Article

Prepared of Titanate as Pb (II) Adsorbent from SCR Waste Catalyst by Sub-Molten Salt Method: A Sustainable Strategy for Hazardous Waste Recycling and Heavy Metal Remediation

1
School of Resources and Environmental Engineering, Jiangxi University of Science and Technology, Ganzhou 341000, China
2
School of Resources and Architectural Engineering, Gannan University of Science and Technology, Ganzhou 341000, China
3
Jiangxi Provincial Key Laboratory of Low-Carbon Processing and Utilization of Strategic Metal Mineral Resources, Ganzhou 341000, China
*
Author to whom correspondence should be addressed.
Sustainability 2025, 17(11), 4823; https://doi.org/10.3390/su17114823
Submission received: 28 April 2025 / Revised: 20 May 2025 / Accepted: 21 May 2025 / Published: 23 May 2025

Abstract

:
To address the disposal challenges of waste SCR catalysts and the urgent need for sustainable solutions in heavy metal pollution control, this study proposes a green resource utilization strategy based on the sub-molten salt method to convert waste SCR catalysts into highly efficient lead ion adsorbents. Titanate-based adsorbent materials with a loose porous structure were successfully prepared by optimizing the process parameters (reaction temperature of 160 °C, NaOH concentration of 70%, and reaction time of 2 h). The experiments showed that the adsorption efficiency was as high as 99.65% and the maximum adsorption capacity was 76.08 mg/g under ambient conditions (adsorbent dosage of 1.2 g/L, initial Pb(II) concentration of 100 mg/L, contact time of 60 min, and pH = 4). Kinetic analysis showed that the quasi-second-order kinetic model (R2 = 0.9985) could better describe the adsorption process, indicating chemisorption as the dominant mechanism. Characterization analysis confirmed that subsequent to the adsorption process, Pb3(CO3)2(OH)2 formed on the surface of the adsorbent material is the adsorption product of Pb(II) and C-O through ion exchange and surface complexation. This study transforms waste SCR catalysts into sustainable titanate adsorbents through a low-energy green process, providing an eco-efficient solution for heavy metal wastewater treatment while aligning with circular economy principles and sustainable industrial practices.

1. Introduction

With the widespread adoption of selective catalytic reduction (SCR) technology in coal-fired power plants to control nitrogen oxides (NOx) emissions, the disposal of discarded SCR catalysts is an increasingly serious problem [1]. SCR catalysts are composed of V2O5-WO3/TiO2 as the core component [2], and they are classified as hazardous waste after deactivation due to the presence of toxic elements (e.g., V, As) [3,4]. According to statistics, up to 0.5 million tons-0.7 million tons of waste SCR catalysts are generated globally every year, but the existing treatment technologies (e.g., landfill, acid leaching recovery) have problems such as low resource utilization (only about 25%) [5], high energy consumption, and the risk of secondary pollution.
China included waste SCR denitrification catalysts that do not have regeneration value in hazardous waste for management and prohibited their being put directly in a landfill [6]. In addition, incineration of waste SCR denitrification catalysts will cause a huge waste of valuable metal elements contained in the catalysts [7,8]. Wu Tao et al. [9] used a sulfuric acid method for the recovery and extraction of Ti from spent SCR catalysts; the existing acid leaching process is more efficient in recovering TiO2, but it cannot utilize the W element efficiently. Kim et al. [10] investigated a novel leaching process using a mixture of an alkaline solution of NaOH and Na2CO3, and utilized the pressure assisted to achieve the high efficiency of leaching of V and W. The alkaline leaching technique is favorable for the efficient recovery of V and W from spent SCR denitrification catalysts, however, the chemical properties of V and W are very similar, which makes the separation and purification of V and W extremely difficult. CHOI I H et al. [11] obtained CaWO4 with a final mass fraction of 96.1% by mixed roasting with CaO added to the spent catalyst, followed by leaching and precipitation. However, the roasting–leaching method has high energy consumption and stringent equipment requirements, which makes the cost significantly higher.
It is particularly noteworthy that the TiO2 content of spent catalysts is as high as 80–85% [12,13], but its high value utilization is still limited, and there is an urgent need to develop environmentally friendly and economical resourcing technologies. Current disposal methods for SCR catalysts (e.g., landfill, acid leaching) not only fail to meet the principles of sustainable development due to high energy consumption and secondary pollution, but also waste valuable resources. The concept of “waste-to-resource” aligns with circular economy frameworks, which prioritize minimizing waste and maximizing material reuse. By converting SCR waste into functional adsorbents, this study directly contributes to sustainable industrial practices by reducing hazardous waste accumulation and offering a low-carbon alternative to conventional adsorbent production.
Meanwhile, lead (Pb(II)) pollution has become a global environmental challenge due to the continuous increase in mining and smelting activities [14,15]. Pb(II) is highly biotoxic and can be enriched through the food chain to jeopardize human health [16,17]. Quanyuan Chen et al. [18] investigated the effectiveness of the CaO-fly ash-CO2 system for the treatment of heavy metal wastewater, with the formation of Pb(OH)2 and PbCO3 precipitates at pH 7–11. Jokar et al. [19] used chicory waste as a cation exchanger for the removal of heavy metal ions and adsorption of Pb2+ and Cd2+ using CaCl2 for modification. Existing lead pollution treatment technologies (such as membrane filtration technology [20], ion exchange technology [21], and chemical coagulation [22]) are effective, but face problems such as high treatment cost, poor adaptability to low concentration wastewater, and secondary pollution [23]. Adsorption is regarded as an ideal choice due to its easy operation and low cost [24], but traditional adsorbents (e.g., biomass materials [25], activated carbon [26]) generally suffer from the defects of low adsorption capacity (usually <50 mg/g) and regeneration difficulties. Notably, recent advances in coupled bioprocesses for complex wastewater treatment (anammox-SCN systems [27] and perfluoro silane-modified biomass aerogels [28]) demonstrate that integrated strategies combining functional microbial communities with metabolic pathway engineering could offer novel paradigms for addressing heavy metal pollution challenges. Therefore, it is important to develop new materials that combine efficient adsorption performance with green and sustainable characteristics.
In recent years, based on the concept of “waste for waste”, the research on the preparation of adsorbents from industrial solid wastes attracted much attention. For example, Song et al. [29] recovered titanate from spent SCR catalysts for cadmium adsorption using the molten salt method, but the process temperature was high (>400 °C), and the impurity elements were not removed simultaneously. In contrast, alkaline leaching techniques can efficiently recover W and V from spent catalysts, but the utilization of residual titanium fractions is still not fully explored [10,30,31].
Compared to traditional alkali fusion and calcination processes, sub-molten salt media with alkali concentrations exceeding 50% exhibit distinct thermodynamic advantages as well as superior kinetic performance [32], and demonstrated promising applications in the extraction and refining of precious metals, light metals, and refractory metals. In this study, the sub-molten salt method was used to prepare of adsorbent materials using a waste SCR catalyst. The adsorption performance and mechanism of Pb(II) were systematically investigated by modulating the surface structure and chemical properties of the material with the aim of providing innovative solutions for industrial solid waste resource utilization and heavy metal pollution control.

2. Materials and Methods

2.1. Preparation of Adsorbent Materials

The raw material for the experiment was waste SCR denitrification catalyst from a domestic thermal power plant, and the raw material was dried in a constant temperature drying oven at 100 °C for 24 h before the experiment.
A 70 wt% NaOH solution was prepared by dissolving 40 g of NaOH in deionized water within a round-bottom flask, which was then immersed in a preheated oil bath at 160 °C. Upon temperature stabilization, 10 g of waste SCR catalyst was introduced into the flask, and the reaction proceeded under continuous stirring for 2 h. Post-reaction, the mixture was quenched with cold water, diluted to approximately 2 L, and subjected to vacuum filtration to isolate the solid phase. The filtered solids were thoroughly washed with deionized water until the filtrate reached a neutral pH (7.0 ± 0.5), followed by drying at 105 °C for 12 h to yield the final adsorbent materials. The main elemental compositions of the raw materials of the SCR catalyst and the dried adsorbent materials are shown in Table 1, and the results of the XRD analysis are shown in Figure 1.
From Table 1, it can be seen that the main elemental composition of waste SCR catalysts and adsorbent materials is Ti, with mass fractions of 47.21% and 46.53%, respectively. The compositional content of W elements in SCR catalyst materials before and after concentrated alkali leaching decreased from 4.325% to 0.128%, and Na elemental composition increased significantly to 5.301%, and it is shown that when a high concentration of NaOH is added to the SCR catalyst for leaching treatment, the W in the SCR catalyst can be leached out into the solution, thus achieving the purpose of recovering W at the same time.
As can be seen from Figure 1, the physical phase of the waste SCR catalyst feedstock is single, mainly the characteristic diffraction peaks of anatase TiO2, and no other impurity peaks appeared. Due to the treatment of the SCR catalysts under alkaline conditions, the characteristic peaks of BaTiO3 also appeared in the adsorbent material obviously, and the characteristic diffraction peaks of anatase TiO2 also existed in the adsorbent materials.

2.2. Preparation of Pb(II) Solution

First, weigh 0.1598 g (0.1 mol) lead nitrate solid, add a small amount of deionized water into the beaker, stir with a glass rod to dissolve, then transfer to a 1000 mL volumetric bottle, add deionized water to the scale, and shake well; the concentration of Pb(II) is 100 mg/L. In this experiment, the solution was prepared in accordance with the concentration of 100 mg/L; the actual detection concentration may vary, but the results were calculated according to the actual detection concentration.

2.3. Experimental Methods

In this study, the static adsorption method was used to investigate the adsorption capacity of the prepared adsorbent materials for Pb(II). In total, 50 mL of prepared Pb(II) solution was measured and put into a conical bottle, the adsorption test was carried out in a vibrator at normal temperature and pressure using the method of conditional control variables, and individual conditioned test sets were synchronized. After the test was completed, the supernatant of the reaction solution was removed using a syringe membrane filter and then the concentration of Pb(II) in the supernatant was measured. The adsorption rate is calculated according to Equation (1), and the adsorption capacity (qe) is calculated according to Equation (2). All experiments were conducted in triplicate.
Adsorption   rate % = C 0 C e C 0 × 100 %
q e = C 0 C e × V m
In the formula, C0 represents the concentration of Pb(II) in the original solution (mg/L), Ce represents the concentration of Pb(II) detected after the reaction (mg/L), V represents the volume of the reagent used in Pb(II) solution (50 mL), and m represents the dosage of the adsorption material used in the test (g).

2.4. Equipment and Reagents

Physical phase analyses of the raw materials and adsorbent material were performed using an X-ray diffractometer (XRD; MiniFlex 600, Rigaku, Tokyo, Japan). Particle size distribution and specific surface area were characterized by a laser particle size analyzer (Mastersizer 3000, Malvern, Malvern City, UK) and a Brunauer–Emmett–Teller (BET) analyzer (ASAP 2460, Micromeritics, Norcross, GA, USA), respectively. The raw materials and adsorbent material were observed using scanning electron microscopy (SEM; MLA650F, FEI, Colombia, SC, USA). The chemical composition was analyzed using the X-ray fluorescence spectrometer (XRF; VANTA VES, Olympus, Bartlett, TN, USA) and atomic absorption spectrometer (AAS; GGX-600, Haiguang, Beijing, China). Functional group identification was achieved through Fourier-transform infrared spectroscopy (FTIR; Nicolet iS50, Thermo Scientific, Waltham, MA, USA). The adsorption samples reacted in a constant temperature oscillator (SHA-C, Guohua, Tainan, China) at a fixed oscillation speed of 105 r/min. The primary chemical reagents used included NaOH, Pb(NO3)2, Cr(NO3)3, MgSO4, and CuSO4 (AR, XIHUA, Chengdu, China).

3. Results

3.1. Characterization Analysis of Waste SCR Catalyst Materials and Adsorbent Materials

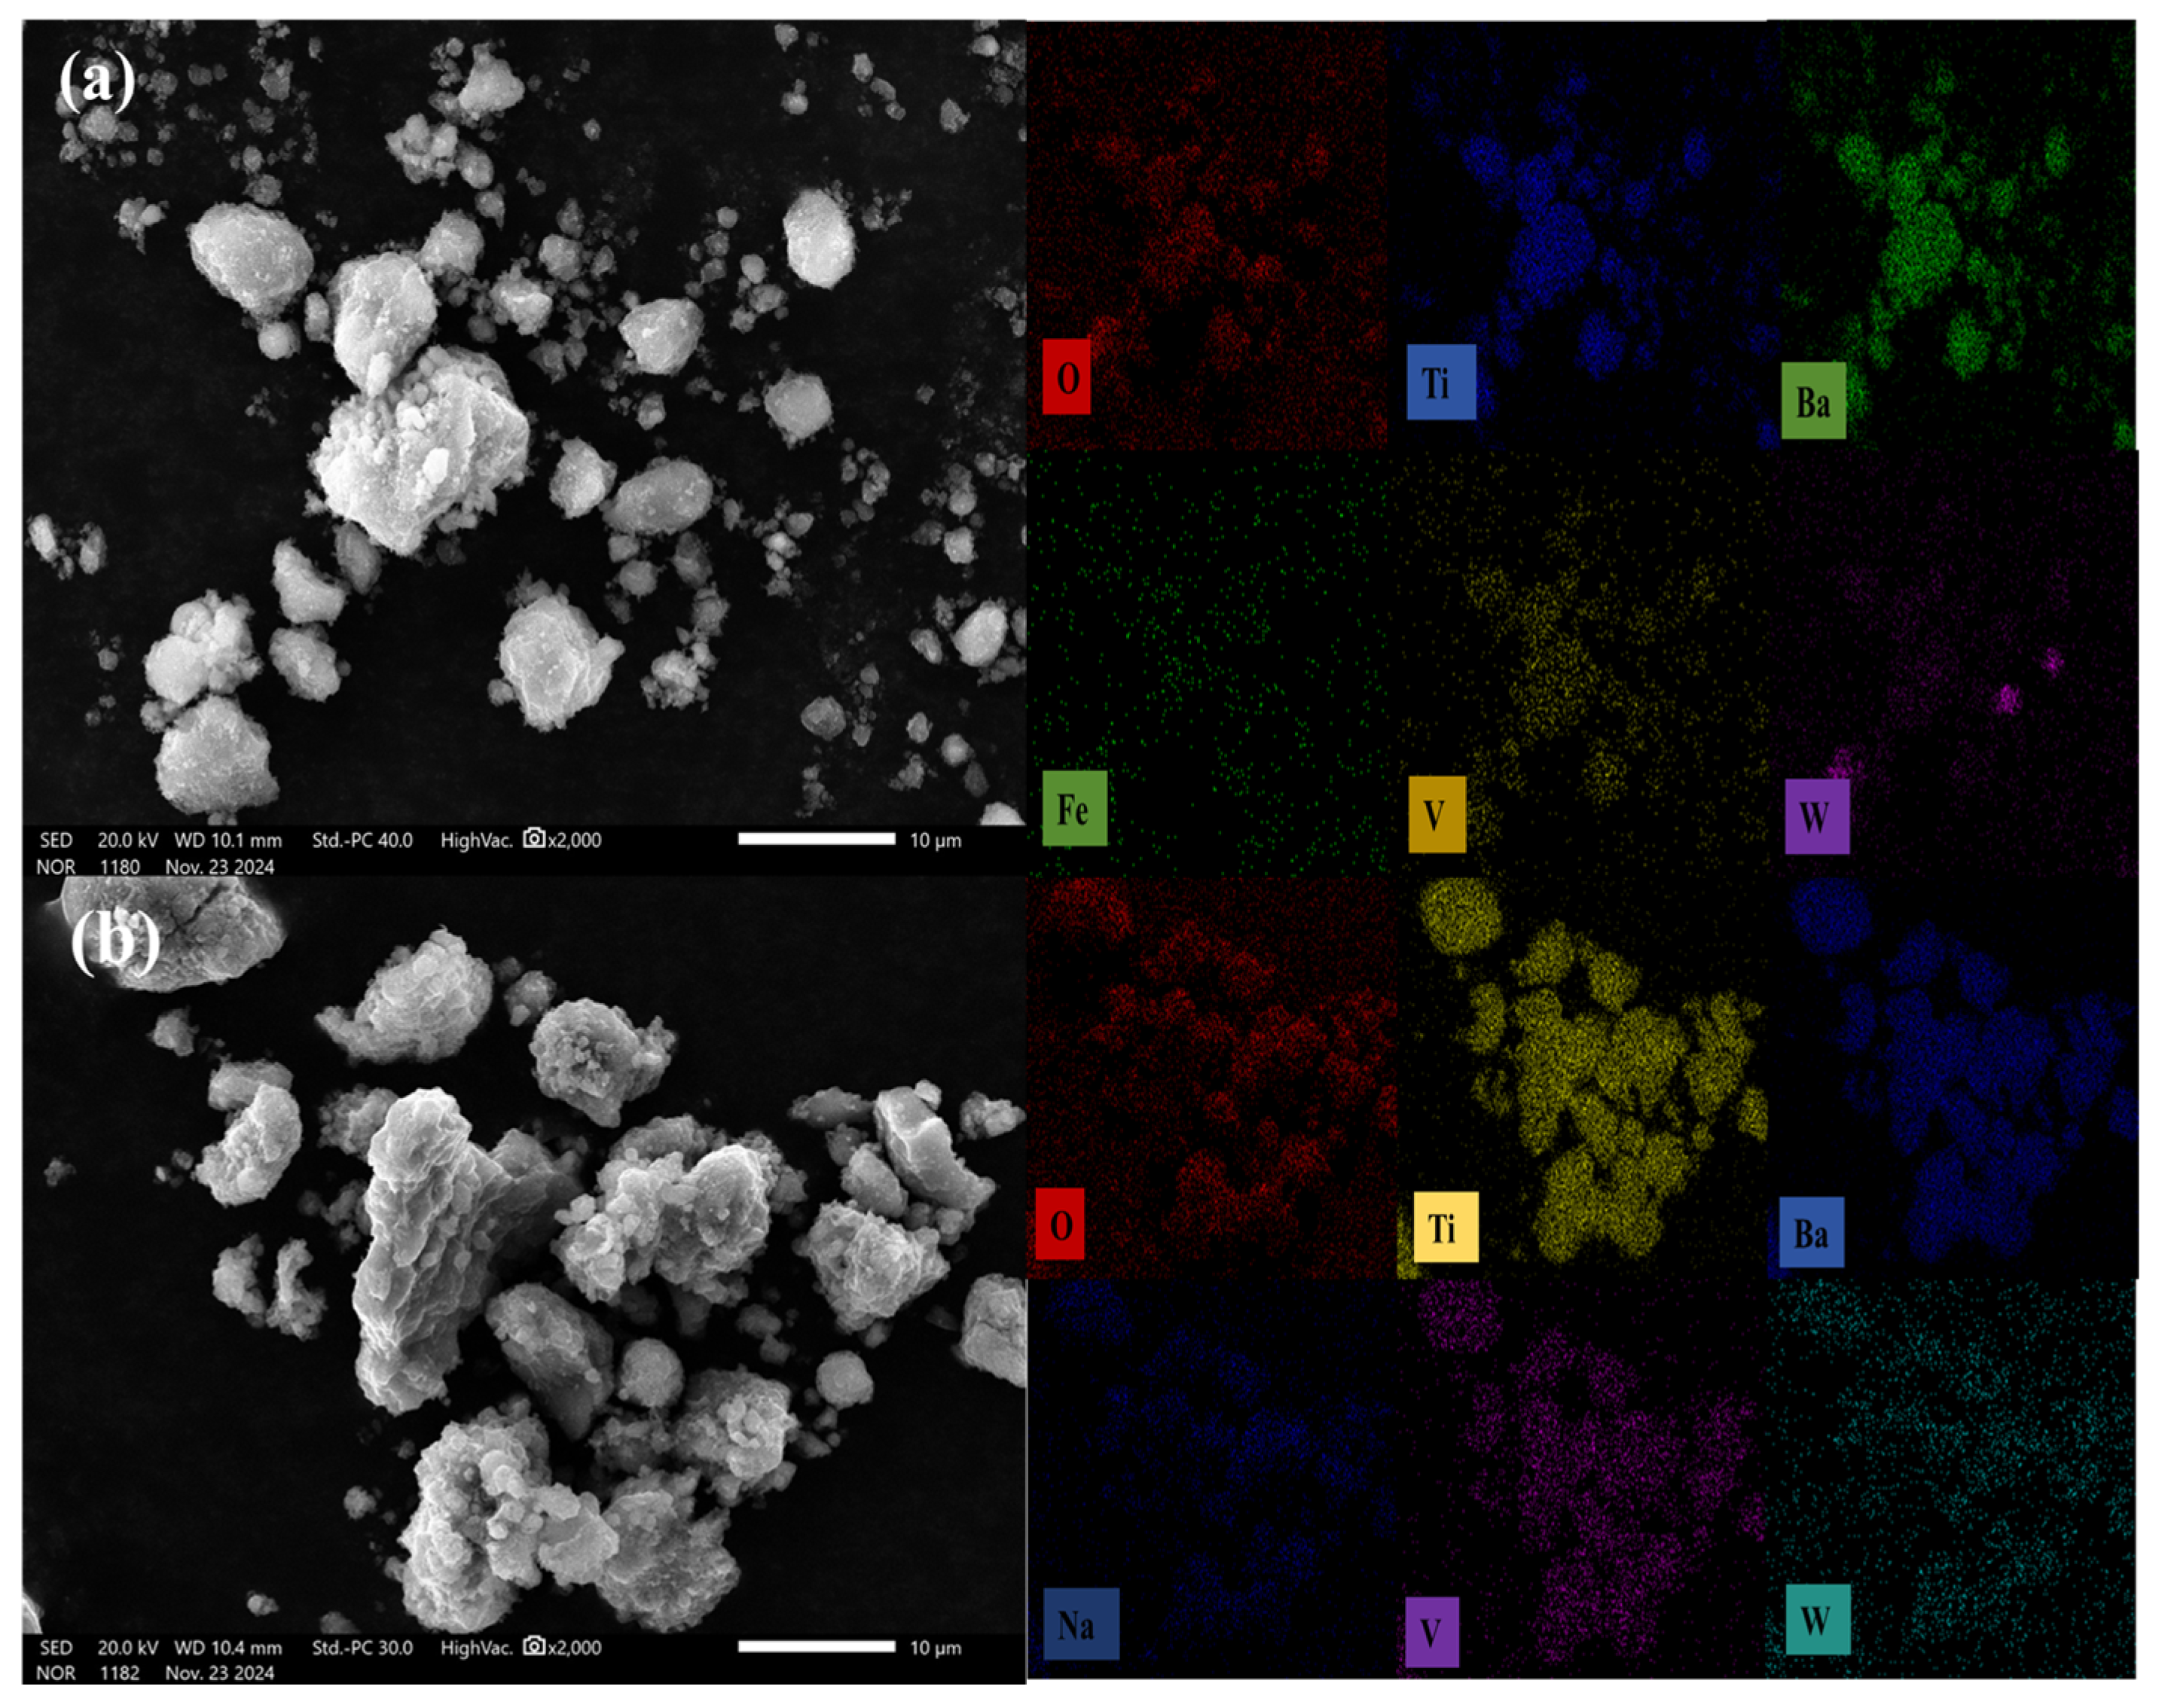
3.1.1. SEM and EDS Analysis

Figure 2 shows the SEM images and EDS results of the waste SCR catalyst and the prepared adsorbent materials. It can be seen from Figure 2a that the particles of the waste SCR catalyst are regular and spherical, and the particles are relatively compact with small gaps, which is not conducive to full adsorption. As can be seen from Figure 2b, the surface shape of the adsorption material is sheet-like, with large gaps between the particles and a large number of cracks on the surface, indicating that the pore structure of the adsorption material is relatively developed and it has adsorption conditions. In addition, it can be seen from Table 2 that the content of Ti in the elemental components of the waste SCR catalyst and the adsorbent materials is 28.12% and 31.00%, and the content of W is reduced from 5.99% to 1.30%, indicating that no other impurity elements are introduced into the SCR catalyst by high-concentration alkali leaching, and the influence of W is removed.
In order to fully observe the adsorption capacity of materials after concentrated alkali leaching, EDS was further used to analyze various elements attached to the waste SCR catalyst and high-concentration alkali leaching materials, observe their element distribution, and explore their mass percentage. The test results are shown in Figure 2. The scatter points in the energy spectrum correspond to Ti, W, and V elements obtained under the scanning of the analytical instrument. The distribution of Ti elements is uniform and more dense. The W and V elements on the surface of the high-concentration alkali leaching material are relatively scattered and scarce, indicating that some W and V impurity elements have been removed from the material obtained after the concentrated alkali leaching.

3.1.2. Particle Size Distribution and BET Analysis

Figure 3 shows the particle size distribution of the waste SCR catalyst and adsorbent materials. From the laser particle size detection data, it can be known that the average particle size (D50) of the waste SCR catalyst is 22.67 μm, the minimum particle size (D10) is 2.70 μm, and the maximum particle size (D90) is 110.275 μm. The average particle size (D50) of the adsorption material is 36.80 μm, the minimum particle size (D10) is 6.69 μm, and the maximum particle size (D90) is 277.32 μm. It can be clearly seen that the particle size of the adsorption material is slightly larger than that of the waste SCR catalyst. Moreover, after BET detection, it can be known from Table 3 that the specific surface area of the adsorption material is smaller than that of the waste SCR catalyst. The above data indicate that the waste SCR catalyst, after being impregnated with high-concentration alkali, yields materials with adsorption performance. The particle size of this adsorption material increases, thereby reducing its specific surface area.

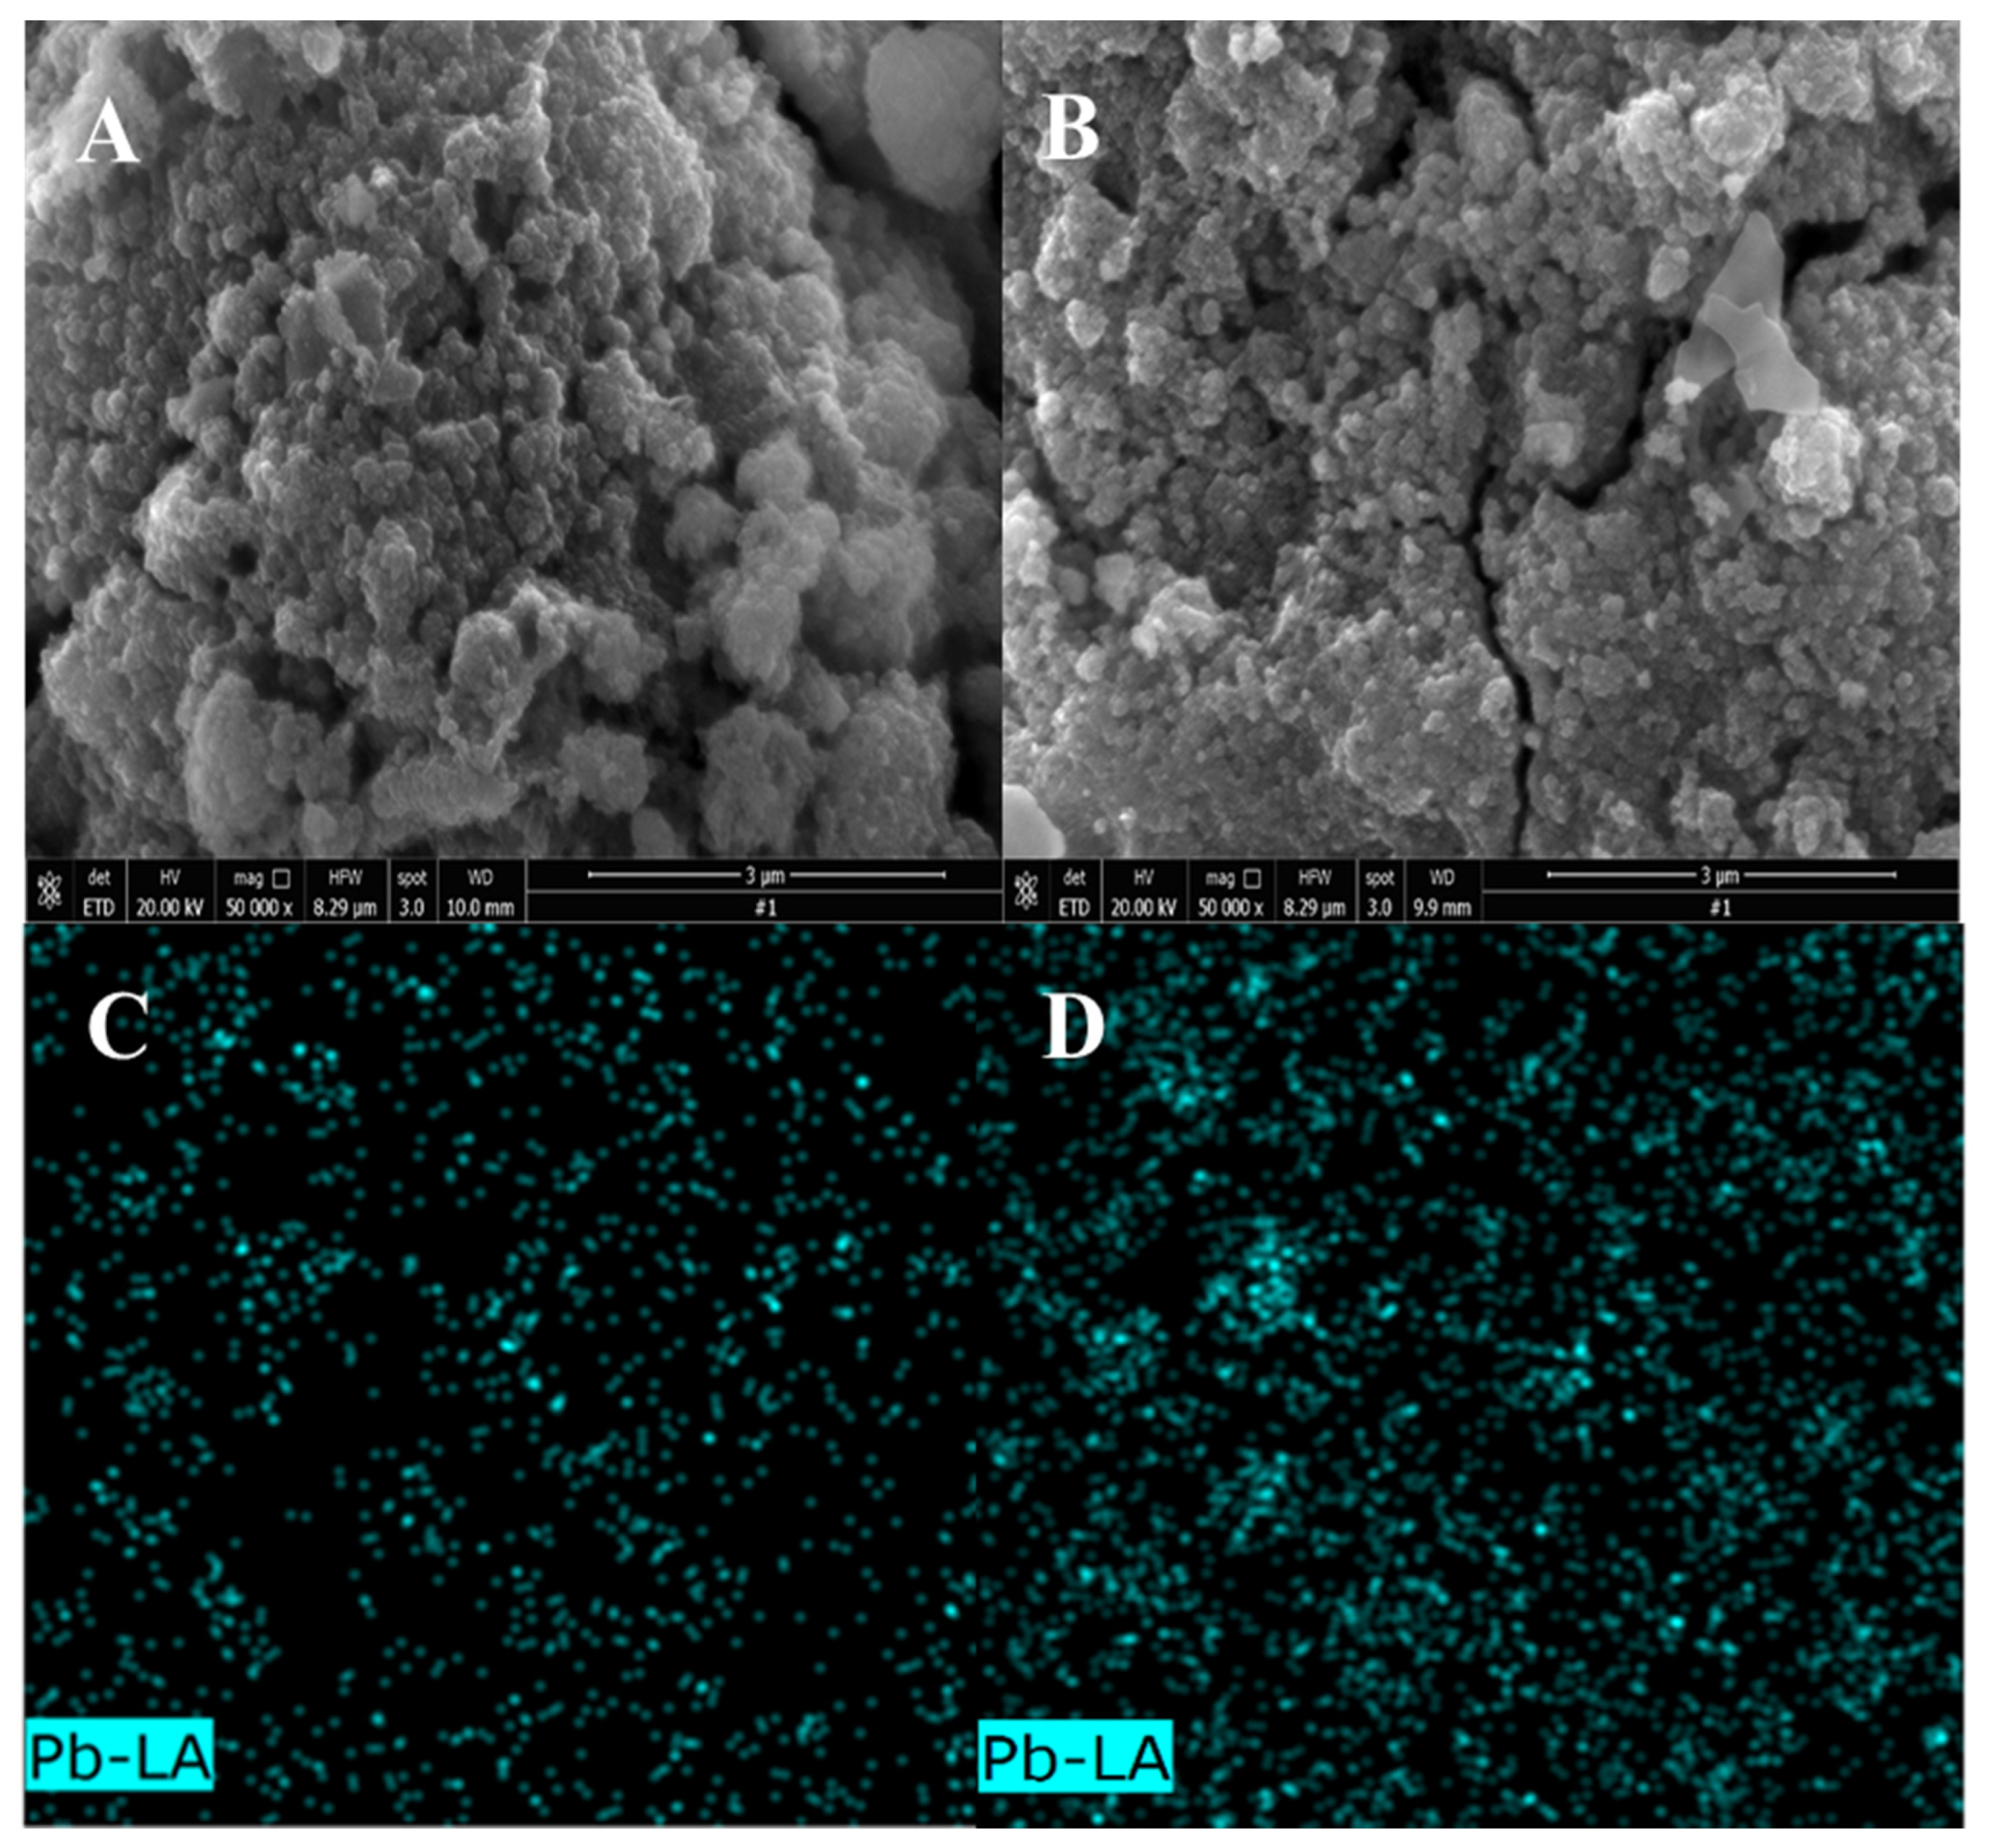
3.1.3. Local SEM and EDS Analysis of Adsorption Materials

Figure 4 is the SEM image of the adsorbent materials, and Figure 4II is the enlarged part of the yellow box in Figure 4I. As can be seen from Table 4, the main element detected in parts 1, 2, 3, and 4 marked in Figure 4II is element Ti, whose content is 55.38%, 50.64%, 42.4%, and 44.20%, respectively, and the content of element W contained in them is 1.05%, 0.28%, 2.64%, and 0.9%. In addition, the content of element V was 0.61% and 0.22% at places 3 and 4. This shows that most of the impurities of W and V are removed from the adsorbent materials, and only a small amount of W and V are adsorbed on the surface in the form of small particles, which also indicates that the prepared material has certain adsorption properties.

3.2. Effect of Different Factors on the Pb(II) Adsorption Process

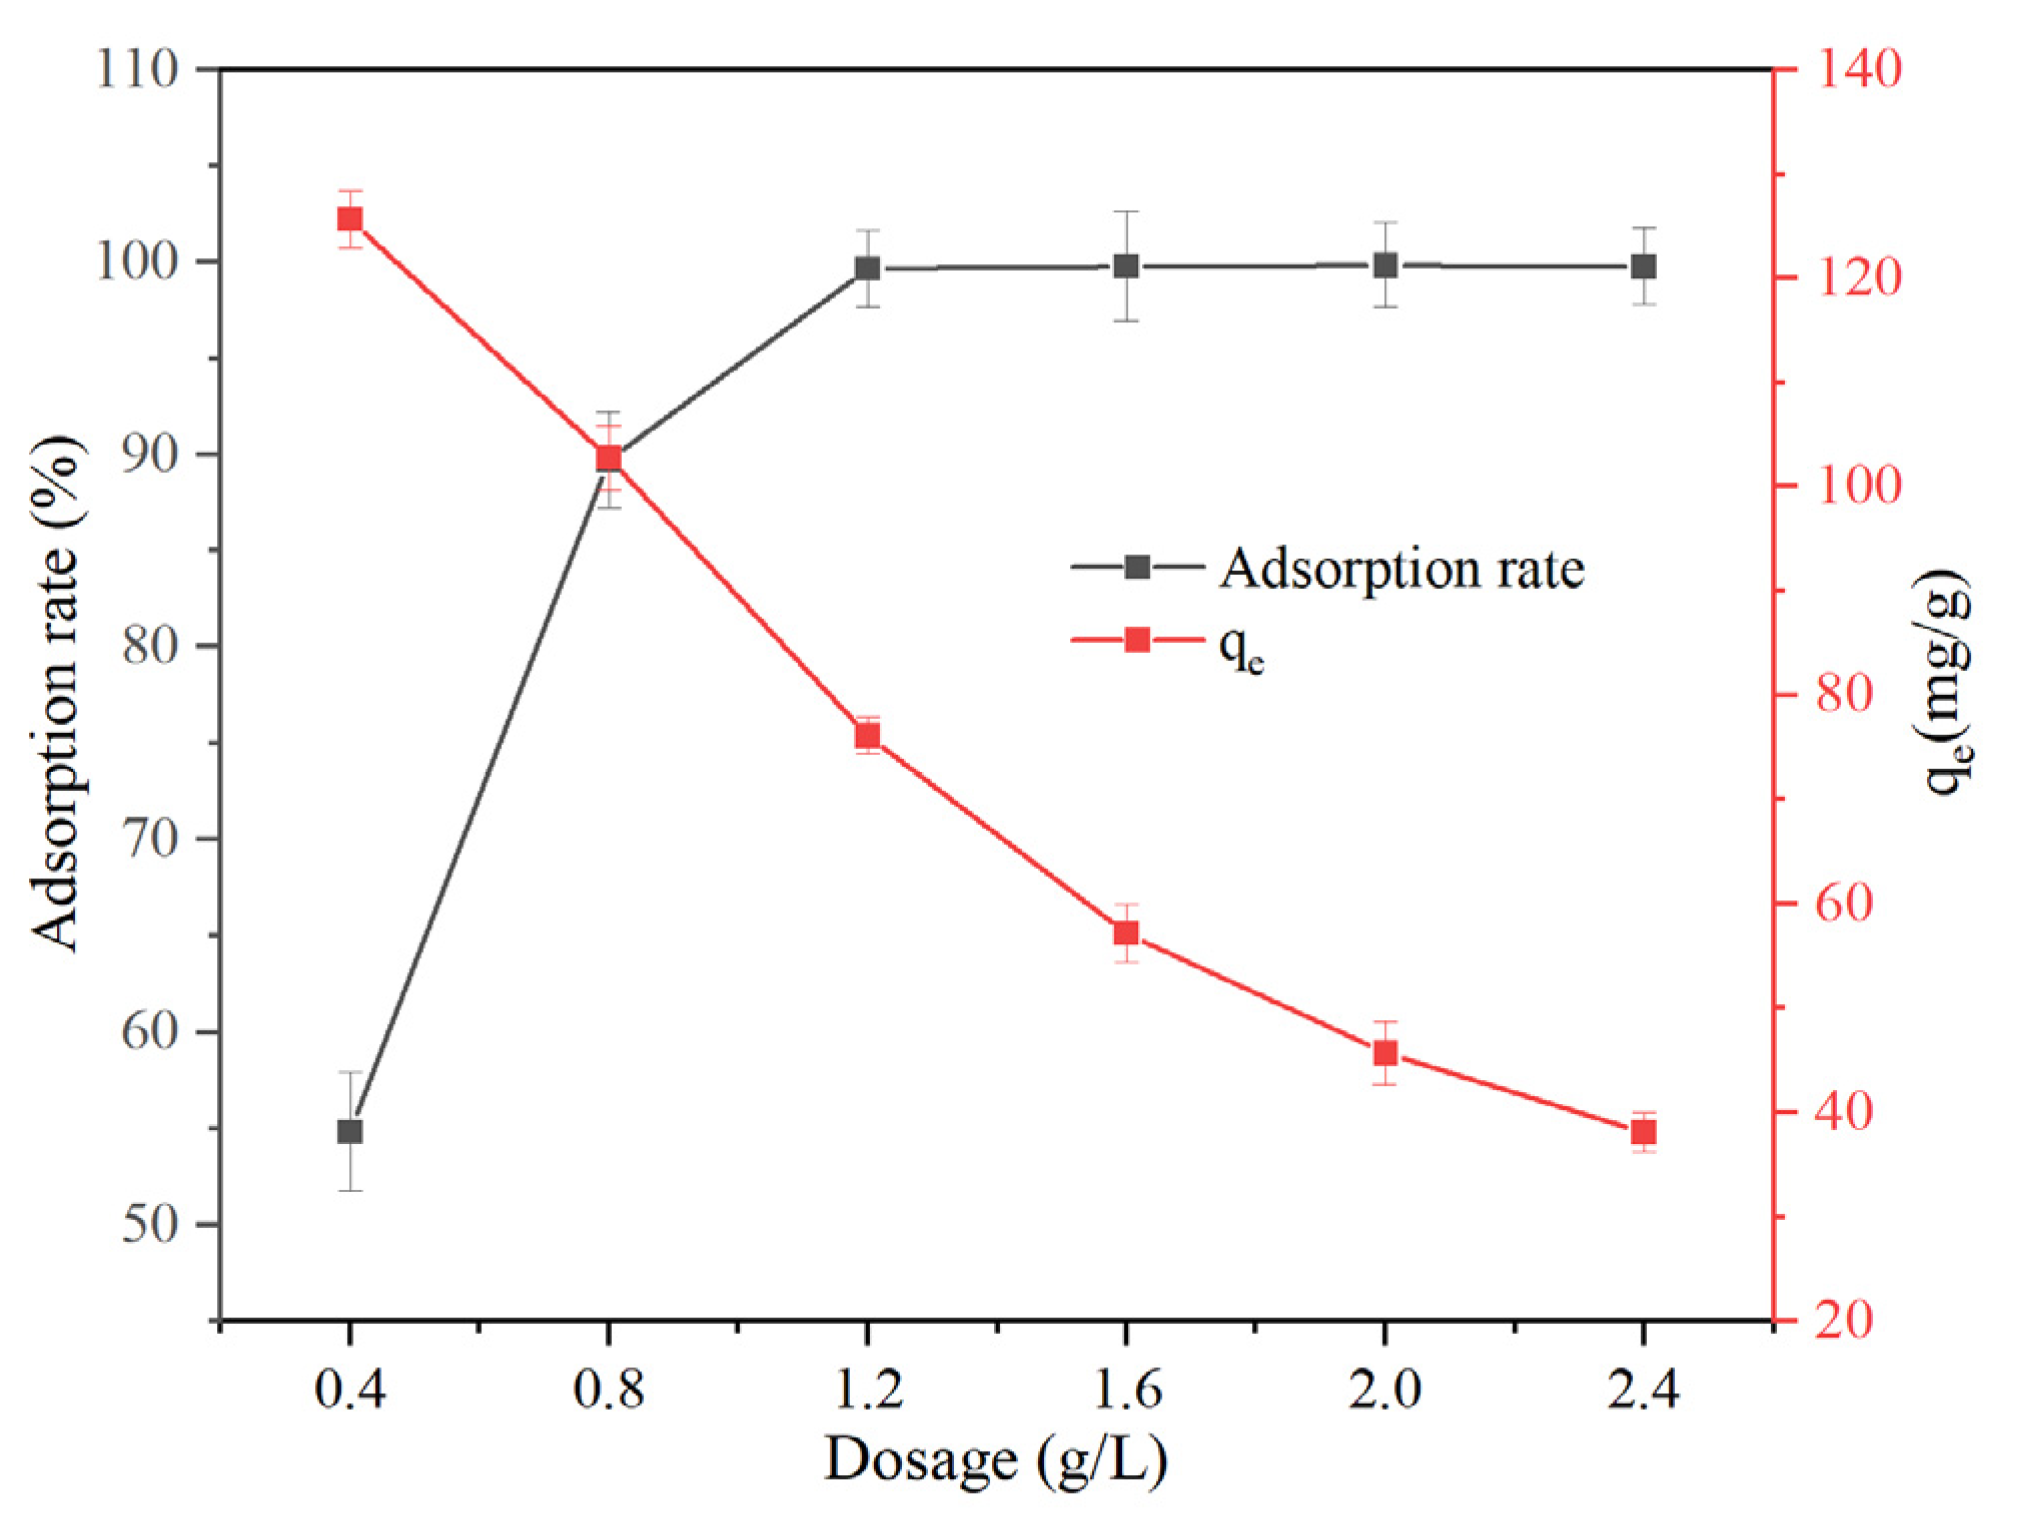
3.2.1. Influence of Adsorption Material Dosage on the Pb(II) Adsorption Process

Under the conditions of normal temperature and pressure, contact time of 60 min, and concentration of Pb(II) of 100 mg/L, the influence of adsorption material dosage on the Pb(II) adsorption process was investigated. The result is shown in Figure 5.
As shown in Figure 5, increasing the adsorbent dosage from 0.4 to 1.2 g/L significantly enhanced the Pb(II) adsorption efficiency from 54.85% to 99.65%, and was accompanied by a progressive decline in qe from 125.62 mg/g to 76.08 mg/g. Beyond the threshold dosage of 1.2 g/L, the adsorption efficiency plateaued, whereas qe exhibited a sharp reduction to 38.08 mg/g at 2.4 g/L, representing a 69.70% decrease compared to the lowest dosage. The optimal dosage of 1.2 g/L achieves near-complete Pb(II) removal (99.65%) while balancing practical adsorption capacity (76.08 mg/g).

3.2.2. Influence of Contact Time on the Pb(II) Adsorption Process

Under the conditions of normal temperature and pressure, an adsorption material dose of 1.2 g/L, and a concentration of Pb(II) of 100 mg/L, the influence of contact time on the Pb(II) adsorption process was investigated. The result is shown in Figure 6.
It can be seen from Figure 6 that the contact time between the adsorbent material and Pb(II) solution has a great influence on the adsorption rate and adsorption amount of lead ions. When the adsorption time increased from 5 min to 60 min, both adsorption rate and qe exhibited substantial enhancement: the removal rate surged from 49.82% to 99.65%, while qe concurrently increased from 38.43 to 76.08 mg/g. When the adsorption time continued to increase to 90 min, there were no statistically significant changes in adsorption rate (99.65–99.81%) or qe (76.08 mg/g–76.98 mg/g), because at the beginning of the adsorption material surface, space is sufficient to accommodate a certain amount of Pb(II), so the adsorption effect of the adsorption material on Pb(II) is relatively ideal at this stage. With the increase in contact time, Pb(II) can be accommodated for on the surface of the adsorbed material as it gradually reaches saturation and the adsorption equilibrium is reached, and the adsorption amount of Pb(II) does not change when the contact time is increased to 90 min. It can be seen that the appropriate contact time between adsorption material and Pb(II) solution is 60 min.

3.2.3. Influence of Initial Concentration on the Pb(II) Adsorption Process

Under the conditions of normal temperature and pressure, an adsorption material dose of 1.2 g/L, and contact time of 60 min, the influence of initial concentration on the Pb(II) adsorption process was investigated. The result is shown in Figure 7.
The initial Pb(II) concentration exerted a pronounced dual-phase influence on adsorption performance, as demonstrated in Figure 7. With increasing concentration from 100 to 1500 mg/L, the adsorption rate exhibited an 89.30% decline from 99.65 % to 10.67%, while the qe increased by 75.2% from 76.08 mg/g to 133.30 mg/g. At 100 mg/L, near-complete Pb(II) removal (99.65%) occurs through efficient utilization of abundant active sites, corresponding to a qe of 76.08 mg/g. As concentration escalates to 1500 mg/L, active site saturation induces dramatic efficiency collapse (10.67%), yet drives qe enhancement via intensified concentration gradient forces. The 100 mg/L condition emerges as optimal, achieving maximum practical efficiency (99.65%) while maintaining 57.10% of peak adsorption capacity.

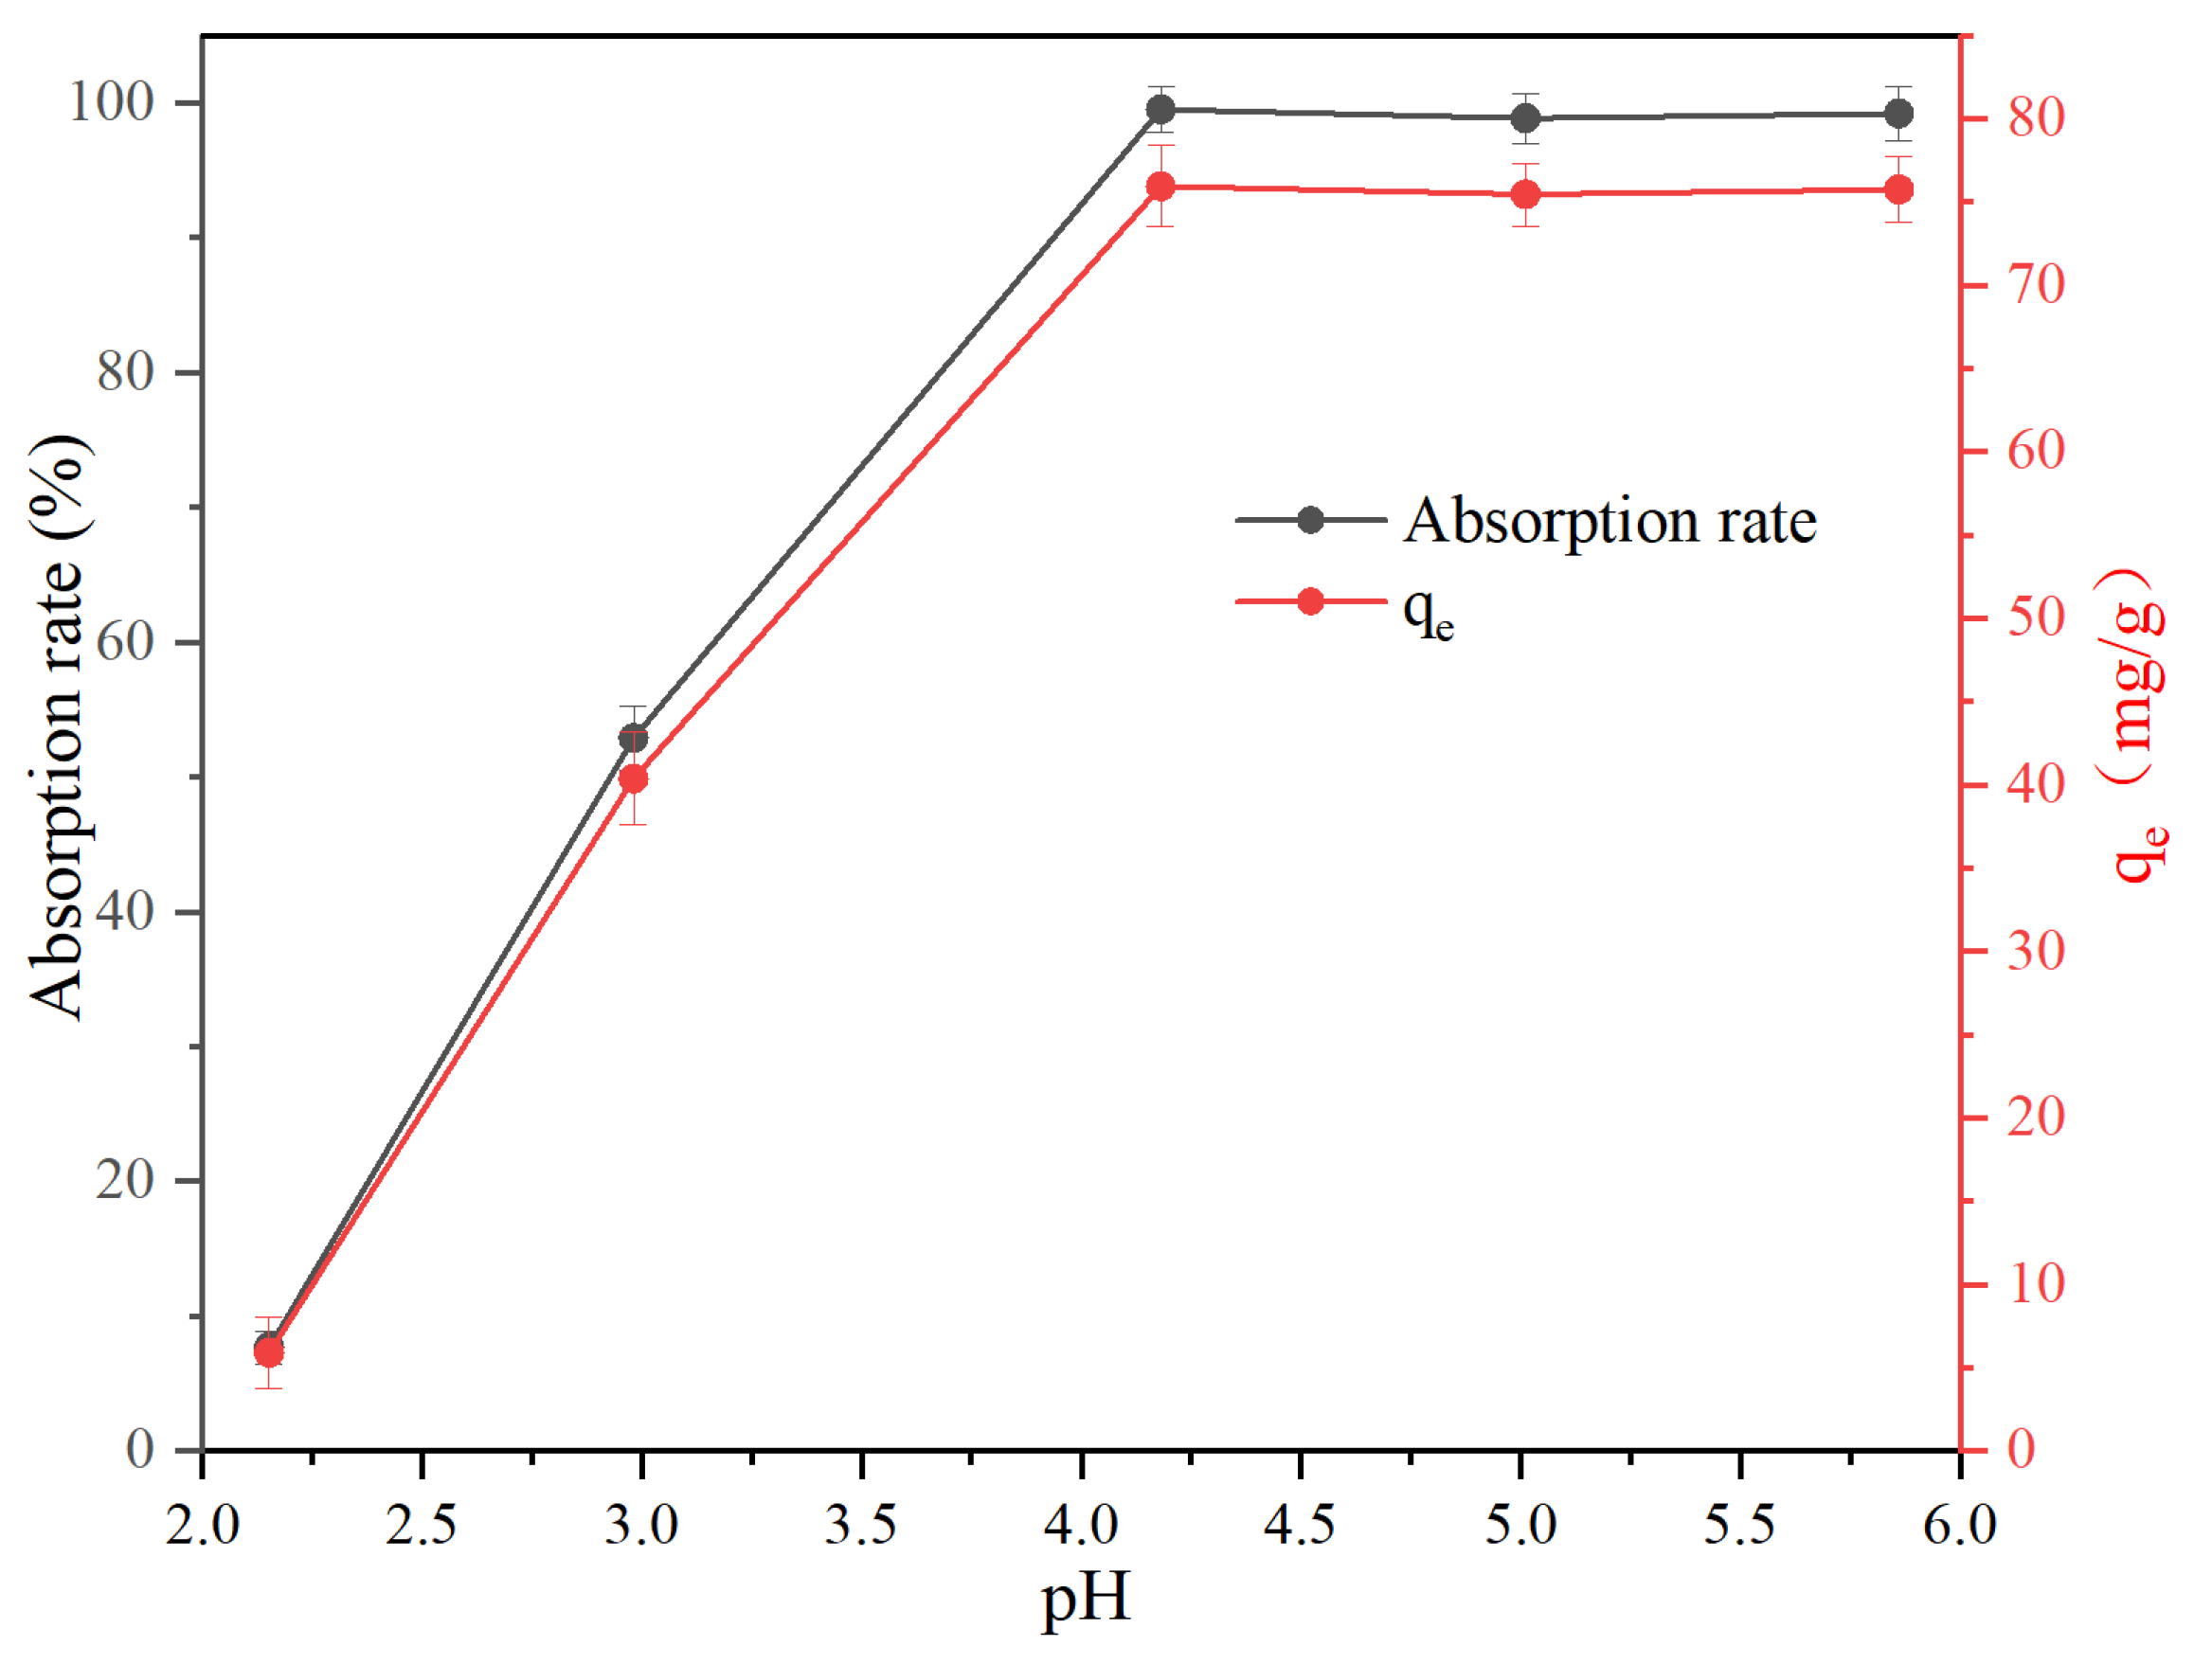
3.2.4. Influence of pH on the Pb(II) Adsorption Process

Under the conditions of normal temperature and pressure, adsorption material dose of 1.2 g/L, concentration of Pb(II) of 100 mg/L, and contact time of 60 min, the influence of pH on the Pb(II) adsorption process was investigated. The result is shown in Figure 8.
It can be seen from Figure 8 that the pH of Pb(II) solution has a great influence on the adsorption rate and adsorption capacity of Pb(II). When the pH increases from 2.15 to 4.18, the adsorption rate and adsorption capacity of Pb(II) increase from 7.76% and 5.93 mg/g to 99.56% and 76.00 mg/g, respectively. When the pH continued to increase, the adsorption rate and adsorption amount of Pb(II) did not change greatly. This abrupt transition correlates with speciation changes: below pH 4.0, excessive H⁺ concentrations induce adsorbent surface protonation, creating electrostatic repulsion against Pb2⁺ ions. Above pH 4.4, near-complete deprotonation enables maximum ligand-Pb2⁺ coordination while avoiding hydroxide precipitation. The pH 4.0–4.5 achieves >99% adsorption rate with 76.00 mg/g capacity, so the appropriate pH of Pb(II) solution is about 4.

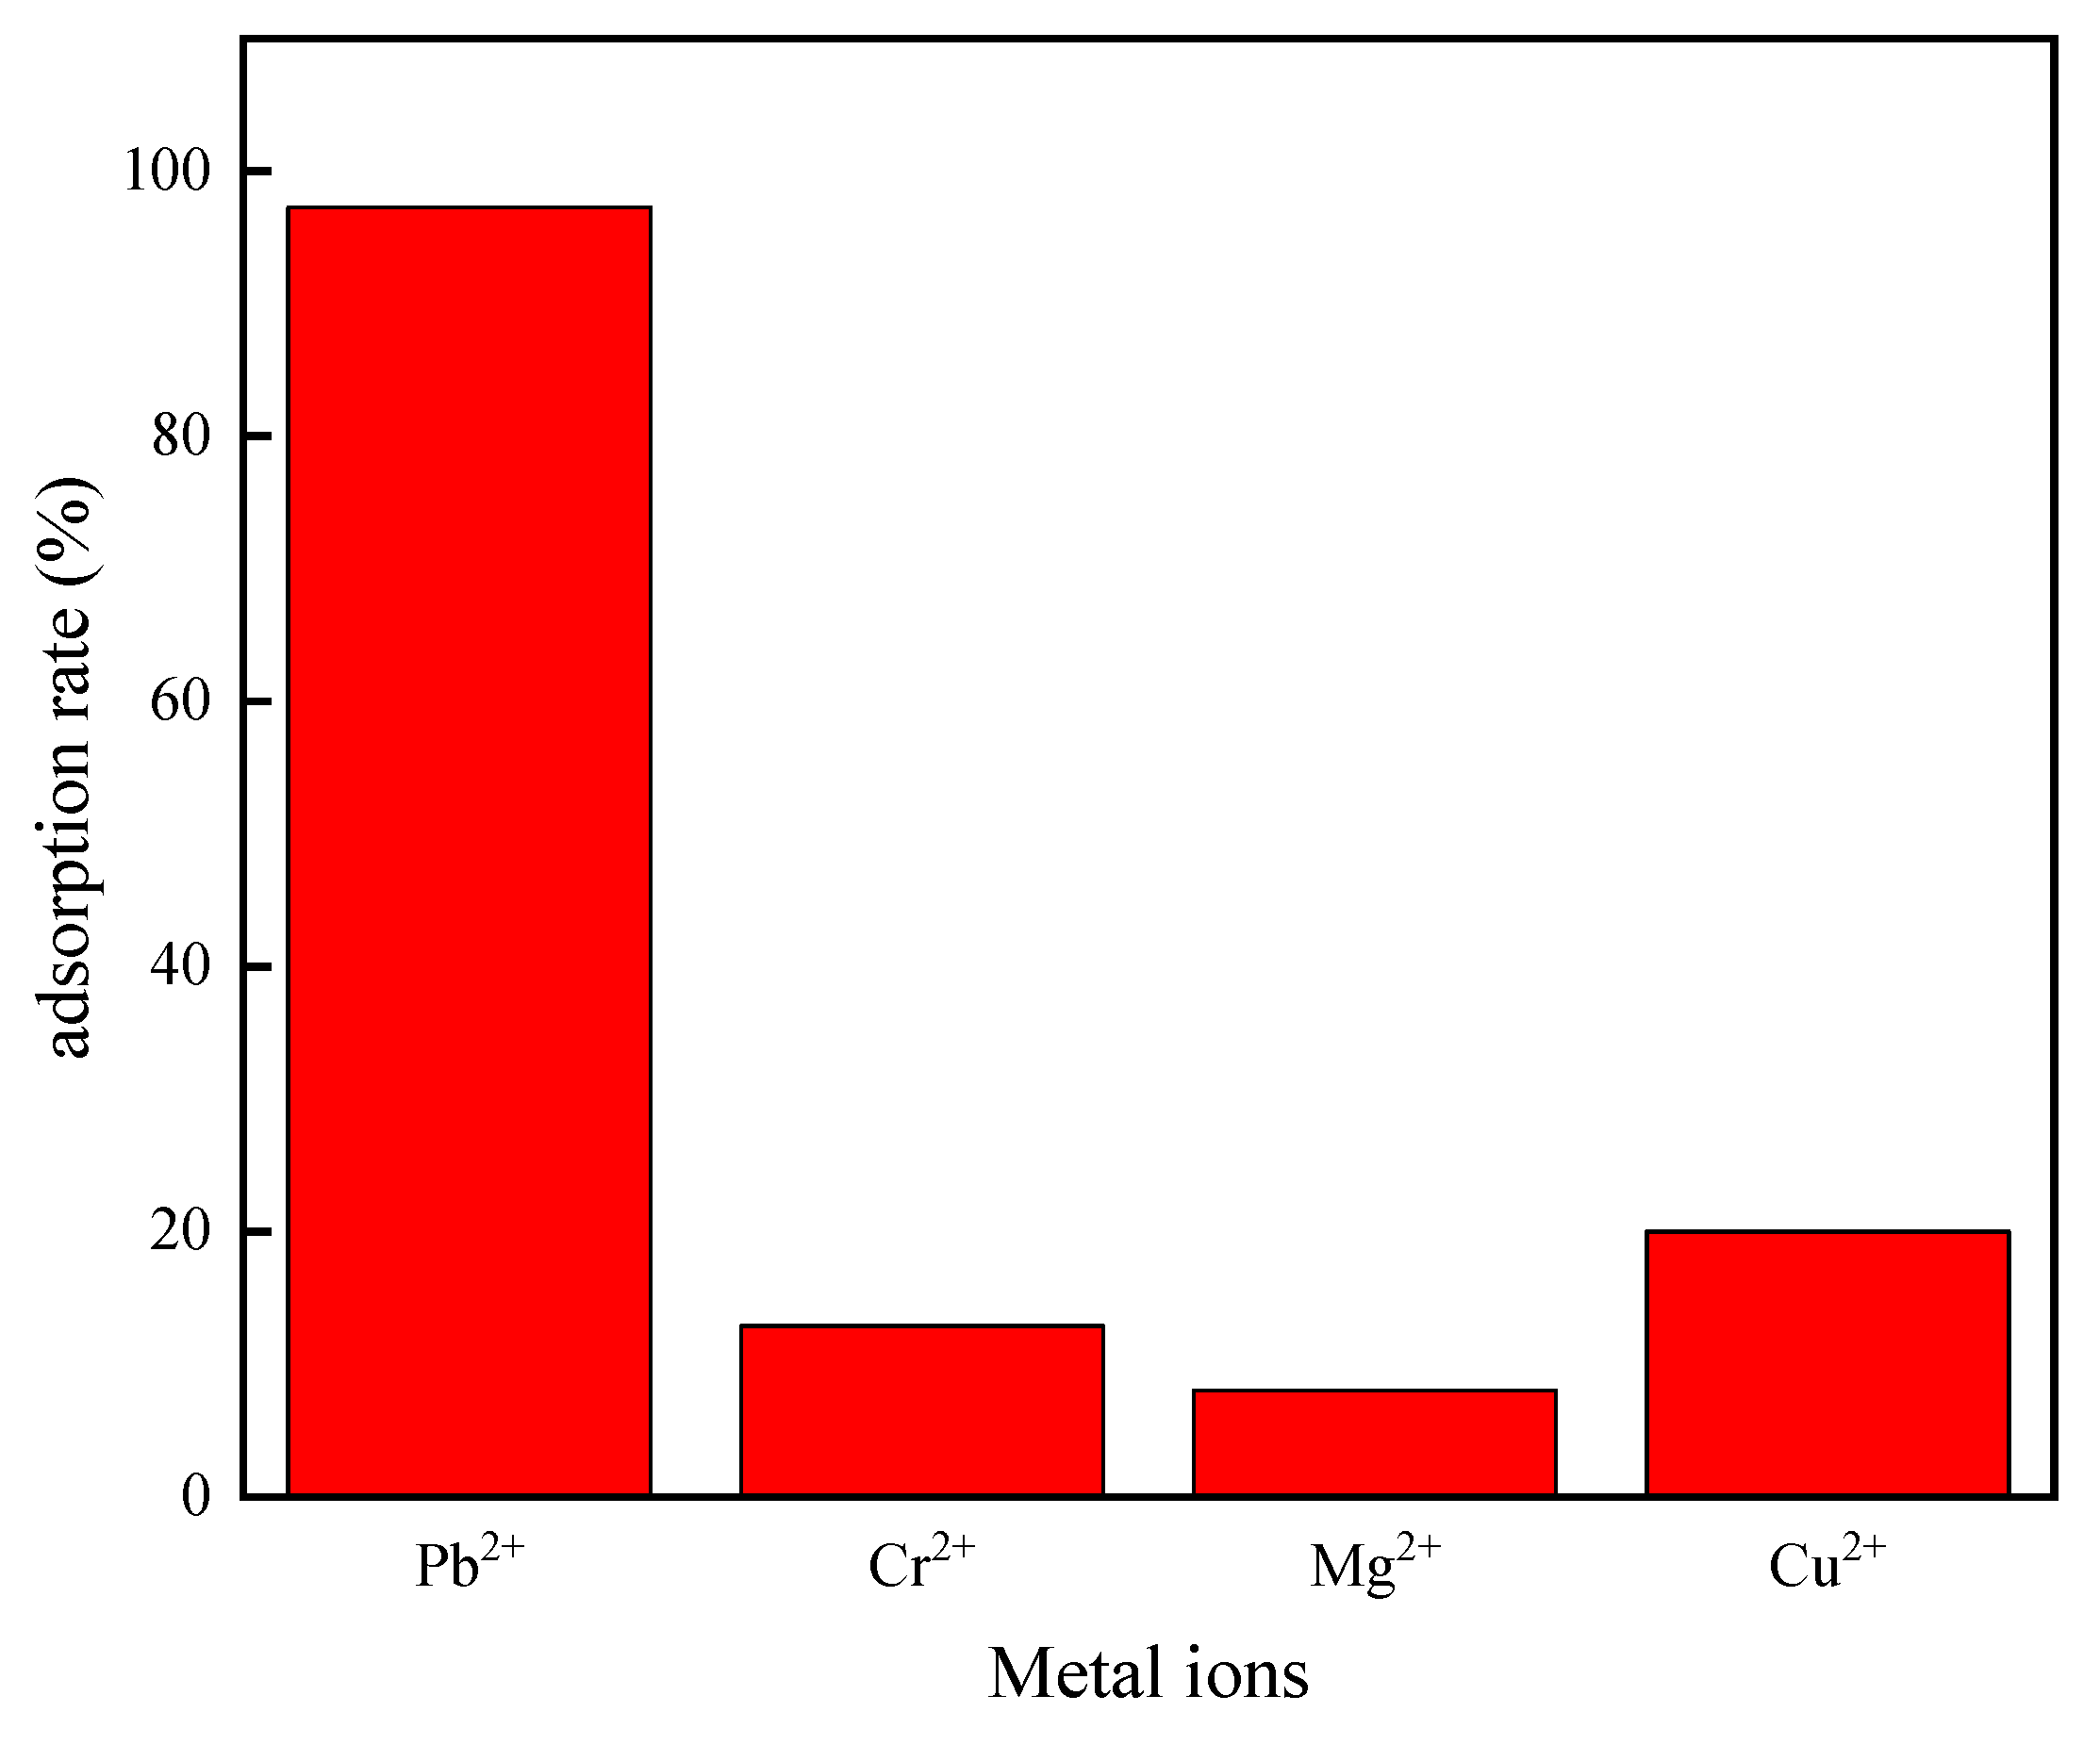
3.3. Competitive Adsorption Performance of Adsorption Materials

The competitive adsorption behavior was systematically evaluated under optimized conditions (adsorbent dosage: 1.2 g/L; contact time: 60 min; and pH 4.0) using equimolar mixed solutions containing 100 mg/L each of Pb2⁺, Cr2⁺, Mg2⁺, and Cu2⁺. The result is shown in Figure 9.
As can be seen from Figure 9, under the same concentration of Pb2⁺, Cr2⁺, Mg2⁺, and Cu2⁺, the adsorption materials achieved 97.24% Pb2⁺ adsorption rates, significantly exceeding values for Cu2⁺ (19.99%), Cr2⁺ (12.90%), and Mg2⁺ (8.02%), which shows that the adsorbent material showed excellent adsorption performance and adsorption selectivity for lead ions in the multi-metal ion solution, and verified its advantage in the adsorption of lead ions, which was attributed to the strong interactions of metal ions with the Pb(II) in the adsorbent material.

4. Discussion

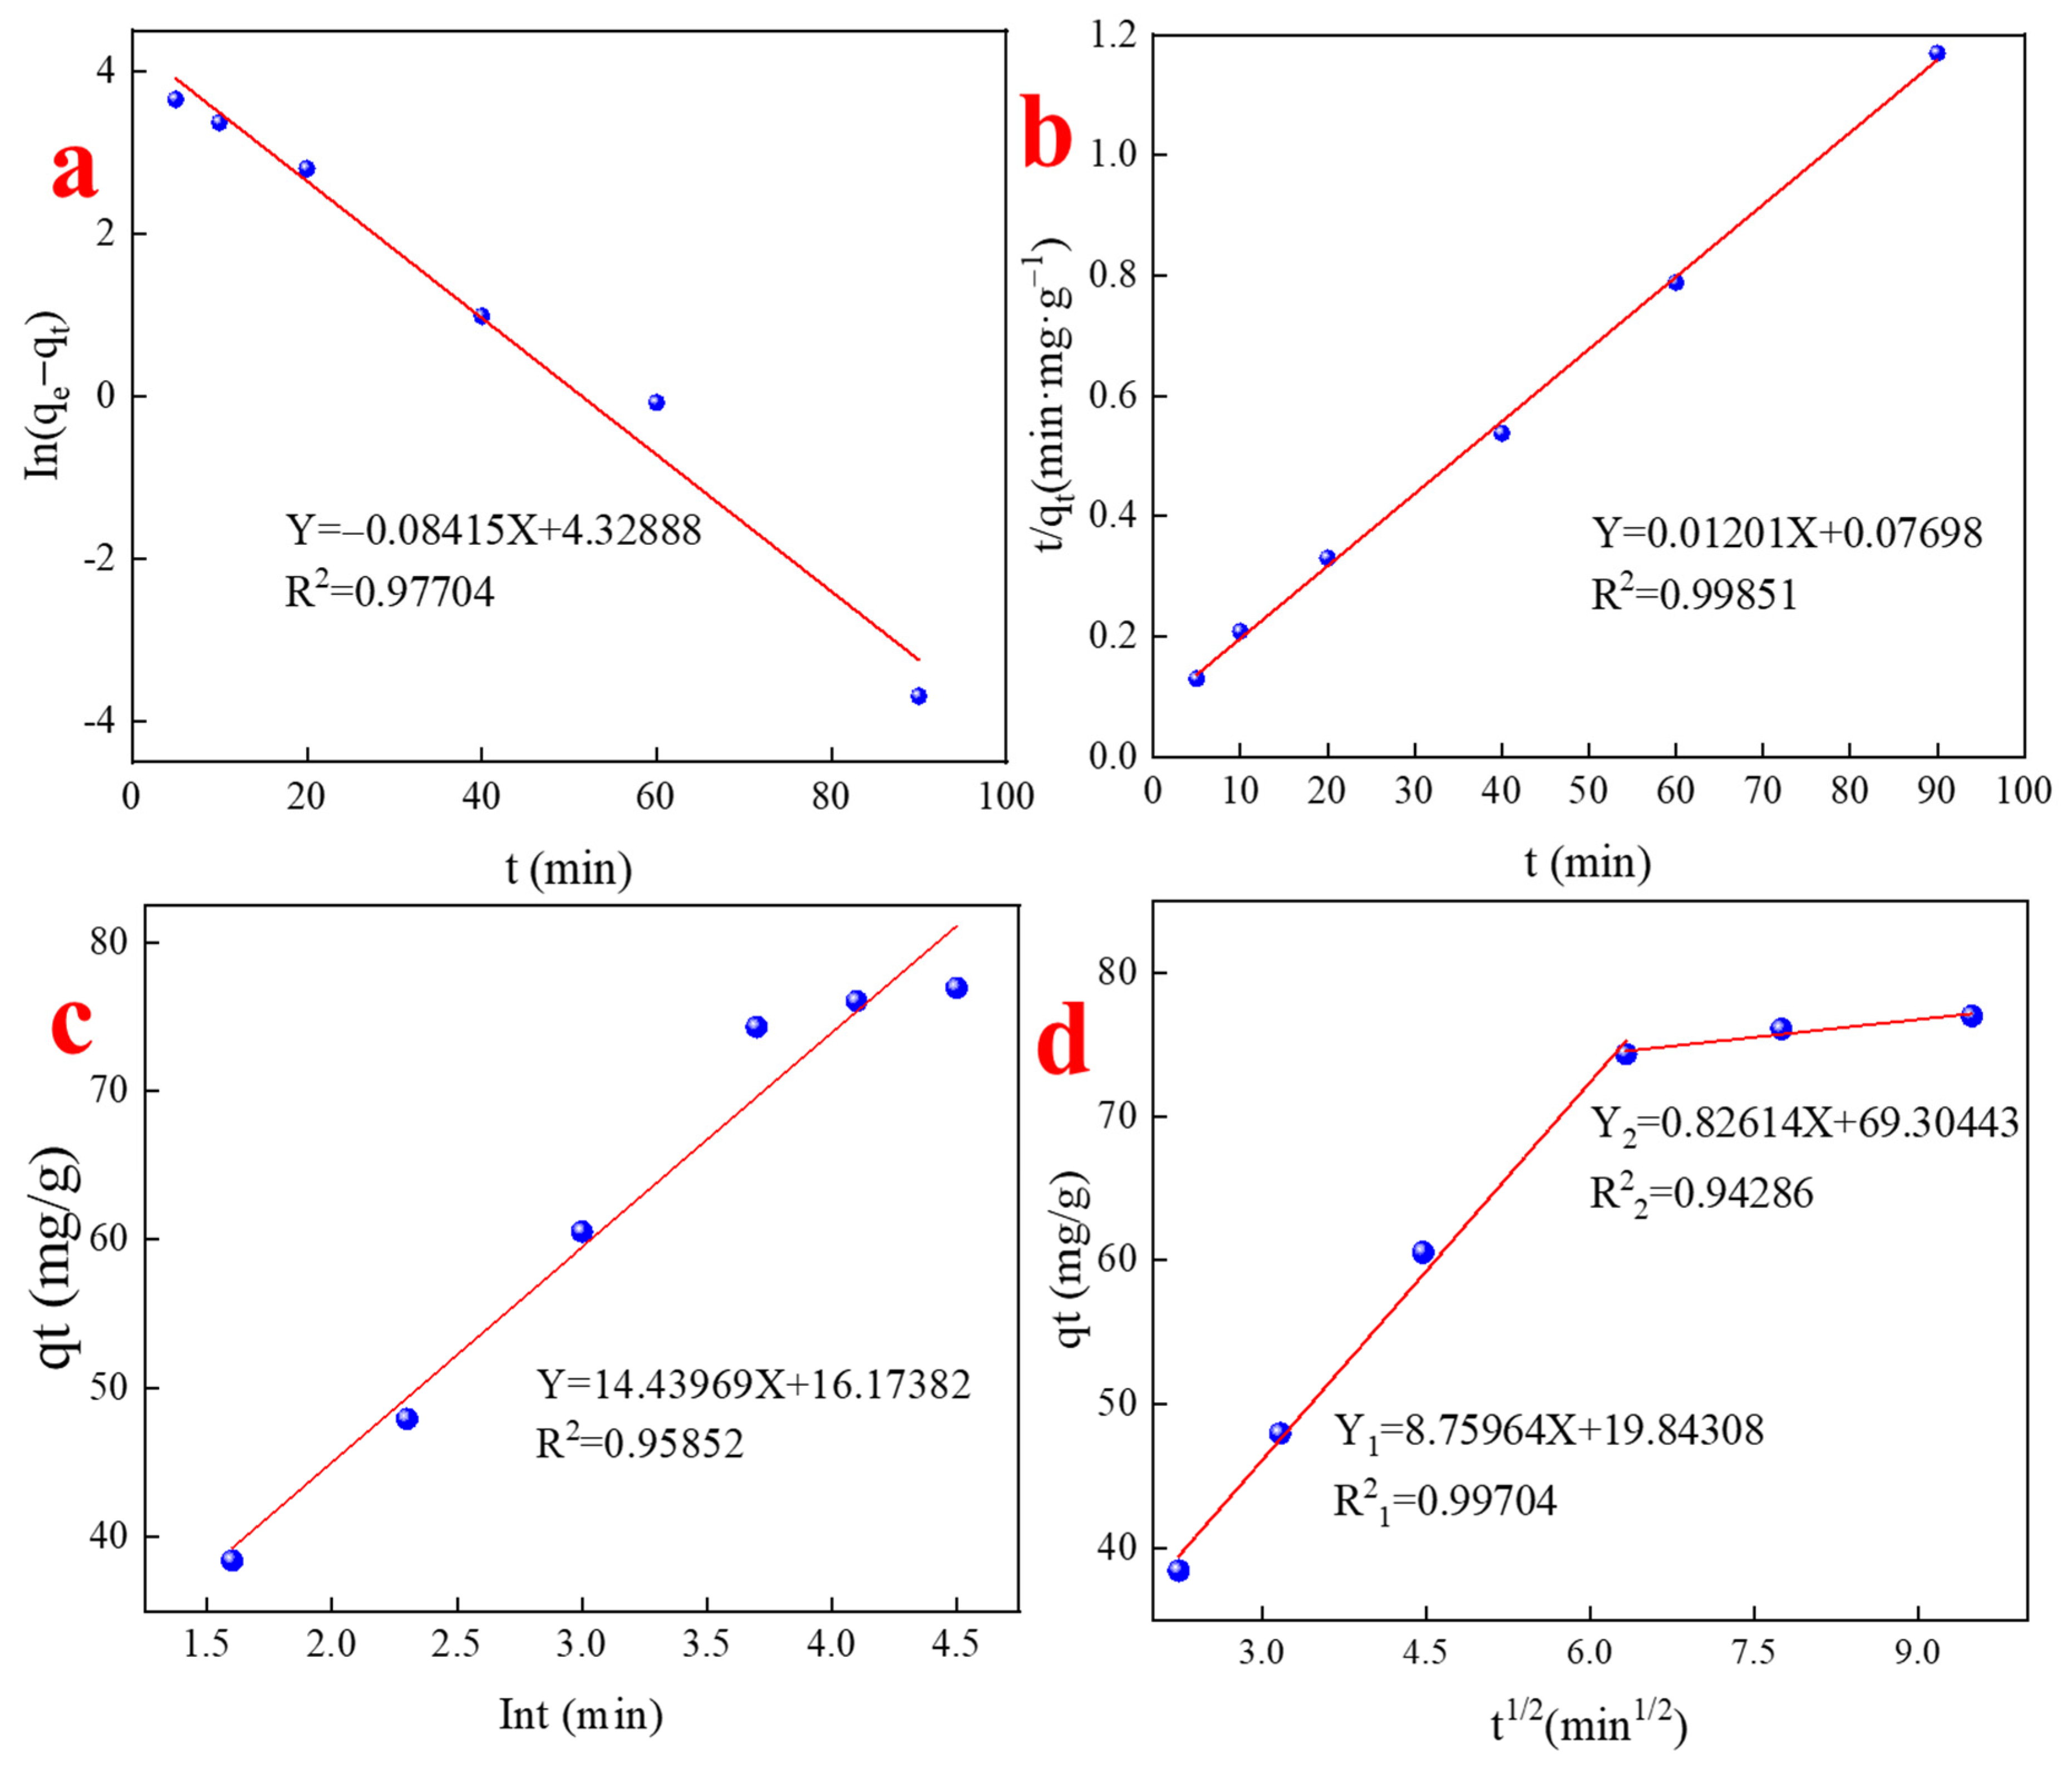
4.1. Adsorption Kinetics for Pb(II) Adsorption

In order to further study the adsorption kinetics mechanism, linear pseudo-first-order kinetic (3), pseudo-second-order kinetic (4), the Elovich equation (5), and intraparticle diffusion (6) were used to fit the data curve of adsorption kinetics data, and the specific formulas are as follows:
ln q e q t = Inq e k 1 t
  t q t = 1 k 2 q e 2 + t q e
q t = β   In α × β + β   lnt
q t = k i t 0.5 + C .
The linear fitting results of pseudo-first-order kinetic equation, pseudo-second-order kinetic equation, and the Elovich equation are shown in Figure 10a–c, and the kinetic parameters of Pb(II) adsorption are detailed in Table 4. It can be seen that the R2 of the pseudo-second-order kinetic equation model is higher than the fitting results of the pseudo-first-order kinetic equation and Elovich equations, indicating that the pseudo-second-order kinetic equation model can better reveal the adsorption of lead by the material, and the fitting curve of the quasi-secondary kinetic passes through all of the experimental data points, and the regression coefficient of the fitting of the Pb(II) can reach 0.99, which suggests that the adsorption of lead by the material is mainly chemisorption.
The intraparticle diffusion model was used to fit the data. As shown in Figure 10d, the lead adsorption amount and t1/2 of the material can be fitted by two straight lines with different slopes in the entire time range, and they do not pass through the origin, indicating that the adsorption process is not affected by a single diffusion factor, and there may also be a common effect such as chemical reaction. Additionally, the fitted correlation coefficient of the intraparticle diffusion model is 0.997 in the former stage and 0.9428 in the latter stage, which indicates that this model can well describe the adsorption behavior of Pb(II) on the adsorbent material in the former stage. The first stage is the first 40 min, when about 74.325 mg/g (97.79% of the saturated adsorption capacity) of lead is adsorbed by the material. The second stage occurs after 40 min, when about 2% of the lead is adsorbed into the material and reaches adsorption equilibrium. The intraparticle diffusion parameters in Table 5 also show the same result. The slope constants are K1 > K2 in the two stages, that is, the adsorption rate changes from fast to slow and finally reaches an adsorption plateau.

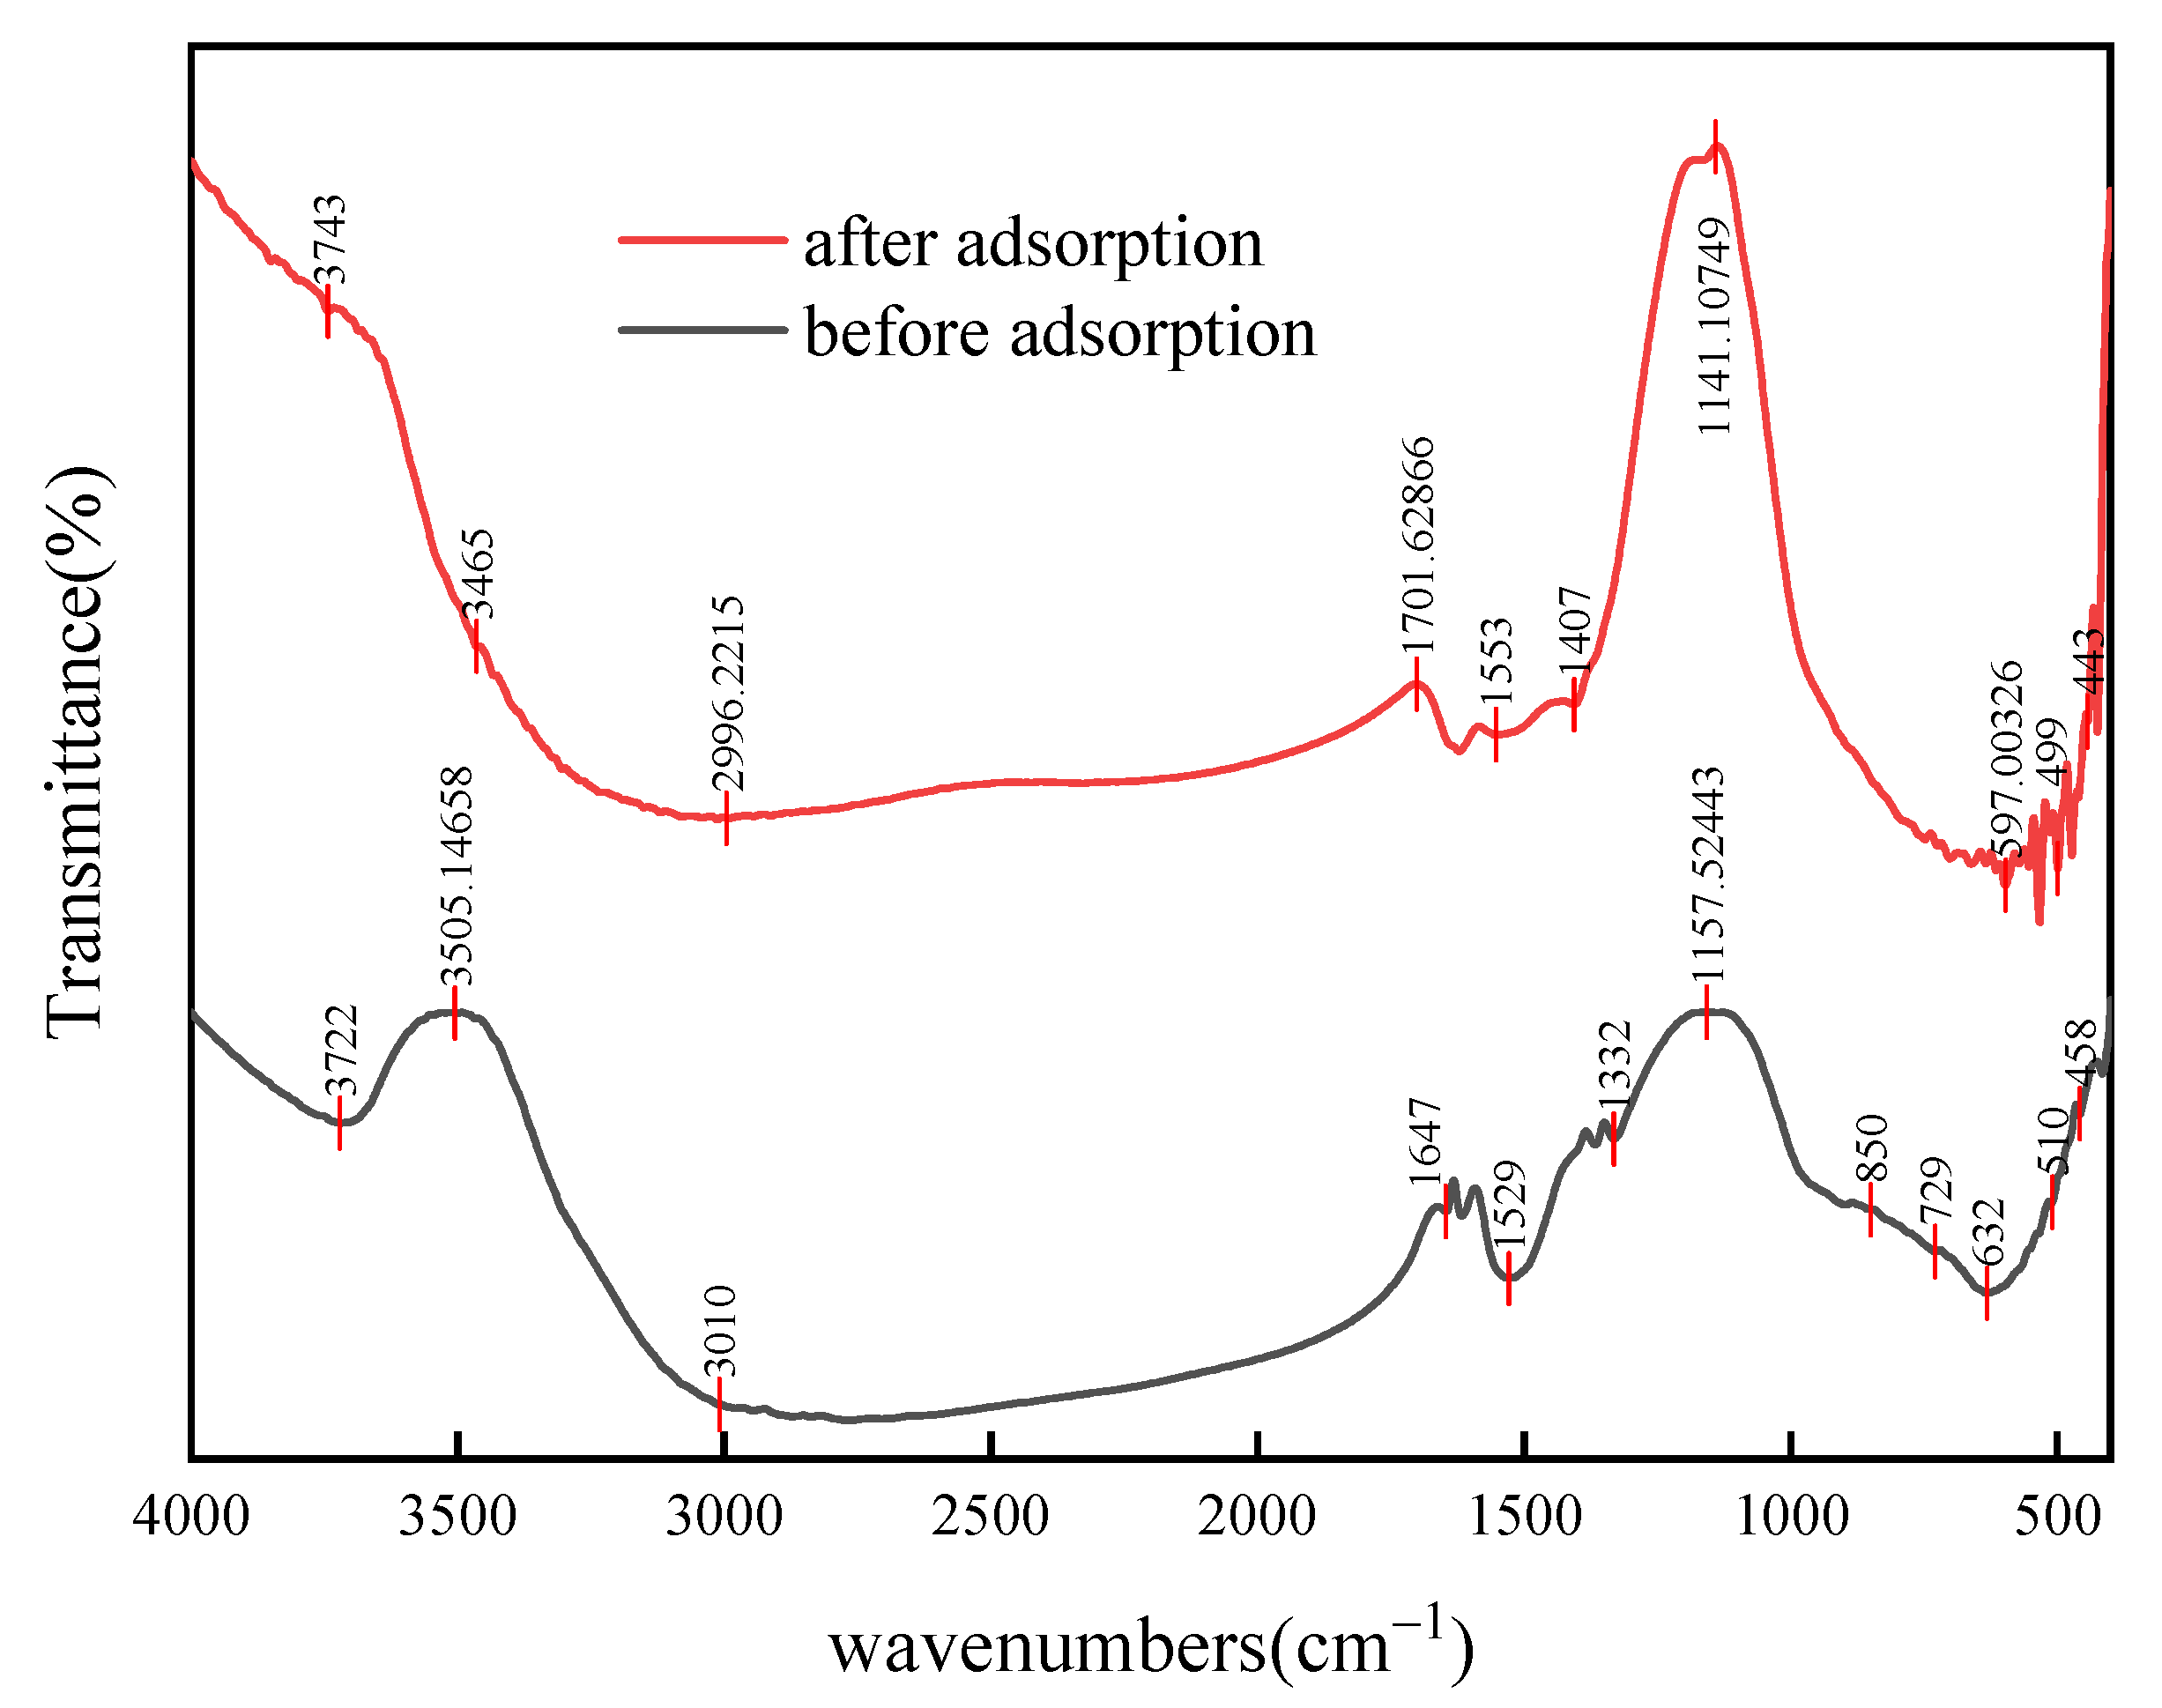
4.2. Characterization Analysis

In this study, the surface morphology and Pb element content of the material after drying before and after lead adsorption were analyzed by scanning electron microscopy. The results are shown in Figure 11 and Table 6. As can be seen in Figure 11A,B, the surface structure of the material before adsorption is loose, and there are more voids and micropores between the surface particles, which is favorable for exposing more active sites and promoting the adsorption–solid–loading reaction, and the lead elements accounted for about 1% of the surface elements of the material before adsorption. After adsorption, the lead element accounted for 24.01% of the surface element of the material, and the surface of the material was rougher, with many fine powdery particles and more cracks in the local area, indicating that a large number of lead ions were adsorbed.
The EDS elemental distribution of the material before and after adsorption is shown in Figure 11C,D. The main elements in the structure of the material after adsorption are uniformly distributed, indicating that the adsorbent material is structurally stable during the adsorption process. Meanwhile, lead ions were uniformly adsorbed on the surface of the material. When the adsorption material is saturated in the Pb ion solution, the distribution of Pb elements on the surface of the adsorbed material is more densely than that of the pre-adsorbed material, indicating that the adsorption effect is very obvious. In addition, the relative content of Pb also increased from 1.86% to 24.01%. The above results fully show that the prepared adsorption material has a remarkable effect on the adsorption of Pb ions.

4.3. Adsorption Mechanism

In order to analyze the surface functional groups and their changes during the preparation process, the FTIR spectra of the material before and after lead adsorption were analyzed. As can be seen in Figure 12, before adsorption, the broad peak at 3505 cm−1 represents the O-H telescopic vibration of water molecules bound on the adsorbent surface, the peak at 1647 cm−1 is the C=O telescopic vibration peak, the peak at 1157 cm−1 is the area of the vibrational absorption peaks of CO32−, which corresponds to the asymmetric telescopic vibration of C-O, and the peaks at 632 cm−1 and 510 cm−1 represent the curved vibration peaks of C-H. It can be concluded that there are active groups such as O-H, C=O, and C-O in the adsorbent material. After the adsorption of lead ions, the O-H was at 3505 cm−1, the C=O stretching vibration peaks at 1647 cm−1 became weaker, and the C-O peaks at 1157 cm−1 became stronger, and the peaks at 850 cm−1 were related to the r-CH of furan or the β-ring of pyridine, which indicated that O-H, C=O, and C-O participated in the adsorption process, and were the main adsorption sites, and also confirmed that the chemical adsorption was the main adsorption mechanism of the adsorption materials.
Figure 13 shows the XRD spectra of the materials before and after adsorption of Pb with characteristic diffraction peaks of TiO2, indicating that the crystal structure of the adsorbed materials remained stable during the adsorption process. The materials before and after adsorption showed the characteristic diffraction peaks of typical anatase TiO2, and the intensity of the diffraction peaks was the same, which proved that the grain size of the TiO2 carrier remained the same and did not change after adsorption. Meanwhile, the XRD spectra of the material before and after adsorption showed that the peak intensity and peak position did not change significantly, and the chemical composition was relatively single, and the XRD spectra of the material after adsorption only increased the characteristic diffraction peaks of Pb, so it can be known that the adsorbent material prepared has a high degree of chemical stability, and there is no introduction of other toxic elements after adsorption of Pb ions, so there is no risk of secondary pollution to the environment; moreover, the V2O5 and WO3 diffraction peaks are not found in the figure, indicating that V2O5 and WO3 are highly dispersed on the TiO2 carrier, and the distribution of their surface components will not be affected after adsorption of the material.
After adsorption of Pb, new characteristic diffraction peaks of Pb (labeled as 1 in Figure 12) were found at 2θ at 20°, 27.18°, and 34.16° for the adsorbent material, which are characteristic diffraction peaks of Pb3(CO3)2(OH)2. Combined with the FTIR analysis, it can be known that Pb(II) reacts with O-H, C=O, and C-O during the adsorption process to realize the adsorption of lead ions. In addition to this, peaks containing Pb substances were detected where BaTiO3 peaks were detected, and some scholars confirmed that porous barium strontium titanate adsorbent has a strong adsorption capacity for heavy metal ions, such as Pb2⁺, Cd2⁺, and Zn2⁺, etc. [33], and investigating the water molecule adsorption on the surface of barium titanate, it was found that water molecules have different adsorption forms on the surface of BaO and TiO2, leading to surface charge redistribution, which may affect its ability to adsorb other substances, and barium titanate shows unique photoelectric properties due to its high specific surface area and interfacial atom ratio, so the porous barium titanate substance on the adsorbent material also has some adsorption capacity for Pb2⁺.

5. Conclusions

(1)
Under the conditions of adsorbent dosage of 1.2 g/L, initial Pb(II) concentration of 100 mg/L, contact time of 60 min, and pH = 4, the adsorbent material achieved a near-complete adsorption of Pb(II), with the adsorption rate as high as 99.65%, and the adsorption capacity as high as 76.08 mg/g. The results show that the SCR catalyst for concentrated alkali leaching is a kind of good and highly efficient adsorbent material.
(2)
The kinetic study showed that the quasi-second-order kinetic model revealed that the adsorption of Pb by the adsorbent material was mainly controlled by chemisorption. The intraparticle diffusion model was used to fit the data, and the relationship between the adsorbed amount of Pb and t1/2 could be fitted by two straight lines with different slopes without passing through the origin, indicating that the adsorption process was not influenced by a single diffusion factor.
(3)
The adsorption of Pb by the Pb(II) adsorbent mainly occurs on the flaky surface of the adsorbent material, and the adsorption products are substances containing CO32− and OH-. The paper proposes a new approach for the high-value utilization of waste SCR catalysts that incorporates innovative waste treatment methods and provides a practical framework for improving the environmental sustainability of waste SCR catalysts. In addition, it effectively realizes the value of lead recovery and disposal.

Author Contributions

Experimentation, data organization, investigation, writing–original draft, L.Z.; guidance, methods, writing—review and editing, W.Y.; conceptualization, supervision, writing—review and editing, obtaining funding, M.Y.; data collation, H.N., Y.M., K.X. and Z.Z.; All authors have read and agreed to the published version of the manuscript.

Funding

This research was supported by the National Natural Science Foundation of China (No.52464025), Academic and Technical Leaders Project of Major Disciplines in Jiangxi Province (No.20243BCE51072), Young Elite Scientists Sponsorship Program by CAST (No.2022QNRC001), Natural Science Foundation of Jiangxi Province (No.20224BAB204038), Ganzhou Science and Technology Innovation Talent Project (No.2023CYZ26999).

Institutional Review Board Statement

Not applicable.

Informed Consent Statement

Not applicable.

Data Availability Statement

The original contributions presented in the study are included in the article; further inquiries can be directed to the corresponding author.

Conflicts of Interest

The authors declare no conflicts of interest.

References

  1. Tan, L.; Guo, Y.; Liu, Z.; Feng, P.; Li, Z. An investigation on the catalytic characteristic of NOx reduction in SCR systems. J. Taiwan Inst. Chem. Eng. 2019, 99, 53–59. [Google Scholar] [CrossRef]
  2. Kumar, M.S.; Alphin, M.S.; Manigandan, S.; Vignesh, S.; Vigneshwaran, S.; Subash, T. A review of comparison between the traditional catalyst and zeolite catalyst for ammonia-selective catalytic reduction of NOx. Fuel 2023, 344, 128125. [Google Scholar] [CrossRef]
  3. Liu, Z.; Lin, D.; He, F.; Cao, Z.; Wang, B. Study of leaching mechanism and kinetics of vanadium and tungsten on the process of recovery spent SCR catalyst by sodium roasted. Mater. Rep. 2021, 35, 429–433. [Google Scholar]
  4. China Environmental Protection Industry Association Desulfurization and Denitration Committee. China Development Report on Desulfurization and Denitration Industries in 2014; China Environmental Protection Industry: Beijing, China, 2015; Volume 12, pp. 4–23. [Google Scholar]
  5. Wang, J.-Z.; Du, H.; Olayiwola, A.; Liu, B.; Gao, F.; Jia, M.-L.; Wang, M.-H.; Gao, M.-L.; Wang, X.-D. Recent advances in the recovery of transition metals from spent hydrodesulfurization catalysts. Tungsten 2021, 3, 305–328. [Google Scholar] [CrossRef]
  6. Dai, Z. Research on Heavy Metal Leaching Characteristics of Waste SCR Catalyst and Its Harmless Treatment. Master’s Thesis, Huazhong University of Science and Technology, Wuhan, China, 2018. [Google Scholar]
  7. Wang, Q. Research on chemical hazardous waste incineration and flue gas treatment process. Chem. Des. Newsl. 2022, 48, 188–190. [Google Scholar]
  8. Xue, Q. Analysis of hazardous waste incineration and disposal technology. Chem. Manag. 2022, 44–46. [Google Scholar]
  9. Wu, T.; Liu, X.; Xi, W. Study on factors affecting acid dissolution rate in titanium separation from waste denitrification catalyst. Mod. Chem. Ind. 2018, 38, 115–117. [Google Scholar]
  10. Kim, J.W.; Lee, W.G.; Hwang, I.S.; Lee, J.Y.; Han, C. Recovery of tungsten from spent selective catalytic reduction catalysts by pressure leaching. J. Ind. Eng. Chem. 2015, 28, 73–77. [Google Scholar] [CrossRef]
  11. Choi, I.-H.; Moon, G.; Lee, J.-Y.; Jyothi, R.K. Hydrometallurgical processing of spent selective catalytic reduction (SCR) catalyst for recovery of tungsten. Hydrometallurgy 2018, 178, 137. [Google Scholar] [CrossRef]
  12. Zhang, Y.; Qu, W.; Yang, J.; Jia, L.; Li, L.; Cao, H.; Guo, X. Cd2+ and Zn2+ fluorescence turn-on sensing and the subsequent detection of S2− by a quinol imide based sensor in water and living cells with application in the combinational logic gate. Tetrahedron 2022, 121, 132916. [Google Scholar] [CrossRef]
  13. Wei, Y.; Li, D.; Qiao, J.; Guo, X. Research progress on disposal and recovery of waste SCR denitrification catalysts. Sci. Technol. Rev. 2024, 42, 62–72. [Google Scholar]
  14. Wang, J.; Guo, P.; Li, X.; Zhu, J.; Reinert, T.; Heitmann, J.; Spemann, D.; Vogt, J.; Flagmeyer, R.-H.; Butz, T. Source identification of lead pollution in the atmosphere of Shanghai City by analyzing single aerosol particles (SAP). Environ. Sci. Technol. 2000, 34, 1900–1905. [Google Scholar] [CrossRef]
  15. Sall, M.L.; Diaw, A.K.D.; Gningue-Sall, D.; Aaron, S.E.; Aaron, J.-J. Toxic heavy metals: Impact on the environment and human health, and treatment with conducting organic polymers, a review. Environ. Sci. Pollut. Res. 2020, 27, 29927–29942. [Google Scholar] [CrossRef]
  16. Qin, G.; Niu, Z.; Yu, J.; Li, Z.; Ma, J.; Xiang, P. Soil heavy metal pollution and food safety in China: Effects, sources and removing technology. Chemosphere 2021, 267, 129205. [Google Scholar] [CrossRef] [PubMed]
  17. Zhuang, P.; McBride, M.B.; Xia, H.; Li, N.; Li, Z. Health risk from heavy metals via consumption of food crops in the vicinity of Dabaoshan mine, South China. Sci. Total Environ. 2009, 407, 1551–1561. [Google Scholar] [CrossRef]
  18. Chen, Q.; Luo, Z.; Hills, C.; Xue, G.; Tyrer, M. Precipitation of heavy metals from wastewater using simulated flue gas: Sequent additions of fly ash, lime and carbon dioxide. Water Res. 2009, 43, 2605–2614. [Google Scholar] [CrossRef]
  19. Jokar, M.; Mirghaffari, N.; Soleimani, M.; Jabbari, M. Preparation and characterization of novel bio ion exchanger from medicinal herb waste (chicory) for the removal of Pb2+ and Cd2+ from aqueous solutions. J. Water Process Eng. 2019, 28, 88–99. [Google Scholar] [CrossRef]
  20. Kárászová, M.; Bourassi, M.; Gaálová, J. Membrane removal of emerging contaminants from water: Which kind of membranes should we use. Membranes 2020, 10, 305. [Google Scholar] [CrossRef]
  21. Vaudevire, E.; Radmanesh, F.; Kolkman, A.; Vughs, D.; Cornelissen, E.; Post, J.; van der Meer, W. Fate and removal of trace pollutants from an anion exchange spent brine during the recovery process of natural organic matter and salts. Water Res. 2019, 154, 34–44. [Google Scholar] [CrossRef]
  22. Rodriguez, A.Z.; Wang, H.; Hu, L.; Zhang, Y.; Xu, P. Treatment of produced water in the permian basin for hydraulic fracturing: Comparison of different coagulation processes and innovative filter media. Water 2020, 12, 770. [Google Scholar] [CrossRef]
  23. Jin, Y.; Liu, P.; Peng, W.; Tang, J. Research progress on modification methods of pomelo peel as biological adsorbent. South For. Sci. 2022, 50, 61–66+72. [Google Scholar]
  24. Vo, T.S.; Hossain, M.M.; Jeong, H.M.; Kim, K. Heavy metal removal applications using adsorptive membranes. Nano Converg. 2020, 7, 36. [Google Scholar] [CrossRef]
  25. Adornado, A.P.; Soriano, A.N.; Orfiana, O.N.; Pangon, M.B.J.; Nieva, A.D. Simulated biosorption of Cd (II) and Cu (II) in single and binary metal systems by water hyacinth (Eichhornia crassipes) using Aspen adsorption. ASEAN J. Chem. Eng. 2017, 16, 21–43. [Google Scholar] [CrossRef]
  26. Wang, B.-J.; Xie, Q.; Sha, Y.-T.; Liu, J.-C.; Liang, D.-C. Research progress of activated carbon preparation. Mod. Agric. Sci. Technol. 2024, 40, 118–122+127. [Google Scholar]
  27. Chen, X.; Duan, F.; Yu, X.; Xie, Y.; Wang, Z.; El-Baz, A.; Ni, B.J.; Ni, S.Q. One-stage anammox and thiocyanate-driven autotrophic denitrification for simultaneous removal of thiocyanate and nitrogen: Pathway and mechanism. Water Res. 2024, 265, 122268. [Google Scholar] [CrossRef]
  28. Sun, L.; Jiang, Z.; Yuan, B.; Zhi, S.; Zhang, Y.; Li, J.; Wu, A. Ultralight and superhydrophobic perfluorooctyltrimethoxysilane modified biomass carbonaceous aerogel for oil-spill remediation. Chem. Eng. Res. Des. 2021, 174, 71–78. [Google Scholar] [CrossRef]
  29. Chengsheng, S.; Dali, Z.; Lei, Y.; Jiabei, Z.; Can, L.; Zhi-Gang, C. Recovery TiO2 and sodium titanate nanowires as Cd (II) adsorbent from waste V2O5-WO3/TiO2 selective catalytic reduction catalysts by Na2CO3-NaCl-KCl molten salt roasting method. J. Taiwan Inst. Chem. Eng. 2018, 88, 226–233. [Google Scholar]
  30. Luo, J.; Wenjuan, G.; Guiqing, Z. High pressure leaching of tungsten and vanadium with sodium carbonate from spent SCR denitration catalysts. Rare Met. Cem Carbides 2015, 43, 1–6. [Google Scholar]
  31. Huo, Y.; Chang, Z.; Li, W.; Liu, S.; Dong, B. Reuse and valorization of vanadium and tungsten from waste V2O5–WO3/TiO2 SCR catalyst. Waste Biomass Valorization 2015, 6, 159–165. [Google Scholar] [CrossRef]
  32. Li, S.-C.; Kang, C.-S.; Kim, S.-C.; Kim, C.-J.; Kang, C.-J. The extraction of Ta, Nb and rare earths from fergusonite by using KOH sub-molten salt leaching. Hydrometallurgy 2021, 201, 105358. [Google Scholar] [CrossRef]
  33. Zhang, D.; Wang, M.; Tan, Y. Preparation of porous nanoporous barium strontium titanate based on straw template method and its adsorption performance on heavy metals. J. Chem. 2010, 68, 1641–1648. [Google Scholar]
Figure 1. XRD patterns of adsorbent materials and SCR catalyst raw materials.
Sustainability 17 04823 g001
Figure 2. SEM images and EDS images of waste SCR catalyst materials (a), SEM images and EDS images of adsorbent materials (b).
Sustainability 17 04823 g002
Figure 3. Particle size distribution maps of the waste SCR catalyst (a) and adsorbent material (b).
Sustainability 17 04823 g003
Figure 4. (I) and (II) are the scanning electron microscope study of local adsorbent materials amplified to 5000 mm and 15,000 mm.
Sustainability 17 04823 g004
Figure 5. Influence of dosage on the Pb(II) adsorption process.
Sustainability 17 04823 g005
Figure 6. Influence of contact time on the Pb(II) adsorption process.
Sustainability 17 04823 g006
Figure 7. Influence of initial concentration on the Pb(II) adsorption process.
Sustainability 17 04823 g007
Figure 8. Influence of pH on the Pb(II) adsorption process.
Sustainability 17 04823 g008
Figure 9. Influence of co-existence metal ions on the adsorption performance of adsorption materials.
Sustainability 17 04823 g009
Figure 10. Linear fitting of pseudo-first-order kinetic equation (a), linear fitting of pseudo-second-order kinetic equation (b), linear fitting of the Elovich equation (c), and linear fitting of intraparticle diffusion (d).
Sustainability 17 04823 g010
Figure 11. Scanning electron microscopy before and after adsorption (A,B), EDS elemental distribution on the material surface before and after adsorption of Pb (C,D).
Sustainability 17 04823 g011
Figure 12. FTIR spectra of materials before and after adsorption of Pb.
Sustainability 17 04823 g012
Figure 13. XRD patterns of the material before and after adsorption of Pb.
Sustainability 17 04823 g013
Table 1. Major elemental composition in SCR catalyst raw materials and adsorbent materials (wt/%).
TiONaWBaSiCa
SCR catalyst raw materials47.2140.100.079134.3252.6131.6091.376
Adsorbent materials46.5341.695.3010.1282.2110.89091.917
Table 2. EDS quantitative results element of SCR catalyst raw materials and adsorbent materials (wt/%).
EDS Quantitative Results ElementWaste SCR Catalyst MaterialsAdsorbent Materials
O47.5839.45
Ti28.1231.00
Fe5.475.96
Al0.860.74
Si1.831.64
W5.991.30
Na0.006.37
Ca0.082.22
Ba8.9011.22
Table 3. Specific surface areas of waste SCR catalysts and adsorbent materials (m2/g).
MaterialsSpecific Surface Areas
waste SCR catalysts52.825
adsorbent materials5.393
Table 4. EDS quantitative results at places 1, 2, 3, and 4 in Figure 4II (wt/%).
EDS Quantitative Results Element1234
O15.0326.2330.9930.00
Ti55.3850.6442.4044.20
Fe2.863.264.182.28
Na2.023.775.995.86
W1.050.282.640.90
V0.000.000.610.22
Si0.640.951.181.04
Ca2.252.571.992.43
Ba19.9511.819.0212.35
Table 5. Kinetic parameters for adsorption of Pb(II).
ModelsParameters
Pseudo-first-orderk1 (min−1)qe (mg/g)R2
0.0841575.85930.97704
Pseudo-second-orderk2 (g·mg−1·min−1)qe (mg/g)R2
0.00187483.26390.99851
Elovich equationα (g·mg−1·min−1)β (mg/g)R2
0.2153514.439690.95852
Intraparticle diffusionki (g·mg−1·min−1)
k1 = 8.75964
k2 = 0.82614
C (mg/g)
19.84308
69.30443
R2
0.99704
0.94286
Table 6. The content of Pb element in the material before and after adsorption (wt/%).
ElementBefore AdsorptionAfter Adsorption
Pb1.8624.01
Disclaimer/Publisher’s Note: The statements, opinions and data contained in all publications are solely those of the individual author(s) and contributor(s) and not of MDPI and/or the editor(s). MDPI and/or the editor(s) disclaim responsibility for any injury to people or property resulting from any ideas, methods, instructions or products referred to in the content.

