Article

Research on the Sustainable Reuse of Tire Textile Waste for the Production of Thermal Insulating Mats

by
Giedrius Balčiūnas
*,
Sigitas Vėjelis
,
Saulius Vaitkus
,
Jurga Šeputytė-Jucikė
,
Arūnas Kremensas
and
Agnė Kairytė
Laboratory of Thermal Insulating Materials and Acoustics, Institute of Building Materials, Faculty of Civil Engineering, Vilnius Gediminas Technical University, 10223 Vilnius, Lithuania
*
Author to whom correspondence should be addressed.
Sustainability 2025, 17(10), 4288; https://doi.org/10.3390/su17104288
Submission received: 18 March 2025 / Revised: 25 April 2025 / Accepted: 7 May 2025 / Published: 8 May 2025
(This article belongs to the Special Issue Sustainable Materials: Recycled Materials Toward Smart Future)

Abstract

Waste tire textile fiber (WTTF), a secondary product from the processing of end-of-life tires, is predominantly disposed of through incineration or landfilling—both of which present significant environmental hazards. The incineration process emits large quantities of greenhouse gases (GHGs) as well as harmful substances such as dioxins and heavy metals, exacerbating air pollution and contributing to climate change. Conversely, landfilling WTTF results in long-term environmental degradation, as the synthetic fibers are non-biodegradable and can leach pollutants into the surrounding soil and water systems. These detrimental impacts emphasize the pressing need for environmentally sustainable disposal and reuse strategies. We found that 80% of WTTF was used for the production of thermal insulation mats. The other part, i.e., 20% of the raw material, used for the twining, stabilization, and improvement of the properties of the mats, consisted of recycled polyester fiber (RPES), bicomponent polyester fiber (BiPES), and hollow polyester fiber (HPES). The research shows that 80% of WTTF produces a stable filament for sustainable thermal insulating mat formation. The studies on sustainable thermal insulating mats show that the thermal conductivity of the product varies from 0.0412 W/(m∙K) to 0.0338 W/(m∙K). The tensile strength measured parallel to the direction of formation ranges from 5.60 kPa to 13.8 kPa, and, perpendicular to the direction of formation, it ranges from 7.0 kPa to 23 kPa. In addition, the fibers, as well as the finished product, were characterized by low water absorption values, which, depending on the composition, ranged from 1.5% to 4.3%. This research is practically significant because it demonstrates that WTTF can be used to produce insulating materials using non-woven technology. The obtained thermal conductivity values are comparable to those of conventional insulating materials, and the measured mechanical properties meet the requirements for insulating mats.

1. Introduction

Waste management has become a fundamental ecological issue in recent decades. The increase in the amount of waste is primarily due to globalization, industrialization, urbanization, and population growth. Recycling the waste generated by these industries significantly benefits both humanity and the environment. Currently, waste textiles and tires are the most commonly produced types of waste [1]. Waste tire textile fibers (WTTFs) are a by-product of the mechanical recycling of end-of-life tires, constituting about 10–15% by weight of tires [2]. Nowadays, these fibers are incinerated or landfilled, and they pose significant environmental challenges. The fast expansion of the automotive sector is caused by global industrialization, which leads to an increase in the production of tires. Consequently, worldwide production accounts for ~1.5 billion units per year [3], which generates a large volume of end-of-life tires, since they do not degrade naturally for centuries. The increasing volumes of generated and accumulated waste tires are threatening the ecosystem. Waste tire landfills pose a potential fire hazard, pollute the environment, and threaten people’s health [4].
The principal applications for end-of-life tires involve reuse (5–23%), landfill (20–30%), pyrolysis and energy recovery (25–60%), and the production of composite materials (3–15%) [2]. The main materials produced from the tires are steel cords, polymer fibers, and rubber (granulated or powder), representing 5–30%, 5–15%, and 70% by weight, respectively [5]. Truck tires require more steel reinforcement to support greater stresses when in use, while passenger tires have less steel and more textiles to reduce weight [6].
The fibers obtained from tires are difficult to use in recycling because they are contaminated with rubber residues [7]. The rubber particles in the fibers account for 22–65% by weight [2,8,9]. In addition, the output fibers have several unfavorable characteristics: they are characterized by a low specific weight and high volume (approximately 140 kg/m3), which causes additional expenses for transportation; they gather electrostatic charges within the bundles, which limit the extrusion process combined with a compound; they form soft bundles that restrict the uniform mixing with other materials, such as bituminous conglomerates or plastics [10]. The textile fibers of tires are usually sent to landfills or incinerators for heat recovery [11,12]. About 320,000 tons of dirty fibrous material in Europe are generated annually during the recycling of tires [7].
Despite the inefficient utilization of waste tire textile, scientific papers have shown a sufficient number of ways to use waste tire textile to develop new materials. In addition, recycled or waste fibers are profitable because they usually cost less than new fibers [13]. According to different scientific researches, Nylon, especially Nylon 6.6, and polyester are the main polymers found in WTTF [2,14,15].
WTTF can be used as a reinforcing filler for soil reinforcement [2,16] and asphalt mixtures [5,17], as a concrete additive [18], as a sound-absorbing material [9,19,20], or as a thermal conductivity reducing material in concretes and plasters [13,16]. WTTF itself has good heat preservation properties. Daniele Landi et al. [10] studied samples of WTTF of different densities and found that, as the density varied from 69 kg/m3 to 287 kg/m3, the thermal conductivity ranged from 0.0548 W/(m∙K) to 0.0650 W/(m∙K). In addition, van de Lindt et al. [21] mixed WTTF with ash and sprayed it on ready-made structures at construction sites.
The studies showed that the thermal conductivity of such a material is 0.0350 W/(m∙K). In the scientific work of Ružickij [22], differently prepared WTTF was mixed with polyurethane adhesive for the production of composites with densities ranging from 96 kg/m3 to 171 kg/m3. The thermal conductivity of these composites ranged from 0.0439 to 0.0495 W/(m∙K). Further studies of Thai et al. [11] used WTTF with PVA adhesive and freeze-dried the resulting dispersion to obtain a porous structure. The thermal conductivity of such a product ranged from 0.0350 to 0.0490 W/(m∙K). In addition, the developed product was characterized by a high porosity ranging from 90% to 98%.
Even though the analyzed studies proved the proper thermal insulation ability of WTTF-based composites, the mechanical and water resistance performance was not taken into consideration in most of the studies. When considering such materials for application in building envelopes, both mechanical and water resistance properties are crucial for their effectiveness and longevity. Thermal insulating mats must withstand physical stress, and a higher tensile strength is required to prevent ripping or tearing, especially during installation, while water resistance helps to prevent moisture absorption, which can lead to mold and mildew growth [23].
Therefore, to enhance scientific knowledge in this field, the research focuses on the industrial process to produce WTTF-based thermal insulating mats. The study includes a comprehensive analysis of the raw materials, and the testing of the thermal insulating, water resistance, and mechanical properties of the mats produced using non-woven manufacturing technology. Additionally, a statistical analysis of the experimental data was conducted. The research conducted in this work is evaluating whether WTTF can be used for the production of thermal insulation mats. The possibility of reusing WTTF could be made possible by the selection of appropriate technologies and mixture compositions.

2. Materials and Methods

2.1. Raw Materials

Four types of fibers were chosen to be used for the formation of technical mats: WTTF, bicomponent low-melt polyester fiber (BiPES), recycled polyester fiber (RPES), and hollow polyester fiber (HPES). WTTF was obtained from JSC Ekobazė (Elektrėnai, Lithuania) immediately after the separation of textile waste from rubber. WTTF in different samples contained from 43 wt.% to 51 wt.% rubber, which, due to its high density, may have an adverse effect on the thermal insulation properties. In order to avoid this effect, the WTTF was sieved with vibro screens before use. After the initial separation, the amount of rubber residue in WTTF was no more than 6 wt.%. It was not possible to remove a larger amount of rubber because rubber inserts were interposed within the WTTF lumps. The length of WTTF fibers varied from 10 mm to 30 mm.
BiPES fibers were used to perform the winding function, with a length of (51 ± 3) mm, a thickness of (4.4 ± 0.5) de‘, a tenacity of (3.5 ± 0.5) g/de‘, an elongation of (42 ± 10)%, a number of crimp of (3.0 ± 2) num/cm, and a dry shrinkage of >7.0%. RPES fibers with a length of (64 ± 5) mm, a thickness of 7 de‘ ± 8%, a number of crimp of (4.0 ± 2) num/cm, and a strength of ≥3.3 cN/dtex were used as a stabilizing filler. HPES fibers with a length of (64 ± 5) mm, a thickness of 7 de‘ ± 8%, a number of crimp of (3.0 ± 2) num/cm, and a strength of ≥3.3 cN/dtex were used to reduce thermal conductivity. BiPES fibers were purchased from Jae Moo Coorporation (Fob Busan, Korea), while RPES and HPES fibers were supplied by JSC Daturė (Trakai region, Lithuania).

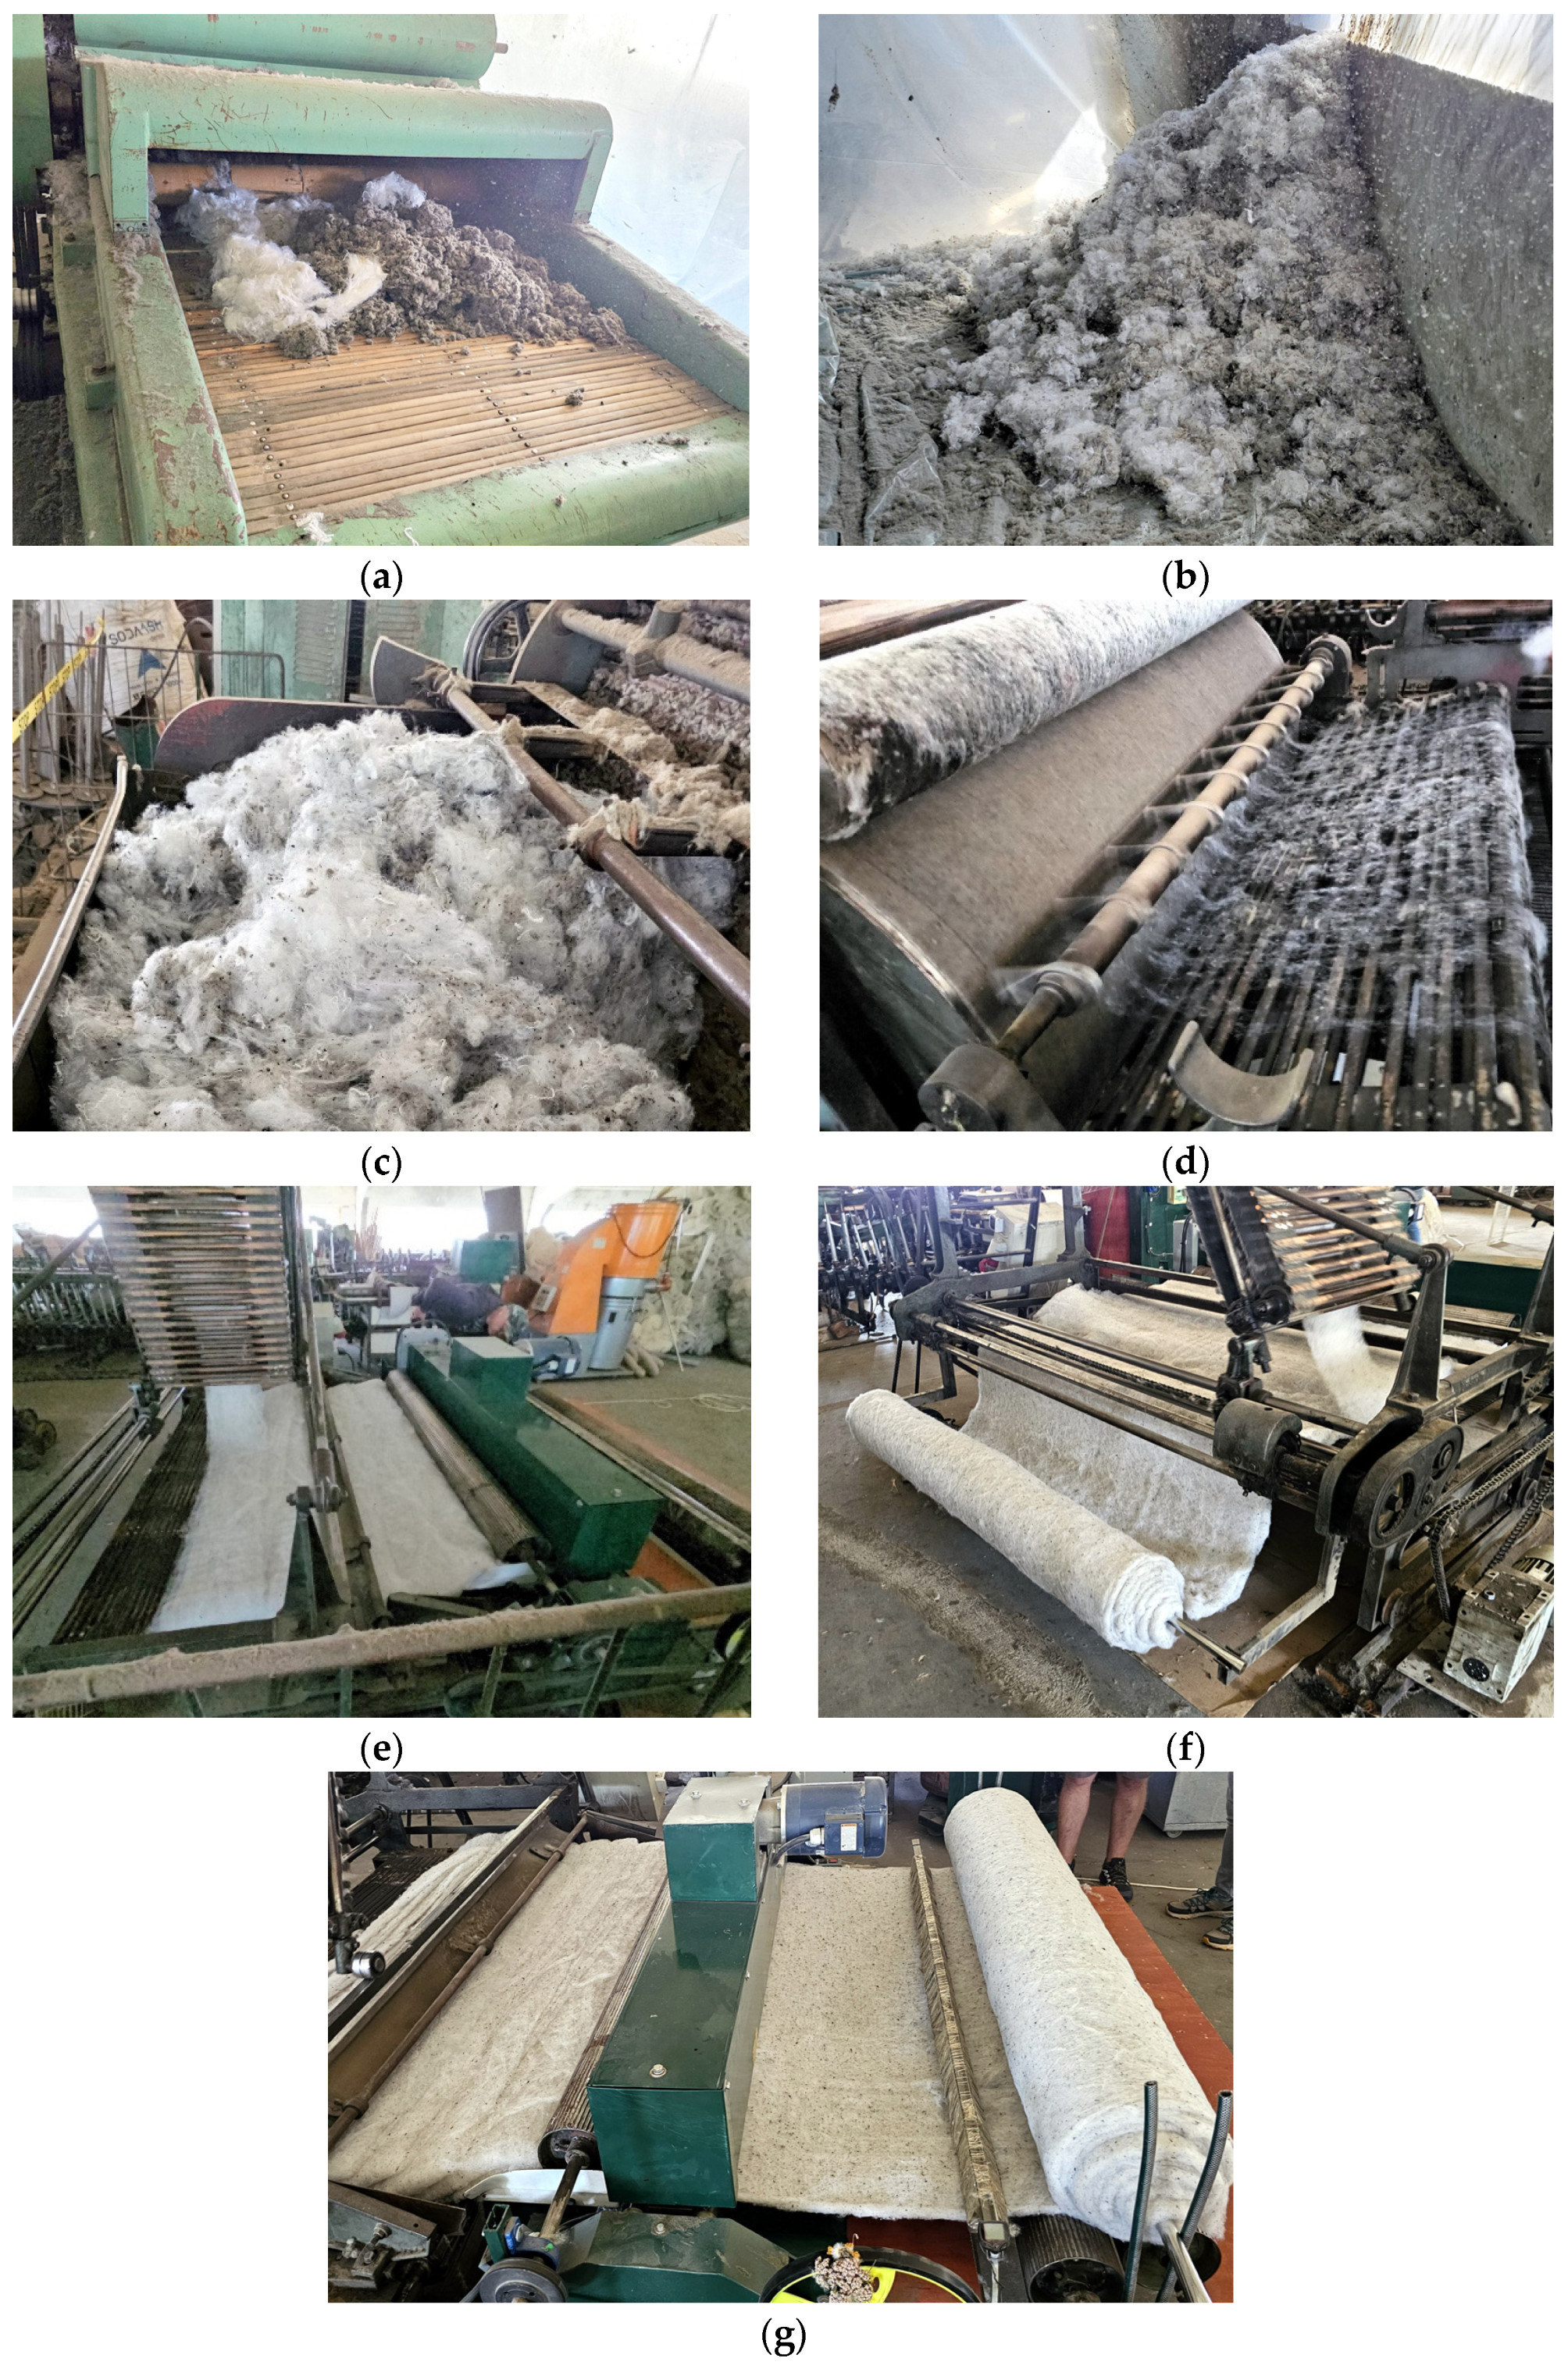
2.2. Production of WTTF-Based Thermal Insulating Mats

For experimental studies, it was chosen to form samples of 3 different compositions. In all cases, 80 wt.% WTTF and 10 wt.% BiPES fibers, which ensure felting, were used for mat formation. In the case of the WTTF+BiPES+RPES composition, 10 wt.% RPES fibers were additionally used; in the case of the WTTF+BiPES+HPES composition, 10 wt.% HPES fibers were used; and, in the case of the WTTF+BiPES+RPES+HPES composition, a mixture of both fibers were used, i.e., 5 wt.% RPES and 5 wt.% HPES fibers. The forming compositions are shown in Table 1.
The technical mat was formed in the non-woven production line of JSC Litwool (Ukmergės district, Lithuania). According to the selected composition, the fibers were weighed and fed into the shredder (Figure 1a).
The fibers are pulled out in the shredder, and primary mixing is performed. From 1.7% to 3.3% of rubber residues are separated from the textile in the shredder and fall out between the shafts. Raw material losses were recorded at all stages, i.e., after sieving, shredding, mixing WTTF fibers, and mat production. A part (from 3.7% to 4.2%) of very short (≤10 mm) WTTF also falls out between the shafts. The fibers are torn and partially mixed in the shredder and enter the settling chamber by a cyclone (Figure 1b). Further, the mixed fibers are carded (combed) so that all fibers go in the same direction. Before feeding to the carding unit, the fibers are additionally mixed with the help of a toothed conveyor in a volumetric feeder (Figure 1c). In the carding unit, a very thin web is formed (Figure 1d). In the carding unit, again, a part (up to 3%) of the short WTTF (≤20 mm) falls out between the shafts. In order to obtain a homogeneous layer, the obtained thin web is fed by a conveyor to a second carder where the thickness of the web is regulated. The web formed in the second carder is fed to the felting unit (Figure 1e). In order to obtain a thicker mat, several webs are fed to the felting unit (Figure 1f). After leaving the felting unit, the prepared mat is rolled into a roll (Figure 1g).

2.3. Testing Methods

The thermal conductivity determination was carried out using the heat flow meter method based on EN 12667 [24] requirements for specimens made from raw fibers and prepared WTTF-based thermal insulating mats with dimensions of (300 × 300 × 50) mm. An average test temperature of 10 °C was used to determine thermal conductivity. All specimens were conditioned for 72 h at (23 ± 2) °C and (50 ± 5)% before the test. Three specimens of each density and each type of raw material and WTTF-based thermal insulating mat were prepared.
The tensile strength test was conducted (Figure 2a) according to EN ISO 29765 [25] standard. The specimen directions (Figure 2b) were along and across the direction of product formation.
All specimens were conditioned for 24 h at (23 ± 2) °C and (50 ± 5)% before the test. Three specimens were prepared for each WTTF-based thermal insulating mat type and production direction.
Short-term water absorption test was conducted based on method A of EN ISO 29767 [26]. The specimen direction was perpendicular to the production direction. The bottom surface of the specimen was (10 ± 2) mm below the surface of the water during the test. The immersion in water took 24 h, and then the specimens were removed from water and weighed. Three samples were prepared for each type of raw material and its density, as well as the WTTF-based thermal insulating mat and its density.
The drying test was conducted immediately after the short-term water absorption test. All samples were placed on a drainage stand and inclined at 45°. Three samples of 200 × 200 mm for each composition were used for the measurements. The first weight measurement was taken after 10 min, followed by 30 min, 1 h, and 24 h. The test was conducted at 23 ± 5 °C temperature and 50 ± 5% relative air humidity.
The hydrophobic nature of the fibers’ surface was determined according to water contact angle measurements. Water contact angle goniometer OS-45D optical system (Ossila Ltd., Sheffield, UK) was adopted. Then, 1 µL water drops were placed on the surface of the sample placed using a syringe. The results were recorded 10 s after deposition of the water droplet. The water contact angles were measured three times for each fiber.
Macro- and microstructure of raw materials was taken using an optical microscope Smart 5MP PRO (Delta Optical, Gdańsk, Poland) which has a magnification up to 300 times. ImageJ software (version 1.54) was used for image analysis.
Mathematical-statistical methods and the software STATISTICA v.8 were used for processing the experimental data and evaluating their reliability [27].

3. Results and Discussion

3.1. Characterization of Raw Materials

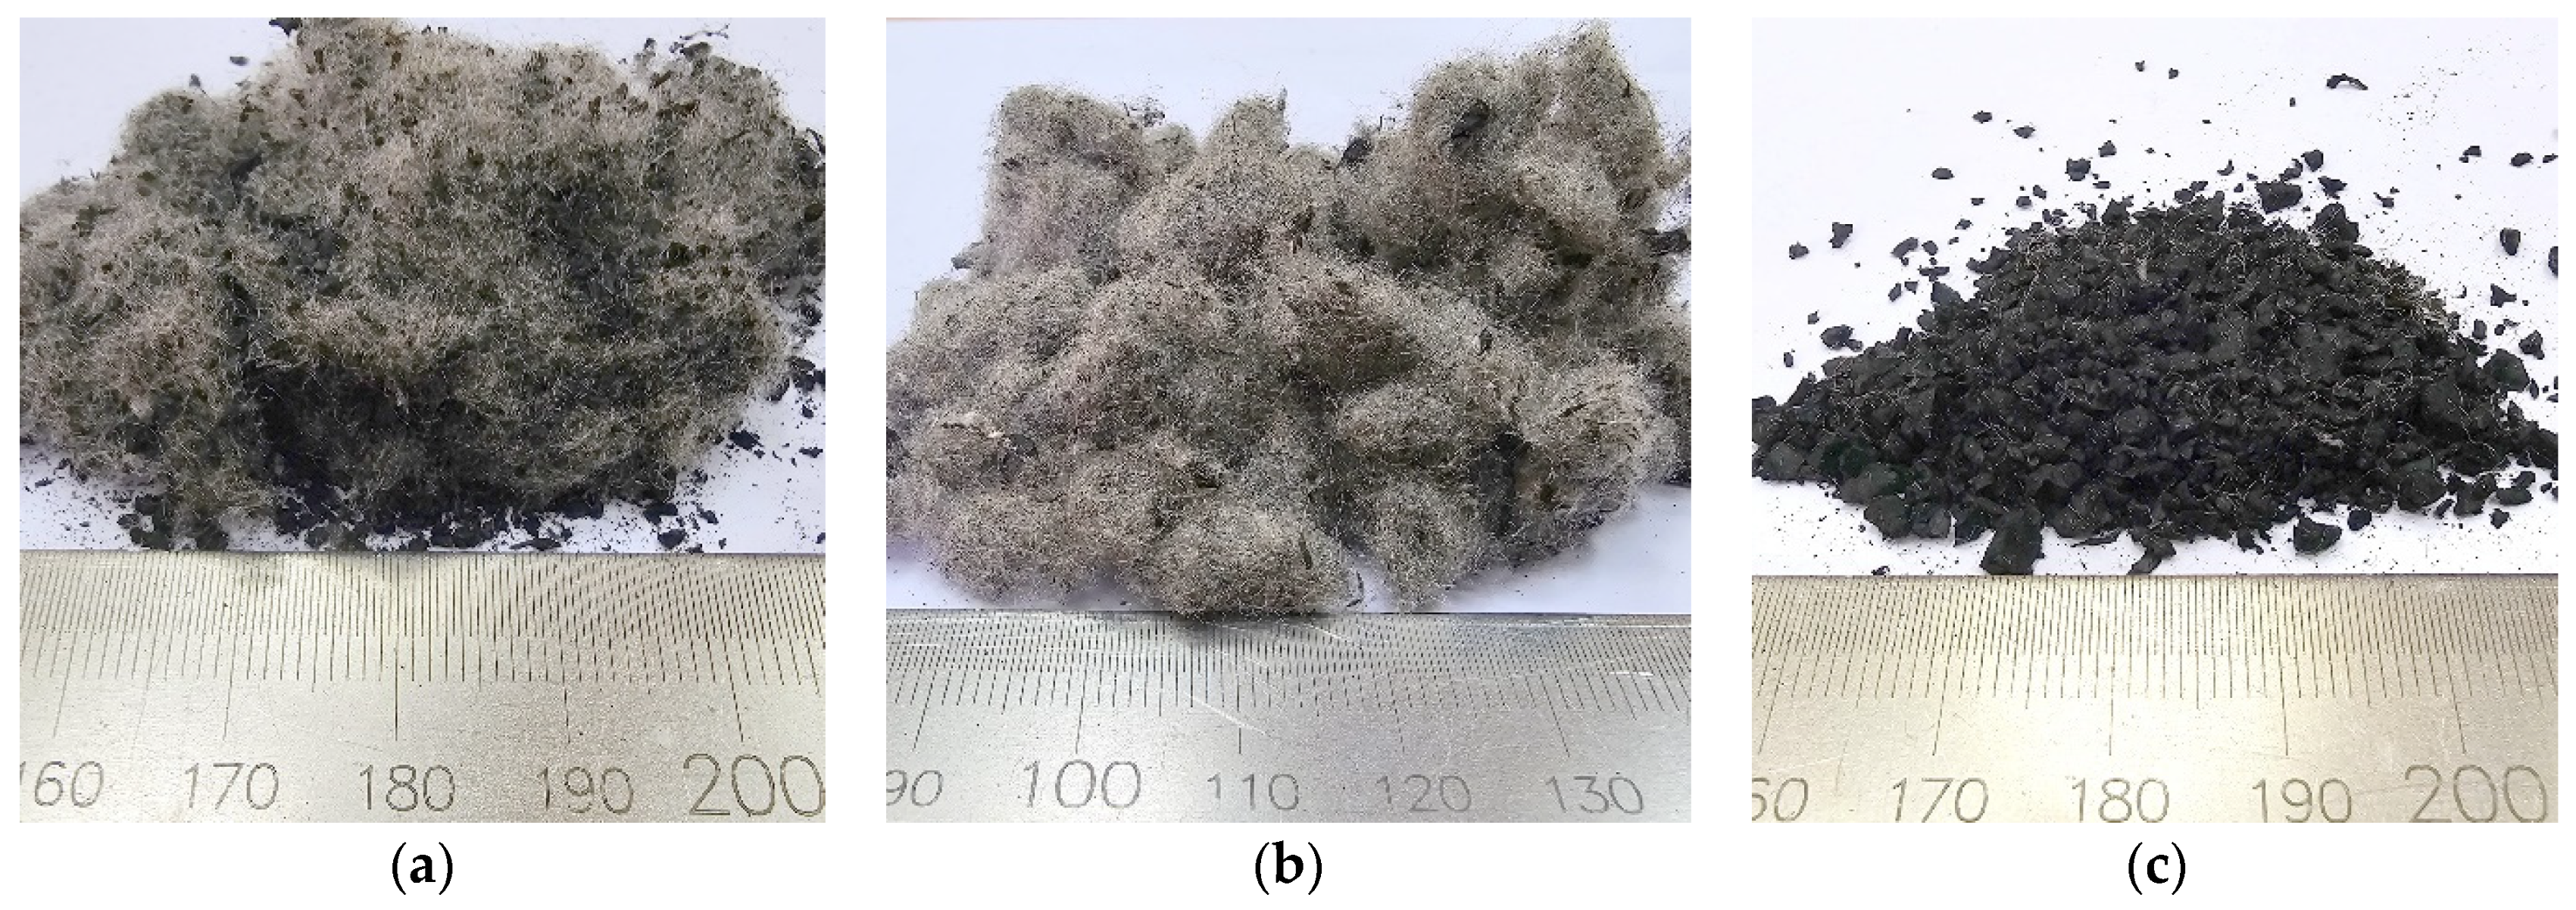
3.1.1. Macrostructure

Analyzing the macrostructure of unsieved WTTF (Figure 3a), we can see that the raw material consists of extremely thin, tangled grey fibers and irregularly shaped rubber granule waste. In the sieved WTTF, tangled textile fibers are observed in clumps of (5–20) mm and a small amount of fine (up to 2 mm) rubber granule waste entangled in WTTF fiber clumps (Figure 3b). An image of rubber separated from textile fibers is presented in Figure 3c. It shows rubber granules of very different sizes, the largest diameter of which reaches 4 mm, and fine textile fibers, the greatest length of which is 5 mm.
Figure 4 shows the macrostructure of binding RPES (Figure 4a), BiPES (Figure 4b), and HPES fibers (Figure 4c).
All three types of fibers exhibit a similar macrostructure, with white fibers measuring 51 to 64 mm in length. Twisted fibers can be observed clumped together in certain areas.

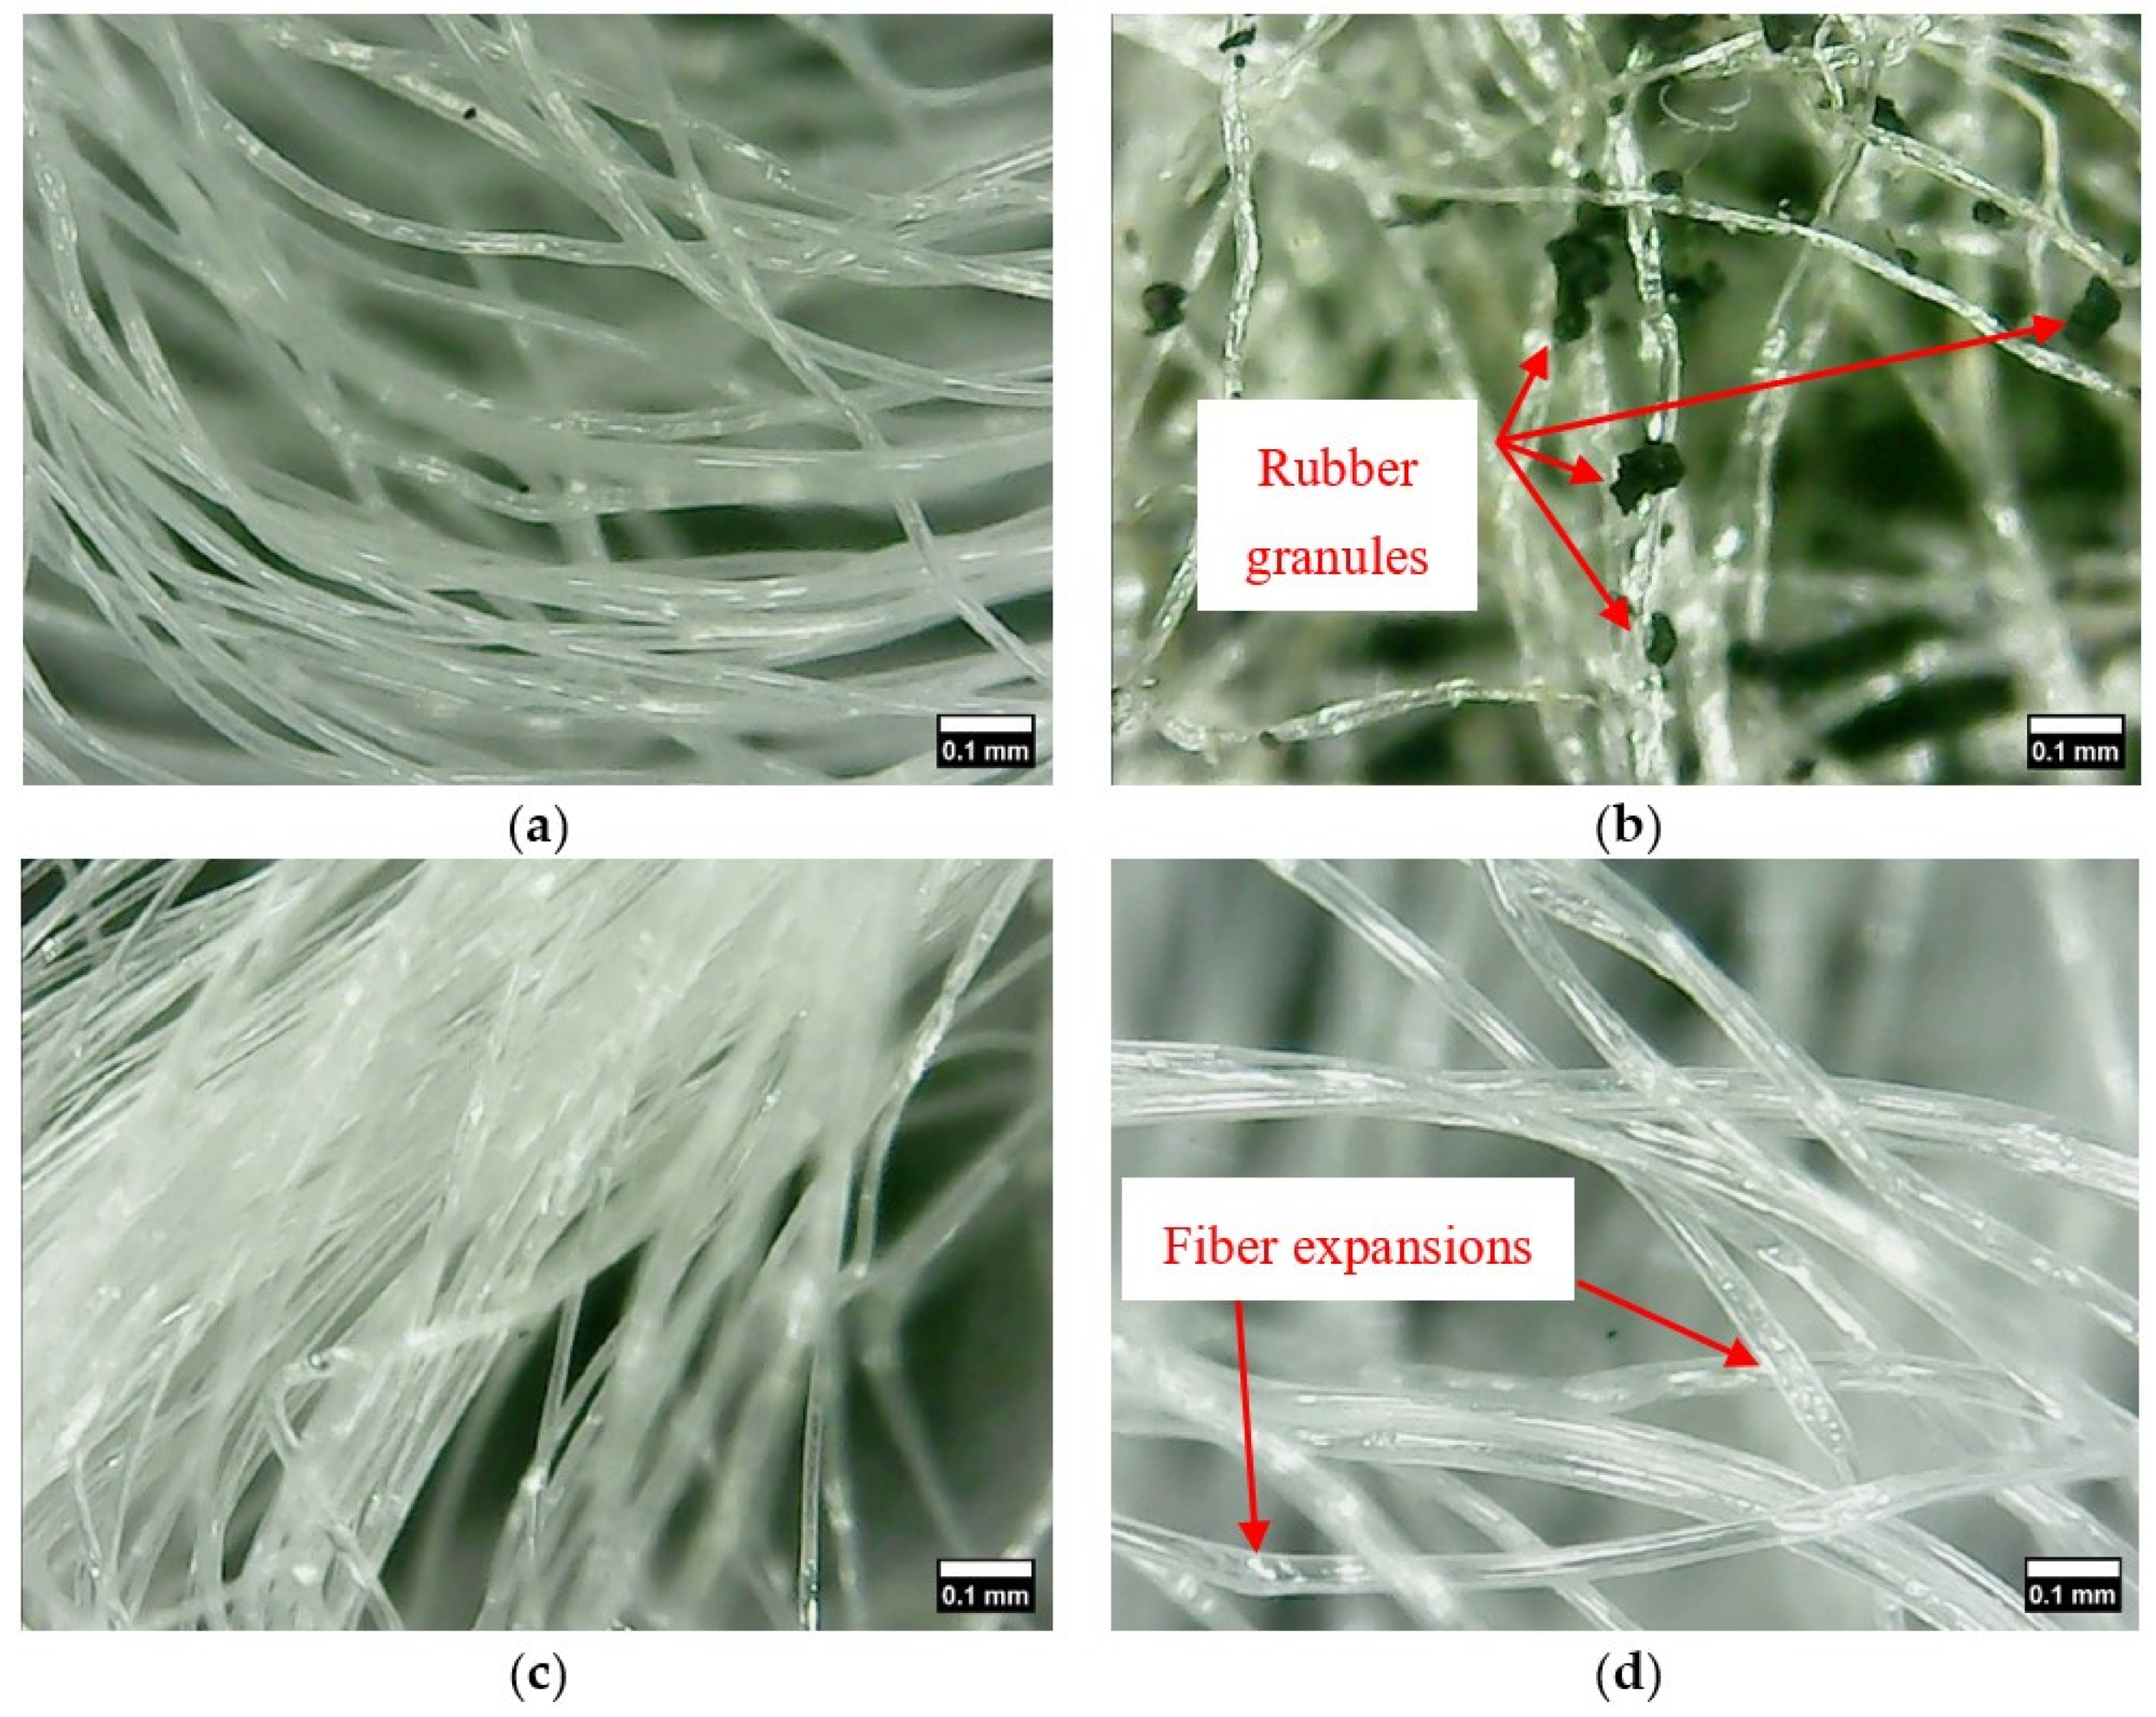
3.1.2. Microstructure

During the microstructure analysis, it was determined that WTTF (Figure 5b) consists of elongated fibers with an average thickness of 22.7 µm, with the smallest recorded thickness being 14 µm, and the largest 31 µm. In Figure 5a, rubber granule residues adhering to the WTTF, with an average diameter of 56 µm, the smallest diameter of 26 µm, and the largest diameter of 121 µm, can be seen.
The microstructure study of the HPES fibers showed (Figure 5d) that these are elongated fibers with noticeable thickenings in random places. The average fiber thickness was determined to be 39.4 µm. The smallest recorded thickness was 35 µm, and the largest—in places of fiber thickening—was 46 µm. The average thickness of the RPES (Figure 5a) fiber was determined to be 25.1 µm, with a minimum and maximum of 22 µm and 28 µm, respectively. The average thickness of the BiPES fibers (Figure 5c) was 16.3 µm, with a minimum and maximum of 12 µm and 22 µm, respectively.

3.1.3. Thermal Conductivity and Density of Raw Fibers

Figure 6 presents the thermal conductivity of all fibers selected for the current study. It shows that the thermal conductivity of the RPES, BiPES, and HPES fibers decreases with increasing density, and, after reaching a certain density level, it changes only slightly. As the density of RPES fibers increased from ~10.9 kg/m3 to ~49.1 kg/m3, the thermal conductivity changed from 0.0691 W/(m·K) to 0.0396 W/(m·K). An analysis of the results shows that, when the density of RPES fibers increased by ~5 times, the thermal conductivity decreased by ~43%. As the density of BiPES fibers changed from ~13.0 kg/m3 to ~50.2 kg/m3, the thermal conductivity reduced from 0.0600 W/(m·K) to 0.0384 W/(m·K). In other words, when the density of the BiPES fibers increased by ~4 times, the thermal conductivity decreased by ~36%. As the density of the HPES fibers varied from ~10.8 kg/m3 to ~49.1 kg/m3, the thermal conductivity reduced from 0.0581 W/(m·K) to 0.0382 W/(m·K). As the density of the HPES fibers increased by ~5 times, the thermal conductivity decreased by ~34%.
It can be assumed that the decrease in the thermal conductivity with increasing density in all three binding fiber cases was due to the denser fiber structure and decreased content in the air gaps, which reduces the heat loss due to the heat transfer by radiation [28], while the heat loss through the solid framework of the material due to the increased contact areas between the fibers at a density of 50 kg/m3 does not yet have a decisive effect on the increase in the thermal conductivity value.
Meanwhile, the density of the unsieved WTTF and sieved WTTF is significantly higher than that of the RPES, BiPES, or HPES fibers. As the density of WTTF varies from ~59.4 kg/m3 to ~178.2 kg/m3, the thermal conductivity increases from 0.0397 W/(m·K) to 0.0493 W/(m·K). An analysis of the results shows that, when the density of the sieved WTTF increases by ~3 times, the thermal conductivity increases by ~24%. As the density of the unsieved WTTF varies from ~79.2 kg/m3 to ~178.4 kg/m3, the thermal conductivity increases from 0.0423 W/(m·K) to 0.0540 W/(m·K); i.e., when the density of the unsieved WTTF increases by ~2 times, the thermal conductivity increases by ~28%. It can be assumed that the higher thermal conductivity of the sieved WTTF and unsieved WTTF is observed due to the more intensive heat transfer through the solid material framework due to the higher density [28]. The experimental data showed that the residual rubber granules worsened the thermal conductivity value (from 6.9% to 19.5%) in all cases. Experimental studies of all raw materials show that they (as judged by the thermal conductivity values) are suitable for producing thermal insulation materials.
As the unsieved WTTF displayed higher thermal conductivity values than the sieved WTTF, we decided to use the sieved WTTF for further testing. A statistical analysis of the data showed that a regression equation Equation (1) can describe the thermal conductivity results obtained (Table 2).
The statistical results of the experimental data showed that the coefficient of determination of the fibrous raw materials is >0.9 (Table 2). It indicates that the selected regression model is suitable for describing the thermal conductivity of the analyzed fibrous raw materials.

3.1.4. Short-Term Water Absorption and Water Contact Angle of Raw Fibers

Figure 7 presents the results of the short-term water absorption of raw fibers: RPES—11.72 ± 0.735 kg/m2, WTTF—1.37 ± 0.325 kg/m2, BiPES—5.35 ± 0.695 kg/m2, and HPES—6.20 ± 0.880 kg/m2. The density of all raw fibers for short-term water absorption tests was set to ~60 kg/m3. An analysis showed that RPES fibers have the highest short-term water absorption, while WTTF has the lowest. The difference between the short-term water absorption results of RPES and WTTF was ~88%. We can assume that the fibers do not absorb water. The water absorption of natural fibers is usually determined by the hemicellulose and lignin content [29]. Synthetic fibers are made from petroleum-based polymers. They do not absorb water like natural fibers primarily due to their chemical structure and properties. Most synthetic fibers are hydrophobic because their molecular structure lacks the polar functional groups that can form hydrogen bonds with water molecules. Additionally, synthetic fibers have a very strong intermolecular force of attraction, which means that polymer chains in synthetic fibers have a very small intermolecular gap and a smooth surface, reducing water molecules’ ability to penetrate the fiber [30]. The lowest short-term water absorption value obtained for WTTF confirms the results of the study by Fazli and Rodrigue [2], which showed that the analyzed parameter of WTTF is twice lower compared to RPES fibers.
In the case of the current study, the highest water absorption of the fibers could be because the smallest voids were formed between the RPES and HPES fibers because of the longest fiber length (64 mm), which led to a more difficult water removal process during the drainage process of the samples. It was observed that HPES exhibits significantly lower water absorption compared to RPES, which could be attributed to the smoother surface of HPES fibers. Additionally, RPES fibers are characterized by the greatest curvature. This property also determines the more difficult removal of water droplets [31].
A statistical analysis showed that there are no differences between the average values obtained for BiPES and HPES fibers. The F-criterion statistic is 1.71 and p = 0.26. It indicates a statistically insignificant difference in the test results. Accordingly, the determination coefficient R2 = 0.300 and the adjusted determination coefficient R2 = 0.124 were obtained. The average value of water absorption for BiPES and HPES can be accepted as 5.78 ± 0.847 kg/m2. The difference between the BiPES/HPES fibers and RPES fibers was ~51%, respectively, and that between BiPES/HPES and WTTF was ~76%.
After conducting studies on the water contact angles (Figure 8), the following values were calculated: RPES—103.9 ± 1.40°, WTTF—124.1 ± 2.50°, BiPES—113.3 ± 1.64°, and HPES—106.2 ± 1.24°. In order to assess the difference in experimental results between individual raw fibers, a statistical analysis was performed. An analysis of the water contact angles for all the raw fibers showed (Figure 8a) that there are no differences between the average values of RPES and WTTF.
It can be seen that the WTTF has the largest water contact angle, and the RPES fibers have the smallest. The difference of the parameter reaches 16% for RPES, 9% for BiPES, and 14% for HPES compared to WTTF. It can be noted that the water contact angle values correlate with the short-term water absorption results. Even though some deviations in the contact angles of different fibers were noticed, all of them were more than 90°, indicating their hydrophobic nature and the sufficient spaces between the fibers for water droplets not to penetrate into deeper layers of the analyzed fibers. Zaman et al. [32] conducted research regarding the surface wettability of geotextiles and concluded that non-woven technology is better than wicking woven technology, as the water contact angle values do not fall lower than 90°.

3.2. Evaluation of WTTF-Based Thermal Insulating Mats Performance

3.2.1. Short-Term Water Absorption and Drying

Figure 9a presents the results of the short-term water absorption test: the value of the WTTF+BiPES+RPES mats was 3.18 ± 1.00 kg/m2 at a density of 26.9 ± 0.146 kg/m3, while WTTF+BiPES+HPES mats reached 2.72 ± 0.304 kg/m2 at a density of 29.9 ± 1.22 kg/m3 and WTTF+BiPES+RPES+HPES mats 1.47 ± 0.043 kg/m2 at a density of 30.3 ± 0.483 kg/m3. Haameem et al. [33] found that the percentage of water absorption of the samples from polyester fibers was approximately 1.5%. Additionally, Ratna Kumari et al. [34] studied the short-term absorption of polylactic acid and polyester. It was found that the maximum moisture gain for polylactic acid was 4.66%, and, for the polyester matrix, 4.22%. In both cases, the research used smaller samples and pure, unprocessed polyester fibers. The difference in results was likely influenced by the structure and density of the samples, but these parameters were not discussed in more detail in the analyzed studies.
The statistical analysis of the experimental data of short-term water absorption (Figure 9a) showed that there were no differences between the average values of the WTTF+BiPES+RPES and WTTF+BiPES+HPES mats. The F-criterion was 0.591, and p = 0.48. It indicates a statistically insignificant difference in the test results. Accordingly, the determination coefficient R2 = 0.13 and the adjusted determination coefficient R2 = −0.089 were obtained. The average value of the short-term water absorption of WTTF+BiPES+RPES and WTTF+BiPES+HPES mats is 2.95 ± 0.710 kg/m2. The difference in short-term water absorption between the WTTF+BiPES+RPES, WTTF+BiPES+HPES, and WTTF+BiPES+RPES+HPES mats was ~50%. As Schaefer [35] point out, polyester, depending on its production process, adsorbs ~0.2 to 0.5% water at 20 °C and 65% relative humidity. The water absorption correlates with the end groups of polyester (hydroxyl and carboxyl groups). In the case of the current study, it is likely that the absorption is determined by the coarser RPES fibers, which better retain water between the fibers.
According to Kosiński [36], fibrous insulation materials can transport, buffer, and evaporate moisture in dry environments. Each type of fibrous material has varying abilities to move moisture, absorb it, or dry out. These properties are influenced by the specific structure of the fibers, their density, and their arrangement. Therefore, the drying kinetics of the WTTF-based thermal insulating mats were evaluated after the short-term water absorption test. The experimental drying values obtained were approximated by the regression equation Equation (2) in Table 3.
A graphical interpretation of these equations is presented in Figure 9b. It was determined that, after 24 h of drying, the moisture reduction of the WTTF+BiPES+RPES+HPES mats was ~92%, WTTF+BiPES+RPES mats ~95%, and WTTF+BiPES+HPES mats ~100%. It can be concluded that WTTF+BiPES+HPES mats release moisture more easily than other compositions. Similar observations were carried out by Antlauf et al. [37], who analyzed the different moisture contents of cellulose fibers and cellulose nanofibers. From the graph (Figure 9b), it can be seen that the drying kinetics is distinguished into two stages.
During the first stage (during the first 6 h), the most intensive wetting occurs after the short-term water absorption test ends. The moisture content of the WTTF+BiPES+RPES mats decreased by ~84% during the first 6 h of drying, WTTF+BiPES+HPES mats by ~83%, and WTTF+BiPES+RPES+HPES by ~95%. The remaining moisture is removed from the samples during the second stage (during the remaining 18 h). In the second stage, the moisture loss of the WTTF+BiPES+RPES mats was ~8%, WTTF+BiPES+HPES mats ~12%, and WTTF+BiPES+RPES+HPES mats ~5%.

3.2.2. Thermal Conductivity

Figure 10 presents a graphical interpretation of the effect of different densities on the thermal conductivity of WTTF-based thermal insulating mats.
Experimental studies have shown that the obtained results can be described by the regression equation Equation (3). The results of the statistical processing of the experimental values of the thermal conductivity of WTTF-based thermal insulating mats are presented in Table 4.
Figure 10 shows that the thermal conductivity of WTTF-based thermal insulating mats decreases with increasing density, and, after reaching a certain density limit, it changes little. As the density of the mat increases, the air gaps between the fibers decrease, which determines a lower thermal conductivity value. However, after reaching a certain level of density increase, the contact areas of the fibers increase, which lead to a higher thermal conductivity. Hamrouni et al. [38] analyzed the thermal conductivity dependence on the density and moisture of flax fibers. The tested density range was from 100 kg/m3 to 400 kg/m3, resulting in the deterioration of thermal insulation performance with an increase in the selected density. Based on this and the current study, it can be assumed that densities higher than 100 kg/m3 are not beneficial for any fibrous thermal insulating material.
When the density of WTTF+BiPES+RPES mats changes from ~31.2 kg/m3 to ~93.3 kg/m3, the thermal conductivity reduces from 0.0409 W/(m·K) to 0.0351 W/(m·K). When the density of WTTF+BiPES+RPES mats increases by ~3 times, the thermal conductivity reduces by ~14%. When the density of WTTF+BiPES+RPES+HPES mats changes from ~27.7 kg/m3 to ~83.0 kg/m3, the thermal conductivity decreases from 0.0379 W/(m·K) to 0.0341 W/(m·K). When the density of the WTTF+BiPES+RPES+HPES increases by ~3 times, the thermal conductivity decreases by ~10%. When analyzing the change in the density of WTTF+BiPES+HPES mats from ~32.1 kg/m3 to ~95.9 kg/m3, a reduction in the thermal conductivity from 0.0364 W/(m·K) to 0.0339 W/(m·K) is observed. With the ~3-times increase in the density of the WTTF+BiPES+HPES, the thermal conductivity decreases by ~7%. Figure 10 shows that the WTTF+BiPES+HPES and WTTF+BiPES+HPES+RPES mats are characterized by a relatively lower thermal conductivity compared to the thermal conductivity of WTTF+BiPES+RPES mats. It is likely that HPES, which is characterized by hollow fibers, allows a significant reduction in the thermal conductivity of the mats because of the additional lower thermal conductivity (0.025 W/(m·K) of the air voids in the HPES fiber.
Sajid et al. [39] studied mats produced using non-woven technology. Washingtonia palm, wool, cotton, and polyester fibers were used. Experimental data showed that the thermal conductivity of the palm/wool fiber mat with a density of 104 kg/m3 at an average temperature of 10 °C was ~0.0340 W/(m·K), the palm/cotton fiber mat ~0.0410 W/(m·K) at a density of 177 kg/m3, and the palm/polyester fiber mat ~0.0360 W/(m·K) at a density of 165 kg/m3. The thermal conductivity of mineral-based thermal insulation materials with densities ranging from 24 kg/m3 to 99 kg/m3 and thermal conductivity varying from 0.0318 W/(m·K) to 0.0490 W/(m·K) were examined in detail in the work of Abdou and Budaiwi [40]. Stapulionienė [41] also studied in detail the thermal conductivity of thermal insulation materials made of natural fibers and pure polylactic acid. It was found that, as the density increased from 40 kg/m3 to 100 kg/m3, the thermal conductivity of the natural-fiber-based thermal insulating materials varied from 0.0370 W/(m·K) to 0.0538 W/(m·K), while the thermal conductivity of the mats formed from polylactic acid varied from 0.0322 W/(m·K) to 0.0345 W/(m·K).
Comparing the results of the current study and other authors’ works, it can be concluded that the thermal conductivity of fibrous materials with a similar density varies insignificantly. Apparently, the nature of the fibers does not have a significant effect on the thermal conductivity value, but rather the density and characteristics of the fibers used do.
The statistical results of the experimental data showed that the coefficient of determination of the WTTF+BiPES+RPES mats is 0.945, WTTF+BiPES+HPES 0.964, and WTTF+BiPES+HPES+RPES 0.969. It indicates that the selected regression model is suitable for describing the data of the thermal conductivity WTTF-based thermal insulating mats. It can be stated that there is a significant relationship between the thermal conductivity and density. Data analysis allows us to assume that the variation in thermal conductivity depends on the density by ~95.9%, and on other factors that were not considered by ~4.1%.

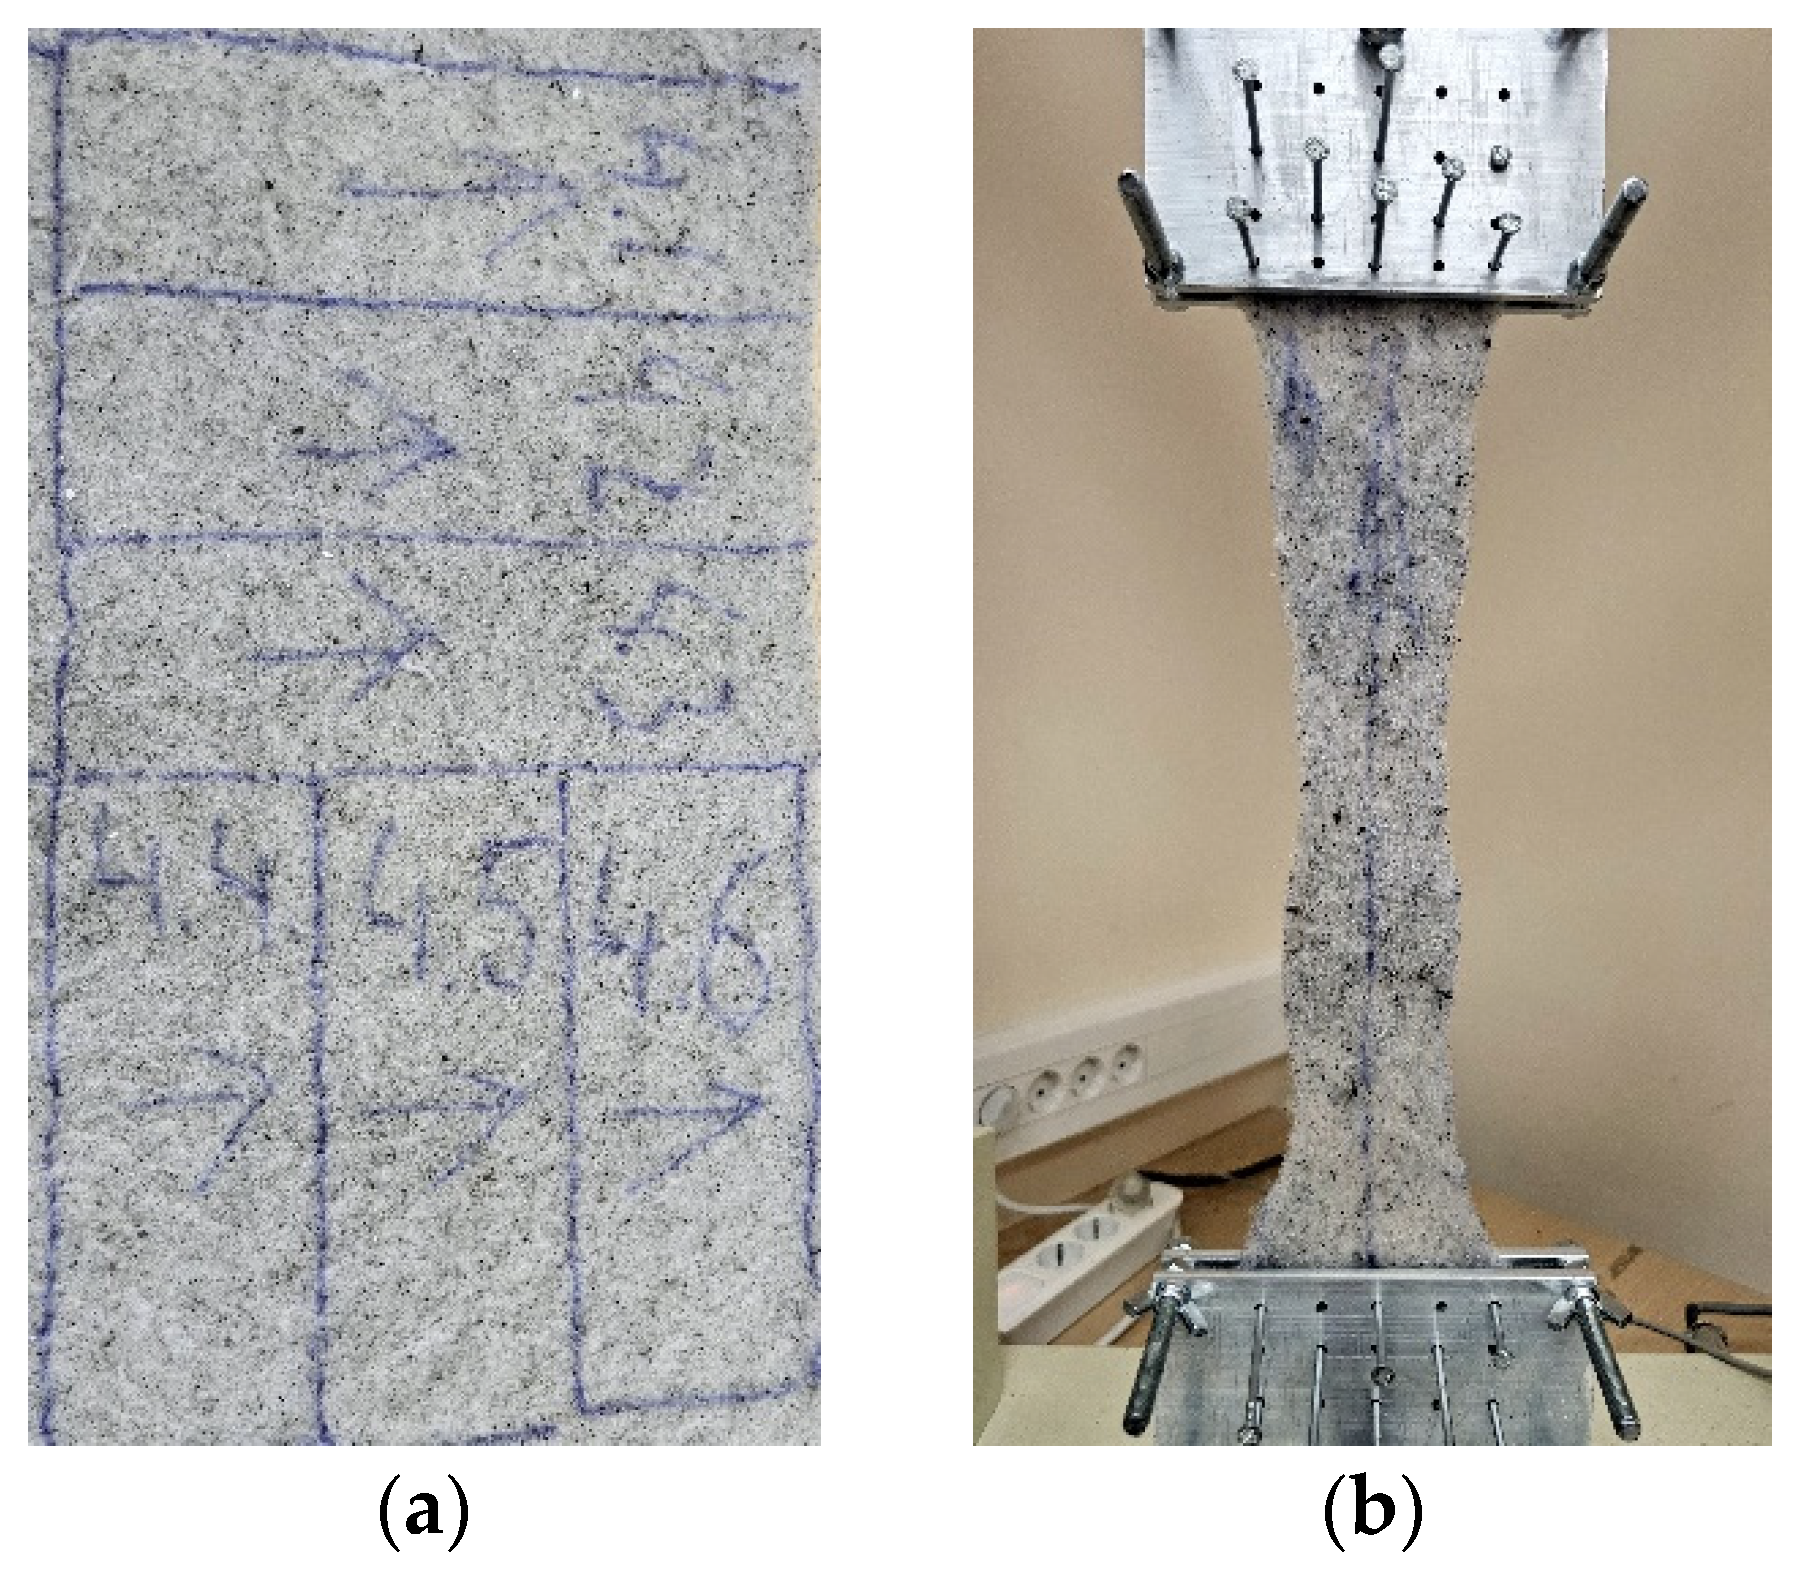
3.2.3. Tensile Strength Parallel to the Mat Surface

The tensile strength test for the WTTF-based thermal insulating mats was carried out along and across the mat formation direction to assess the heterogeneity of the properties. Figure 11a presents the results of the tensile strength test along the mats’ formation direction. The tensile strength of the WTTF+BiPES+RPES mats was 7.71 ± 0.390 kPa at a density of 44.9 ± 3.09 kg/m3, WTTF+BiPES+HPES mats 11.84 ± 1.89 kPa at a density of 44.5 ± 1.89 kg/m3, and WTTF+BiPES+RPES+HPES mats 7.62 ± 1.13 kPa at a density of 56.3 ± 2.15 kg/m3. Compared to WTTF+BiPES+HPES, the WTTF+BiPES+RPES composition has a 1.5-times-lower tensile strength at the same density, indicating that RPES fibers are stronger than HPES fibers. Additionally, Biswas et al. [42,43] noted that the fiber length exerts the greatest influence on the tensile strength. In their work, the authors increased the length of the natural fibers from 5 to 30 mm, and the tensile strength increased by more than fourfold. In the current study, the fiber length varied within vast limits from 10 to 64 mm. In addition, the heat treatment was not applied when preparing the mats, and only the felting process was used. Heat treatment is planned for future research.
The statistical analysis of the experimental data on the tensile strength along the direction of formation showed (Figure 11a) that there are no differences between the average values of the WTTF+BiPES+RPES and WTTF+BiPES+RPES+HPES mats. The F-criterion is 0.316, and p = 0.88 indicates a statistically insignificant difference in the test results. Accordingly, the determination coefficient R2 = 0.078 and the adjusted determination coefficient R2 = −0.24 were obtained. The average tensile strength of the discussed mats is 7.62 ± 1.13 kPa. The difference in the tensile strength results along the direction of formation between the WTTF-BiPES+RPES and WTTF+BiPES+RPES+HPES mats is ~38%, between WTTF+BiPES+RPES and WTTF+BiPES+HPES ~38%, and between WTTF+BiPES+HPES and WTTF+BiPES+RPES+HPES ~62%.
Figure 11b presents the results of tensile strength tests across the direction of formation: the average value of the WTTF+BiPES+RPES mats is 11.81 ± 0.409 kPa at a density of 45.4 ± 0.275 kg/m3, WTTF+BiPES+HPES mats 19.33 ± 3.83 kPa at a density of 45.4 ± 0.275 kg/m3, and WTTF+BiPES+RPES+HPES mats 7.35 ± 0.829 kPa at a density of 56.3 ± 1.81 kg/m3. The statistical analysis of the experimental data on the tensile strength across the direction of formation showed that the average values of all WTTF-based thermal insulating mats differ significantly. It could be caused by the needle punching process. A more random or evenly dispersed fiber arrangement in the cross direction may contribute to improved stress distribution and reduced deformation, thereby increasing the tensile strength. The F-criterion is 21.24, and p = 0.0019 indicates a statistically significant difference in the test results. Accordingly, the determination coefficient R2 = 0.88 and the adjusted determination coefficient R2 = 0.84 were obtained. The difference in tensile strength values between WTTF+BiPES+RPES and WTTF+BiPES+RPES+HPES is ~36%. The highest tensile strength along and across the direction of formation is observed in the WTTF+BiPES+HPES mats.

4. Conclusions

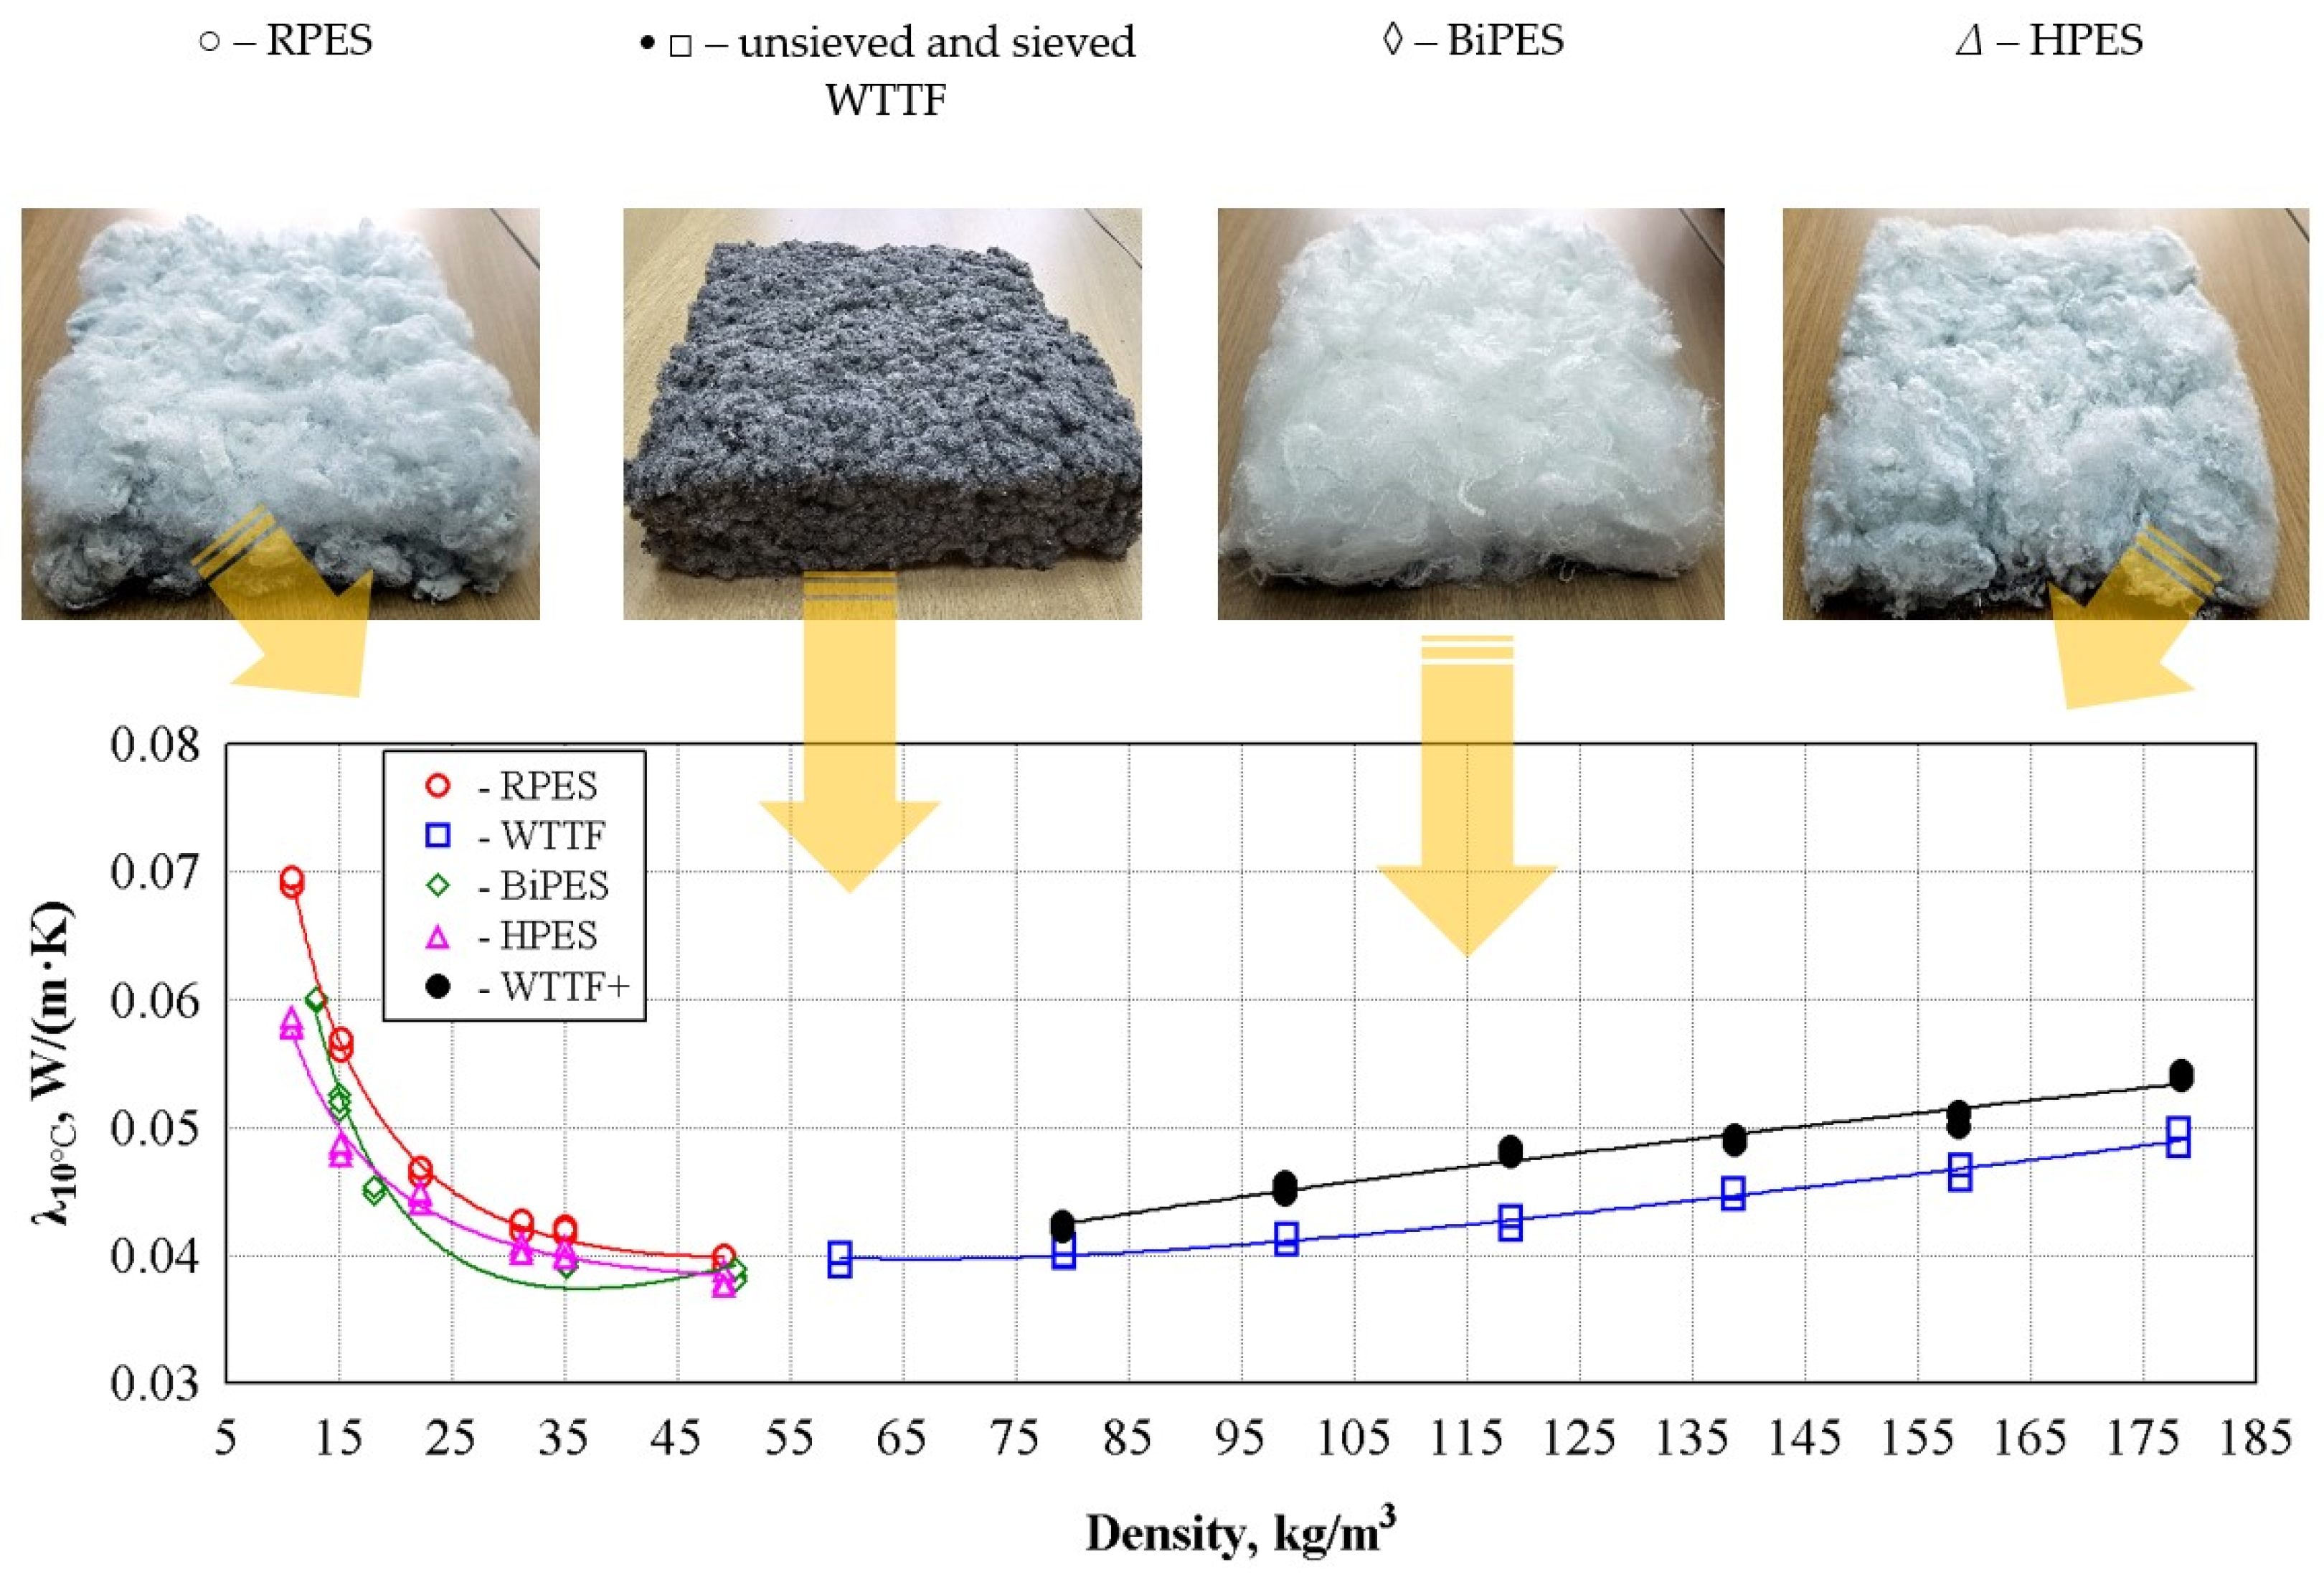
  • The thermal conductivity of HPES, BiPES, and RPES fibers decreases with a change in density from 10 kg/m3 to 50 kg/m3. This effect is determined by the denser fiber structure, which reduces the heat loss by radiation, and the heat loss through the solid framework of the material due to the fact that the increased contact areas between the fibers at a density of 50 kg/m3 does not yet have a decisive effect on the increase in the thermal conductivity. On the contrary, the thermal conductivity of WTTF increased from 0.0397 W/m∙K to 0.0493 W/m∙K with a change in density from 60 kg/m3 to 180 kg/m3. The increased heat loss determined this effect through the denser solid framework of the material due to the residue of rubber granules in the fiber. Rubber granules worsened the thermal conductivity from 6.9% to 19.5%.
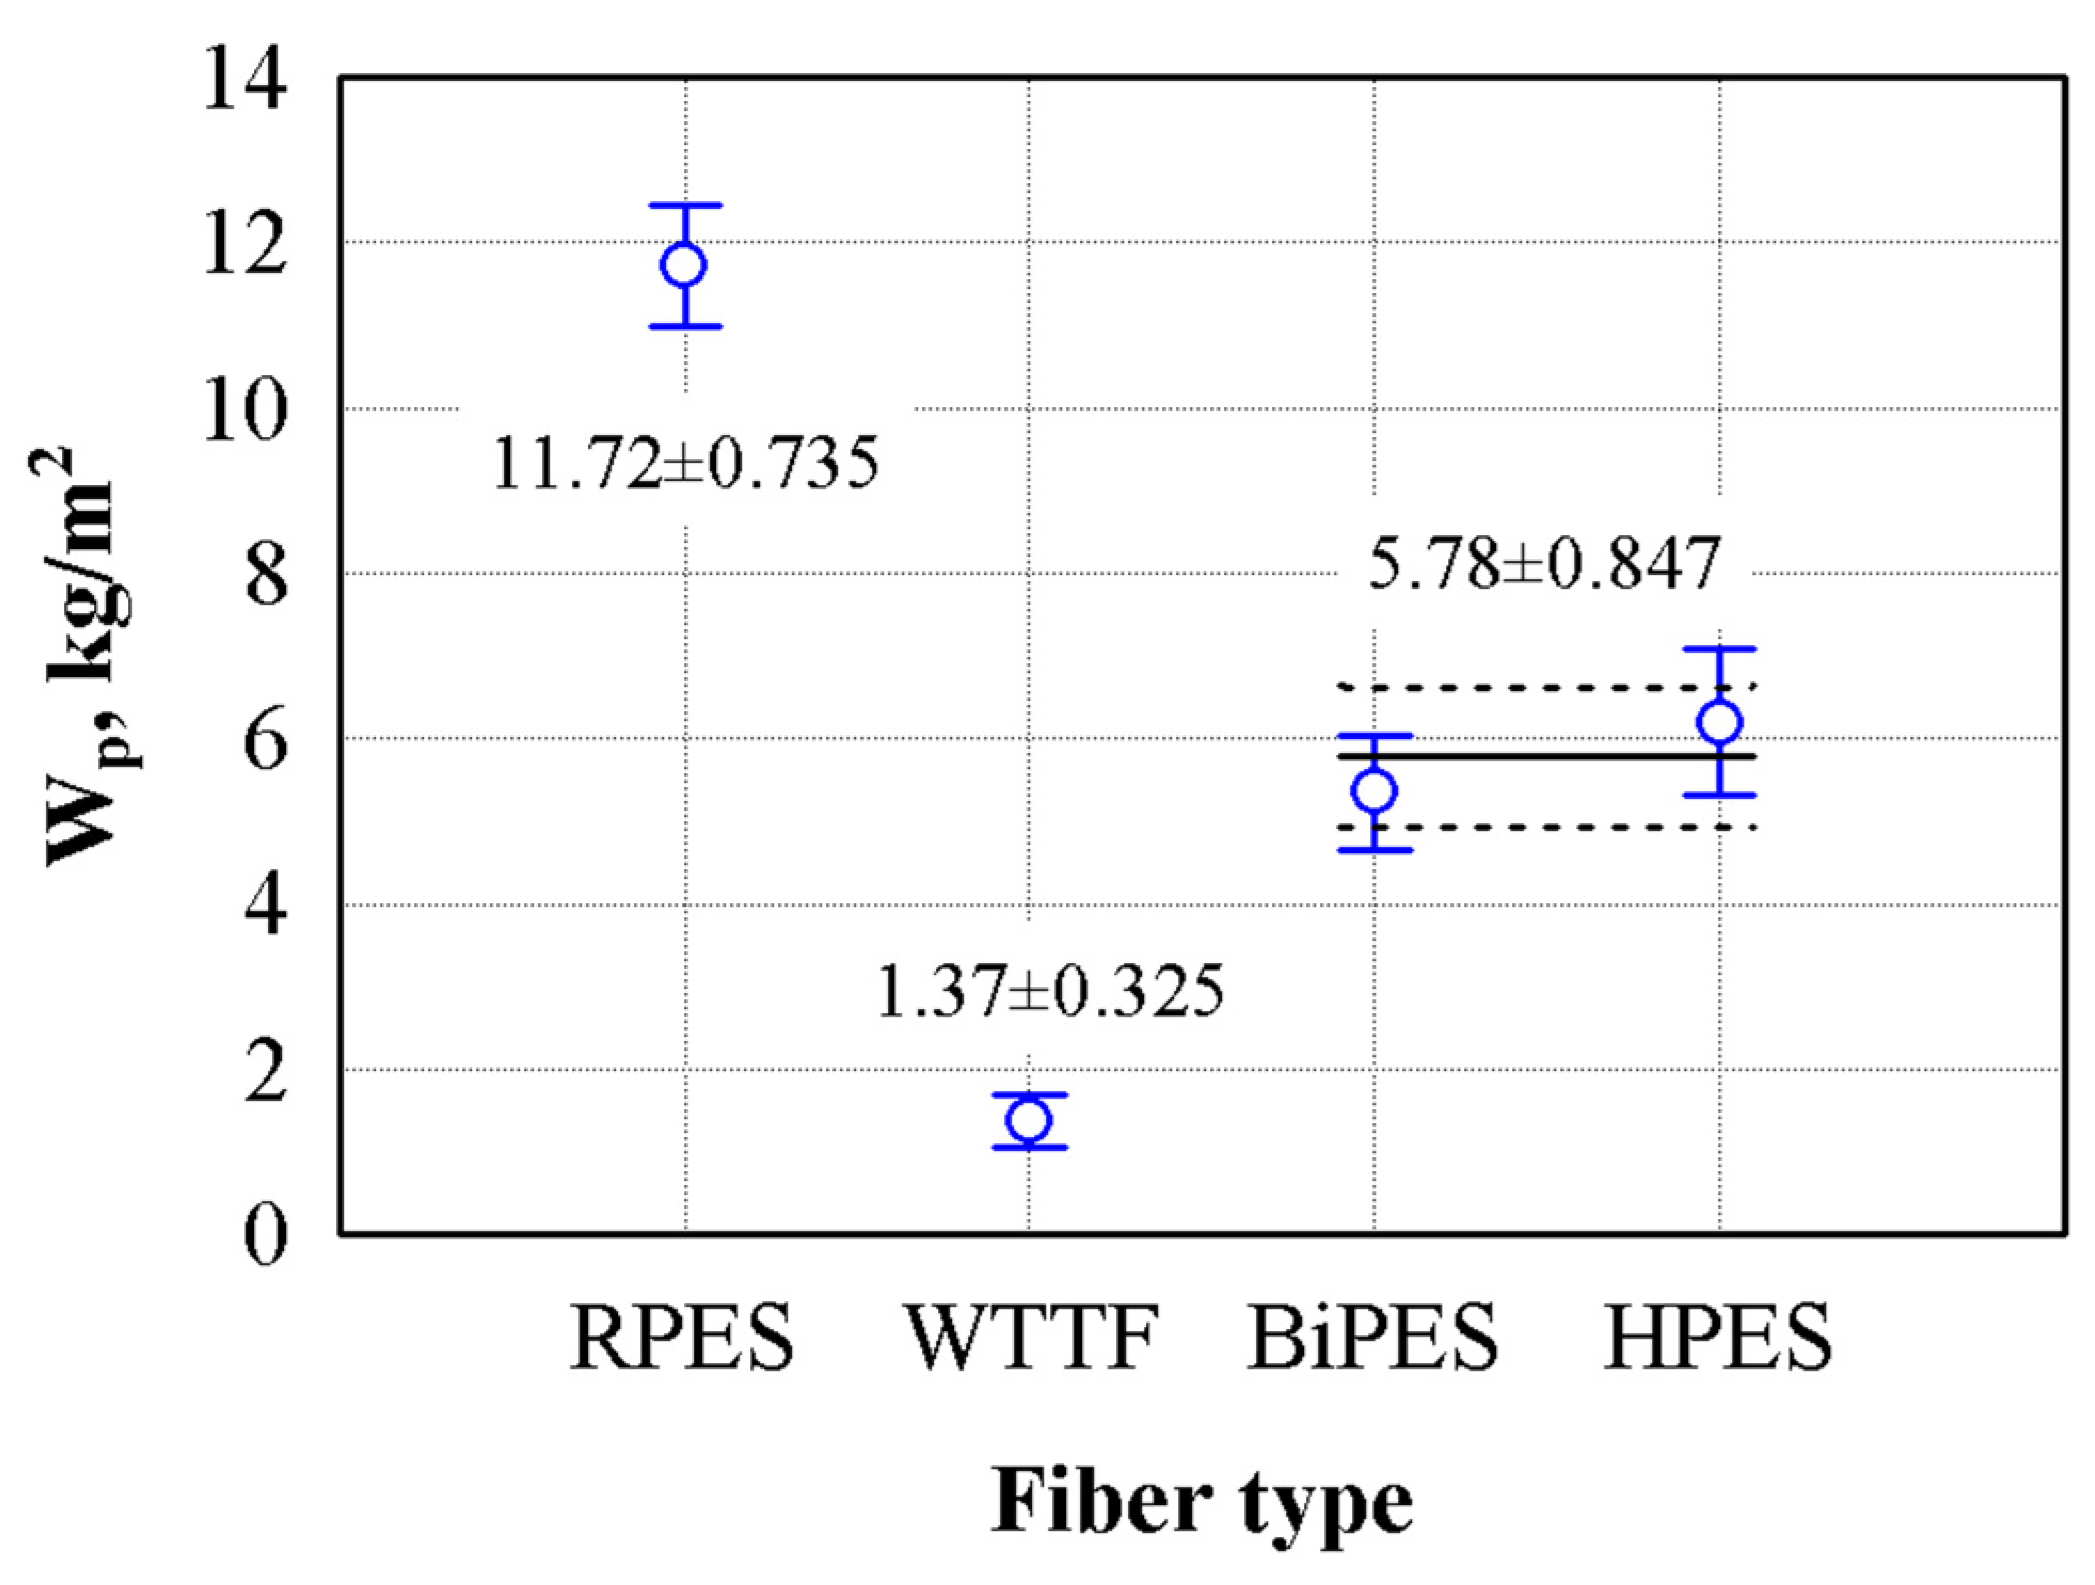
  • The short-term water absorption of fibers ranged from 11.7% to 1.37%. The highest short-term water absorption was observed in the RPES fibers and the lowest in WTTF. The difference between the short-term water absorption results of RPES and WTTF was ~88%. The highest water absorption could be because the smallest voids formed between the fibers of the longest (64 mm) RPES and HPES fibers, which led to a more difficult water removal process during the drainage process of the samples.
  • The thermal conductivity of WTTF+BiPES+RPES mats varied from 0.0409 W/(m·K) to 0.0351 W/(m·K) at densities from ~31.2 kg/m3 to ~93.3 kg/m3, the thermal conductivity of WTTF+BiPES+HPES mats varied from 0.0379 W/(m·K) to 0.0341 W/(m·K) at densities from ~27.7 kg/m3 to ~83.0 kg/m3, and the thermal conductivity of WTTF+BiPES+RPES+HPES mats varied from 0.0364 W/(m·K) to 0.0339 W/(m·K) at densities from ~32.1 kg/m3 to ~95.9 kg/m3. The most suitable compositions for producing WTTF-based thermal insulating mats are WTTF+BiPES+HPES and WTTF+BiPES+RPES+HPES since their thermal conductivity values are the lowest. This effect could be due to the HPES fibers in the composition, which creates additional air gaps in the fibers’ system, which leads to lower heat losses through the solid skeleton of the material.
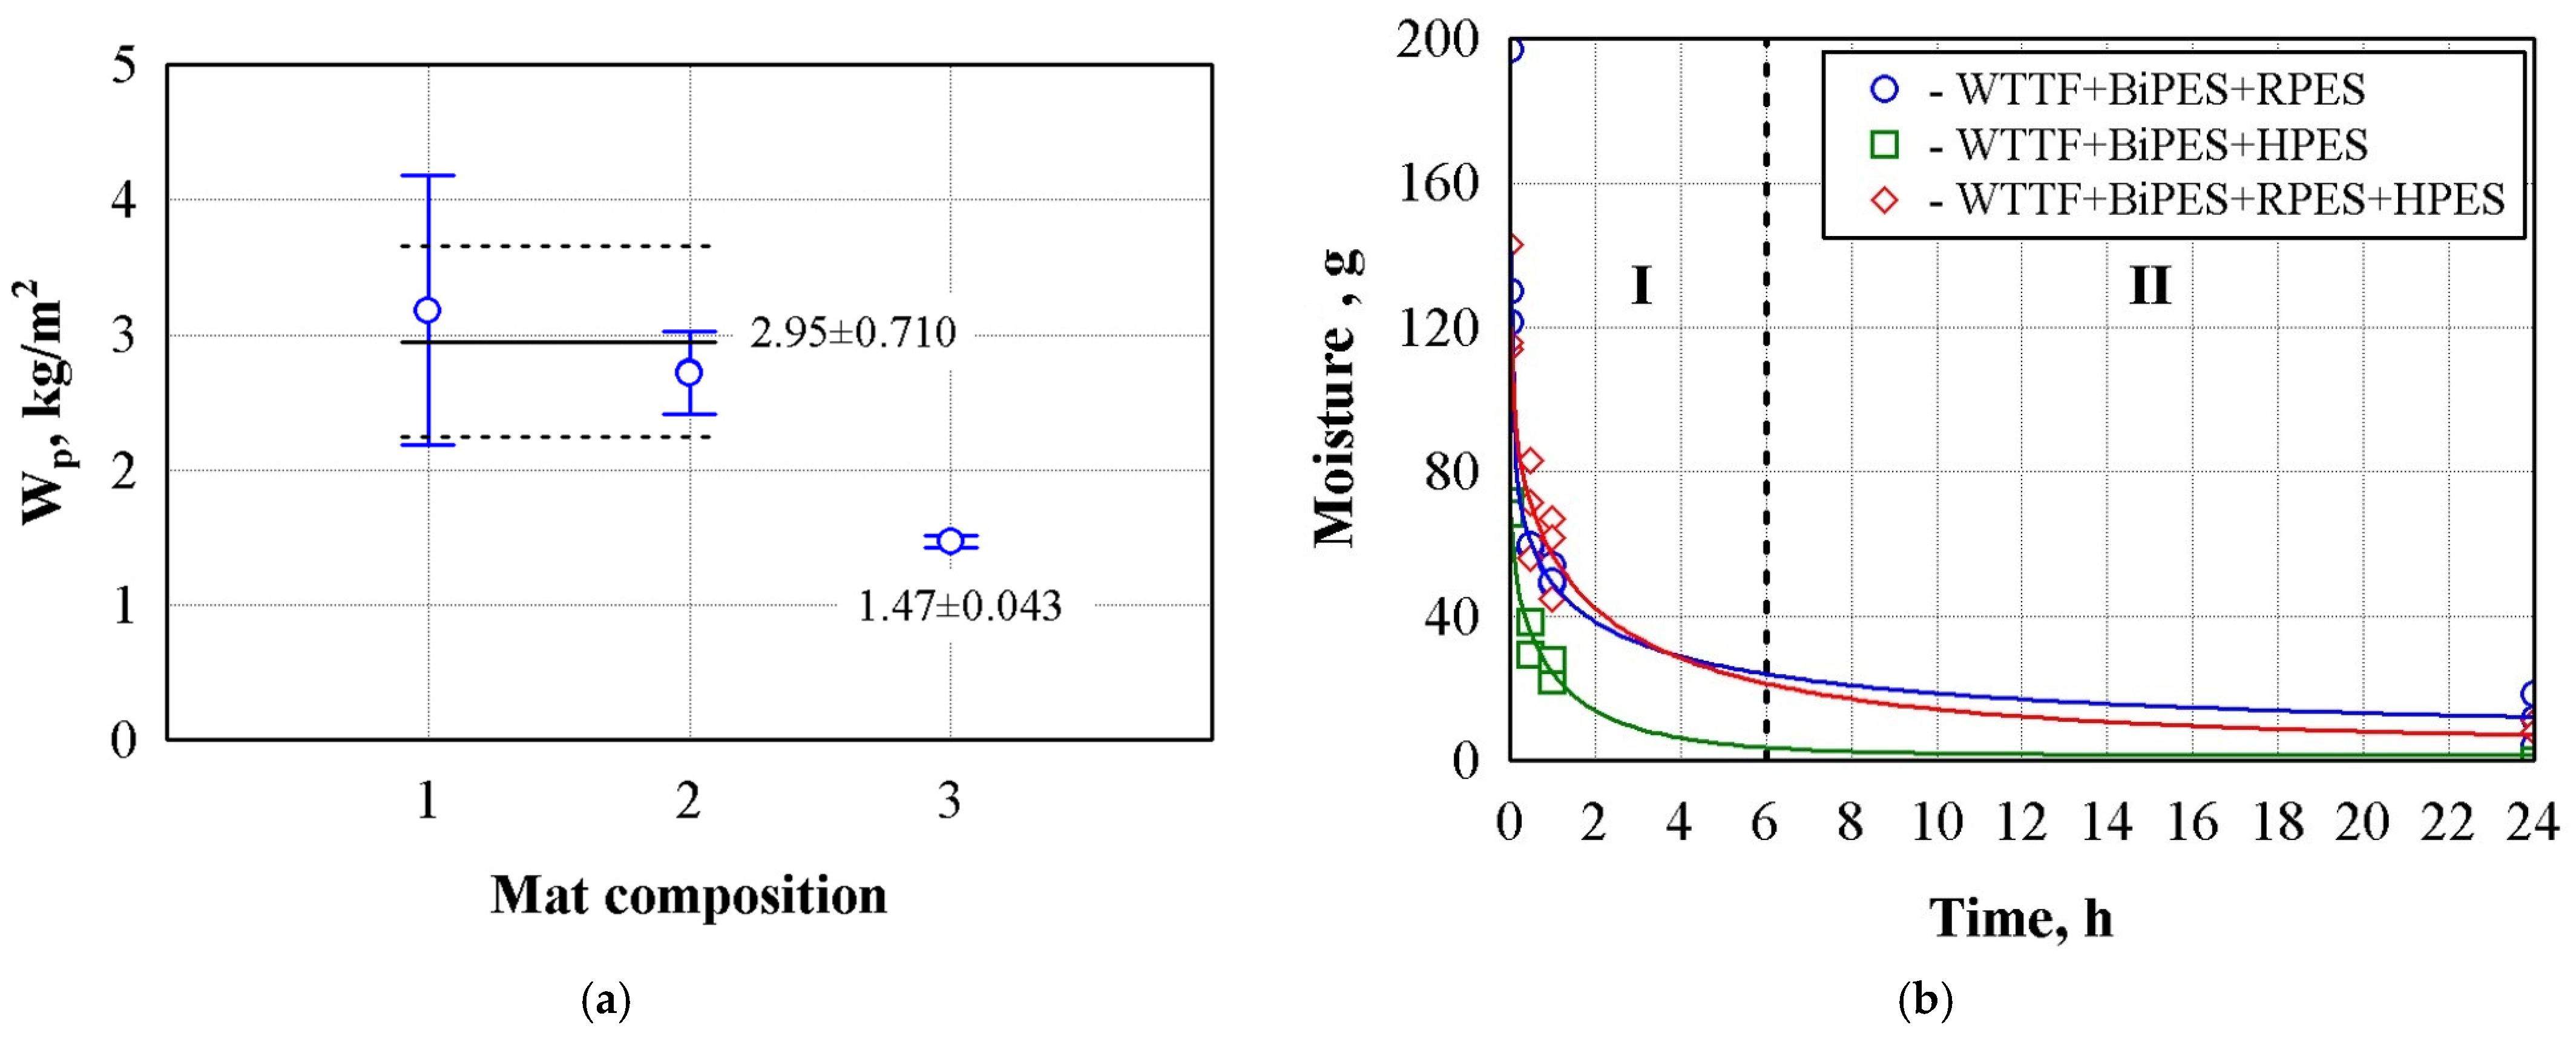
  • The short-term water absorption of the WTTF+BiPES+RPES mats was 3.18 ± 1.00 kg/m2, WTTF+BiPES+HPES 2.72 ± 0.304 kg/m2, and WTTF+BiPES+RPES+HPES 1.47 ± 0.043 kg/m2. The highest water absorption of WTTF+BiPES+RPES is attributed to the share of RPES fibers in the composition. The aforementioned fibers absorbed the most due to the geometric properties of the fibers. The lowest water absorption was observed in the WTF+BiPES+RPES+HPES mats. The effect was determined by the geometric properties of the fibers forming the mat and the removal part of the RPES and HPES fibers from the mat composition.
  • After 24 h of drying, the moisture reduction in the WTTF+BiPES+RPES mats was ~92%, WTTF+BiPES+HPES mats ~95%, and WTTF+BiPES+RPES+HPES mats ~100%. The drying kinetics can be distinguished into two stages. During the first stage (first 6 h), the most intensive moisture removal occurs, and, during the second stage (the remaining 18 h), the remaining moisture is removed from the samples.
  • The tensile strength values along the forming direction varied from 7.53 ± 1.74 kPa to 11.84 ± 1.89 kPa and across the forming direction from 7.35 ± 0.829 kPa to 19.33 ± 3.83 kPa. In both directions, the lowest tensile strength was obtained for WTTF+BiPES+RPES+HPES mats and the highest one for WTTF+BiPES+HPES mats. HPES fibers with a smoother surface adhere worse to WTTF, but entangle well with RPES fibers. The synergy of WTTF, BIPES, RPES, and HPES fibers determines the optimal composition for felting the mat and allows us to achieve the highest tensile strength result.
  • This research is practically significant because it demonstrates that WTTF can be used to produce insulating materials through non-woven technology. The obtained thermal conductivity values are comparable to those of conventional insulating materials, and the measured mechanical properties meet the requirements for insulating mats.

Author Contributions

G.B.: writing—original draft, visualization, validation, resources, methodology, investigation, and conceptualization. S.V. (Sigitas Vėjelis): writing—original draft, visualization, validation, methodology, investigation, and conceptualization. S.V. (Saulius Vaitkus): writing—review and editing, visualization, validation, formal analysis, data curation, and investigation. J.Š.-J.: writing—review and editing, visualization, validation, resources, and investigation. A.K. (Arūnas Kremensas): writing—review and editing, visualization, validation, resources, and investigation. A.K. (Agnė Kairytė): writing—original draft, visualization, validation, resources, methodology, investigation, and conceptualization. All authors have read and agreed to the published version of the manuscript.

Funding

This research was conducted as part of the execution of Project “Mission-driven Implementation of Science and Innovation Programs” (No. 02-002-P-0001), funded by the Economic Revitalization and Resilience Enhancement Plan “New Generation Lithuania”.

Institutional Review Board Statement

Not applicable.

Informed Consent Statement

Not applicable.

Data Availability Statement

The original contributions presented in the study are included in the article; further inquiries can be directed to the corresponding author.

Conflicts of Interest

The authors declare no conflicts of interest.

References

  1. Mahapatra, T.K.; Satapathy, S.; Panda, S.K. Thermal and acoustic properties evaluation of waste tire and textile reinforced epoxy composites. Mater. Today 2022, 62, 5982–5986. [Google Scholar] [CrossRef]
  2. Fazli, A.; Rodrigue, D. Sustainable Reuse of Waste Tire Textile Fibers (WTTF) as Reinforcements. Polymers 2022, 14, 3933. [Google Scholar] [CrossRef]
  3. Archibong, F.N.; Sanusi, O.M.; Médéric, P.; Hocine, N.A. An overview on the recycling of waste ground tyre rubbers in thermoplastic matrices: Effect of added fillers. Resour. Conserv. Recycl. 2021, 175, 105894. [Google Scholar] [CrossRef]
  4. Nadal, M.; Rovira, J.; Díaz-Ferrero, J.; Schuhmacher, M.; Domingo, J.L. Human exposure to environmental pollutants after a tire landfill fire in Spain: Health risks. Environ. Int. 2016, 97, 37–44. [Google Scholar] [CrossRef] [PubMed]
  5. Valdés-Vidal, G.; Calabi-Floody, A.; Duarte-Nass, C.; Mignolet, C.; Díaz, C. Development of a New Additive Based on Textile Fibers of End-of-Life Tires (ELT) for Sustainable Asphalt Mixtures with Improved Mechanical Properties. Polymers 2022, 14, 3250. [Google Scholar] [CrossRef]
  6. Xiao, Z.; Pramanik, A.; Basak, A.K.; Prakash, C.; Shankar, S. Material recovery and recycling of waste tyres—A review. Clean. Mater. 2022, 5, 100115. [Google Scholar] [CrossRef]
  7. Landi, D.; Vitali, S.; Germani, M. Environmental Analysis of Different End of Life Scenarios of Tires Textile Fibers. Procedia CIRP 2016, 48, 508–513. [Google Scholar] [CrossRef]
  8. Marconi, M.; Landi, D.; Meo, I.; Germani, M. Reuse of Tires Textile Fibers in Plastic Compounds: Is this Scenario Environmentally Sustainable? Procedia CIRP 2018, 69, 944–949. [Google Scholar] [CrossRef]
  9. Jimenez-Espadafor, F.J.; Villanueva, J.A.B.; García, M.T.; Trujillo, E.C.; Blanco, A.M. Optimal design of acoustic material from tire fluff. Mater. Des. 2011, 32, 3608–3616. [Google Scholar] [CrossRef]
  10. Landi, D.; Gigli, S.; Germani, M.; Marconi, M. Investigating the feasibility of a reuse scenario for textile fibres recovered from end-of-life tyres. Waste Manag. 2018, 75, 187–204. [Google Scholar] [CrossRef]
  11. Thai, Q.B.; Le-Cao, K.; Nguyen, P.T.; Le, P.K.; Phan-Thien, N.; Duong, H.M. Fabrication and optimization of multifunctional nanoporous aerogels using recycled textile fibers from car tire wastes for oil-spill cleaning, heat-insulating and sound absorbing applications. Colloids Surf. A Physicochem. Eng. Asp. 2021, 628, 127363. [Google Scholar] [CrossRef]
  12. Grubor, M.; Štirmer, N.; Jelčić Rukavina, M.; Baričević, A. Effect of Recycled Tire Polymer Fibers on Autogenous Deformation of Self-Compacting Concrete. RILEM Tech. Lett. 2020, 5, 33–40. [Google Scholar] [CrossRef]
  13. Valipour, M.; Shourijeh, P.T.; Mohammadinia, A. Application of recycled tire polymer fibers and glass fibers for clay reinforcement. Transp. Geotech. 2021, 27, 100474. [Google Scholar] [CrossRef]
  14. Abbaspour, M.; Narani, S.S.; Aflaki, E.; Nejad, F.M. Dynamic characteristics of a sandy subgrade reinforced by waste tire textile fibres. Int. J. Pavement Eng. 2020, 23, 2293–2308. [Google Scholar] [CrossRef]
  15. Khongova, I.; Chromkova, I.; Prachar, V. Reuse of waste tire textile fibers from tires in plaster mixtures. IOP Conference Series: Materials Science and Engineering, Volume 1205, International Conference Building Materials, Products and Technologies (ICBMPT 2021) 29th September—1st October 2021, Telc, Czech Republic. IOP Conf. Ser. Mater. Sci. Eng. 2021, 1205, 012017. [Google Scholar]
  16. Narani, S.S.; Abbaspour, M.; Mir Mohammad Hosseini, S.M.; Aflaki, E.; Moghadas Nejad, F. Sustainable reuse of Waste Tire Textile Fibers (WTTFs) as reinforcement materials for expansive soils: With a special focus on landfill liners/covers. J. Clean. Prod. 2020, 247, 119151. [Google Scholar] [CrossRef]
  17. Bocci, E.; Prosperi, E. Recycling of reclaimed fibers from end-of-life tires in hot mix asphalt. J. Traffic Transp. Eng. (Engl. Ed.) 2020, 7, 678–687. [Google Scholar] [CrossRef]
  18. Malaiškienė, J.; Nagrockienė, D.; Skripkiūnas, G. Possibilities to use textile cord waste from used tires for concrete. J. Environ. Eng. Landsc. Manag. 2015, 23, 183–191. [Google Scholar] [CrossRef]
  19. Ružickij, R.; Romagnoli, F.; Grubliauskas, R. Waste Tyre Textile Fibre Composite Material: Acoustic Performance and Life Cycle Assessment. Sustainability 2024, 16, 6281. [Google Scholar] [CrossRef]
  20. Maderuelo-Sanz, R.; Nadal-Gisbert, A.V.; Crespo-Amorós, J.E.; Parres-García, F. A novel sound absorber with recycled fibers coming from end of life tires (ELTs). Appl. Acoust. 2012, 73, 402–408. [Google Scholar] [CrossRef]
  21. Van de Lindt, J.W.; Carraro, J.A.H.; Heyliger, P.R.; Choi, C. Application and feasibility of coal fly ash and scrap tire fiber as wood wall insulation supplements in residential buildings. Resour. Conserv. Recycl. 2008, 52, 1235–1240. [Google Scholar] [CrossRef]
  22. Robert, R. Acoustic and Thermal Properties Evaluation and Analysis of Recycled Tyre Textile Fibre Waste. Master’s Thesis, Vilniaus Gedimino Technikos Universitetas, Vilnius, Lithuania, 2020; 87p. [Google Scholar]
  23. Qin, C.; Zhao, Z.; Piao, X.; Wang, Z.; Jin, C. Facile preparation of bamboo with improved hydrophobicity, dimensional stability and mold resistance by paraffin/tung oil modification. J. Mater. Res. Technol. 2024, 33, 8132–8141. [Google Scholar] [CrossRef]
  24. EN 12667; Thermal Performance of Building Materials and Products—Determination of Thermal Resistance by Means of Guarded Hot Plate and Heat Flow Meter. European Standard: Plzen, Czech Republic, 2001.
  25. ISO 29765:2008; Specifies the Equipment and Procedures for Determining the Tensile Strength of a Product Perpendicular to Its Faces. ISO: Geneva, Switzerland, 2008.
  26. ISO 29767:2008; Specifies the Equipment and Procedures for Determining the Short-Term Water Absorption of Specimens by Partial Immersion. ISO: Geneva, Switzerland, 2008.
  27. Data Science Textbook. 2020. Available online: https://docs.tibco.com/data-science/textbook (accessed on 12 January 2025).
  28. Berge, A.; Johansson, P. Literature Review of High Performance Thermal Insulation; Chalmers University of Technology: Gothenburg, Sweden, 2012. [Google Scholar]
  29. Ng, L.F.; Yahya, M.Y.; Muthukumar, C.; Parameswaranpillai, J.; Ma, Q.; Muhammad Asyraf, M.R.; Abdul Majid, R. Mechanical Characterization, Water Absorption, and Thickness Swelling of Lightweight Pineapple Leaf/Ramie Fabric-Reinforced Polypropylene Hybrid Composites. Polymers 2024, 16, 1847. [Google Scholar] [CrossRef]
  30. Sabir, T. 2—Fibers used for high-performance apparel. In High-Performance Apparel; McLoughlin, J., Sabir, T., Eds.; Woodhead Publishing Series in Textiles; Woodhead Publishing: Sawston, UK, 2018; pp. 7–32. [Google Scholar] [CrossRef]
  31. Van de Velde, P.; Protière, S.; Duprat, C. Dynamics of drop absorption by a swelling fiber. Soft Matter. 2021, 17, 6168–6175. [Google Scholar] [CrossRef]
  32. Zaman, M.W.; Han, J.; Zhang, X. Evaluating wettability of geotextiles with contact angles. Geotext. Geomembr. 2022, 50, 825–833. [Google Scholar] [CrossRef]
  33. JA, M.H.; Majid, M.S.A.; Afendi, M.; Marzuki, H.F.A.; Hilmi, E.A.; Fahmi, I.; Gibson, A.G. Effects of water absorption on Napier grass fibre/polyester composites. Compos. Struct. 2016, 144, 138–146. [Google Scholar] [CrossRef]
  34. Kumari, Y.R.; Ramanaiah, K.; Prasad, A.R.; Reddy, K.H.; Sanaka, S.P.; Prudhvi, A.K. Experimental investigation of water absorption behaviour of sisal fiber reinforced polyester and sisal fiber reinforced poly lactic acid composites. Mater. Today 2021, 44 Pt 1, 935–940. [Google Scholar] [CrossRef]
  35. Schaefer, K. Re: What is the Difference in Water-Absorption of Polyester and PP Geofabrics? 2015. Available online: https://www.researchgate.net/post/What-is-the-difference-in-water-absorption-of-Polyester-and-PP-geofabrics/562b893d5e9d97d9058b4589/citation/download (accessed on 25 October 2024).
  36. Kosiński, P. Moisture Transport in Loose Fibrous Insulations under Steady-State Boundary Conditions. Materials 2023, 16, 7656. [Google Scholar] [CrossRef]
  37. Antlauf, M.; Boulanger, N.; Berglund, N.; Oksman, K.; Andersson, O. Thermal Conductivity of Cellulose Fibers in Different Size Scales and Densities. Biomacromolecules 2021, 22, 3800–3809. [Google Scholar] [CrossRef]
  38. Hamrouni, I.; Jalili, H.; Ouahbi, T.; Taibi, S.; Jamei, M.; Mabrouk, A. Thermal properties of a raw earth-flax fibers building material. Constr. Build. Mater. 2024, 423, 135828. [Google Scholar] [CrossRef]
  39. Sajid, L.; Azmami, O.; Ahmadi, Z.; Benayada, A.; Majid, S.; Gmouh, S. Introduction of raw palm fibers in the textile industry by development of nonwoven composite materials based on Washingtonia palm fibers. J. Text. Inst. 2021, 112, 1717–1729. [Google Scholar] [CrossRef]
  40. Abdou, A.; Budaiwi, I. The variation of thermal conductivity of fibrous insulation materials under different levels of moisture content. Constr. Build. Mater. 2013, 43, 533–544. [Google Scholar] [CrossRef]
  41. Stapulionienė, R. Development and Investigation of Thermal Insulating Composite from Fibrous Plants. Ph.D. Thesis, Vilnius Gediminas Technical University, Vilnius, Lithuania, 2016. [Google Scholar]
  42. Biswas, S.; Kindo, S.; Patnaik, A. Effect of fiber length on mechanical behavior of coir fiber reinforced epoxy composites. Fiber Polym. 2011, 12, 73–78. [Google Scholar] [CrossRef]
  43. Wu, Y.; Wu, Y.; Wu, Y. Research on a New Plant Fiber Concrete-Light Steel Keel Wall Panel. Sustainability 2023, 15, 8109. [Google Scholar] [CrossRef]
Figure 1. Production process of WTTF-based sustainable thermal insulating mat: (a) shredder; (b) pulled out fibers; (c) fibers in the volumetric feeder; (d) primary thin web; (e) secondary web fed to the felting unit; (f) doubling of web; and (g) prepared mat.
Sustainability 17 04288 g001
Figure 2. Tensile strength determination of WTTF-based thermal insulating mat: (a) directions of the specimen; and (b) tensile strength test setup.
Sustainability 17 04288 g002
Figure 3. Macrostructure of: (a) WTTF raw material; (b) sieved WTTF; and (c) residues of rubber granules.
Sustainability 17 04288 g003
Figure 4. Macrostructure of binding fibers: (a) RPES; (b) BiPES; and (c) HPES.
Sustainability 17 04288 g004
Figure 5. Microstructure of fibers: (a) RPES; (b) WTTF; (c) BiPES; and (d) HPES.
Sustainability 17 04288 g005
Figure 6. Thermal conductivity of raw materials: □—sieved WTTF, ●—unsieved WTTF, ∆—HPES, ○—RPES, and ◊—BiPES.
Sustainability 17 04288 g006
Figure 7. Short-term water absorption of raw fibers.
Sustainability 17 04288 g007
Figure 8. Water contact angles of raw fibers: (a) average results for all raw fibers; and (be) optical images of water droplets on RPES, WTTF, BiPES, and HPES, respectively.
Sustainability 17 04288 g008
Figure 9. Results obtained during and after short-term water absorption test: (a) short-term water absorption; and (b) drying kinetics after short-term water absorption test: 1—WTTF+BiPES+RPES, 2—WTTF+BiPES+HPES; and 3—WTTF+BiPES+RPES+HPES.
Sustainability 17 04288 g009
Figure 10. Thermal conductivity dependence on the density of WTFF-based thermal insulating mats.
Sustainability 17 04288 g010
Figure 11. Tensile strength of WTTF-based thermal insulating mats: (a) along to the forming direction; and (b) across to the forming direction: 1—WTTF+BiPES+RPES, 2—WTTF+BiPES+HPES, and 3—WTTF+BiPES+RPES+HPES.
Sustainability 17 04288 g011
Table 1. Compositions of WTTF-based thermal insulating mats.
CompositionWTTF, wt.%BiPES, wt.%RPES, wt.%HPES, wt.%
1WTTF+BiPES+RPES8010100
2WTTF+BiPES+HPES8010010
3WTTF+BiPES+RPES+HPES801055
Table 2. Statistical results of thermal conductivity of fibrous raw materials.
Number of SpecimensStatistical Characteristics
b 0 b 1 b 2 RR2Adjusted R2 S r Fp
λ 10 = b 0 + b 1 · ρ + b 2 ρ ,(1)
18RPES
0.019020.0002090.520070.9990.9980.9970.0005462033.20
21sieved WTTF
0.022160.0001300.582120.9890.9780.9740.000535246.40
18unsieved WTTF
0.0403740.0000850−0.363420.9850.9710.9650.000706155.30
15BiPES
0.0006040.0005040.670750.9860.9730.9650.00150131.30
18HPES
0.028400.00007800.306060.9930.9860.9830.000866337.00
Note: λ 10   ° C the average value of thermal conductivity at 10 °C, W/(m·K); ρ density of raw materials, kg/m3; b0, b1, and b2—the constants obtained from the test results using the least squares method.
Table 3. Statistical results of drying kinetics after short-term water absorption test.
Number of SpecimensStatistical Characteristics
b 0 b 1 b 2 b 3 RR2Adjusted R2 S r Fp
M o i s t u r e * = b 0 · 1 b 1 · e x p b 2 · t b 3 (2)
12WTTF+BiPES+RPES (Composition 1)
6.261150−22.81841.203960.3081170.9470.8960.83721.115.080
12WTTF+BiPES+HPES (Composition 2)
1.398792−48.67271.0914950.6406840.9950.9890.9833.22157.30
12WTTF+BiPES+HPES+RPES (Composition 3)
4.454245−26.80980.8218570.4844000.9720.9460.91512.330.70
Note: m o i s t u r e * m o i s t u r e   r e m a i n i n g   i n   t h e   s a m p l e , g r a m s ;   t time, hour.
Table 4. Statistical results of thermal conductivity of WTTF-based thermal insulating mats.
Number of SpecimensStatistical Characteristics
b 0 b 1 b 2 RR2Adjusted R2 S r Fp
λ 10   ° C = b 0 + b 1 · ρ + b 2 ρ   (3)
21WTTF+BiPES+RPES (Composition 1)
0.023720.00006800.470240.9720.9450.9350.00054196.90
21WTTF+BiPES+HPES (Composition 2)
0.025620.00005500.289170.9820.9640.9580.000203151.60
21WTTF+BiPES+HPES+RPES (Composition 3)
0.026310.0000530.280850.9840.9690.9630.000267176.10
Note: λ 10 ° C the average value of thermal conductivity at 10 °C, W/(mK) ρ d e n s i t y , k g / m 3 ; and b 0 , b 1 , b 2 t h e   c o n s t a n t s   o b t a i n e d   f r o m   t h e   t e s t   r e s u l t s   u s i n g   t h e   l e a s t   s q u a r e s   m e t h o d .
Disclaimer/Publisher’s Note: The statements, opinions and data contained in all publications are solely those of the individual author(s) and contributor(s) and not of MDPI and/or the editor(s). MDPI and/or the editor(s) disclaim responsibility for any injury to people or property resulting from any ideas, methods, instructions or products referred to in the content.

