Abstract
The conventional solar still (CSS) unit faces challenges such as low productivity (Pd) and thermal efficiency (ηth) due to the limited temperature difference between the hot water and the cold interior glass cover surfaces (ΔTw-gi). This study addresses these issues by introducing enhancements in the CSS unit, incorporating a v-corrugated-type basin, internal reflecting mirror, flat-plate solar collector (FPSC) still, and FPSC nanofluids. A v-corrugated-type basin, internal reflecting mirror, FPSC still, and FPSC nanofluids elicited a significant improvement in the distillate productivity (Pd) up to approximately 22.39%, 41.72%, 70.10%, and 104.13% compared to the CSS unit. This increase in the Pd is attributed mainly to a notable raise in the ΔTw-gi, showing increments of around 34.33%, 52.32%, 77.37%, and 112.87% compared to the CSS unit. Moreover, a v-corrugated basin, internal reflecting mirror, FPSC still, and FPSC nanofluids substantially increased the average daily thermal efficiency (ηth), around 22.01%, 26.71%, 39.57%, and 56.21%, respectively. The results confirmed that integrating the v-corrugated basin, internal reflecting mirror, FPSC still, and FPSC nanofluids within a combined seawater distillation system can significantly enhance the performance of the CSS unit. These different combinations effectively raised the basin water temperature (Tw) and ΔTw-gi, consequently improving the overall performance of the solar still unit.
1. Introduction
Solar still (SS) is a thermal desalination unit driven by a temperature difference between the two hot water and cold interior glass cover surfaces (ΔTw-gi) [1]. Utilizing water desalination through solar collectors can aid in mitigating the spread of diseases such as COVID-19 by providing a more reliable and clean water source, reducing reliance on potentially contaminated water supplies [2]. The evaporation and condensation were gathered in an integrated system [1], as shown in Figure 1. Comparing with other thermal desalination processes, such as humidification-dehumidification (HDH), vapor compression (VC), multi-stage flash (MSF), and multi-effect distillation (MED), the solar still (SS) is a more convenient water desalination system utilized at remote coastal regions owing to low operation and maintenance costs, low-operating temperatures, easy operation process, no need for skilled workers, and less energy use, where it depends only upon the incident solar radiation [2].
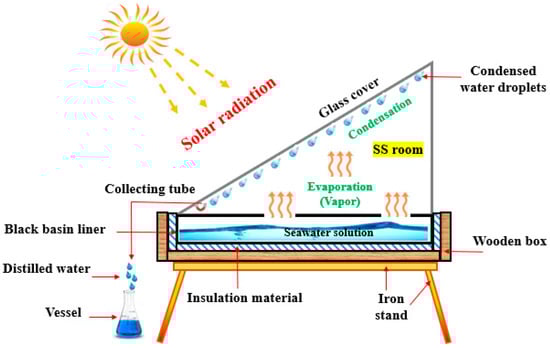
Figure 1.
Solar still.
The increasing or decreasing ΔTw-gi deeply affects the solar still distillate productivity (Pd) [3], whereas, the increase in the ΔTw-gi helps in upgrading the still distillate productivity (Pd) and vice versa [4]. The single slope-type solar still is one of the most common solar desalination units [5]; however, low distillate productivity (Pd) ranging between 2 and 5 L/m2/day has been challenging [6]. To solve this issue, the water temperature (Tw) in the still basin at first and the ΔTw-gi should be augmented. This objective could be accomplished practically by linking a flat-plate solar thermal collector (FPSC) with a solar distillation unit in a system named FPSC still [7], fixing an internal reflecting mirror to the still glass cover [8], and replacing a flat-plate type still basin with a v-corrugated-type still basin [9].
Eltawil and Omara [10] stated that the FPSC still noticeably enhanced the still distillate productivity (Pd) by about 56% and 82% in the case of sprayed hot water (passive and active recirculation modes) and by 76% in the case of jet hot water (active recirculation mode). Also, Sheeba et al. [11] demonstrated that a combined active desalination system (FPSC still) outperformed the passive desalination system (solar still operating alone) in terms of the daily thermal efficiency (ηth) by around 20.4% and 23.6% for tap and saline water, respectively. Likewise, the distillate productivity (Pd) of the FPSC still was greater by 24% compared with the passive desalination system [12]. Similarly, Badran and Al-Tahaineh [13] and Badran [14] announced an around 36% enhancement in the distillate productivity (Pd) of the active system compared to the passive one.
As for a reflector, a work was proceeded by Tanaka [15]; during the winter season, a noticeable improvement in the still distillate productivity (Pd) from 70% to 100% resulted due to the positive influence of internal and external reflectors, respectively. Hiroshi and Yasuhito [16] investigated the impact of reflectors (internal and external) on the single slope solar still productivity (Pd). The obtained outcomes showed the positive effect of reflectors in enhancing the overall still distillate productivity (Pd), by around 21%. The authors also recommended the inclination of a single slope solar still and reflector for fulfilling better performance throughout the year. As described by Omara et al. [17], a comparative investigation was carried out between the stepped solar still unit and the conventional one. The results demonstrated that the stepped still unit remarkably outperforms the conventional one. The distillate productivity (Pd) of the stepped still with fixing top and bottom reflectors was upgraded by approximately 125% compared to the conventional still. Another comparative investigation by Omara et al. [18] demonstrated that a v-corrugated-type still basin with wick and internal reflecting mirrors achieved better productivity (Pd) than that of the conventional one by about 145.5%. Similarly, Al-Hayek and Badran [6] reported an increment of 20% in the productivity (Pd) of asymmetric greenhouse-type stills compared to the symmetric greenhouse-type still. Furthermore, Abdallah et al. [19] reported that the distillate productivity (Pd) for the modified single slope solar still with reflecting mirrors fixed on all interior sides was maximal at about 30% compared to the productivity (Pd) without mirrors.
A v-corrugated-type still basin promoted the solar still performance as a result of increasing the surface area of heat and mass transferring from the hot water surface to the cold interior glass cover surface. Omara et al. [9] compared the volume of the still distillate productivity (Pd) for three different kinds of absorber plate still basin, such as finned, corrugated, and flat shapes. The experimental results showed a remarkable improvement in productivity (Pd) in the case of finned and v-corrugated-type still basins in comparison with the flat-plate type still basin, reaching around 40% and 21%, respectively.
By using several kinds of nanofluids, the solar collector’s absorption efficiency can be enhanced [20]. In order to produce distilled water, experimental work was conducted to study the flat-plate and evacuated-tube collectors [21]. The physical characteristics of nanofluids and the yield of distilled water at various seawater flow rates were determined. In the presence of carbon nanotubes in paraffin wax and ethylene glycol nanofluids, the desalination unit’s performance was assessed. Ethylene glycol nanofluid at 80–100 °C increased the flat-plate collector’s evaporation efficiency by up to 36%.
The pressure drops and thermal efficiency of several nanofluids inside a flat-plate solar collector were computed. The thermal efficiency for Al2O3/water, however, was examined both experimentally and numerically [22]. Working fluids include CuO/water, Al2O3/water, Ti2O/water, and Si2O/water nanofluids, with vol. concentrations of 1, 2, and 3%, respectively. As the volume concentration of nanofluid rises, thermal efficiency does as well. For instance, 2% Al2O3/water has a thermal efficiency that is 5.3% higher and 29.75% more than 1% Al2O3/water and water. The thermal efficiencies of CuO and Al2O3 are 46% and 43.8%, respectively, assuming a uniform mass flow rate and 1% volume concertation.
Previous studies focused on specific enhancements or modifications individually, lacking a comprehensive approach that combines multiple innovations to maximize efficiency and productivity. Many studies did not extensively address the influence of varying environmental conditions on the performance of enhanced solar distillation systems, thereby limiting the broader applicability of their findings. A few studies conducted detailed comparative analyses between different enhancement methods or their combined effects to understand their synergistic impact comprehensively. The scalability and adaptability of enhancements across diverse geographical regions or varying water salinity levels were not extensively addressed in some studies, limiting their broader applicability [21,22,23].
The novelty of this study lies in its comprehensive approach that integrates multiple enhancements (v-corrugated basin, internal reflecting mirror, FPSC still, and FPSC nanofluids) into a single solar distillation system. This approach could potentially address various limitations observed in previous studies. The study offers a comparative evaluation of various enhancements in terms of their individual and combined impact on distillate productivity and thermal efficiency. This comparative analysis provides valuable insights into the synergistic effects of these enhancements. By emphasizing performance improvements in a combined seawater distillation system, this study aims to bridge the gap between theoretical advancements and practical application, potentially making it more relevant for real-world scenarios. The significant improvements reported in distillate productivity (Pd) and average daily thermal efficiency (ηth) due to these combined enhancements underscore the novelty of this study. This study potentially addresses environmental dependency concerns by assessing the performance enhancements under varying conditions, making the findings more robust and applicable in diverse settings.
2. Thermal Analysis
The following assumptions were used in the present analytical analysis [22]:
- The glass cover has the same area Ag as the water film Aw.
- The water film and the glass cover are gray surfaces.
- The water film is maintained at a constant temperature Tw.
- The glass cover is taken at a constant temperature Tgi.
- There is constant and equal specific heat C for feed, brine, and distillate.
- The sky can be considered as a black body.
- The glass cover is exposed only to the sky.
The energy flow and energy balance for the solar still unit are given by Equations (1) and (2) [23].
- Heat balance for the still basin (b)
- Heat balance for water in the basin (w)
- Heat balance for the glass cover (g) can be determined using Equation (3).
- The condensate rate is given by Equation (4) [23].
The rate of heat transfer through convection, denoted as qcw (W), within the solar still, specifically from the water surface to the interior surface of the glass cover, is described by Equation (5) [24].
where Tw and Tgi are water temperature and temperature of the glass interior surface (K), respectively. Meanwhile, hcw is the convective heat transfer coefficient in (Wm−2 K−1); it is given by Equation (6) [25].
where Pw and Pgi are the partial pressures in (Nm−2) for water vapor at water and the interior glass surface temperatures within the still, which are given by Equations (7) and (8) [26].
Rate of the evaporative heat transfer within the still from the water surface to the inner glass cover surface, which is denoted by qew in (W) units in Equation (3), can be determined using Equation (9).
where the evaporative heat transfer coefficient, hew in (Wm−2 K−1), is given by Equation (10) [23].
The rate of radiative heat transfer from the water surface to the interior surface of the glass cover, qrwb in (W) in Equation (3), is given by Equation (11).
where hrw is the radiative heat transfer coefficient in (Wm−2 K−1). It can be determined using Equation (12).
where εeff is the effective emissivity factor of diffuse radiation from the water surface to the interior surface of the glass cover and σ is the Stefan–Boltzmann constant taken as 56.7 × 10⁻⁹ Wm−2 K−4 [27]. If the shape factor is taken as the unity and the emissivity of the water is 0.90, the radiative heat transfer from the hot water surface to the interior surface of the glass cover can be determined using Equation (13).
Thus, the internal heat transfer within the still is governed by three modes: the heat exchange between condensing and evaporating surfaces, i.e., from water surface to interior surface of glass cover of the solar still, which is known as internal heat transfer. These modes are radiation, convection, and evaporation, and, hence, the total internal heat transfer coefficient (h1) from the water surface to the interior surface of the glass cover will be the sum of all these modes of heat transfer coefficients according to Tiwari and Tiwari [28], as given in Equation (14).
And the total value of the energy transfer q1 in (W) within the solar still from the water surface to the interior surface of the glass cover can be obtained using Equation (15).
The influence of relative magnitudes of these three modes can be better understood by evaluating the fraction of total energy, as performed by Cooper [29]. These convective (Fc), evaporative (Fe), and radiative (Fr) fractions can be determined using Equation (16) [30].
qbw in (W) in Equation (2) represents the rate of the convective heat transfer coefficient from the black basin liner (the hottest region in the still) to the water surface. The calculations were performed by applying Equation (17).
where Tbi is the inner basin temperature (K) and hbw is the convective heat transfer coefficient from the black basin liner to the water surface in (Wm−2 K−1).
The conductive heat transfer coefficient (Ug) through the thickness of the still glass cover (xg) could be formulated, as given in Equation (18).
where kg and xg are the thermal conductivity for the glass cover in (Wm−1 K−1) and the glass cover thickness in (m), respectively.
The rate of heat transfer from the exterior surface of the glass cover to the surroundings due to convection, qcga in (W) (caused by the wind), is given by Equation (19).
where Tgo, Tao, and hcga are the outer glass cover temperature, ambient air temperature, and convective heat transfer coefficient, respectively. The convective heat transfer coefficient (hcga) depends on the prevailing wind speed. It is given by Equation (20) [31].
where w is the wind speed in (m/s).
The rate of radiative heat transfer from the exterior surface of the glass cover to the sky can be determined using Equation (21).
where hrgs is the radiative heat transfer coefficient in (Wm−2 K−1); it is given by Equation (22)
where εeff is the effective emissivity factor of diffuse radiation from the exterior surface of the glass cover to the sky and σ is the Stefan–Boltzmann constant taken as 56.7 × 10⁻⁹ Wm−2 K−4. If the shape factor is taken as unity and the emissivity of the glass cover is 0.90, the radiative heat transfer from the exterior surface of the glass cover to the sky can be determined using Equation (23).
where Tsky is the sky temperature and, generally, the average sky temperature during the operating hours is given by Equation (24) [32].
The total external heat transfer coefficient (h2) is given by Equation (25).
The total value of the rate of energy transfer from the exterior surface of the glass cover to its surroundings q2 in (W) can be determined using Equation (26).
Hence, the overall heat transfer coefficient (Ut) through the top of the still can be calculated using Equation (27).
The rate of conductive heat losses qb in (W) from the basin bottom to the atmosphere can be formulated using Equation (28) [33,34].
where kin and Xin are the insulation thermal conductivity in (Wm−1 K−1) and the basin thickness in (m), respectively.
3. Materials and Methods
Experimental comparison of the conventional solar still (CSS) and modified solar still (MSS) performance for seawater desalination was implemented during August 2023 at a latitude of (30°35′00″ N 32°16′00″ E). The conventional solar still (CSS) is used in this work as a reference unit for a comparison with other modified solar still (MSS) units.
Each and every chemical element used in the experimental testing was of reagent grade. Commercial Al2O3 nanoparticles with a 99.99% purity rating and an average diameter of 45 nm were acquired from Sigma-Aldrich GmbH and placed in the base fluid. Aluminum oxide nanofluid was chosen because of its superior Brownian motion, thermal conductivity of higher effective, lower density, and ability to decrease sedimentation [35]. In order to disperse Al2O3 along the base fluid, distilled water, and to increase the stability of Al2O3/seawater nanofluid, sodium dodecyl benzene sulfonate was used as a natural surfactant [36]. Sodium dodecyl benzene sulfonate supplied the optimum stability level for the Al2O3-seawater nanofluid. The Al2O3 nanoparticles were dispersed in water using sonicator for 30 min in an ultrasonic bath at 3% (w/v). Model USC-1400 was used at 40 kHz of ultrasound frequency. The Malvern Panalytical pro blue unite (Malvern Instruments, Malvern, UK) was used to measure the zeta potential of particles in a liquid. Zeta potential is an electric potential that exists at the interface between a particle surface and the liquid medium in which it is dispersed. It is a key parameter in understanding and controlling the stability of colloidal dispersions. The Zetasizer primarily uses a technique known as electrophoretic light scattering (ELS). In this method, a laser beam was directed through a sample containing dispersed particles. The instrument applies an electric field to the sample, causing charged particles to move. The velocity of these moving particles is related to their zeta potential. The velocity data are then used to calculate the zeta potential of the particles based on the Smolu–Chowski equation, which relates the electrophoretic mobility of the particles to the zeta potential. The Zetasizer provides results in terms of zeta potential, which indicates the magnitude and direction of the electric charge on the particles’ surfaces. This information is crucial for understanding the stability of colloidal systems. Water and nanoparticles’ physical characteristics are listed in Table 1.

Table 1.
Al2O3 nanoparticles’ and water’s physical characteristics.
Density ρnf and heat capacity Cnf, which may differ considerably from those of the base fluid, are the two key nanofluid parameters that are used in the determination of the usable thermal efficiency extracted during the heating process. Authors did not test the density and heat capacity of Al2O3 nanofluids at different nanoparticle volume concentrations; thus, the density and heat capacity were calculated using Equations (29)–(31) proposed by Pak and Cho [39] and Xuan and Roetzel [40].
where base fluid, nanoparticle, and nanofluid are given the subscriptions f, p, and nf, respectively. Using the Hamilton–Crosser projected model [41], the thermal conductivity Knf of the nanofluid is assessed using Equation (31).
where n denotes the particle sphericity and n = 3 denotes the particle form factor. The sphericity values for cylinder-shaped and spherical particles are 0.5 and 1, respectively. Due to the spherical shape of the Al2O3 nanoparticles, the value of n in the current study is, thus, considered to be 3. Table 2 lists the thermophysical characteristics of Al2O3 nanofluids as a function of nanoparticle volume concentration.
ρnf = (1 − ϕ)ρbf + ϕ ρp
(ρ·C)nf = (1 − ϕ)(ρ·Cp)bf + ϕ (ρ·Cp)p
Knf/kf = kp + (n − 1)kf + (n − 1)ϕ(kp − kf)/kp + (n − 1)kf − ϕ(kp − kf)
Table 2.
Thermophysical characteristics of nanofluids, particles sizes, and zeta potentials of Al2O3/water nanofluid at ϕ = 3%.
Al2O3 nanoparticles acquire a negative charge on their surface due to the presence of hydroxyl (OH-) groups. When dispersed in a water medium, these groups dissociate, resulting in negatively charged surfaces on the nanoparticles. A high negative zeta potential (−27.71 mV), as listed in Table 2, suggested a high degree of electrostatic repulsion between the particles, which helps prevent their agglomeration or aggregation.
This stabilization mechanism is crucial in nanofluid applications because it helps maintain the dispersion stability of nanoparticles in the fluid, preventing them from clumping together and thereby maintaining their desired properties and characteristics, such as uniformity and stability of the nanofluid.
3.1. Experimental Set-Up
The conventional (CSS) and modified solar still (MSS) units utilized in this investigation are shown in Figure 2. The single slope solar still units consisted mainly of seawater tank, glass cover, iron basin, wooden box, circulation water pump, and connection piping. The tested solar still units were erected facing south during the experiments, and the module’s inclination was fixed at 30° with respect to the ground to maximize the quantity of sunlight that hit the module’s surface. The flat-plate solar thermal collector (FPSC) was used to warm the seawater solution (acts as a thermal carrier) flowing into the copper collector’s tube by absorbing the incident solar radiation and transferring heat into seawater stream. The FPSC operated under forced circulation using a 375-Watt water circulation pump. It was placed in the south direction with a slope of 30° to maximize the solar intensity and to transfer the maximum possible solar radiation.
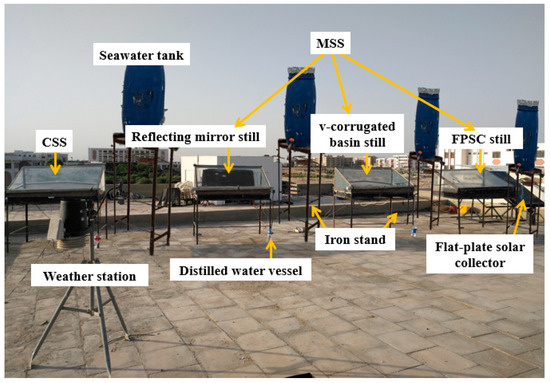
Figure 2.
Photograph of experimental set-up.
The seawater solution examined in this experiment was characterized with around 33,162 ppm salt concentration. A plastic water tank (50 L capacity and 2 mm thick) was fixed above iron stand to supply the solar still (SS) unit with the required water depth. The thickness of transparent glass cover of solar still is 3 mm, having the same dimensions, as illustrated in Figure 3. It was sealed with silicone rubber to prevent any vapor leakage. The reflective mirror, possessing a thickness of 2 mm, was fixed perpendicular to a still glass surface, demonstrating dimensions of 0.5 m in height and 1.5 m in length.
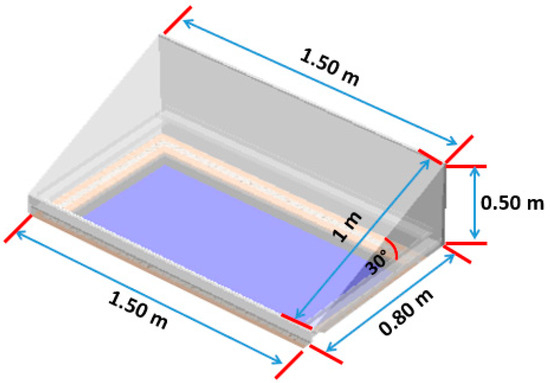
Figure 3.
Dimensions of solar still glass cover.
The flat-plate and v-corrugated-type still basins used in this study are illustrated in Figure 4. All still basins are fabricated from galvanized iron with the same outside dimensions of 0.8 m width, 1.3 m length, 0.1 m depth. It should be noted here that the inside surface area of the three solar still units used a flat-plate type basin equal to 1.04 m2. The basin, designed in a v-corrugated type, measures 0.8 m in width, 2.4 m in length, and stands at a height of 7 cm. This configuration is illustrated in Figure 4. The angle of bending between two successive tops or bottoms is around 60°, and the distance between each two tops or two bottoms is about 8 cm (equilateral triangles) with 7 cm height. This basin consists of 15 tunnels (tops and bottoms of corrugated shape). The depth of seawater inside the still basin is kept at 2 cm during the experiment operating time.
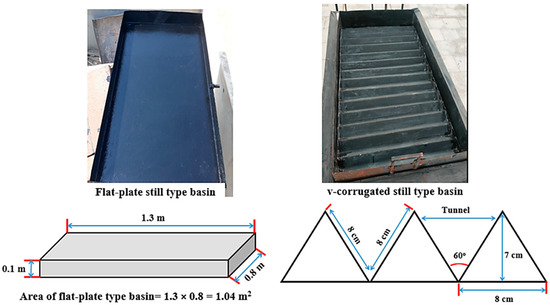
Figure 4.
Photograph of flat-plate and v-corrugated-type still basins.
The still basins were painted in black coating to enhance the heat absorption from the sun, and each one is added separately inside a wooden box for low heat loss. A wooden box was made from plywood material with the same outside dimensions of 1.44 × 0.94 m2 and thickness of 0.025 m. The side spaces between the still basin and the wooden box are filled with Styrofoam (0.07 m thick and 0.04 Wm−1 K−1 thermal conductivity) and with rock wool at the bottom basin (thick of 0.02 m and 0.0346 Wm−1 K−1 thermal conductivity). Two openings are made at the side and bottom of still basin for entry and drainage of seawater solution. A tube made of PVC is fixed between the sloped glass cover surface and still basin to collect the water droplets resulting from the vapor condensation. The flat-plate solar thermal collector (FPSC) utilized as a heat source in this experiment was designed in a rectangular shape, as shown in Figure 5. It consists of black aluminum absorber plate (1 mm thick), serpentine copper tube (26 m tube length, 8 mm diameter, 30 channels with 50 mm pitch between tubes), glass cover surface (3 mm thickness), wooden box (160 cm length, 90 cm width, 10 cm depth, 5 mm thickness, and surface area of 1.44 m2), and insulation material.
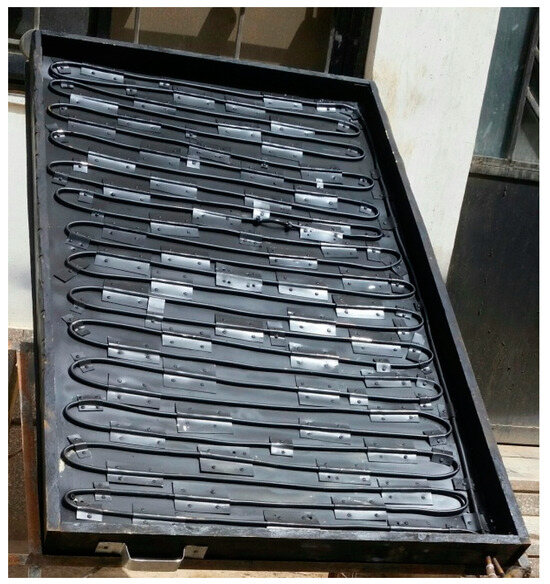
Figure 5.
Photograph of flat-plate solar thermal collector (FPSC).
3.2. Solar Still Configurations
In the current experiment, as elucidated schematically in Figure 6, the cold seawater solution (pointing out as a blue solid line in the figure) flowed from the feeding tank to the iron basin after opening the control valve (7). The control valve (7) was left open until the still basin filled up with cold seawater solution at the required depth; then, it closed to prevent more water flowing into the basin. After that, the cold seawater solution in the basin began to warm up and convert to a hot solution (red solid line in the figure) by the solar rays transmitted through the glass cover surface and absorbed by the linear black basin. The hot seawater solution starts to evaporate and produce a vapor at the hot water surface to remove salts. After that, the generated vapor molecules transferred by a convection mode towards the interior cold glass cover surface. Then, it condensed and turned into pure water droplets. The water droplets moved down on the interior glass cover surface under a gravitational effect and collected as distilled water in the vessel (green solid line in the figure). To maintain the depth of water constantly in the still basin during the experiment, the control valve (7) was opened once again to compensate any shortage in water depth as a result of evaporation process.
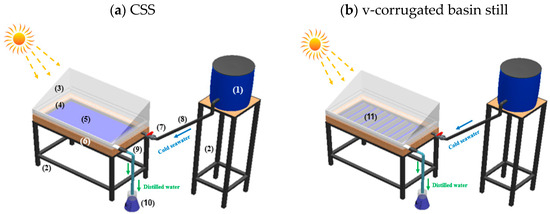
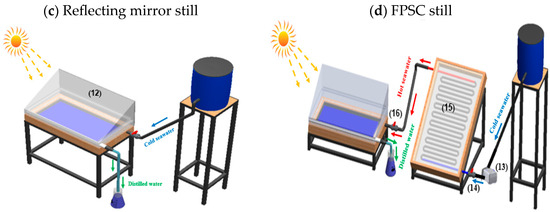
Figure 6.
The schematic diagrams illustrating the (a) CSS, (b) v-corrugated basin still, (c) reflecting mirror still and (d) FPSC still with and without nanofluids used in this investigation: (1) seawater tank, (2) iron stand, (3) glass cover, (4) flat-plate-type still basin, (5) seawater, (6) wooden box, (7) control valve (1), (8) connecting pipe, (9) distillate PVC tube, (10) distilled water vessel (11) v-corrugated-type still basin, (12) reflecting mirror, (13) water pump, (14) control valve (2), (15) flat-plate solar thermal collector, (16) control valve (3).
The same steps were repeated in case of solar still (SS) unit equipped with a solar thermal collector with (FPSC nanofluid) and without nanofluids (FPSC still), as illustrated in Figure 6d, except the cold seawater stream entering first into the solar thermal collector by using a water circulation pump (375 Watt) after opening the control valve (14) for preheating. The control valve (14) was left open until the cold seawater solution completely filled the copper collector’s tube closing at the same time as the control valve (16). After the cold seawater solution filled the copper collector’s tube and was heated up by absorbed solar radiation, the control valve (16) opened gradually to allow the preheated seawater solution to flow and fill the still basin with a tested depth; then, it closed once again. The above-mentioned steps were repeated until the collection of pure fresh water in the vessel.
Al2O3/seawater nanofluid with various nanoparticle concentrations is pushed through the solar collector’s tube in order to remove the surplus heat produced by the flat-plate solar collector, as shown in Figure 6d. By providing direct contact continuous heating, the temperature of the surface of the pipe will be controlled by the Al2O3/seawater nanofluid, significantly improving the extraction of heat from the surface solar collector system. In Figure 6d, the hot Al2O3/seawater nanofluid is directed to the solar still (SS) unit for usage after leaving the solar collector. To achieve an accurate nanofluid mass flow rate, the rotameter is calibrated using the usual weighing approach with the assistance of a stopwatch using the estimated nanofluid density, and the mass flow rate of the nanofluid is also obtained in the current study.
3.3. Solar Still Performance Parameters
- (a)
- Solar still productivity (Pd)
The Pd of the solar still could be calculated by using Equations (32) and (33) [42,43].
where Pd is the hourly still productivity (kgh−1), Ab is the basin surface area (m2), ΔT is the temperature difference between the hot water and the cold glass cover (°C), Qe,w−gi is the evaporative heat transfer rate (Wm−2), he,w−gi is the evaporative heat transfer coefficient from the water surface to the glass cover (Wm−2 °C−1), and Lw is the latent heat of water (≈2434 kJ kg−1).
- (b)
- Solar still thermal efficiency (ηth)
The ηth of solar still could be determined mathematically using Equation (34) [42,43,44,45].
where Lw is the latent heat of water (J kg−1) at average water temperature (Tw), Ag is the glass cover surface area (m2), and I is the solar radiation incident on the glass cover surface (Wm−2).
In case of single slope solar still with the support of a flat-plate solar collector (FPSC), the solar still thermal efficiency must consider the solar collector’s energy gain as an energy entry. Its hourly thermal efficiency (ηFPSC) could be determined mathematically using Equations (35) and (36).
where Qex is the energy supplied by the nanofluid circulated in the copper tubes of solar collector to saline water (J/h), m is the flow rate of seawater with and without nanofluids (≈ 0.0075 kg/s), c is the specific heat of seawater with and without nanofluids (≈3959 and 3900 J/kg·K), and Tin and Tout are the inlet and outlet temperatures (°C), respectively, in the FPSC still with and without nanofluids in 1 h.
- (c)
- Basin surface area (Ab)
The surface area of rectangular flat-plate-type still basin (Ab-flat) = Length × Width, while, in case of a v-corrugated-type still basin (Ab-corrugated) = area of one tunnel × number of tunnels (Figure 4).
3.4. Experimental Proceedings and Measurements
Experiments started at 7:00 h and continued up to 18:00 h during August 2022. The velocity of wind (W), ambient temperature (Tao), and solar intensity (R) was measured experimentally using meteorological station (Vantage Pro 2, Davis, USA). Additionally, water (Tw), vapor (Tv), and inner glass cover (Tgi) temperatures are recorded by utilizing thermocouples (Lab-Jack logger, powered by USB cable, supply 5 volt, USA). The thermocouples are connected to a data-logger system to display and record the data during the experimental period. The output data were recorded every five minutes and averaged every one hour during daylight.
4. Uncertainty Analysis
The features of each measuring instrumentation are shown together with the standard uncertainty in Table 3. According to [46], the usual standard uncertainty of each piece of equipment is defined using Equation (37).
where a is the instrumentations accuracy [47,48].
Table 3.
Instrumentation accuracy and uncertainty.
The uncertainty of the function X may be predicted if it is a function of ‘n’ independent linear parameters, as in X = f(β1, β2,…, βn) [49] using Equation (38).
The maximum solar still productivity uncertainty, Pd, was determined using Equation (39) as the focal point.
The greatest error in the estimation of thermal efficiency was noted as 0.026, as detailed in Table 3.
The highest absolute uncertainty of the parameters was calculated to be less than 4%, showcasing the reliability of the assessed parameters.
5. Results and Discussion
5.1. Comparative Temperature Analysis of Solar Still Configurations
The hourly variations of basin water (Tw), inner glass cover (Tgi), and vapor (Tv) temperatures for conventional solar still (CSS), v-corrugated basin, reflecting mirror, FPSC still, and FPSC nanofluids are shown in Figure 7a–c. Investigations were carried out at an average ambient temperature of 30.9 °C, average solar radiation intensity of 506.9 W/m2, water depth of 2 cm, and salt concentration of 33,162 ppm. The obtained results demonstrated that a v-corrugated basin, reflecting mirror, FPSC still, and FPSC nanofluids obviously upgraded the performance of the solar distillation unit in comparison with the conventional solar still (CSS). As shown in Figure 7a, the advanced basin water temperature (Tw) fulfilled with different enhancement techniques around the daytime compared to the conventional solar still (CSS) unit was associated mainly with a considerable increase in absorbed solar radiation and a heat loss reduction to the surrounding environment compared with conventional solar still (CSS) unit. The excessive energy losses took place in the case of a conventional solar still (CSS) unit, leading to a visible basin water temperature (Tw) decline. The enhanced basin water temperature (Tw) of a v-corrugated-type still basin was attributed to an increase in the surface area of heat and mass transfer (1.92 m2) corresponding to only 1.04 m2 in the case of a flat-plate-type still basin of a conventional solar still (CSS) unit. Additionally, placing a mirror on the vertical side of the glass cover of the still helped in reflecting all the incoming solar radiation onto the seawater surface. As a result, this action elevated the temperature of the basin water (Tw). In the FPSC still and FPSC nanofluids, it was observed that the water temperature (Tw) consistently exceeded that of the conventional solar still (CSS) unit. This was attributed to a preheated water supply and a specific fin arrangement. The elevation in temperatures of the inner glass cover (Tgi), illustrated in Figure 7b, was predominantly attributable to distinct enhancement techniques applied during daylight hours. This rise was chiefly a consequence of a heightened rate of vapor condensation occurring on the interior glass cover surface, a phenomenon that differed significantly from the conventional solar still (CSS) unit. The use of FBSC nanofluid exhibited a significant increase in vapor temperature, reaching up to 100 degrees Celsius at 14:00, in contrast to the 70 degrees Celsius observed with the conventional CSS configuration (Figure 7c). As listed in Table 4, it was noted that a v-corrugated basin, reflecting mirror, FPSC still, and FPSC nanofluids completely affected the average basin water (Tw), inner glass cover (Tgi), and vapor (Tv) temperatures of the solar distillation unit. As an example, in comparison with the conventional solar still (CSS) unit, noticeable increases of around 11.53%, 22.45%, 33.89%, and 60.67% observed in average basin water temperature (Tw) for a v-corrugated basin, reflecting mirror, FPSC still, and FPSC nanofluids, respectively. Also, the average still glass cover temperature (Tgi) was raised by 6.96%, 16.46%, 25.14%, and 50.19% relative to the conventional solar still (CSS). Likewise, compared with the conventional solar still (CSS) unit, a v-corrugated basin, reflecting mirror, FPSC still, and FPSC nanofluids incremented the average vapor temperature (Tv) by nearly 12.38%, 23.22%, 33.79%, and 60.55%, respectively.
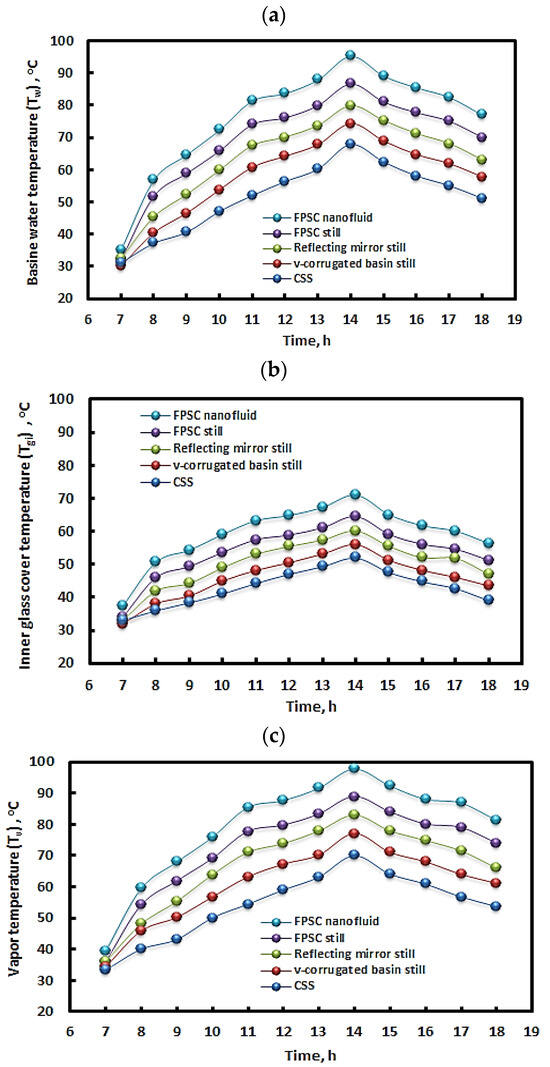
Figure 7.
The hourly variation of basin water, inner glass cover, vapor temperatures for different solar still configurations (a) Time vs. basin water temperature, (b) Time vs. inner glass cover temperature and (c)Time vs. vapour temperature.
Table 4.
The average basin water (Tw), inner glass cover (Tgi), vapor (Tv) temperatures in °C for different solar still configurations.
5.2. Comparative Productivity Analysis of Solar Still Configurations
The resulting data presented in Figure 8 elucidated the impact of a v-corrugated basin, reflecting mirror, FPSC still, and FPSC nanofluids on the accumulated daily distillate productivity (Pd) of the solar distillation unit compared with a conventional solar still (CSS) unit. Figure 8 shows that a v-corrugated basin, reflecting mirror, FPSC still, and FPSC nanofluids greatly enhanced the still daily productivity (Pd) by roughly 22.39%, 41.72%, 70.10%, and 104.13%, respectively, compared with the conventional solar still (CSS) unit. The improved accumulated daily distillate productivity (Pd) was ascribed to a considerable augmentation in the temperature difference between the hot water and the cold glass cover (ΔTw-gi) by around 34.33%, 52.32%, 77.37%, and 112.87% on average around the daytime compared to the unit of a conventional solar still (CSS), in which a high thermal capacity was the main reason for a productivity (Pd) decrease, as illustrated in Figure 9. Additionally, the improved accumulated daily productivity (Pd) in the case of the FPSC still and FPSC nanofluids could be translated by increasing the heat transfer rate from the hot water surface to the inner cold glass cover surface via convective, evaporative, and radiative forces.
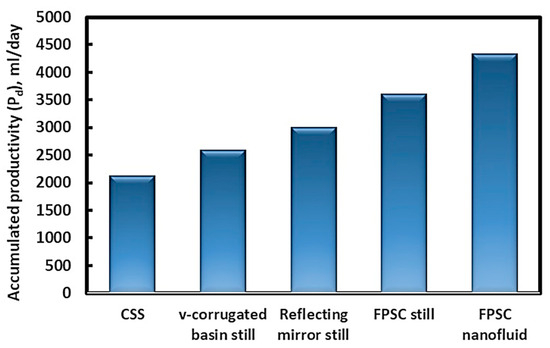
Figure 8.
Assessing the daily productivity (Pd) of various solar still configurations under atmospheric conditions from June to August.
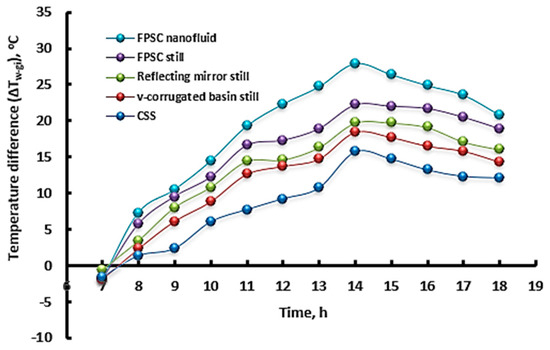
Figure 9.
The hourly variation of the temperature difference (ΔTw-gi) for different solar still configurations.
5.3. Comparative Thermal Efficiency Analysis of Solar Still Configurations
Figure 10 displays that the positive influence of a v-corrugated basin, reflecting mirror, FPSC still, and FPSC nanofluids for the average daily thermal efficiency (η) is 22.01%, 26.71%, 39.57%, and 56.21%, respectively. The achieved augmentation in the average thermal efficiency (η) could be explained due to two reasons: firstly, increasing water evaporation and condensation processes thanks to various improvement techniques contrasted to the conventional solar still (CSS); secondly, a large amount of thermal energy added during sunshine hours until sunset by virtue of integrating the solar thermal collector into the solar distillation unit. Meanwhile, a decline happened in the average thermal efficiency (η) of a conventional solar still (CSS) unit, attributed mainly to a high specific heat capacity and lower distillate productivity (Pd).
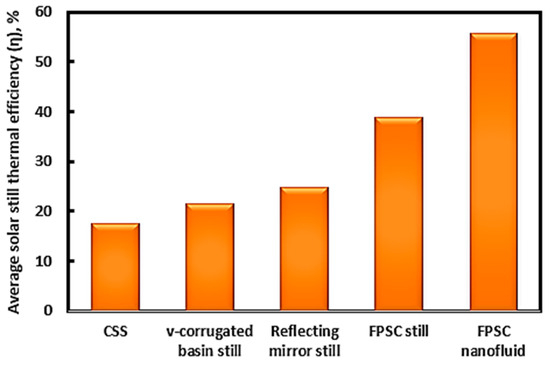
Figure 10.
Comparison of the average daily thermal efficiency (ηth) for different solar still configurations.
6. Comparative Assessment with Current Study
Table 5 presents comparisons of productivity (Pd) and thermal efficiency (η) between the single slope solar still tested in the current experimental study and previous solar still unit studies. The utilization of Al2O3 water-based nanofluid in the solar collector (FPSC) within this study demonstrated a notable and substantial enhancement in both thermal efficiency (56.21%) and productivity (104.13%) when compared to previous research. The incorporation of Al2O3 nanoparticles into the water-based nanofluid significantly augmented the heat transfer characteristics within the collector. This enhancement can be attributed to the improved thermal conductivity and convective heat transfer properties of the nanofluid, facilitating better heat absorption and transfer within the system. Consequently, the increased thermal efficiency of the solar collector led to a substantial improvement in the overall productivity of the system. The findings suggest that employing Al2O3 water-based nanofluid in the solar collector configuration represents a promising advancement, offering an effective means to significantly enhance both thermal efficiency and productivity, thus contributing to the potential advancement of solar energy utilization for various applications.
Table 5.
A comparative study between the current investigation and previous studies on solar distillation techniques, including V-corrugated basin, reflecting mirror, FPSC still, and FPSC nanofluids.
7. Conclusions
In the current work, a v-corrugated basin, reflecting mirror, FPSC still, and FPSC nanofluids deeply improved the solar still distillate productivity (Pd) and thermal efficiency (ηth) compared with a conventional solar still (CSS) unit. This was owing to significantly increasing the temperature difference between the two hot water and cold glass cover surfaces (ΔTw-gi). Under an average ambient temperature of 30.9 °C, average solar radiation intensity of 506.9 W/m2, water depth of 2 cm, and salt concentration of 33,162 ppm, the solar still distillate productivity (Pd) was upgraded by nearly 22.39%, 41.72%, 70.10%, and 104.13% by virtue of a v-corrugated basin, reflecting mirror, FPSC still, and FPSC nanofluids, respectively, compared with the conventional solar still (CSS) unit. This was ascribed to a considerable augmentation in the temperature difference between the two hot water and cold glass cover surfaces (ΔTw-gi) by around 34.33%, 52.32%, 77.37%, and 112.87%, respectively, compared with the conventional solar still (CSS), in which a high thermal capacity leads to a productivity (Pd) decrease. Also, the v-corrugated basin, reflecting mirror, FPSC still, and FPSC nanofluids greatly upgraded the average solar still thermal efficiency (ηth) by about 22.01%, 26.71%, 39.57%, and 56.21%, respectively. The results demonstrated that integrating a v-corrugated basin, reflecting mirror, FPSC still, and FPSC nanofluids into combined active solar distillation units significantly enhanced the performance of the solar distillation unit. These combined configurations effectively raised the temperature of the basin water (Tw) and increased the temperature difference between the hot water and the inner cold glass cover surfaces (ΔTw-gi), thereby resulting in improved performance of the solar still.
Author Contributions
Conceptualization, Y.E., S.S.K., M.A.-R.A.-Z. and M.B.; Methodology, M.A.-R.A.-Z., Y.E., M.T., M.B., T.M., O.A.A.-Q. and S.S.K.; Software, M.A.-R.A.-Z. and S.S.K.; Validation, M.A.-R.A.-Z., Y.E., M.T., M.B., O.A.A.-Q. and S.S.K.; Formal analysis, M.A.-R.A.-Z.; Investigation, M.A.-R.A.-Z., Y.E., M.T., M.B., T.M., O.A.A.-Q. and S.S.K.; Resources, O.A.A.-Q.; Writing—review & editing, T.M. All authors have read and agreed to the published version of the manuscript.
Funding
This research received no external funding.
Institutional Review Board Statement
Not applicable.
Informed Consent Statement
Not applicable.
Data Availability Statement
Data will be available from the corresponding author on request.
Acknowledgments
The researchers would like to acknowledge the assistance provided by the Science and Technology Development Fund (STDF) for funding the project, No. 41902 (Center of Excellence in Membrane-based Water Desalination Technology for Testing and Characterization).
Conflicts of Interest
The authors declare no conflict of interest.
Nomenclature
| a | Accuracy of instrument |
| Ab | Basin surface area (m2) |
| Ag | Glass cover surface area (m2) |
| Aw | Water surface area (m2) |
| Cpw | Specific heat of seawater (J/kg·K) |
| Cpb | Basin specific heat (J/kg·K) |
| Cpg | Glass cover specific heat (J/kg·K) |
| Fc | Convective fraction |
| Fe | Evaporative fraction |
| Fr | Radiative fraction |
| K | Thermal conductivity (W/m.K) |
| kg | Glass cover thermal conductivity (W/m.K) |
| kin | Insulation thermal conductivity (W/m.K) |
| n | Particle shape factor |
| I | Solar radiation flux incident on the basin (Wm−2) |
| Lw | Latent heat of vaporization (kJ kg−1) |
| m | Flow rate of seawater with and without nanofluids (kg/s) |
| mb | Basic mass (kg) |
| mc | Mass of condensated water (kg) |
| mg | Mass of the glass cover (kg) |
| mw | Water mass (kg) |
| Qex | Energy supplied by the nanofluid circulated in the copper tubes of solar collector to saline water (J/h) |
| Qe,w−gi | Evaporative heat transfer rate within still from the water surface to the interior surface of the glass cover (Wm−2) |
| qb | Conductive heat transfer rate from the basin bottom to the atmosphere (Wm−2) |
| qbwb | Convective heat transfer rate from the black basin liner to the water surface (Wm−2) |
| qcga | Convective heat transfer rate from the exterior surface of the glass cover to the atmosphere (Wm−2) |
| qcw | Convective heat transfer rate within still from the water surface to the interior surface of the glass cover (Wm−2) |
| qrgs | Radiative heat transfer rate from the exterior surface of the glass cover to the sky (Wm−2) |
| qrwb | Radiative heat transfer rate within still from the water surface to the interior surface of the glass cover (Wm−2) |
| q1 | Total value of the energy transfer within the still from the water surface to the interior surface of the glass cover (Wm−2) |
| q2 | Total value of the energy transfer from the exterior surface of the glass cover to the atmosphere (Wm−2) |
| hbw | Convective heat transfer coefficient from the black basin liner to the water surface (Wm−2 °C−1) |
| hcga | Convective heat transfer coefficient from the exterior surface of the glass cover to the atmosphere (Wm−2 °C−1) |
| hcw | Convective heat transfer coefficient from water surface to the interior surface of the glass cover (Wm−2 °C−1) |
| hew | Evaporative heat transfer coefficient from water surface to the interior surface of the glass cover (Wm−2 °C−1) |
| he,w−gi | Evaporative heat transfer coefficient from water surface to glass cover (Wm−2 °C−1) |
| hrgs | Radiative heat transfer coefficient from the exterior surface of the glass cover to the sky (Wm−2 °C−1) |
| hrw | Radiative heat transfer coefficient from the water surface to the interior surface of the glass cover (Wm−2 °C−1) |
| h1 | Total internal heat transfer coefficient from the water surface to the interior surface of the glass cover (Wm−2 °C−1) |
| h2 | Total external heat transfer coefficient from the exterior surface of the glass cover to the atmosphere (Wm−2 °C−1) |
| Tw | Basin water temperature (°C) |
| Tin | Inlet temperature in the FPSC still with and without nanofluids in 1 h (°C) |
| Tout | Outlet temperature in the FPSC still with and without nanofluids in 1 h (°C) |
| Tao | Ambient temperature (°C) |
| Tv | Vapor temperature (°C) |
| Tsky | Sky temperature (°C) |
| Tgo | Outer glass cover temperature (°C) |
| Tgi | Inner glass cover temperature (°C) |
| u | Standard uncertainty |
| ΔTw-gi | Temperature difference between the hot basin water surface and the interior cooling glass cover surface (°C) |
| Ug | Conductive heat transfer coefficient through the thickness of the still cover Wm−2 °C−2 |
| W | Vel°City of wind (m/sec) |
| xg | Glass cover thickness (m/s) |
| xin | Insulation thickness (m/sec) |
| Pd | Hourly condensate (distillate) production from the still (kgh–1) |
| Pgi | Partial pressure of water vapor at inner glass temperature within the still (Nm−2) |
| Pwb | Partial pressure of water vapor at water temperature within the still (Nm−2) |
| Abbreviations | |
| SS | Solar still |
| CSS | Conventional solar still |
| MSS | Modified solar still |
| FPSC | Flat-plate solar collector |
| HDH | Humidification-dehumidification |
| MSF | Multi-stage flash |
| MED | Multi-effect distillation |
| VC | Vapor compression |
| Subscripts | |
| bf | base fluid |
| nf | nanofluid |
| p | nanoparticle |
| u | useful |
| Greek letters | |
| ηth | Solar still thermal efficiency (%) |
| ηFPSC | Solar still-solar collector thermal efficiency (%) |
| ρ | Density of fluid (kg/m3) |
| ϕ | Concentration ratio by volume of nanoparticles |
| εeff | Shape factor of diffuse radiation between the water surface and the glass cover (effective emissivity) |
| σ | Stefan -Boltzmann constant (Wm−2 K−4) |
References
- Ibrahim, A.G.M.; Elshamarka, S.E. Performance study of a modified basin type solar still. Sol. Energy 2015, 118, 397–409. [Google Scholar] [CrossRef]
- Elbany, M.; Elhenawy, Y. Analyzing the ultimate impact of COVID-19 in Africa. Case Stud. Transp. Policy 2021, 9, 796–804. [Google Scholar] [CrossRef]
- Sharshir, S.W.; Yang, N.; Peng, G.; Kabeel, A.E. Factors affecting solar stills productivity and improvement techniques: A detailed review. Appl. Therm. Eng. 2016, 100, 267–284. [Google Scholar] [CrossRef]
- Shukla, S.K.; Sorayan, V.P.S. Thermal modeling of solar stills: An experimental validation. Renew. Energy 2005, 30, 683–699. [Google Scholar] [CrossRef]
- Kabeel, A.E.; Hamed, A.M.; El-Agouz, S.A. Cost analysis of different solar still configurations. Energy 2010, 35, 2901–2908. [Google Scholar] [CrossRef]
- Al-Hayek, I.; Badran, O.O. The effect of using different designs of solar stills on water distillation. Desalination 2004, 169, 121–127. [Google Scholar] [CrossRef]
- Chan, W.W.; Jiang, B.; Liu, L. Comparative studies of solar collectors in southern China hotels. J. China Tour. Res. 2013, 9, 292–304. [Google Scholar] [CrossRef]
- Tanaka, H. Monthly optimum inclination of glass cover and external reflector of a basin type solar still with internal and external reflector. Sol. Energy 2010, 84, 1959–1966. [Google Scholar] [CrossRef]
- Omara, Z.M.; Hamed, M.H.; Kabeel, A.E. Performance of finned and corrugated absorbers solar stills under Egyptian conditions. Desalination 2011, 277, 281–287. [Google Scholar] [CrossRef]
- Eltawil, M.A.; Omara, Z.M. Enhancing the solar still performance using solar photovoltaic, flat plate collector and hot air. Desalination 2014, 349, 1–9. [Google Scholar] [CrossRef]
- Sheeba, K.N.; Babu, J.S.-C.; Jaisankar, S. Performance evaluation of a flat plate collector coupled solar still system. Energy Sources Part A Recovery Util. Environ. Eff. 2015, 37, 291–298. [Google Scholar] [CrossRef]
- Rai, S.N.; Tiwari, G. Single basin solar still coupled with flat plate collector. Energy Convers. Manag. 1983, 23, 145–149. [Google Scholar] [CrossRef]
- Badran, O.O.; Al-Tahaineh, H.A. The effect of coupling a flat plate collector on the solar still productivity. Desalination 2005, 183, 137–142. [Google Scholar] [CrossRef]
- Badran, O.O. Experimental study of the enhancement parameters on a single slope solar still productivity. Desalination 2007, 209, 136–143. [Google Scholar] [CrossRef]
- Tanaka, H. Experimental study of a basin type solar still with internal and external reflectors in winter. Desalination 2009, 249, 130–134. [Google Scholar] [CrossRef]
- Hiroshi, T.; Yasuhito, N. Theoretical analysis of a basin type solar still with internal and external reflectors. Desalination 2006, 197, 205–216. [Google Scholar]
- Omara, Z.M.; Kabeel, A.E.; Younes, M.M. Enhancing the stepped solar still performance using internal and external reflectors. Energy Convers. Manag. 2014, 78, 876–881. [Google Scholar] [CrossRef]
- Omara, Z.M.; Kabeel, A.E.; Abdullah, A.S.; Essa, F.A. Experimental investigation of corrugated absorber solar still with wick and reflectors. Desalination 2016, 381, 111–116. [Google Scholar] [CrossRef]
- Abdallah, S.; Badran, O.; Mazen, M.; Khader, A. Performance evaluation of a modified design of a single slope solar still. Desalination 2008, 219, 222–230. [Google Scholar] [CrossRef]
- Hameed, H.G.; Diabil, H.A.N.; Al-Fahham, M.A. Performance study on a solar concentrator system for water distillation using different water nanofluids. Heliyon 2023, 9, e16535. [Google Scholar] [CrossRef]
- Zakaria, M.; Sharaky, A.M.; Al-Sherbini, A.-S.; Bassyouni, M.; Rezakazemi, M.; Elhenawy, Y. Water desalination using solar thermal collectors enhanced by nanofluids. Chem. Eng. Technol. 2022, 45, 15–25. [Google Scholar] [CrossRef]
- Fouad, K.; Alalm, M.G.; Bassyouni, M.; Saleh, M.Y. A novel photocatalytic reactor for the extended reuse of W–TiO2 in the degradation of sulfamethazine. Chemosphere 2020, 257, 127270. [Google Scholar] [CrossRef] [PubMed]
- Abu-Arabi, M.; Zurigat, Y.; Al-Hinai, H.; Al-Hiddabi, S. Modeling and performance analysis of a solar desalination unit with double-glass cover cooling. Desalination 2002, 143, 173–182. [Google Scholar] [CrossRef]
- Baum, V.A.; Bairamov, R. Heat and mass transfer processes in solar stills of hot-box type. Sol. Energy 1964, 8, 78. [Google Scholar] [CrossRef]
- Dunkle, R.V. Solar water distillation: The roof-type still and a multiple- effect diffusion still. In International Developments in Heat Transfer, ASME, Proceedings International Heat Transfer Part V; University of Colorado: Victoria, Australia, 1961; p. 895. [Google Scholar]
- Fernandez, J.L.; Chargoy, N. Multi stage indirectly heated solar still. Sol. Energy J. 1990, 44, 215–223. [Google Scholar] [CrossRef]
- Duffie, J.A.; Beckman, W.A. Solar Engineering of the Thermal Process; Wiley: New York, NY, USA, 1991; pp. 3–44. [Google Scholar]
- Tiwari, A.K.; Tiwari, G.N. Thermal modeling based on solar fraction and experimental study of the annual and seasonal performance of a single slope passive solar still: The effect of water depths. Desalination 2007, 207, 184–204. [Google Scholar] [CrossRef]
- Cooper, P.I. Digital simulation of experimental solar still data. Sol. Energy 1973, 14, 451. [Google Scholar] [CrossRef]
- Sartori, E. Solar still versus solar evaporator: A comparison study between their thermal behaviors. Sol. Energy 1996, 56, 199–206. [Google Scholar] [CrossRef]
- McAdams, W.H. Heat Transmission, 3rd ed.; McGraw-Hill Book Company: New York, NY, USA, 1954. [Google Scholar]
- Swinbank, Long-wave radiation from clear skies. Q. J. R. Meteorol. Soc. 1963, 89, 339–348. [CrossRef]
- Rai, G.D. Solar Energy Utilization. A Text Book for Engineering Students; Some additional methods of solar energy utilization; Khanna: Delhi, India, 1980; Chapter 12; pp. 194–197. [Google Scholar]
- Hamdan, M.A.; Musa, A.M.; Jubran, B.A. Performance of solar still under Jordanian climate. Energy Conserv. Manag. 1999, 40, 495–503. [Google Scholar] [CrossRef]
- Ebaid, M.S.; Al-busoul, M.; Ghrair, A.M. Performance enhancement of photovoltaic panels using two types of nanofluids. Heat Transf. 2020, 49, 2789–2812. [Google Scholar] [CrossRef]
- Sardarabadi, M.; Hosseinzadeh, A.; Kazemian, M. Passandideh-Fard, Experimental investigation of the effects of using metal-oxides/water nanofluids on a photovoltaic thermal system (PVT) from energy and exergy viewpoints. Energy 2017, 138, 682–695. [Google Scholar] [CrossRef]
- Michael, J.J.; Iniyan, S. Performance analysis of a copper sheet laminated photovoltaic thermal collector using copper oxide–water nanofluid. Sol. Energy 2015, 119, 439–451. [Google Scholar] [CrossRef]
- Sharaf, O.Z.; Orhan, M.F. Thermodynamic analysis and optimization of densely-packed receiver assembly components in high-concentration CPVT solar collectors. Energy Convers. Manag. 2016, 121, 113–144. [Google Scholar] [CrossRef]
- Poredoš, P.; Tomc, U.; Petelin, N.; Vidrih, B.; Flisar, U.; Kitanovski, A. Numerical and experimental investigation of the energy and exergy performance of solar thermal, photovoltaic and photovoltaic-thermal modules based on roll-bond heat exchangers. Energy Convers. Manag. 2020, 210, 112674. [Google Scholar] [CrossRef]
- Radwan, A.; Ahmed, M.; Ookawara, S. Performance enhancement of concentrated photovoltaic systems using a microchannel heat sink with nanofluids. Energy Convers. Manag. 2016, 119, 289–303. [Google Scholar] [CrossRef]
- Sardarabadi, M.; Passandideh-Fard, M.; Heris, S.Z.J. Experimental investigation of the effects of silica/water nanofluid on PV/T (photovoltaic thermal units). Energy 2014, 66, 264–272. [Google Scholar] [CrossRef]
- Gupta, B.; Mandraha, T.; Edla, P.; Pandya, M. Thermal modeling and efficiency of solar water distillation: A review. Am. J. Eng. Res. 2013, 2, 203–213. [Google Scholar]
- Manokar, A.; Vimala, M.; Winston, D.; Ramesh, R.; Sathyamurthy, R.; Nagarajan, P.; Bharathwaaj, R. Different parameters affecting the condensation rate on an active solar still—A review. Env. Prog. Sustain. Energy 2019, 38, 286–296. [Google Scholar] [CrossRef]
- Mabrouk, A.N.; Elhenaw, Y.; Abdelkader, M.; Shatat, M. The impact of baffle orientation on the performance of the hollow fiber membrane distillation. Desalination Water Treat. 2017, 58, 35–45. [Google Scholar] [CrossRef]
- Muraleedharan, M.; Singh, H.; Udayakumar, M.; Suresh, S. Modified active solar distillation system employing directly absorbing Therminol 55–Al2O3 nano heat transfer fluid and Fresnel lens concentrator. Desalination 2019, 457, 32–38. [Google Scholar] [CrossRef]
- Elhenawy, Y.; Moustafa, G.H.; Attia, A.M.; Mansi, A.E.; Majozi, T.; Bassyouni, M. Performance enhancement of a hybrid multi effect evaporation/membrane distillation system driven by solar energy for desalination. J. Environ. Chem. Eng. 2022, 10, 108855. [Google Scholar] [CrossRef]
- Gupta, S.V. Measurement Uncertainties: Physical Parameters and Calibration of Instruments; Springer Science & Business Media: Berlin/Heidelberg, Germany, 2012. [Google Scholar]
- Kirkup, L.; Frenkel, R.B. An Introduction to Uncertainty in Measurement: Using the GUM (Guide to the Expression of Uncertainty in Measurement); Cambridge University Press: Cambridge, UK, 2006. [Google Scholar]
- Alhathal Alanezi, A.; Bassyouni, M.; Abdel-Hamid, S.M.; Ahmed, H.S.; Abdel-Aziz, M.H.; Zoromba, M.S.; Elhenawy, Y. Theoretical investigation of vapor transport mechanism using tubular membrane distillation module. Membranes 2021, 11, 560. [Google Scholar] [CrossRef]
- Omara, Z.M.; Kabeel, A.E.; Younes, M.M. Enhancing the stepped solar still performance using internal reflectors. Desalination 2013, 314, 67–72. [Google Scholar] [CrossRef]
- Diabil, H.A.N. Experimental study to enhance the productivity of single-slope single-basin solar still. Open Eng. 2022, 12, 157–168. [Google Scholar] [CrossRef]
- Balachandran, G.B.; David, P.W.; Mariappan, R.K.; Kabeel, A.E.; Athikesavan, M.M.; Sathyamurthy, R. Improvising the efficiency of single-sloped solar still using thermally conductive nano-ferric oxide. Environ. Sci. Pollut. Res. 2020, 27, 32191–32204. [Google Scholar] [CrossRef] [PubMed]
- Sharshir, S.W.; Elsheikh, A.H.; Ellakany, Y.M.; Kandeal, A.W.; Edreis, E.M.A.; Sathyamurthy, R.; Thakur, A.K.; Eltawil, M.A.; Hamed, M.H.; Kabeel, A.E. Improving the performance of solar still using different heat localization materials. Environ. Sci. Pollut. Res. 2020, 27, 12332–12344. [Google Scholar] [CrossRef]
- Kabeel, A.E.; Attia, M.E.H.; Bellila, A.; El-Maghlany, W.M.; Fayed, M.; Abdullah, A.S.; Zidane, I.F. The impact of the corrugated absorber shape on the performance of a hemispherical solar still for water desalination: An experimental study. Appl. Water Sci. 2023, 13, 108. [Google Scholar] [CrossRef]
- Attia, M.E.H.; Zayed, M.; Abdelgaied, M.; Sharshir, S.; Kabeel, A.E.; Abdalla, A. Experimental investigation on a modified design of hemispherical solar distiller with v-corrugated iron trays and wick materials for improving freshwater production. Environ. Sci. Pollut. Res. 2022, 29, 83756–83769. [Google Scholar] [CrossRef]
- Ramzy, K.; Abdelgaleel, M.; Kabeel, A.E.; Mosalam, H. Performance of a single slope solar still using different porous absorbing materials: An experimental approach. Environ. Sci. Pollut. Res. 2023, 30, 72398–72414. [Google Scholar] [CrossRef]
- Bellatreche, R.; Ouali, M.; Balistrou, M.; Tassalit, D. Thermal efficiency improvement of a solar desalination process by parabolic trough collector. Water Supply 2021, 21, 3698–3709. [Google Scholar] [CrossRef]
- Sambare, R.K.; Dewangan, S.K.; Gupta, P.K.; Joshi, S. Augmenting the productivity of tubular solar still using low-cost energy storage materials. Environ. Sci. Pollut. Res. 2022, 29, 78739–78756. [Google Scholar] [CrossRef] [PubMed]
Disclaimer/Publisher’s Note: The statements, opinions and data contained in all publications are solely those of the individual author(s) and contributor(s) and not of MDPI and/or the editor(s). MDPI and/or the editor(s) disclaim responsibility for any injury to people or property resulting from any ideas, methods, instructions or products referred to in the content. |
© 2024 by the authors. Licensee MDPI, Basel, Switzerland. This article is an open access article distributed under the terms and conditions of the Creative Commons Attribution (CC BY) license (https://creativecommons.org/licenses/by/4.0/).