Abstract
Urban buildings consume raw material and energy, and they produce waste and greenhouse gasses. Sustainable urban development strategies aim to reduce these. Using the case study of buildings in Vienna, this article evaluates the impact of a defined urban development pathway on the heating energy demand, greenhouse gas emissions, and total material requirement of buildings in Vienna for 2021–2050. Furthermore, the impact of recycling to reduce the total material requirement and to increase the circular material use rate is evaluated. The results show that the heating energy demand can be reduced to meet the targets of Vienna’s sustainable development strategy. The same does not count for greenhouse gas emissions. To meet the targets for the latter, the renovation of old buildings by thermal insulation should be expanded and heating systems substituted. With respect to the total material requirement, the recycling of demolition waste from buildings in Vienna to produce secondary raw materials for buildings in Vienna can help to achieve the reduction targets of Vienna’s sustainable development strategy so that in the year 2050, the material footprint is only 44% of the value of the year 2019. Since there is a contradiction between the total material requirement and the circular material use rate, the latter has to be discussed for its use as a circular economy indicator, since the aim of circular economy is not to produce as much recycling materials as possible, but to reduce resource consumption to a sustainable level.
1. Introduction
Human history is characterized by a number of groundbreaking transformations. One of the most recent, but also most dramatic, is urbanization. Today, 55% of the global population lives in cities. It is projected that by the year 2050, this share will increase to 68% [1]. One consequence of this rapid growth is that cities not only became important consumers of energy and raw materials, but also large producers of emissions and waste [2,3]. In order to reduce the negative consequences associated with this urban consumption and waste generation, many cities defined strategies, subsumed under the term sustainable urban development [4,5]. While most of these strategies aim to reduce energy consumption and greenhouse gas (GHG) emissions, others also foresee a reduction in the consumption of primary raw materials [6,7]. In order to achieve these reductions, two of the most important sectors in urban societies that have to be targeted are the transport sector and the building construction sector [8,9,10,11,12,13,14,15]. This also accounts for the Austrian capital of Vienna, where recent studies show that from the two sectors, building construction is twice as relevant for the resource consumption of construction materials than the transport sector [16,17,18,19,20].
When it comes to the measures needed to achieve a reduction in the consumption of construction materials in the building construction sector, cities like Amsterdam [5,7], Leuven [6], and Porto [21] focus on enhanced recycling or reuse of materials from the demolition of buildings in order to produce goods or secondary raw materials that can substitute primary raw materials for new constructions. These measures, which are a part of a circular economy, are also important pillars of the sustainable urban development strategy of Vienna [22]. However, in addition, this strategy, which is called the Smart Climate City Strategy Vienna [22], also aims to reduce resource consumption in the buildings sector by means of demolishing fewer buildings. In this sense, the Smart Climate City Strategy Vienna offers a broader concept of sustainability for the building sector [23]. In order to evaluate and monitor the success of different measures to achieve a sustainable urban development in Vienna, the Smart Climate City Strategy Vienna uses a number of indicators. With respect to resource consumption, the most important indicator is the consumption-based material footprint, which was defined for Vienna as the total material requirement (TMR) [24,25]. In Vienna, this TMR should be reduced in all sectors by −30% until the year 2030, −40% until the year 2040, and −50% until the year 2050. The reduction targets are in comparison to the base year for the TMR, which is the year 2019 [22]. Next to the TMR, the final energy consumption should also be reduced. For buildings in Vienna, the heating energy demand (HED) is particularly mentioned of relevance [26]. The first reason for this is that the HED is the largest consumer of energy in buildings, much larger than the energy demand for warm water or electricity. The second reason is that the HED is also associated with higher GHG emissions than other energy uses, since the HED is provided in Vienna mainly by district heating and decentral floor heating by boilers, both of which are fueled to a large extent by natural gas [26]. Other energy demands for light, power, and cooling are quantitatively not only less important than heating, but they also rely less on fossil fuels and thus generate much less GHG emissions. The reason for that is that these energy demands are covered by electricity, and more than 80% of the electricity produced and consumed in Austria comes from renewable energy sources. Moreover, in summertime, when the demand for cooling for instance has had its peak, more than 100% of the electricity produced in Austria comes from renewable energy sources, allowing not only for covering of the increasing demand of electricity in Austria, but also for exporting of a substantial surplus to neighbouring countries [27]. Coming back to the HED and its reduction, the reduction targets for the energy consumption of buildings in Vienna are −20% until the year 2030 and −30% until the year 2040 [22]. Furthermore, according to the Smart Climate City Strategy Vienna, the direct GHG emissions should also be reduced in Vienna. The reduction targets are −55% until the year 2030 and −100% until the year 2040. This GHG reduction does not include embodied or indirect GHG emissions. All of these reduction targets, the TMR, the HED, and the GHG, are measured on a per-capita basis. The base for the HED and the GWP reductions is the average annual value of the timespan 2005–2010. As aforementioned, for the TMR, the base is the annual value of the year 2019 [22]. Besides the Smart Climate City Strategy Vienna, other regulations relevant to assessing the sustainable development of the city exist. At a national level, the Austrian Circular Economy Strategy not only aims to reduce the material footprint but also to increase the Circular Material Use Rate (CMUR) from 12% in the year 2020 to 18% in the year 2030. Hosting more than a fifth of the population of the country, Vienna will play a crucial role to fulfil this national target. With respect to the energy demand scenarios for Austria, the most important source comes from the Umweltbundesamt, which is the Federal Environment Management Agency of Austria [28]. This document, which is also one of the scientific bases for the Austrian National Energy and Climate Plan [29] in the German Nationaler Energie- und Klimaplan (NEKP), models three scenarios for energy demand in the buildings sector until the year 2050 in Austria. The first scenario is the “With Existing Measures” or WEM scenario, the second is the “With Additional Measures” or WAM scenario, and the third is the Transition scenario. Having a look at the building sector in these scenarios, it becomes clear that the energy demand reduction targets of Vienna are much higher than those modelled in the scenarios. In particular, the WEM scenario models the energy consumption reduction per capita until 2030 by −10%, until 2040 by −13%, and until 2050 by −14%. The WAM scenario models a reduction of −15% (2030), −23% (2040), and −27% (2050), while the Transition scenario models a reduction of −19% (2030), −34% (2040), and −42% (2050) [28]. In comparison, the energy reduction targets for Vienna are −20% (2030) and −30% (2040) and thus comparable to the Transition scenario modelled by the Umweltbundesamt.
With respect to achieving the sustainable urban development targets for buildings in Vienna, there are a number of recent studies investigating scenarios that aim to analyze possible future urban development pathways in the context of the Smart Climate City Strategy Vienna. A recent study by Lederer et al. [30] for instance calculated the direct material requirement (DMR) of the most important construction minerals under an enhanced circularity scenario, suggesting that re-use and recycling can contribute, but will not be sufficient alone, to meeting Vienna’s resource consumption reduction target. This study, however, used the material flow data of construction materials and demolition waste from the year 2014, but not future scenarios or development pathways for material consumption and waste generation. Such scenarios were developed by Lederer et al. [17], who found that a massive reduction in the demolition of old buildings in combination with enhanced renovation, the so-called RENO-scenario in their study, is favourable with respect to reducing the material consumption if compared to a continuation of the business-as-usual, the so-called BAU-scenario, or the DEMO-scenario, which foresees more demolition of old buildings that can then be substituted by new low-energy buildings. Moreover, using the model of Lederer et al. [17], Haas et al. [31] found that the RENO-scenario outperforms the other scenarios with respect to savings of heating energy and mitigation of greenhouse gas emissions. Yet, there are certain points that must be considered and discussed with respect to these studies. First, the model of Lederer et al. [17] modelled material inputs and outputs in the building sector of Vienna in the future until the year 2050. However, the study did not consider to which extent recycling of the material outputs can reduce the material inputs and thus contribute to sustainable development in Vienna. To do so, a combination of the material flow scenarios from Lederer et al. [17] with recycling scenarios from Lederer et al. [30], would be inevitable. Second, the scenario-based model of Lederer et al. [17] started its calculation in the year 2016. This means that now, in the year 2024, there is already statistical data available for the years 2016–2020. These data can first of all be used to update the material flow model of Lederer et al. [17], which can be combined with the recycling scenarios from Lederer et al. [30]. Furthermore, it can serve to update the HED and GHG emissions model from Haas et al. [31]. Finally, and probably most importantly, the new statistical data can also be used to indicate the most likely scenario as a future development pathway of the building stock in Vienna.
Against this background, this study investigates the following research questions.
(1) What is the annual material input and output, the heating energy demand, and the direct greenhouse gas emissions from the heating of buildings in Vienna for a defined development pathway of the building sector in the city and the timespan 2021–2050?
(2) What are the material flows (inputs and outputs) of the most important construction materials and demolition waste of buildings in Vienna in the timespan 2021–2050, considering both enhanced vs non-enhanced domestic circular economy within the building sector with demolition waste from the city for secondary raw materials for the city?
(3) To which extent can recycling reduce the consumption-based material footprint and at the same time increase the circular material use rate of buildings in Vienna if domestic recycling in the building sector is further encouraged?
2. Materials and Methods
2.1. An Updated Model for Material Flows, Heating Energy Demand, and Greenhouse Gas Emissions of Vienna’s Building Stock
The model from Lederer et al. [17] basically consists of material intensity coefficients (MICs) in mass per reference values, in the present case kg/m² net floor area (NFA), and reference values (RVs) of different building types, in the present case given in m² NFA. Both are used to model material flows of inputs and outputs, but also for other parameters, like HED or GHG emissions. While the MICs are not changed in the model, the RVs are, since these are affected by the developments observed in the years 2016–2020.
Thus, as a first step, statistical data for the years 2016–2020 were retrieved. These data, which referred to the NFA of new constructed buildings, thermal renovation on existing buildings, attic extensions on existing buildings, and demolition of existing buildings, the latter based on demolition waste statistics, were then used twofold, namely first for defining a likely development pathway for Vienna’s buildings stock 2021–2050, and secondly for updating the material input and output model from Lederer et al. [17] with new data. These applications are discussed here in detail before we present how these updated data sets can be used to model material flows, heating energy demand, and greenhouse gas emissions of the development pathway defined.
2.1.1. Definition of a Development Pathway for Vienna’s Building Stock 2021–2050
Based on this statistical data for the years 2016–2020, Vienna more likely develops its building stock somewhere in between the aforementioned BAU-scenario and the DEMO-scenario from Lederer et al. [17]. For instance, the amount of waste generated from buildings has increased since 2016, as shown in Figure 1, while the NFA of buildings being renovated by thermal insulation remains virtually constant, as shown in Figure 2. For this study, it was thus assumed that Vienna would start in the year 2021, with the assumptions as defined in the DEMO-scenario of Lederer et al. [17]. Furthermore, it was assumed that the buildings stock of the city is gradually managed as in the BAU-scenario, which means a reduction in the number of buildings demolished but an increase in the number of buildings thermally renovated, if compared to the DEMO-scenario.
Figure 1.
Generation of concrete and debris (bricks, mortar, etc.) demolition waste from buildings generated in Vienna based on statistics from the City of Vienna [32] if compared to the amounts modelled in the scenarios by Lederer et al. [17].
Figure 2.
NFA of residential buildings renovated by thermal insulation based on statistics [32] compared to the amounts modelled in the scenarios by Lederer et al. [17].
2.1.2. Updated Material Input and Output Model by New Data
After having selected the future development pathway for buildings in Vienna until the year 2050, the model used to calculate net floor areas (NFAs) and material inputs and outputs of the building stock from Lederer et al. [17] was updated by recently published statistical data on the new construction of buildings, new attic extensions on existing buildings, new thermal insulation on existing buildings, and demolition of existing buildings. The data sources for these data sets come from national and city statistical departments [32,33,34]. These updated data from statistics, as well as the new modelled data based on these statistics, are shown in NFAs in Table 1 as well as in Tables S1–S4 in the Supplementary File.
Table 1.
Updated statistical data of NFA in m2 for the years 2016–2020, and new modelled data based on these updates for the years 2021, 2030, 2040, and 2050 for buildings in Vienna. Building categories according to their use (Residential, Service, etc.).
2.1.3. Modelling the Material Input and Output of the Updated Building Model of Vienna
By combining the data for the RVs (Table 1) by material intensity coefficients (MICs), the material flows MF were modelled after Equation (1):
in which is the material flow for the material in the year in kg/year, and is the material intensity coefficient of material for buildings distinguishing between age category , use category , and renovation status , given in kg/m² NFA. These units also indicate the reference value for different building types, which is m² NFA. For the MICs, data from Lederer et al. [17] were used (Table 3 of their article, Table A1, and S5 in this article). The RV came from the updated model (see Table 1 and Supplementary File spreadsheets “S1 Res-NFA”, “S2 Ser-NFA”, “S3 Ind-NFA”, “S4 Oth-NFA”).
2.1.4. Modelling the Heating Energy Demand of the Updated Building Model of Vienna
The updated RVs from Table 1 can also be used to determine the HED for the building stock in Vienna. For residential and service buildings, energy for floor heating is the most relevant energy consumption. The same cannot be said for other buildings where the HED is less relevant [26]. In addition, and as aforementioned, the energy consumption for other purposes is less relevant. In order to model the HED of these building types, first the gross floor area (GFA) had to be determined, since standard values for the HED are usually given in [kWh/m² GFA]. In the model of Lederer et al. [17]., the development of the building stock was given in m² net floor area conditioned () for residential buildings and m³ gross volume () for service buildings. The indices indicate the age category , use category , and renovation status of buildings. Both data can be found in Lederer et al. [17]. For the reference values, Lederer et al. [35] provided conversion factors in order to convert from to (see Equation (2)).
The data for the NFA are in Table 1. The data came from analyzing 256 buildings of different ages, sizes, and uses in Vienna [35]. The values are shown in Table 2.
Table 2.
Updated statistical data for the years 2016–2020, and new modelled data based on these updates for the years 2021, 2030, 2040, and 2050 for buildings in Vienna.
After converting the RVs of the building stock into m² GFA, the floor HED for the timespan 1991–2050 were modelled. This was performed by multiplying the specific floor HED of each building class by the reference value. The total floor heating energy demand per year, given in [kwh/yr], was calculated, as shown in Equation (3).
where is the heating energy demand of each building type per m² GFA in [kwh/m² GFA/yr] and is the reference value, both distinguishing between age category , use category , and renovation status . The is given in [m² GFA] and can be found in the Supplementary File spreadsheets (“S1 Res-NFA”, “S2 Ser-NFA”, “S3 Ind-NFA”, “S4 Oth-NFA”). Values for are shown in Table 2 and the Supplementary File spreadsheet (Table “S7 Heating-energy data” and “S8 Heating-energy-carrier”).
2.1.5. Modelling the Greenhouse Gas Emissions of the Updated Building Model of Vienna
After determining the HED, it is possible to calculate the direct GHG emissions. Note that in contrast to Haas et al. [31], indirect and embodied GHG emissions are not considered, which is in line with the Smart Climate City Strategy Vienna [22]. The corresponding indicators are the GHGs for supplying the buildings with different energy carriers for heating . According to the Smart Climate City Strategy Vienna, only these direct GHGs are to be considered, while the GHGs associated with the provision of materials are not. The calculation was performed as in Equation (4):
where is the greenhouse gas emissions in kg CO2-equivalent from the heating energy demand of different energy carriers for heating multiplied by the emission factors of all of these energy carriers . The data for the distribution of the total heating energy demand to the enegy carriers came from Veigl et al. [26], who modelled one heating energy consumption pathway for Vienna until the year 2050. Even though Veigl et al. did not consider recent ambitions to achieve carbon neutrality until 2040, the results give an impression of the additional steps required. Using these data, the HED and its distribution to energy carriers and heating systems was estimated, as shown in the Supplementary File (spreadsheet “heating-energy-carrier”). Emission factors were taken from Austria’s Environment Agency [40], shown in the Appendix A Table A2.
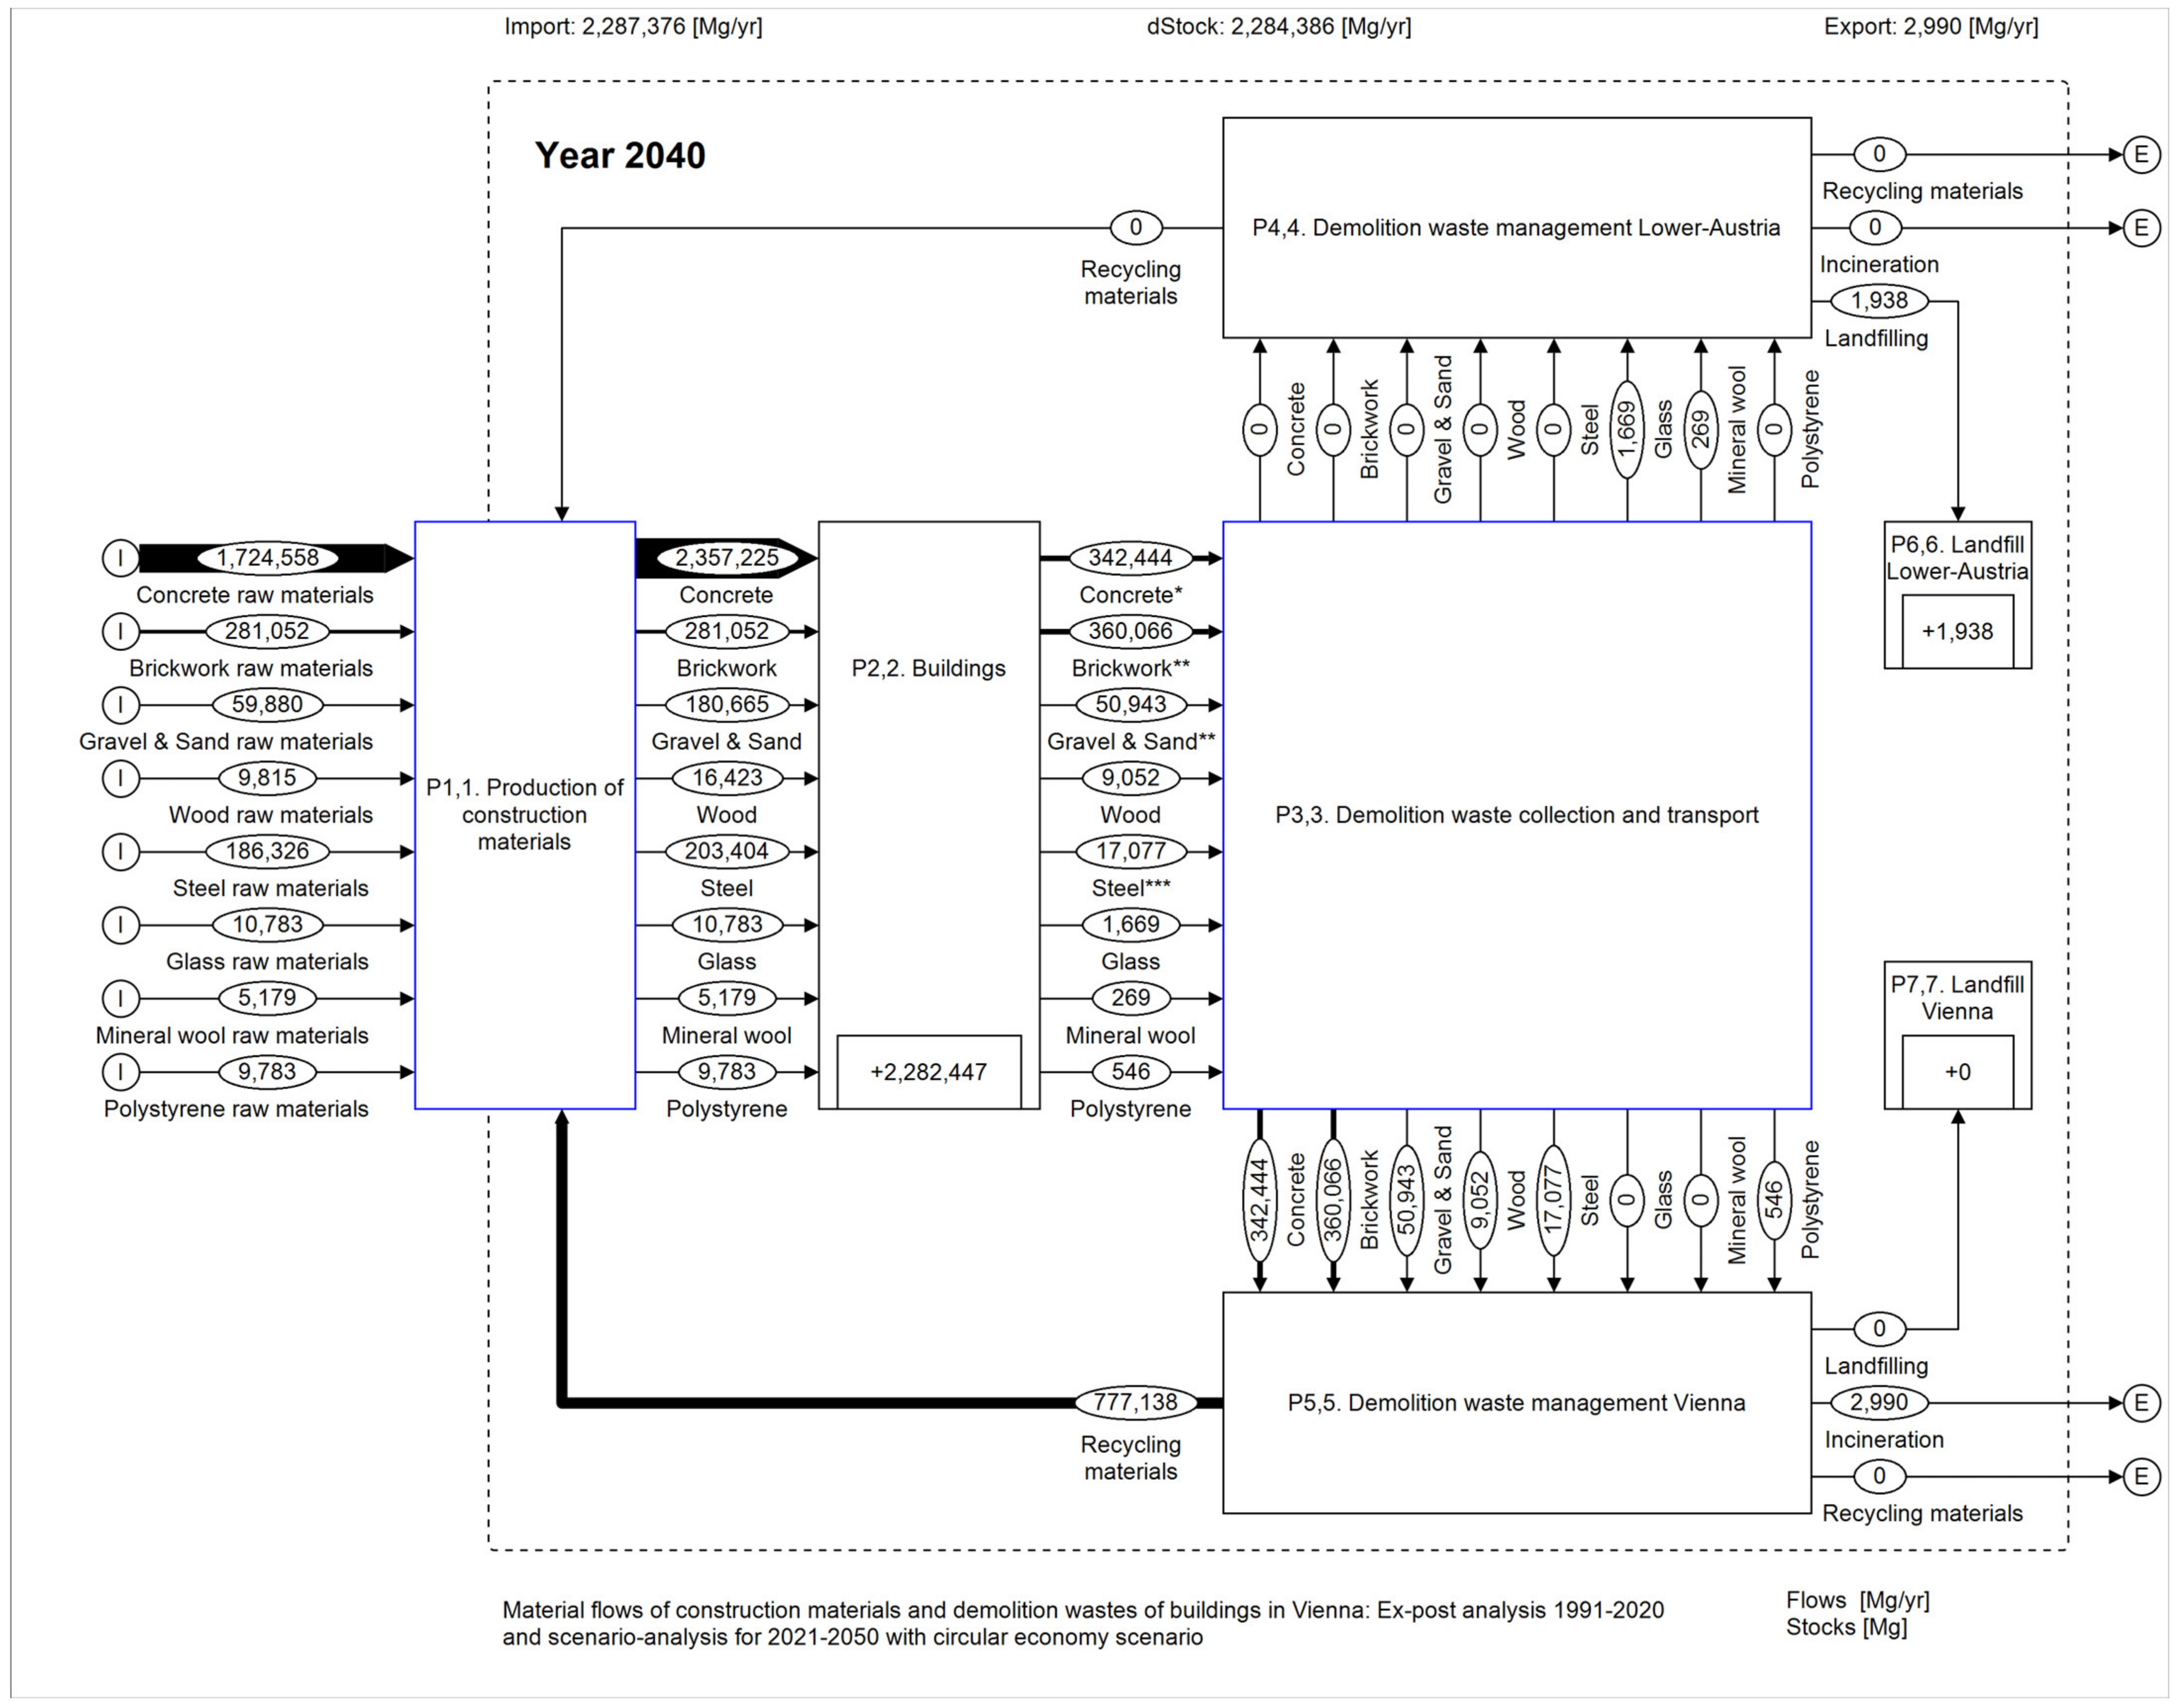
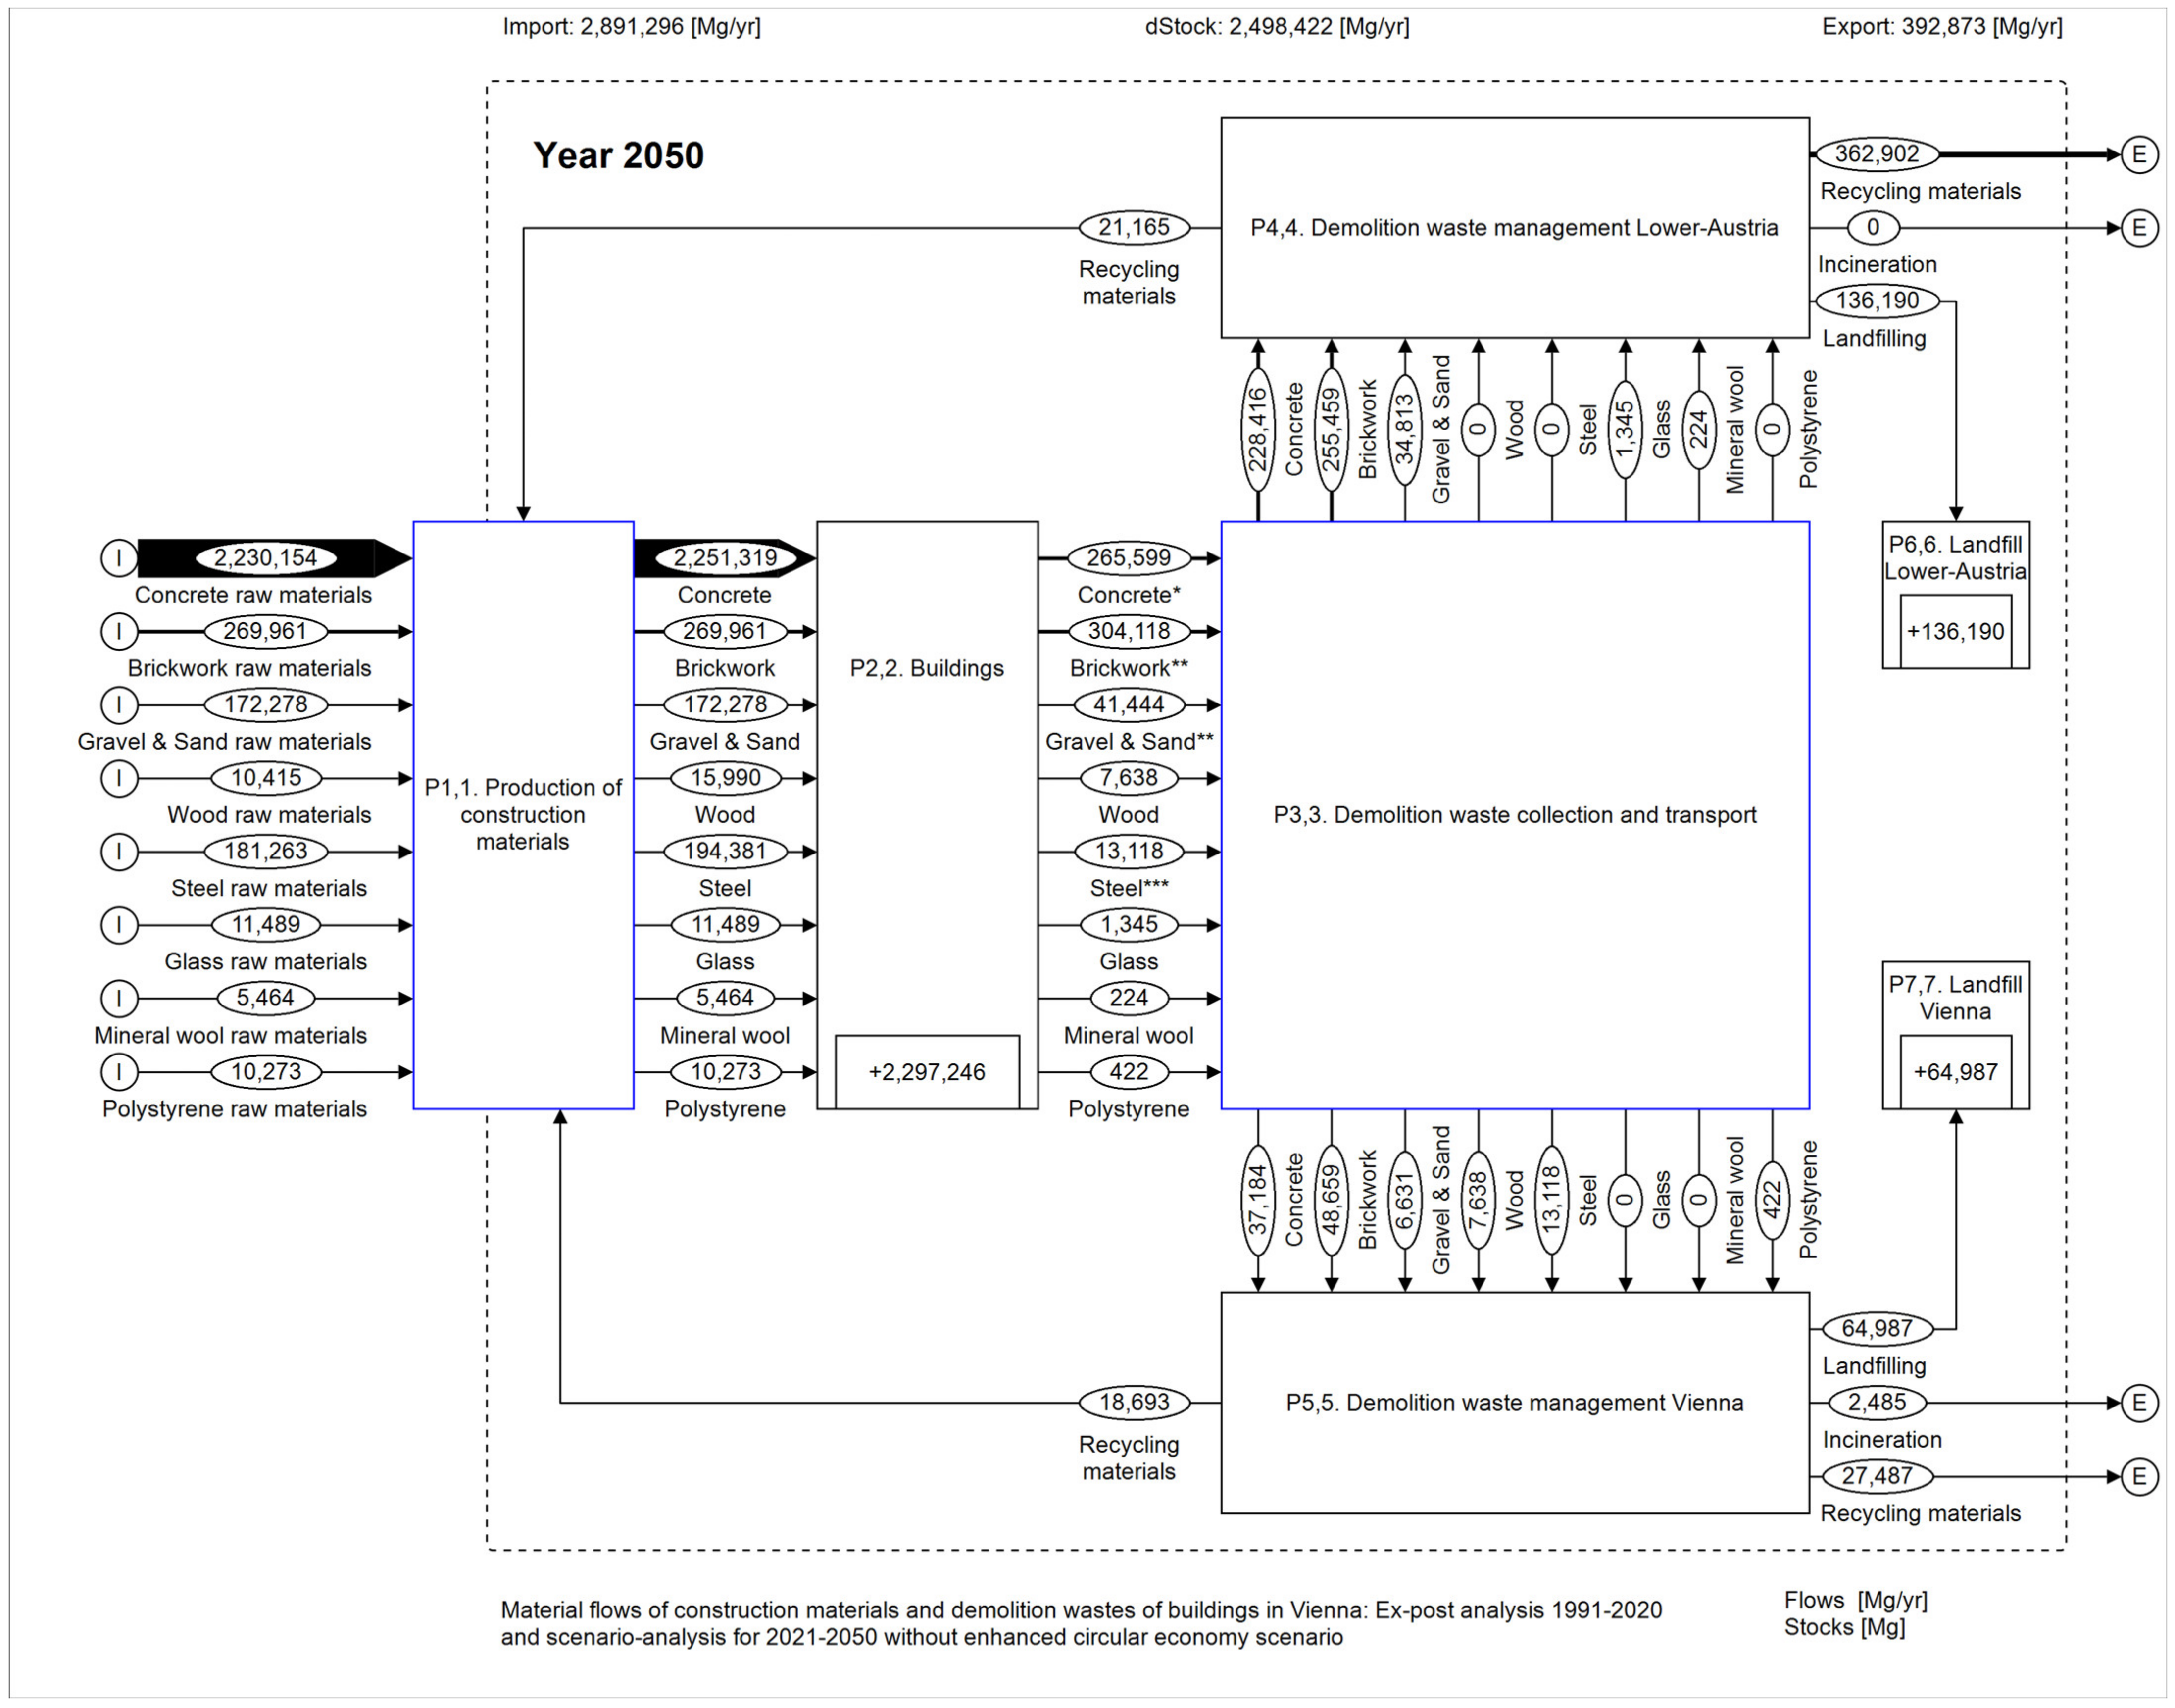
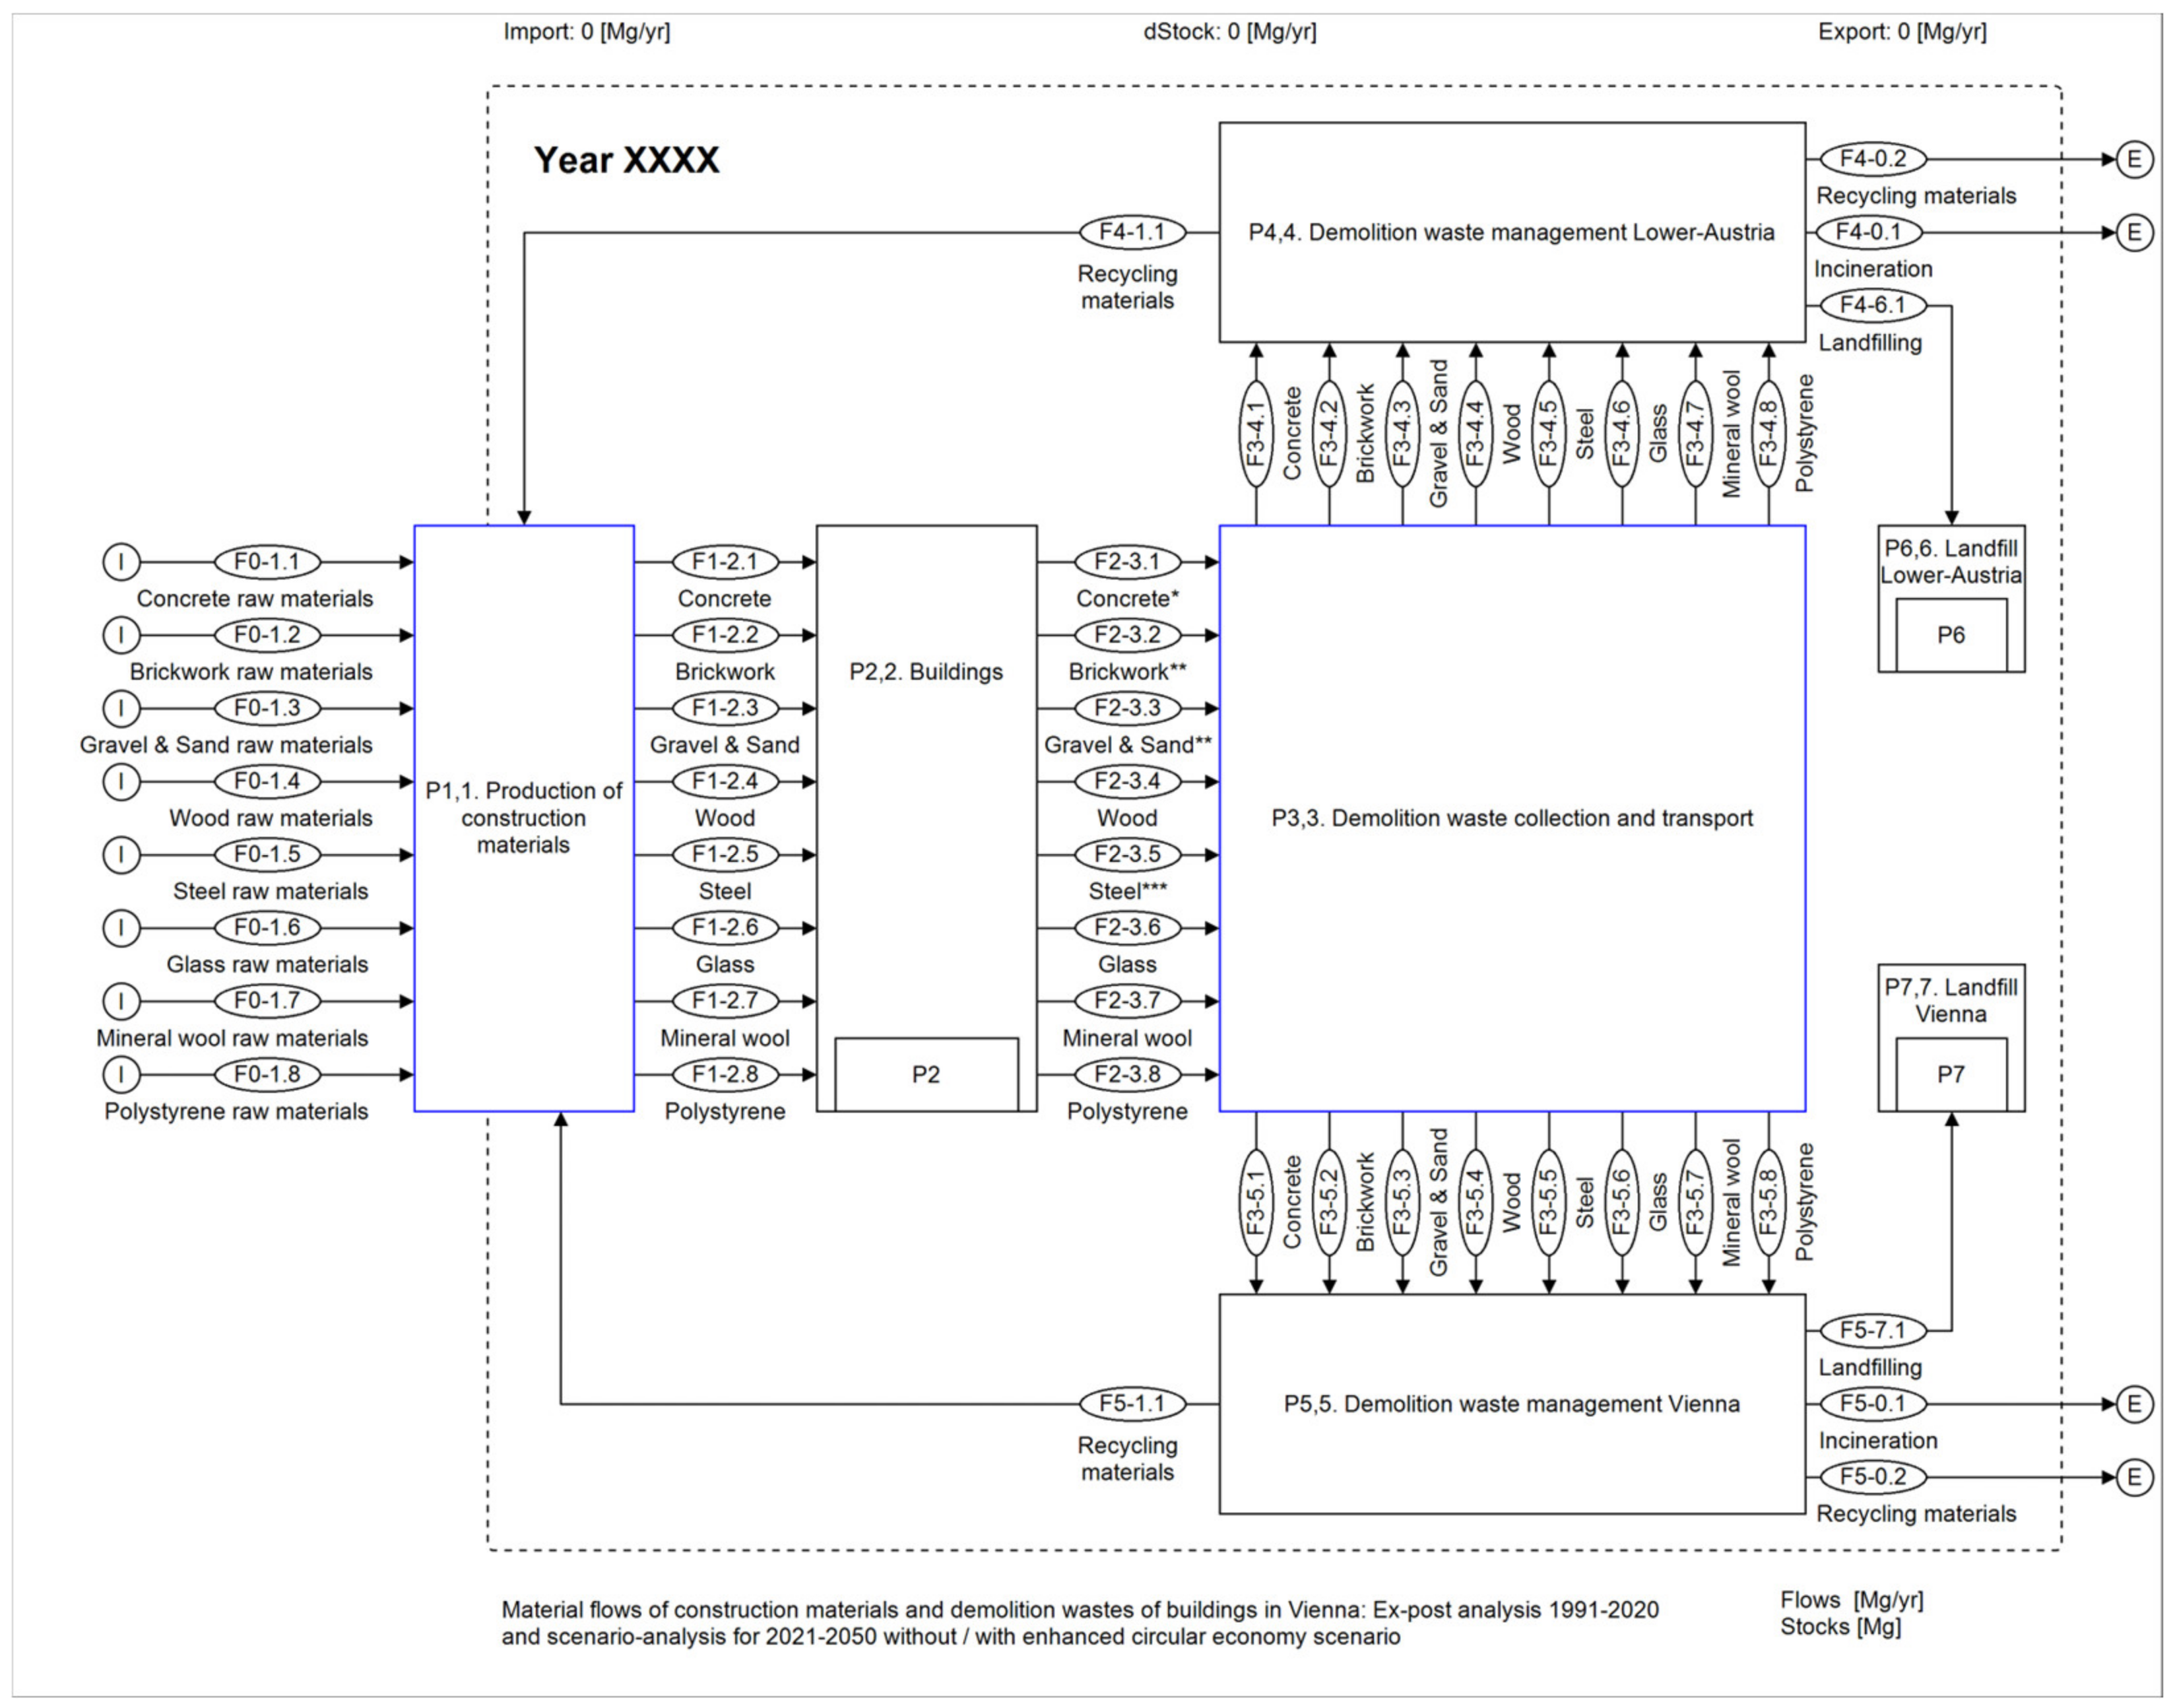
2.2. Modelling the Material Flows of Construction Materials and Demolition Waste of the Updated Building Model of Vienna Considering Non- and Enhanced Circular Economy Scenarios
For modelling the material flows of construction materials and demolition waste in the updated building model of Vienna, material flow analysis (MFA) after Brunner and Rechberger [41] was used. Two types of MFA models were calculated. The first does not consider an enhanced local circular economy in the building sector but assumes that demolition waste from Vienna are either exported to the neighbouring federal state of Lower Austria or recycled to other sectors than building construction. The second is an enhanced local circular economy scenario that assumes the maximum treatment of demolition waste in Vienna to produce secondary raw materials to be used in Vienna’s building sector.
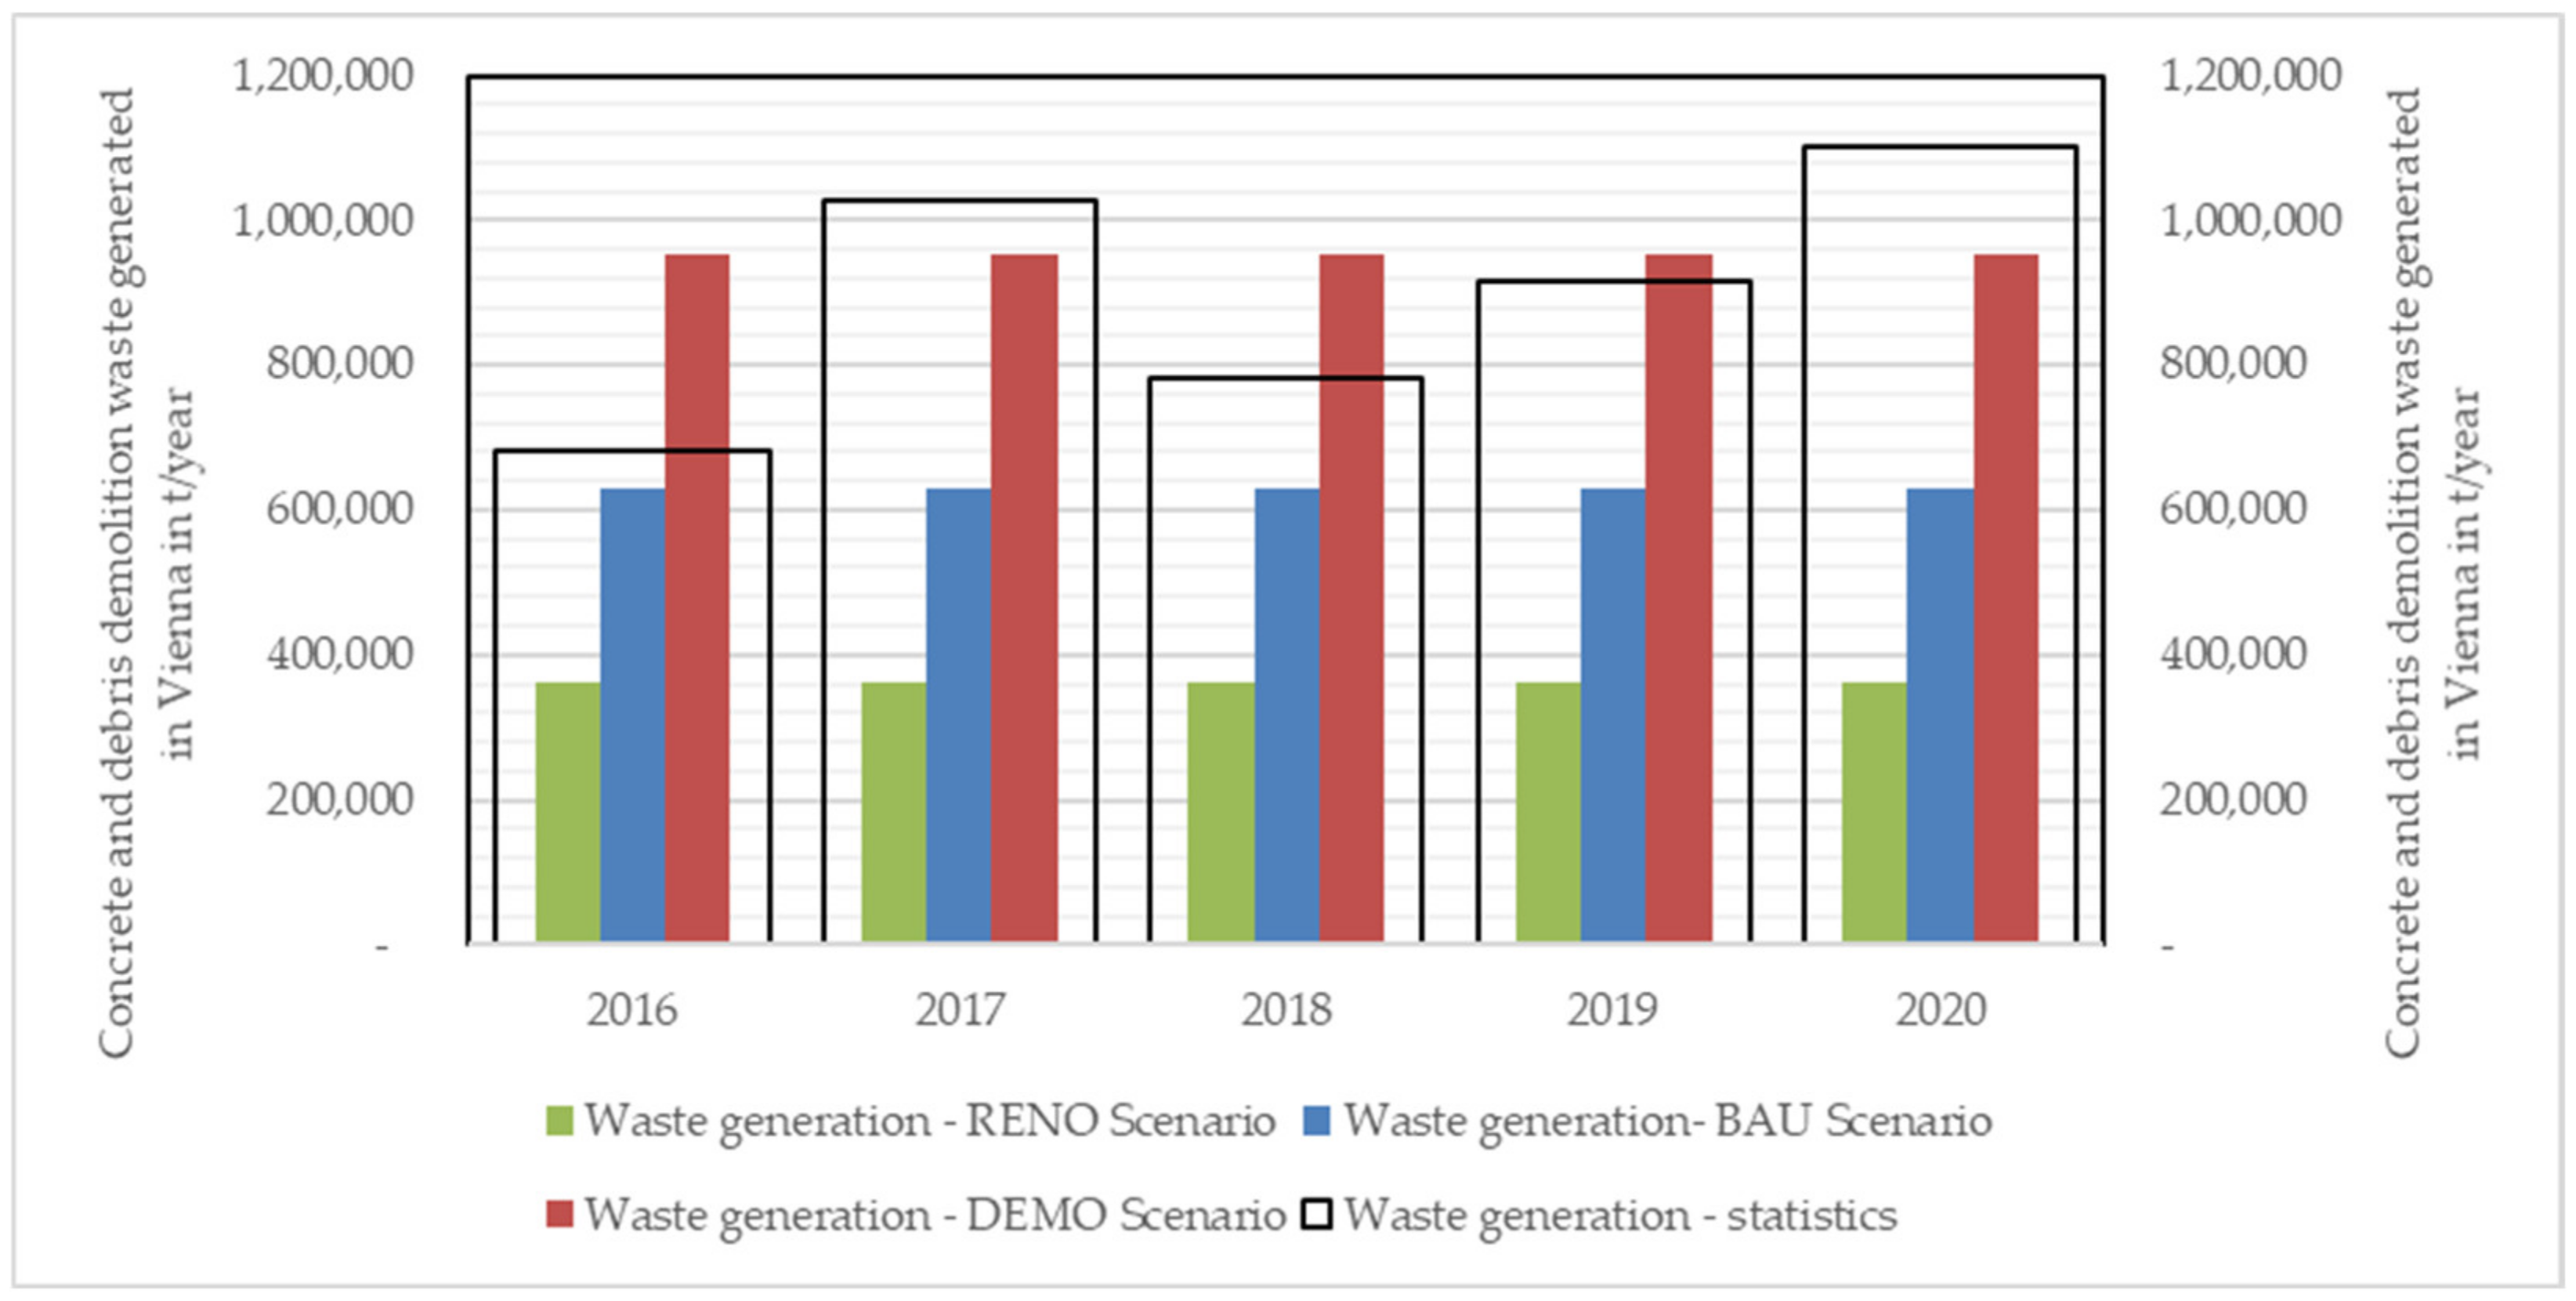
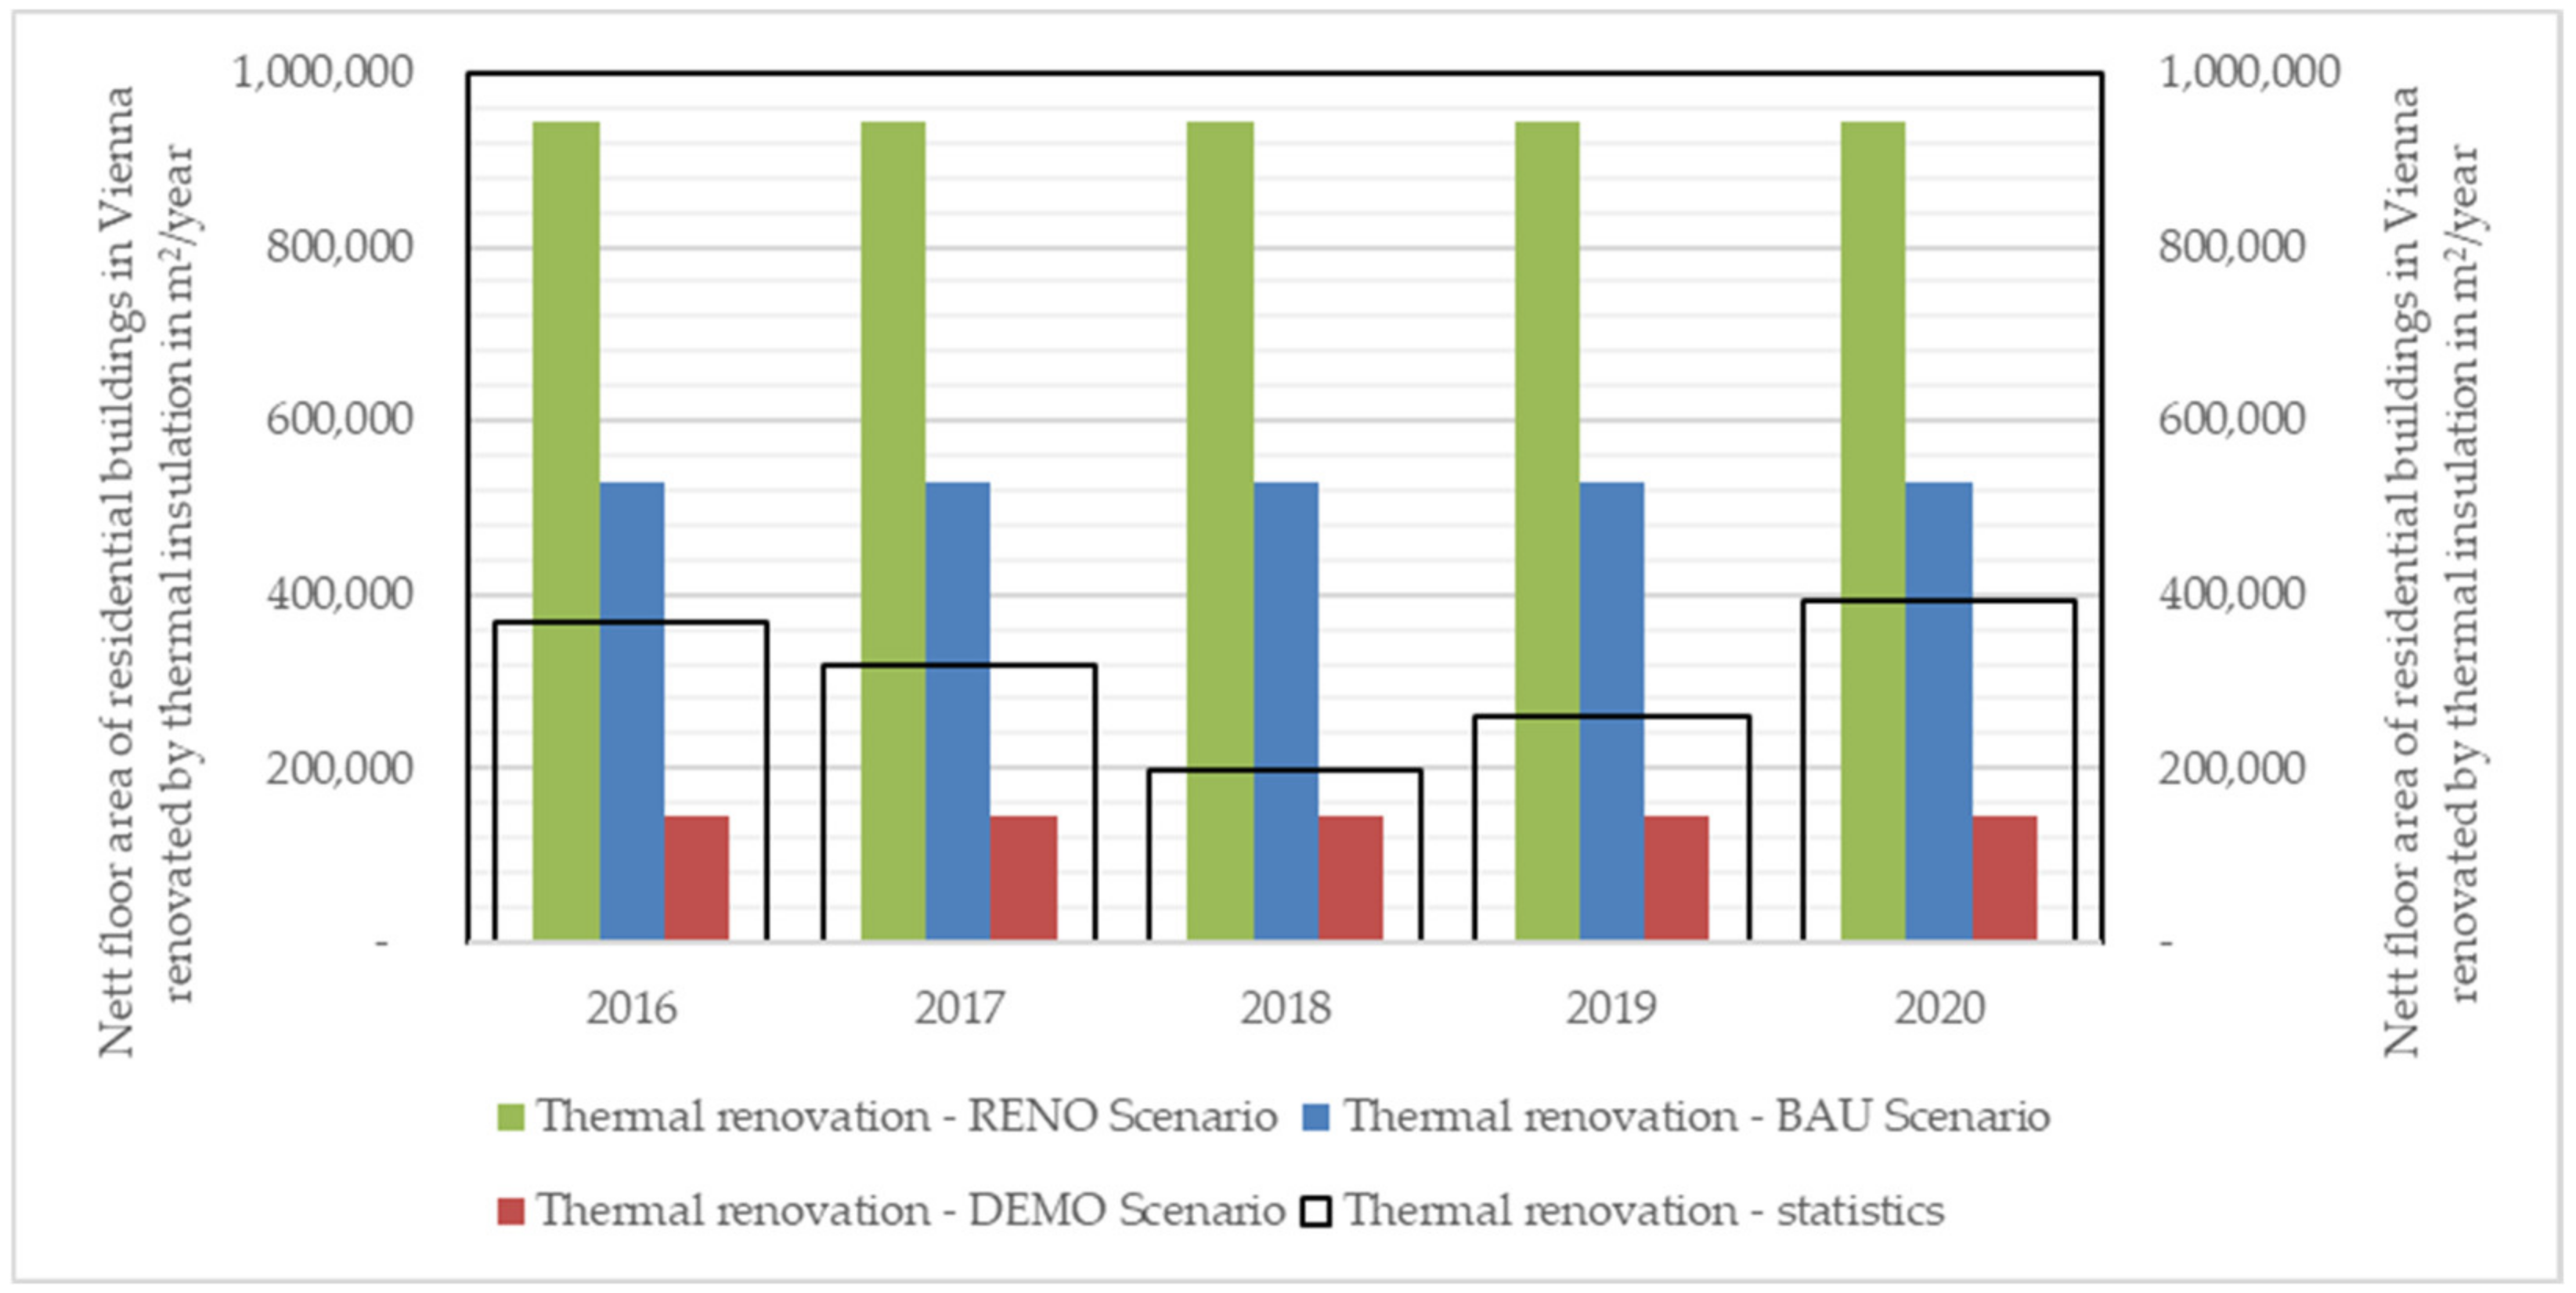
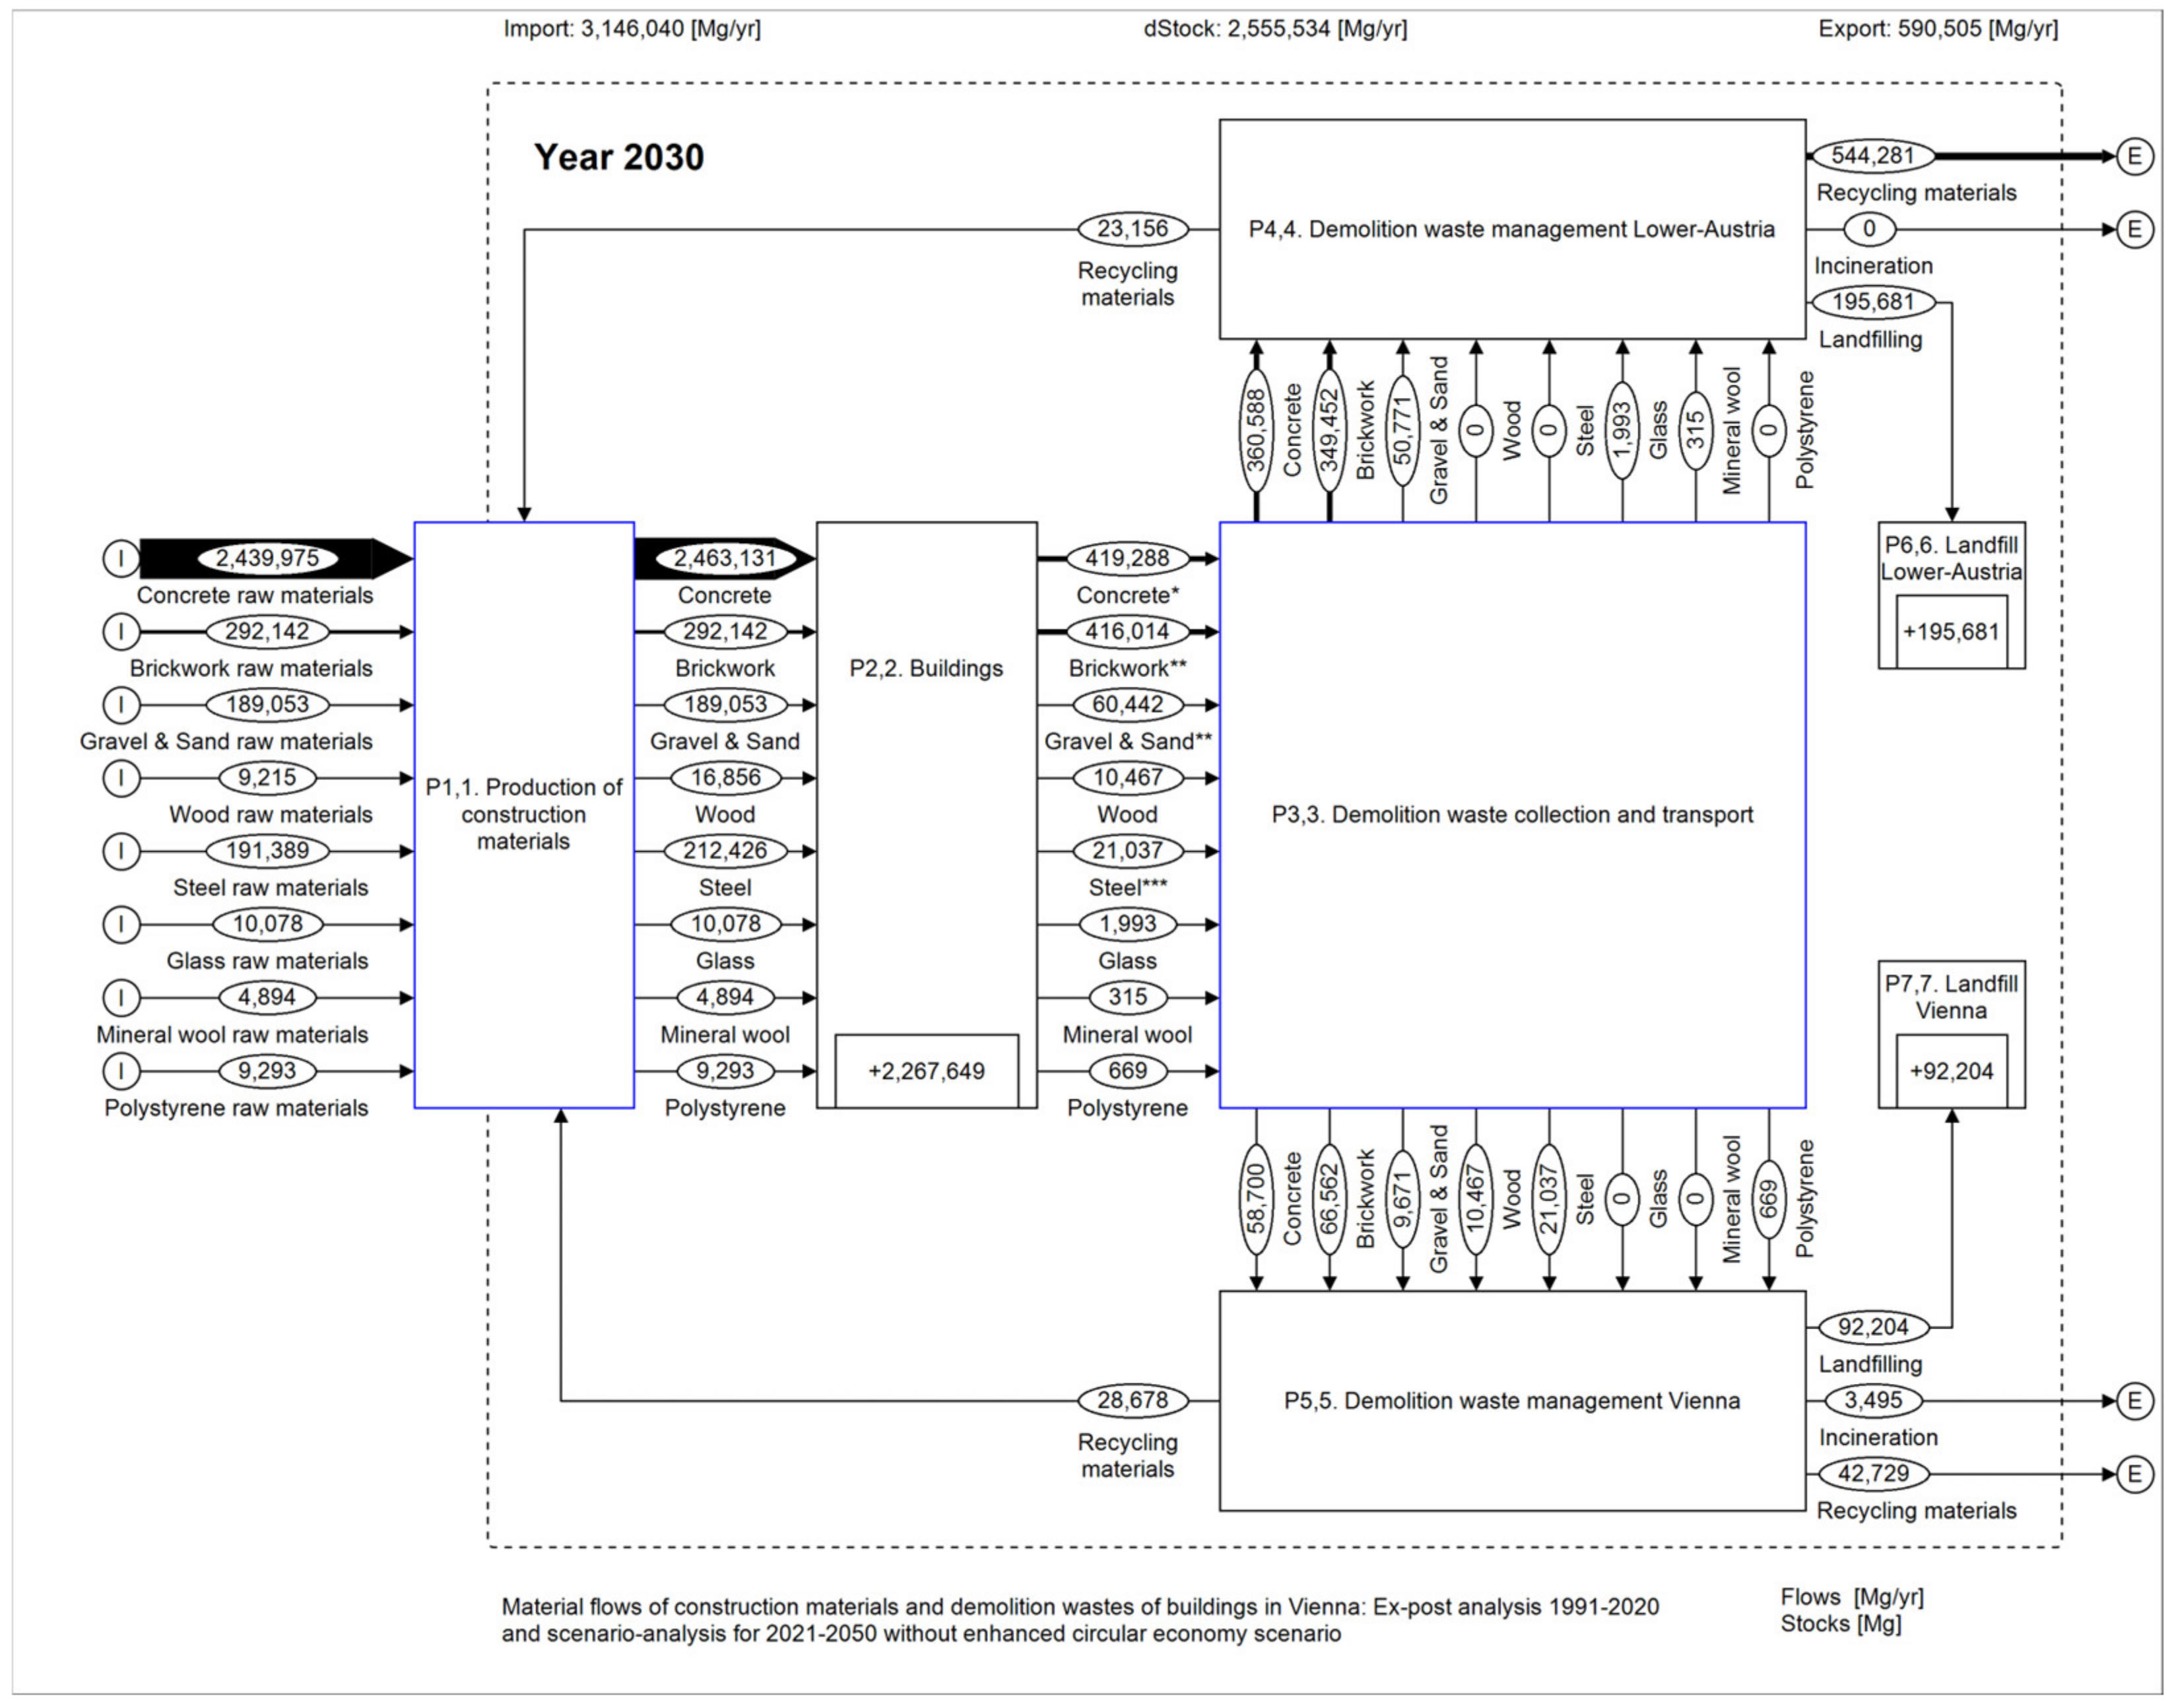
2.2.1. Material Flows of Construction Materials and Demolition Waste without Local Circular Economy in the Building Sector
The MFA model, which is shown in Figure 3, consists of seven processes, starting with 1. Production of construction materials and 2. Buildings. The inputs of construction materials into both processes are assumed to be the same, meaning that losses, for instance by clinker burning for cement, are not considered here. The material inputs of construction materials and outputs of demolition waste come from the updated material input and output model (see Section 2.1.3). The latter (material outputs of demolition waste) form the input into process 3. Demolition waste collection and transport, in which the demolition waste are distributed to the processes 4. Demolition waste management Lower Austria and process 5. Demolition waste management Vienna. The relevant data were taken from the waste management plan of Lower Austria [42]. In Lower Austria, the bulk of demolition waste are recycled, mainly in road construction in Lower Austria [30,42,43], while a smaller share is landfilled (process 6. Landfill Lower Austria). The incineration of demolition waste from Vienna in Lower Austria is of low relevance. The reason is that Vienna has the largest waste incineration capacity in Austria and imports rather than exports combustible waste. In Vienna, based on information from the only two operators of demolition waste treatment plants and landfills (ContraCon and LangesFeld [44,45]), a higher share of demolition waste is landfilled than in Lower Austria, while a smaller amount is recycled, also mainly in road construction. With respect to recycling, there is only a relevant backflow of demolition recycling materials generated in Vienna and used in Vienna (flow F5-1.1). This flow consists of brickwork contributing 10% of material demand in the cement industry [46], steel scrap which is entirely used to produce new steel, and waste wood of which 73% is recycled in new wood products [47].
Figure 3.
MFA model for buildings in Vienna. Concrete * from demolition can be present in concrete waste or debris waste, the latter being a mix of mineral demolition wastes. Brickwork ** consists of bricks, mortar, and plaster, and is like Gravel & Sand ** present in debris waste. Steel *** consists of construction steel and rebar.
2.2.2. Material Flows of Construction Materials and Demolition Waste with Local Circular Economy in the Building Sector
The MFA model for the local circular economy scenario is the same as in Figure 2. However, the difference is that there is a much stronger link between Vienna’s demolition waste management and the construction industry of the city. This particularly counts for the mineral demolition waste of concrete, brickwork, and gravel and sand, which are, like the aforementioned steel and wood, also sought to be recycled in buildings in Vienna. Based on the strategies as defined in Lederer et al. [30], mineral demolition waste from buildings in Vienna are treated in Vienna or its vicinity, in order to produce recycling materials such as recycling aggregates from demolition waste concrete, debris, gravel and sand to be used in concrete, secondary raw materials from debris to produce cement, recycling aggregate from demolition waste debris for unbound use (e.g., as filler on flat roofs), or recycling wood and steel products (material flow F5-1.1 in the MFA-model in Figure 3). These strategies consider technical and legal limits for the use of recycling materials. In detail, these limits foresee that concretes (material flow F1-2.1 in Figure 2) can consist either of 29% recycling aggregate from demolished and processed concrete or gravel and sand, or 17% of recycling material from the coarse fraction of demolished and processed brickwork. According to the literature, all cements can consist of 20% of demolished and processed fine fractions of brickwork [48], instead of 10% as assumed based on data from Mauschitz on the current practise in the Austrian cement industry [46]. As before, waste steel can be recycled at 100% to steel (material flow F1-2.4) and waste wood (material flow F1-2.5 in Figure 3) can be recycled at 73% of the waste generated. The remaining wood is incinerated, due to its low quality [47]. For other waste such as glass, mineral wool, and polystyrene, no recycling is assumed, which has to do with lack of data, quality limitations, but also contents of potentially hazardous materials such as asbestos in mineral wool or CFCs in polystyrene. In Austria, however, these hazardous materials are usually removed manually before demolition [30]. Furthermore, reuse is not considered, since its contribution to a circular economy of construction materials considered in this study is negligible [30].
2.3. Assessing the Scenarios without vs. with a Local Circular Economy of the Updated Building Model
In accordance with Vienna’s and Austria’s circular economy and waste management legislation and strategies, the following indicators were used for the sustainability assessment of both the scenarios defined in Section 2.2.
2.3.1. Heating Energy Demand (HED)
The first indicator is the HED in MWh/capita/yr and calculated as in Equation (3). The results for this indicator are not influenced by the circular economy scenarios. The HED is calculated for the years 1991–2020 ex-post and for 2021–2050 scenario-based, and the results are indicated for the years for which a HED reduction target in comparison to the base value (average annual value for the timespan 2005–2010) was aimed to be achieved in the Smart Climate City Strategy Vienna. This counts for the years 2030 (−20%) and 2040 (−30%). These reduction targets are similar to the modelled transition scenario for Austria by the Umweltbundesamt [29]. Not considered as a benchmark here in this study are any reduction targets of the Integrated National Energy- and Climate Plan, since this document was not ratified by the relevant parties in Austria, meaning that it is likely to be subject to changes before coming to force.
2.3.2. Direct Greenhouse Gas Emissions from Heating
The second indicator is the direct GHG emissions from heating, which are calculated as shown in Equation (4), Section 2.1.5. The results for this indicator are not influenced by the circular economy scenarios, since only direct GHG emissions from heating are considered in the Smart Climate City Strategy Vienna. The GWP is calculated for the years 1991–2020 ex-post and 2021–2050 scenario-based, and the results are indicated for the years for which a GWP reduction target existed in comparison to the annual average of the years 2005–2010. This counts for the years 2030 (−30%) and 2040 (−100% GHG per capita).
2.3.3. Total Material Requirement
The second metric for the consumption-based material footprint is the total material requirement (TMR). For calculation of the , data on construction material consumption, i.e., the material flows for the different materials , were modelled as shown in Section 2.1.3. Recycling materials substituting raw materials were subtracted, considering characterization factors for raw materials () and recycling materials () after Mostert and Bringezu [49]. Like in Watari et al. [50] and Oliveira Neto et al. [51], data for the came from the Wuppertal Institute [52]. The same data were also used to calculate and monitor the TMR of Vienna in the Smart Climate City Strategy Vienna [25]. Table A2 provides an overview not only of the GWP emission factors, but also of the TMR characterization factors as used in this study. The calculation was performed using Equation (5):
In detail, is the material flow input into processing P2 Buildings that can be substituted by recycling materials, and is the material flow of recycling materials. It is assumed that these recycling materials, summarized in material flow F5-1.1 in the MFA model in Figure 3, consist of first recycling aggregate from demolished concrete, brickwork, and gravel and sand, substituting natural aggregate to produce concrete or an unbound form (as filling material); second, the fine fraction of processed brickwork to be used for the production of cement for concrete; third, demolished steel that can be used to produce steel; and fourth, demolished wood that can be used to produce wood fibre boards. For details on these recycling routes, see Lederer et al. [30].
The was calculated for the year 2019, which is the base year, and for the years 2021–2050 on a scenario basis. The results are indicated for the years with a reduction target, namely 2030 (−30%), 2040 (−40%), and 2050 (−50% of the per capita if compared to the year 2019). The unit is Mg/capita/year.
2.3.4. Circular Material Use Rate
An important indicator in Austria’s Circular Economy Strategy [53] is the circular material use rate (CMUR), which is the content of recycled materials in products. The CMUR is usually calculated for economic entities, like national states. For these, only recycling materials originating from the entities are considered, but not recycling materials which are imported [54]. For a particular sector, like buildings, and a not national but regional entity, like a federal state, there are no general guidelines for calculating the CMUR. For this reason, the CMUR for buildings in Vienna is calculated as defined in this study by Equation (6).
where is the material input calculated after Equation (1) (Section 2.1.3) and is the recycling material provided to cover parts of this material input for material in year . In the MFA model in Figure 3, equals material flow F5-1.1 Recycling materials, while is the sum of the material flows F1-2.1 to F1-2.8, which are construction materials such as concrete, brickwork, etc. Recycling materials that may come from outside Vienna or recycling materials that origin from sectors other than buildings are not counted.
3. Results and Discussion
The results section first shows the model result based on the updates (Section 3.1), then the material flows considering demolition waste management (Section 3.2), and finally the sustainability assessment of Vienna’s building sector (Section 3.3).
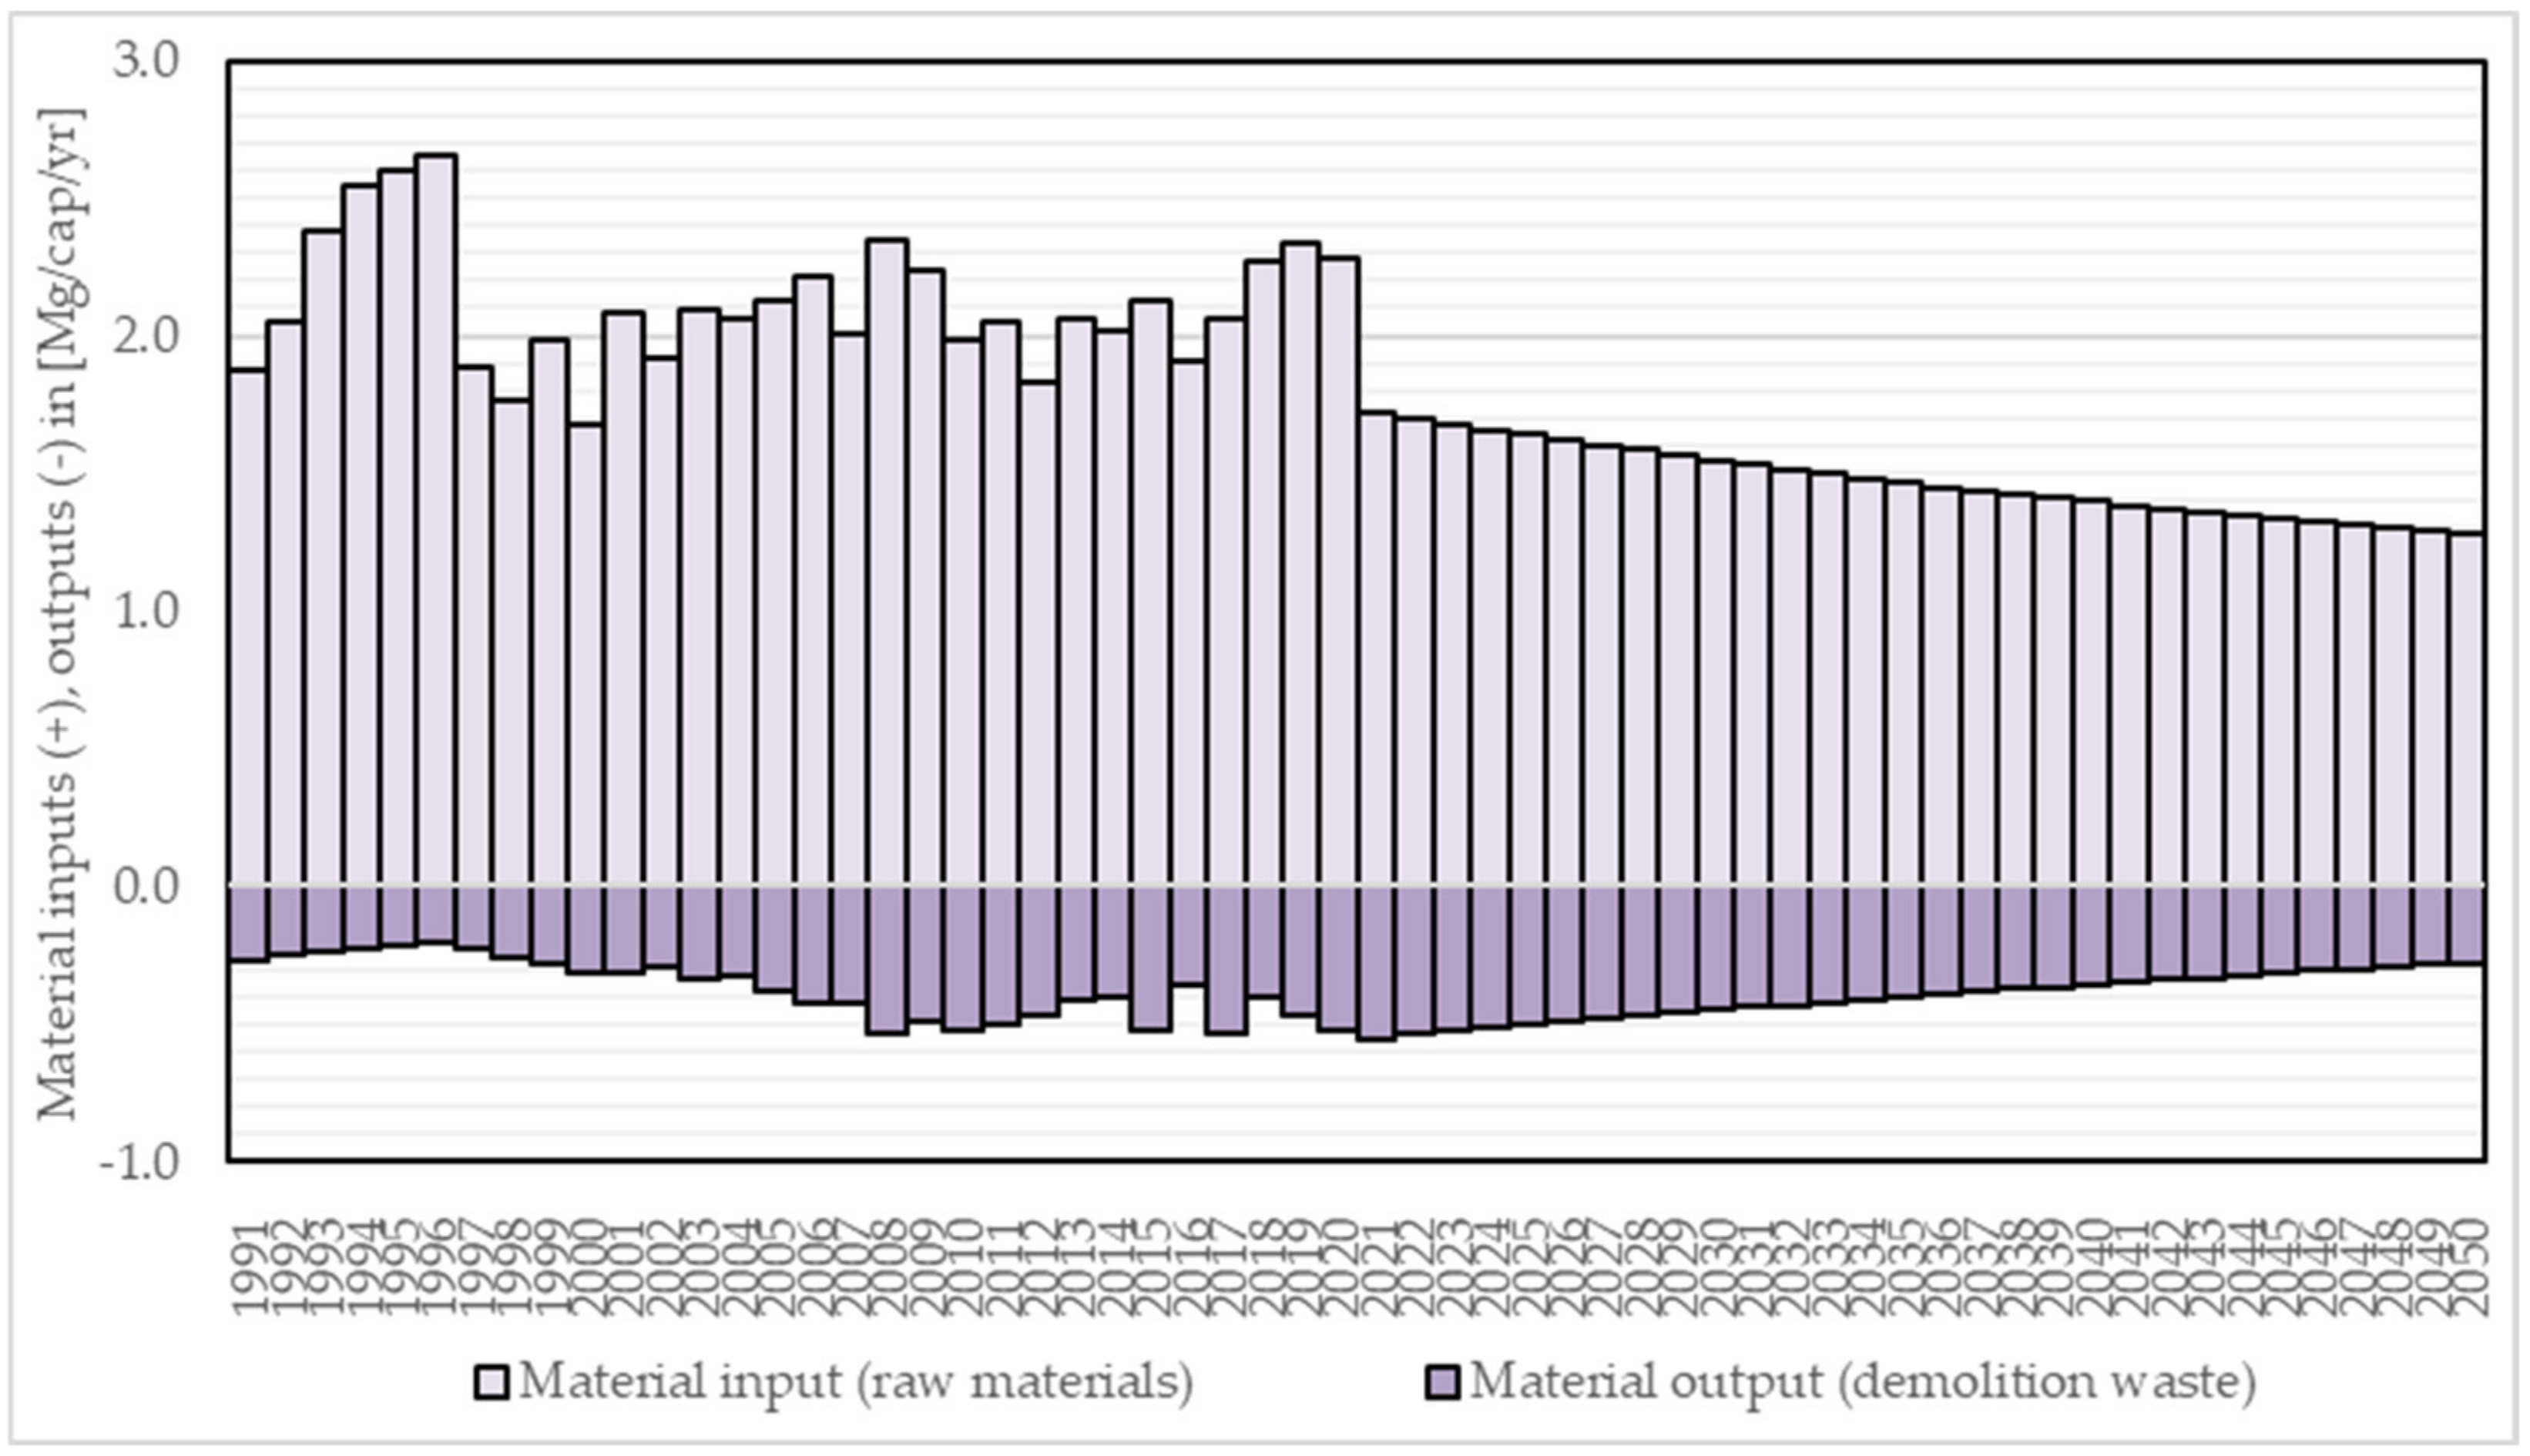
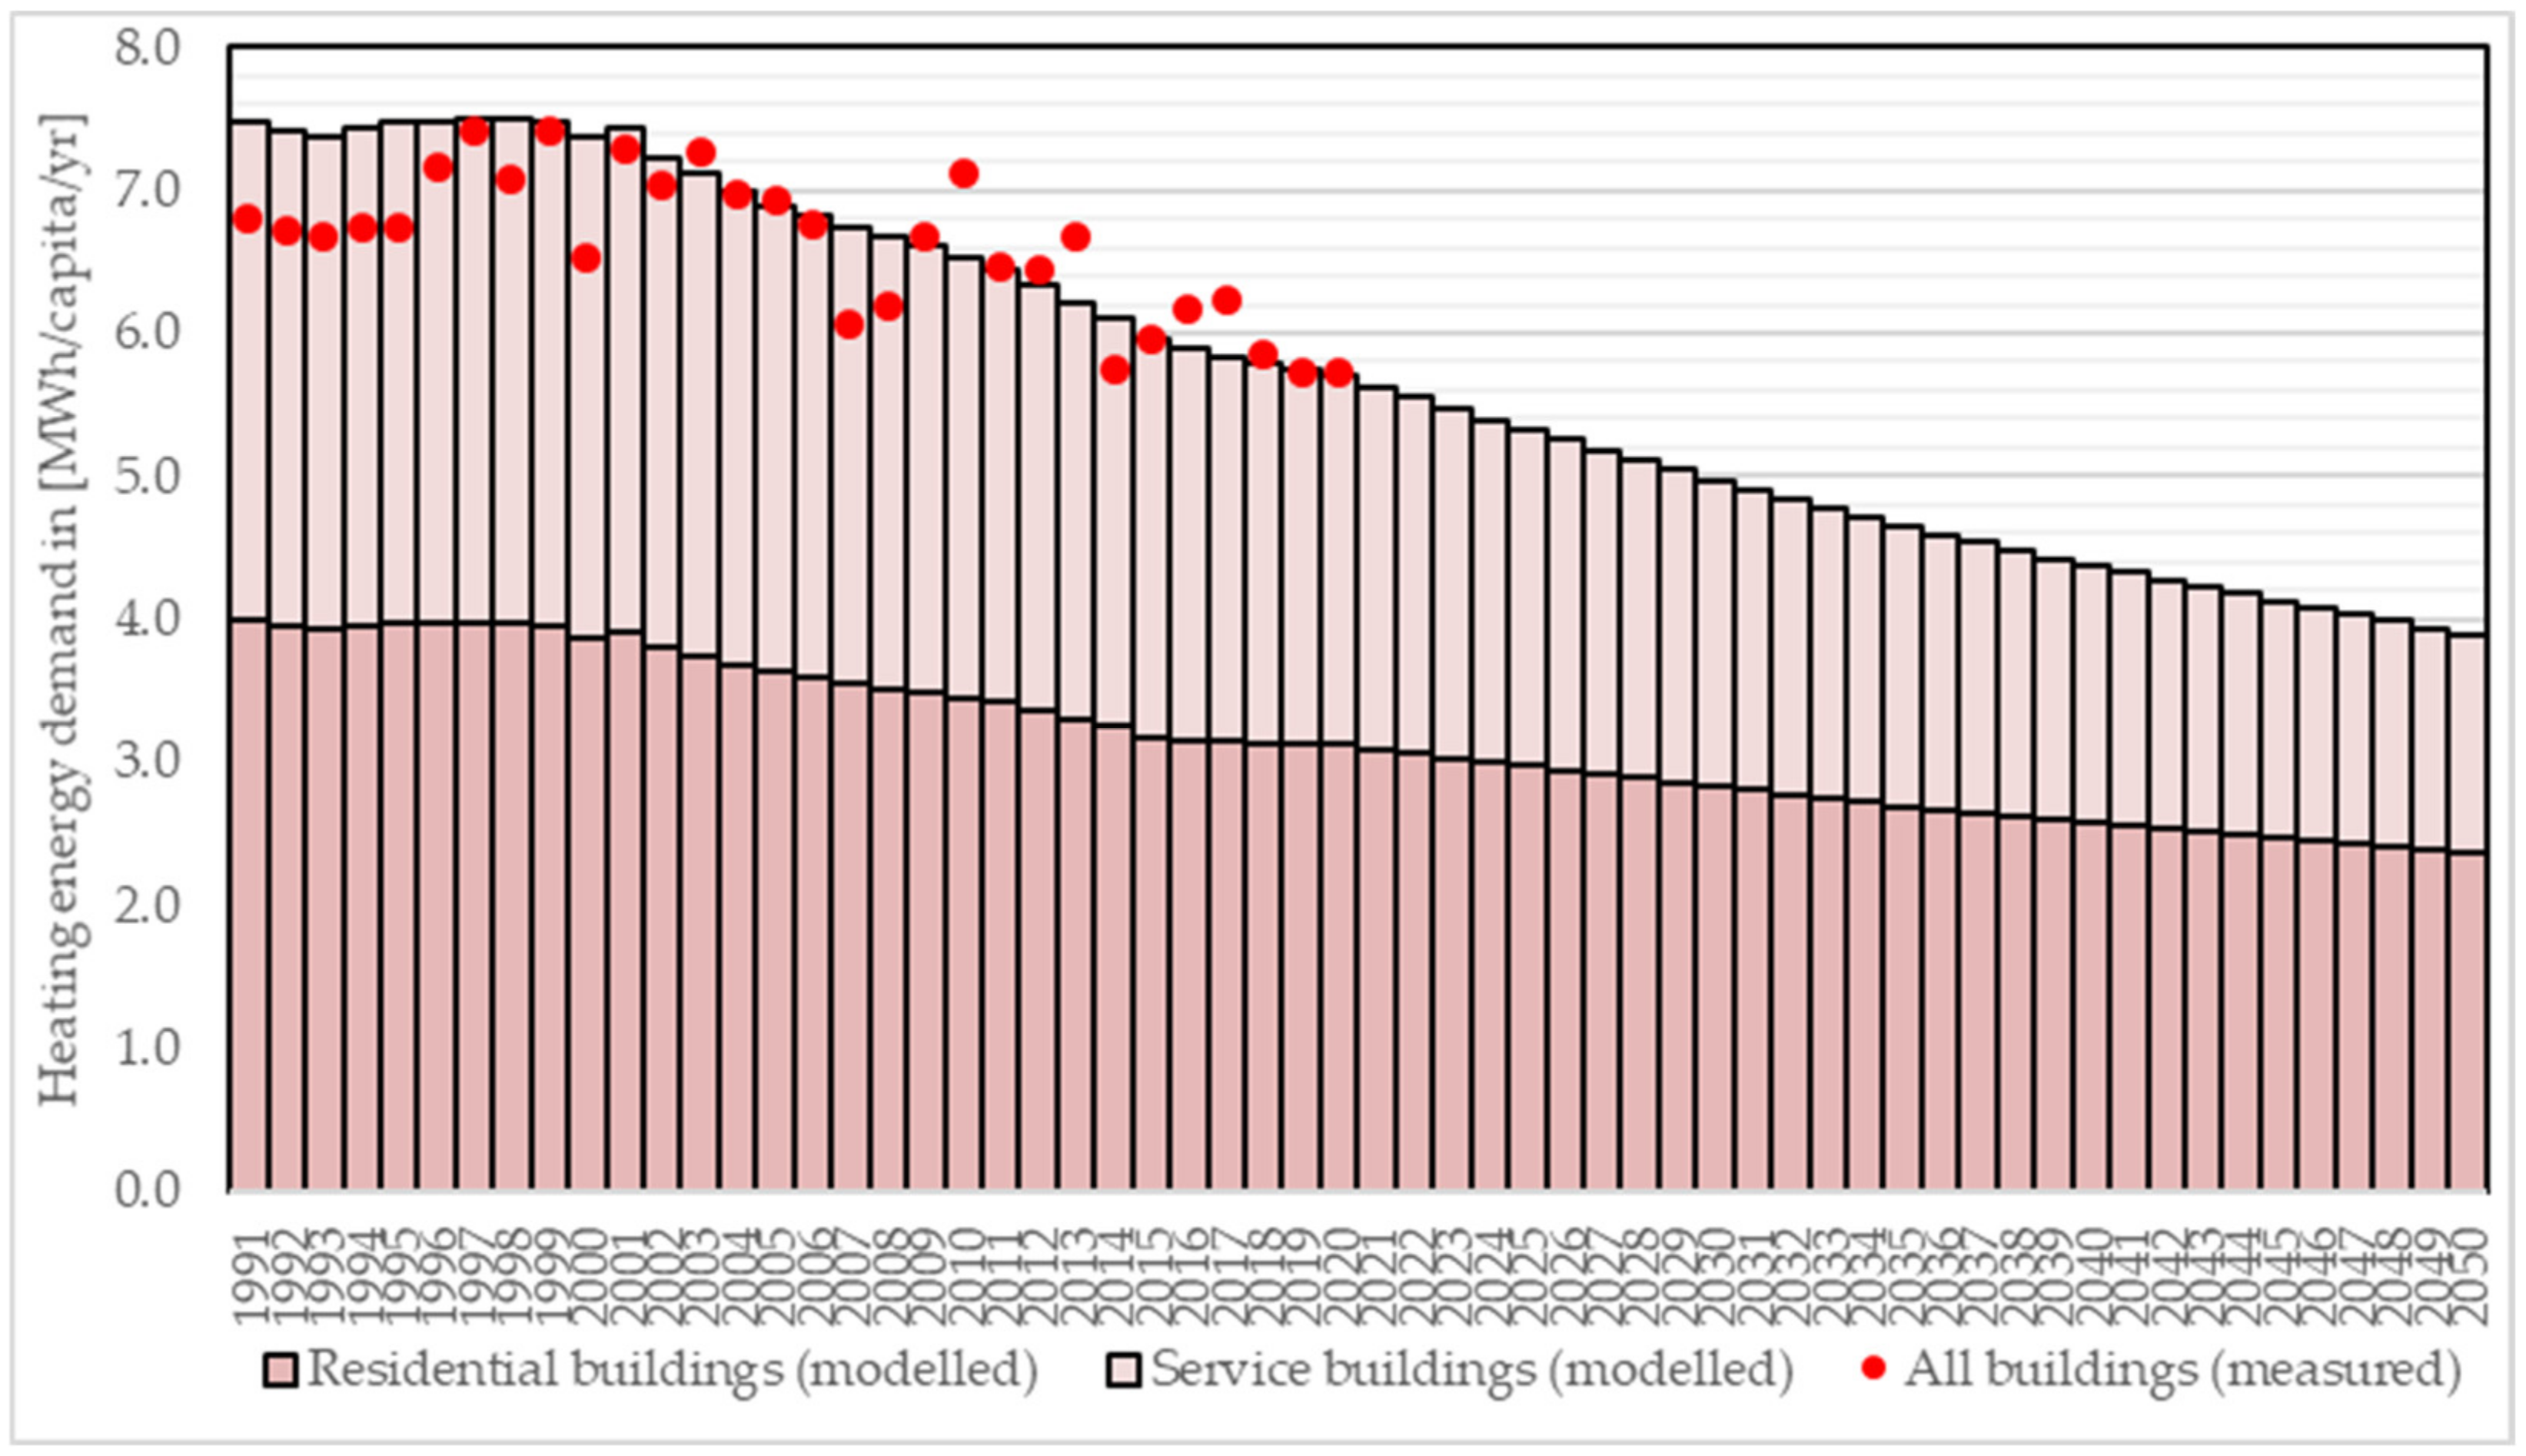
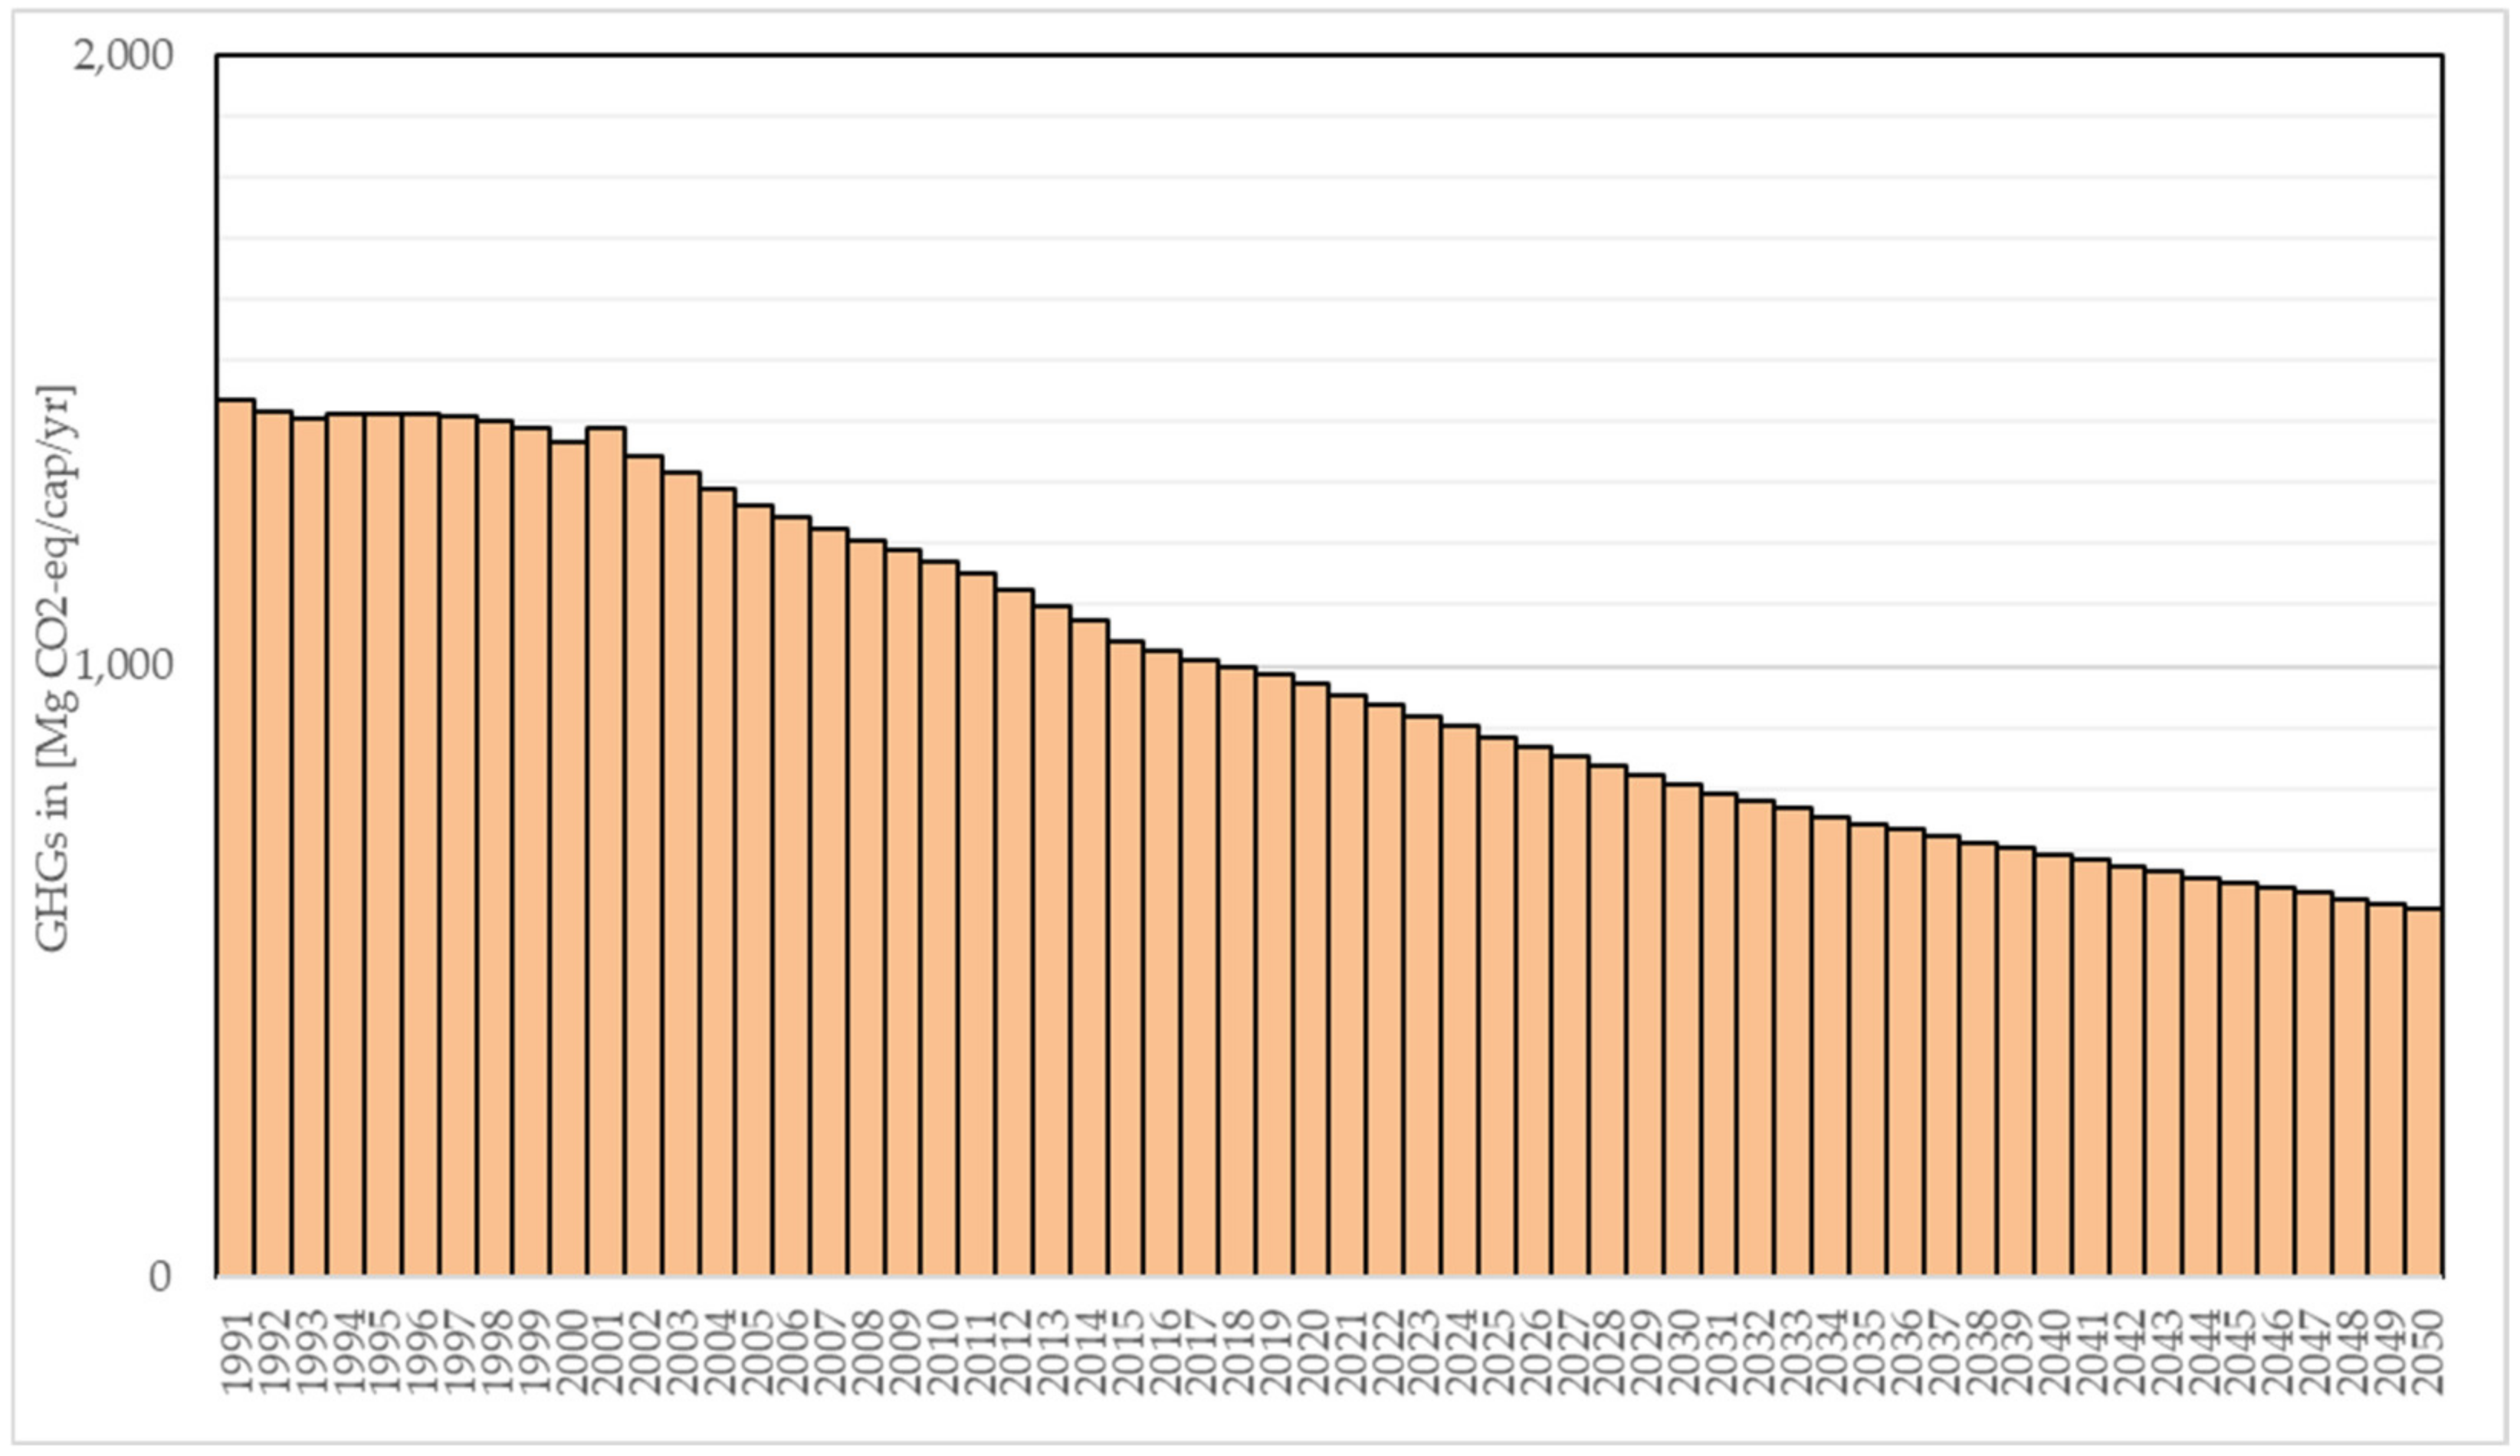
3.1. Updated Material Inputs and Outputs, Heating Energy Demand, and Greenhouse Gases of Vienna’s Building Sector
The updated material input and output model is shown in Figure 4 and in the Supplementary File spreadsheet (Table “S11 Results per-captia”). Even though it was assumed that the scenario 2021–2050 follows the DEMO-scenario from Lederer et al. [17], the material input after 2021 is smaller than in the preceding years. The reason for this is that it was assumed that the NFA per person remains constant, while it was expanded in recent decades. This influences the material inputs. In other studies, particularly Heeren and Hellweg for Switzerland and Soonsawad et al. for Canberras, decreasing material inputs in the building stock were also predicted [55,56]. The reasons for this are manifold, including population decrease in the case of Switzerland, but also a saturation of the building stock in both cases. On the output side, the amount of waste from the demolition of buildings starts with a high value, which is reduced until 2050 to a level that was experienced in the year 2001. This is in contrast to the assumptions from Heeren and Hellweg, who assumed higher material outputs in the future, caused by the refurbishment of buildings [55].
Figure 4.
Updated material input and output model for buildings in Vienna 1991–2050.
Figure 5 shows the updated HED model of Vienna for 1991–2050. The data are also displayed in the Supplementary File spreadsheet (Table “S11 Results per-capita” and “S9 Results_heating-energy”). The result first shows the good agreement between the modelled and the measured data from Gollner [57] for the years for which data were available (1991–2020). Furthermore, the model shows the decline in the per capita HED since the year 2001. This is clearly an achievement not only of new low-energy buildings substituting old high-energy consuming buildings, but also of thermal renovation of existing buildings [13,31]. With respect to future HED, the results are in line with studies from the UK and Finland, even though in these studies, the temperature increase due to global warming has a much higher impact than in this study, where this factor was not considered [58,59]. Furthermore, the reduction in HED in Vienna as modelled in this study is stronger than in the cities investigated by Harris et al. [60]. However, the study of Harris et al. modelled the total energy demand of cities, and not only the HED. What is remarkable in this study for Vienna is the comparatively high HED of service buildings, which are only 13 m2 NFA/capita in Vienna if compared to 41 m2 NFA/capita for residential buildings. This means that the potential to save energy for the HED in Vienna is larger for service buildings, despite their smaller relevance in terms of the HED.
Figure 5.
Updated HED model for buildings in Vienna 1991–2050.
The updated greenhouse gas emission model considering the direct greenhouse gasses from heating is shown in Figure 6. Like for the HED, the GHG for heating has declined since the year 2001. This decline is even stronger, since not only less energy is used, but the energy sources also produce less GHG emissions than, for instance, oil or natural gas. However, and this will be shown later, this decline is not sufficient to meet the GHG emission reduction targets of Vienna, nor also Austria and the EU 27. In comparison to other cities, however, Harris et al. [60] shows that only Copenhagen achieves higher GHG reductions than the HED-caused GHG emissions in the building sector of Vienna, even in a business-as-usual scenario [60]. Therefore, Vienna should look at cities like Copenhagen as role models for their own transformation.
Figure 6.
Updated direct GHG emission model from heating for buildings in Vienna 1991–2050.
3.2. Material Flows of Construction Materials and Demolition Wastes of the Updated Building Model of Vienna with and witout Enhanced Circular Economy Scenarios
The MFA for buildings in Vienna for the year 2030 without an enhanced local circular economy is shown in Figure 7, and the MFA for the enhanced local circular economy scenario for the year 2030 is shown in Figure 8. Figure A1, Figure A2, Figure A3, Figure A4 and Figure A5 in the Appendix A show the MFAs for the year 2019 (status quo), and for the years 2040, and 2050 (with and without an enhanced local circular economy). A comparison of the figures for the scenario without local circular economy in the year 2030 (Figure 7) with the local circular economy scenario for the year 2030 (Figure 8) shows that in the first, the bulk of wastes are still exported and not recycled in Vienna in the building sector. In detail, in the year 2030, without a local circular economy, in total 3,146,040 Mg/yr have to be imported (see Figure 7), while with an enhanced local circular economy, the import reduces to 2,295,559 Mg/yr (see Figure 8). In the latter case, 902,315 Mg/yr of secondary raw materials from building demolition in Vienna will be used as construction materials for buildings newly constructed in Vienna. Since it was assumed that demolition activities will decrease until 2050, as foreseen in the Smart Climate City Strategy Vienna [25], the amount of raw materials consumed in process 2. Buildings will also decrease to 2,931,154 Mg/yr in the year 2050 (see Figure A4 and Figure A5 in the Appendix A). Since less demolition waste is available in 2050, the amount of secondary raw materials provided also decreases to 629,854 Mg/yr in the enhanced local recycling scenario (Figure A5). As a result, slightly more raw materials have to be imported in the year 2050 (2,301,300 Mg/yr) than in the year 2030 (2,295,559 Mg/yr), which is detrimental to achieving a maximum CMUR. Furthermore, the results are in contrast to findings from Zhang et al. for the Netherlands, where most imports of raw materials for building construction (except limestone and cement) are projected to decrease [61]. The reason for this difference is that in Zhang et al., the demolition rate of buildings does not decrease, while in this study, it did, since it was assumed that a lower number of buildings were demolished. However, this also reflects the differences in the political agenda of how to achieve a decarbonized and circular building stock.
Figure 7.
MFA for buildings in Vienna 2030 without enhanced local circular economy.
Figure 8.
MFA for buildings in Vienna 2030 with enhanced local circular economy.
3.3. Assessing the Updated Building Model
3.3.1. Heating Energy Demand and Greenhouse Gas Emissions
Table 3 shows the results of the HED and GHG emissions of the defined development pathway. As already mentioned, there is no difference in these indicators for the two circular economy scenarios. The results show that the defined DEMO-BAU development pathway can reach the reduction targets of the Smart Climate City Strategy Vienna for the HED. As shown in Haas et al. [31] and Hoxha et al. [62], a higher number of buildings being renovated by thermal insulation annually can further reduce the HED. However, sufficient incentives therefore have to be provided [31,62].
Table 3.
Modelled HED and GWP for the heating of buildings in Vienna in 2030, 2040, and 2050, compared to reduction targets (base year annual average 2005–2010).
With respect to GHG emissions, the figures look worse for both the 2030 and the 2040 target. It must be said that all major stakeholders at different levels, from Vienna over Austria to the EU 27, agreed to achieve carbon neutrality by earliest in 2040, latest in 2050 [22,63]. To reduce the GHG emissions for the HED of buildings in Vienna, next to reducing the HED, a change in the heating systems is required. For Vienna, this is a challenge, considering the high share of decentralized natural gas-fed boiler heating systems that exist [31]. However, with a lower HED, this is also easier to achieve.
3.3.2. Total Material Requirement and Circular Material Use Rate with a Local Circular Economy Scenario
Table 4 shows the results of the TMR and CMUR calculation of the defined development pathway in Vienna. With respect to the TMR, the reduction targets as defined in the Smart Climate City Strategy Vienna were easily met by the modelled values for the years 2030, 2040, and 2050. The reason for this is on the one hand a decrease in material consumption due to a lower demolition of buildings, and on the other hand the enhanced local recycling of demolition wastes. The latter has also been shown by Zhang et al. for concrete recycling in the Netherlands [64]. Contrary to the positive development of the TMR, the CMUR declines from 28% in the year 2030 to 21% in the year 2050 due to the lower amounts of recycling material available, which is caused by lower number of buildings being demolished. When solely looking at the CMUR, this development is negative, since the CMUR aims to achieve a maximum possible value in sustainable development [54]. However, since a circular economy aims to reduce primary raw material consumption, the benefits of reducing the TMR outweigh the costs of a decreasing CMUR, since recycling, which is actually measured by the CMUR, is just a tool for the circular economy and not an objective of the circular economy. This contradiction is interesting, not only for research, but also for policy-selecting circular economy indicators.
Table 4.
TMR and CMUR for buildings in Vienna in 2030, 2040, and 2050, compared to 2019.
4. Conclusions
Cities are not only important consumers of energy and resources but also producers of emissions and waste. For the material resources and waste part, a circular economy can play an important role to mitigate negative impacts on the environment, even under a scenario where an excessive demolition of buildings, an in general unsustainable practise, prevails. This was shown for the case study of Vienna, as analyzed in this study. However, for a reduction in energy consumption and the mitigation of greenhouse gas emissions, more ambitions are still required, particularly increasing the renovation of buildings by thermal insulation and transforming energy production for the heating of buildings. Together with a circular economy for demolition wastes and construction materials, this will be the key to sustainable urban development.
Supplementary Materials
The following supporting information can be downloaded at: https://www.mdpi.com/article/10.3390/su16177319/s1, Supplementary File spreadsheet.
Author Contributions
Conceptualization, J.L.; methodology, J.L.; software, J.L.; validation, J.L.; formal analysis, J.L.; investigation, J.L.; resources, J.L.; data curation, J.L. and D.B.; writing—original draft preparation, J.L.; writing—review and editing, D.B.; visualization, J.L.; supervision, J.L.; project administration, J.L.; funding acquisition, J.L. and D.B. All authors have read and agreed to the published version of the manuscript.
Funding
This research was funded by Vienna Science and Technology Funds (WWTF), Funding Program Environmental Systems Research 2017—Urban Environments, Funding No. ESR17-067, Project TransLoC: Transformation of Cities into a Low Carbon Future and its Impact on Urban Metabolism, Environment, and Society; Austrian Research Promotion Agency FFG, Funding Program Leitprojekt-Kreislaufführung von Baustoffen und Gebäudeteilen mit KI-Unterstützung, Project KrAIsbau.
Institutional Review Board Statement
Not applicable.
Informed Consent Statement
Not applicable.
Data Availability Statement
All data used for this study are available in the article or other articles cited, particularly references [17,18,30,35]. In addition, a Supplementary Data File with all data is available.
Conflicts of Interest
The authors declare no conflicts of interest.
Appendix A
Table A1.
Material intensity coefficients (MCIs) for the material input (MCIinput) and output (MCIoutput) of different building types according to their use, age, and renovation category. Renovated refers to thermal renovation.
Table A1.
Material intensity coefficients (MCIs) for the material input (MCIinput) and output (MCIoutput) of different building types according to their use, age, and renovation category. Renovated refers to thermal renovation.
| Material | Building Age and Renovation Category | MICinput | MICoutput | MICinput | MICoutput | MICinput | MICoutput | MICinput | MICoutput |
|---|---|---|---|---|---|---|---|---|---|
| Residential Buildings | Service Buildings | Industrial Buildings | Other Buildings | ||||||
| Concrete | 1800–1918 | - | 250.6 | - | 183.0 | - | 917.5 | - | 81.4 |
| 1800–1918 Renovated | - | - | - | - | - | - | - | - | |
| 1800–1918 Attic extension | 920.3 | - | - | - | - | - | - | - | |
| 1919–1945 | - | 519.2 | - | 836.6 | - | 1322.3 | - | 1333.3 | |
| 1919–1945 Renovated | - | - | - | - | - | - | - | - | |
| 1919–1945 Attic extension | 920.3 | - | - | - | - | - | - | - | |
| 1946–1980 | - | 1370.7 | - | 1688.8 | - | 1499.5 | - | 1561.0 | |
| 1946–1980 Renovated | - | - | - | - | - | - | - | - | |
| 1981–2000 | 1700.1 | 1700.1 | 1822.5 | 1822.5 | 1189.7 | 1189.7 | 1755.8 | 1755.8 | |
| 2001–2050 | 1664.9 | 1664.9 | 1533.1 | 1533.1 | 1905.0 | 1905.0 | 1852.7 | 1852.7 | |
| Brick | 1800–1918 | - | 1888.8 | - | 1747.5 | - | 1212.7 | - | 2031.5 |
| 1800–1918 Renovated | - | - | - | - | - | - | - | - | |
| 1800–1918 Attic extension | 224.2 | 175.4 | - | - | - | - | - | - | |
| 1919–1945 | - | 1518.4 | - | 1298.9 | - | 1144.7 | - | 703.8 | |
| 1919–1945 Renovated | - | - | - | - | - | - | - | - | |
| 1919–1945 Attic extension | 224.2 | 175.4 | - | - | - | - | - | - | |
| 1946–1980 | - | 818.9 | - | 136.1 | - | 370.3 | - | 211.9 | |
| 1946–1980 Renovated | - | - | - | - | - | - | - | - | |
| 1981–2000 | 510.2 | 510.2 | 38.6 | 38.6 | 10.8 | 10.8 | 523.3 | 523.3 | |
| 2001–2050 | 273.9 | 273.9 | 61.0 | 61.0 | 192.0 | 192.0 | 208.9 | 208.9 | |
| Gravel | 1800–1918 | - | 164.0 | - | 149.9 | - | 174.1 | - | 110.2 |
| 1800–1918 Renovated | - | - | - | - | - | - | - | - | |
| 1800–1918 Attic extension | 3.6 | 76.8 | - | - | - | - | - | - | |
| 1919–1945 | - | 172.0 | - | 134.8 | - | 165.3 | - | 77.7 | |
| 1919–1945 Renovated | - | - | - | - | - | - | - | - | |
| 1919–1945 Attic extension | 3.6 | 76.8 | - | - | - | - | - | - | |
| 1946–1980 | - | 152.5 | - | 143.9 | - | 105.4 | - | 151.2 | |
| 1946–1980 Renovated | - | - | - | - | - | - | - | - | |
| 1981–2000 | 157.2 | 157.2 | 121.0 | 121.0 | 106.4 | 106.4 | 151.3 | 151.3 | |
| 2001–2050 | 149.5 | 149.5 | 118.0 | 118.0 | 136.8 | 136.8 | 152.3 | 152.3 | |
| Wood | 1800–1918 | - | 44.6 | - | 43.9 | - | 31.2 | - | 62.3 |
| 1800–1918 Renovated | - | - | - | - | - | - | - | - | |
| 1800–1918 Attic extension | 23.0 | 30.5 | - | - | - | - | - | - | |
| 1919–1945 | - | 40.1 | - | 28.9 | - | 43.7 | - | 19.1 | |
| 1919–1945 Renovated | - | - | - | - | - | - | - | - | |
| 1919–1945 Attic extension | 23.0 | 30.5 | - | - | - | - | - | - | |
| 1946–1980 | - | 15.1 | - | 8.8 | - | 5.5 | - | 30.6 | |
| 1946–1980 Renovated | - | - | - | - | - | - | - | - | |
| 1981–2000 | 13.7 | 13.7 | - | - | - | - | 4.4 | 4.4 | |
| 2001–2050 | 11.8 | 11.8 | 9.3 | 9.3 | - | - | 12.2 | 12.2 | |
| Steel | 1800–1918 | - | 9.1 | - | 7.2 | - | 42.6 | - | 1.9 |
| 1800–1918 Renovated | - | - | - | - | - | - | - | - | |
| 1800–1918 Attic extension | 58.9 | - | - | - | - | - | - | - | |
| 1919–1945 | - | 8.7 | - | 14.1 | - | 138.7 | - | 41.8 | |
| 1919–1945 Renovated | - | - | - | - | - | - | - | - | |
| 1919–1945 Attic extension | 58.9 | - | - | - | - | - | - | - | |
| 1946–1980 | - | 34.9 | - | 49.1 | - | 42.3 | - | 38.5 | |
| 1946–1980 Renovated | - | - | - | - | - | - | - | - | |
| 1981–2000 | 99.7 | 99.7 | 116.4 | 116.4 | 127.7 | 127.7 | 269.8 | 269.8 | |
| 2001–2050 | 226.2 | 226.2 | 91.4 | 91.4 | 125.2 | 125.2 | 104.1 | 104.1 | |
| Glass | 1800–1918 | - | 4.7 | - | 5.0 | - | 2.0 | - | 0.9 |
| 1800–1918 Renovated | 8.5 | - | 3.1 | - | 4.3 | - | 3.0 | - | |
| 1800–1918 Attic extension | 2.9 | 1.0 | - | - | - | - | - | - | |
| 1919–1945 | - | 5.2 | - | 2.9 | - | 3.8 | - | 3.4 | |
| 1919–1945 Renovated | 7.2 | - | 3.0 | - | 8.0 | - | 3.4 | - | |
| 1919–1945 Attic extension | 2.9 | 1.0 | - | - | - | - | - | - | |
| 1946–1980 | - | 4.1 | - | 3.4 | - | 9.3 | - | 9.1 | |
| 1946–1980 Renovated | 6.3 | - | 3.1 | - | 4.1 | - | 2.9 | - | |
| 1981–2000 | 4.4 | 4.4 | 3.3 | 3.3 | 3.5 | 3.5 | 3.3 | 3.3 | |
| 2001–2050 | 6.0 | 6.0 | 3.3 | 3.3 | 6.9 | 6.9 | 5.1 | 5.1 | |
| MinWool | 1800–1918 | - | 0.7 | - | 1.3 | - | 1.5 | - | 0.4 |
| 1800–1918 Renovated | 3.1 | - | 1.9 | - | 0.5 | - | 1.2 | - | |
| 1800–1918 Attic extension | 6.7 | 0.0 | - | - | - | - | - | - | |
| 1919–1945 | - | 2.5 | - | 1.2 | - | 0.5 | - | 3.6 | |
| 1919–1945 Renovated | 2.7 | - | 1.9 | - | 0.9 | - | 1.4 | - | |
| 1919–1945 Attic extension | 6.7 | 0.0 | - | - | - | - | - | - | |
| 1946–1980 | - | 1.3 | - | 0.4 | - | - | - | 3.0 | |
| 1946–1980 Renovated | 2.3 | - | 2.0 | - | 0.5 | - | 1.2 | - | |
| 1981–2000 | 1.4 | 1.4 | 0.4 | 0.4 | - | - | 0.9 | 0.9 | |
| 2001–2050 | 2.2 | 2.2 | 2.1 | 2.1 | 0.8 | 0.8 | 2.1 | 2.1 | |
| Polystyrene | 1800–1918 | - | 0.6 | - | 0.5 | - | 0.6 | - | - |
| 1800–1918 Renovated | 6.5 | - | 3.5 | - | 3.9 | - | 3.9 | - | |
| 1800–1918 Attic extension | 2.4 | - | - | - | - | - | - | - | |
| 1919–1945 | - | 0.6 | - | 0.7 | - | 0.9 | - | 0.8 | |
| 1919–1945 Renovated | 5.5 | - | 3.5 | - | 7.3 | - | 4.4 | - | |
| 1919–1945 Attic extension | 2.4 | - | - | - | - | - | - | - | |
| 1946–1980 | - | 0.5 | - | 1.1 | - | 3.9 | - | 1.3 | |
| 1946–1980 Renovated | 4.8 | - | 3.6 | - | 3.7 | - | 3.8 | - | |
| 1981–2000 | 5.2 | 5.2 | 3.5 | 3.5 | 1.0 | 1.0 | 4.1 | 4.1 | |
| 2001–2050 | 4.6 | 4.6 | 3.9 | 3.9 | 6.3 | 6.3 | 6.6 | 6.6 | |
Table A2.
Emission factors (EFs) and characterization factors (CFs) to calculate the GWP and TMR for the use of different building materials and heating energy sources.
Table A2.
Emission factors (EFs) and characterization factors (CFs) to calculate the GWP and TMR for the use of different building materials and heating energy sources.
| Material | in [kg/kg] | Material | in [kg/kg] | Energy | of HED in [kg/kwh] |
|---|---|---|---|---|---|
| Concrete | 1.3300 | Recycling material from concrete to substitute natural aggregate in concrete | 1.420 | District heating | 0.2000 |
| Brickwork | 1.9700 | Recycling material from brickwork to substitute natural aggregate in concrete | 1.420 | Wood | 0.0120 |
| Gravel and sand | 1.0100 | Recycling material from gravel and sand to substitute natural aggregate in concrete | 1.420 | Renewables | 0.0638 |
| Wood | 5.4000 | Recycling material from brickwork to substitute raw materials for cement | 1.420 | Electricity | 0.2190 |
| Iron and steel | 4.8000 | Recycling material from brickwork to substitute gravel and sand | 1.420 | Hard coal | 0.3320 |
| Glass | 2.9500 | Recycling material from gravel and sand to substitute gravel & sand | 1.420 | Heating oil | 0.3320 |
| Mineral wool | 4.3300 | Recycling material from wood to substitute wood | 3.440 | Natural gas | 0.2680 |
| Polystyrene | 2.5000 | Recycling material from steel to substitute iron ore | 6.670 |
Figure A1.
MFA for buildings in Vienna 2019 without an enhanced local circular economy.
Figure A2.
MFA for buildings in Vienna 2040 without an enhanced local circular economy.
Figure A3.
MFA for buildings in Vienna 2040 with an enhanced local circular economy.
Figure A4.
MFA for buildings in Vienna 2050 without an enhanced local circular economy.
Figure A5.
MFA for buildings in Vienna 2050 with an enhanced local circular economy.
References
- Ritchie, H.; Roser, M. Urbanization. 2018. Available online: https://ourworldindata.org/ (accessed on 27 July 2024).
- Kalmykova, Y.; Rosado, L.; Patrício, J. Resource consumption drivers and pathways to reduction: Economy, policy and lifestyle impact on material flows at the national and urban scale. J. Clean. Prod. 2016, 132, 70–80. [Google Scholar] [CrossRef]
- Schiller, G.; Roscher, J. Impact of urbanization on construction material consumption: A global analysis. J. Ind. Ecol. 2023, 27, 1021–1036. [Google Scholar] [CrossRef]
- Petit-Boix, A.; Leipold, S. Circular economy in cities: Reviewing how environmental research aligns with local practices. J. Clean. Prod. 2018, 195, 1270–1281. [Google Scholar] [CrossRef]
- Prendeville, S.; Cherim, E.; Bocken, N. Circular Cities: Mapping Six Cities in Transition. Environ. Innov. Soc. Transit. 2018, 26, 171–194. [Google Scholar] [CrossRef]
- Marin, J.; Alaerts, L.; Van Acker, K. A Materials Bank for Circular Leuven: How to Monitor ‘Messy’ Circular City Transition Projects. Sustainability 2020, 12, 10351. [Google Scholar] [CrossRef]
- Savini, F. The economy that runs on waste: Accumulation in the circular city. J. Environ. Policy Plan. 2019, 21, 675–691. [Google Scholar] [CrossRef]
- Barles, S. Urban Metabolism of Paris and Its Region. J. Ind. Ecol. 2009, 13, 898–913. [Google Scholar] [CrossRef]
- Chen, S.; Chen, B. Network Environ Perspective for Urban Metabolism and Carbon Emissions: A Case Study of Vienna, Austria. Environ. Sci. Technol. 2012, 46, 4498–4506. [Google Scholar] [CrossRef]
- Christis, M.; Athanassiadis, A.; Vercalsteren, A. Implementation at a city level of circular economy strategies and climate change mitigation—The case of Brussels. J. Clean. Prod. 2019, 218, 511–520. [Google Scholar] [CrossRef]
- Gassner, A.; Lederer, J.; Kanitschar, G.; Ossberger, M.; Fellner, J. Extended ecological footprint for different modes of urban public transport: The case of Vienna, Austria. Land Use Policy 2018, 72, 85–99. [Google Scholar] [CrossRef]
- Rosado, L.; Kalmykova, Y.; Patrício, J. Urban metabolism profiles. An empirical analysis of the material flow characteristics of three metropolitan areas in Sweden. J. Clean. Prod. 2016, 126, 206–217. [Google Scholar] [CrossRef]
- van Oorschot, J.; Sprecher, B.; Rijken, B.; Witteveen, P.; Blok, M.; Schouten, N.; van der Voet, E. Toward a low-carbon and circular building sector: Building strategies and urbanization pathways for the Netherlands. J. Ind. Ecol. 2023, 27, 535–547. [Google Scholar] [CrossRef]
- Lederer, J.; Ott, C.; Brunner, P.H.; Ossberger, M. The life cycle energy demand and greenhouse gas emissions of high-capacity urban transport systems: A case study from Vienna’s subway line U2. Int. J. Sustain. Transp. 2016, 10, 120–130. [Google Scholar] [CrossRef]
- Wurzer, G.; Lorenz, W.; Forster, J.; Bindreiter, S.; Lederer, J.; Gassner, A.; Mitteregger, M.; Kotroczo, E.; Pöllauer, P.; Fellner, J. M-DAB: Towards re-using material resources of the city. In Proceedings of the 38th eCAADe, Anthropologic—Architecture and Fabrication in the Cognitive Age, Berlin, Germany, 17–19 September 2020; pp. 127–132. Available online: http://hdl.handle.net/20.500.12708/65012 (accessed on 28 July 2024).
- Gassner, A.; Lederer, J.; Kovacic, G.; Mollay, U.; Schremmer, C.; Fellner, J. Projection of material flows and stocks in the urban transport sector until 2050–A scenario-based analysis for the city of Vienna. J. Clean. Prod. 2021, 311, 127591. [Google Scholar] [CrossRef]
- Lederer, J.; Gassner, A.; Fellner, J.; Mollay, U.; Schremmer, C. Raw materials consumption and demolition waste generation of the urban building sector 2016–2050: A scenario-based material flow analysis of Vienna. J. Clean. Prod. 2021, 288, 125566. [Google Scholar] [CrossRef]
- Lederer, J.; Gassner, A.; Keringer, F.; Mollay, U.; Schremmer, C.; Fellner, J. Material flows and stocks in the urban building sector: A case study from Vienna for the years 1990–2015. Sustainability 2019, 12, 300. [Google Scholar] [CrossRef]
- Gassner, A.; Lederer, J.; Fellner, J. Material stock development of the transport sector in the city of Vienna. J. Ind. Ecol. 2020, 24, 1364–1378. [Google Scholar] [CrossRef]
- Kleemann, F.; Lederer, J.; Rechberger, H.; Fellner, J. GIS-based Analysis of Vienna’s Material Stock in Buildings. J. Ind. Ecol. 2017, 21, 368–380. [Google Scholar] [CrossRef]
- Cavaleiro de Ferreira, A.; Fuso-Nerini, F. A Framework for Implementing and Tracking Circular Economy in Cities: The Case of Porto. Sustainability 2019, 11, 1813. [Google Scholar] [CrossRef]
- Deistler, J.; Homeier, I.; Lengauer, C.; Pangerl, E.; Rücker, L.; Lutter, J.; Cerveny, M.; Bartik, H.; Hofinger, J.; Veigl, A. Smart Klima City Strategie Wien (Smart Climate City Strategy Vienna); Magistrat der Stadt Wien: Vienna, Austria, 2022; Available online: https://smartcity.wien.gv.at/ (accessed on 27 July 2024).
- Adams, K.T.; Osmani, M.; Thorpe, T.; Thornback, J. Circular economy in construction: Current awareness, challenges and enablers. Proc. Inst. Civ. Eng. Waste Resour. Manag. 2017, 170, 15–24. [Google Scholar] [CrossRef]
- Liedtke, C.; Bienge, K.; Wiesen, K.; Teubler, J.; Greiff, K.; Lettenmeier, M.; Rohn, H. Resource Use in the Production and Consumption System—The MIPS Approach. Resources 2014, 3, 544–574. [Google Scholar] [CrossRef]
- Eisenmenger, N.; Kaufmann, L.; Kalt, G.; Dorninger, C.; Perkovic, M.; Lederer, J.; Fellner, J.; Lutter, S. CO2-und Material-Fußabdruck für Wien (CO2- and Material footprint of Vienna); University of Natural Resources and Life Sciences, Technische Universitaet Wien, Vienna University of Economics and Buisnesses: Vienna, Austria, 2022. [Google Scholar]
- Veigl, A.; Watzak-Helmer, M.; Cerveny, M. Wiens Klima- & Energieziele für 2030 & 2050; Urban Innovation Vienna: Vienna, Austria, 2019. [Google Scholar]
- ENTSO-E. Stromversorgung der Vergangenen 52 Wochen, Stromversorgung in den Vergangenen 30 Tagen Bzw. 12 Monaten. ENTSO-E, Ed. 2024. Available online: https://energie.gv.at/strom/strom (accessed on 27 July 2024).
- BMK. Integrierter nationaler Energie- und Klimaplan für Österreich Periode 2021–2030 (Integrated National Energy and Climate Plan for Austria Period 2021–2030). Draft for Public Consultation; Bundesministerium für Klimaschutz, Umwelt, Energie, Mobilität; Innovation und Technologie (BMK): Vienna, Austria, 2023. [Google Scholar]
- Krutzler, T.; Wasserbaur, R.; Schindler, I. Energie- und Treibhausgasszenarien 2023 (Energy and Greenhouse Gas Scenarios 2023); Umweltbundesamt: Vienna, Austria, 2023. [Google Scholar]
- Lederer, J.; Gassner, A.; Kleemann, F.; Fellner, J. Potentials for a circular economy of mineral construction materials and demolition waste in urban areas: A case study from Vienna. Resour. Conserv. Recycl. 2020, 161, 104942. [Google Scholar] [CrossRef]
- Haas, R.; Siebenhofer, M.; Lederer, J.; Ajanovic, A. Historical Evolution and Scenarios Up to 2050 of Heating Energy Consumption and CO2 Emissions of Residential Buildings in Vienna. J. Energy Power Technol. 2022, 4, 30. [Google Scholar] [CrossRef]
- Stadt_Wien. Nicht gefährlicher Abfall—Abfallmengen in Wien (Non-Hazardous Waste—Waste Quantities in Vienna). Available online: https://www.wien.gv.at/umweltschutz/abfall/nicht-gefaehrliche-abfallmenge.html (accessed on 27 July 2024).
- Statistics_Austria. 2005 bis 2020 Fertiggestellte Wohnungen Nach Gebäudeeigenschaften, Art der Bautätigkeit und Bundesländern (2005 to 2020 Completed Living Units according to Type of Building, Type of Construction Activity and Federal States), 16.11.2021 ed.; Statistics Austria: Vienna, Austria, 2021. [Google Scholar]
- Wohnfonds_Wien. Anzahl der Thermisch Sanierten Wohneinheiten in Wien Nach Bauperiode (Number of Thermal Renovated Living Units after Construction Period); Lederer, J., Ed.; Wien: Vienna, Austria, 2022. [Google Scholar]
- Lederer, J.; Fellner, J.; Gassner, A.; Gruhler, K.; Schiller, G. Determining the material intensities of buildings selected by random sampling: A case study from Vienna. J. Ind. Ecol. 2021, 25, 848–863. [Google Scholar] [CrossRef]
- Müller, A. Energy Demand Assessment for Space Conditioning and Domestic Hot Water: A Case Study for the Austrian Building Stock; Technische Universität Wien: Vienna, Austria, 2015. [Google Scholar]
- OIB. Richtlinien des Österreichischen Instituts für Bautechnik (Standards of the Austrian Institut for Construction Technology). In OIB-Richtlinie 6 Energieeinsparung und Wärmeschutz (OIB Standard 6 Energy Supply and Thermal Insulation); Österreichischen Instituts für Bautechnik (OIB): Vienna, Austria, 2015; Volume OIB-330.6-009/15. [Google Scholar]
- Stadt_Wien. Heating Demand of Restorated Apartments before and after Restoration, 08.10.2021 ed.; Magistrat Wien—Magistratsabteilung 20—Energieplanung: Vienna, Austria, 2021. [Google Scholar]
- Bayer, G.; Sturm, T.; Steininger, M. Energieflüsse in Bürogebäuden; Österreichische Gesellschaft für Umwelt und Technik (ÖGUT): Wien, Austria, 2014. [Google Scholar]
- Umweltbundesamt. Berechnung von Treibhausgas (THG)-Emissionen Verschiedener Energieträger. Available online: https://secure.umweltbundesamt.at/co2mon/co2mon.html (accessed on 27 July 2024).
- Brunner, P.H.; Rechberger, H. Handbook of Material Flow Analysis: For Environmental, Resource, and Waste Engineers, 2nd ed.; CRC Press: Boca Raton, FL, USA, 2016. [Google Scholar]
- Land_Niederösterreich. NIederösterreichischer Abfallwirtschaftsplan (Waste Management Plan of Lower-Austria); Land Niederösterreich, Gruppe Raumordnung, Umwelt und Verkehr (Federal State of Lowwer-Austria, Group Spatial Planning, Environment and Transport): St. Pölten, Austria, 2018. [Google Scholar]
- Bernhardt, A.; Kleemann, F.; Neubauer, C.; Neubauer, M.; Walter, B. Datenanalyse zur Behandlung von Mineralischen Bau- und Abbruchabfällen in Österreich—Detailstudie zum Bundes-Abfallwirtschaftsplan (Data Analysis on the Treatment of Mineral Construction and Demolition Wastes in Austria—Detailed Study for the Federal Waste Management Plan); Umweltbundesamt (Federal Environment Agency): Vienna, Austria, 2019. [Google Scholar]
- ContraCon. Amounts and Types of Demolition Waste Treated and Recycling Materials Produced; Lederer, J., Ed.; ContraCon: Vienna, Austria, 2023; Available online: https://www.contracon.at/ (accessed on 27 July 2024).
- LangesFeld. Amounts and Types of Demolition Waste Treated and Recycling Materials Produced; Lederer, J., Ed.; LangesFeld: Vienna, Austria, 2023; Available online: https://langesfeld.at/ (accessed on 27 July 2024).
- Mauschitz, G. Emissionen aus Anlagen der Österreichischen Zementindustrie—Berichtsjahr 2016 (Emissions from Plants of the Austrian Cement Industry—Reporting Year 2016); TU Wien: Vienna, Austria, 2017. [Google Scholar]
- BMK. Bundes-Abfallwirtschaftsplan (BAWP) 2023 Teil 1 (Federal Waste Management Plan 2023 Part 1); Bundesministerin für Klimaschutz, Umwelt, Energie, Mobilität, Innovation und Technologie (BMK): Vienna, Austria, 2023. [Google Scholar]
- Zeitlhofer, H.; Peyerl, M.; Krispel, S. Evaluierung des Einsatzes Alternativer Rohstoffe in der Klinkerproduktion zur Minderung der Treibhausgasemissionen (Evaluation of the Use of Alternative Raw Materials in the Clinker Production for the Reduction of Greenhouse Gas Emissions); Smart Minerals: Vienna, Austria, 2018; p. 61. [Google Scholar]
- Mostert, C.; Bringezu, S. Measuring Product Material Footprint as New Life Cycle Impact Assessment Method: Indicators and Abiotic Characterization Factors. Resources 2019, 8, 61. [Google Scholar] [CrossRef]
- Watari, T.; McLellan, B.C.; Giurco, D.; Dominish, E.; Yamasue, E.; Nansai, K. Total material requirement for the global energy transition to 2050: A focus on transport and electricity. Resour. Conserv. Recycl. 2019, 148, 91–103. [Google Scholar] [CrossRef]
- Oliveira Neto, G.C.; Correia, J.M. Environmental and economic advantages of adopting reverse logistics for recycling construction and demolition waste: A case study of Brazilian construction and recycling companies. Waste Manag. Res. 2019, 37, 176–185. [Google Scholar] [CrossRef] [PubMed]
- Wuppertal_Institute. Material Intensity of Materials, Fuels, Transport Services, Food; Wuppertal Institute for Climate, Environment and Energy GmbH: Wuppertal, Germany, 2014. [Google Scholar]
- BMK. Die österreichische Kreislaufwirtschaft. Österreich auf dem Weg zu Einer Nachhaltigen und Zirkulären Gesellschaft; Bundesministerium für Klimaschutz, Umwelt, Energie, Mobilität, Innovation und Technologie (BMK): Vienna, Austria, 2021. [Google Scholar]
- Moraga, G.; Huysveld, S.; Mathieux, F.; Blengini, G.A.; Alaerts, L.; Van Acker, K.; de Meester, S.; Dewulf, J. Circular economy indicators: What do they measure? Resour. Conserv. Recycl. 2019, 146, 452–461. [Google Scholar] [CrossRef]
- Heeren, N.; Hellweg, S. Tracking Construction Material over Space and Time: Prospective and Geo-referenced Modeling of Building Stocks and Construction Material Flows. J. Ind. Ecol. 2019, 23, 253–267. [Google Scholar] [CrossRef]
- Soonsawad, N.; Marcos-Martinez, R.; Schandl, H. City-scale assessment of the material and environmental footprint of buildings using an advanced building information model: A case study from Canberra, Australia. J. Ind. Ecol. 2024, 28, 247–261. [Google Scholar] [CrossRef]
- Gollner, M. Nutzenergieanalyse. Available online: https://www.statistik.at/statistiken/energie-und-umwelt/energie/nutzenergieanalyse (accessed on 22 April 2022).
- Jylhä, K.; Jokisalo, J.; Ruosteenoja, K.; Pilli-Sihvola, K.; Kalamees, T.; Seitola, T.; Mäkelä, H.M.; Hyvönen, R.; Laapas, M.; Drebs, A. Energy demand for the heating and cooling of residential houses in Finland in a changing climate. Energy Build. 2015, 99, 104–116. [Google Scholar] [CrossRef]
- Eyre, N.; Baruah, P. Uncertainties in future energy demand in UK residential heating. Energy Policy 2015, 87, 641–653. [Google Scholar] [CrossRef]
- Harris, S.; Weinzettel, J.; Bigano, A.; Källmén, A. Low carbon cities in 2050? GHG emissions of European cities using production-based and consumption-based emission accounting methods. J. Clean. Prod. 2020, 248, 119206. [Google Scholar] [CrossRef]
- Zhang, C.; Hu, M.; Sprecher, B.; Yang, X.; Zhong, X.; Li, C.; Tukker, A. Recycling potential in building energy renovation: A prospective study of the Dutch residential building stock up to 2050. J. Clean. Prod. 2021, 301, 126835. [Google Scholar] [CrossRef]
- Hoxha, E.; Röck, M.; Truger, B.; Steininger, K.; Passer, A. Austrian GHG emission targets for new buildings and major renovations: An exploratory study. IOP Conf. Ser. Earth Environ. Sci. 2020, 588, 032052. [Google Scholar] [CrossRef]
- Perissi, I.; Jones, A. Investigating European Union Decarbonization Strategies: Evaluating the Pathway to Carbon Neutrality by 2050. Sustainability 2022, 14, 4728. [Google Scholar] [CrossRef]
- Zhang, C.; Hu, M.; van der Meide, M.; Di Maio, F.; Yang, X.; Gao, X.; Li, K.; Zhao, H.; Li, C. Life cycle assessment of material footprint in recycling: A case of concrete recycling. Waste Manag. 2023, 155, 311–319. [Google Scholar] [CrossRef]
Disclaimer/Publisher’s Note: The statements, opinions and data contained in all publications are solely those of the individual author(s) and contributor(s) and not of MDPI and/or the editor(s). MDPI and/or the editor(s) disclaim responsibility for any injury to people or property resulting from any ideas, methods, instructions or products referred to in the content. |
© 2024 by the authors. Licensee MDPI, Basel, Switzerland. This article is an open access article distributed under the terms and conditions of the Creative Commons Attribution (CC BY) license (https://creativecommons.org/licenses/by/4.0/).