
Suitability of Residues from Seaweed and Fish Processing for Composting and as Fertilizer

 , , , , , ,
  and
and
Abstract
1. Introduction
2. Materials and Methods
2.1. Compost Feedstocks
2.2. Experimental Design
2.3. Physical and Chemical Characterization
2.4. Statistical Analysis
3. Result
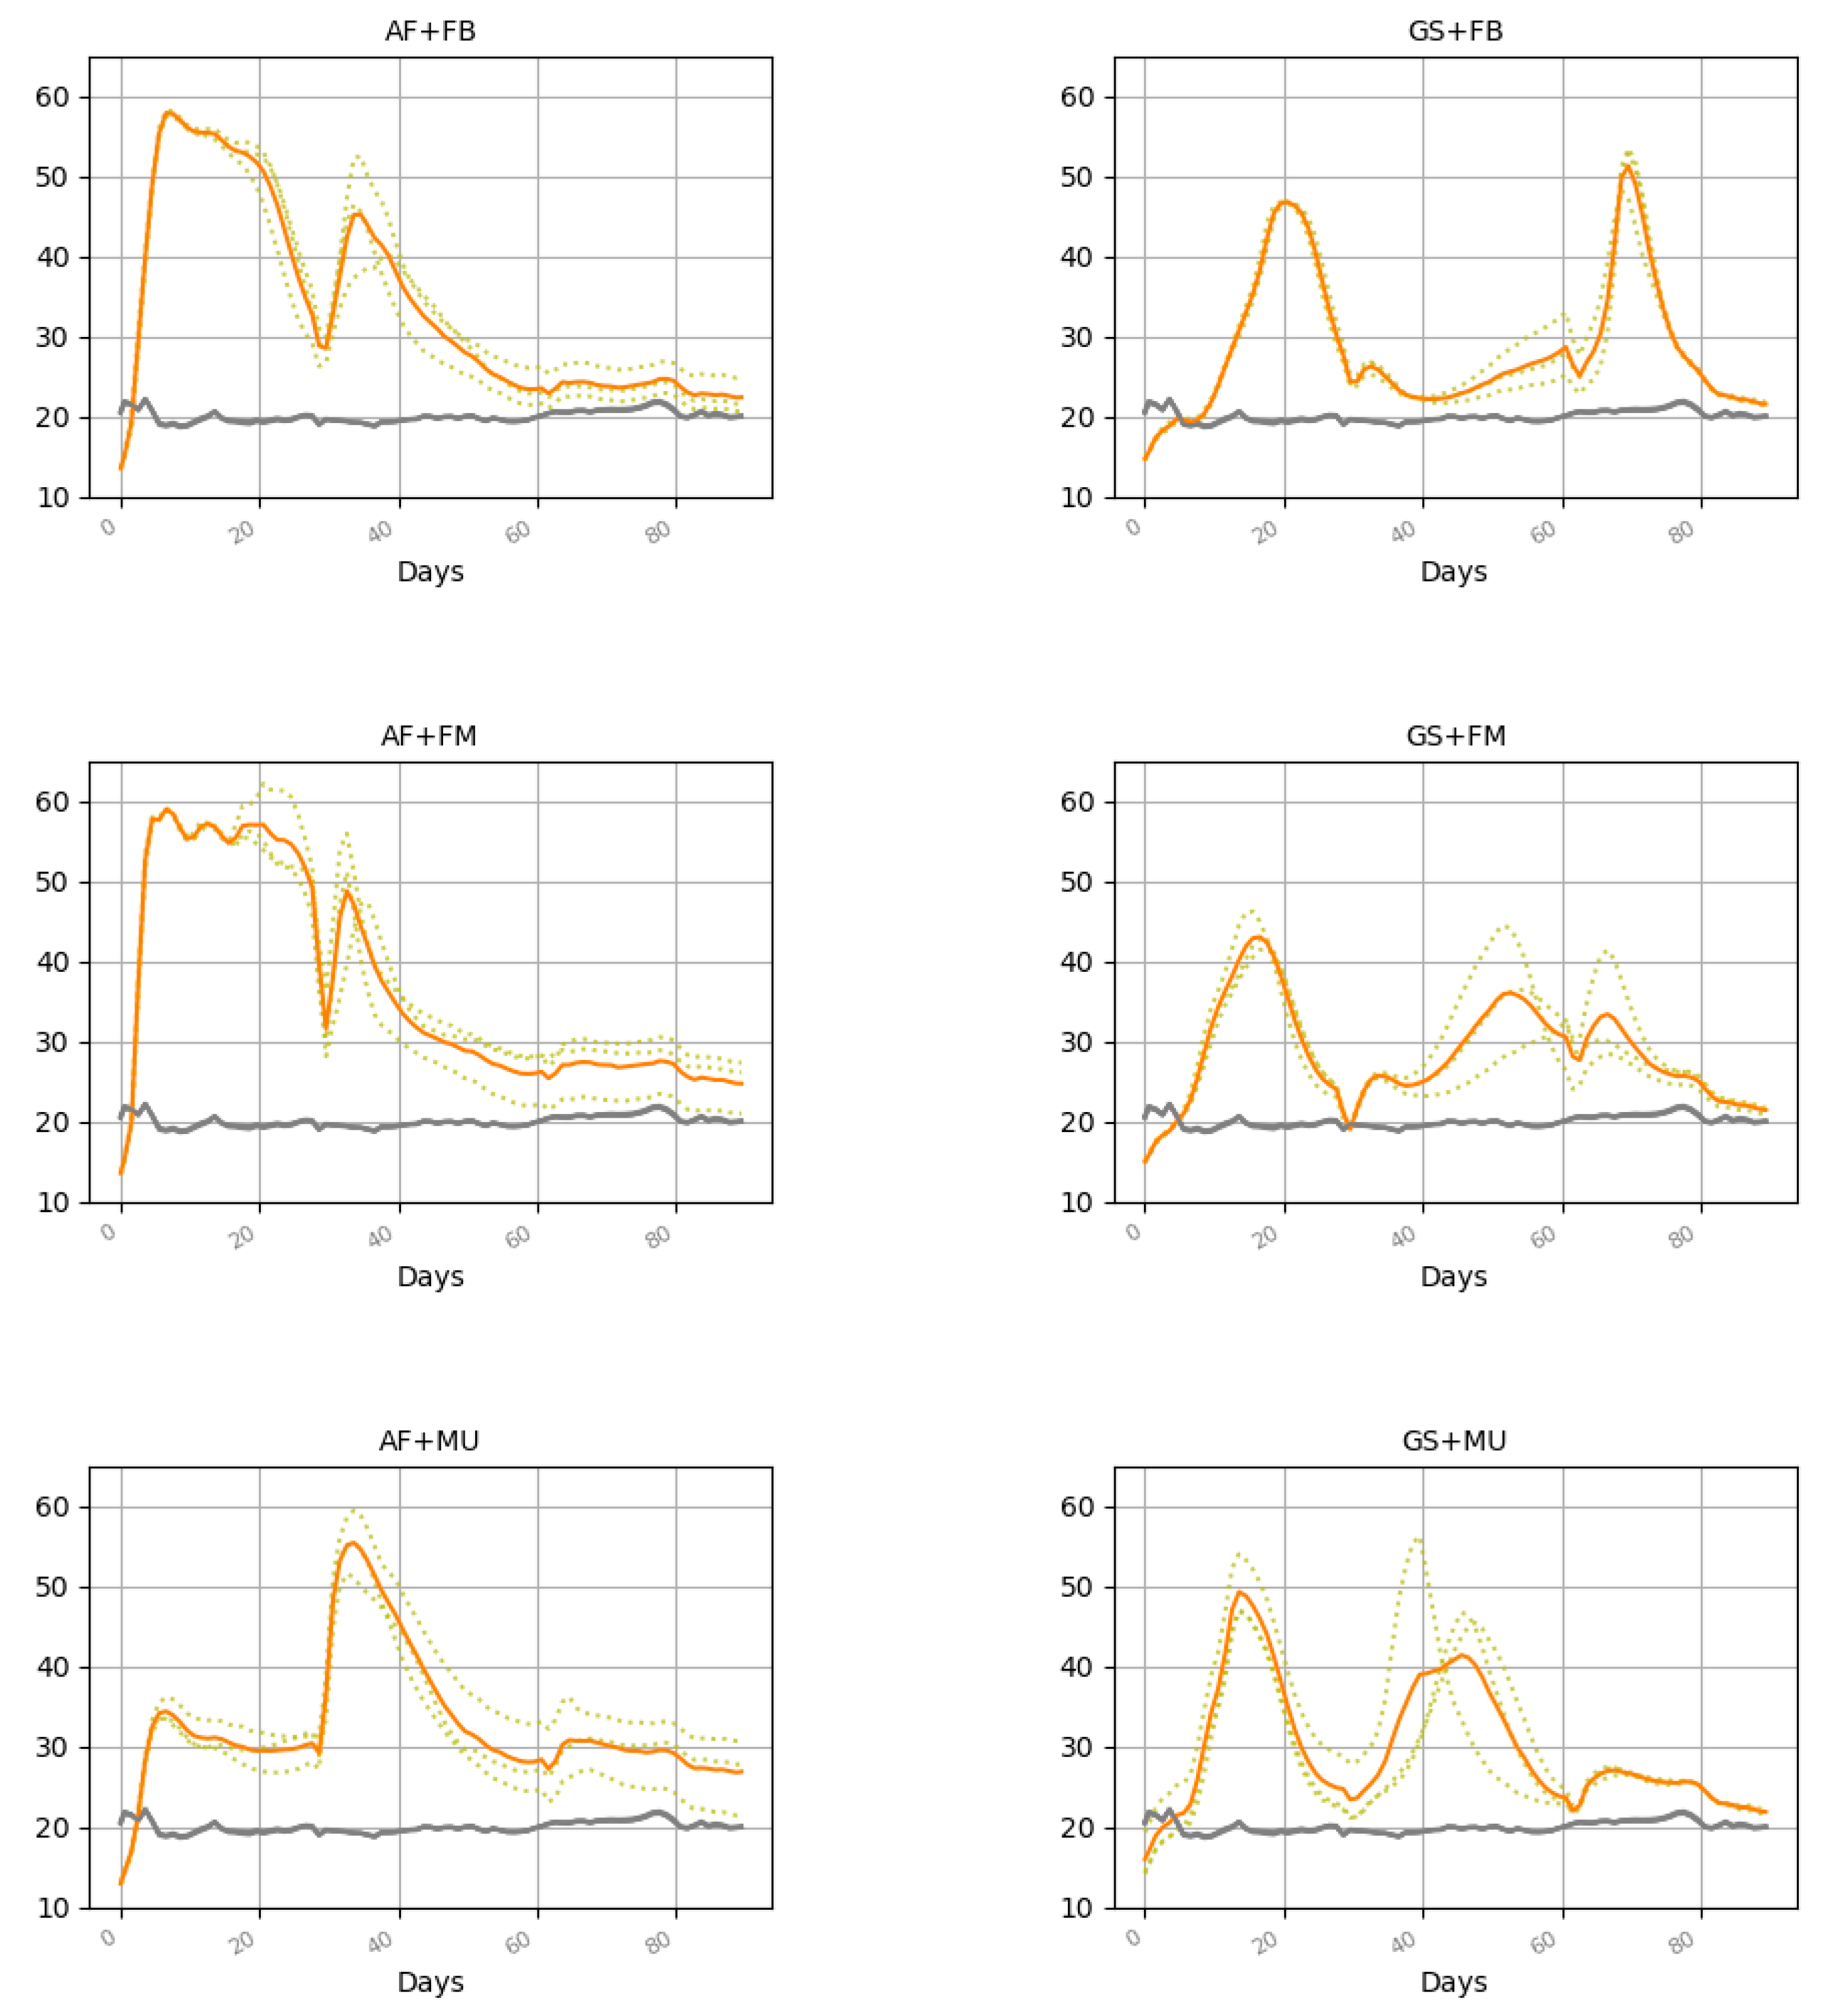
3.1. Temperature
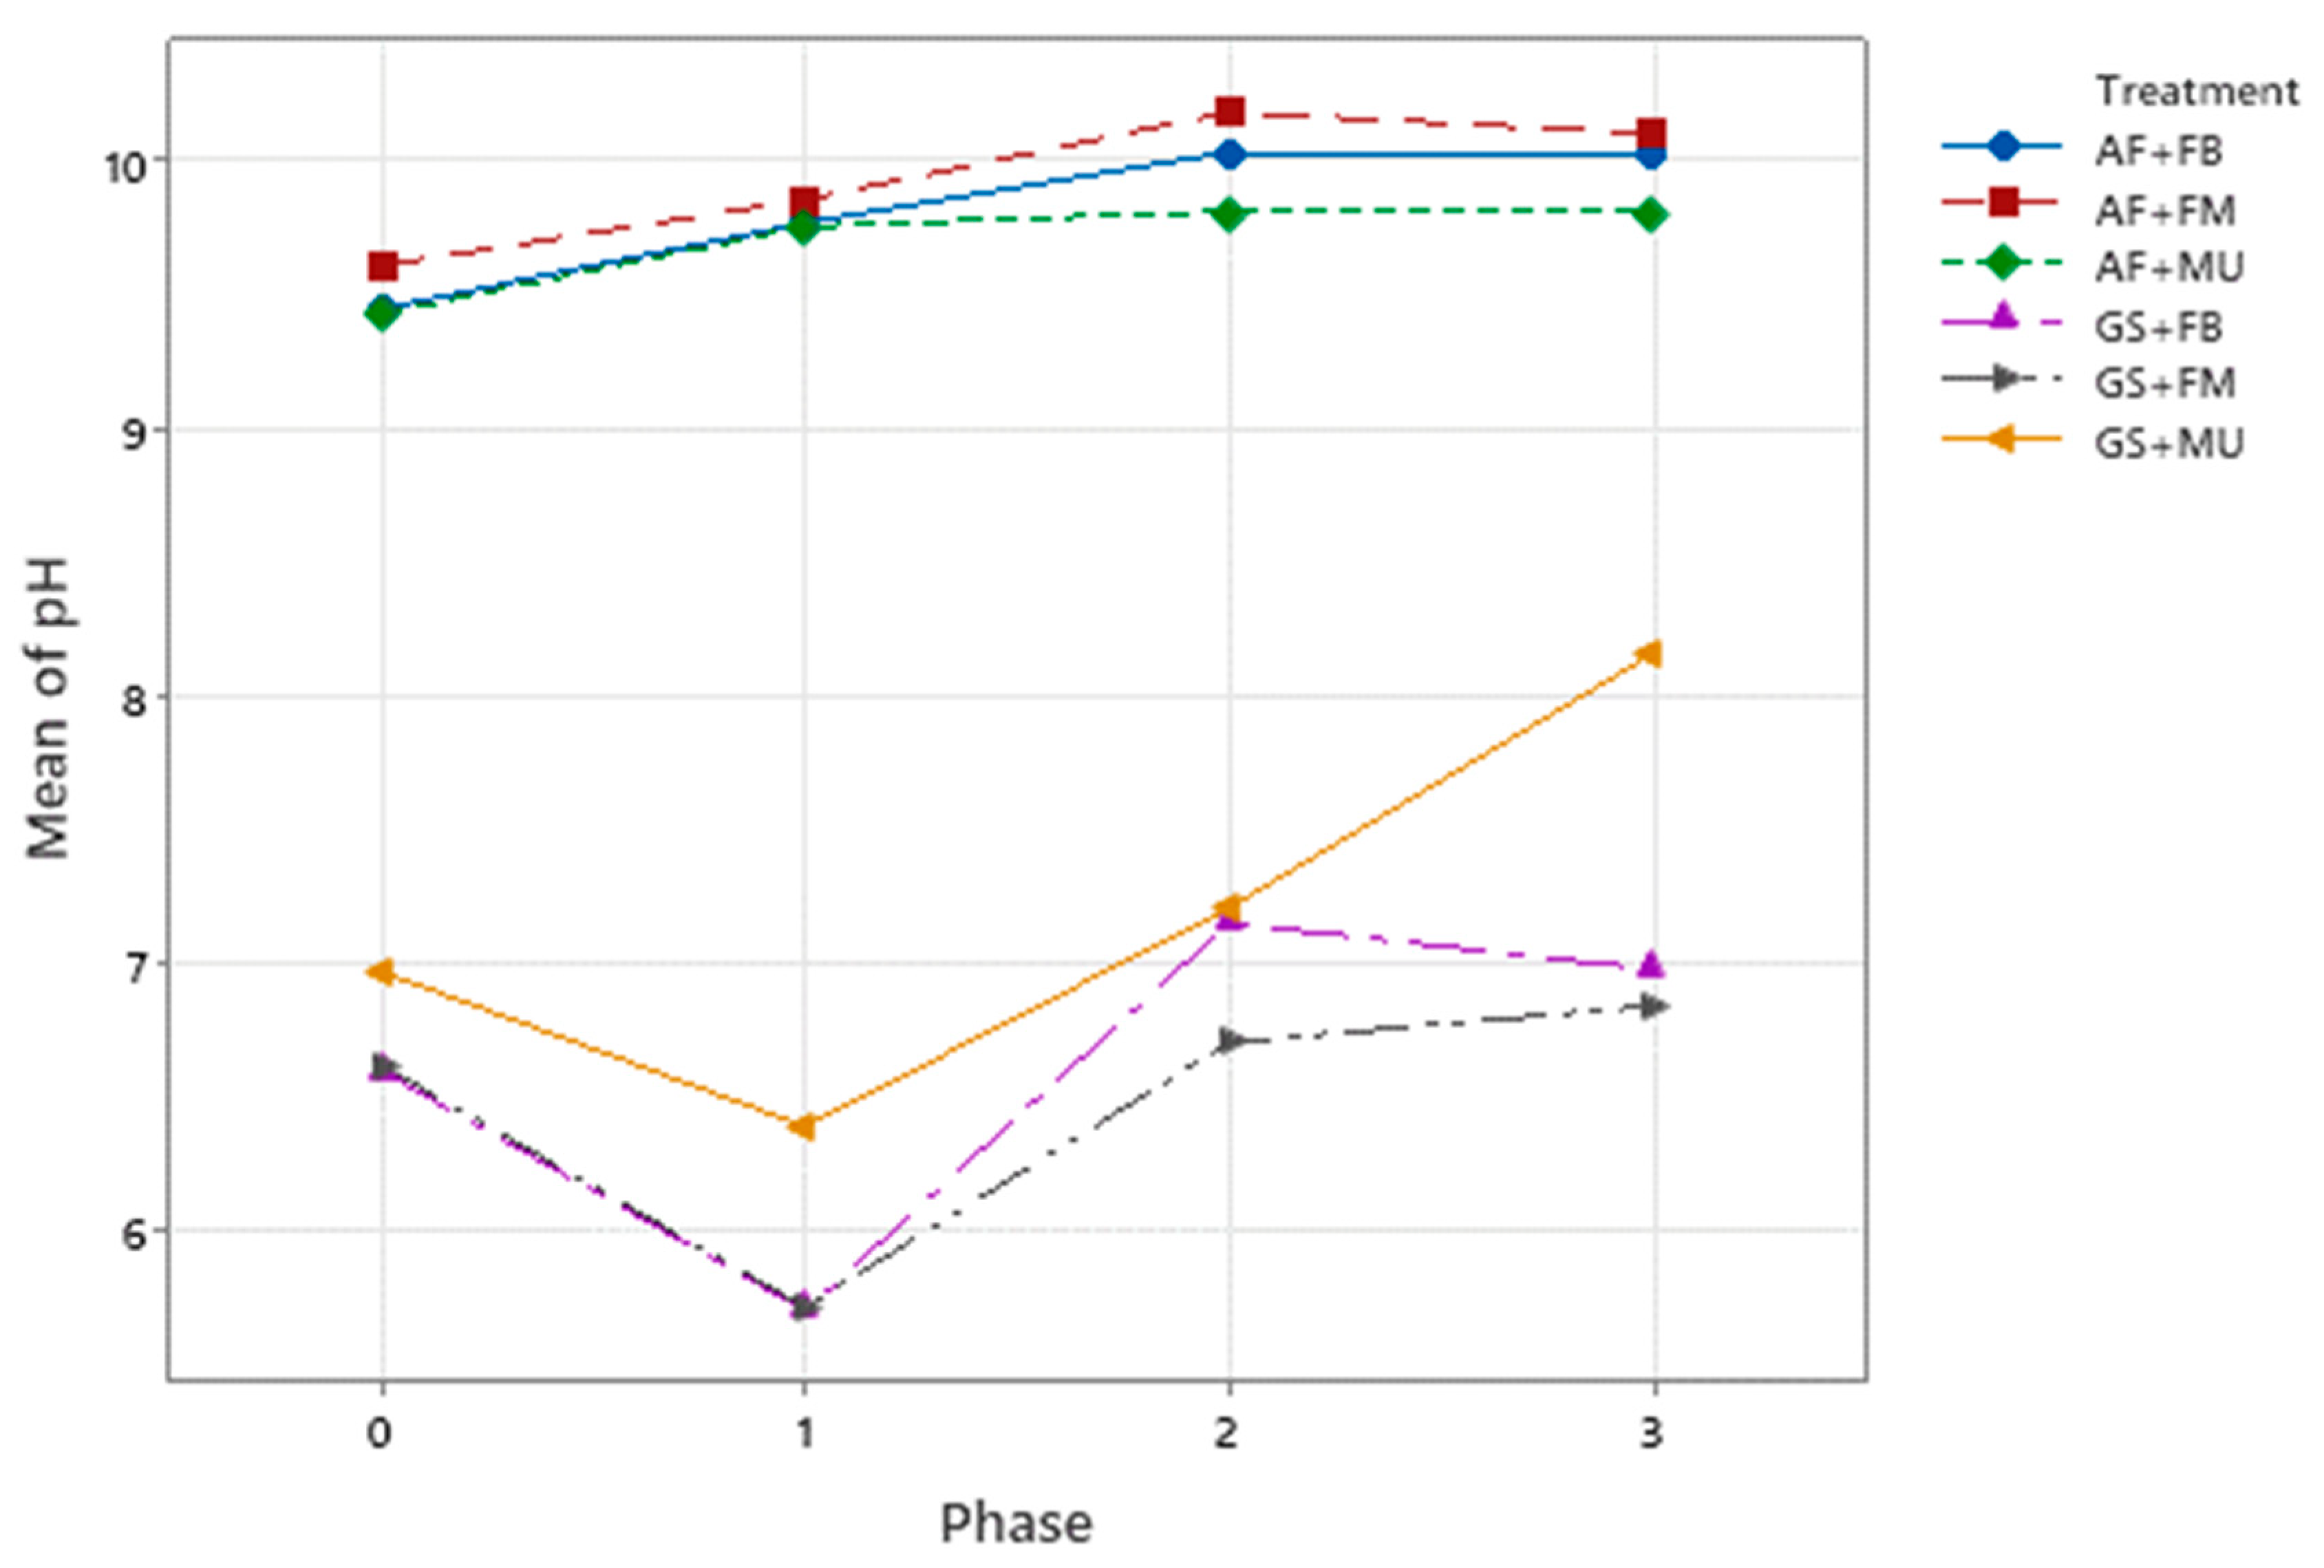
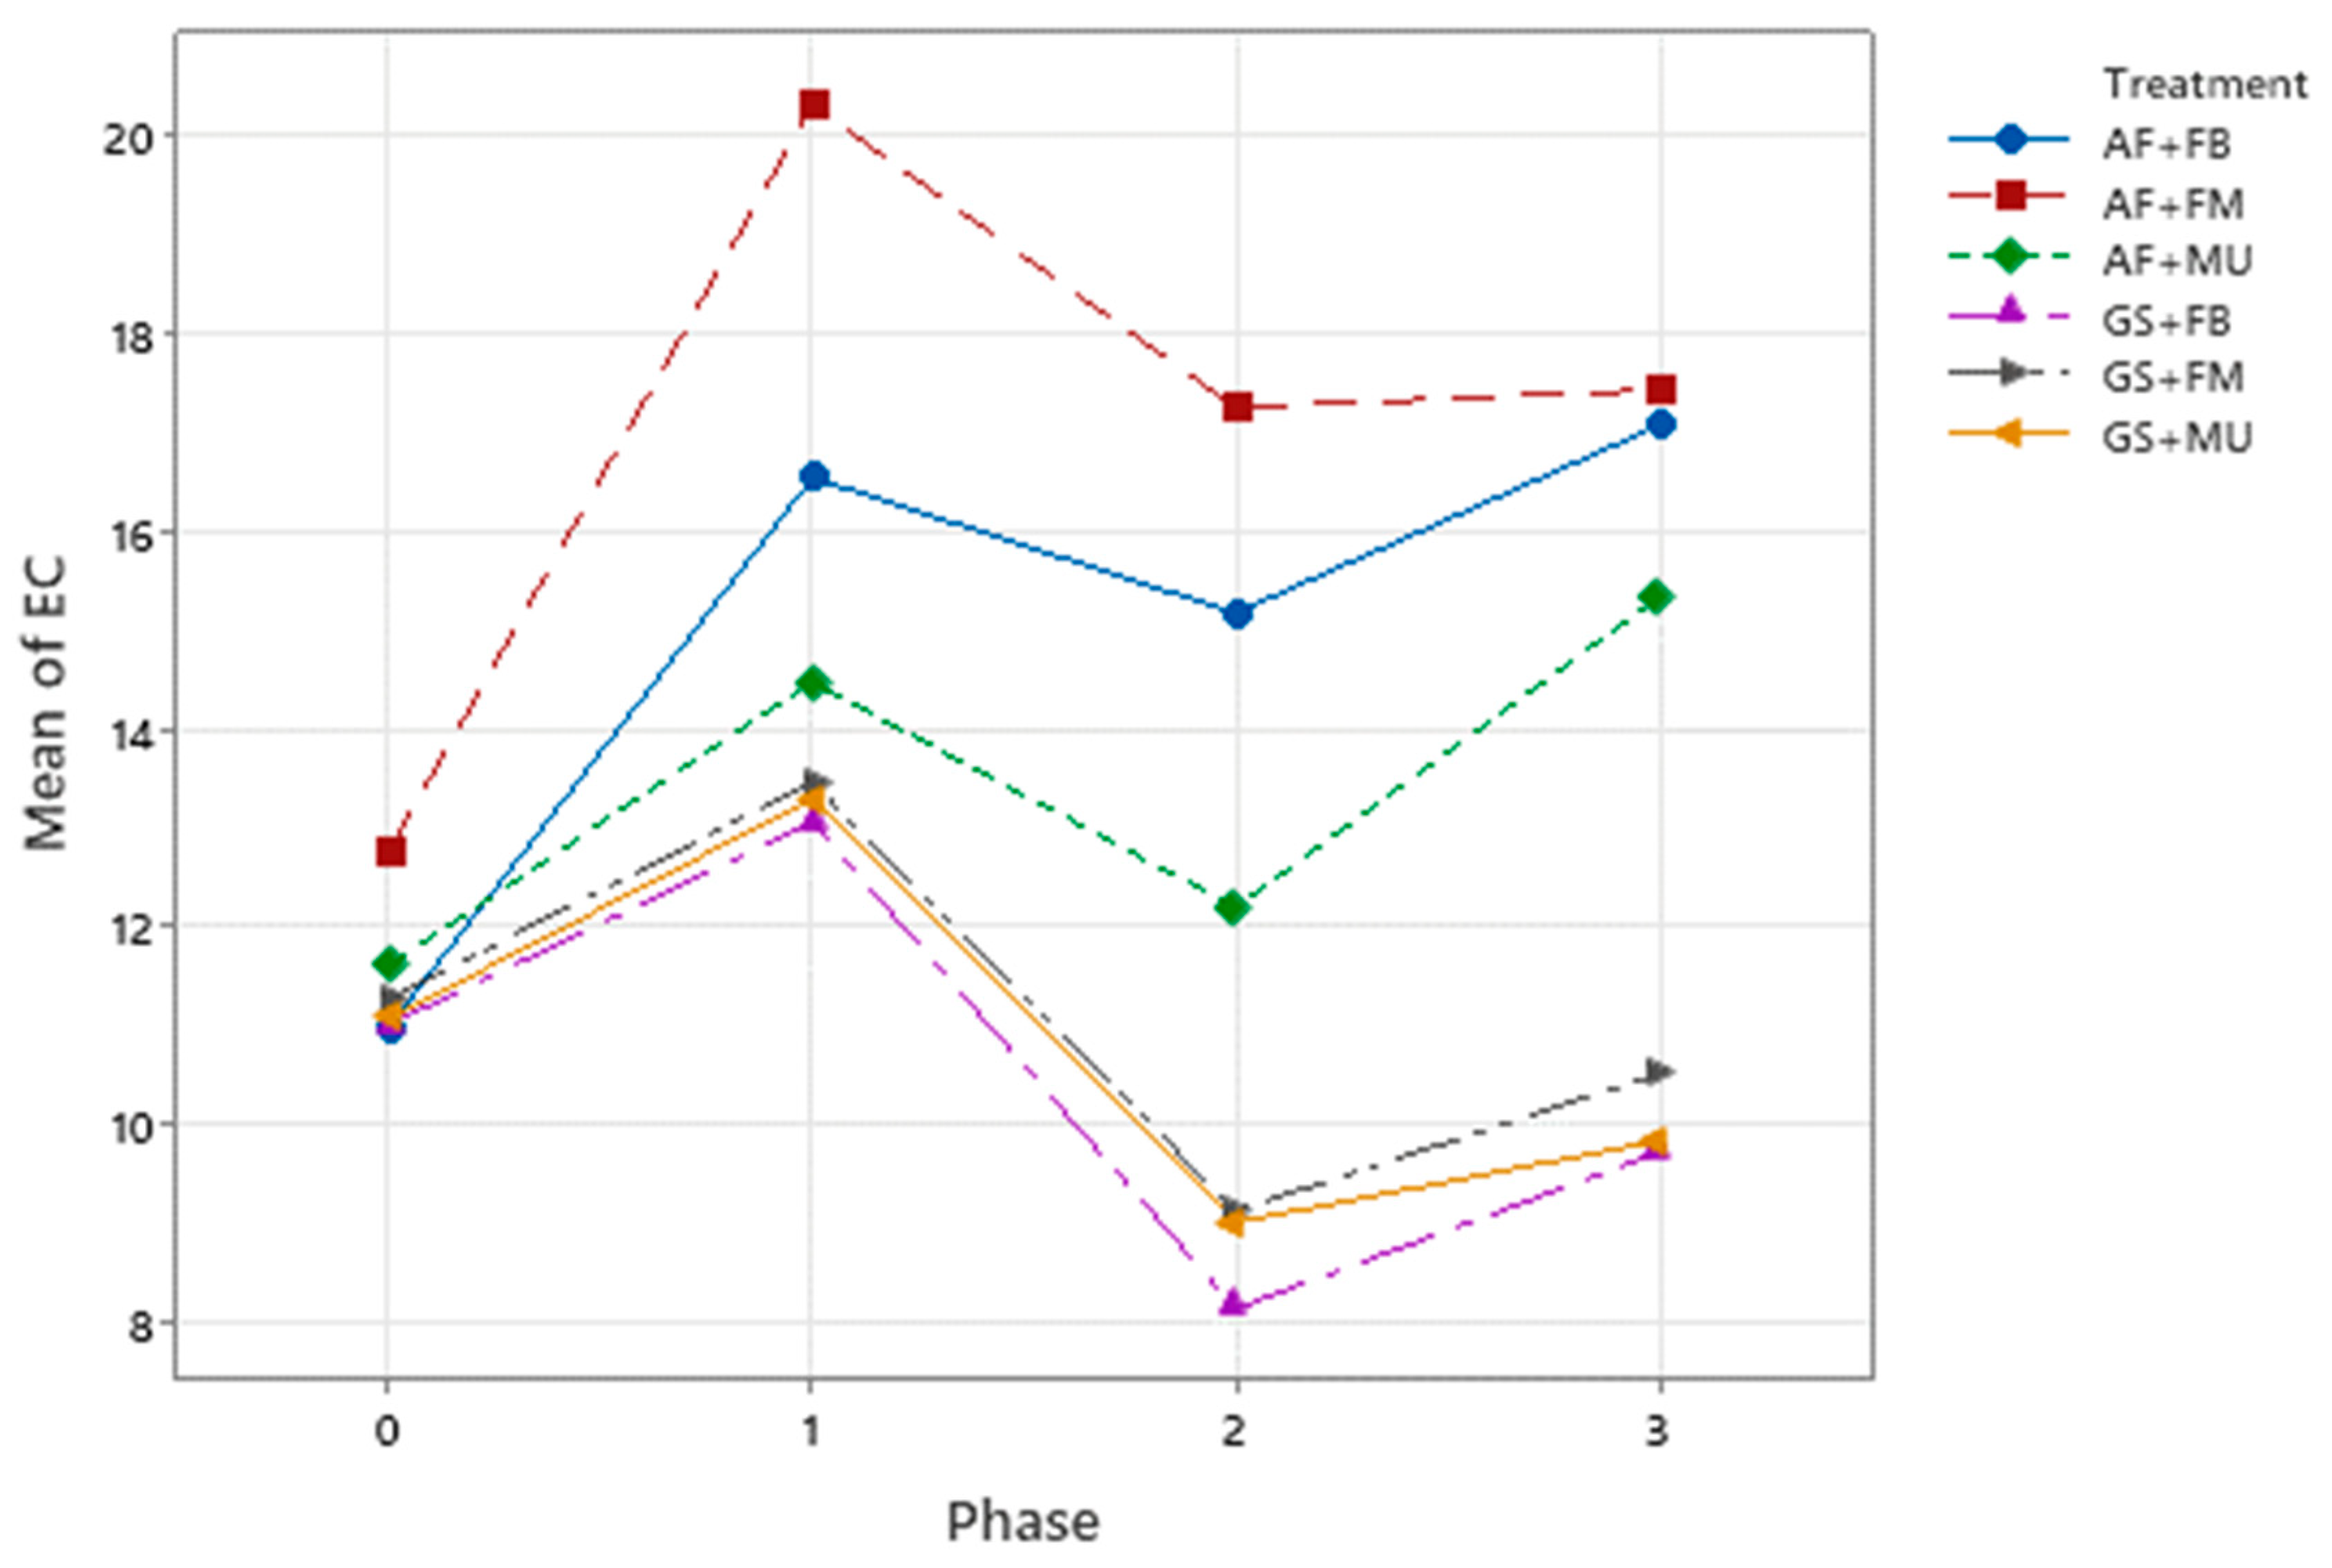
3.2. Physical and Chemical Characterization and Changes
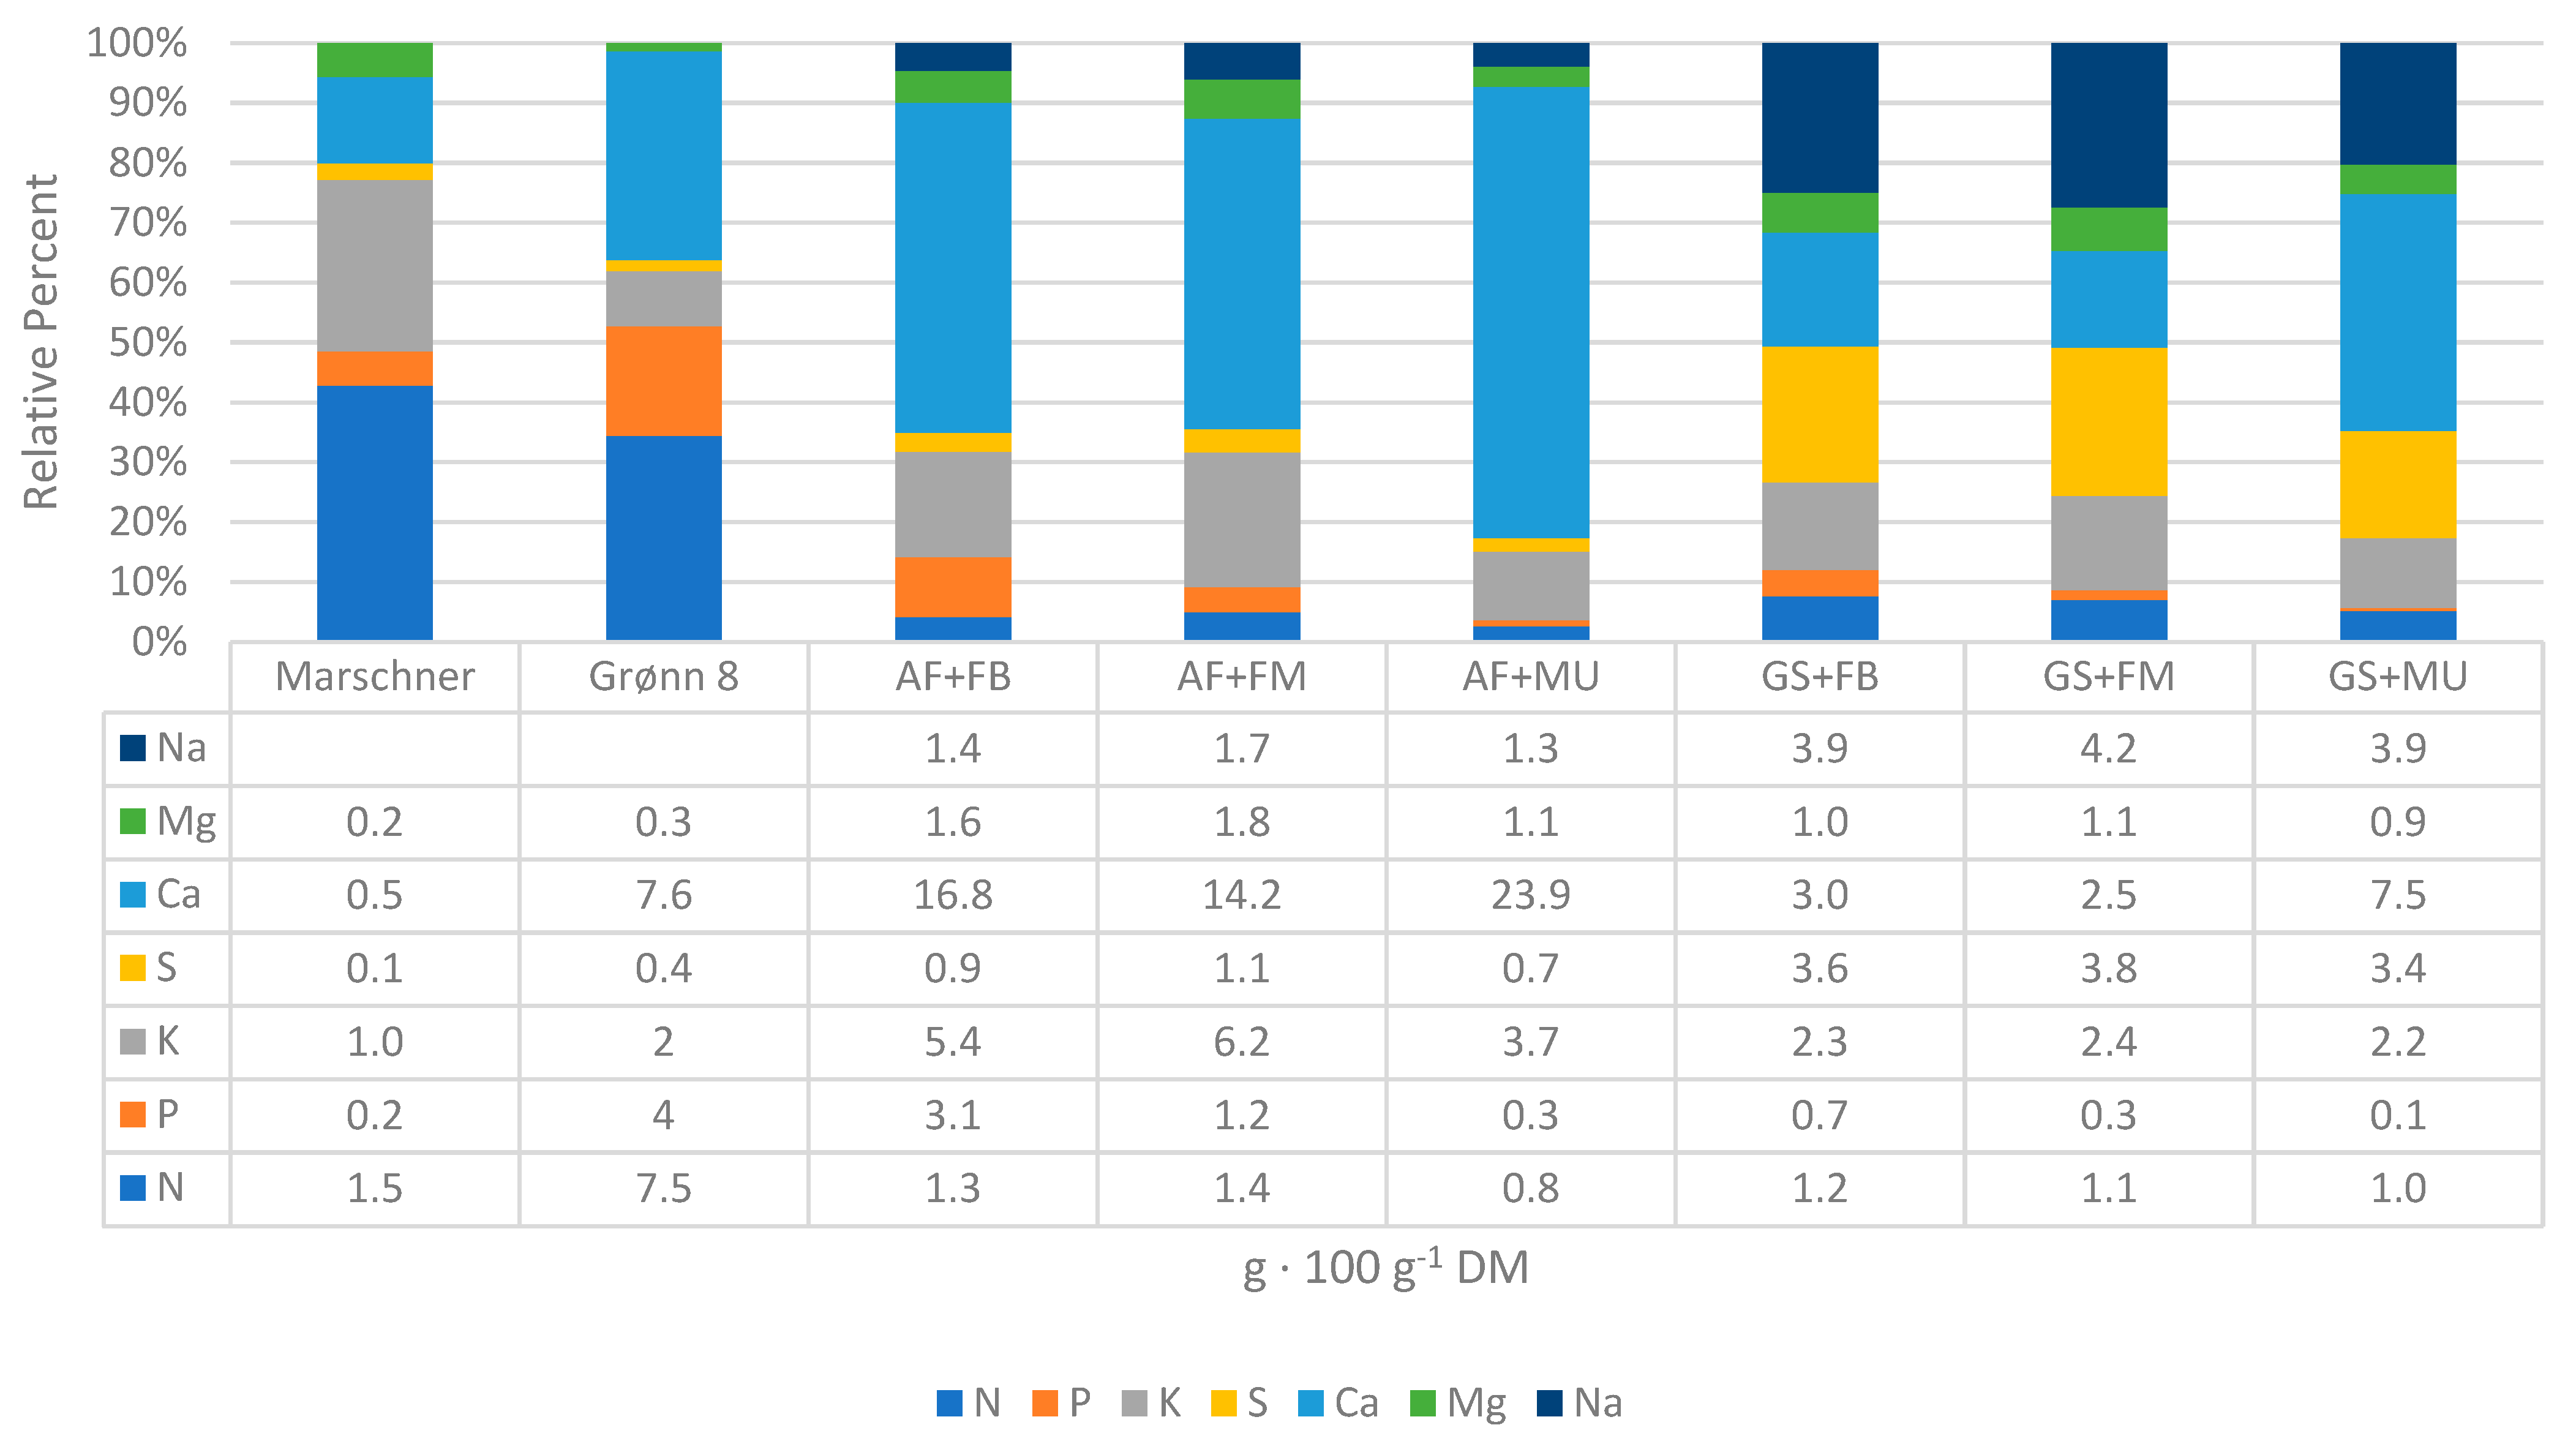
3.3. Concentrations and Contents of Nutrients
3.4. Suitability as a Fertilizer
4. Discussion
4.1. Composting Process
4.2. Potential Application of Compost

| AF + FM | GS + FB | Szmidt [45] | Cole [29] | Illera-Vives [35] | Stehouwer et al. [77] 2 | ||
|---|---|---|---|---|---|---|---|
| Feedstocks | Algae fiber from A. nodosum + fishbone | Ground and dried A. nodosum + fishbone | A. nodosum decanter waste + wheat straw + NH4NO3 + urea | Fresh sea lettuce (U. ohnoi) + sugarcane bagasse (start C/N 26) | Drift seaweed (Laminaria &, Cystoseira spp.) + horse mackerel (T. trachurus) + pine bark | Leaf and yard trimmings, food waste, manure, biosolids, urban waste | |
| Characteristic | Unit | ||||||
| C/N | 17 | 24 | 35 | 20 | 22 | 12–23 | |
| pH | 10.10 | 6.98 | 8.7 | 6.06 | 6.68 | 7.0–8.1 | |
| EC | dS · m−1 | 17.43 | 9.23 | 1.07 1 | 10.17 | 2.47 | 0.96–3.96 |
| tot-N | g · 100 g−1 DM | 1.35 | 1.20 | 2.76 | 1.3 | 2.11 | 1.2–2.1 |
| P | g · 100 g−1 DM | 1.17 | 0.69 | 0.38 | 0.11 | 0.61 | 0.23–0.94 |
| K | g · 100 g−1 DM | 6.15 | 2.31 | 3.92 | 1.62 | 0.7 | 0.45–1.18 |
| S | g · 100 g−1 DM | 1.08 | 3.57 | * | 2.36 | * | 0.18–0.23 |
| Ca | g · 100 g−1 DM | 14.2 | 3.0 | * | 0.42 | 0.99 | 1.93–3.93 |
| Mg | g · 100 g−1 DM | 1.78 | 1.04 | * | 2.27 | 0.28 | 0.27–0.71 |
| Na | g · 100 g−1 DM | 1.68 | 3.93 | * | 2.76 | 1.02 | 0.05–0.20 |
5. Conclusions
Author Contributions
Funding
Institutional Review Board Statement
Informed Consent Statement
Data Availability Statement
Acknowledgments
Conflicts of Interest
References
- Pozza, L.E.; Field, D.J. The Science of Soil Security and Food Security. In Soil Security; Elsevier Ltd.: Amsterdam, The Netherlands, 2020; Volume 1. [Google Scholar]
- Oliver, M.A.; Gregory, P.J. Soil, food security and human health: A review. Eur. J. Soil. Sci. 2015, 66, 257–276. [Google Scholar] [CrossRef]
- Gomiero, T. Soil degradation, land scarcity and food security: Reviewing a complex challenge. Sustainability 2016, 8, 281. [Google Scholar] [CrossRef]
- FAO; ITPS. Status of the World’s Soil Resources (SWSR)—Main Report; FAO: Rome, Italy, 2015. [Google Scholar]
- Davis, A.G.; Huggins, D.R.; Reganold, J.P. Linking soil health and ecological resilience to achieve agricultural sustainability. In Frontiers in Ecology and the Environment; John Wiley and Sons Inc.: Hoboken, NJ, USA, 2023; Volume 21, pp. 131–139. [Google Scholar]
- Qiao, L.; Wang, X.; Smith, P.; Fan, J.; Lu, Y.; Emmett, B.; Fan, M. Soil quality both increases crop production and improves resilience to climate change. Nat. Clim. Chang. 2022, 12, 574–580. [Google Scholar] [CrossRef]
- Wright, J.; Kenner, S.; Lingwall, B. Utilization of Compost as a Soil Amendment to Increase Soil Health and to Improve Crop Yields. Open J. Soil Sci. 2022, 12, 216–224. [Google Scholar] [CrossRef]
- Heisey, S.; Ryals, R.; Maaz, T.M.C.; Nguyen, N.H. A Single Application of Compost Can Leave Lasting Impacts on Soil Microbial Community Structure and Alter Cross-Domain Interaction Networks. Front. Soil Sci. 2022, 2, 749212. [Google Scholar] [CrossRef]
- Løes, A.K.; Ahuja, I.; De Boer, A. Harvesting Our Fertilisers from the Sea—An Approach to Close the Nutrient Gaps in Organic Farming. 2021. Available online: https://orgprints.org/id/eprint/42198/ (accessed on 17 December 2021).
- Ahuja, I.; Dauksas, E.; Remme, J.F.; Richardsen, R.; Løes, A.K. Fish and fish waste-based fertilizers in organic farming—With status in Norway: A review. Waste Manag. 2020, 115, 95–112. [Google Scholar] [CrossRef]
- Rudovica, V.; Rotter, A.; Gaudêncio, S.P.; Novoveská, L.; Akgül, F.; Akslen-Hoel, L.K.; Alexandrino, D.A.M.; Anne, O.; Arbidans, L.; Atanassova, M.R.; et al. Valorization of Marine Waste: Use of Industrial By-Products and Beach Wrack Towards the Production of High Added-Value Products. Front. Mar. Sci. 2021, 8, 723333. [Google Scholar] [CrossRef]
- Pereira, L.; Cotas, J. Historical Use of Seaweed as an Agricultural Fertilizer in the European Atlantic Area. In Seaweeds as Plant Fertilizer, Agricultural Biostimulants and Animal Fodder, 1st ed.; Pereira, L., Bahcevandziev, K., Joshi, N.H., Eds.; CRC Press: Boca Raton, FL, USA, 2019. [Google Scholar]
- Yun, J.H.; Archer, S.D.; Price, N.N. Valorization of waste materials from seaweed industry: An industry survey based biorefinery approach. Rev. Aquac. 2023, 15, 1020–1027. [Google Scholar] [CrossRef]
- OMRI. Generic Materials List. Eugene, Oregon: The Organic Materials Review Institute. 2024. Available online: https://www.omri.org/us-list (accessed on 4 June 2024).
- Stirk, W.A. World seaweed resources. S. Afr. J. Bot. 2006, 72, 666. [Google Scholar] [CrossRef]
- Spann, T.M.; Little, H.A. Applications of a Commercial Extract of the Brown Seaweed Ascophyllum nodosum Increases Drought Tolerance in Container-grown ‘Hamlin’ Sweet Orange Nursery Trees. HortScience 2011, 46, 577–582. [Google Scholar] [CrossRef]
- Illera-Vives, M.; Seoane Labandeira, S.; Fernández-Labrada, M.; López-Mosquera, M.E. Agricultural uses of seaweed. In Sustainable Seaweed Technologies: Cultivation, Biorefinery, and Applications; Elsevier: Amsterdam, The Netherlands, 2020; pp. 591–612. [Google Scholar]
- Illera Vives, M. Valorization of Fish Waste and Seaweed: Development and Evaluation of a Compost to Be Used in Organic Agriculture. Ph.D. Thesis, Universidad de Santiago de Compostella, A Coruña, Spain, 2015. [Google Scholar]
- Moloșag, A.; Pârvulescu, O.C.; Ion, V.A.; Asănică, A.C.; Soane, R.; Moț, A.; Dobrin, A.; Frîncu, M.; Løes, A.-K.; Cabell, J.; et al. Effects of Marine Residue-Derived Fertilizers on Strawberry Growth, Nutrient Content, Fruit Yield and Quality. Agronomy 2023, 13, 1221. [Google Scholar] [CrossRef]
- Maroulis, M.; Matsia, S.; Lazopoulos, G.; Pârvulescu, O.C.; Ion, V.A.; Bujor, O.-C.; Cabell, J.; Løes, A.-K.; Salifoglou, A. Chemical and Biological Profiling of Fish and Seaweed Residues to Be Applied for Plant Fertilization. Agronomy 2023, 13, 2258. [Google Scholar] [CrossRef]
- Silva, L.D.; Bahcevandziev, K.; Pereira, L. Production of bio-fertilizer from Ascophyllum nodosum and Sargassum muticum (Phaeophyceae). J. Oceanol. Limnol. 2019, 37, 918–927. [Google Scholar] [CrossRef]
- Oshins, C.; Michel, F.; Louis, P.; Richard, T.L.; Rynk, R. The composting process. In The Composting Handbook; Rynk, R., Black, G., Biala, J., Bonhotal, J., Cooperband, L., Gilbert, J., Eds.; Academic Press: Cambridge, MA, USA, 2022; pp. 51–101. [Google Scholar]
- Bollen, G.J.; Volker, D.; Wijnen, A.P. Inactivation of soil-borne plant pathogens during small-scale composting of crop residues. Neth. J. Plant Pathol. 1989, 95, 19–30. [Google Scholar] [CrossRef]
- Grundy, A.C.; Green, J.M.; Lennartsson, M. The Effect of Temperature on the Viability Of Weed Seeds in Compost. Compost. Sci. Util. 1998, 6, 26–33. [Google Scholar] [CrossRef]
- Tompkins, D.K.; Chaw, D.; Abiola, A.T. Effect of Windrow Composting on Weed Seed Germination and Viability. Compost. Sci. Util. 1998, 6, 30–34. [Google Scholar] [CrossRef]
- Lin, C.; Cheruiyot, N.K.; Bui, X.T.; Ngo, H.H. Composting and its application in bioremediation of organic contaminants. Bioengineered 2022, 13, 1073–1089. [Google Scholar] [CrossRef]
- Guo, X.X.; Liu, H.T.; Wu, S.B. Humic substances developed during organic waste composting: Formation mechanisms, structural properties, and agronomic functions. Sci. Total Environ. 2019, 662, 501–510. [Google Scholar] [CrossRef]
- Adugna, G. A review on impact of compost on soil properties, water use and crop productivity. Agric. Sci. Res. J. 2018, 4, 93–104. [Google Scholar]
- Cole, A.J.; Roberts, D.A.; Garside, A.L.; de Nys, R.; Paul, N.A. Seaweed compost for agricultural crop production. J. Appl. Phycol. 2016, 28, 629–642. [Google Scholar] [CrossRef]
- Laos, F.; Mazzarino, M.J.; Walter, I.; Roselli, L. Composting of Fish Waste with Wood By-Products and Testing Compost Quality as a Soil Amendment: Experiences in the Patagonia Region of Argentina. Compost. Sci. Util. 1998, 6, 59–66. [Google Scholar] [CrossRef]
- Martin, A.M. Composting of seafood wastes. In Maximising the Value of Marine By-Products; Elsevier Ltd.: Amsterdam, The Netherlands, 2006; pp. 486–515. [Google Scholar]
- Illera-Vives, M.; Seoane Labandeira, S.; Iglesias Loureiro, L.; López-Mosquera, M.E. Agronomic assessment of a compost consisting of seaweed and fish waste as an organic fertilizer for organic potato crops. J. Appl. Phycol. 2017, 29, 1663–1671. [Google Scholar]
- Illera-Vives, M.; Seoane Labandeira, S.; Brito, L.M.; López-Fabal, A.; López-Mosquera, M.E. Evaluation of compost from seaweed and fish waste as a fertilizer for horticultural use. Sci. Hortic. 2015, 186, 101–107. [Google Scholar] [CrossRef]
- Brinton, W.F.; Seekins, M.D. Composting Fish Byproducts: A Feasibility Study; Woods End Research Laboratory: Mt. Vernon, ME, USA, 1988. [Google Scholar]
- Illera-Vives, M.; Seoane Labandeira, S.; López-Mosquera, M.E. Production of compost from marine waste: Evaluation of the product for use in ecological agriculture. J. Appl. Phycol. 2013, 25, 1395–1403. [Google Scholar] [CrossRef]
- Dróżdż, D.; Malińska, K.; Kacprzak, M.; Mrowiec, M.; Szczypiór, A.; Postawa, P.; Stachowiak, T. Potential of Fish Pond Sediments Composts as Organic Fertilizers. Waste Biomass Valorization 2020, 11, 5151–5163. [Google Scholar] [CrossRef]
- Sokač, T.; Valinger, D.; Benković, M.; Jurina, T.; Gajdoš Kljusurić, J.; Radojčić Redovniković, I.; Jurinjak Tušek, A. Application of Optimization and Modeling for the Composting Process Enhancement. Processes 2022, 10, 229. [Google Scholar] [CrossRef]
- Bernal, M.P.; Sommer, S.G.; Chadwick, D.; Qing, C.; Guoxue, L.; Michel, F.C. Current Approaches and Future Trends in Compost Quality Criteria for Agronomic, Environmental, and Human Health Benefits. Adv. Agron. 2017, 144, 143–233. [Google Scholar]
- Körner, I.; Braukmeier, J.; Herrenklage, J.; Leikam, K.; Ritzkowski, M.; Schlegelmilch, M.; Stegmann, R. Investigation and optimization of composting processes—Test systems and practical examples. Waste Manag. 2003, 23, 17–26. [Google Scholar] [CrossRef]
- Nordahl, S.L.; Preble, C.V.; Kirchstetter, T.W.; Scown, C.D. Greenhouse Gas and Air Pollutant Emissions from Composting. Environ. Sci. Technol. 2023, 57, 2235–2247. [Google Scholar] [CrossRef]
- Zhang, H.; Schuchardt, F.; Li, G.; Yang, J.; Yang, Q. Emission of volatile sulfur compounds during composting of municipal solid waste (MSW). Waste Manag. 2013, 33, 957–963. [Google Scholar] [CrossRef]
- Pereira, L.; Morrison, L.; Shukla, P.S.; Critchley, A.T. A concise review of the brown macroalga Ascophyllum nodosum (Linnaeus) Le Jolis. J. Appl. Phycol. 2020, 32, 3561–3584. [Google Scholar] [CrossRef]
- Hrólfsdóttir, A.Þ.; Arason, S.; Sveinsdóttir, H.I.; Gudjónsdóttir, M. Added Value of Ascophyllum nodosum Side Stream Utilization during Seaweed Meal Processing. Mar. Drugs 2022, 20, 340. [Google Scholar] [CrossRef] [PubMed]
- Shukla, P.S.; Mantin, E.G.; Adil, M.; Bajpai, S.; Critchley, A.T.; Prithiviraj, B. Ascophyllum nodosum-based biostimulants: Sustainable applications in agriculture for the stimulation of plant growth, stress tolerance, and disease management. Front. Plant Sci. 2019, 10, 462648. [Google Scholar] [CrossRef]
- Szmidt, R.A.K. Composting Processing Residuals Of Seaweed (Ascophyllum nodosum). Compost. Sci. Util. 1997, 5, 78–86. [Google Scholar] [CrossRef]
- Løes, A.K.; Ahlin, J.P.; Ahuja, I.; Krogstad, T.; Smevoll, S.; Waag, H. Effects of Formic Acid Preservation of Fishbones on the Extractability of Ammonium Lactate–Acetate Soluble Calcium, Phosphorus, Magnesium, and Potassium. Waste Biomass Valorization 2022, 13, 3547–3559. [Google Scholar] [CrossRef]
- Ahuja, I.; Løes, A.K. Effect of Fish Bones and Algae Fiber as Fertilisers for Ryegrass. Tingvoll, Norge. 2019. Available online: https://orgprints.org/id/eprint/36439/ (accessed on 5 November 2019).
- Løes, A.K.; Ahuja, I.; de Boer, A.; Rittl, T. Fertilisation Effects of Marine-Derived Residual Materials on Agricultural Crops. Available online: https://orgprints.org/id/eprint/45330/ (accessed on 18 January 2023).
- Brinton, W.F.; Evans, E.; Droffner, M.L.; Brinton, R.B. Standardized Test for Evaluation of Compost Self-Heating. Biocycle 1995, 36, 64–69. [Google Scholar]
- BS EN 16087-2; Soil Improvers and Growing Media—Determination of Aerobic Biological Activity Part 2: Self-Heating Test for Compost. European Committee for Standardization: Brussels, Belgium, 2011.
- Cabell, J.; Løes, A.K. Blue Biomass Composting Technology. Tingvoll. 2023. Available online: https://orgprints.org/id/eprint/50477/1/NORS%C3%98K%20rapport%20nr%204%20vol%208%202023%20Blue%20biomass%20composting%20technology.pdf (accessed on 17 June 2024).
- Koenig, A.; Bari, Q.H. Application of self-heating test for indirect estimation of respirometric activity of compost: Theory and practice. Compost. Sci. Util. 2000, 8, 99–107. [Google Scholar] [CrossRef]
- Miloştean, D.; Flori, M. Study of biodegradable waste compostability through self-heating test. Ann. Fac. Eng. Hunedoara 2021, 19, 107–110. [Google Scholar]
- Nelson, D.W.; Sommers, L.E. Total Carbon, Organic Carbon, and Organic Matter. In Methods of Soil Analysis: Part 2 Chemical and Microbiological Properties; Page, A.L., Ed.; American Society of Agronomy, Inc./Soil Science Society of America, Inc.: Madison, WI, USA, 1982; pp. 539–579. [Google Scholar]
- Bremner, J.M.; Mulvaney, C.S. Nitrogen—Total. In Methods of Soil Analysis: Part 2 Chemical and Microbiological Properties; Page, A.L., Ed.; American Society of Agronomy, Inc./Soil Science Society of America, Inc.: Madison, WI, USA, 1982; pp. 595–624. [Google Scholar]
- McMaster, G.S.; Wilhelm, M.M. Growing degree-days: One equation, two interpretations. Agric. For. Meteorol. 1997, 87, 291–300. [Google Scholar] [CrossRef]
- Vandaele, E. Hygienisation Requirements for Composting. Antwerp. 2019. Available online: https://northsearegion.eu/media/16203/hygienisation_-for-soilcomher.pdf (accessed on 27 June 2024).
- USDA. Soil Fertility and Crop Nutrient Management Practice Standard. 7 CFR 205.203 USA: 65 FR 80637. 21 December 2000. Available online: https://www.ecfr.gov/current/title-7/part-205/section-205.203 (accessed on 27 June 2024).
- Marschner, P. Marschner’s Mineral Nutrition of Higher Plants, 3rd ed.; Marschner, P., Ed.; Elsevier: Amsterdam, The Netherlands, 2012. [Google Scholar]
- Pérez, T.; Vergara, S.E.; Silver, W.L. Assessing the climate change mitigation potential from food waste composting. Sci. Rep. 2023, 13, 7608. [Google Scholar] [CrossRef]
- Peigne, J.; Girardin, P. Environmental Impacts of Farm-Scale Composting Practices. Water Air Soil. Pollut. 2004, 153, 45–68. [Google Scholar] [CrossRef]
- Ho, T.T.K.; Tra, V.T.; Le, T.H.; Nguyen, N.-K.; Tran, C.-S.; Nguyen, P.-T.; Vo, T.-D.; Thai, V.-N.; Bui, X.-T. Compost to improve sustainable soil cultivation and crop productivity. Case Stud. Chem. Environ. Eng. 2022, 6, 100211. [Google Scholar] [CrossRef]
- Cáceres, R.; Malińska, K.; Marfà, O. Nitrification within composting: A review. Waste Manag. 2018, 72, 119–137. [Google Scholar] [CrossRef]
- Wong, J.W.C.; Wang, X.; Selvam, A. Improving Compost Quality by Controlling Nitrogen Loss During Composting. In Current Developments in Biotechnology and Bioengineering; Elsevier: Amsterdam, The Netherlands, 2017; pp. 59–82. [Google Scholar]
- Antil, R.S.; Raj, D. Chemical and microbiological parameters for the characterization of maturity of composts made from farm and agro-industrial wastes. Arch. Agron. Soil. Sci. 2012, 58, 833–845. [Google Scholar] [CrossRef]
- VanderGheynst, J.S.; Pettygrove, S.; Dooley, T.M.; Arnold, K.A. Estimating Electrical Conductivity of Compost Extracts at Different Extraction Ratios. Compost. Sci. Util. 2004, 12, 202–207. [Google Scholar] [CrossRef]
- Eyras, M.C.; Defossé, G.E.; Dellatorre, F. Seaweed Compost as an Amendment for Horticultural Soils in Patagonia, Argentina. Compost. Sci. Util. 2008, 16, 119–124. [Google Scholar] [CrossRef]
- Bedolla-Rivera, H.I.; Conde-Barajas, E.; Galván-Díaz, S.L.; Gámez-Vázquez, F.P.; Álvarez-Bernal, D.; Xochilt Negrete-Rodríguez, M.d.l.L. Compost Quality Indexes (CQIs) of Biosolids Using Physicochemical, Biological and Ecophysiological Indicators: C and N Mineralization Dynamics. Agronomy 2022, 12, 2290. [Google Scholar] [CrossRef]
- Gondek, M.; Weindorf, D.C.; Thiel, C.; Kleinheinz, G. Soluble Salts in Compost and Their Effects on Soil and Plants: A Review. Compost Sci Util 2020, 28, 59–75. [Google Scholar] [CrossRef]
- Gao, M.; Liang, F.; Yu, A.; Li, B.; Yang, L. Evaluation of stability and maturity during forced-aeration composting of chicken manure and sawdust at different C/N ratios. Chemosphere 2010, 78, 614–619. [Google Scholar] [CrossRef]
- Gómez-Brandón, M.; Lazcano, C.; Domínguez, J. The evaluation of stability and maturity during the composting of cattle manure. Chemosphere 2008, 70, 436–444. [Google Scholar] [CrossRef]
- Reyes-Torres, M.; Oviedo-Ocaña, E.R.; Dominguez, I.; Komilis, D.; Sánchez, A. A systematic review on the composting of green waste: Feedstock quality and optimization strategies. Waste Manag. 2018, 77, 486–499. [Google Scholar] [CrossRef]
- Binner, E.; Smidt, E.; Tintner, J.; Böhm, K.; Lechner, P. How to enhance humification during composting of separately collected biowaste: Impact of feedstock and processing. Waste Manag. Res. 2011, 29, 1153–1163. [Google Scholar] [CrossRef] [PubMed]
- Moen, E.; Horn, S.; Østgaard, K. Biological degradation of Ascophyllum nodosum. J. Appl. Phycol. 1997, 9, 347–357. [Google Scholar] [CrossRef]
- Rajauria, G.; Ravindran, R.; Garcia-Vaquero, M.; Rai, D.K.; Sweeney, T.; O’Doherty, J. Purification and Molecular Characterization of Fucoidan Isolated from Ascophyllum nodosum Brown Seaweed Grown in Ireland. Mar. Drugs 2023, 21, 315. [Google Scholar] [CrossRef] [PubMed]
- EU. Commission Decision (EU) 2022/1244 of 13 July 2022 Establishing the EU Ecolabel Criteria for Growing Media and Soil Improvers (Notified under Document C(2022) 4758) (Text with EEA Relevance). 2022/1244 2022. Available online: https://eur-lex.europa.eu/legal-content/en/TXT/?uri=CELEX%3A32022D1244 (accessed on 12 August 2024).
- Stehouwer, R.; Cooperband, L.; Rynk, R.; Biala, J.; Bonhotal, J.; Antler, S.; Nichols, H. Compost characteristics and quality. In The Composting Handbook; Elsevier: Amsterdam, The Netherlands, 2022; pp. 737–775. [Google Scholar]
- Amézketa, E. Soil Aggregate Stability: A Review. J. Sustain. Agric. 1999, 14, 83–151. [Google Scholar] [CrossRef]
- Wakeel, A. Potassium–sodium interactions in soil and plant under saline-sodic conditions. J. Plant Nutr. Soil Sci. 2013, 176, 344–354. [Google Scholar] [CrossRef]
- Kronzucker, H.J.; Coskun, D.; Schulze, L.M.; Wong, J.R.; Britto, D.T. Sodium as nutrient and toxicant. Plant Soil 2013, 369, 1–23. [Google Scholar] [CrossRef]
- Munns, R. Comparative physiology of salt and water stress. Plant Cell Environ. 2002, 25, 239–250. [Google Scholar] [CrossRef]
- Walker, D.J.; Bernal, M.P. The effects of olive mill waste compost and poultry manure on the availability and plant uptake of nutrients in a highly saline soil. Bioresour. Technol. 2008, 99, 396–403. [Google Scholar] [CrossRef]
- Zikeli, S.; Weiler, C.S.; Løes, A.K.; Conroy, J.; Rayns, F.; Touliatos, D.; Malińska, K.; Dróżdż, D.; Laursen, C. Pathways to Phase out Contentious Inputs from Organic Agriculture in Europe Deliverable 5.7: Technical Report on Alternative Fertiliser (Arable and Vegetables). Hohenheim. 2022. Available online: https://orgprints.org/id/eprint/40076/1/D5.7%20O%2B%20Technical%20report%20on%20alternative%20fertiliser%20%28arable%20and%20vegetables%29.pdf (accessed on 12 August 2024).
- FOR-2003-07-04-951; Forskrift om Gjødselvarer mv. av Organisk Opphav (in Norwegian). Norway. Available online: https://lovdata.no/dokument/SF/forskrift/2003-07-04-951/ (accessed on 15 February 2024).
- EU. Regulation (EU) 2019/1009 of the European Parliament and of the Council of 5 June 2019 Laying down the Rules on the Making Available on the Market of EU Fertilising Products and Amending Regulations (EC) No 1069/2009 and (EC) No 1107/2009 and Repealing Regulation (EC) No 2003/2003. EU. Available online: http://data.europa.eu/eli/reg/2019/1009/oj (accessed on 15 February 2024).
| Unit | GS | AF | FB | FM | MU | |
|---|---|---|---|---|---|---|
| Dry matter (after drying and milling) 1 | g · 100 g−1 | 89 | 90 | 95 | 90 | 98 |
| Loss on ignition 1 | g · 100 g−1 DM | 67 | 57 | 34 | 65 | 16 |
| pH (1:5) 2 | 5.6 | 9.5 | 7.0 | 6.3 | 7.2 | |
| Electrical conductivity (1:5) 2 | dS · m−1 | 15.26 | 13.78 | 16.80 | 10.86 | 8.84 |
| Total carbon 2 | g · 100 g−1 DM | 37.7 | 35.8 | 15.4 | 35.3 | 15.2 |
| Total organic carbon 3 | g · 100 g−1 DM | 32 | 28 | 14 | 30 | 8 |
| % total organic carbon of total carbon | % | 84 | 78 | 93 | 86 | 53 |
| Total nitrogen 2 | g · 100 g−1 DM | 0.94 | 0.52 | 4.83 | 9.97 | 1.44 |
| C/N | 40 | 69 | 3 | 4 | 11 | |
| P 3 | g · 100 g−1 DM | 0.09 | 0.34 | 12.24 | 3.11 | 0.14 |
| K 3 | g · 100 g−1 DM | 1.86 | 5.02 | 0.14 | 5.21 | 0.31 |
| S 3 | g · 100 g−1 DM | 2.75 | 0.86 | 0.27 | 0.89 | 0.37 |
| Ca 3 | g · 100 g−1 DM | 1.50 | 9.78 | 25.47 | 15.82 | 35.97 |
| Mg 3 | g · 100 g−1 DM | 0.80 | 1.38 | 0.33 | 1.51 | 0.16 |
| Na 3 | g · 100 g−1 DM | 3.26 | 1.22 | 0.52 | 1.38 | 0.98 |
| Treatment Code | C-Rich Feedstock (AF or GS) | N-Rich Feedstock (FB, FM, or MU) | Ratio of Feedstocks | Water | Leca® | Total | Weight of Sample Removed | |
|---|---|---|---|---|---|---|---|---|
| g | g | g | L | g | L | g | ||
| AF + FB | 1900 | 365 | 5:1 | 3430 | 2.0 | 6270 | 8.27 | 85 |
| AF + FM | 2000 | 195 | 10:1 | 3268 | 2.0 | 6017 | 7.97 | 84 |
| AF + MU | 1400 | 880 | 2:1 | 3655 | 2.0 | 6505 | 8.21 | 107 |
| GS + FB | 2000 | 100 | 20:1 | 3236 | 2.0 | 5892 | 8.01 | 87 |
| GS + FM | 2100 | 53 | 40:1 | 3304 | 2.0 | 6027 | 8.21 | 91 |
| GS + MU | 1900 | 310 | 6:1 | 3471 | 2.0 | 6261 | 8.35 | 86 |
| Treatment | MTt °C | MT1 °C | MT2 °C | MT3 °C | RDD >20 °C | TDD >45 °C | HDD >55 °C |
|---|---|---|---|---|---|---|---|
| AF + FB | 34.0 AB ± 1.0 | 46.1 B ± 0.8 | 32.2 AB ± 1.5 | 23.7 A ± 1.2 | 1262 AB ± 92.1 | 178 B ± 19.7 | 12 AB ± 1.9 |
| AF + FM | 37.0 A ± 1.5 | 51.7 A ± 0.9 | 32.8 AB ± 1.7 | 26.6 A ± 2.1 | 1529 A ± 128 | 283 A ± 22.6 | 41 A ± 17.0 |
| AF + MU | 32.5 ABC ± 1.8 | 29.5 C ± 0.9 | 39.1 A ± 2.2 | 28.9 A ± 2.5 | 1148 ABC ± 166 | 68 C ± 22.1 | 5 B ± 5.0 |
| GS + FB | 28.7 C ± 0.3 | 30.7 C ± 0.1 | 24.8 C ± 0.8 | 30.7 A ± 0.2 | 781 C ± 31.4 | 23 C ± 5.8 | 0 B ± 0 |
| GS + FM | 28.6 C ± 0.2 | 29.8 C ± 0.2 | 29.3 BC ± 1.7 | 26.5 A ± 1.2 | 780 C ± 21.6 | 1 C ± 0.8 | 0 B ± 0 |
| GS + MU | 29.7 BC ± 0.8 | 31.9 C ± 2.1 | 32.4 AB ± 0.6 | 24.8 A ± 0.1 | 884 BC ± 69.5 | 32 C ± 31.9 | 1 B ± 0.6 |
| Characteristic | Unit | AF + FB | AF + FM | AF + MU | GS + FB | GS + FM | GS + MU | |
|---|---|---|---|---|---|---|---|---|
| Moisture content | % weight | S | 64.0 | 63.4 | 64.7 | 65.3 | 65.5 | 64.4 |
| F | 41.7 ± 1.4 | 37.2 ± 0.7 | 47.1 ± 0.0 | 51.6 ± 0.2 | 51.5 ± 1.0 | 50.0 ± 1.4 | ||
| %Δ | −35 B ± 2.1 | −41 B ± 1.1 | −27 A ± 0.1 | −21 A ± 0.3 | −21 A ± 1.5 | −22 A ± 2.1 | ||
| Loss on ignition | g · 100 g−1 DM | S | 52.3 | 58.5 | 40.9 | 75.6 | 77.9 | 67.5 |
| F | 31.3 ± 0.2 | 42.8 ± 0.7 | 15.4 ± 0.7 | 65.5 ± 1.3 | 64.7 ± 1.1 | 52.0 ± 1.1 | ||
| %Δ | −40 D ± 0.4 | −27 C ± 1.1 | −62 E ± 1.5 | −14 A ± 1.7 | −17 AB ± 1.4 | −23 BC ± 1.7 | ||
| Weight of flask contents | g | S | 1325 | 1280 | 1595 | 1260 | 1190 | 1295 |
| F | 670 ± 12.6 | 592 ± 8.3 | 930 ± 21.8 | 755 ± 5.8 | 695 ± 2.9 | 797 ± 6.7 | ||
| %Δ | −49 B ± 1.0 | −54 C ± 0.7 | −42 A ± 1.4 | −40 A ± 0.5 | −42 A ± 0.2 | −39 A ± 0.5 | ||
| Volume of flask contents | ml | S | 2075 | 2075 | 2075 | 2075 | 2075 | 2075 |
| F | 1296 ± 19.7 | 1200 ± 19.8 | 1568 ± 24.0 | 1508 ± 36.4 | 1438 ± 9.4 | 1595 ± 12.9 | ||
| %Δ | −38 C ± 1.0 | −42 C ± 1.0 | −24 A ± 1.2 | −27 AB ± 1.8 | −31 B ± 0.5 | −23 A ± 0.6 | ||
| Bulk density | g · L−1 | S | 639 | 617 | 769 | 607 | 573 | 624 |
| F | 517 ± 2.5 | 493 ± 3.4 | 593 ± 5.6 | 501 ± 9.0 | 483 ± 3.7 | 499 ± 5.7 | ||
| %Δ | −19 ABC ± 0.4 | −20 BC ± 0.6 | −23 C ± 0.7 | −18 AB ± 1.5 | −16 A ± 0.6 | −20 BC ± 0.9 | ||
| DM content/flask | g | S | 477 | 469 | 563 | 437 | 411 | 461 |
| F | 391 ± 2.9 | 372 ± 4.3 | 492 ± 11.9 | 366 ± 1.4 | 337 ± 5.4 | 398 ± 7.5 | ||
| %Δ | −18 AB ± 0.6 | −21 B ± 0.9 | −13 A ± 2.1 | −16 AB ± 0.3 | −18 AB ± 1.3 | −14 A ± 1.6 | ||
| pH | S | 9.45 | 9.61 | 9.43 | 6.60 | 6.62 | 6.97 | |
| F | 10.02 ± 0.02 | 10.10 ± 0.02 | 9.81 ± 0.02 | 6.98 ± 0.10 | 6.84 ± 0.01 | 8.16 ± 0.11 | ||
| %Δ 1 | −73 BC ± 1.1 | −68 B ± 1.8 | −59 AB ± 2.3 | −56 AB ± 10.4 | −40 A ± 1.7 | −93 C ± 1.8 | ||
| Electrical conductivity | dS · m−1 | S | 11.00 | 12.78 | 11.62 | 11.02 | 11.28 | 11.08 |
| F | 17.07 ± 0.15 | 17.43 ± 1.02 | 15.33 ± 0.46 | 9.23 ± 0.46 | 10.52 ± 0.87 | 9.85 ± 0.74 | ||
| %Δ | 55 A ± 1.4 | 36 A ± 8.0 | 32 A ± 4.0 | −12 B ± 4.2 | −7 B ± 7.7 | −11 B ± 6.6 | ||
| Total C | g · 100 g−1 DM | S | 32.2 | 36.0 | 26.9 | 36.7 | 36.8 | 34.4 |
| F | 22.9 ± 0.4 | 26.8 ± 0.2 | 20.3 ± 0.2 | 33.5 ± 0.1 | 34.5 ± 0.3 | 29.5 ± 0.1 | ||
| %Δ | −29 D ± 1.4 | −26 CD ± 0.4 | −24 C ± 1.0 | −9 A ± 0.3 | −6 A ± 0.8 | −14 B ± 0.4 | ||
| Total N | g · 100 g−1 DM | S | 1.33 | 1.34 | 0.96 | 1.20 | 1.22 | 1.00 |
| F | 1.53 ± 0.01 | 1.54 ± 0.04 | 0.97 ± 0.01 | 1.41 ± 0.03 | 1.45 ± 0.03 | 1.26 ± 0.07 | ||
| %Δ | 15 AB ± 1.1 | 15 AB ± 3.0 | 1 B ± 0.6 | 29 A ± 2.6 | 19 A ± 2.6 | 26 A ± 6.9 | ||
| C/N | S | 24 | 27 | 28 | 34 | 30 | 34 | |
| F | 15 ± 0.3 | 17 ± 0.5 | 21 ± 0.3 | 24 ± 0.4 | 24 ± 0.4 | 24 ± 1.3 | ||
| %Δ | −38 C ± 1.1 | −35 C ± 1.7 | −25 AB ± 1.1 | −29 ABC ± 1.3 | −21 A ± 1.3 | −31 BC ± 3.7 |
| Mineral | Unit | AF + FB | AF + FM | AF + MU | GS + FB | GS + FM | GS + MU | |
|---|---|---|---|---|---|---|---|---|
| Total C | g · 100 g−1 DM | S | 33.6 | 37.2 | 29.7 | 37.5 | 38.4 | 35.1 |
| F | 23.7 | 27.0 | 20.4 | 33.7 | 35.3 | 30.9 | ||
| %Δ | −30 | −27 | −31 | −10 | −8 | −12 | ||
| Total C | g/flask | S | 160.4 | 174.2 | 167.1 | 163.8 | 157.9 | 161.9 |
| F | 92.7 | 100.4 | 100.4 | 123.3 | 119.0 | 123.0 | ||
| %Δ | −42 | −42 | −40 | −25 | −25 | −24 | ||
| Total N | g · 100 g−1 DM | S | 1.34 | 1.33 | 0.86 | 1.12 | 1.17 | 0.99 |
| F | 1.26 | 1.35 | 0.83 | 1.20 | 1.08 | 0.98 | ||
| %Δ | −6 | −1 | −3 | −7 | −8 | −1 | ||
| Total N | g/flask | S | 6.4 | 6.3 | 4.8 | 4.9 | 4.8 | 4.6 |
| F | 4.9 | 5.0 | 4.1 | 4.4 | 3.6 | 3.9 | ||
| %Δ | −23 | −19 | −15 | −10 | −25 | −15 | ||
| P | g · 100 g−1 DM | S | 2.48 | 0.59 | 0.27 | 0.70 | 0.18 | 0.10 |
| F | 3.07 | 1.17 | 0.31 | 0.69 | 0.25 | 0.10 | ||
| %Δ | 24 | 98 | 16 | −1 | 40 | 3 | ||
| P | g/flask | S | 11.8 | 2.8 | 1.5 | 3.0 | 0.7 | 0.5 |
| F | 11.8 | 4.0 | 1.5 | 2.5 | 0.8 | 0.4 | ||
| %Δ | 1 | 57 | 2 | −17 | 15 | −11 | ||
| K | g · 100 g−1 DM | S | 4.14 | 5.03 | 3.23 | 1.77 | 1.96 | 1.61 |
| F | 5.36 | 6.15 | 3.66 | 2.31 | 2.43 | 2.22 | ||
| %Δ | 30 | 22 | 13 | 30 | 24 | 38 | ||
| K | g/flask | S | 19.7 | 23.6 | 18.2 | 7.8 | 8.0 | 7.4 |
| F | 21.0 | 23.0 | 18.0 | 8.5 | 8.2 | 8.8 | ||
| %Δ | 6 | −3 | −1 | 9 | 2 | 19 |
| Mineral | Unit | AF + FB | AF + FM | AF + MU | GS + FB | GS + FM | GS + MU | |
|---|---|---|---|---|---|---|---|---|
| S | g · 100 g−1 DM | S | 0.75 | 0.86 | 0.67 | 2.63 | 2.69 | 2.37 |
| F | 0.94 | 1.08 | 0.71 | 3.57 | 3.81 | 3.39 | ||
| %Δ | 25 | 25 | 6 | 36 | 41 | 43 | ||
| S | g/flask | S | 3.6 | 4.0 | 3.8 | 11.5 | 11.1 | 10.9 |
| F | 3.7 | 4.0 | 3.5 | 13.1 | 12.8 | 13.5 | ||
| %Δ | 2 | −1 | −8 | 14 | 16 | 24 | ||
| Ca | g · 100 g−1 DM | S | 12.6 | 10.3 | 19.7 | 2.7 | 1.9 | 7.0 |
| F | 16.8 | 14.2 | 23.9 | 3.0 | 2.5 | 7.5 | ||
| %Δ | 33 | 38 | 21 | 11 | 30 | 7 | ||
| Ca | g/flask | S | 60.1 | 48.4 | 111.1 | 11.8 | 7.9 | 32.3 |
| F | 65.7 | 52.8 | 117.6 | 11.0 | 8.4 | 30.0 | ||
| %Δ | 9 | 9 | 6 | −7 | 7 | −8 | ||
| Mg | g · 100 g−1 DM | S | 1.19 | 1.39 | 0.92 | 0.78 | 0.82 | 0.70 |
| F | 1.61 | 1.78 | 1.07 | 1.04 | 1.12 | 0.93 | ||
| %Δ | 35 | 28 | 17 | 33 | 36 | 33 | ||
| Mg | g/flask | S | 5.7 | 6.5 | 5.2 | 3.4 | 3.4 | 3.2 |
| F | 6.3 | 6.6 | 5.3 | 3.8 | 3.8 | 3.7 | ||
| %Δ | 11 | 2 | 2 | 12 | 12 | 15 | ||
| Na | g · 100 g−1 DM | S | 1.10 | 1.24 | 1.13 | 3.12 | 3.20 | 2.89 |
| F | 1.42 | 1.68 | 1.25 | 3.93 | 4.22 | 3.85 | ||
| %Δ | 30 | 36 | 11 | 26 | 32 | 33 | ||
| Na | g/flask | S | 5.2 | 5.8 | 6.4 | 13.6 | 13.1 | 13.3 |
| F | 5.6 | 6.2 | 6.2 | 14.4 | 14.2 | 15.3 | ||
| %Δ | 6 | 8 | −4 | 6 | 8 | 15 |
Disclaimer/Publisher’s Note: The statements, opinions and data contained in all publications are solely those of the individual author(s) and contributor(s) and not of MDPI and/or the editor(s). MDPI and/or the editor(s) disclaim responsibility for any injury to people or property resulting from any ideas, methods, instructions or products referred to in the content. |
© 2024 by the authors. Licensee MDPI, Basel, Switzerland. This article is an open access article distributed under the terms and conditions of the Creative Commons Attribution (CC BY) license (https://creativecommons.org/licenses/by/4.0/).
Share and Cite
Cabell, J.; Eich-Greatorex, S.; Ion, V.A.; Krogstad, T.; Matsia, S.; Perikli, M.; Salifoglou, A.; Løes, A.-K. Suitability of Residues from Seaweed and Fish Processing for Composting and as Fertilizer. Sustainability 2024, 16, 7190. https://doi.org/10.3390/su16167190
Cabell J, Eich-Greatorex S, Ion VA, Krogstad T, Matsia S, Perikli M, Salifoglou A, Løes A-K. Suitability of Residues from Seaweed and Fish Processing for Composting and as Fertilizer. Sustainability. 2024; 16(16):7190. https://doi.org/10.3390/su16167190
Chicago/Turabian StyleCabell, Joshua, Susanne Eich-Greatorex, Violeta Alexandra Ion, Tore Krogstad, Sevasti Matsia, Maria Perikli, Athanasios Salifoglou, and Anne-Kristin Løes. 2024. "Suitability of Residues from Seaweed and Fish Processing for Composting and as Fertilizer" Sustainability 16, no. 16: 7190. https://doi.org/10.3390/su16167190
APA StyleCabell, J., Eich-Greatorex, S., Ion, V. A., Krogstad, T., Matsia, S., Perikli, M., Salifoglou, A., & Løes, A.-K. (2024). Suitability of Residues from Seaweed and Fish Processing for Composting and as Fertilizer. Sustainability, 16(16), 7190. https://doi.org/10.3390/su16167190