Article

Seasonal Variation in the Element Composition of Dried, Powdered Green Sea Urchin (Strongylocentrotus droebachiensis) from Northern Norway

Nofima, Muninbakken 9, 9019 Tromsø, Norway
*
Author to whom correspondence should be addressed.
Sustainability 2024, 16(16), 6727; https://doi.org/10.3390/su16166727
Submission received: 18 June 2024 / Revised: 30 July 2024 / Accepted: 4 August 2024 / Published: 6 August 2024
(This article belongs to the Special Issue Marine Biomass as the Basis for a Bio-Based, Circular Economy)

Abstract

:
In many countries, such as Norway, there are vast quantities of sea urchins that have formed barrens over large areas of the coastline. Research has shown that removal of sufficient quantities of sea urchins from these barrens can lead to them reverting to a macroalgae forest. Identifying the chemical composition of sea urchins for various uses, such as agricultural fertiliser, would incentivise this sea urchin removal. This study investigates the composition of sea urchins and whether the composition varies when sea urchin collection sites vary both geographically and temporally. Sea urchins were collected from three sites within 10 km of each other in northern Norway at three times through the year. The sea urchins were dried, crushed, powdered, and analysed for nutrient content. An elemental analysis from the sea urchin samples showed high calcium and relatively high magnesium levels; smaller relative quantities of nitrogen, phosphorous, and potassium were also found. Micronutrients such as iron (Fe), zinc (Zn), manganese (Mn), and copper (Cu) were found. More importantly, both primary, macro-, and micronutrients showed high variability when collected from different sites and at different times of the year. This will be a critical consideration when investigating the use of this product as a plant fertiliser or for any other use.

1. Introduction

Kelp forests are very productive ecosystems found along one quarter of global coasts where they provide important ecosystem services such as erosion protection, as well as providing food and habitat for many important marine species [1,2]. Laminariales are the main order that compose the kelp forests, and these species are actively grazed by sea urchins. This can be extensive, such that the seaweeds completely disappear from certain areas forming extensive sea urchin “barrens” with a very high population density of sea urchins [3,4,5]. Generally, these sea urchins have very little roe, as there is very little food available to them, which removes any value as a food product unless they can be harvested and enhanced. The enhancement process consists of holding them in captivity for a period and feeding them formulated feeds that increase the size and quality of the roe to the point that they can be marketed as a seafood commodity [6]. There are extensive efforts to develop sea urchin enhancement, but at this point, it is still at the semicommercial scale in several countries. In Norway, where the sea urchin population along the coastline is estimated to be around 80 billion individuals, it is accepted that only a small fraction of this sea urchin population will be large enough or suitable for enhancement [6,7]. Alternatively, it is possible to simply harvest them from the sea urchin barrens for alternative uses for a significant biomass of whole sea urchins [5]. To encourage this and to make this activity an economically viable proposition it is important to generate value from this sea urchin biomass.
Some of the previous research conducted on sea urchin biomass (non-food sea urchin tissue) includes the extraction of collagens [8], egg-laying hen calcium supplements [9], hydrolyzation of sea urchins [10], and for supplying nutrients to macroalgae seedlings [11]. An additional possible use is as a fertiliser or agricultural biostimulant [12,13] and this is the primary focus of this study. The effectivity of this application relies on knowing the elemental composition of the sea urchin material and any variation that exists in the composition. A recent study investigated the use of sea urchin waste from the fishery industry as an organic fertiliser [12]. This study was conducted on the Tasmanian coast, south-east of Australia, where sea urchins are overgrazing the local kelp forests [14]. In this study they used dried long spined sea urchins’ (Centrostephanus rodgersii) shells (with the roe removed) crushed to a powder as fertiliser for growing tomato plants. The tomato growth study compared different growth parameters in plants fertilized with standard Hoagland liquid fertiliser [15] applied twice a week and plants fertilized with different sea urchin waste powder concentrations. That study showed that plants planted in a potting mix of 5% powder (the highest concentration in the experiment) achieved the best vegetative size characteristic, which was comparable with the tomatoes planted with standard Hoagland fertiliser. A similar study on the whole sea urchin crush showed similarly promising results in Norway [13].
For the sea urchin biomass to be used as fertilisers or in any other application, it is not sufficient to know what components are present. Studies on the composition of sea urchins have been conducted for different species in different regions of the world including Strongylocentrotus intermedius, Mesocentrotus nudus, Scaphechinus mirabilis, and Echinocardium cordatum from the Japan Sea [16], green sea urchin (S. droebachiensis) and red sea urchin (Strongylocentrotus franciscanus) from the east and west coasts of Canada, respectively, [17], and Paracentrotus lividus from the coasts of Sardinia in the Mediterranean sea [18]. However, there is a paucity of information in the literature regarding the drivers of any possible changes in sea urchin composition and whether this is primarily driven by feed or also regulated by environmental factors. Overall, elemental analyses from the different species and environments gave similar results: high calcium (Ca) and relatively high magnesium (Mg) levels and smaller relative quantities of nitrogen (N), phosphorous (P), and potassium (K) were all found in the powdered sea urchins. Furthermore, micronutrients such as iron (Fe), zinc (Zn), manganese (Mn), and copper (Cu) were found together with heavy metals such as cadmium (Cd) and lead (Pd) [12]. What has not been investigated in any of these studies is whether the composition changes over time and between harvesting locations. The current study focusses on the green sea urchin (S. droebachiensis) harvested in the north of Norway. We investigate the variation in the elemental composition of the sea urchin biomass when collected from three different harvesting sites that are relatively close to each other (within 10 km) and at three different times of the year.

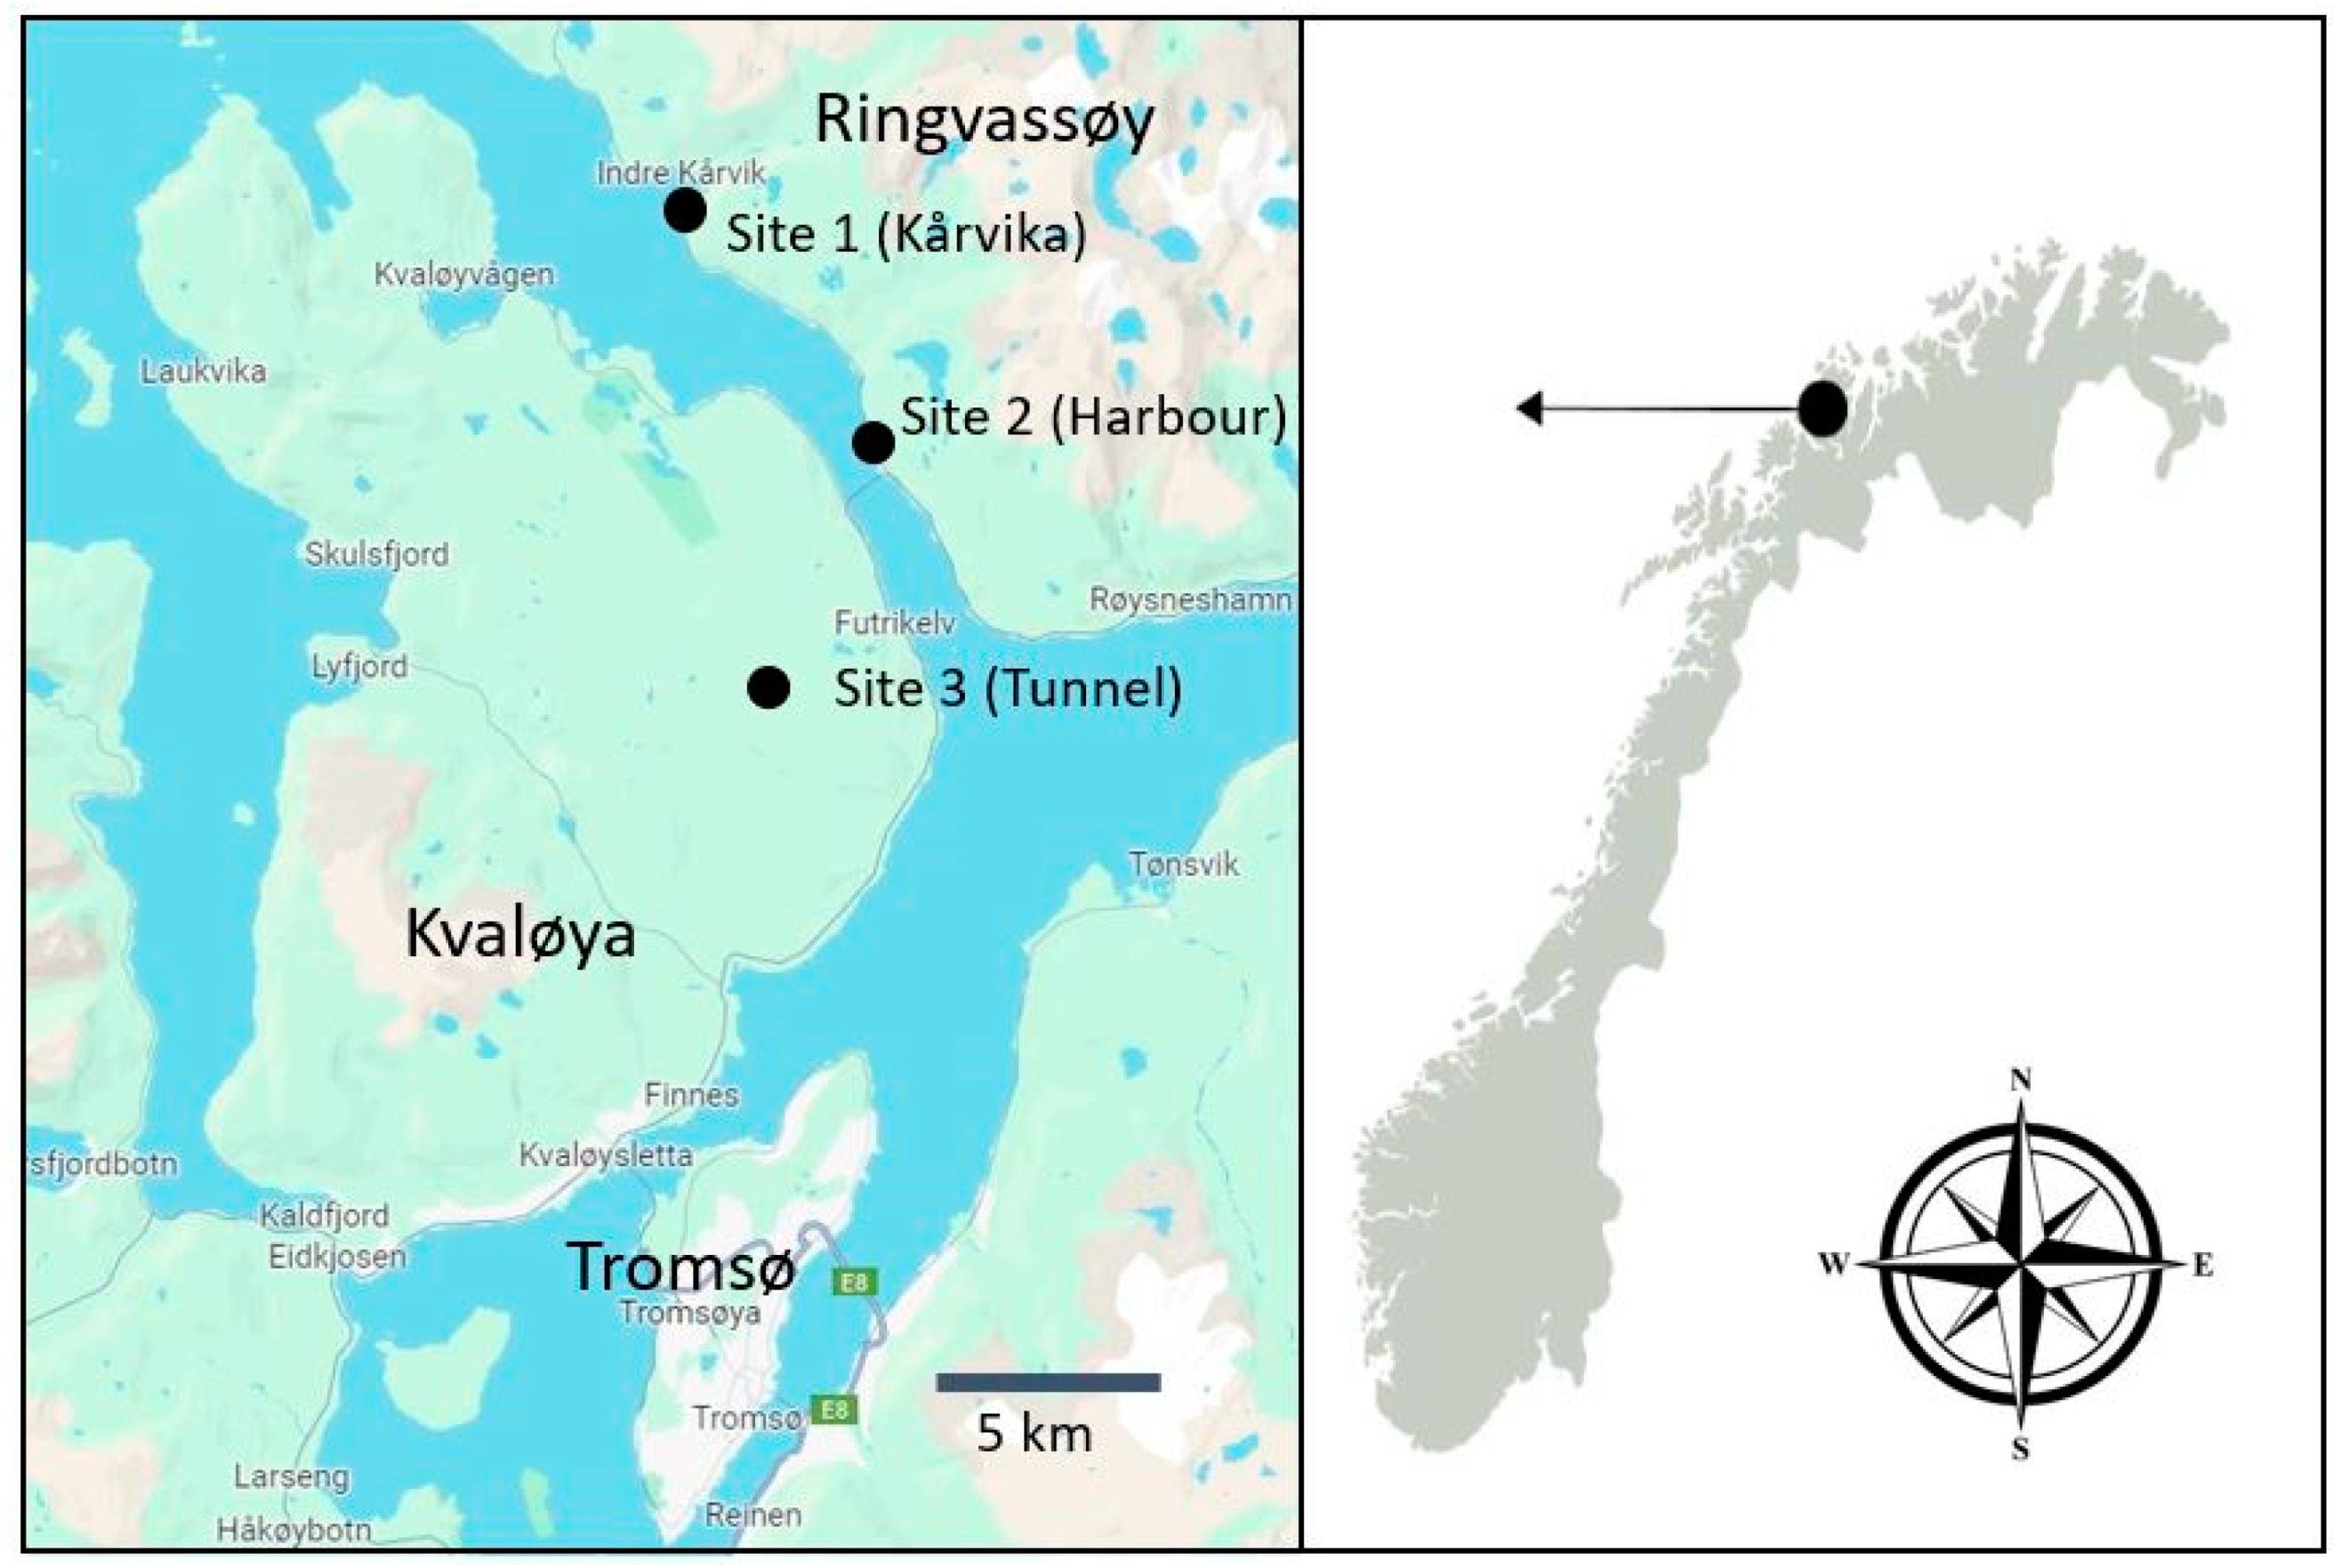
2. Materials and Methods

Sea urchins were sampled at regular intervals from three different collection sites within 10 km of each other on the islands of Kvaløya and Ringvassøy, close to Tromsø in Northern Norway (Figure 1).
Site One (referred to as “Kårvika” on Ringvassøy) (69.868273 N, 18.922038 E): Consists of a hard substrate mixed with sandy areas that shelves rapidly from 1 m to 7–8 m. There is macroalgae present in very small quantities and occasionally as drift algae. Sea urchins are found at relatively high density at the site, but most are relatively small. Larger individuals (>50 mm test diameter) are sparse.
Site Two (referred to as “Harbour” on Ringvassøy) (69.820438 N, 19.020685 E): Consists of a soft substrate with occasional rocks and hard patches. It is formed by a man-made rock boulder wall to protect boats in the small harbour. It is shallow throughout with a maximum depth of 2–3 m. There are some drift macroalgae present at the site, but they mostly consist of Ascophyllum nodosum. Sea urchins are found at relatively medium density at that site.
Site Three (referred to as “Tunnel” on Kvaløya) (69.804905 N, 19.015441 E): Consists of flat rocky hard substrate interspersed with sand that gently shelves from 1 m to 4–5 m. The currents at that site are very strong, and collections can only be made at slack high or low tides. There are macroalgae growing on all structures and hard surfaces close to the water surface, and previous surveys have shown that at depths greater than 5 m, there are significant macroalgae (kelp) beds. Sea urchins are found at relatively high density at the site.
Three sample collections were conducted over a 12-month period, in January, May and September 2023. For each collection, a minimum of 9 kg of sea urchins were collected from each site. Sea urchins were hand-collected by free divers using a steel claw into catch bags before being transferred into mesh bags for transport to the Nofima facility where they were frozen at −30 °C prior to processing. The gonad index of the sea urchins was calculated at the time of collection (this was not available for the final September collection). This was calculated using the standard methodology described in James et al. [19].
The urchins where then defrosted for 2 days in a temperature-controlled (2 °C) room. When defrosted, the urchins where roughly crushed with a wooden mortar in stainless steel trays to not trap any moisture inside the shell. The crushed sea urchins where then put inside a 60 °C oven for 4 days to dry to a constant weight. The sea urchins where then scraped from the trays and ground to powder (<40 µm) using a “Retsch ZM200” (Retsch GmbH, Haan, Germany) centrifugal grinder [13]. Sea urchins were weighed before and after drying to calculate the moisture content.
Samples of the resulting dry powder samples (3 × 120 g replicate samples from each site, 9 replicates in total) were sent to ALS Laboratory Group (Drammensveien 264, 0283 Oslo, the analysis was conducted at ALS Laboratories UK Ltd. Avd Chatteris Medcalfe Way, Bridge Street United Kingdom, ALS Scandinavia AB Luleå Aurorum 10 Sweden, GBA Pinneberg Flensburger Strasse 15 Germany) for analysing the content of the following elements: boron, calcium, copper, iron, magnesium, molybdenum, phosphorus, potassium, sodium, sulphur, zinc, and nitrogen. pH and conductivity were determined. The methods used included nitric acid/hydroperoxide (H3NO5) digestion with trace of hydrofluoric acid in a microwave oven according to SE-SOP-0128 (SS-EN 13805:2014 [20]), the determination of the pH in food by an in-house method based on Pearson’s Composition and Analysis of Foods (9th Edition), s 15–16, the determination of protein content by the LECO (DUMAS) in-house method, the determination of metals in food according to SS-EN ISO 17294-2:2016 [21], US EPA Method 200.8:1994 [22]. Prior to analysis the sample was digested according to B-PF51HF-MW or B-PF51-MW. Conductivity in water was determined using the method from DIN EN 27888: 1993-11 [23]; Water quality; determination of electrical conductivity, 1993.
The elemental content of the sea urchin crush was analysed with one two-way ANOVA per element with sampling time (3 levels) and sampling site (3 levels) as fixed factors. Significant differences between means were further analysed post hoc with SNK tests (Student–Newman–Keuls test). Before analysis, the data were tested for equality of variances with Levene’s test and for normality with Shapiro–Wilk’s test. All statistical analyses were performed in RStudio (version 2023.03.0 + 386). For the sampling in May from the site “Harbour”, there was one outlier for both calcium and sodium which was removed from the analysis, hence, n = 2 for these elements from this group, while for all other groups and elements, n = 3.

3. Results

3.1. Sea Urchin Gonad Index

The sea urchin gonad index varied between collection (or sampling time) and site, but the variation was limited. The respective average GI values in the January and May samples were 4.9 and 8.8 at the Kårvika site, 6.2 and 7.3 at the Harbour site, and 2.4 and 3.4 at the Tunnel site. The respective GI values were not available for the September collection.

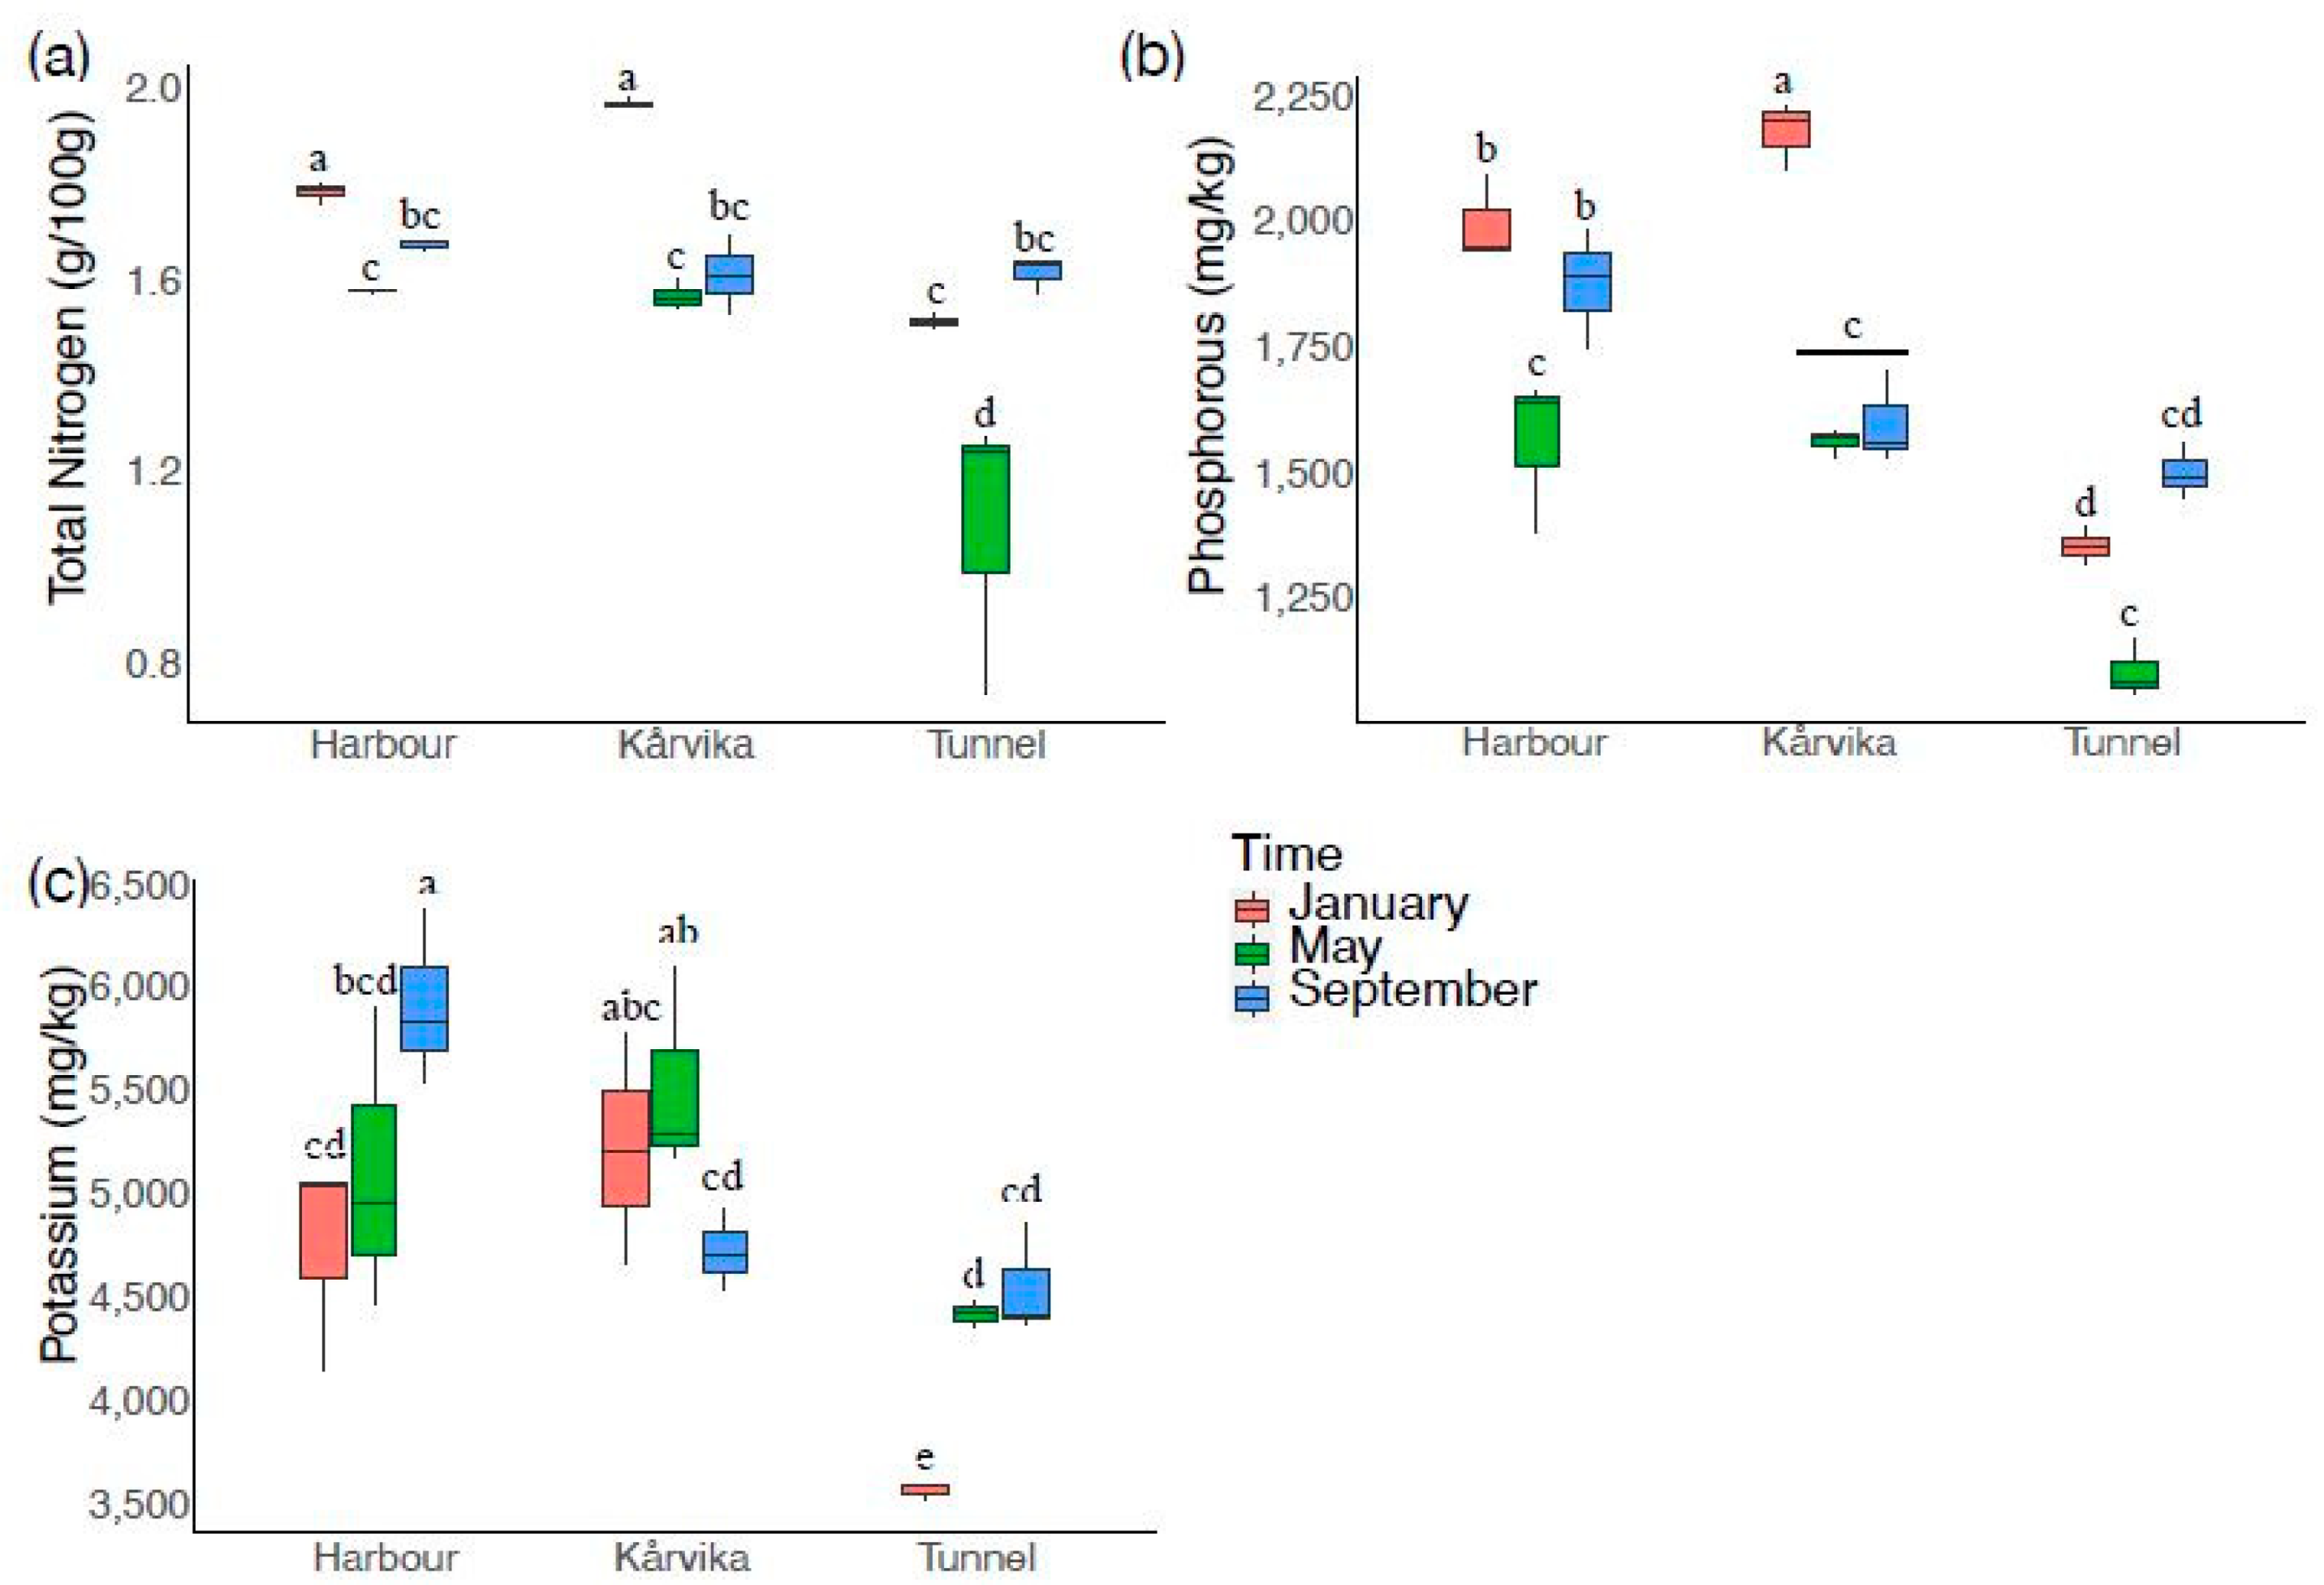
3.2. Primary Nutrients

For primary nutrient results, the % values refer to the amount of difference between the median results as expressed in the figures.
For all primary nutrients, i.e., total nitrogen, phosphorous, and potassium, the two-way ANOVAs showed significant interactions (p < 0.05) between sampling time and site (Figure 2; Table 1).
For total nitrogen, the largest difference in content was detected in the sea urchins collected at Tunnel, where it was 48% higher in September than in May, although sea urchins from Kårvika (1.73 g/100 g) and Harbour (1.70 g/100 g) had generally higher levels than sea urchin crush from Tunnel (1.42 g/100 g; Figure 2a).
Phosphorus showed the same pattern as total nitrogen both temporally and spatially (Figure 2b), with Harbour (1829 mg/kg) and Kårvika (1798 mg/kg) on average having a higher phosphorous content than the samples from Tunnel (1339 mg/kg). However, for phosphorus the largest temporal difference was found in sea urchin crush from Tunnel, where it was 35% higher in September than in May. In contrast, the phosphorous content was highest in January and lowest in May in samples from both Kårvika and Harbour (27% and 39%, respectively).
The pattern for potassium differed from the patterns of total nitrogen and phosphorous (Figure 2c). The largest temporal difference was at Tunnel (27% higher in September than January), with a similar pattern at Harbour (24% higher for the same months). However, in sea urchin crush from Kårvika, the potassium content was 17% higher in May than in September. The potassium content was generally highest at Harbour (5304 mg/kg), followed by Kårvika (5200 mg/kg), and lowest at Tunnel (4223 mg/kg).

3.3. Secondary Nutrients
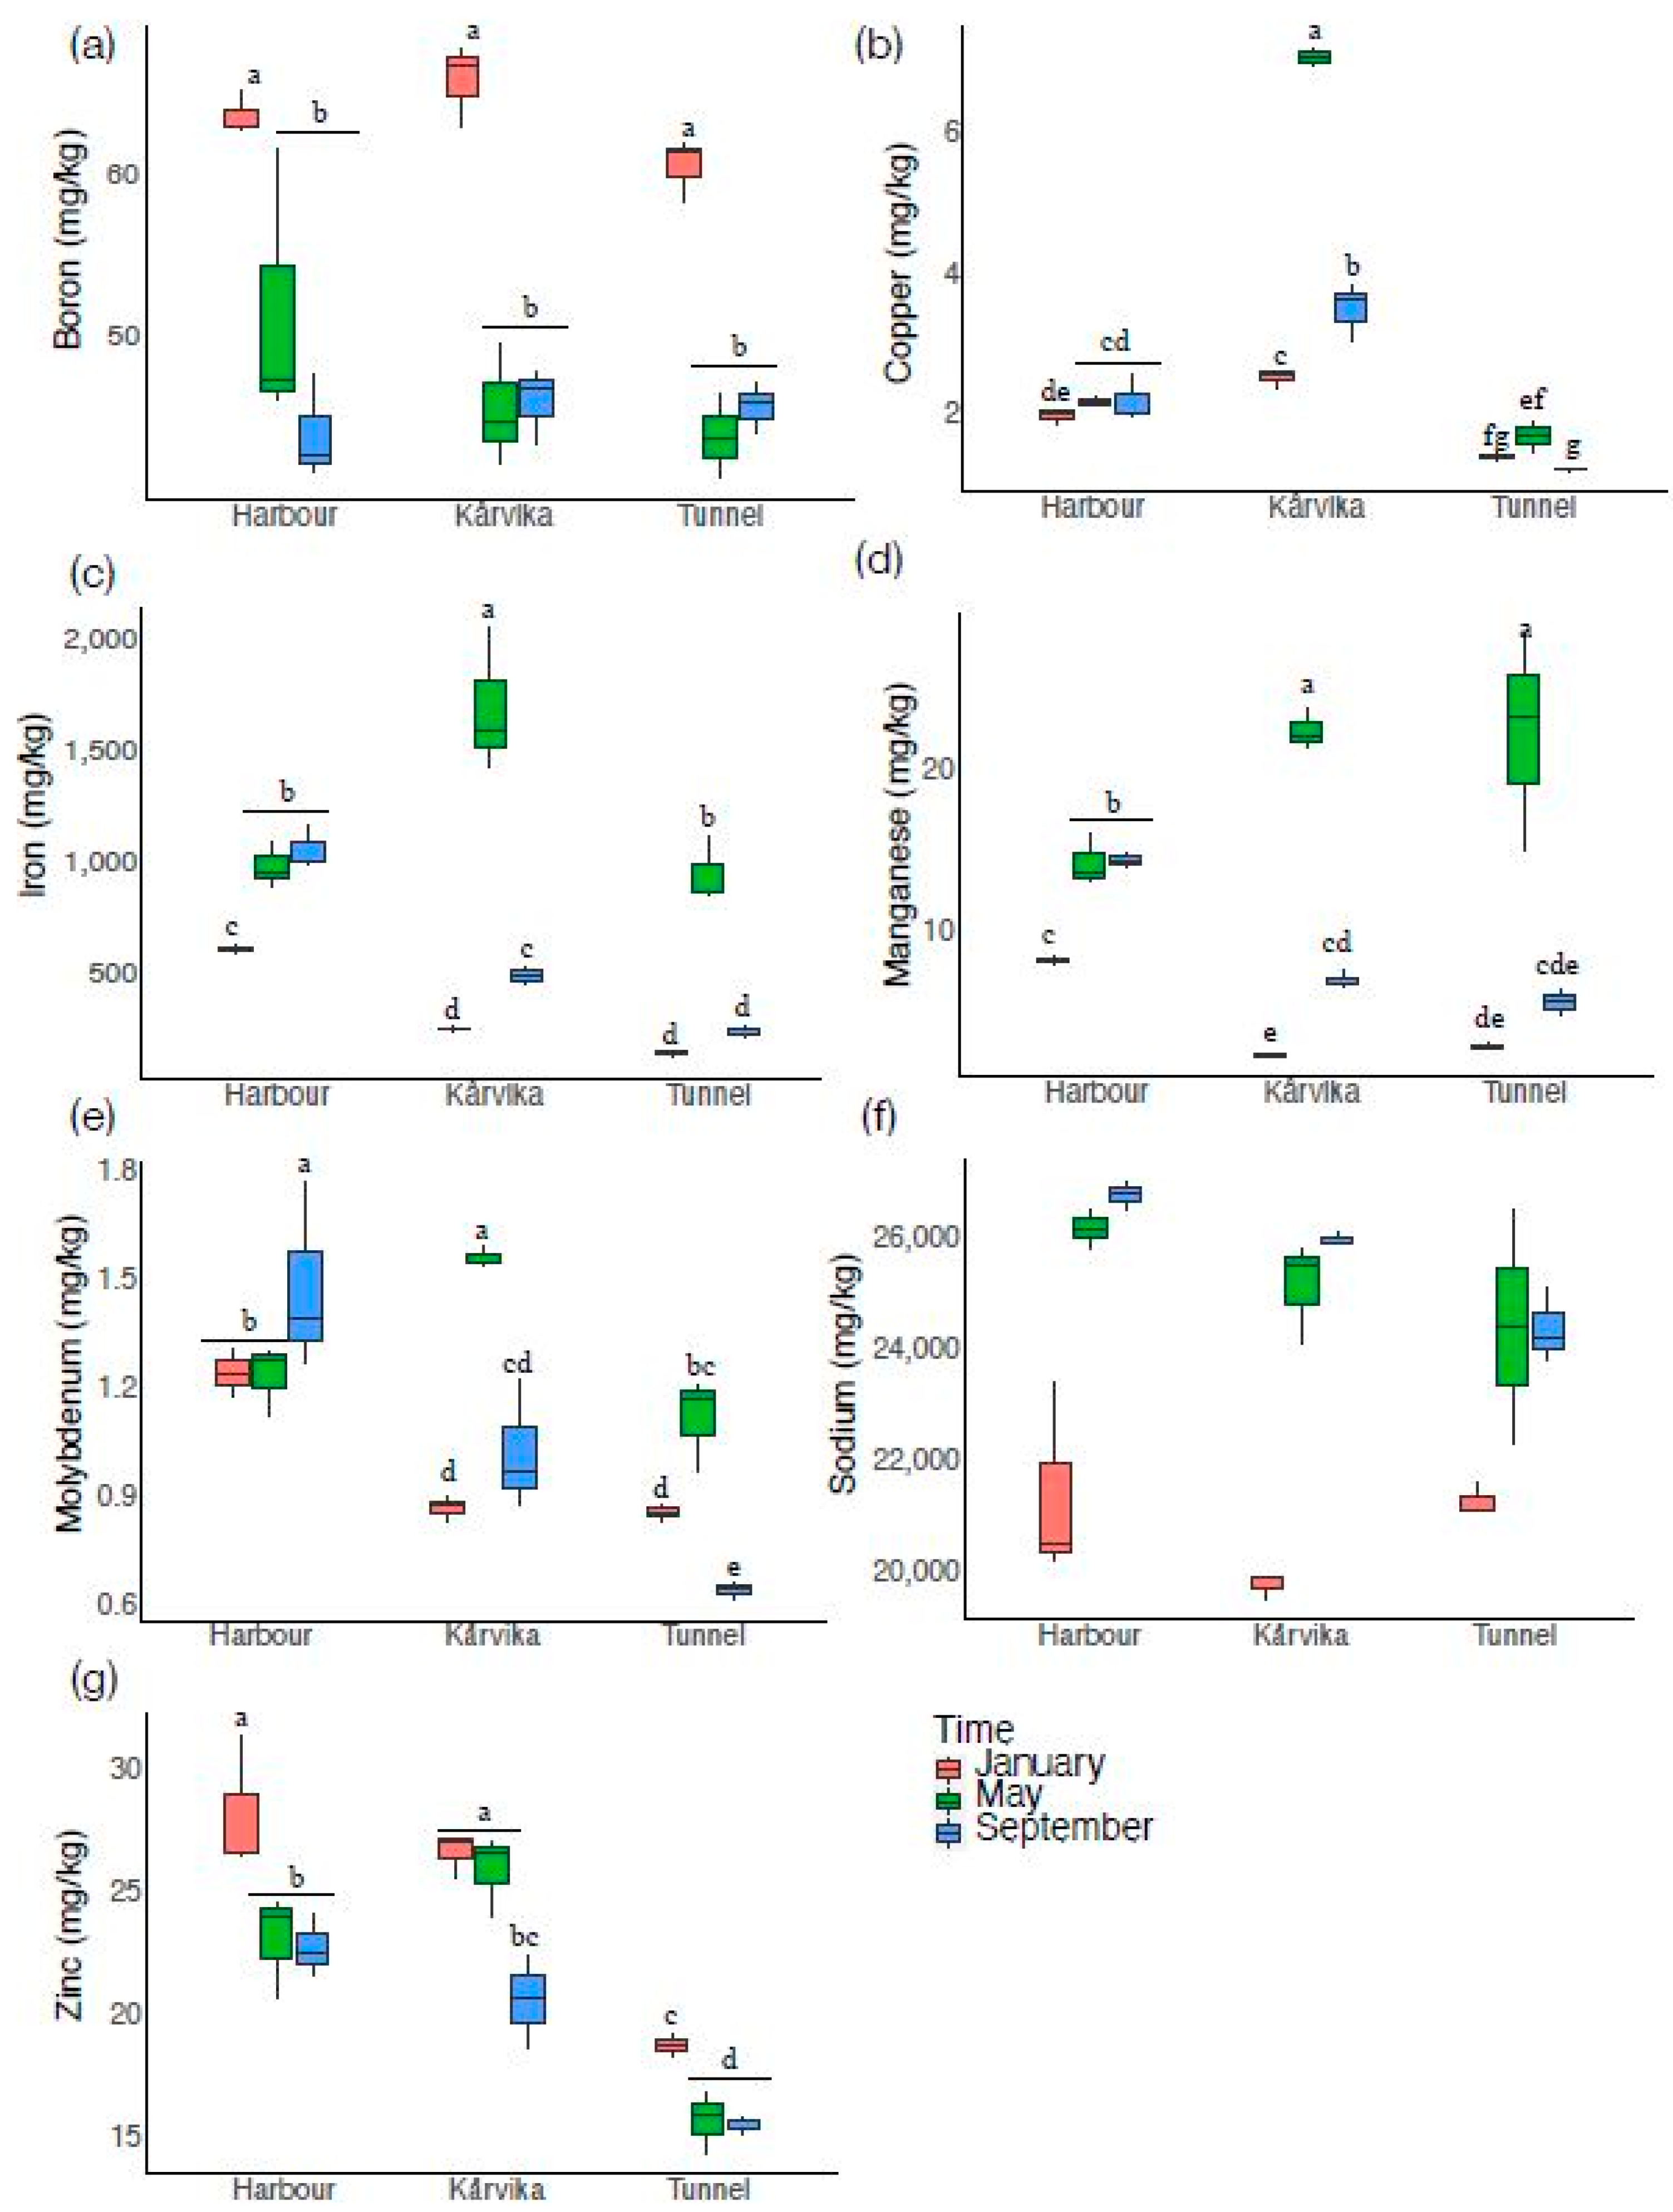
For secondary nutrient results, the % values refer to the amount of difference between the median results as expressed in the figures.
For magnesium, there was no significant effect of either sampling time or site, although the magnesium content was slightly higher at Harbour than at the other two sites (Figure 3a). For calcium, there was a significant effect of time (Table 2; Figure 3b). For sulphur, there was a significant interaction between time and site (Table 2; Figure 3c). The sulphur content was consistently lowest in May for all sites. The sulphur content in sea urchin crush from Harbour and Kårvika was highest in January, 17% and 21% higher than in May, respectively. The sea urchin crush from Tunnel contained 14% more sulphur in September than in May. On average, the sulphur content was highest in sea urchin crush from Kårvika (7861 mg/kg), followed by Harbour (7773 mg/kg), and lowest in Tunnel (7003 mg/kg).

3.4. Micronutrients

For micronutrient results, the % values refer to the amount of difference between the median results as expressed in the figures.
For boron, there was a significant effect of time (Table 3; Figure 4a), where the boron content always was highest in January regardless of site. Sea urchin crush from Harbour contained 45% more boron in January than in September; Kårvika also contained 45% more boron in January than in both May and September.
For copper, there was a significant interaction between time and site (Table 3; Figure 4b), where the site average was noticeably higher in Kårvika (4.46 mg/kg) than in Harbour (2.21 mg/kg) and Tunnel (1.53 mg/kg). The largest temporal difference was seen in sea urchin crush from Kårvika, where the copper content was 174% higher in May than in January. In sea urchin crush from the Tunnel site, the copper content was 36% higher in May than in September, and the Harbour site had 11% higher copper content in September than in January.
There was a significant interaction between sampling time and site on the iron content, where the iron content was always lowest in January regardless of site (Table 3; Figure 4c). The iron content was almost twice as high at the Harbour (906 mg/kg) and Kårvika (834 mg/kg) sites than at the Tunnel site (464 mg/kg). The Harbour site displayed the smallest temporal difference with a 71% higher iron content in September than in January. For sea urchin crush from the Kårvika and Tunnel sites, the temporal difference was noticeably higher: 536% higher in May than in January for sea urchin crush from Kårvika and 506% higher from Tunnel for the same months.
There was a significant interaction between sampling time and site on manganese content (Table 3; Figure 4d). The temporal change in manganese content followed the same pattern as that for iron content: The Harbour site had the highest content in September and lowest in January (a 71% difference), while sea urchin crush from the Kårvika and Tunnel sites had the highest content in May and lowest in January, a 683% and 554% difference, respectively.
There was a significant interaction between sampling time and site on molybdenum content (Table 3; Figure 4e). On average, the molybdenum content at Tunnel (0.89 mg/kg) was lower than that at the Kårvika (1.17 mg/kg) and Harbour (1.34 mg/kg) sites. The temporal difference in molybdenum content was highest in sea urchin crush from Kårvika (78% difference between May and January), followed by Tunnel (73% difference between May and January), and lowest in Harbour (19% difference between September and May).
For sodium, there was no significant effect of neither time nor site; however, the sodium content was always lowest in January regardless of sampling site (Figure 4f).
For zinc, there was a significant interaction between time and site (Figure 4g), with the site average from the Tunnel site (16.9 mg/kg) being noticeably lower than that of the Kårvika (24.6 mg/kg) or Harbour (24.9 mg/kg) sites. There were also smaller temporal differences where the zinc content was always highest in January and lowest in September, regardless of site.

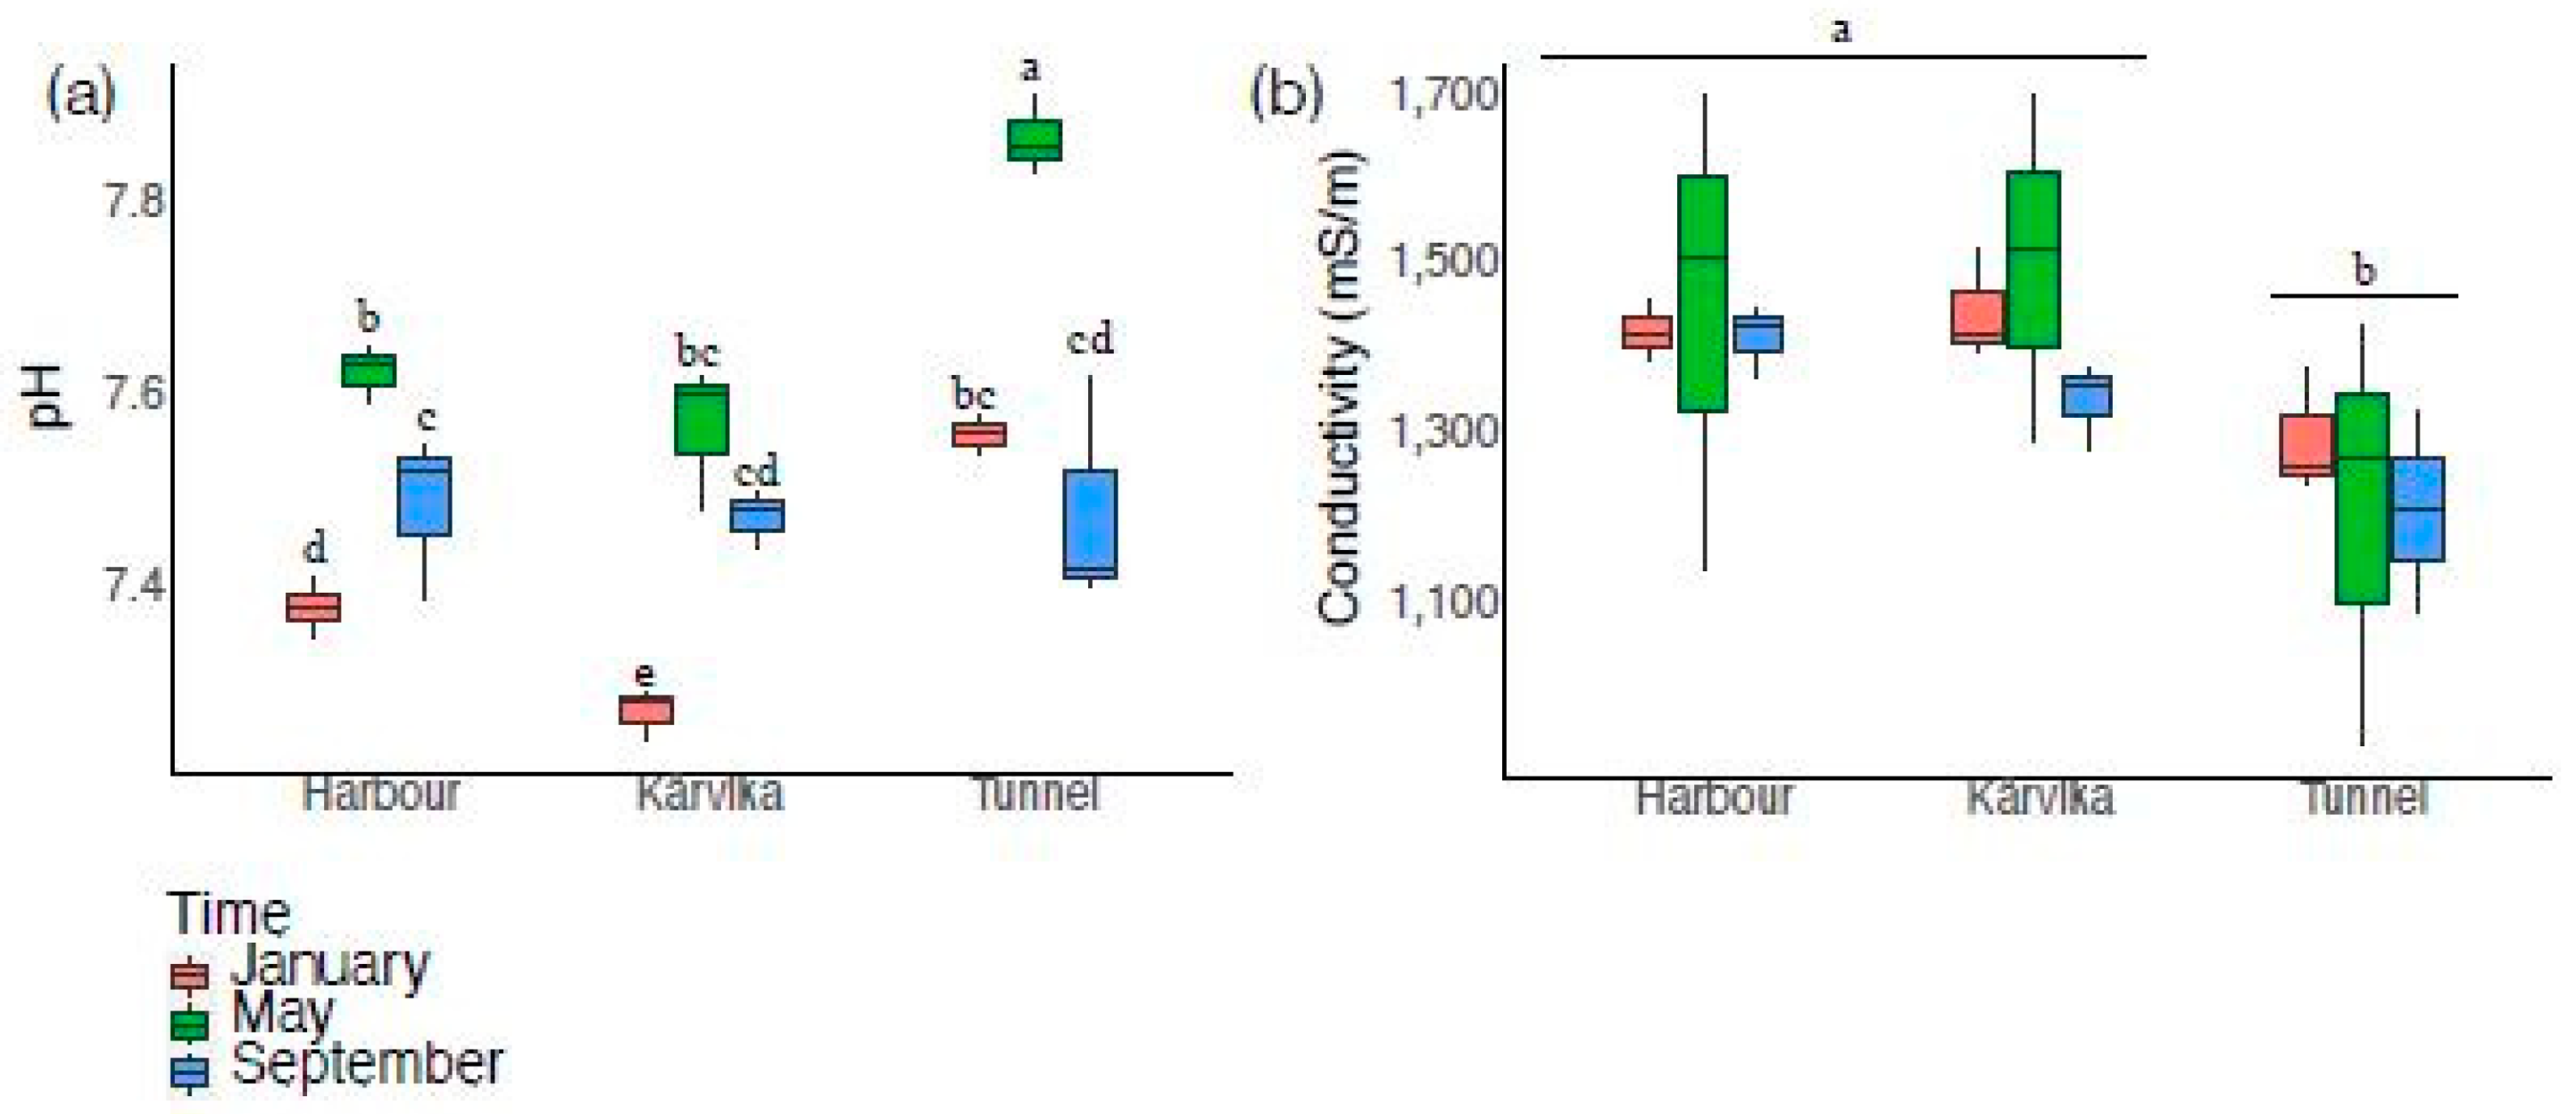
3.5. Other Elemental Parameters

For conductivity there was a significant effect of site, where it was noticeably lower at the Tunnel (1248 mS/m) compared to the Kårvika and Harbour sites, where it was 1440 mS/m in the sea urchin crush from both sites (Figure 5a, Table 4).
For pH there was a significant interaction between sampling time and site: The pH was lowest in sea urchin crush from the Kårvika site (7.45), followed by Harbour (7.51), and highest from the Tunnel (7.65) site. The pH in the sea urchin crush was always highest in May, and for the Harbour and Kårvika sites, it was lowest in January, while for the Tunnel site it was lowest in September (Figure 5b, Table 4).

4. Discussion

The use and function of nutrients in plant fertilisers have been extensively researched [12,13,15,18,24]. A thorough breakdown of the benefits and disadvantages of macro- and micronutrients as well as soil conductivity and pH cannot be provided within the scope of this manuscript, but it is possible to quantify whether the nutrients provided in sea urchin crush are essential and/or useful for plant growth and whether the quantities present are sufficient to be useful as a fertiliser. In addition, we can also comment on how the composition of the sea urchin crush varies over time and when collected from different sites within a limited spatial range.
The average GI values of the sea urchins collected in this study varied with the season and collection site, but the variation was relatively small [19] and it is unlikely that such a low GI content would have any impact on the nutrient content of the sea urchin biomass. However, this should be the focus of future studies.
In the current study, the primary nutrients were compared to standard fertilisers which provide a benchmark for industrially useful products in the target market for a sea urchin crush-based fertiliser. Nitrogen is the main limiting nutrient governing photosynthesis, is known to be a crucial component of amino acids, and is critical for growth and development, including protein and pigment synthesis [24,25]. They are commonly 10–46% by weight of a fertiliser mix, and in the current study, we found generally lower amounts of nitrogen in the sea urchin crush. Phosphate is important in energy transfer and storage (metabolism), root and flower formation, especially during early growth stages [26]. It is commonly 1–15% by weight and is usually present as phosphoric oxide (P2O5). In the current study, we found much lower amounts of phosphate in the sea urchin crush than standard fertilisers, even at the sites with the highest observed values. Potassium is important for a range of physiological processes, especially stomatal regulation, which affects osmoregulation, respiration, and photosynthesis by controlling gas exchange [27]. Fertilisers high in potassium are often associated with stress tolerance, and they are commonly included by weight at 1–15%, usually as potash (K2O) [28]. In the current study, we found generally lower amounts of potassium in the sea urchin crush, although the highest reported values were not dramatically below the lower end of the commercially available products.
The NPK ratio of different fertilisers varies, and it is often optimised to specific crops and growth stages. Successful application of sea urchin crush fertiliser will require identifying the crops that are best suited to the natural NPK ratio of the product, or modifying the product by concentration, dilution, or supplementation with other substances to match the necessary NPK ratio for each usage. In the current study, the natural NPK ratio in the sea urchin crush varied but was approximately 8:1:2. This is much more nitrogen rich than a common, general-purpose fertiliser with a 1:1:1 ratio but not dissimilar to more specialized fertiliser for lush growth (such as in lawns) which can be around 6:1:3 or 16:3:4 [29], suggesting that a sea urchin based fertiliser could target similar uses.
Micronutrients are included in what is referred to as “complete” fertilisers [30]. Plant fertilisers that include a spectrum of micronutrients are generally considered to be of higher quality and meet a higher price point than fertilisers which only contain the primary nutrients. Boron, involved in cell wall formation and pollen germination, usually ranges from 0.01 to 0.5% [31]. Sea urchin crush had dramatically lower Boron content than most “complete” fertilisers, although harvesting in January maximized the Boron content. Copper, important to enzyme activity especially related to respiration, usually ranges from 0.01 to 0.1% [31]. Sea urchin crush had dramatically lower copper content than most “complete” fertilisers, and even the variation between sites and sampling periods was not enough to reach concentrations like those of “complete” fertilisers. Iron, crucial for chlorophyll synthesis and photosynthesis, usually ranges from 0.1 to 1.0% [31]. Sea urchin crush had somewhat lower iron content than most “complete” fertilisers, although when harvested in May, all sites contained more than 0.1% iron, which is within the range of commercially available fertilisers. Manganese, used in photosynthesis and enzyme activation, usually ranges from 0.1 to 0.5% [31]. Sea urchin crush had dramatically lower manganese content than most “complete” fertilisers. Molybdenum, component of enzymes for nitrogen metabolism and nitrate reduction, usually ranges from 0.001 to 0.005% [32]. Sea urchin crush had lower molybdenum content than most “complete” fertilisers, although the molybdenum levels were relatively consistent and reasonably close to (one order of magnitude below) the levels found in commercial fertilisers.
Zinc, involved in enzyme activation and hormone synthesis, usually ranges from 0.1 to 0.5% [31]. Sea urchin crush had dramatically lower zinc content than most “complete” fertilisers, although two sites had consistently higher zinc content than the third. The observed micronutrient levels may be biologically relevant, but in an unpurified form, they remained consistently below the levels observed in commercially available fertilisers [31].
The levels of calcium were consistently high in the samples collected in this study, and this reflects the high levels of calcium in virtually all sea urchin biomass studies [12]. The only variation occurred during the January collection, when calcium levels were significantly lower from each of the collection sites compared to collections from all sites in the May and September collections. Sea urchin product has previously been tested as an egg-laying hen calcium supplement in the poultry industry [9]. The consistently high levels of calcium in this study are an indicator that this may be a possible mineral that could be extracted or used for its specific calcium content, but that caution is needed to ensure consistent quantities of calcium in the product.
Soil pH is a crucial factor in determining soil characteristics and most plant crops prefer a slightly acidic pH and grow well if it is between 5.4 and 6.0 [33]. Specific crops may prefer a slightly higher or lower pH. pH is important because it affects the availability of micronutrients in the growing medium; some nutrients that are essential for good plant growth are not available at high levels and the plants start developing deficiency symptoms [33]. In the current study, the pH varied between 7.45 and 7.65 and depended on the sampling site and time. This is higher than the recommended range, but if the sea urchin biomass is used as a fertiliser additive (at a given percentage of the total soil), then it would most likely not have a significant impact on the soil pH. Electrical conductivity (EC) is a measure of the total amount of salts, including fertiliser salts, in the growing medium. Since most salts in any given fertiliser are macronutrients, EC can be used as an indicator of the presence of macronutrients in the growing medium but gives little or no information about the presence of micronutrients. The results of the current study showed a significant variation in both the macro- and micronutrients, and this was reflected in the EC of the sea urchin biomass.
The elemental analysis of the green sea urchins in this study gave similar results to previous studies that looked at different species: High calcium and relatively high magnesium levels, and smaller relative quantities of nitrogen, phosphorous, and potassium were all found in the powdered sea urchins [12]. However, previous studies did not compare the results when the sea urchins were collected from different sites and at different times of the year, and the results of this study indicate that there are likely to be significant differences in the amounts of primary, macro-, and micronutrients when the sea urchin crush is produced over extended periods from different sources. This is a critical consideration when looking at possible uses for the product in the future. The possible causes of such differences in the amounts of primary, macro-, and micronutrients in sea urchins sampled from relatively close sites or from different times of the year are difficult to identify. There are no clear patterns in the current study that would indicate which factor is impacting the composition. There is also a paucity of information in the literature on what might drive the composition of the sea urchin or possible changes in composition. Feed availability would be one possibility, changes in environmental conditions another. Sampling sea urchins from a greater variety of geographic locations and at different collection times over a longer period, whilst monitoring feed availability and environmental conditions, would be a useful method of identifying the causal factors of such differences.
In this study, we focused on the possible use of sea urchin crush as a plant fertiliser. However, there may be other applications for this product from inclusion in aquaculture feeds to the extraction of specific compounds and nutrients. The results from this study provide a tentative indication of the composition that can be expected from sea urchins collected at the sites used in this study and during the collection periods tested. The authors recommend a further study to confirm that the presence/absence of the roe in the sea urchin biomass has little or no impact on the nutrient content of the final sea urchin product. They also suggest additional research into the variation in sea urchin biomass collected from a greater variety of geographic locations and different collection times over a longer period to allow the targeted collection of sea urchins with the most economically useful nutrient ratios.

Author Contributions

P.J. was the principal researcher in this project and contributed to the sample collection and analysis, trial design, collation of results, analysis, and writing of the manuscript. T.E. contributed to the sample collection, trial design, and writing of the manuscript. A.K. was a contributing researcher in this project and worked on the results’ analysis and writing of the manuscript. Conceptualization, P.J. and T.E.; methodology, P.J. and T.E.; software, A.K.; validation, P.J., A.K. and T.E.; formal analysis, A.K. and P.J.; resources, P.J.; data curation, T.E. and P.J.; writing—original draft preparation, P.J.; writing—review and editing, P.J., A.K. and T.E.; project administration, P.J.; funding acquisition, P.J. All authors have read and agreed to the published version of the manuscript.

Funding

The authors gratefully acknowledge the funding provided from EU Blue Bio, project number: 311736 (InEVal), and the Regionale Forskningsfond (RFF Arktis) project: Removal and utilization of sea urchin barrens to restore macroalgae forests, economic and ecosystem benefits (RFF project no. 337205).

Institutional Review Board Statement

Not applicable.

Informed Consent Statement

Not applicable.

Data Availability Statement

Data supporting the reported results can be found at 10.5281/zenodo.12067136.

Conflicts of Interest

The authors declare no conflicts of interest. The funders had no role in the design of the study; in the collection, analyses, or interpretation of data; in the writing of the manuscript; or in the decision to publish the results.

References

  1. Hamilton, S.L.; Gleason, M.G.; Godoy, N.; Eddy, N.; Grorud-Colvert, K. Ecosystem-based Management for Kelp Forest Ecosystems. Mar. Policy 2022, 136, 104919. [Google Scholar] [CrossRef]
  2. Steneck, R.S.; Graham, M.H.; Bourque, B.J.; Corbett, D.; Erlandson, J.M.; Estes, J.A.; Tegner, M.J. Kelp forest ecosystems: Biodiversity, stability, resilience, and future. Environ. Conserv. 2002, 29, 436–459. [Google Scholar] [CrossRef]
  3. Stewart, N.L.; Konar, B. Kelp Forests versus Urchin Barrens: Alternate Stable States and Their Effect on Sea Otter Prey Quality in the Aleutian Islands. J. Mar. Biol. 2012, 2012, 492308. [Google Scholar] [CrossRef]
  4. Steneck, R.S. Sea urchins as drivers of shallow benthic marine community structure. In Developments in Aquaculture and Fisheries Science; Elsevier: Amsterdam, The Netherlands, 2013; Volume 38, pp. 195–212. [Google Scholar] [CrossRef]
  5. Norderhaug, K.M.; Christie, H. Sea urchin grazing and kelp re-vegetation in the NE Atlantic. Mar. Biol. Res. 2009, 5, 515–528. [Google Scholar] [CrossRef]
  6. James, P.; Siikavuopio, S.I.; Mortensen, A. Sea Urchin Aquaculture in Norway. In Echinoderm Aquaculture (s. 147–173); John Wiley & Sons, Inc.: Hoboken, NJ, USA, 2015. [Google Scholar] [CrossRef]
  7. Verbeek, J.; Louro, I.; Christie, H.; Carlsson, P.M.; Matsson, S.; Renaud, P.E. Restoring Norway’s Underwater Forests, a Strategy to Recover Kelp Ecosystems from Urchin Barrens; SeaForester, NIVA, Akvaplan-niva: Oslo, Norway, 2012. [Google Scholar]
  8. Zilia, F.; Bacenetti, J.; Sugni, M.; Matarazzo, A.; Orsi, L. From waste to product: Circular economy applications from Sea Urchin. Sustainability 2021, 13, 5427. [Google Scholar] [CrossRef]
  9. Zilia, F.; Orsi, L.; Costantini, M.; Tedesco, D.E.A.; Sugni, M. Case study of Life Cycle Assessment and sustainable business model for sea urchin waste. Clean. Environ. Syst. 2023, 8, 100108. [Google Scholar] [CrossRef]
  10. Solstad, R.G.; Philip, J. Observations from the Hydrolysis of the Green Sea Urchin (Strongylocentrotus droebachiensis). Glob. Chall. 2022, 7, 2200078. [Google Scholar] [CrossRef] [PubMed]
  11. Thapa, S. Cultivation of Saccharina latissima (Sugar kelp) Using Sea Urchins Crush as a Nutrient Source. Master’s Thesis, UiT The Arctic University of Norway, Tromsø, Norway, 2021. Available online: https://hdl.handle.net/10037/26548 (accessed on 21 January 2024).
  12. Campus, P.; Swarts, N.D.; Mundy, C.; Keane, J.P.; Gardner, C. Assessing Processing Waste from the Sea Urchin (Centrostephanus rodgersii) Fishery as an Organic Fertilizer. Agronomy 2022, 12, 2919. [Google Scholar] [CrossRef]
  13. Bergquist, T. Assessing dried, powdered green sea urchin (Strongylocentrotus droebachiensis) as a biostimulant. Bachelor Thesis, number BIO-2203-H04. UiT. The Arctic University of Norway, Tromsø, Norway, 2023; p. 34. [Google Scholar]
  14. Ling, S.D.; Keane, J.P. Resurvey of the Longspined Sea Urchin (Centrostephanus rodgersii) and Associated Barren Reef in Tasmania. University of Tasmania: Hobart, Australia, 2018; Report. Available online: https://www.imas.utas.edu.au/__data/assets/pdf_file/0005/1176026/129569-Resurvey-of-the-Longspined-Sea-Urchin-Centrostephanus-rodgersii-and-associated-barren-reef-in-Tasmania.pdf (accessed on 4 February 2024).
  15. Zandvakili, O.R.; Barker, A.V.; Hashemi, M.; Etemadi, F.; Autio, W.R. Comparisons of commercial organic and chemical fertilizer solutions on growth and composition of lettuce. J. Plant Nutr. 2019, 42, 990–1000. [Google Scholar] [CrossRef]
  16. Drozdov, A.L.; Sharmankina, V.V.; Zemnukhova, L.A.; Polyakova, N.V. Chemical composition of spines and tests of sea urchins. Biol. Bull. 2016, 43, 521–531. [Google Scholar] [CrossRef]
  17. Amarowicz, R.; Synowiecki, J.; Shahidi, F. Chemical composition of shells from red (Strongylocentrotus franciscanus) and green (Strongylocentrotus droebachiensis) sea urchin. Food Chem. 2012, 133, 822–826. [Google Scholar] [CrossRef]
  18. Garau, G.; Castaldi, P.; Deiana, S.; Campus, P.; Mazza, A.; Deiana, P.; Pais, A. Assessment of the use potential of edible sea urchins (Paracentrotus lividus) processing waste within the agricultural system: Influence on soil chemical and biological properties and bean (Phaseolus vulgaris) and wheat (Triticum vulgare) growth in an amended acidic soil. J. Environ. Manag. 2012, 109, 12–18. [Google Scholar] [CrossRef]
  19. James, P.; Evensen, T.; Johansson, G. Effect of Season and Increased Temperature on Survival, Roe Enhancement, and Reproductive Cycle of the Green Sea Urchin (Strongylocentrotus droebachiensis) Collected from Four Relatively Close Sites in Northern Norway. Aquac. Res. 2023, 2023, 6360865. [Google Scholar] [CrossRef]
  20. SS-EN 13805:2014; Foodstuffs—Determination of Trace Elements—Pressure Digestion. CEN: Brussels, Belgium, 2014.
  21. SS-EN ISO 17294-2:2016; Determination of Selected Elements Including Uranium Isotopes. ISO: Geneva, Switzerland, 2016.
  22. Method 200.8:1994; Determination of Trace Elements in Waters and Wastes by Inductively Coupled Plasma—Mass Spectrometry. US EPA: Washington, DC, USA, 1994.
  23. DIN EN 27888:1993-11; Water Quality; Determination of Electrical Conductivity. DIN: Berlin, Germany, 1993.
  24. Anas, M.; Lioa, F.; Verma, K.K.; Sarwar, M.A.; Mahmood, A.; Chen, Z.L.; Li, Q.; Zeng, X.P.; Liu, Y.; Li, Y.R. Fate of nitrogen in agriculture and environment: Agronomic, eco-physiological and molecular approaches to improve nitrogen use efficiency. Biol. Res. 2020, 53, 47. [Google Scholar] [CrossRef] [PubMed]
  25. Wang, Z.; Li, S. Effects of Nitrogen and Phosphorus Fertilization on Plant Growth and Nitrate Accumulation in Vegetables. J. Plant Nutr. 2004, 27, 539–556. [Google Scholar] [CrossRef]
  26. Khan, M.S.; Zaidi, A.; Wani, P.A. Role of Phosphate Solubilizing Microorganisms in Sustainable Agriculture—A Review. In Sustainable Agriculture; Lichtfouse, E., Navarrete, M., Debaeke, P., Véronique, S., Alberola, C., Eds.; Springer: Dordrecht, The Netherlands, 2009. [Google Scholar] [CrossRef]
  27. Prajapati, K.; Modi, H.A. The Importance of Patassium in Plant Growth—A Review. Indian J. Plant Sci. 2012, 1, 177–186. Available online: http://www.cibtech.org/jps.htm (accessed on 14 March 2024).
  28. Jaiswal, D.K.; Verma, J.P.; Prakash, S.; Meena, V.S.; Meena, R.S. Potassium as an Important Plant Nutrient in Sustainable Agriculture: A State of the Art. In Potassium Solubilizing Microorganisms for Sustainable Agriculture; Meena, V., Maurya, B., Verma, J., Meena, R., Eds.; Springer: New Delhi, India, 2016. [Google Scholar] [CrossRef]
  29. Jilani, S.J.; Waseem, K.; Khaliq, G. Effect of different Nkp levels on the growth and yield of three onion (Allium cepa L.) varieties. Asian J. Plant Sci. 2003, 2, 342–346. [Google Scholar]
  30. Römheld, V.; Marschner, H. Function of micronutrients in plants. Micronutr. Agric. 1991, 4, 297–328. [Google Scholar]
  31. Tripathi, D.K.; Singh, S.; Singh, S.; Mishra, S.; Chauhan, D.K.; Dubey, N.K. Micronutrients and their diverse role in agricultural crops: Advances and future prospective. Acta Physiol. Plant. 2015, 37, 139. [Google Scholar] [CrossRef]
  32. Kaiser, B.N.; Gridley, K.L.; Brady, J.N.; Phillips, B.T.; Tyerman, S.D. The Role of Molybdenum in Agricultural Plant Production. Ann. Bot. 2005, 96, 745–754. [Google Scholar] [CrossRef] [PubMed]
  33. Thomas, G.W. Soil pH and Soil Acidity. In Methods of Soil Analysis: Part 3 Chemical Methods, 5.3; Sparks, D.L., Page, A.L., Helmke, P.A., Loeppert, R.H., Soltanpour, P.N., Tabatabai, M.A., Johnston, C.T., Sumner, M.E., Eds.; John Wiley & Sons, Inc.: Hoboken, NJ, USA, 1996. First published: 1 January 1996. [Google Scholar] [CrossRef]
Figure 1. Harvest sites on the islands of Kvaløya and Ringvassøy near Tromsø, Northern Norway. The GPS location of sites are included in the site descriptions.
Sustainability 16 06727 g001
Figure 2. Box plots for the primary nutrients nitrogen (a), phosphorous (b), and potassium (c) from sea urchins collected at three different sites and at three different times of the year. Median and interquartile range displayed by the box, n = 3. Solid black lines indicate no significant differences within sites. Lower case letters indicate significant differences between sites and sampling time.
Sustainability 16 06727 g002
Figure 3. Box plots for the secondary nutrients magnesium (a), calcium (b), and sulphur (c) from sea urchins collected at different sites and at different times of the year. Median and interquartile range displayed by the box; n = 3 except calcium for the Harbour May sampling, where n = 2. Solid black lines indicate no significant differences within sites. Lower case letters indicate significant differences between sites and sampling time.
Sustainability 16 06727 g003
Figure 4. Box plots for the micronutrients boron (a), copper (b), iron (c), manganese (d), molybdenum (e), sodium (f), and zinc (g) from sea urchins collected at different sites and at different times of the year. Median and interquartile range displayed by the box; n = 3 except sodium for the Harbour May sampling, where n = 2. Solid black lines indicate no significant differences within sites. Lower case letters indicate significant differences between sites and sampling time.
Sustainability 16 06727 g004
Figure 5. Box plots for the pH (a) and conductivity (b) from sea urchins collected at different sites and at different times of the year. Median and interquartile range displayed by the box, n = 3. Solid black lines indicate no significant differences between/within sites. Lower case letters indicate significant differences between sites and sampling time.
Sustainability 16 06727 g005
Table 1. Summary of effects of sampling site and time of the year on primary nutrients in sea urchin crush (Strongylocentrotus droebachiensis) collected in Northern Norway. p-Values and corresponding F-values, mean squares, and degrees of freedom of the 2-way ANOVA are reported for the analyses of all response variables. Values in bold denote statistically significant values. For all elements, n = 3.
Total Nitrogen
Source of VariationDfMean SquaresF-Valuep-Value
Site20.2601823.8058.80 × 10−6
Time20.2763425.2835.92 × 10−6
Site × Time40.069096.3220.00233
Residual180.01093
Phosphorous
Source of variationDfMean SquaresF-valuep-value
Site2677,47092.103.51 × 10−10
Time2425,61557.861.45 × 10−8
Site × Time4102,12613.882.46 × 10−5
Residual187356
Potassium
Source of variationDfMean SquaresF-valuep-value
Site23,200,38117.4166.19 × 10−5
Time2849,6044.6230.0240
Site × Time4787,9704.2880.0131
Residual18183,763
Table 2. Summary of effects of sampling site and time of the year on secondary nutrients in sea urchin crush (Strongylocentrotus droebachiensis) collected in Northern Norway. p-Values and corresponding F-values, mean squares, and degrees of freedom of the 2-way ANOVA are reported for the analyses of all response variables. Values in bold denote statistically significant values. For all elements n = 3.
Magnesium
Source of VariationDfMean SquaresF-Valuep-Value
Site21,213,3332.7010.0942
Time2614,4441.3680.2799
Site × Time4574,4441.2790.3150
Residual18449,259
Calcium
Source of variationDfMean SquaresF-valuep-value
Site22.823 × 1091.1310.3447
Time21.445 × 10105.7860.0115
Site × Time42.816 × 1091.1280.3746
Residual182.497 × 109
Sulphur
Source of variationDfMean SquaresF-valuep-value
Site22,004,58114.2200.000197
Time22,179,39315.4600.000124
Site × Time4839,2595.9530.003110
Residual18140,970
Table 3. Summary of effects of sampling site and time of the year on micronutrients in sea urchin crush (Strongylocentrotus droebachiensis) collected in Northern Norway. p-Values and corresponding F-values, mean squares, and degrees of freedom of the 2-way ANOVA are reported for the analyses of all response variables. Values in bold denote statistically significant values. For all elements, n = 3.
Boron
Source of VariationDfMean SquaresF-Valuep-Value
Site224.41.7130.208
Time2919.564.5616.14 × 10−9
Site × Time426.51.8640.161
Residual1814.2
Copper
Source of variationDfMean SquaresF-valuep-value
Site221.133477.42.54 × 10−16
Time27.117160.83.31 × 10−12
Site × Time45.145116.21.34 × 10−12
Residual180.044
Iron
Source of variationDfMean SquaresF-valuep-value
Site2506,27130.721.58 × 10−6
Time21,826,597110.827.61 × 10−11
Site × Time4370,49422.488.49 × 10−7
Residual1816,482
Manganese
Source of variationDfMean SquaresF-valuep-value
Site210.31.8420.187
Time2532.694.8272.76 × 10−10
Site × Time474.813.3253.22 × 10−5
Residual185.6
Molybdenum
Source of variationDfMean SquaresF-valuep-value
Site20.462730.941.50 × 10−6
Time20.252316.877.46 × 10−5
Site × Time40.186112.455.00 × 10−5
Residual180.0150
Sodium
Source of variationDfMean SquaresF-valuep-value
Site27,023,9810.2880.753
Time255,996,2042.3000.129
Site × Time424,518,1481.0070.430
Residual1824,348,796
Zinc
Source of variationDfMean SquaresF-valuep-value
Site2186.1273.162.27 × 10−9
Time255.0921.651.62 × 10−5
Site × Time47.733.040.0445
Residual182.54
Table 4. Summary of effects of sampling site and time of the year on elemental parameters in sea urchin crush (Strongylocentrotus droebachiensis) collected in Northern Norway. p-Values and corresponding F-values, mean squares, and degrees of freedom of the 2-way ANOVA are reported for the analyses of all response variables. Values in bold denote statistically significant values. For all elements n = 3.
Conductivity
Source of VariationDfMean SquaresF-valuep-value
Site2110,4644.5660.0249
Time212,9580.5360.5943
Site × Time477350.3200.8610
Residual1824,192
pH
Source of variationDfMean SquaresF-valuep-value
Site20.0936725.3425.83 × 10−6
Time20.1916751.8553.38 × 10−8
Site × Time40.023496.3540.00227
Residual180.00370
Disclaimer/Publisher’s Note: The statements, opinions and data contained in all publications are solely those of the individual author(s) and contributor(s) and not of MDPI and/or the editor(s). MDPI and/or the editor(s) disclaim responsibility for any injury to people or property resulting from any ideas, methods, instructions or products referred to in the content.

