1. Introduction
Migration exerts a significant influence on population dynamics, public services, and the socio-economic landscape, necessitating an in-depth analysis of household structures to inform policy-makers and service providers for future strategic planning [
1]. An understanding of the economic and social determinants affecting migration dynamics is critical, requiring an examination of the scale and dynamics of household relocations across different regions [
2].
The relationship between distance, age, and house price significantly influences migration patterns and local sustainability. Research indicates that younger populations tend to migrate shorter distances, often driven by affordability and job opportunities, which are closely tied to house prices in urban areas [
3]. Conversely, older individuals may seek to relocate to suburban or rural areas, where housing is more affordable, impacting local demographics and sustainability efforts [
4]. Moreover, house prices can deter migration, particularly for younger individuals, who face financial constraints, leading to stagnation in urban centers and potential decline in local economies [
5]. This dynamic creates a feedback loop in which high house prices exacerbate distance-related migration challenges, ultimately affecting community sustainability and resource allocation.
Although previous research highlighted the impact of house prices and age demographics on migration trends, emphasizing the importance of housing affordability, locational preferences, and distance [
6,
7,
8], there remains a notable gap in comprehending the spatial dynamics that connect migration destinations with the age of migrants and house price levels. This deficiency underscores the need for further research into how factors such as age, geographical distance, and housing affordability influence migration patterns in various contexts. In this paper, we aim to answer the following questions: How do house price levels in migration areas correlate with household characteristics such as age, migration distance, and previous areas categorized by house price levels, and what are the policy implications and contributions to the literature on migration patterns?
In the UK, the Office for National Statistics conducts a comprehensive census every ten years. The 2011 Census provided detailed insights into demographic changes, housing, and employment shifts, all of which are crucial for informing policy and planning. Given the public availability of migration data from the Census, this source of migration information is invaluable for exploring population trends and patterns at both national and subnational levels [
9]. Utilizing this dataset, previous research was conducted to elucidate the dynamics of migration flows, their temporal changes, and the significance of distance analysis [
2,
10]. Additionally, this dataset is often integrated with other datasets to examine the influence of social and economic factors on household mobility [
7,
11,
12]. Within this context, house price data emerge as a critical variable. However, the existing body of migration studies that investigate the spatial connections between house price levels and migration flows is relatively sparse. Consequently, there is a significant opportunity to explore the spatial relationships between house price levels and migration flows, to ascertain whether there is a correlation between the magnitude of mobility flows and house price levels, and to determine whether there is a relationship between migration distance ranges, household age ranges, and the levels of house prices.
In this study, we investigate migration patterns within the Greater Manchester area, UK, focusing on their correlation with housing price levels, household age, and migration distance. Utilizing migration flow data and housing price information from 2011, statistical techniques such as cross-tabulation analysis and Chi-squared tests are employed alongside Geographic Information System (GIS) analysis. This combined approach is applied to identify significant spatial relationships between migration destinations and household characteristics. GIS technology facilitates the creation of detailed maps, illustrating spatial distribution patterns and highlighting connections between migration destinations and variables of interest [
13]. Ultimately, the study is designed to contribute to the understanding of migration dynamics and offer insights for policy-making in housing and urban development within the region [
12].
To conduct the research, we propose the following hypotheses:
Hypothesis 1. There is a significant correlation between housing price levels and migration distances, such that higher housing prices are associated with shorter migration distances.
Hypothesis 2. Age demographics influence migration patterns, with certain age groups showing distinct preferences for regions with varying housing prices.
Hypothesis 3. The relationship between migration flows and housing prices varies by geographic location within Greater Manchester, with specific areas demonstrating stronger associations.
This research showcases the effectiveness of GIS techniques in elucidating the intricate spatial relationships among migration patterns, age groups, and housing prices. A key breakthrough of this study is its application of GIS technologies to reveal the complex web of connections between various factors influencing migration, including housing affordability, demographic shifts, and the distances over which populations move. By graphically representing regions with pronounced migration challenges, GIS enables the formulation of targeted policy measures. Furthermore, the adept use of GIS to analyze extensive datasets on housing prices and migration paths underscores its critical role in dissecting the nuances of migration trends, offering a fresh lens through which to view the complexities of migration behavior. This study significantly enriches the field of migration research by illuminating the local-level spatial dynamics between household migrations and housing prices. By underscoring the utility of GIS in exploring the spatial dynamics of migration catalysts and housing economics, it not only expands the academic discourse but also supplies practical insights for those in urban planning, policy-making, and migration studies. The introduction of a GIS-centric analytical framework represents a pivotal step forward, allowing for the strategic pinpointing and mitigation of issues in areas heavily affected by migration, thus paving the way for spatially informed solutions to migration-related challenges.
2. Literature Review
Predicting population dynamics accurately is crucial for governments worldwide to ensure the provision of adequate services. Efforts have often centered around household projections, utilizing models that incorporate social, economic, and life-cycle factors [
14]. Enhancements in model robustness have been sought through the examination of life-course events, housing dissatisfaction, and the mobility intentions and decisions of diverse household groups [
15,
16]. By the late 1990s, research had delved into how age demographics influence migration decisions, particularly among young individuals, families, retirees, and the elderly [
17]. Social and cultural determinants, such as employment opportunities, housing quality, environmental conditions, public policies, and ethnic background, have also been identified as significant [
17]. Presently, we have created a modelling framework and techniques to analyze and forecast the increase in population and changes in housing density, taking into account the choices made by individuals in three different age groups. However, while these studies provide valuable insights, they primarily employ traditional statistical approaches, with a noted deficiency in spatial analysis techniques for the visual exploration of migration patterns and trends.
In demographic research, the focus often centers on age structure as a crucial factor. Urbanization trends indicate that cities will continue to expand, with significant implications for housing wealth driven by shifts in resident age demographics. Migration played a pivotal role in shaping population patterns and age structures, with concerns raised in the literature about the impact of aging populations on house prices [
18,
19,
20]. Studies suggested that working-age households exhibit greater housing demand compared to retirees [
21,
22,
23]. One study found a negative correlation between old-age dependency ratios and real house price growth [
24]. Furthermore, specific demographic groups, such as married couples and cohabitors, exhibited varying probabilities of homeownership across age groups [
25], contributing to demand for property acquisition. In summary, migration data categorized by age shed light on the relationship between migration flows and housing demand.
Recent research underscored the significant impact of age on migration patterns in a global context. Feng and Wang [
26] found that migration distances vary with age, with retirees moving based on lifestyle changes or family proximity, and older retirees opting for shorter moves for care or downsizing reasons in England. Raymer et al. [
27] highlighted the effects of older population migration on regional systems and demographics in the European Union. Levy and Mussida [
28] noted that young and middle-aged individuals moved for education, career, or family, whereas retirees relocated for lifestyle improvements in European countries. Bell et al. [
29] investigated global internal migration trends, emphasizing age as a key factor in mobility for a wider range of countries around the world [
30]. A decrease in the proportion of individuals in the appropriate age group for home buying, along with shifts in family structures due to aging populations, directly impacted housing prices in China [
30]. Collectively, these findings highlighted the need to consider age-related demographic changes in migration and urban development studies across countries.
In the UK, the Office for National Statistics (ONS) disseminates census data through official websites and various public channels. With access to census-based internal migration data, researchers have increasingly focused on analyzing spatial migration patterns and trends [
2,
9,
10,
31]. These migration data are valuable for understanding individuals’ current and previous locations [
9]. Employing a visual approach has proven useful for investigating trends and patterns within the census dataset, aiding in the identification of problematic migration patterns and their temporal changes. Notably, studies by Champion and Shuttleworth [
32], Kalogirou [
10], and Chen et al. [
31] have explored internal mobility flows in the UK, revealing national and sub-national migration trends. Stillwell et al. [
2] stressed the importance of examining migration trends at regional and local levels over shorter time spans. Such research aids policy-makers and service providers in monitoring and addressing problematic migration patterns effectively. However, these studies often lack insight into the motivations behind movement and other factors associated with household mobility. Therefore, integrating census migration data with other datasets, such as those on housing prices, can offer a more comprehensive understanding of spatial linkages between migration flows and socioeconomic factors in migration areas. In our research paper, we merge census and house price datasets to provide insights into the spatial dynamics of migration and housing prices.
The integration of mobility data with socio-economic datasets in previous research has shed light on the spatial dynamics among regions characterized by distinct socio-economic profiles through the study of migration patterns. Studies such as those by Ferrari and Rae have unveiled the link between housing affordability and migration trends, demonstrating how area-level economic conditions influence residential mobility [
12]. Hincks further explored migration flows against the backdrop of socio-economic disparities, employing visual tools to detail the spatial relationships between areas of varying economic health [
33]. Subsequent work by Darlington-Pollock et al. [
11] and Lomax et al. [
7] identified the critical role of migration distance, correlating it with demographic attributes. This body of work highlights the importance of integrating diverse datasets to deepen the understanding of migration’s socio-economic effects. Nevertheless, the specific impacts of housing prices and age demographics on migration patterns, with a focus on local spatial dynamics, remain insufficiently explored. This paper aims to fill this gap by adopting a visual GIS-based methodology to investigate the local-level spatial relationships between migration flows and housing affordability.
The literature review in this study highlights the profound effects of house prices and age demographics on migration trends, spotlighting the importance of housing affordability, locational preferences, and distance within the housing market. While existing studies have extensively examined the interplay between house prices, age demographics, and migration, there remains a conspicuous gap in the understanding of the spatial dynamics that link migration destinations with the age of migrants and levels of house prices [
7,
8]. This oversight underscores a critical need for further research into how factors such as age, geographical distance, and housing affordability shape migration patterns across different spatial contexts. This study aims to bridge this gap in the literature on migration research by investigating the spatial relationships between migration flows, demographic age groups, and house prices. Prior investigations have largely concentrated on analyzing migration trends and patterns at broader national and subnational levels, often overlooking the nuanced spatial variations that occur at the local level. By adopting a visual analytical approach and utilizing comprehensive datasets, including census information and house price indices, this paper endeavors to uncover how age and house prices exert influence over migration decisions and patterns at a more detailed geographic scale. This nuanced exploration is intended to contribute valuable insights into the spatial mechanisms of migration, thereby enriching our understanding of the complex interdependencies between demographic factors, economic conditions, and migratory movements.
3. Data
3.1. Geographic Boundaries
In this study, we utilized the geographical demarcations of Output Areas (comprising 8684 areas) and Merged Wards (encompassing 215 areas), as delineated in the 2011 UK Census data, along with the 2011 house price data (covering 25,872 postcodes) obtained from the Land Registry database for the Greater Manchester area.
3.2. Migration Flow Data
Additionally, we utilized migration flow data (as shown in
Table 1) sourced from the 2011 UK Census, which was accessible for download at
https://wicid.ukdataservice.ac.uk/ (accessed on June 2023). This dataset contained information regarding migration flows from previous areas (one year prior) to current destination areas, aggregated at the levels of output areas and merged wards within Greater Manchester.
In this paper, we investigate migration data by considering variables including the count of individuals moving from previous locations to current ones, segmented into output and ward areas, alongside the calculated migration distances. Age, classified into five groups from 1–15 years old to 75 years old and above, is used to delve into the correlation between age demographics and migration trends, as well as their influence on housing prices. A statistical analysis is employed to examine the relationships between distance, age, and price. These variables are then visualized on GIS maps to explore spatial connections. By examining how different age groups impact migration distance and the dynamics of the housing market in previous and current areas, the research is intended to offer insights into the interplay among age, migration, and housing market trends.
3.3. House Price Data
We utilized 2011 house price data from the UK Land Registry, focusing on the Greater Manchester area. This dataset included 25,872 property postcodes, which were converted into latitude and longitude coordinates to enable visualization on GIS maps—a process known as geocoding. For this conversion, we employed the Google Maps Geocoding API, ensuring the postcodes were properly formatted and exported into the service. Upon receiving the geocoded output—accurate latitudes and longitudes for each property—we then used QGIS, an open-source geographic information system, to map these locations. This methodical approach allowed us to visually analyze and interpret spatial patterns in housing prices, migration distances, and demographic distributions across Greater Manchester.
Table 2 and
Table 3 offer a condensed overview of the house price data categorized by administrative boundaries, postcodes, average prices, and property numbers. These tables provide a detailed breakdown of house price data across Greater Manchester, organized by administrative boundaries and postcodes. Each table presents the average house prices and the number of properties within specific postcode areas, offering insights into the housing market trends within these regions.
4. Method
The investigation focused on analyzing the correlation between migration areas segmented by price levels and various household factors, including age distributions, migration distances, and preferences for housing prices. The aim of this paper is to answer the following question: How do house price levels in migration areas correlate with household characteristics including age, migration distance, and previous areas categorized by house price levels? Additionally, we seek to explore the policy implications and contributions to the literature on migration patterns. The answers derived from the research questions are intended to hold significant importance for policy-makers as they endeavor to develop more sophisticated and efficient strategies to address the complexities associated with household migration. By providing valuable insights into the spatial dynamics of household migration concerning house prices at the local level, this paper is intended to contribute to enriching the global conversation on migration studies.
To test these hypotheses, we performed a cross-tabulation analysis and chi-squared tests to evaluate the relationships between migration distances, age demographics, and housing prices. GIS was used to map and visualize these relationships spatially. The study employed chi-squared tests and spatial mapping techniques to analyze migration flows and house price data. Chi-squared tests were utilized to assess the association between categorical variables including age, house price, and migration distance. Household ages were segmented into distinct groups, house prices categorized into levels ranging from significantly low to significantly high, and migration flows grouped by distance into short, medium, and long ranges. The null hypothesis stated no significant relationship between these variables. A significance level of 0.05 was chosen to determine statistical significance. Using SPSS software, we calculated the difference between observed and expected frequencies for each category and evaluated the statistical significance of these differences.
On the other hand, spatial mapping involves representing data in geographic space to identify spatial patterns and relationships. To conduct spatial mapping, we utilized QGIS software to present maps of house price data based on latitudes and longitudes, as well as maps of migration flow derived from census flow data. Subsequently, these maps were combined into a single GIS map for spatial analysis. The objective of these maps is to illustrate the spatial patterns of migration flows in relation to factors such as age, migration distance, and house prices.
The UK Census is conducted once every ten years, with the most recent censuses taking place in 2011 and 2021. We utilized census data from 2011, recognizing that there may have been numerous changes in demographic shifts, housing markets, mobility patterns, and economic conditions since then, which could impact the study’s findings. While the 2021 Census data became available for download in 2023, the study proceeded with the 2011 dataset as the basis for its initial investigation. However, the availability of the 2021 dataset presents an opportunity to validate the results and explore any changes in spatial patterns and their associations. Looking ahead, there is potential to analyze trends over a 10-year period using the 2021 census data, thereby enhancing the longitudinal perspective of the study.
4.1. Determining Age Ranges
We utilized the 2011 Census data, incorporating age distribution within migration flows, segmented into the following age ranges: 1–15, 16–49, 50–64, 65–74, and 75 and above.
4.2. Determining House Price Levels and Migration Distance Ranges
We applied the k-means clustering algorithm to categorize house prices and migration distances, following the methodologies outlined by Caliński and Harabasz [
34] and Hincks et al. [
33]. The k-means method is a clustering algorithm that partitions data into K distinct groups based on similarity. It achieves this by initializing K centroids, assigning each data point to the nearest centroid to form clusters, and then iteratively moving the centroids to the average location of the points within each cluster until the positions of the centroids stabilize, indicating that the clusters are as compact and distinct from each other as possible [
35].
The principal components of this methodology involved computing the Variance Ratio Criterion (V) and executing the Tukey post hoc test [
36], facilitated by the SPSS software suite. The Variance Ratio Criterion (V), often associated with the Caliński–Harabasz index, is a statistical measure used to evaluate the quality of clusters in clustering algorithms like k-means [
34]. It is defined as the ratio of the between-cluster variance to the within-cluster variance. A higher Variance Ratio Criterion value indicates better-defined clustering, where data points in the same cluster are more similar to each other (low within-cluster variance) and data points in different clusters are more distinct (high between-cluster variance). On the other hand, the Tukey post hoc test, or Tukey’s Honestly Significant Difference (HSD) test, is a statistical method used to identify significant differences between the means of all possible pairs of groups after an ANOVA indicates overall significant differences [
36]. It controls for Type I errors across multiple comparisons by comparing the mean differences to a critical value, determining which group means are significantly different from each other. In short, the Tukey post hoc test and the Variance Ratio Criterion serve different purposes in statistical analysis: Tukey’s test identifies significant differences between group means after ANOVA, while the Variance Ratio Criterion assesses cluster quality in methods like k-means by comparing between-cluster and within-cluster variance. Together, they can validate clustering solutions and the significance of differences between clusters.
To conduct the k-means method, we first determined the Variance Ratio Criterion (V) values by deriving F-values through a one-way ANOVA analysis in SPSS software, a statistical method used to compare means across different groups. Second, the value of
Qn, representing the rate of change in V across varying numbers of clusters, was computed using the equation provided below. Third, by assessing the change in
Qn, we selected the optimal cluster solution with the lowest
Qn value, indicating the point of diminishing returns in improving clustering quality. Fourth, the significance of the Tukey post hoc test was considered to validate the chosen classification. Based on the ANOVA analysis to determine the significant differences between groups, we utilized SPSS to conduct the Tukey test via SPSS’s ‘Compare Means’ feature. Finally, we reviewed the output with the comparisons between groups together with significance levels and paid attention to group comparisons with significance levels at or below 0.05, ensuring statistically meaningful distinctions.
4.2.1. Determining House Price Levels
Table 4 displays the Variance Ratio Criterion value (V),
Qn value, Tukey post hoc test results, and the optimal grouping option for house prices.
We opted for a five-cluster model (
n = 5) for the analysis. Utilizing the boundaries of 215 merged wards and calculating the average sold price for each area within Greater Manchester, the optimal cluster selection, as determined from the analysis, is outlined in
Table 5.
4.2.2. Determining Migration Distance Ranges
Table 6 presents the Variance Ratio Criterion,
Qn value, and Tukey post hoc test results for mobility distance ranges. Based on the analysis, the optimal cluster selection for distance ranges was determined to be four (
n = 4), corresponding to the minimum
Qn value and the significance of the Tukey post hoc test for this classification.
Table 7 showed the detail for the four distance levels.
5. Results
In this section, we initially explore whether individuals’ previous locations influenced their subsequent destination areas. Secondly, we investigate whether age demographics influenced households’ relocation destinations. Lastly, we delve into the relationship between migration distance and destination areas categorized by price levels.
5.1. The Spatial Relationship between Destination and Origin Areas Based on House Price
Based on the methodology and data outlined previously, we categorized both the original migration areas and the destination migration areas into five distinct house price levels: significantly high price, high price, medium price, low price, and significantly low price in
Table 8. Subsequently, a crosstabulation analysis and chi-squared test were performed, with the results depicted in
Figure 1 and
Table 9.
The table above reveals a pronounced correlation between individuals’ prior residences and their subsequent relocation destinations, categorized by house price levels. Notably, there is a substantial percentage of migrations occurring between areas classified as low price and significantly low price (13.9% and 13.2%, respectively). In stark contrast, the migration percentages between significantly high price areas to high price areas, and from significantly high price areas to significantly low price areas, are minimal (0.1% and 0.3% for the former, and 0.2% for the latter, respectively). The bar chart further elucidates the distinct connection between previous migration areas and current destination areas. Despite the overall trend, there are still observable migration linkages from significantly high price areas to significantly low price areas. Predominantly, migration activities are concentrated in areas characterized by significantly low and low prices.
Figure 1 illustrates the price levels in both the original areas and the destination areas, along with the corresponding number of households relocating. It depicts a robust connection between households’ prior residences and their current migration destinations, delineated by price levels. Although the majority of migration activities are concentrated in significantly low price areas and low price areas, notable migration linkages persist between significantly high price areas and significantly low price areas.
To ascertain whether individuals’ prior residences influenced their selection of migration destination, we conducted the chi-squared test (as shown in
Table 8).
Table 8 demonstrates a significant association between the price levels of original and destination areas through the chi-squared test, with a notably low significance value of 0.000 (Asymp. Sig), indicating a strong correlation. Essentially, the chi-squared test fundamentally compared observed data to what would be expected if no relationship existed between the variables. The significantly low significance value of 0.000 strongly supported the research question posed above, confirming that the observed relationship between the price levels of original and destination areas was not due to chance, thereby underscoring a significant link between these variables in the study.
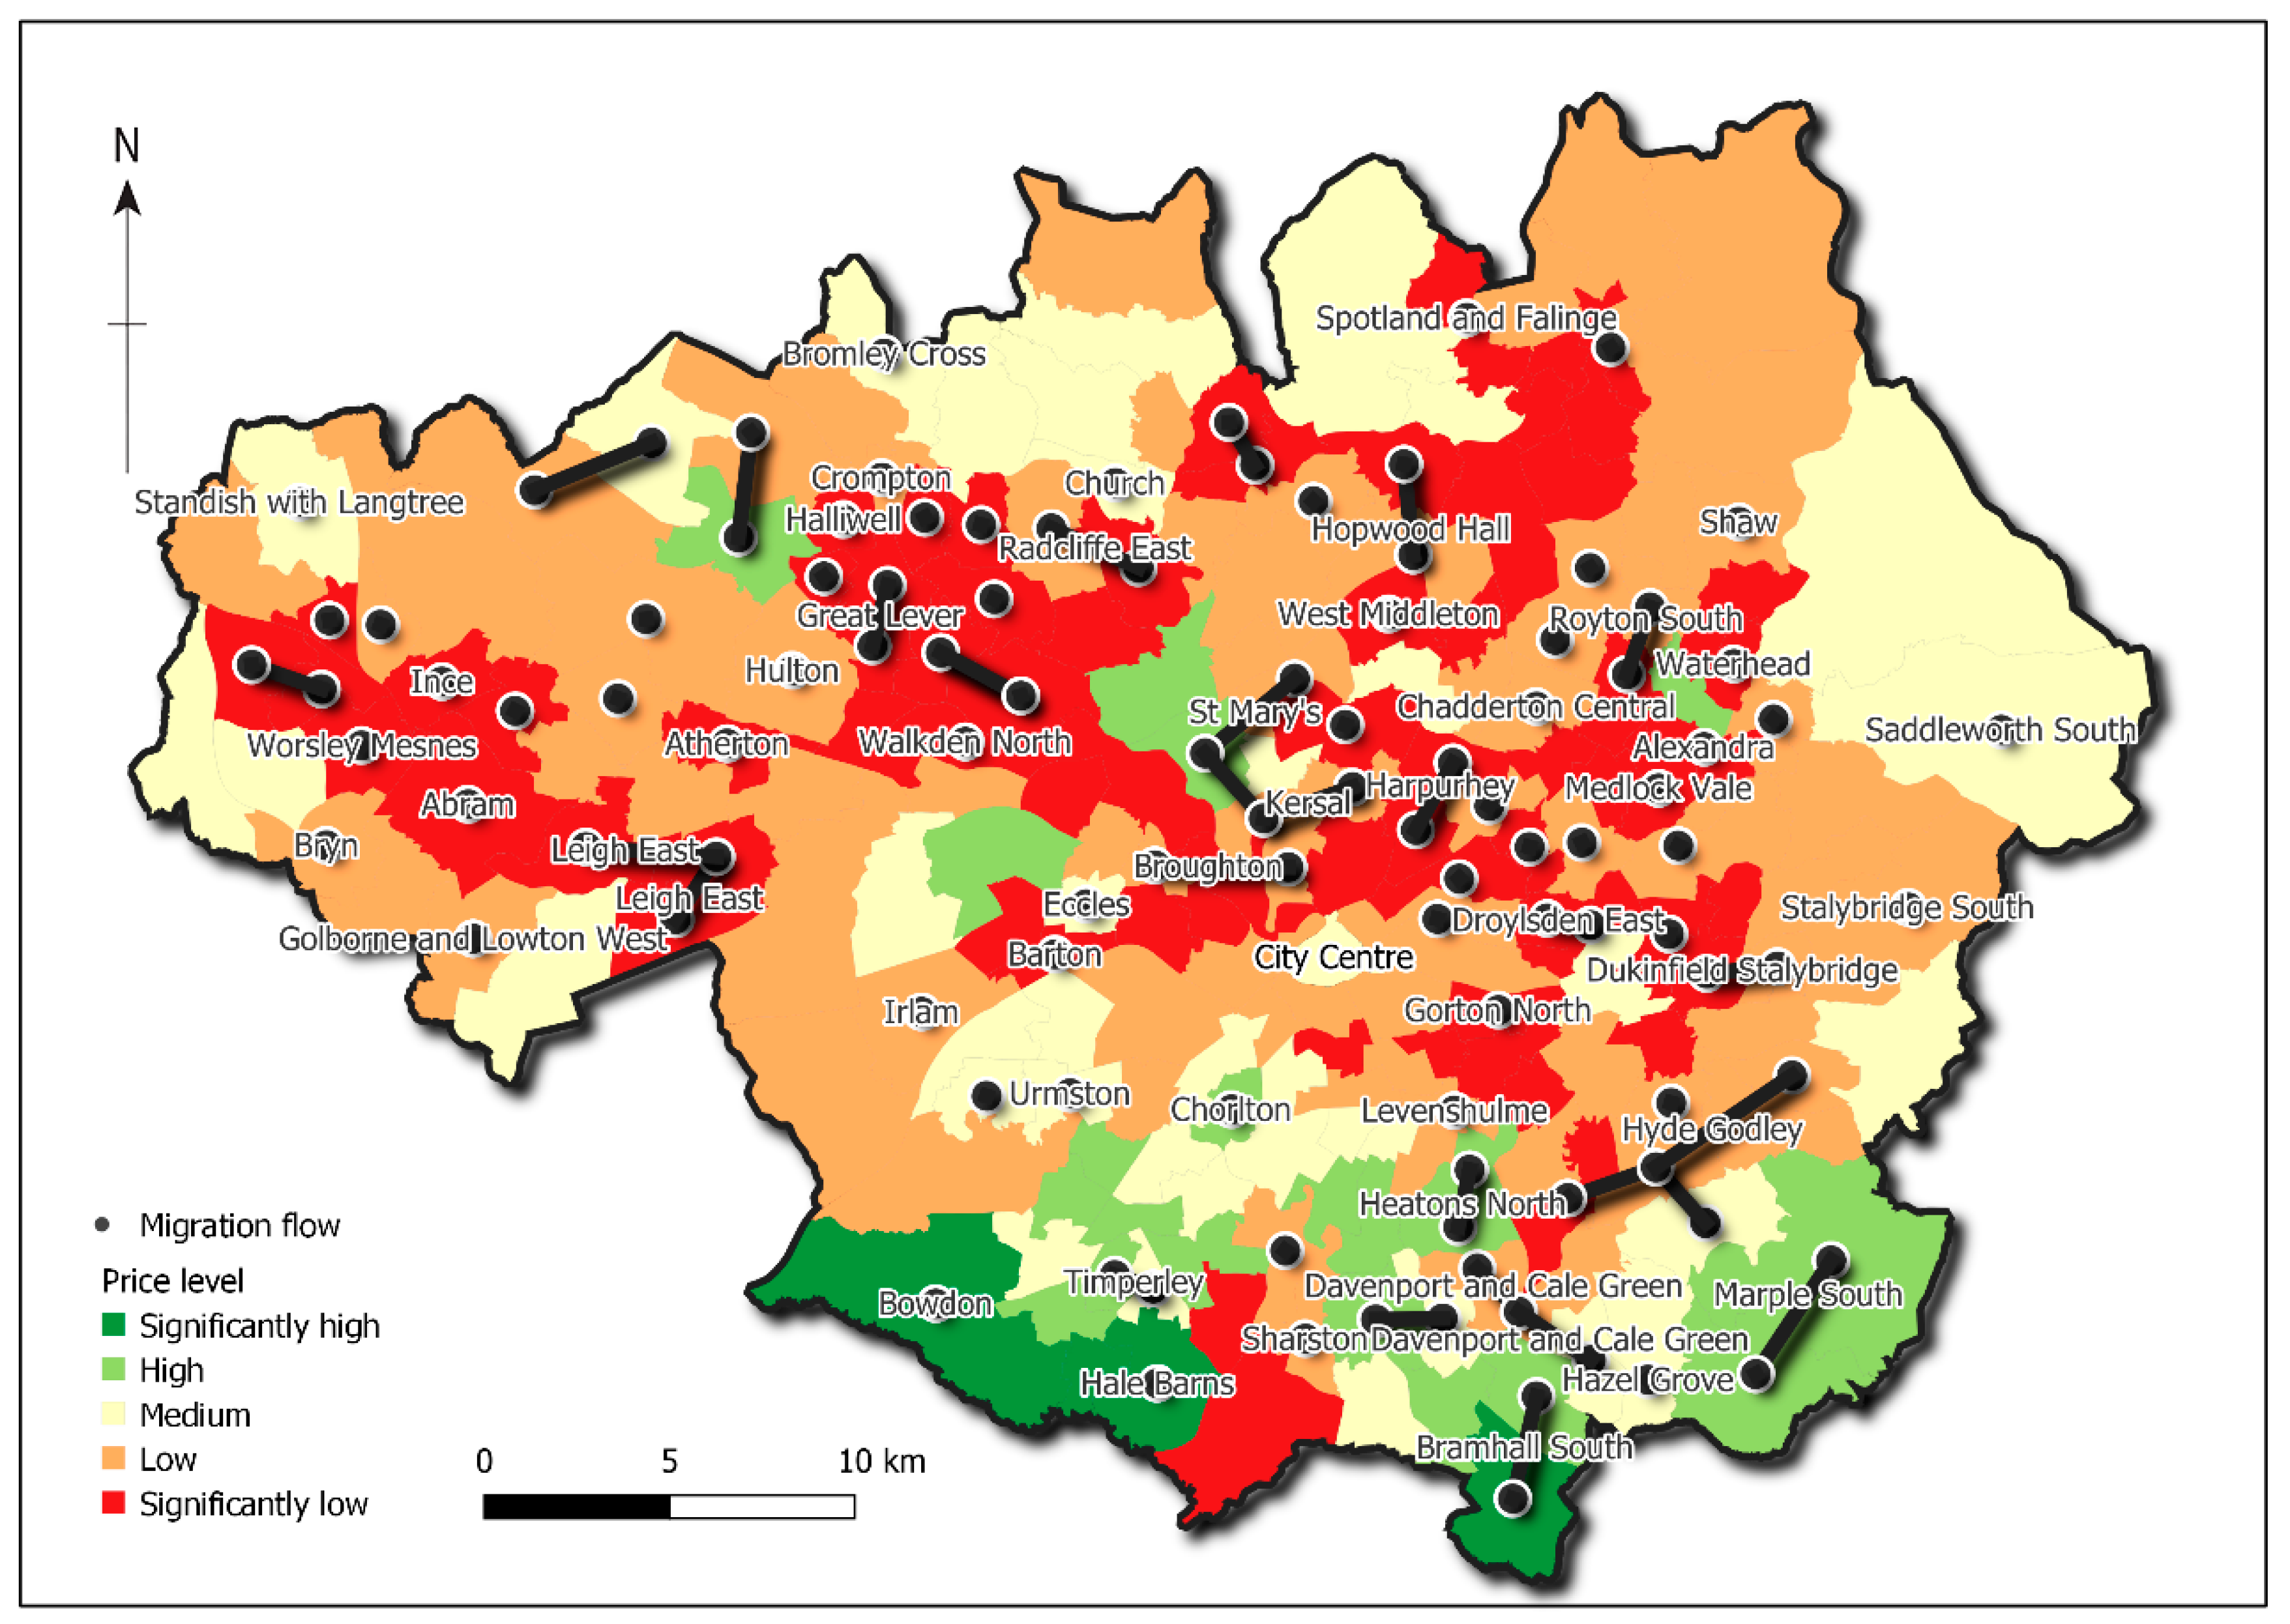
Figure 2,
Figure 3,
Figure 4 and
Figure 5 depict the migration flows into areas categorized by significantly high, high, low, and significantly low house prices. The intensity of these flows is represented through the sizes and colors of the circles on the maps: larger and darker circles signify more substantial migration flows.
Through these visual representations, the study highlights areas experiencing notable migration influxes and traces their origins. Noteworthy migration hotspots include Bowdon and Bramhall in the significantly high price category, Heatons North and St Mary’s in the high price category, and Rumworth, Radcliffe West, and Hindley in the significantly low price category, and Broughton and Crumpsall in the low price category.
The findings of this paper underscore the importance of incorporating spatial analysis into migration and housing market research, building upon the foundational [
12]. While their research offered significant insights into the relationship between house prices and migration flow at a regional level within UK cities, highlighting key implications for urban policy and planning, it did not delve into the granular details of migration patterns at the local level, such as the specific origins and destinations of migrating households.
In recent years, a body of research has explored the complex interplay between house prices and mobility across various nations, shedding light on how housing affordability influences migration behavior within specific country contexts. Although these studies offer empirical insights into the relationship between housing market dynamics and population movements, they often overlook the spatial patterns of migration and house prices. Spatial analysis is crucial for understanding how migration flows intersect with local housing markets and urban development. By examining spatial patterns, researchers can uncover disparities in housing affordability, identify areas experiencing gentrification or urban decline, and assess the efficacy of policy interventions in different regions. The GIS approach employed in this paper contributes to the analysis of spatial patterns between migration and house prices, providing a more comprehensive understanding of the intricate dynamics within housing markets and population movements.
5.2. The Spatial Relationship between Distance Ranges, House Prices, and Migration
This section delves into the nexus between migration distance and the pricing tiers of migration destinations. Initially, we present a cross-tabulation analysis to explore the correlation between the ranges of migration distance and the levels of house prices (as shown in
Table 10). The data reveal a notable trend: a significant proportion of households opt for medium, long, and notably long distances when relocating to areas characterized by significantly low and low house price levels. Conversely, areas classified under the high price level category register a substantial influx of households migrating over medium distances. This pattern is further elucidated in the accompanying bar chart, visually representing the distribution of migration distances across different house price levels in
Figure 6.
Table 11 depicted the results of the chi-squared analysis for distance and price level, assessing whether a significant association existed between these two categorical variables by comparing observed data to expected data under the assumption of no relationship. A low significance value (e.g., less than 0.05) typically indicated a meaningful association. The analysis revealed a pronounced association between migration distance levels and the price categories of areas, as evidenced by an Asymptotic Significance (Asymp. Sig) value of 0.000. This statistical evidence addressed the earlier research question, suggesting a marked propensity for mobility among residents of areas characterized by low and significantly low house prices compared to those residing in high and significantly high-priced regions, indicating that economic factors, notably the cost of housing, played a critical role in influencing household mobility decisions and migration distances.
Figure 7, based on the data regarding distance levels and price-based areas, depicts the spatial distribution of migration flows within the distance range of 4.17 KM and below, categorized by price-based areas, particularly focusing on flows ranging from 150 to 1187 persons per flow. Notably, significant short-distance migrations are concentrated in areas characterized by significantly low house prices, such as Bradford and Charlestown.
Recent research highlights the significant influence of migration patterns, revealing variations in migration distances and motivations across different contexts. Lomax et al. [
7] and Darlington-Pollock et al. [
11] have explored the patterns of migration distance at national and regional scales, illuminating spatial trends in migration. Despite these insights, the intricate spatial relationships between migration, distance, and housing prices at the local level have received less attention. This oversight suggests a fertile area for investigation into how local migration patterns are shaped by the interplay between distance and housing price dynamics, contributing to a deeper understanding of the spatial nuances of migration. The methodology presented in this paper provides a framework for probing these complex spatial dynamics, offering a novel approach to dissecting the influences of distance and price on migration at a more granular level.
5.3. The Spatial Relationship between Ages, House Prices, and Migration
The analysis delineates a notable correlation between age demographics and housing price levels, with a pronounced inclination of individuals aged 16–49 towards regions characterized by low (26.5%), significantly low (24.9%), and medium (12.7%) housing prices in
Table 12. This trend underscores the priorities of this age bracket, possibly driven by budget considerations and life stage needs. Conversely, there is a marked scarcity of migration from all age categories, barring the 16–49 group, into areas with high and significantly high housing costs, indicating potential affordability barriers or differing needs among these groups. Overall, the age group of 16–49 exhibits the highest mobility across various price levels, highlighting their significant role in urban migration patterns.
The chi-squared test (as shown in
Table 13) was utilized to examine the relationship between different age ranges and housing price levels, with the aim of uncovering whether distinct age groups display varying preferences influenced by economic factors. In this analysis, particularly focusing on the group aged 75 and above, we identified a distinctive and significant correlation, as evidenced by a Pearson chi-squared value of 0.000. Such a low significance level indicates that the observed association is highly unlikely to have occurred by chance, thus providing robust statistical evidence that supports the research hypothesis. This result unequivocally suggests that individuals within this age cohort exhibit deliberate preferences in their migration patterns, which are predominantly influenced by housing price levels. The finding underscores the critical role that economic considerations play in the residential decision-making processes of the elderly population, possibly in conjunction with other factors such as accessibility, community services, and healthcare availability, highlighting how these elements collectively influence the migration decisions of older adults.
Figure 8 depicts the migration patterns of individuals aged 75 and above, revealing notable movement trends characterized by short-distance relocations from higher-priced to lower-priced areas, exemplified by flows from locales such as Hyde Godley to Bramhall South. Similarly, substantial migration flows were observed between areas characterized by significantly low housing prices, as evidenced by movements between Harpurhey and Great Lever. These findings illuminate the mobility preferences and tendencies of elderly populations, emphasizing their propensity for relocation to areas offering more affordable housing options and/or potentially better access to essential amenities and services.
This finding aligns with previous research by Feng and Wang [
26] and Levy and Mussida [
28], which highlights a robust correlation between migration patterns, mobility distances, and age demographics. Individuals transitioning into retirement age are inclined to undertake longer-distance moves, whereas older retirees often opt for shorter relocations, potentially motivated by factors such as retirement care or downsizing. Moreover, migration trends exhibit significant activity during early adulthood and middle age, with many young and middle-aged individuals relocating for educational, career, or familial reasons [
28]. However, prior studies primarily relied on statistical analyses and did not delve into spatial exploration to discern the spatial patterns underlying such migrations. This paper contributes by offering an effective approach to unravel spatial patterns and identify problematic areas associated with age demographics and house price levels.
In short, the analysis supported Hypothesis 1, showing that higher housing prices are associated with shorter migration distances, highlighting the impact of housing prices on migration distances. However, Hypothesis 2 was only partially supported, revealing that while certain age groups prefer specific housing price ranges, the effect is less pronounced than anticipated. Hypothesis 3 was confirmed, with varying strengths of association observed across different geographic areas. Spatial variations within Greater Manchester affect the relationship between migration and housing prices, emphasizing the need for localized policy interventions.
6. Conclusions and Discussion
In this paper, we examined the correlation between migration areas categorized by house price levels and three household characteristics: age, migration distance, and previous areas grouped by house price levels. Through a cross-tabulation analysis, chi-squared tests, and GIS techniques, significant connections were identified between destination migration areas and house price ranges, in conjunction with household age groups, migration distance ranges, or previous locations associated with specific house price levels. We leveraged the GIS overlay technique to combine multiple spatial data layers, including migration patterns and housing price levels, uncovering new insights into the spatial correlation between migration factors and housing prices. This approach enabled the visualization of complex relationships on maps, highlighting distinct spatial patterns and areas where economic factors significantly influence migration decisions. By providing a clear, visual format, GIS was instrumental in revealing and illustrating the nuanced interplay between migration behaviors and housing prices, thereby enhancing the study’s exploration and communication of intricate spatial dynamics.
This study’s hypotheses have been instrumental in elucidating the complex relationships between migration patterns, housing prices, and demographic factors. The results underscore the importance of considering these variables in urban planning and policy development, providing suggestions for urban planners and policy makers. These findings suggest that urban planners and policy-makers should consider implementing targeted housing policies that address the specific needs of different age demographics. For instance, the group made up of individuals aged 16–49 played a significant role in urban migration patterns, often moving into areas with high and significantly high housing costs more frequently than other age groups. The affordable housing initiatives in urban centers could attract younger populations, while developing age-friendly communities in suburban areas could better serve older residents. Additionally, enhancing public transportation links between urban and suburban areas could facilitate mobility for all age groups, thereby addressing the disparities in migration patterns related to housing price. The migration patterns of individuals aged 75 and older, which are characterized by short-distance relocations from higher-priced to lower-priced areas, reveal notable movement trends. The interplay of distance, age, and house prices shapes migration trends, with significant implications for local sustainability, highlighting the need for policies that address housing affordability and promote balanced demographic shifts.
Building upon these research findings, we propose the following policy implications and contributions to the literature on migration patterns. Firstly, the employment of a GIS approach in this study revealed its effectiveness in spatially identifying specific migration patterns and problematic migration areas, contingent on the availability of migration flow data and house price data. Such insights enable policy-makers to devise more informed solutions to challenges associated with household migration. For instance, enhancements to property conditions or the construction of new housing in areas of high migration density could be considered, as well as strategies to alter existing migration patterns. In particular, in the analysis above, we identified migration hotspots such as Bowdon, Bramhall, Heatons North, and St. Mary’s. The price levels in these areas were notably higher compared to others. The construction of new houses in these areas may alleviate the affordability problem. Conversely, in areas with the lowest price levels, such as Broughton and Crumpsall, relocation activities were quite high, implying that households were moving out due to dissatisfaction with neighborhood or property conditions. In this case, improving property conditions or neighborhoods may help encourage households to continue residing in such areas.
Secondly, the findings of this paper enrich the international body of research on migration studies by offering insights into the spatial relationship between household migration and house prices at the local level. The study underscores the significance of utilizing a GIS approach to examine the spatial dynamics between household migration determinants and house price levels. It also emphasizes the value of migration flow data and house price data in enhancing our comprehension of the spatial migration behaviors of households. Through these contributions, the paper not only advances academic understanding but also provides practical insights for urban planners, policy-makers, and researchers interested in the intricate dynamics of migration and housing markets. The paper provides evidence of a correlation between migration factors and house price levels in original and destination locations, and highlights the significance of applying a GIS approach. Urban planners can utilize these findings to strategically allocate resources for infrastructure development, housing projects, and community revitalization efforts in migration hotspots, thereby promoting sustainable urban growth. Policy-makers can tailor housing policies and incentives to address affordability issues in high-demand areas while simultaneously implementing measures to improve living conditions in low-priced neighborhoods, thus alleviating relocation pressures and fostering neighborhood stability. Furthermore, researchers can delve deeper into specific factors driving household migration patterns, facilitating the development of targeted interventions and long-term solutions to address real-world challenges related to housing market dynamics and population mobility.
Previous scholarly inquiries have primarily focused on aspects such as migratory intentions, destination preferences, and relocation distances. However, the distinctive contribution of this paper lies in its spatially explicit analysis, which identifies specific migration pathways, spatial distributions, and areas of heightened migratory activity—a facet seemingly underexplored in extant migration research. The salience of this analytical framework lies in its utilization of the GIS methodology, which facilitates identification and targeted intervention in problematic locales and migration hotspots. Consequently, this spatially informed approach holds promise for effective remedial interventions in areas prone to migration-related challenges.
While this study offers valuable insights into the relationship between migration and house prices at the local level, it is important to acknowledge its limitations. Firstly, the paper relies solely on basic statistical and GIS techniques, which may limit the depth of analysis and the generalizability of the findings to other contexts. The use of more advanced analytical methods could potentially yield more robust results applicable to diverse settings. Secondly, while the 2011 migration data are considered outdated and may not fully capture current migration trends due to changes in methodologies and the impact of socio-economic, political, and demographic shifts over the past decade, their use in forecasting or policy-making could result in less reliable outcomes. Nonetheless, this paper is intended to serve as a cornerstone in demonstrating the relationship between migration factors and house prices, proposing a GIS approach to analyze future migration data.
This paper represents an initial exploration of the complex interplay between migration patterns and house prices. With the availability of 2021 migration data alongside 2011 house price data, there is an opportunity to revisit and assess any changes in the relationship between migration and house prices, as well as in their spatial patterns, offering valuable insights into how these dynamics have evolved over time. Furthermore, the observed correlations between migration factors and house price levels in previous and destination areas suggest the feasibility of developing predictive models. These models could incorporate additional factors such as job trends and demographics, utilizing advanced analytics, like machine learning, for deeper insights. With access to migration data from 2001, 2011, and 2021, time-series analysis can capture the evolving nature of these dynamics, while segmentation by demographic factors allows for tailored predictions. Such predictive models can help to sharpen our understanding of migration patterns and housing economics, aiding policy and urban planning decisions by potentially forecasting the price levels of areas to which households are inclined to move, based on their age and distance, as well as the price level of their current location. In summary, this paper serves as a foundational investigation, demonstrating a significant relationship between household age ranges, migration distance ranges, and house price levels in both original and destination areas. It proposes a pivotal GIS approach to identify spatial patterns among these variables, contributing a method that can be used to analyze the combination of house price and migration data, particularly given their availability every 10 years.


