Article

Oil Plant Pomace as a Raw Material in Technology of Sustainable Thermoplastic Polymer Composites

1
Institute of Wood Sciences and Furniture, Department of Technology and Entrepreneurship in Wood Industry, Warsaw University of Life Sciences—SGGW, 159 Nowoursynowska St., 02-776 Warsaw, Poland
2
Institute of Wood Sciences and Furniture, Department of Wood Science and Wood Protection, Warsaw University of Life Sciences—SGGW, 159 Nowoursynowska St., 02-776 Warsaw, Poland
3
Institute of Food Sciences, Department of Food Engineering and Process Management, Warsaw University of Life Science—SGGW, 159C Nowoursynowska St., 02-776 Warsaw, Poland
*
Author to whom correspondence should be addressed.
Sustainability 2024, 16(16), 7088; https://doi.org/10.3390/su16167088
Submission received: 26 July 2024 / Revised: 12 August 2024 / Accepted: 15 August 2024 / Published: 18 August 2024
(This article belongs to the Special Issue Sustainability in Civil and Environmental Engineering)

Abstract

:
The design of composites offers extensive opportunities for controlling parameters and utilizing diverse materials, including those sourced from recycling or waste streams. In this study, biocomposites were developed using high-density polyethylene (HDPE) and pomace derived from oilseed plants such as evening primrose, gold of pleasure, rapeseed, and sunflower seeds, mixed in a 1:1 ratio. These biocomposites were evaluated for their structural, mechanical, morphological, and thermal properties, as well as their vulnerability to overgrowth by cellulolytic fungi. The results indicate that incorporating plant waste into HDPE reduces thermal stability while increasing water absorption and thickness swelling. Additionally, the biocomposites showed enhanced fungal growth, which may improve their biodegradability. Notably, the PE_EP composite, derived from evening primrose pomace, did not show significant differences in surface roughness and MOE parameters compared to pure polyethylene. In the case of PE_R composite, an increase in MOE was observed while maintaining the MOR parameter compared to pure PE. Although generally the mechanical properties of composites were lower compared to pure polyethylene, the findings suggest that with further optimization, oil plant pomace can be a valuable raw material for producing biocomposites suitable for various industrial applications, thereby contributing to sustainability and effective waste recycling.

1. Introduction

Ensuring food security is the socio-economic foundation for many countries around the world. Therefore, the agri-food sector is one of the most dynamically developing branches of industry. Still, it also generates a huge amount of waste that should be properly managed or disposed of [1,2]. Due to the variety within the agri-food industry, the generated waste varies in durability, harmfulness, and potential for reuse [3,4]. Plant production creates waste in the form of fruit and vegetable pomace, seeds, leaves, stems, and straw. Many of these wastes are reused. Through appropriate actions taken by state policies, the agri-food economy follows the principles of a circular economy, giving waste a new life in new products and keeping them in circulation for as long as possible [5]. Waste from primary plant production mainly consists of plant biomass, which can be successfully reused in 95% of cases. This waste group is mainly used as compost and animal feed [6,7], but the processing possibilities for this waste group are much broader. Numerous data indicate that plant waste is used to produce pectin [8,9], flavors and dyes, organic acid, distillates [10], and industrial assortments such as pellets or insulation boards [11,12]. Research has shown that apple pomace can be used to produce pellets, while rapeseed pomace, when added to energy crop pellets, increases the calorific value of the final pellet. Oilseed plant waste can be successfully used as combustible material or, as recent studies suggest, as raw material for the production of hydrogen fuel and methane [13,14]. Plant pomace, being a bio-waste from the agri-food industry, can be a significant raw material for various applications. Due to their valuable nutrient content, some pomaces, such as rapeseed and sunflower, are used as feed additives or organic fertilizers [15,16]. Other wastes, like evening primrose pomace, which are rich in phytonutrients, are used in the production of cosmetics and functional food [17,18]. Some studies suggest that fruit pomace, especially from apples, can be used to produce packaging materials that could replace plastic packaging in the future. Additionally, these packaging materials can be not only biodegradable but also edible. Packaging made from the olive pomace, produced by Grzelczyk et al. [12], degrades in about 30 days. The use of plant-based waste materials for the production of polylactic acid (PLA) plastics has brought certain environmental benefits [19]. A good solution is also the attempt to modify petroleum-based plastics by adding plant material while simultaneously reducing the percentage of petroleum-derived monomers [20]. It should be noted that such actions and combinations of raw materials help to reduce CO2 emissions [21,22]. The presence of plant components, especially those rich in polyphenols or other active ingredients, in the polymer structure often leads to the creation of functional composites. Mizielińska et al. [23] demonstrated that coating polyethylene films with coatings containing buckwheat extracts give the film antibacterial properties. Other studies have found that grape extracts and their polyphenols improve polyethylene processability and slightly enhance its homogeneity [24].
Various plant agriculture wastes have been used in combination with different polymer matrices to produce composites, including potato, apple, and citrus peels pomace [25], grape pomace [26,27,28], olive pomace [29,30], corn pomace [31,32,33,34,35,36], flax pomace and fibers [37,38,39,40], coconut shell powder [41,42,43], almond shell powder [44,45,46,47], soybean hulls [48,49,50] or walnut shell powder [51,52,53,54,55]. Composites made of high-density polyethylene (HDPE) and agricultural waste such as oilseed pomace, represent a promising path in sustainable materials research. The utilization of natural fibers and plant residues in polymer matrices not only enhances the environmental credentials of these materials but also offers solutions for recycling and waste management challenges. Although various types of fillers are being investigated in lignocellulosic polymer composites, the use of post-production pomace undeniably offers numerous advantages. An extruded form of pomace simplifies storage and transport. There is also no need to collect material. An innovative aspect is combining production methods from both plastic and wood industries, utilizing extruded blends to manufacture flat-pressed panels. The primary objective of this study is to evaluate the structural, mechanical, morphological, and thermal properties of these biocomposites and their susceptibility to cellulolytic fungi overgrowth. By incorporating pomace from a few types of plants like evening primrose, gold of pleasure, rapeseed, and sunflower seeds into HDPE, the study seeks to create a sustainable material with optimal parameters that can be used in various industrial applications.
By converting plant pomace into valuable composite materials, industries can reduce waste disposal costs and generate additional revenue streams. The development of sustainable materials leads to a reduction in environmental impact and promotes a circular economy, which is increasingly becoming a priority for many governments and industries worldwide.

2. Materials and Methods

2.1. Preparation of Biocomposites

The materials used as a reinforcement in the production of biocomposites were the oil-pressing residues from plants like evening primrose, gold of pleasure, rapeseed, and sunflower seed pomace. These fillers were integrated into a matrix of high-density polyethylene (HDPE) (Hostalen GD 7255, Basell Orlen Polyolefins sp. z o.o., Płock, Poland). The first part of the manufacturing process for these biocomposites is based on the methodology described in the authors’ previous publications [56]. Initially, the pomace from these plant sources was shredded into a fine fraction ∈<0.315–1.000> mm, using a knife mill (OB-RPPD sp. z o.o., Czarna Woda, Poland) and mixed with HDPE in a 1:1 ratio. Subsequently, the mixture underwent homogenization using a high-speed mixer (KMOD SGGW, Warsaw, Poland). Biocomposites were then formed from the resulting blend using an extruder (Leistritz Extrusionstechnik GmbH, Nürnberg, Germany), followed by further size reduction with a knife mill (OB-RPPD sp. z o.o., Czarna Woda, Poland) to achieve a finer fraction for subsequent processing steps. The temperatures in the individual sections of the extruder were 170–180 °C and the speed 16 RPM. Next, the prepared mixture was used to manufacture composite boards with an assumed density of 900 kg/m3. Form frames for boards pressing were made from 2.5 mm thick MDF. Form inside dimensions were 275 mm × 160 mm (rectangular shape). Aluminum sheets and parchment paper were used to prevent the composite material from adhering to the frames. The prepared material underwent pressing in a single-shelf laboratory press (AB AK Eriksson, Mariannelund, Sweden) at a temperature of 180 °C for composites and 140 °C for the control sample. Temperatures were determined through technological trials and sensory evaluations. Directly after hot pressing, the material was cooled under pressure using equipment from the Industrial Equipment Plant, Nysa, Poland. After 24 h of seasoning, the samples were cut to dimensions of 250 mm × 150 mm, and after that to sizes appropriate for conducting specific tests.
The obtained composites were marked with the following codes:
  • PE_0: pure high-density polyethylene (HDPE) or control samples;
  • PE_EP: HDPE + evening primrose seed pomace;
  • PE_G: HDPE + gold of pleasure seed pomace;
  • PE_R: HDPE + rapeseed seed pomace;
  • PE_S: HDPE + sunflower seed pomace.

2.2. Quality Parameters of Composites

Since the last stage of the composite manufacturing process is flat pressing, a technique common in the wood industry, standards used for wood-based materials were applied to test the obtained composites.

2.2.1. Density and Mechanical Properties

The density was determined according to EN 323:1999—Wood-based panels—Determination of density [57] using a PS 1000.X2 (Radwag, Radom, Poland) electronic balance and electronic caliper. Modulus of rupture (MOR) and modulus of elasticity (MOE) were assessed in accordance with EN 310:1994—Wood-based panels—Determination of modulus of elasticity in bending and of bending strength [58]. The tests were conducted using a strength apparatus manufactured by OB-RPPD sp. z o.o. (Czarna Woda, Poland) and using OBRCzW_NET_MS software (OB-RPPD sp. z o.o. Czarna Woda, Poland).

2.2.2. Surface Roughness

Surface roughness parameters were determined using a Surftest SJ-210 portable contact profilometer (Mitutoyo Co., Kawasaki, Japan), based on the assumptions of EN ISO 21920-2:2022-06—Product Geometry Specifications (GPS)—Geometric Structure of Surfaces: Profile—Part 2: Terms, definitions, and parameters of the geometric structure of surfaces [59]. For each composite variant, Rz, Ra, and Rq parameters were determined, where Rz is the average maximum height of the profile, Ra—Arithmetic Average Roughness, and Rq—Root Mean Square Roughness.

2.2.3. Contact Angle

The contact angle was determined using a Haas Phoenix 300 goniometer (Surface Electro Optics, Suwon City, Republic of Korea) equipped with an automated system for dispensing 1 μL water droplets. Measurements were taken at 5-, 20-, 40-, and 60-second intervals after deposition of the droplet on the sample surface. An image analysis system (Image XP, Surface Electro Optics, version 5.8, Suwon City, Republic of Korea) was utilized to measure the angle, determining it as the angle between the tangent to the drop contour and the straight line crossing its base. Each measurement was repeated 10 times.

2.2.4. Water Absorption and Thickness Swelling

Thickness swelling (TS) after 2 h and 24 h immersion in water was determined according to EN 317:1999—Particleboard and fiberboard—Determination of swelling to thickness after soaking in water [60]. Water absorption after 2 h (WA2) and 24 h (WA24) soaking in water [%] was calculated according to the Formula 1 as follows:
WAn = (mn − m0)/m0 × 100%,
where
m0—mass of sample, mn—mass of sample after soaking in water, n—time, n ∈ (2, 24).

2.2.5. Fourier-Transform Infrared Spectroscopy (FTIR)

Infrared spectra were acquired using a Cary 630 spectrometer (Agilent Technologies Inc., Santa Clara, CA, USA) equipped with a diamond crystal ATR reflection accessory. Spectral analysis was conducted over the wavelength range of 650–4000 cm−1 with a resolution of 4 cm−1 and 32 scans on the spectrum. Before measurement, the background spectrum was recorded. The analysis was carried out by pressing the sample against the crystal using a pressure clamp. For each sample, 3 scans were taken. All data were recorded using MicroLab FTIR software (Santa Clara, CA, USA). For the analysis, FTIR Functional Group Database Table with Search—InstaNANO was used [61].

2.2.6. Thermal Properties of Composites

Thermal stability was assessed using a thermogravimeter (TGA/DSC 3+, Mettler Toledo, Greifensee, Switzerland). Approximately 7 mg of the crushed material was placed in open 70 µL alumina crucibles and subjected to pyrolysis from 30 to 600 °C, with a heating rate of 5 K/min, under a nitrogen atmosphere (flow rate of 50 mL/min). Also, material combustion in oxygen was conducted from 30 to 600 °C, with a heating rate of 5 K/min, under an oxygen atmosphere (flow rate of 50 mL/min). The TGA and DTG thermograms were analyzed using STARe software (version 16.20c) from Mettler Toledo (Greifensee, Switzerland). The analysis was performed in duplicate.

2.2.7. SEM Analysis

The surface observations of the pure polyethylene control samples and composites were performed using a Phenom XL (Phenom World, Eindhoven, The Netherlands) scanning electron microscope. The samples were covered by a 5 nm gold layer before the observations using an auto sputter coater (Leica EM ACE200; Leica Mikrosysteme GmbH, Vienna, Austria), due to their poor electrical conductivity. The photos were taken at the magnifications of 200 and 1000× and recorded using Phenom ProSuite Software (ver. 5.4.7). The acceleration voltage of the electrons was 10 kV, and the pressure was 10 Pa.

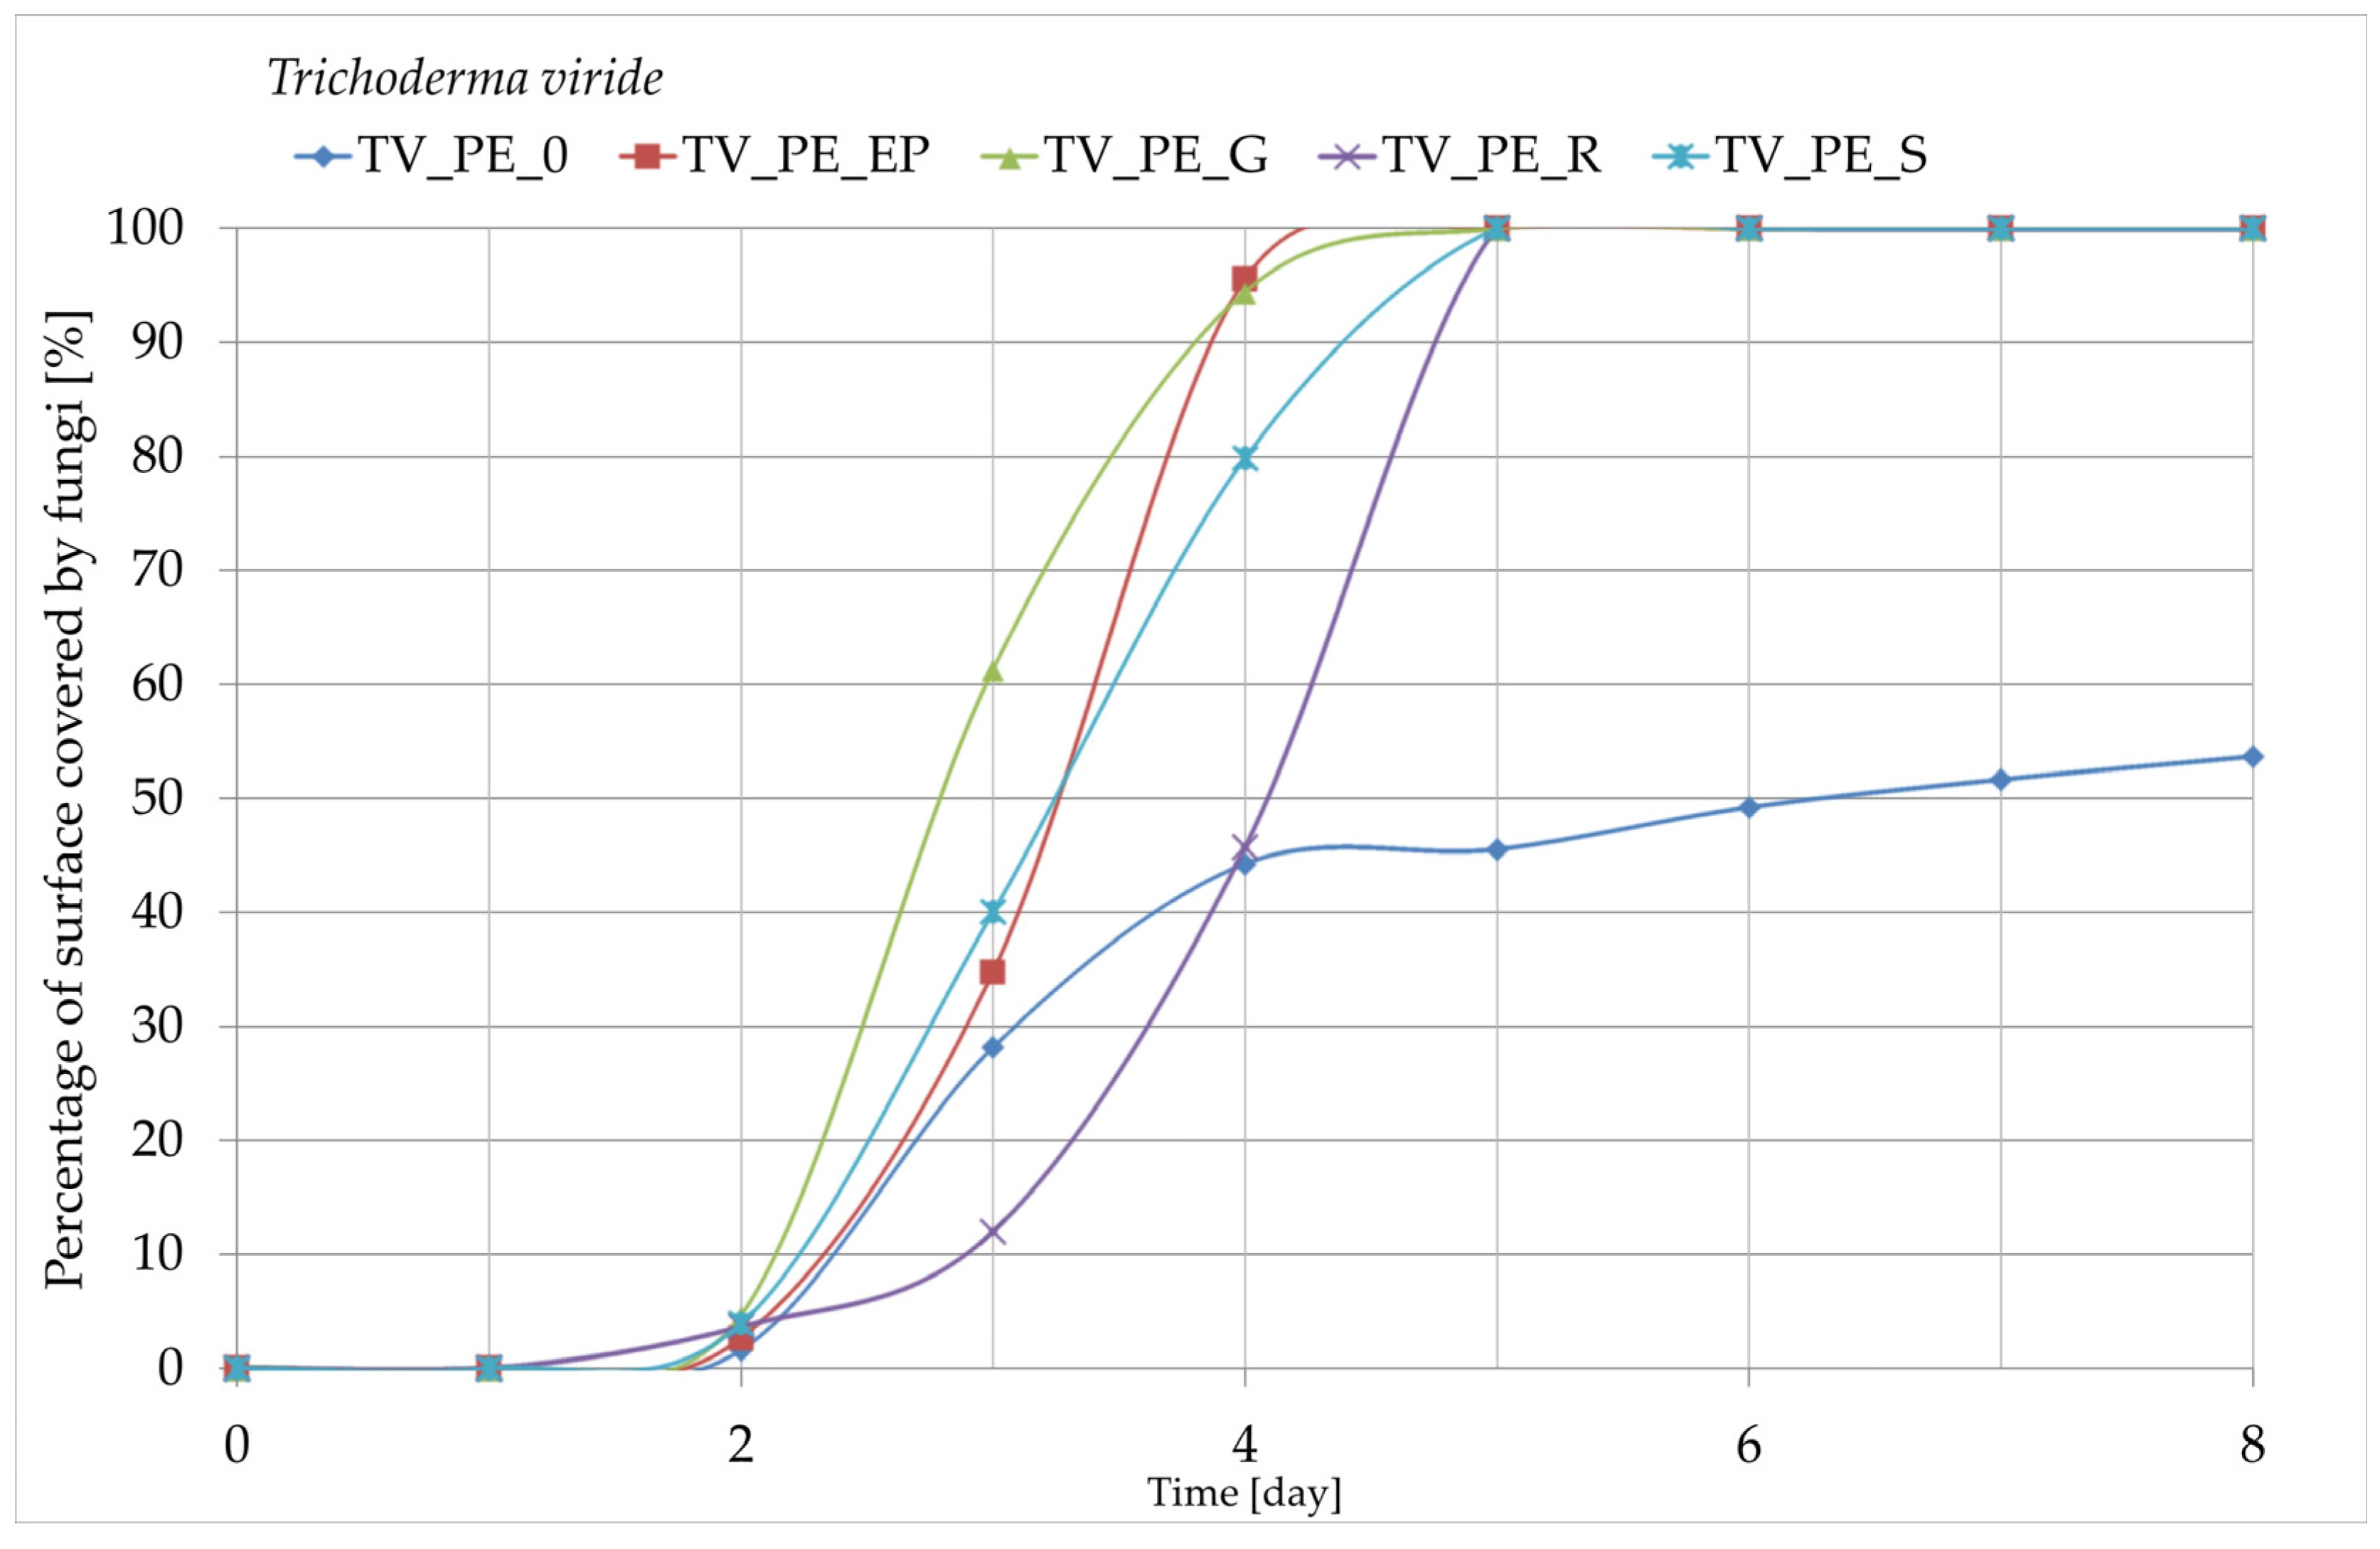
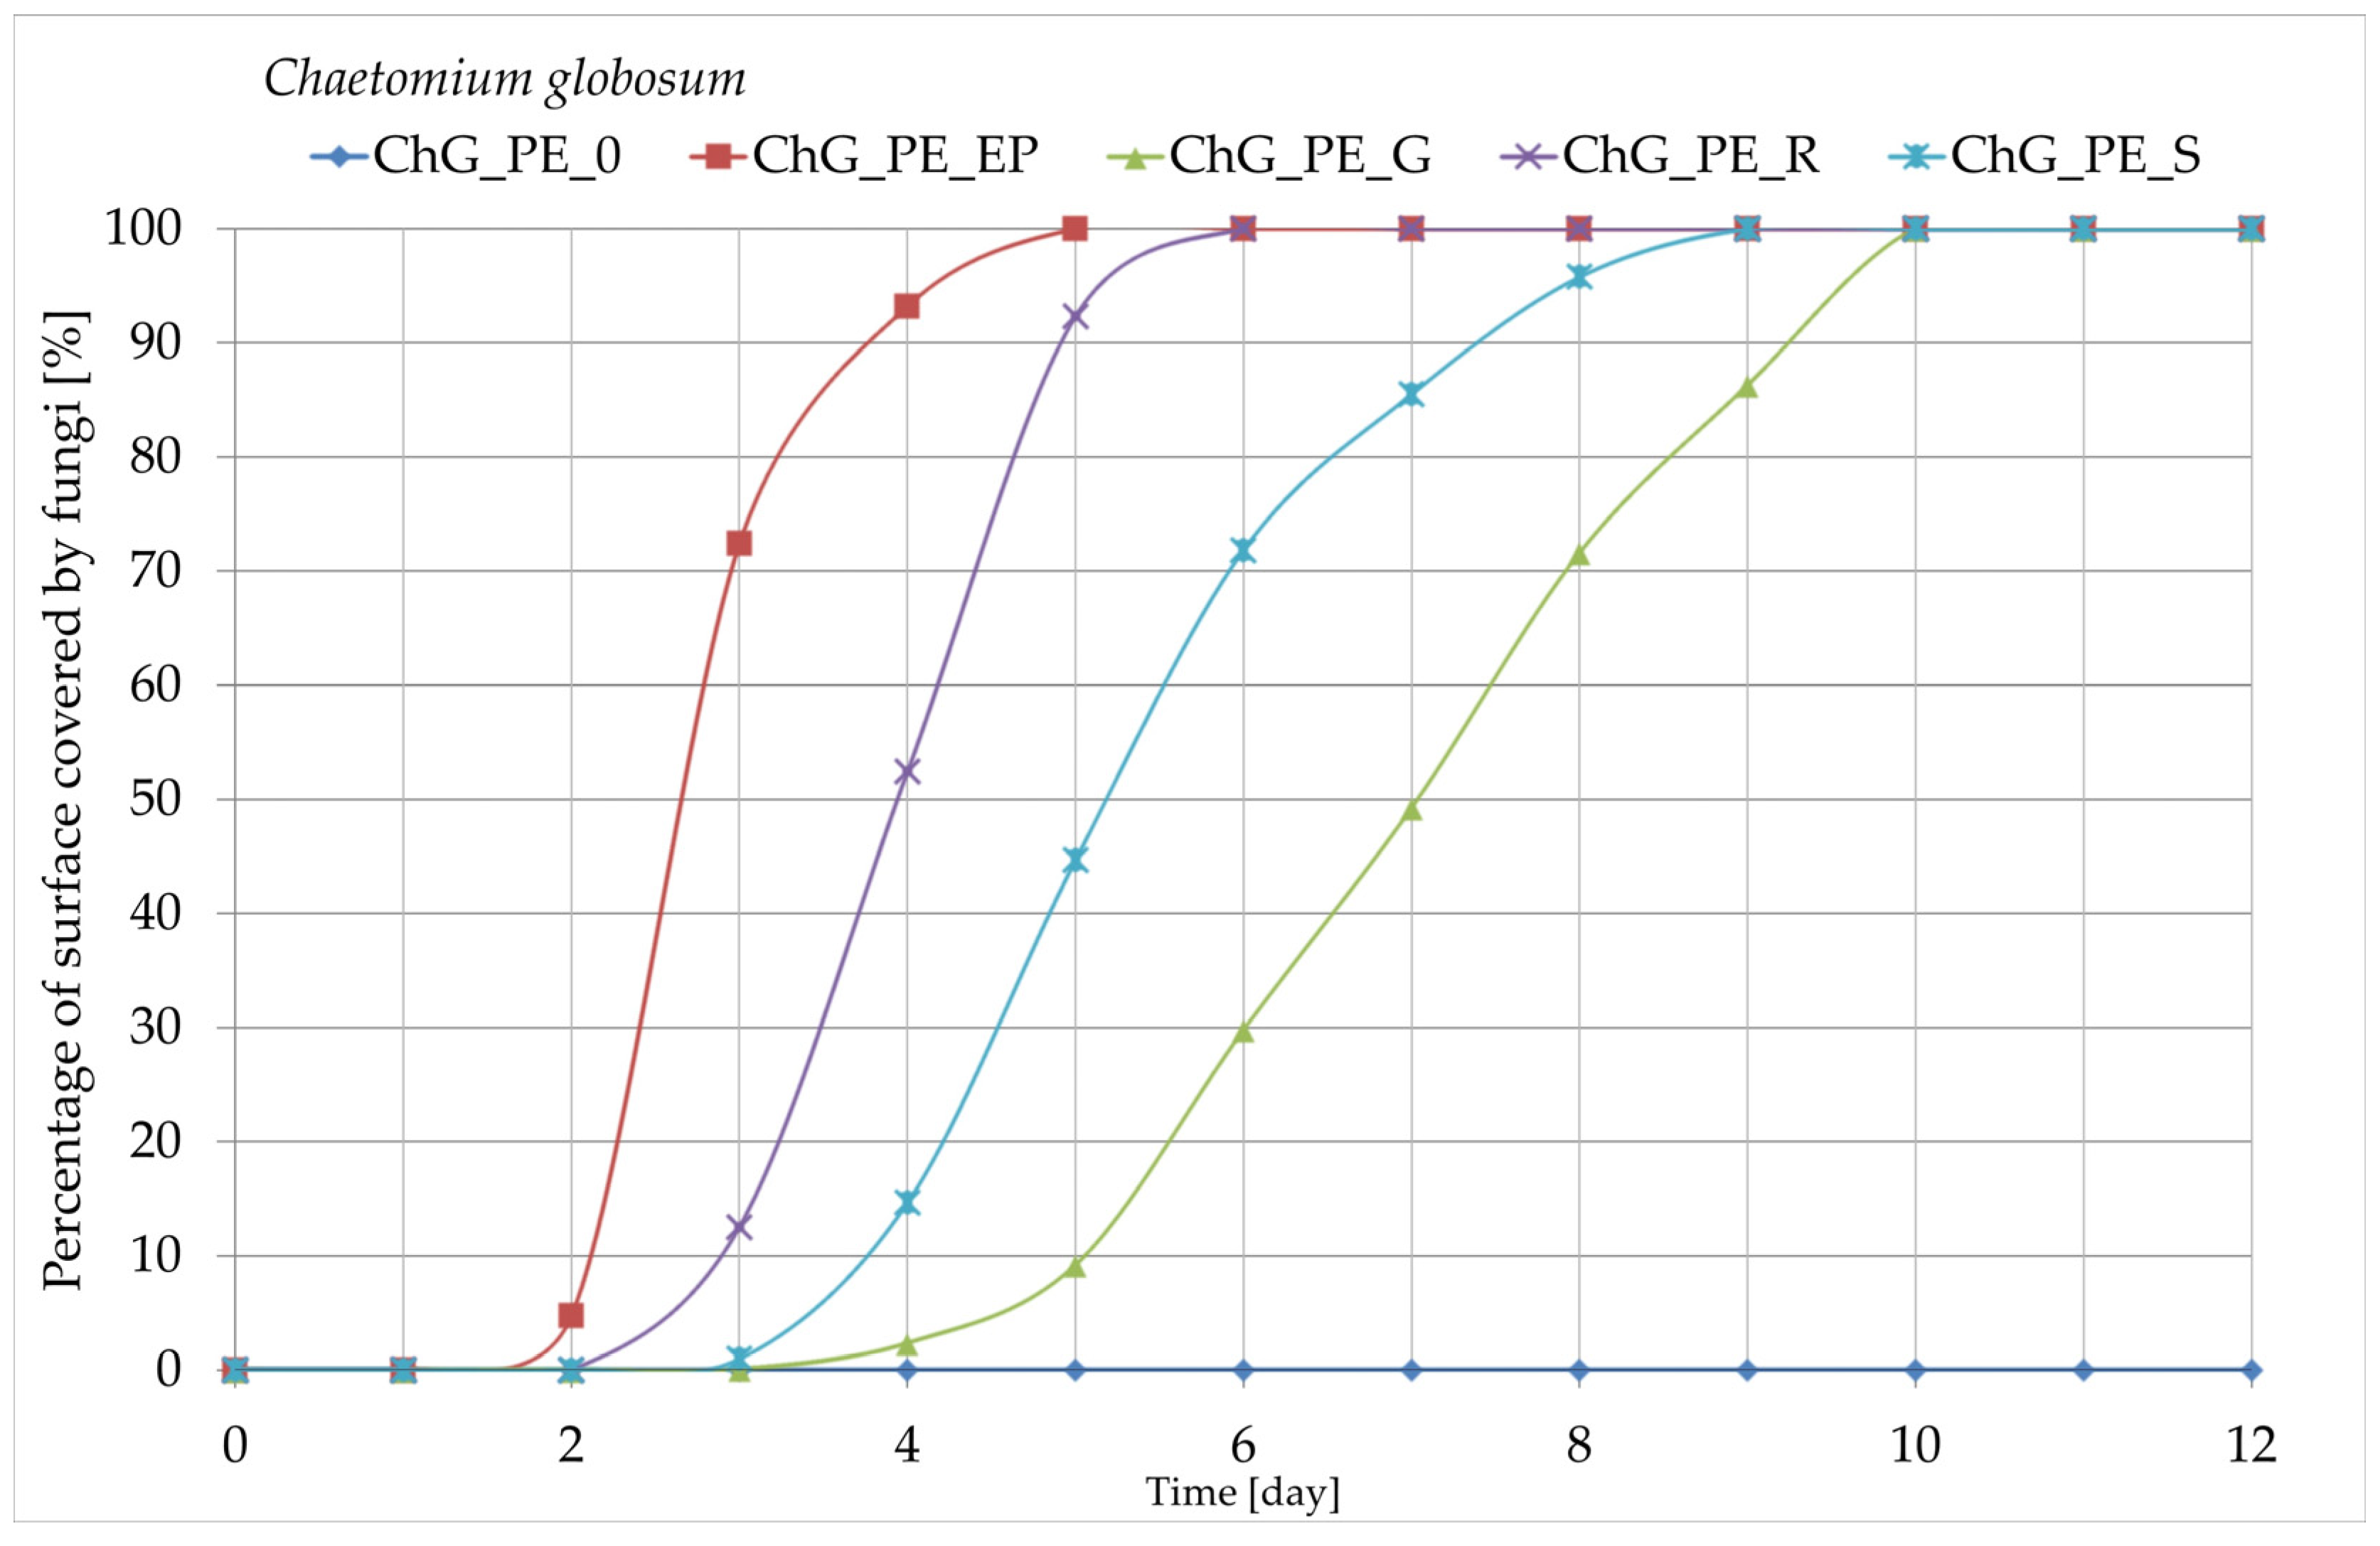
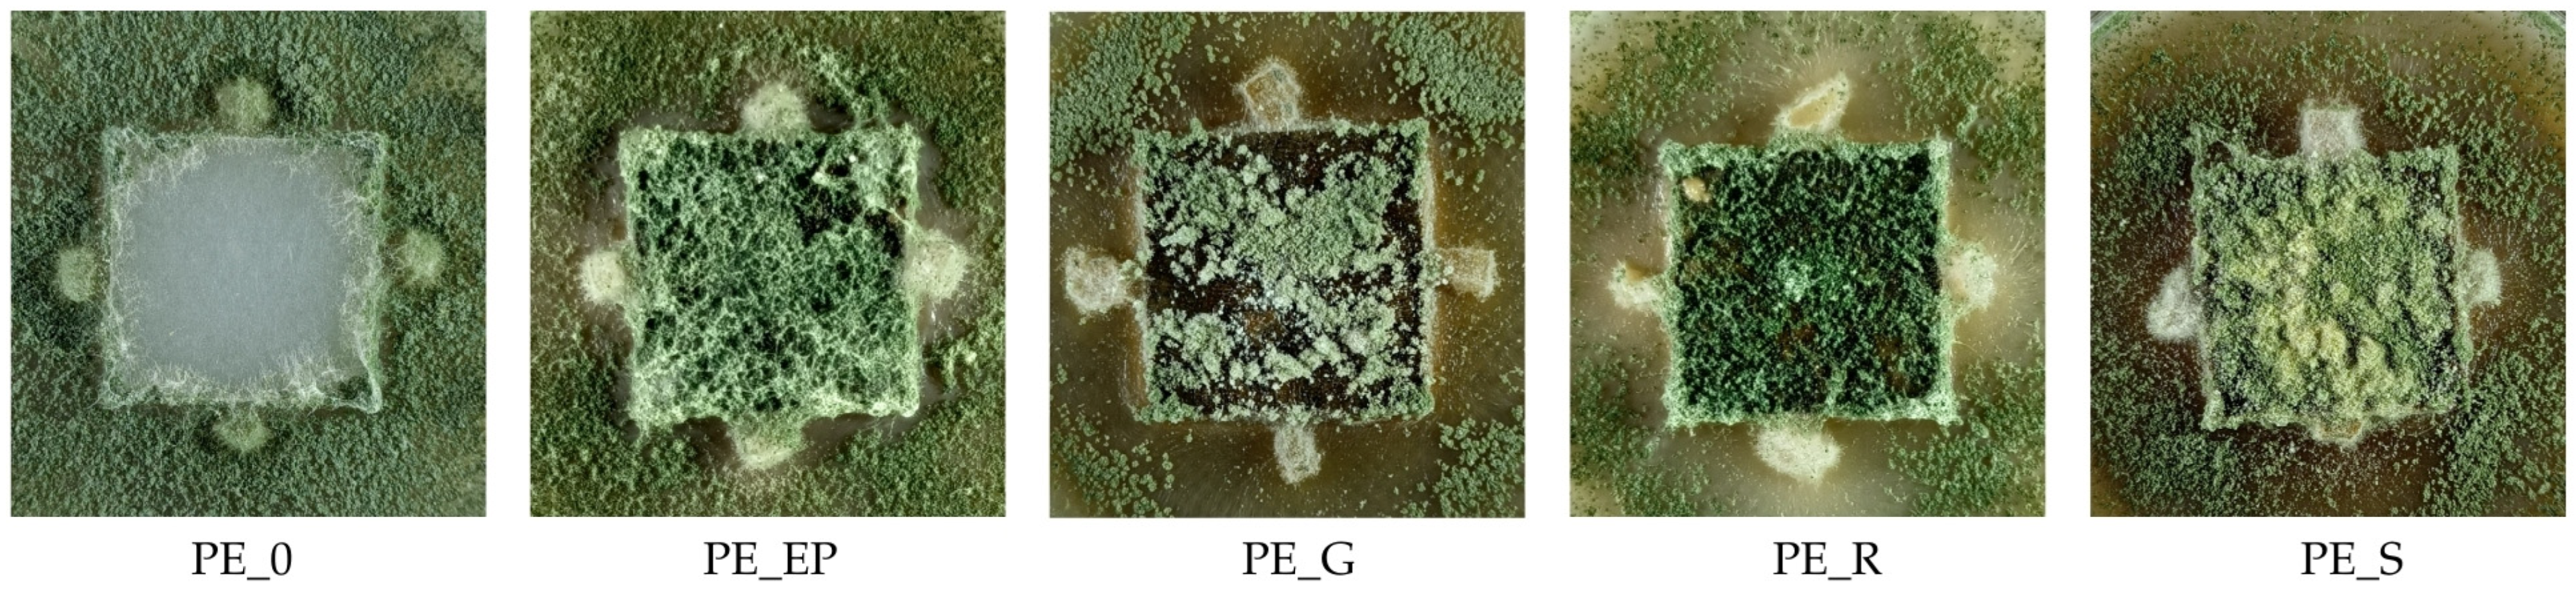
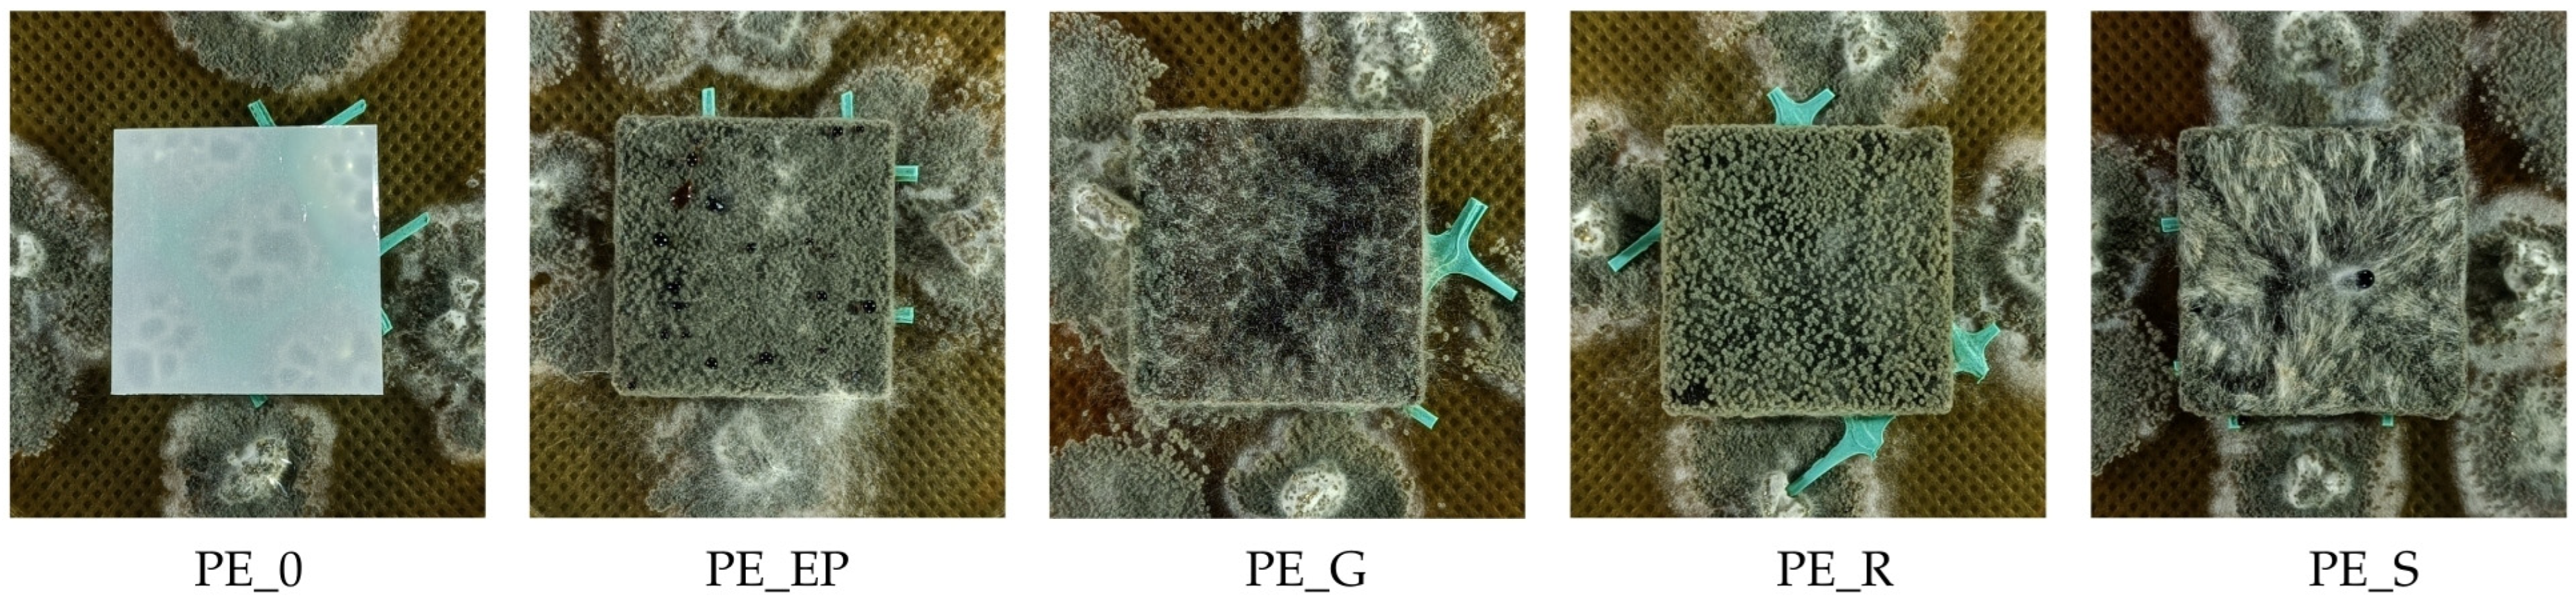
2.2.8. Growth of Fungi

Square shaped samples of 30 mm side dimension were cut from manufactured composites and control samples and subsequently sterilized under UV light (Bionovo, Legnica, Poland) for 30 min. These sterile samples were placed on a maltose-agar medium containing 2.5% maltose extract (Linegal Chemicals sp. z o.o., Blizne Łaszczyńskiego, Poland) and 2.5% agar (Polaura, Morąg, Poland). Plastic sterile pads were used to prevent direct contact between the biocomposites and the moist medium. The fungal inoculum, consisting of Chaetomium globosum Kunze, strain A-141 (ATCC 6205), and Trichoderma viride Pers., strain A-102, from the Department of Wood Science and Wood Preservation, Warsaw University of Life Sciences (Warsaw, Poland), was placed at four equidistant points around the discs, approximately 10 mm from the edge of each sample. Cultures were incubated for 14 days in a Thermolyne Type 42,000 model incubator (ThermoFisher Scientific, Waltham, MA, USA) at 26 ± 2 °C and 63 ± 2% relative humidity. High-resolution images were captured at 24-hour intervals using a laboratory photo-taking station. The evaluation of fungal coverage on the sample surfaces followed the methodology described in previous publications. Using ImageJ image analysis software (Fiji v1.52i, Rasband WS. ImageJ. U. S. National Institutes of Health; Bethesda, MD, USA), the percentage of fungus coverage on the sample surfaces was calculated relative to the total surface area. The surface fouling percentage was assessed with a precision of 5%. Each experimental variant was tested in triplicate.

2.3. Test Standards

The statistical analysis of the results was performed using Statistica version 13 (TIBCO Software Inc., CA, USA). Because of non-normally distributed data and variance heterogeneity, as a non-parametric equivalent of an ANOVA, the Kruskal–Wallis test was used with α = 0.05. To determine the properties of the produced composites, 10 repetitions were performed for each variant unless otherwise specified in the methodology of the specific experiment.

3. Results and Discussion

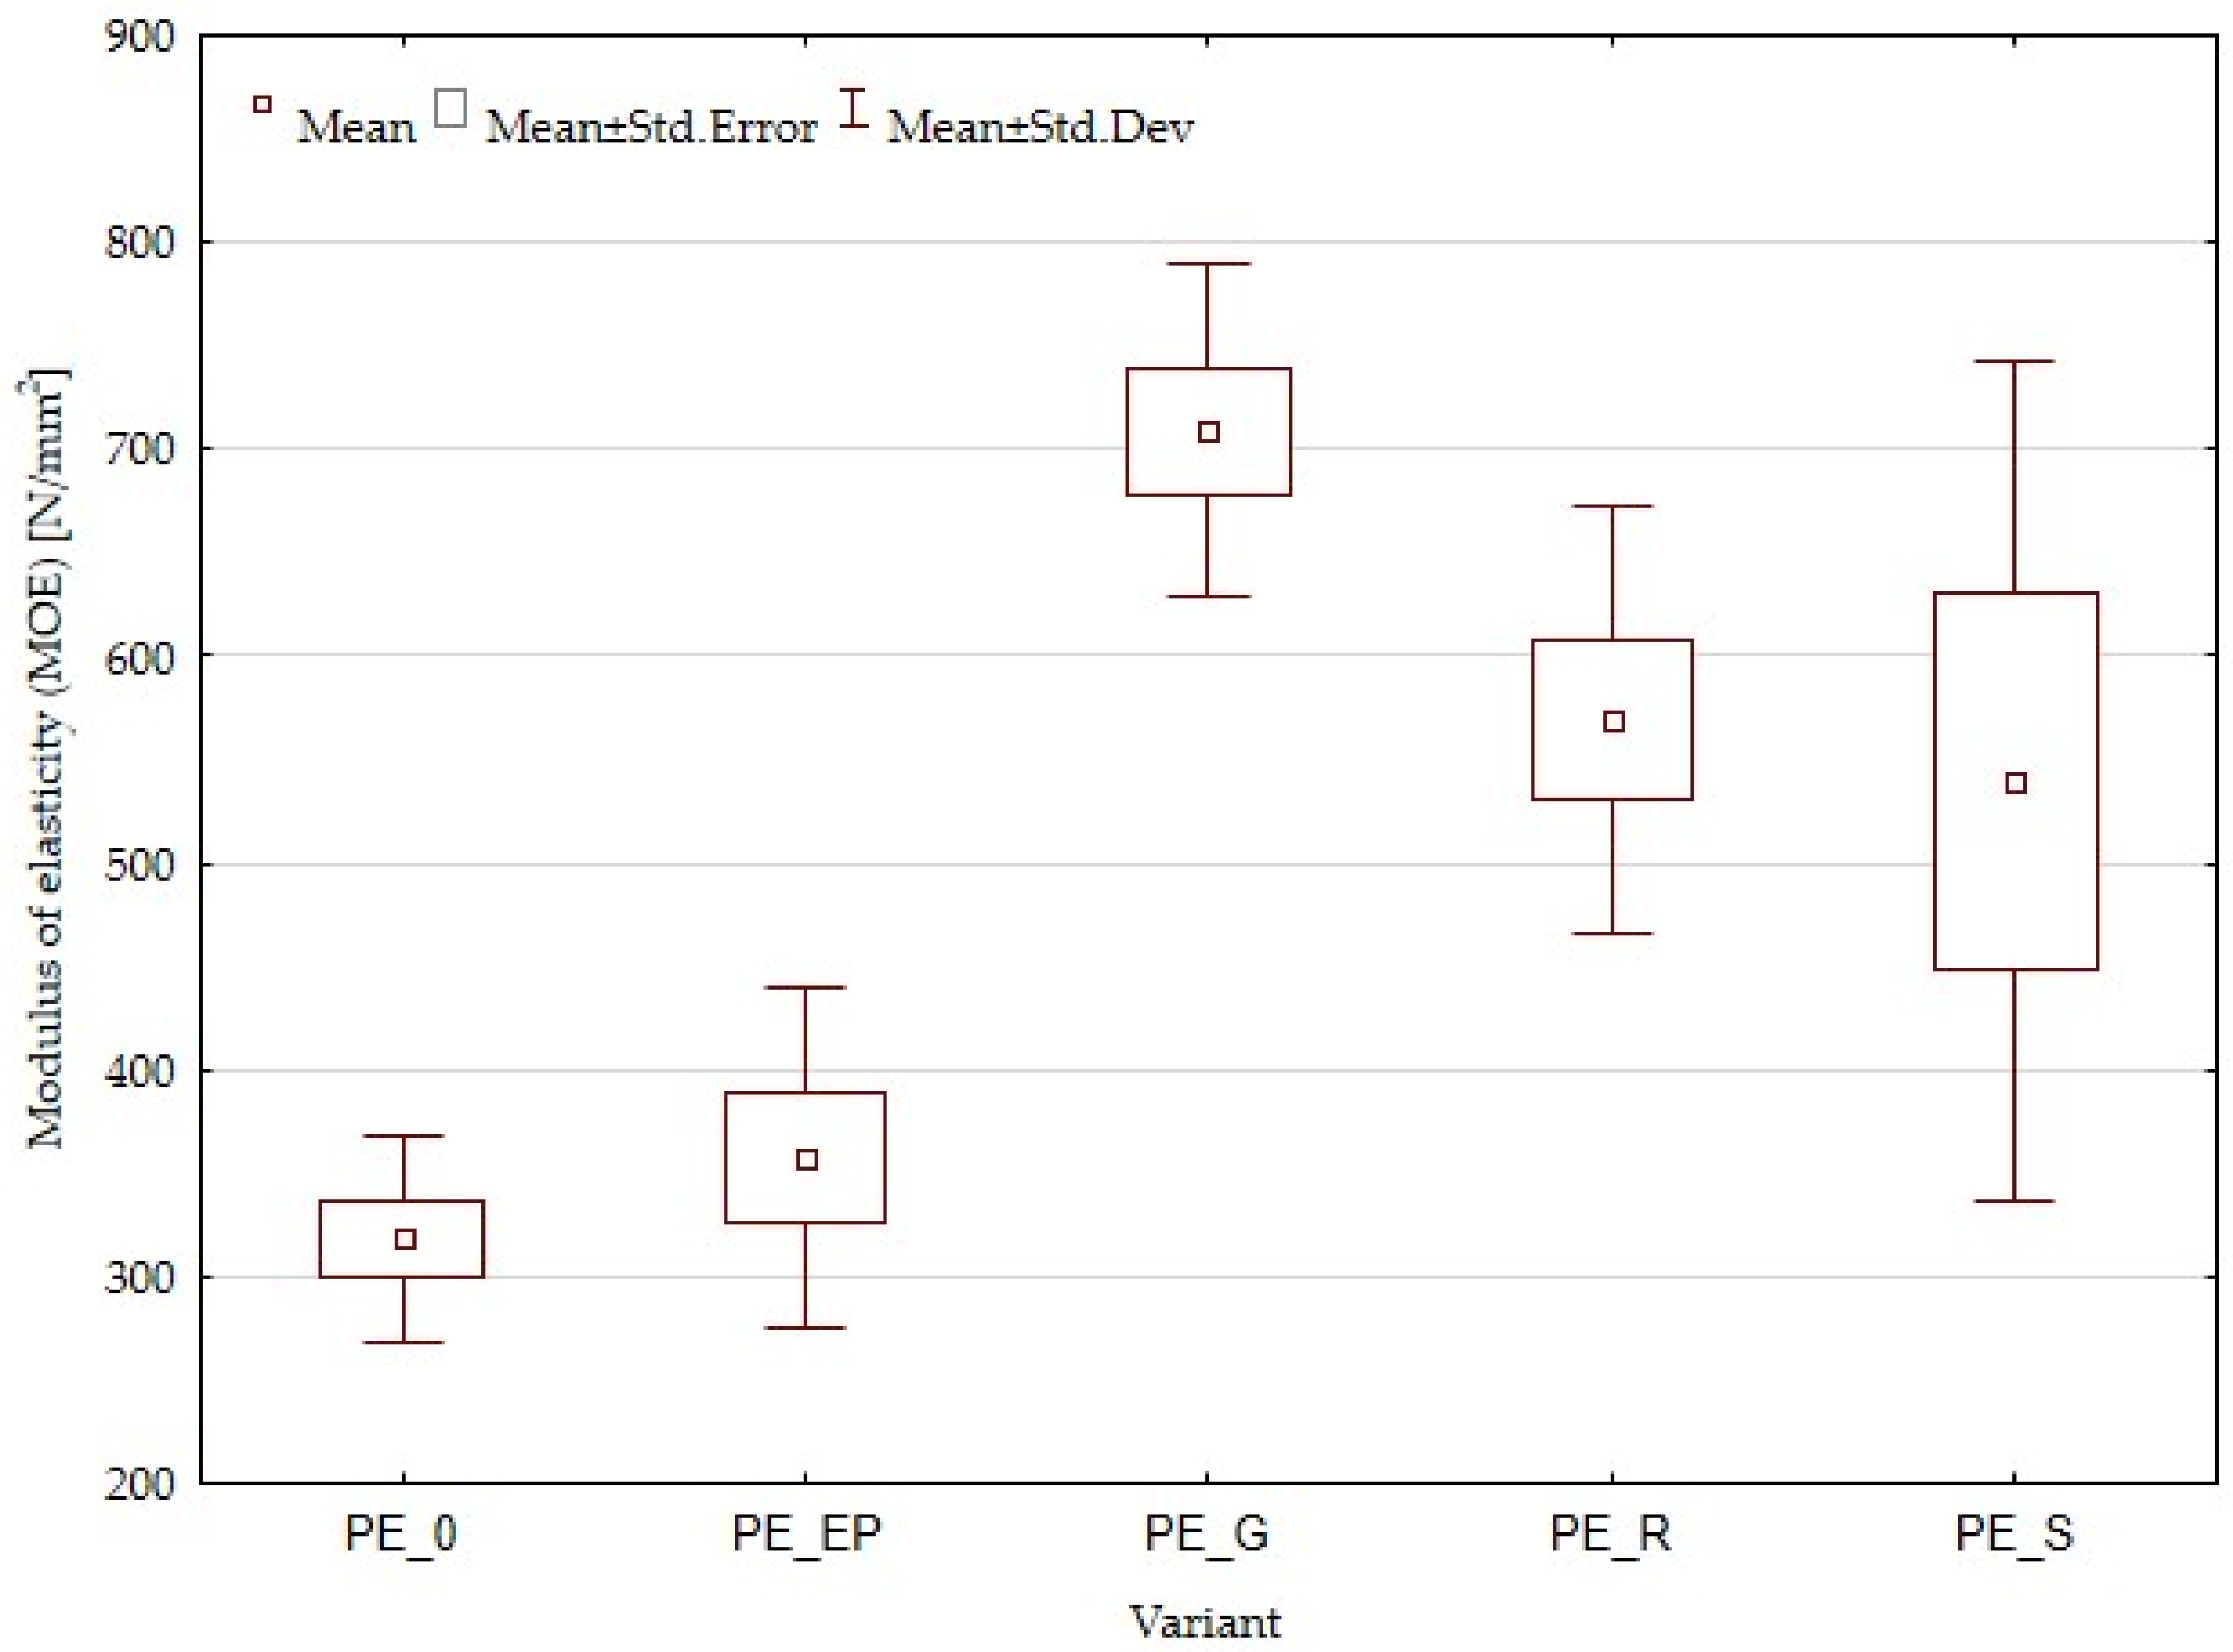
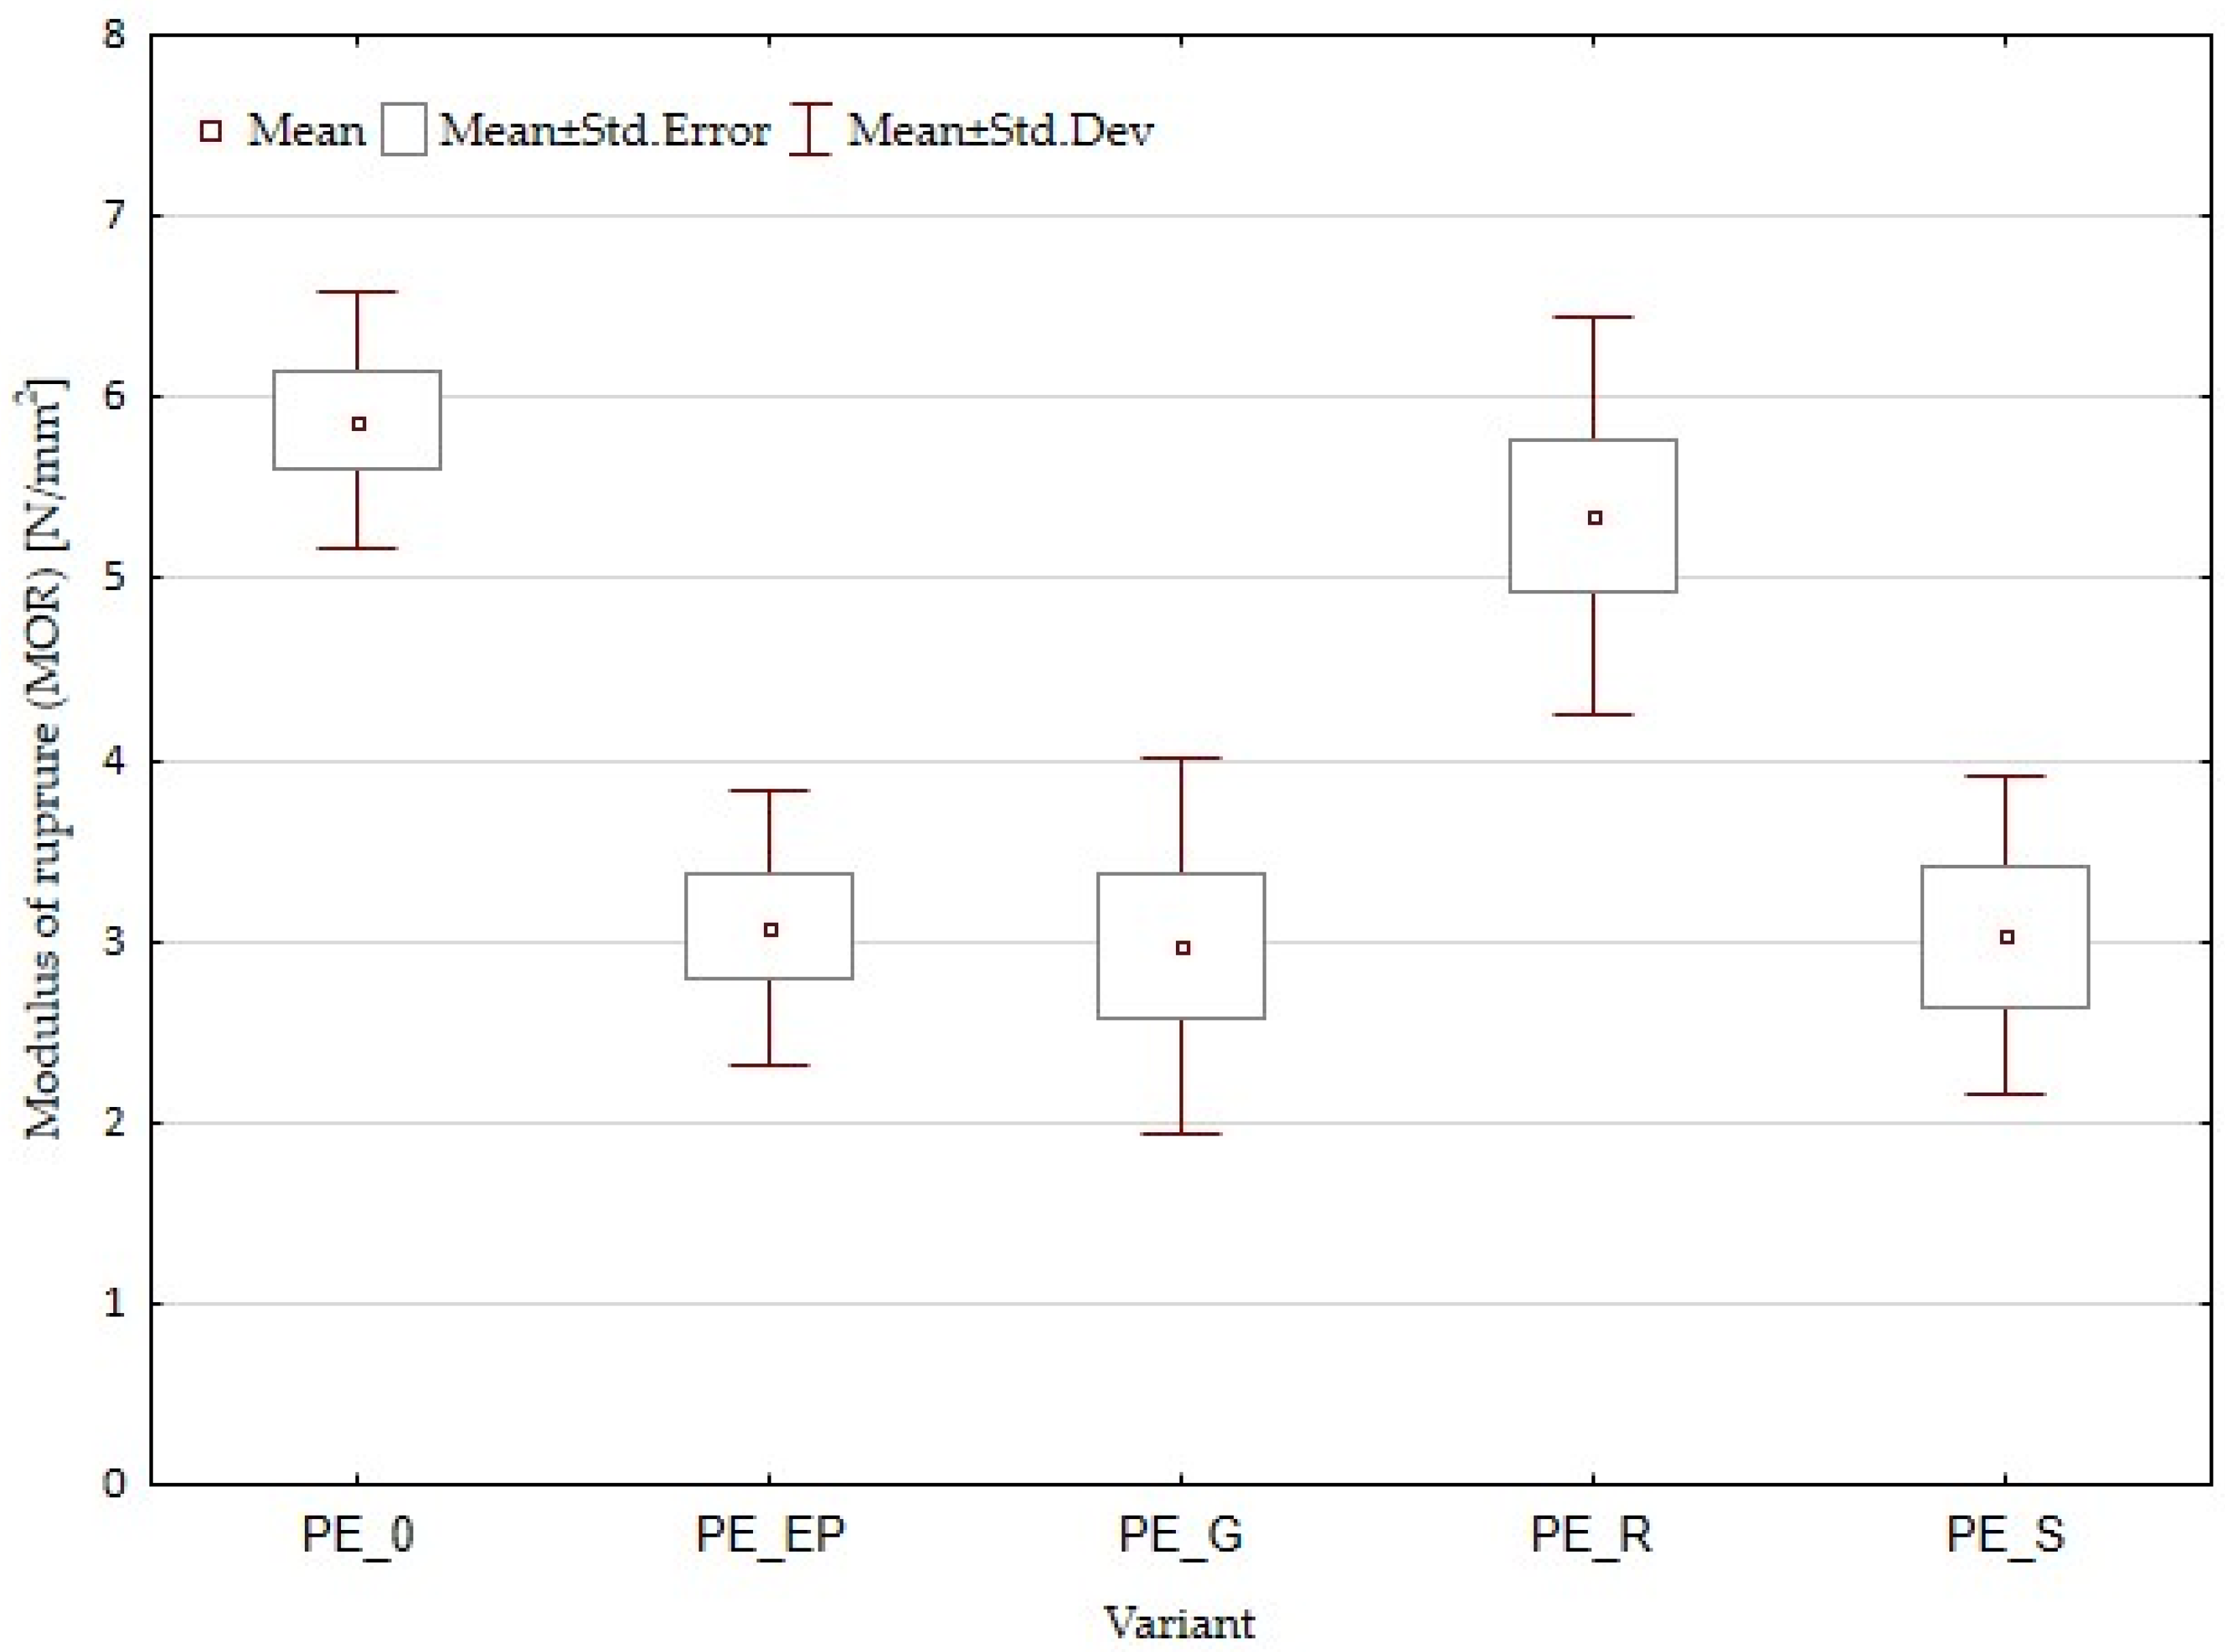
3.1. Density and Mechanical Properties

Despite the density of the composites being assumed in the methodology, the production process does not fully eliminate the outflow of raw material. The density obtained for the samples differs from the assumed value, indicating that the mat formation and pressing process requires improvement. Table 1 presents the results of the density of manufactured composites.
Lignocellulosic fillers, such as wood flour, agricultural residues, or other natural fibers, act as reinforcing agents when added to polymer matrices [62]. These fillers have high stiffness and can distribute the applied stress more efficiently throughout the composite material. This reinforcement mechanism can lead to an increase in MOE. According to previous research, composites MOE increase was observed when using as a filler among others: ramie, hemp and flax fibers [63], rice husk fibers [64], corn stalk powder [65], sunflower fibers [66]. But there are also studies demonstrating a decrease of MOE parameter, e.g., using grape pomace as a filler, which was explained by the lack of suitable interfacial adhesion and the heterogeneity of the lignocellulosic particles and high ash content [67]. Figure 1 presents a box plot of MOE test results for composites and control samples. Similarities can be observed between the PE_0 control sample and PE_EP composite, so the addition of evening primrose particles did not affect the MOE parameter. For PE_G, PE_R, and PE_S variants, the MOE value was higher, and it is worth noting that the PE_S variant exhibited the greatest statistical dispersion.
Figure 2 shows the results of MOR tests for composites and control samples. PE_EP, PE_G, and PE_S composites were characterized by having reduced MOR compared to pure polyethylene. In the case of PE_R composites, the difference is not significant. When comparing MOE and MOR parameters, it is noteworthy that among the tested variants, PE_R emerges as the optimal option. This is because it shows an increase in MOE, indicating enhanced stiffness without a significant drop in strength (MOR). In contrast, the PE_G and PE_S variants exhibit a decrease in the MOR parameter. This suggests that, although these specific fillers improved the stiffness of the composite, they did not achieve sufficient adhesion to maintain the MOR values. Generally, it is accepted that the addition of lignocellulosic particles in the range of 40–60% can lead to increases in both MOE and MOR, depending on factors such as particle size and shape. Larger particles typically have a positive effect on mechanical properties. In our case, however, the particle size was limited by the capabilities of the extruder, and smaller particles were used, which may have affected the mechanical properties of the resulting composites. It is also worth mentioning that no coupling agents were used to enhance the bonding between the polymers and natural fillers, despite being a common practice in lignocellulosic-polymer composite technology.

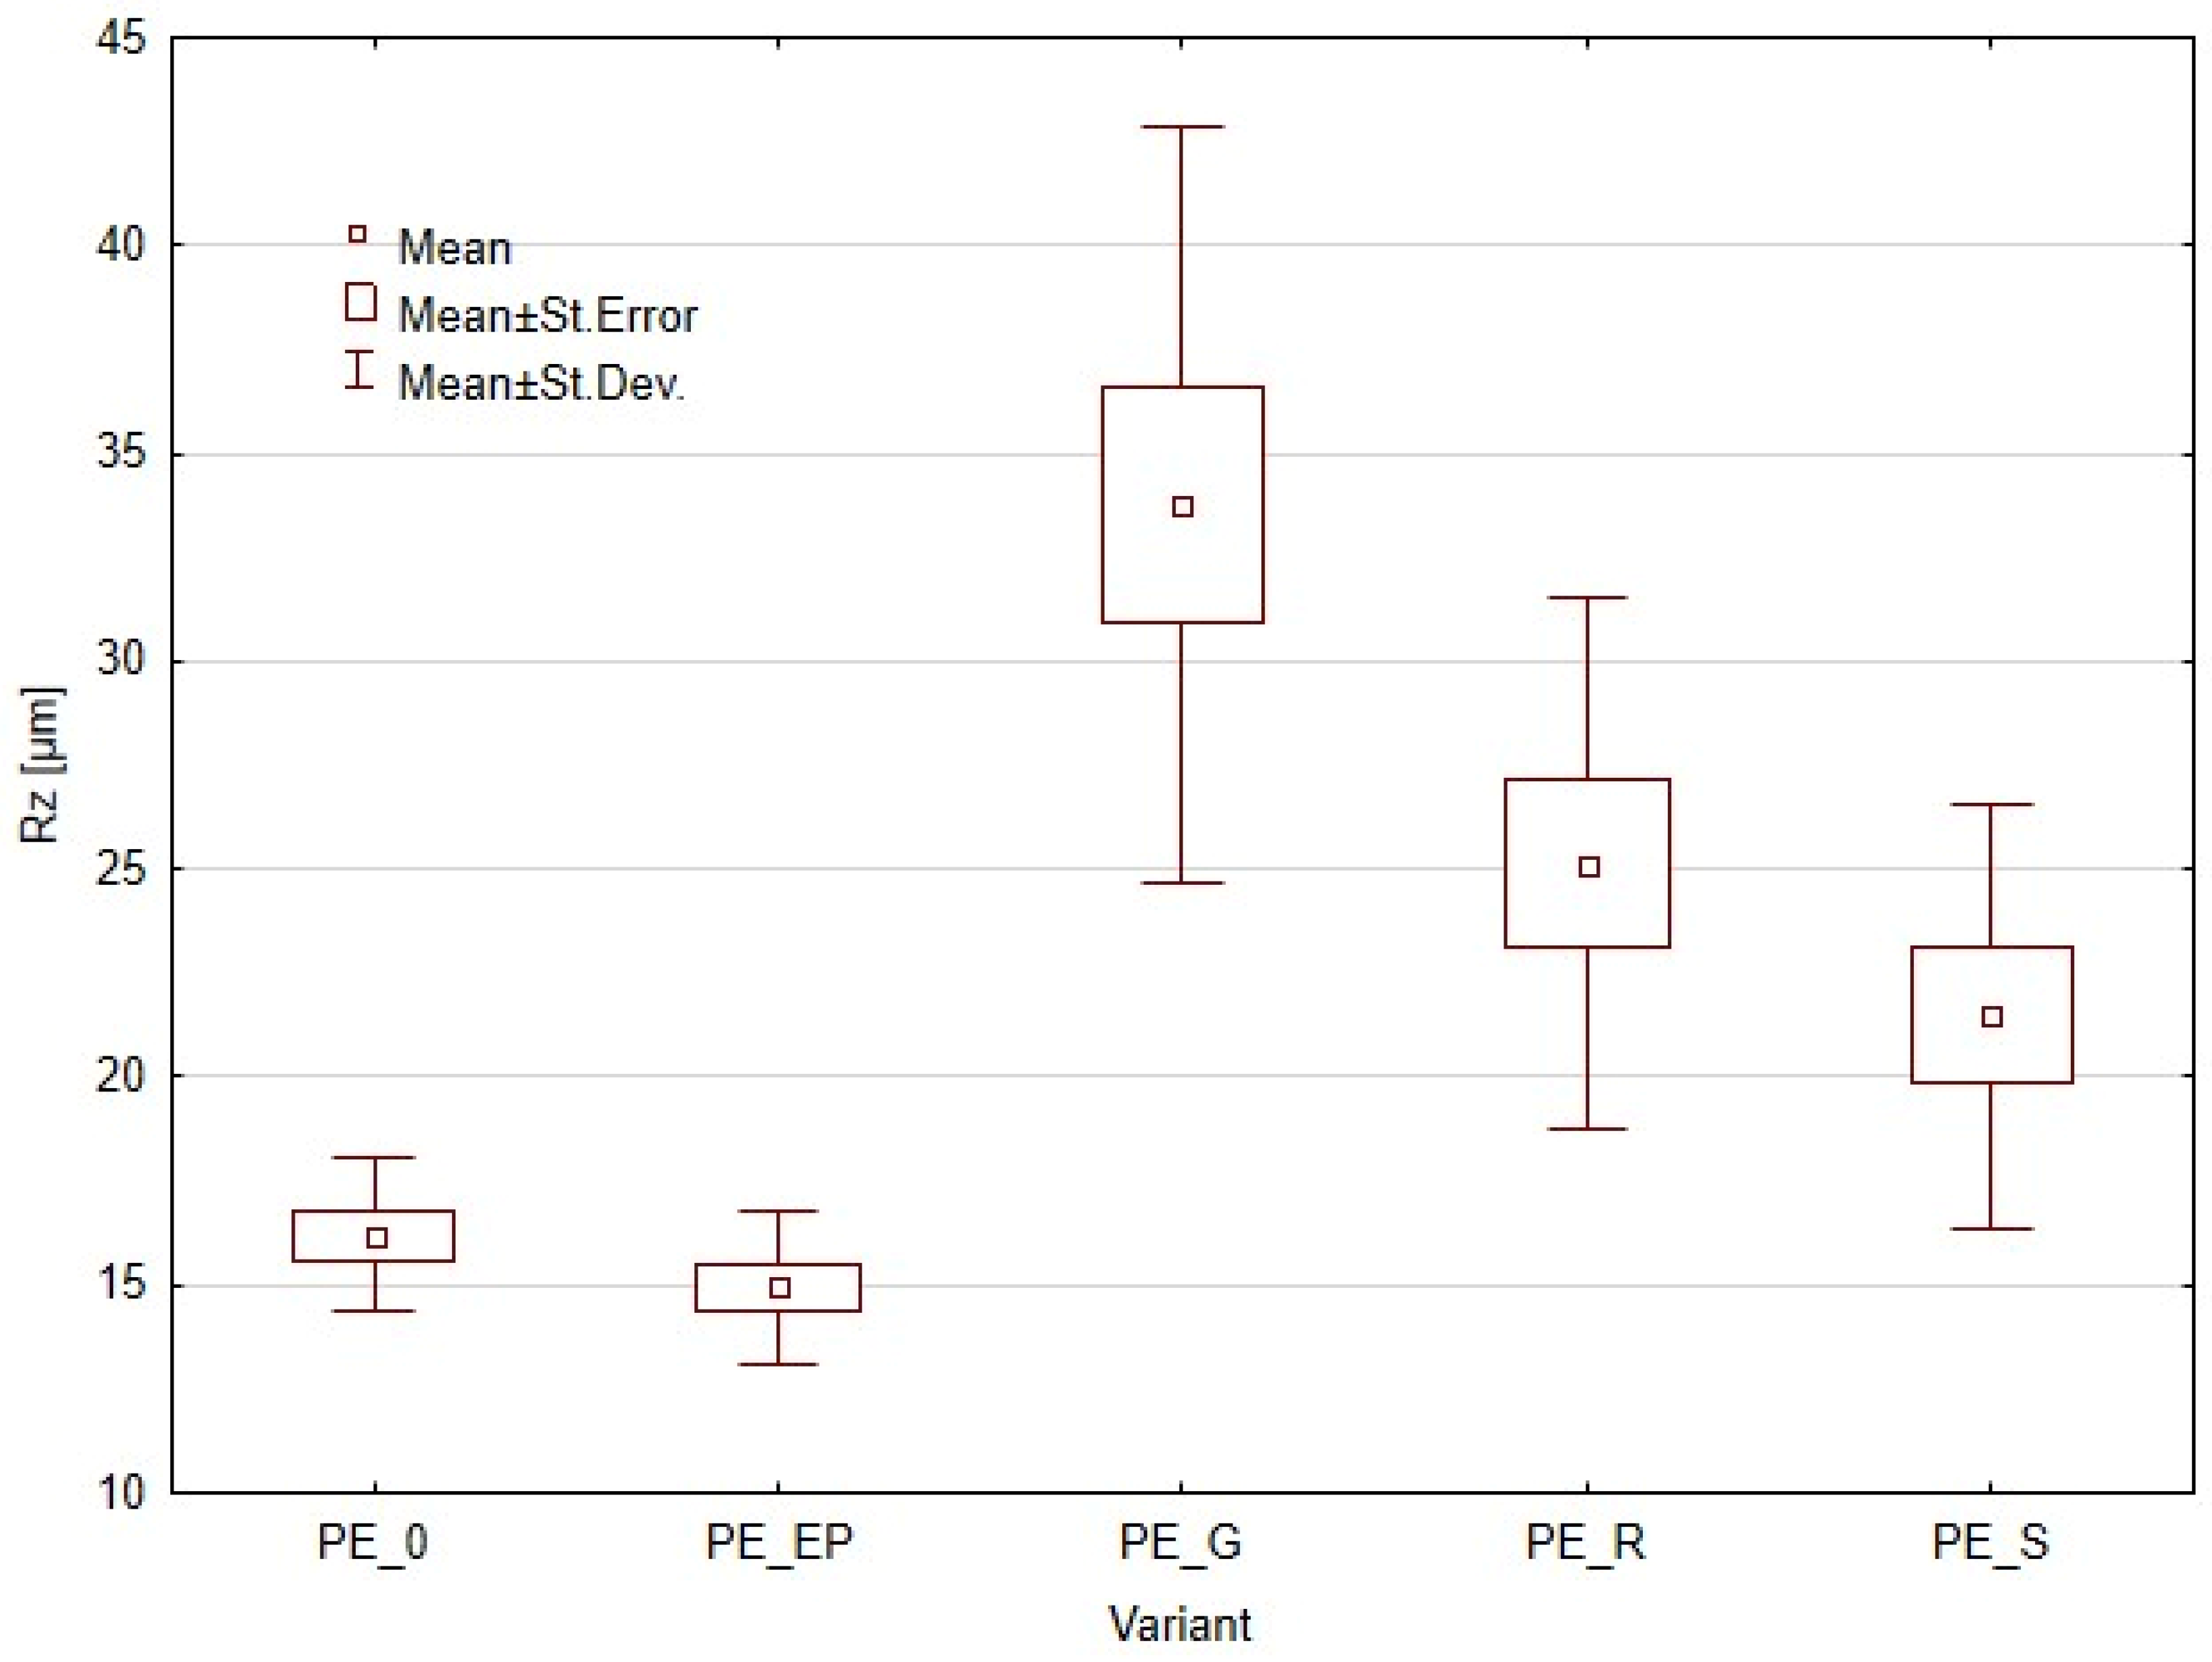
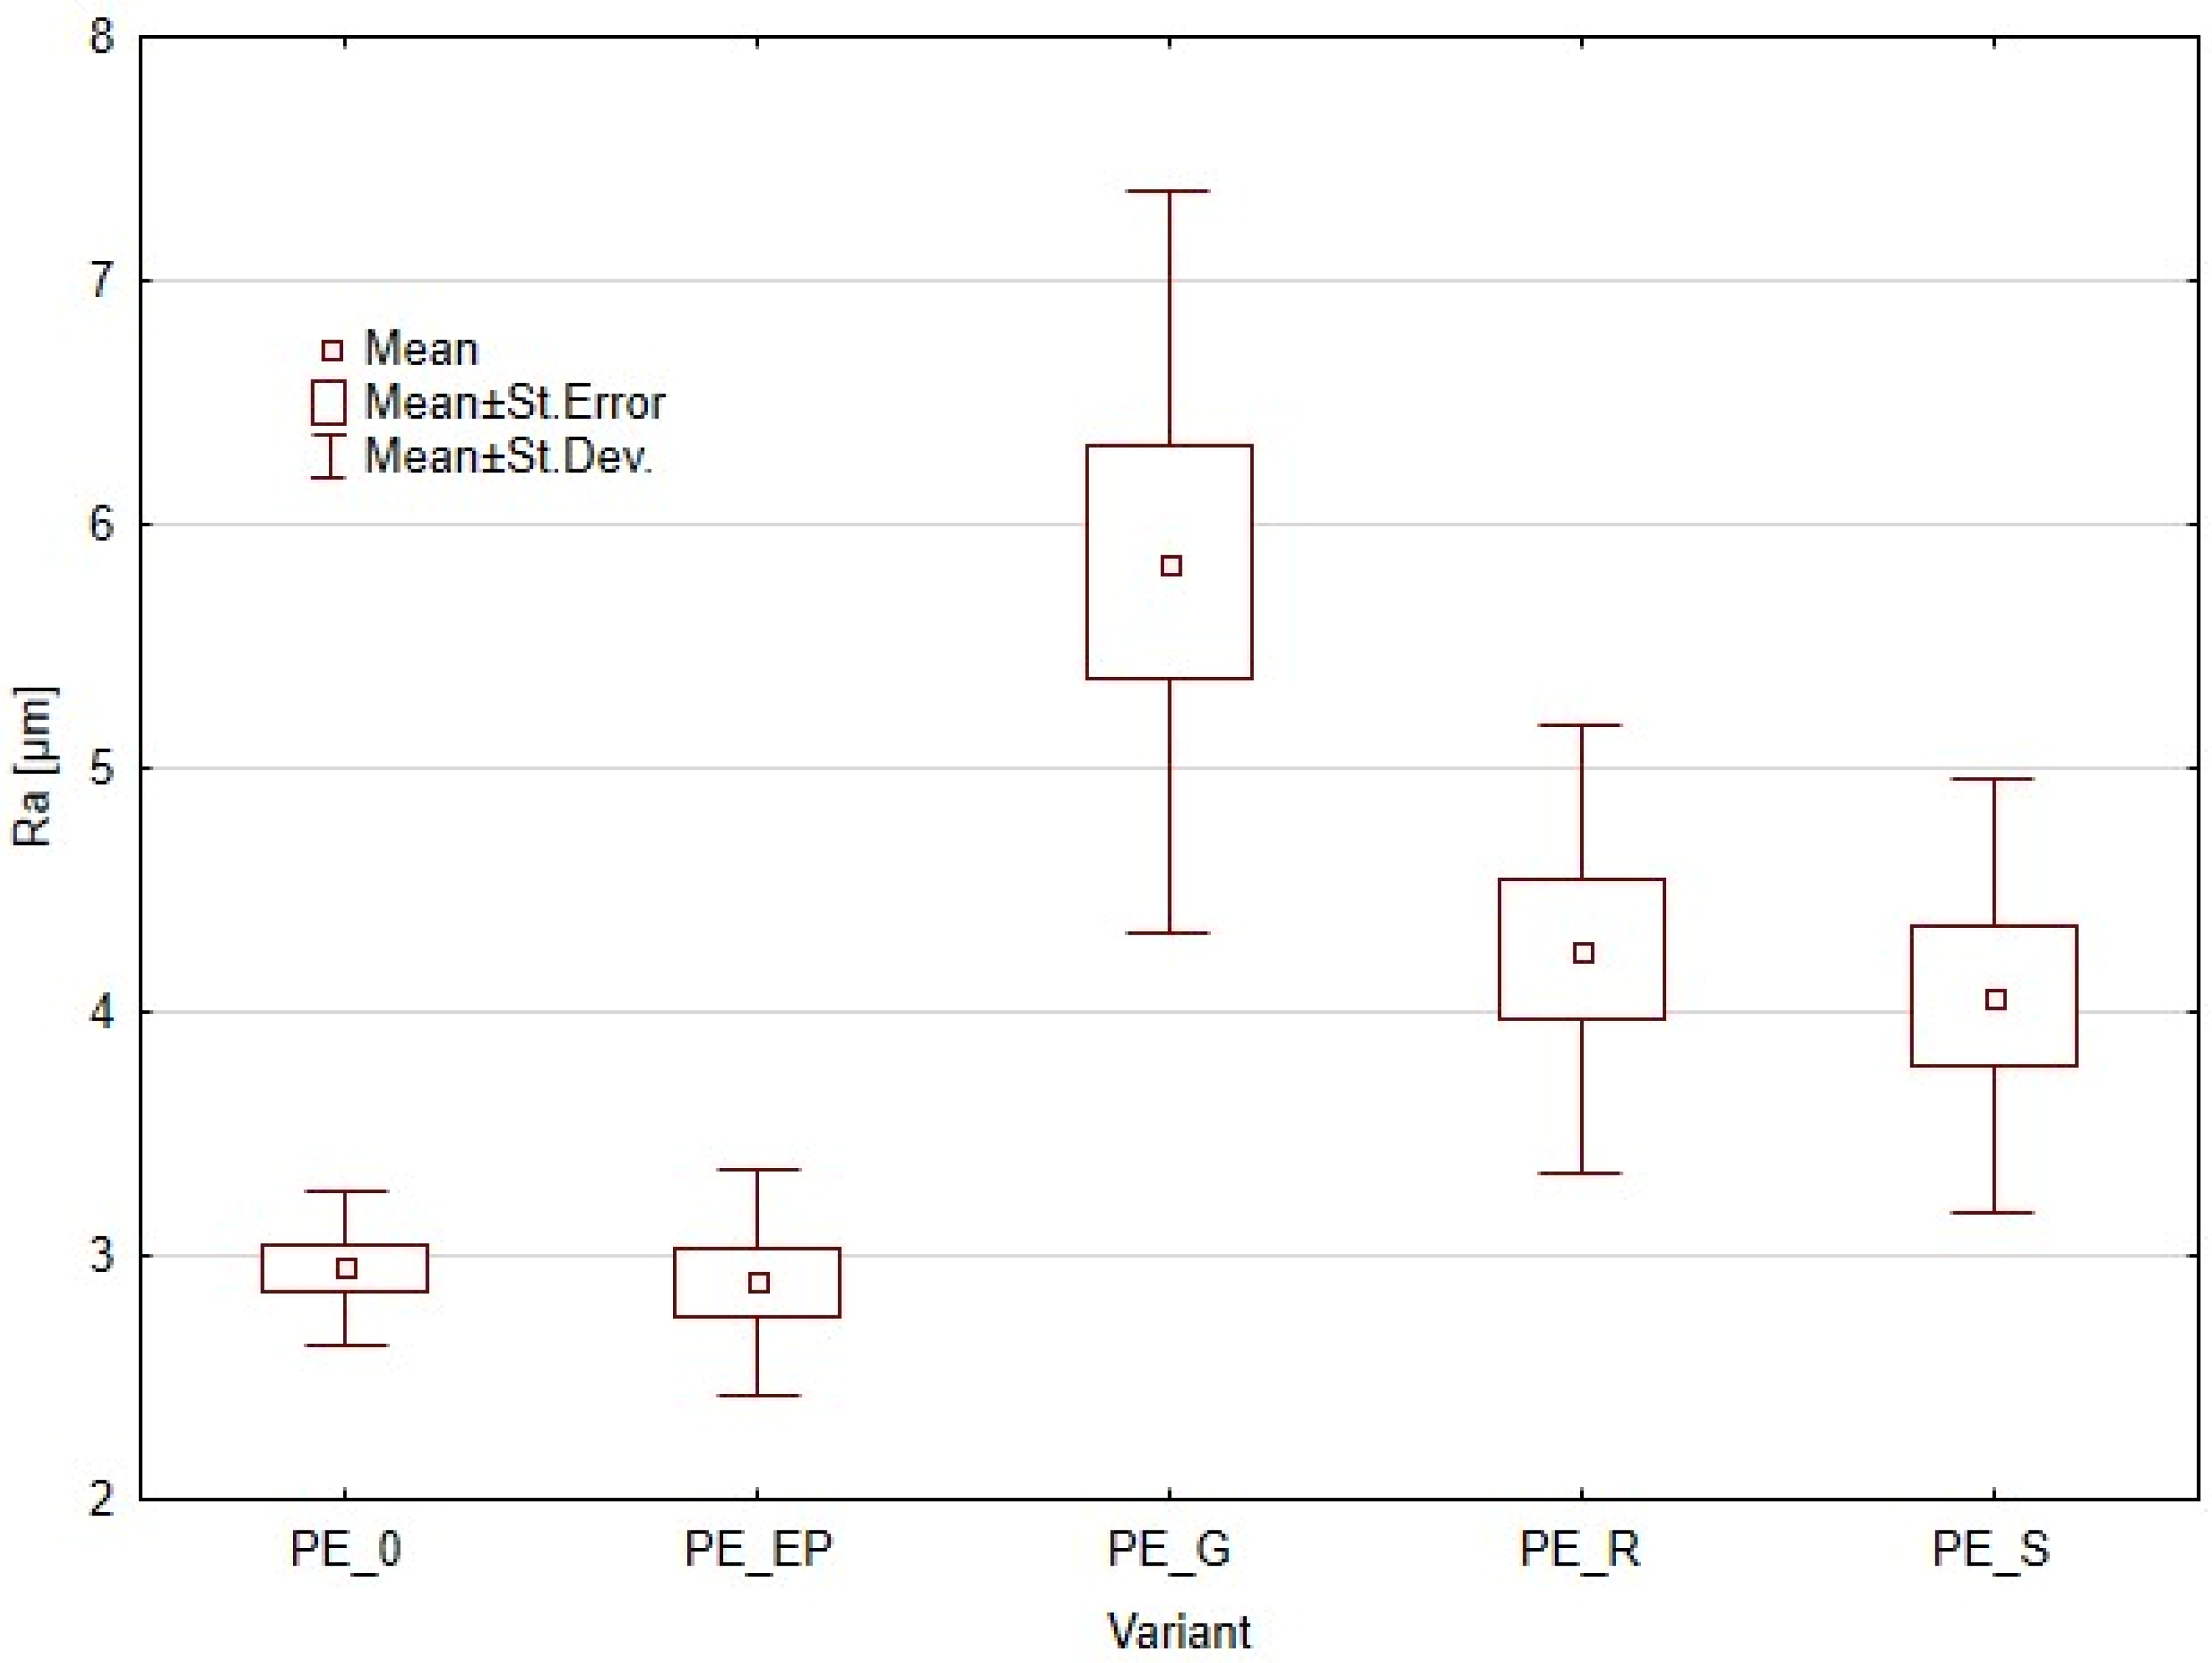
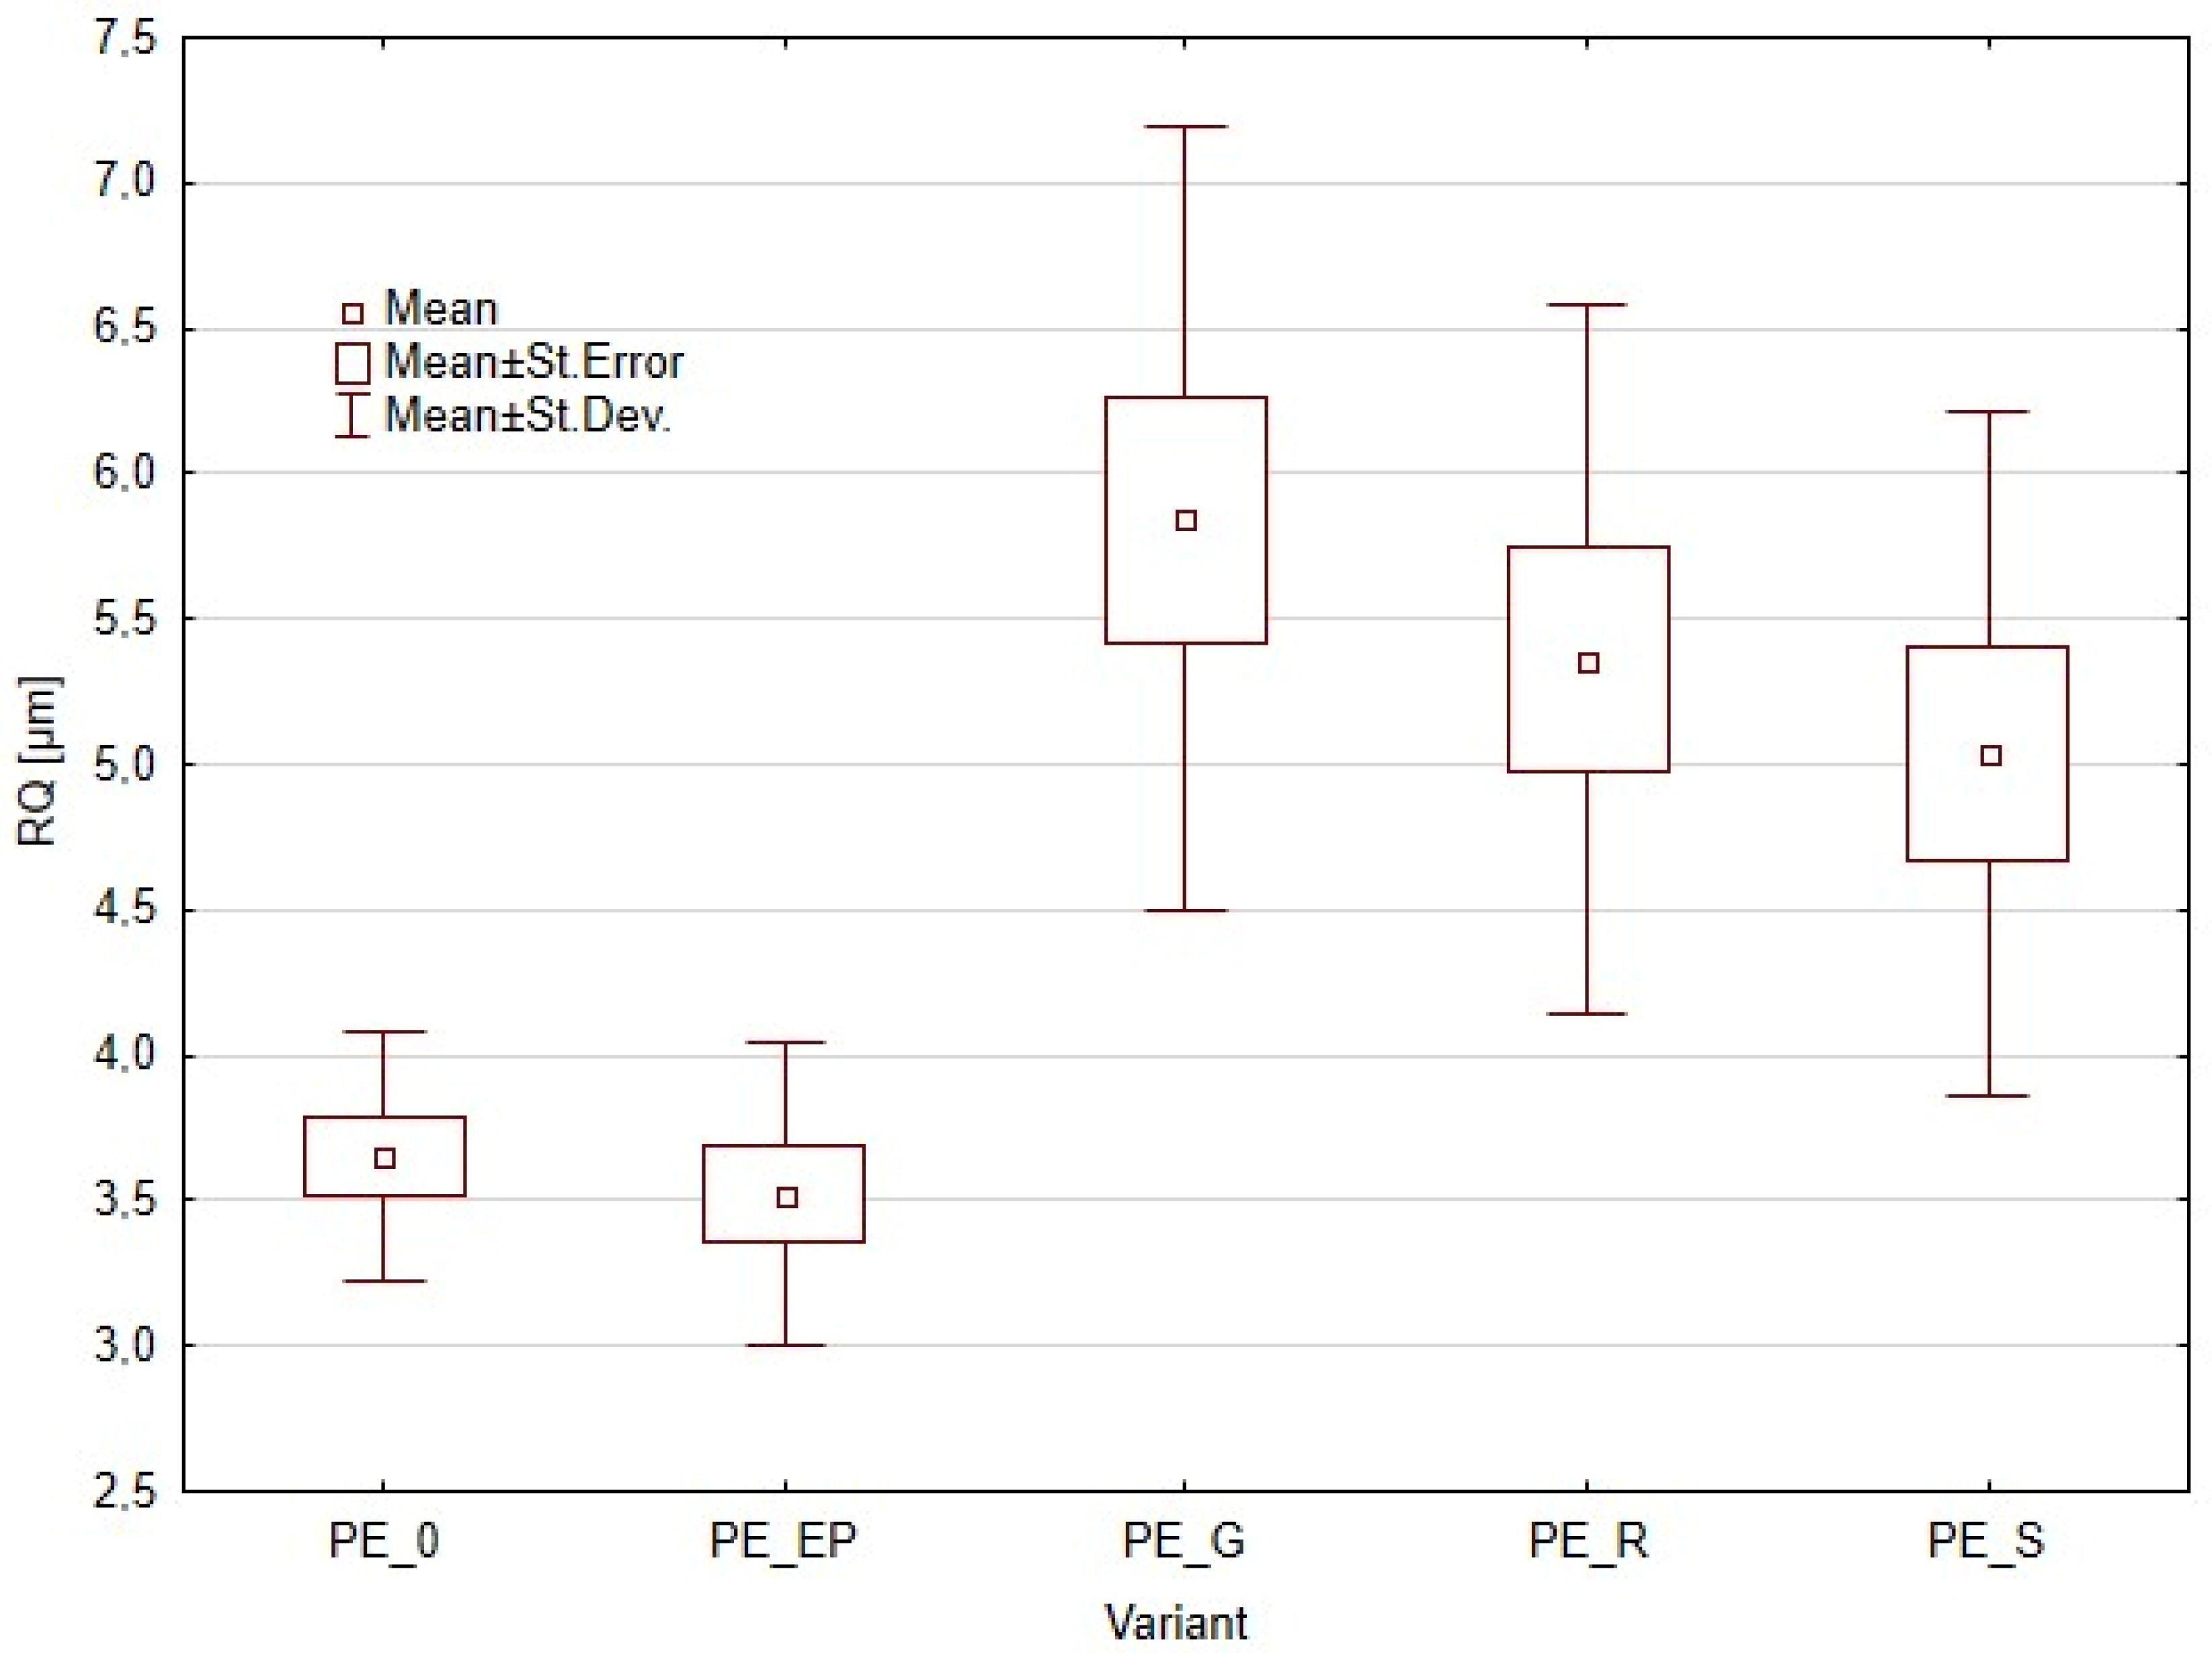
3.2. Surface Roughness
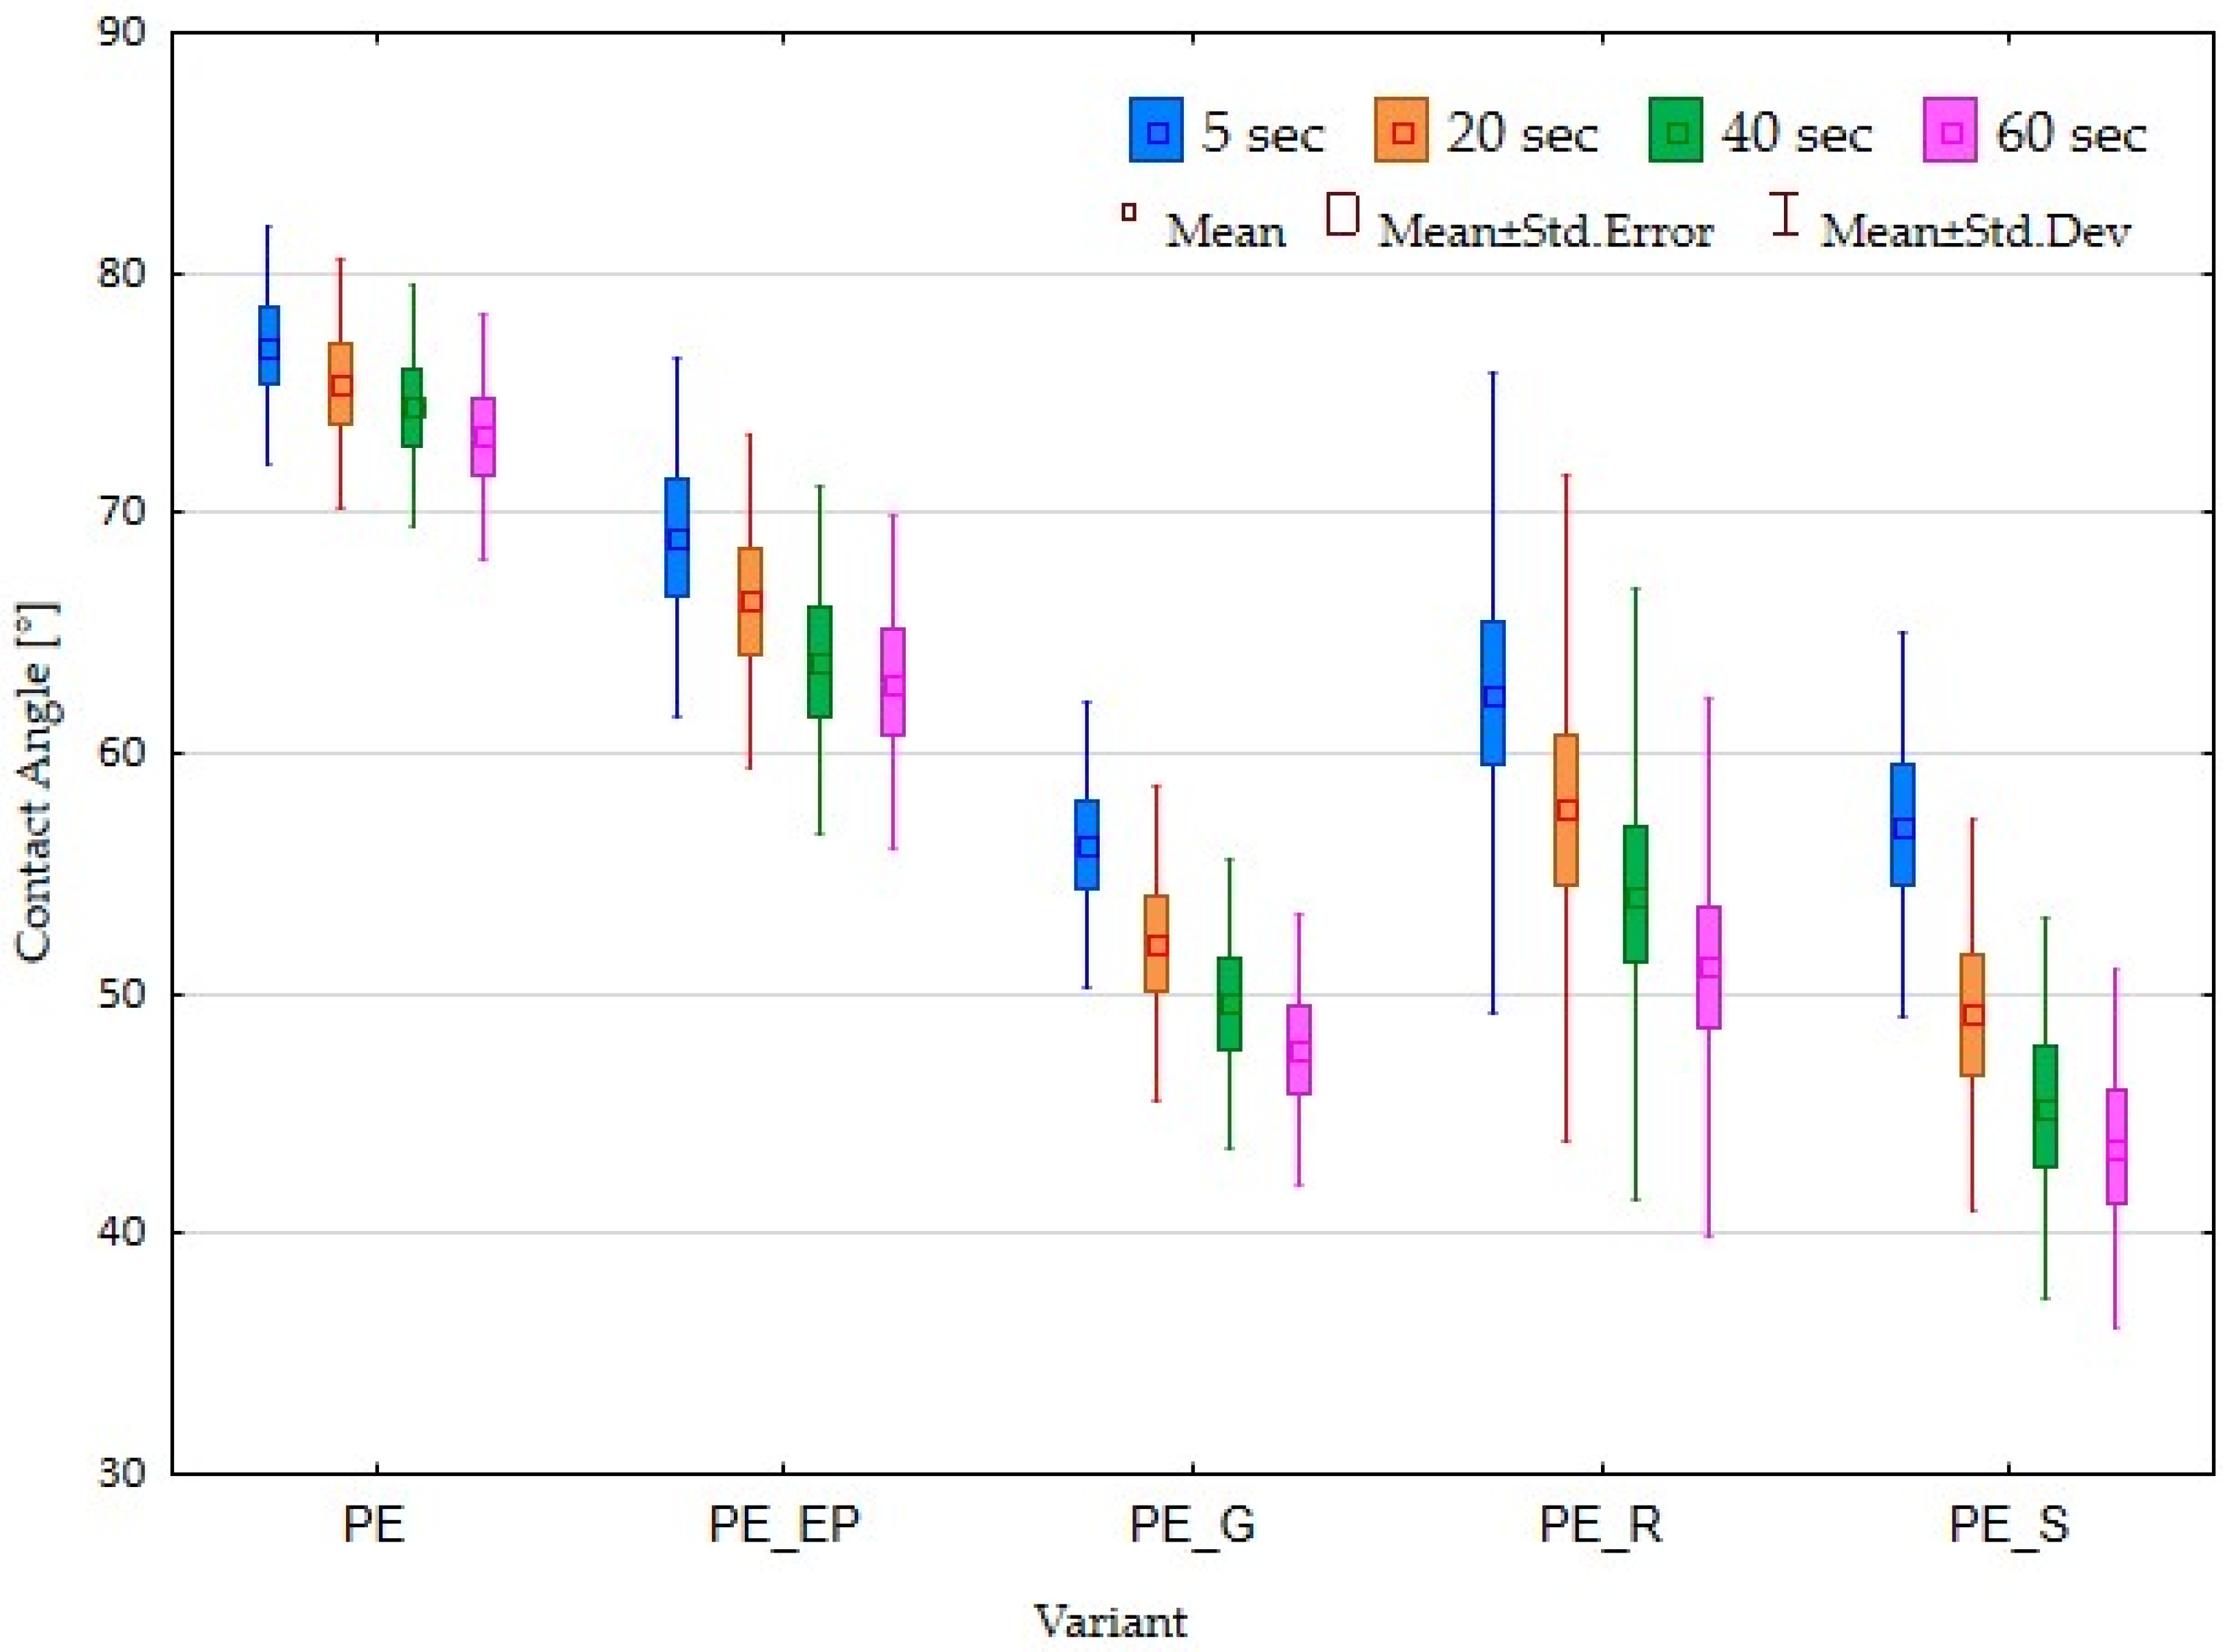
Surface roughness parameters such as Rz, Ra, and Rq provide insights into the texture and quality of a material’s surface. Rz, the average maximum height of the profile, gives a picture of extreme surface irregularities.
Ra measures the average deviation of the surface profile from the mean line, offering a general indication of the surface’s smoothness. Rq accounts for the variation in the height of the surface profile, emphasizing peaks and valleys more than Ra. The results of the surface roughness parameters are presented in Figure 3 (Rz parameter), Figure 4 (Ra parameter), and Figure 5 (Rq parameter). The PE_EP composites were similar to the results obtained for pure polyethylene. This variant obtained the highest density, so its structure was more compact than the others. According to Rz and Ra parameters results among the remaining composites, the PE_G composites exhibited the highest roughness, but when comparing Rz, Ra, and Rq parameters for PE_G, PE_R, and PE_S parameters, it can be observed that in the case of Rq, which is more sensitive for peaks and valleys, the difference between those composites is decreasing.

3.3. Contact Angle

The contact angle measurement of the composites was performed to evaluate the wettability of the material’s surface, which is crucial for understanding its adhesive and coating properties. Analysis of the results presented in Figure 6 indicated that the composite in the PE_EP variant has similar parameters to PE_0 control samples, which corresponds to their surface roughness parameters. In contact angle measurements, it is crucial to consider the roughness of the tested material. For the PE_G variant, significantly lower contact angle values were obtained compared to pure polyethylene, which may be attributed to the previously presented surface roughness parameters.

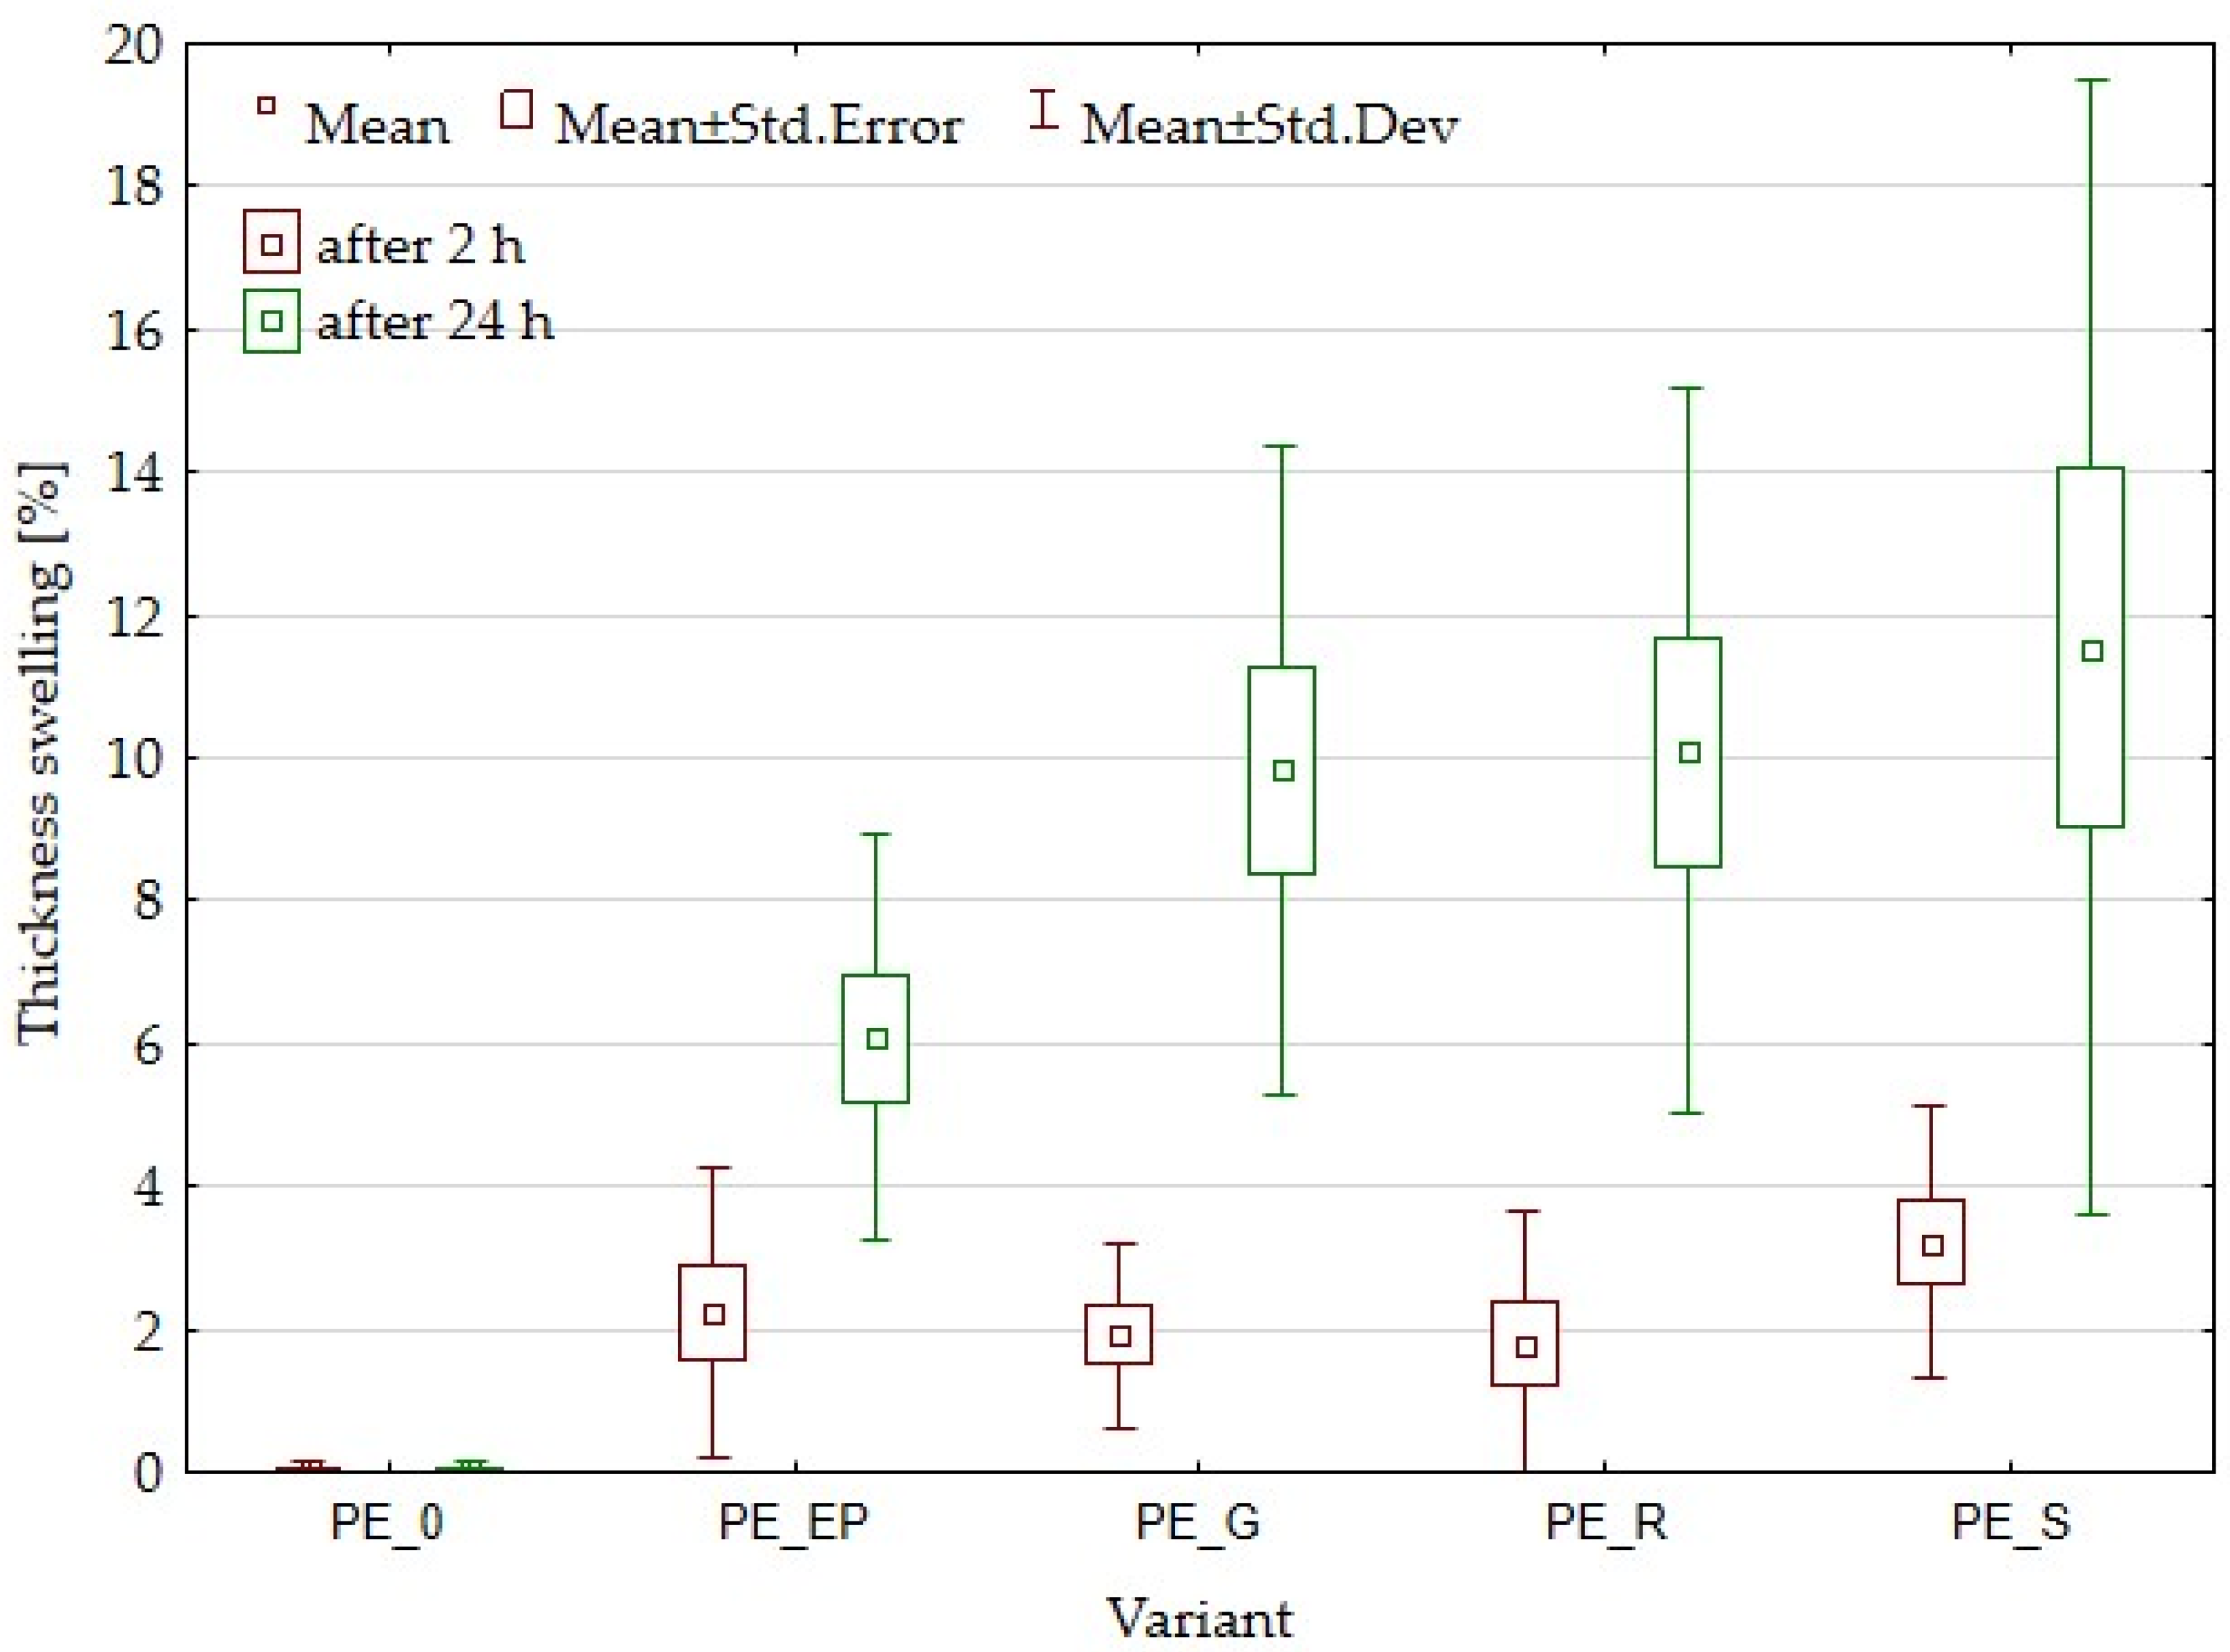
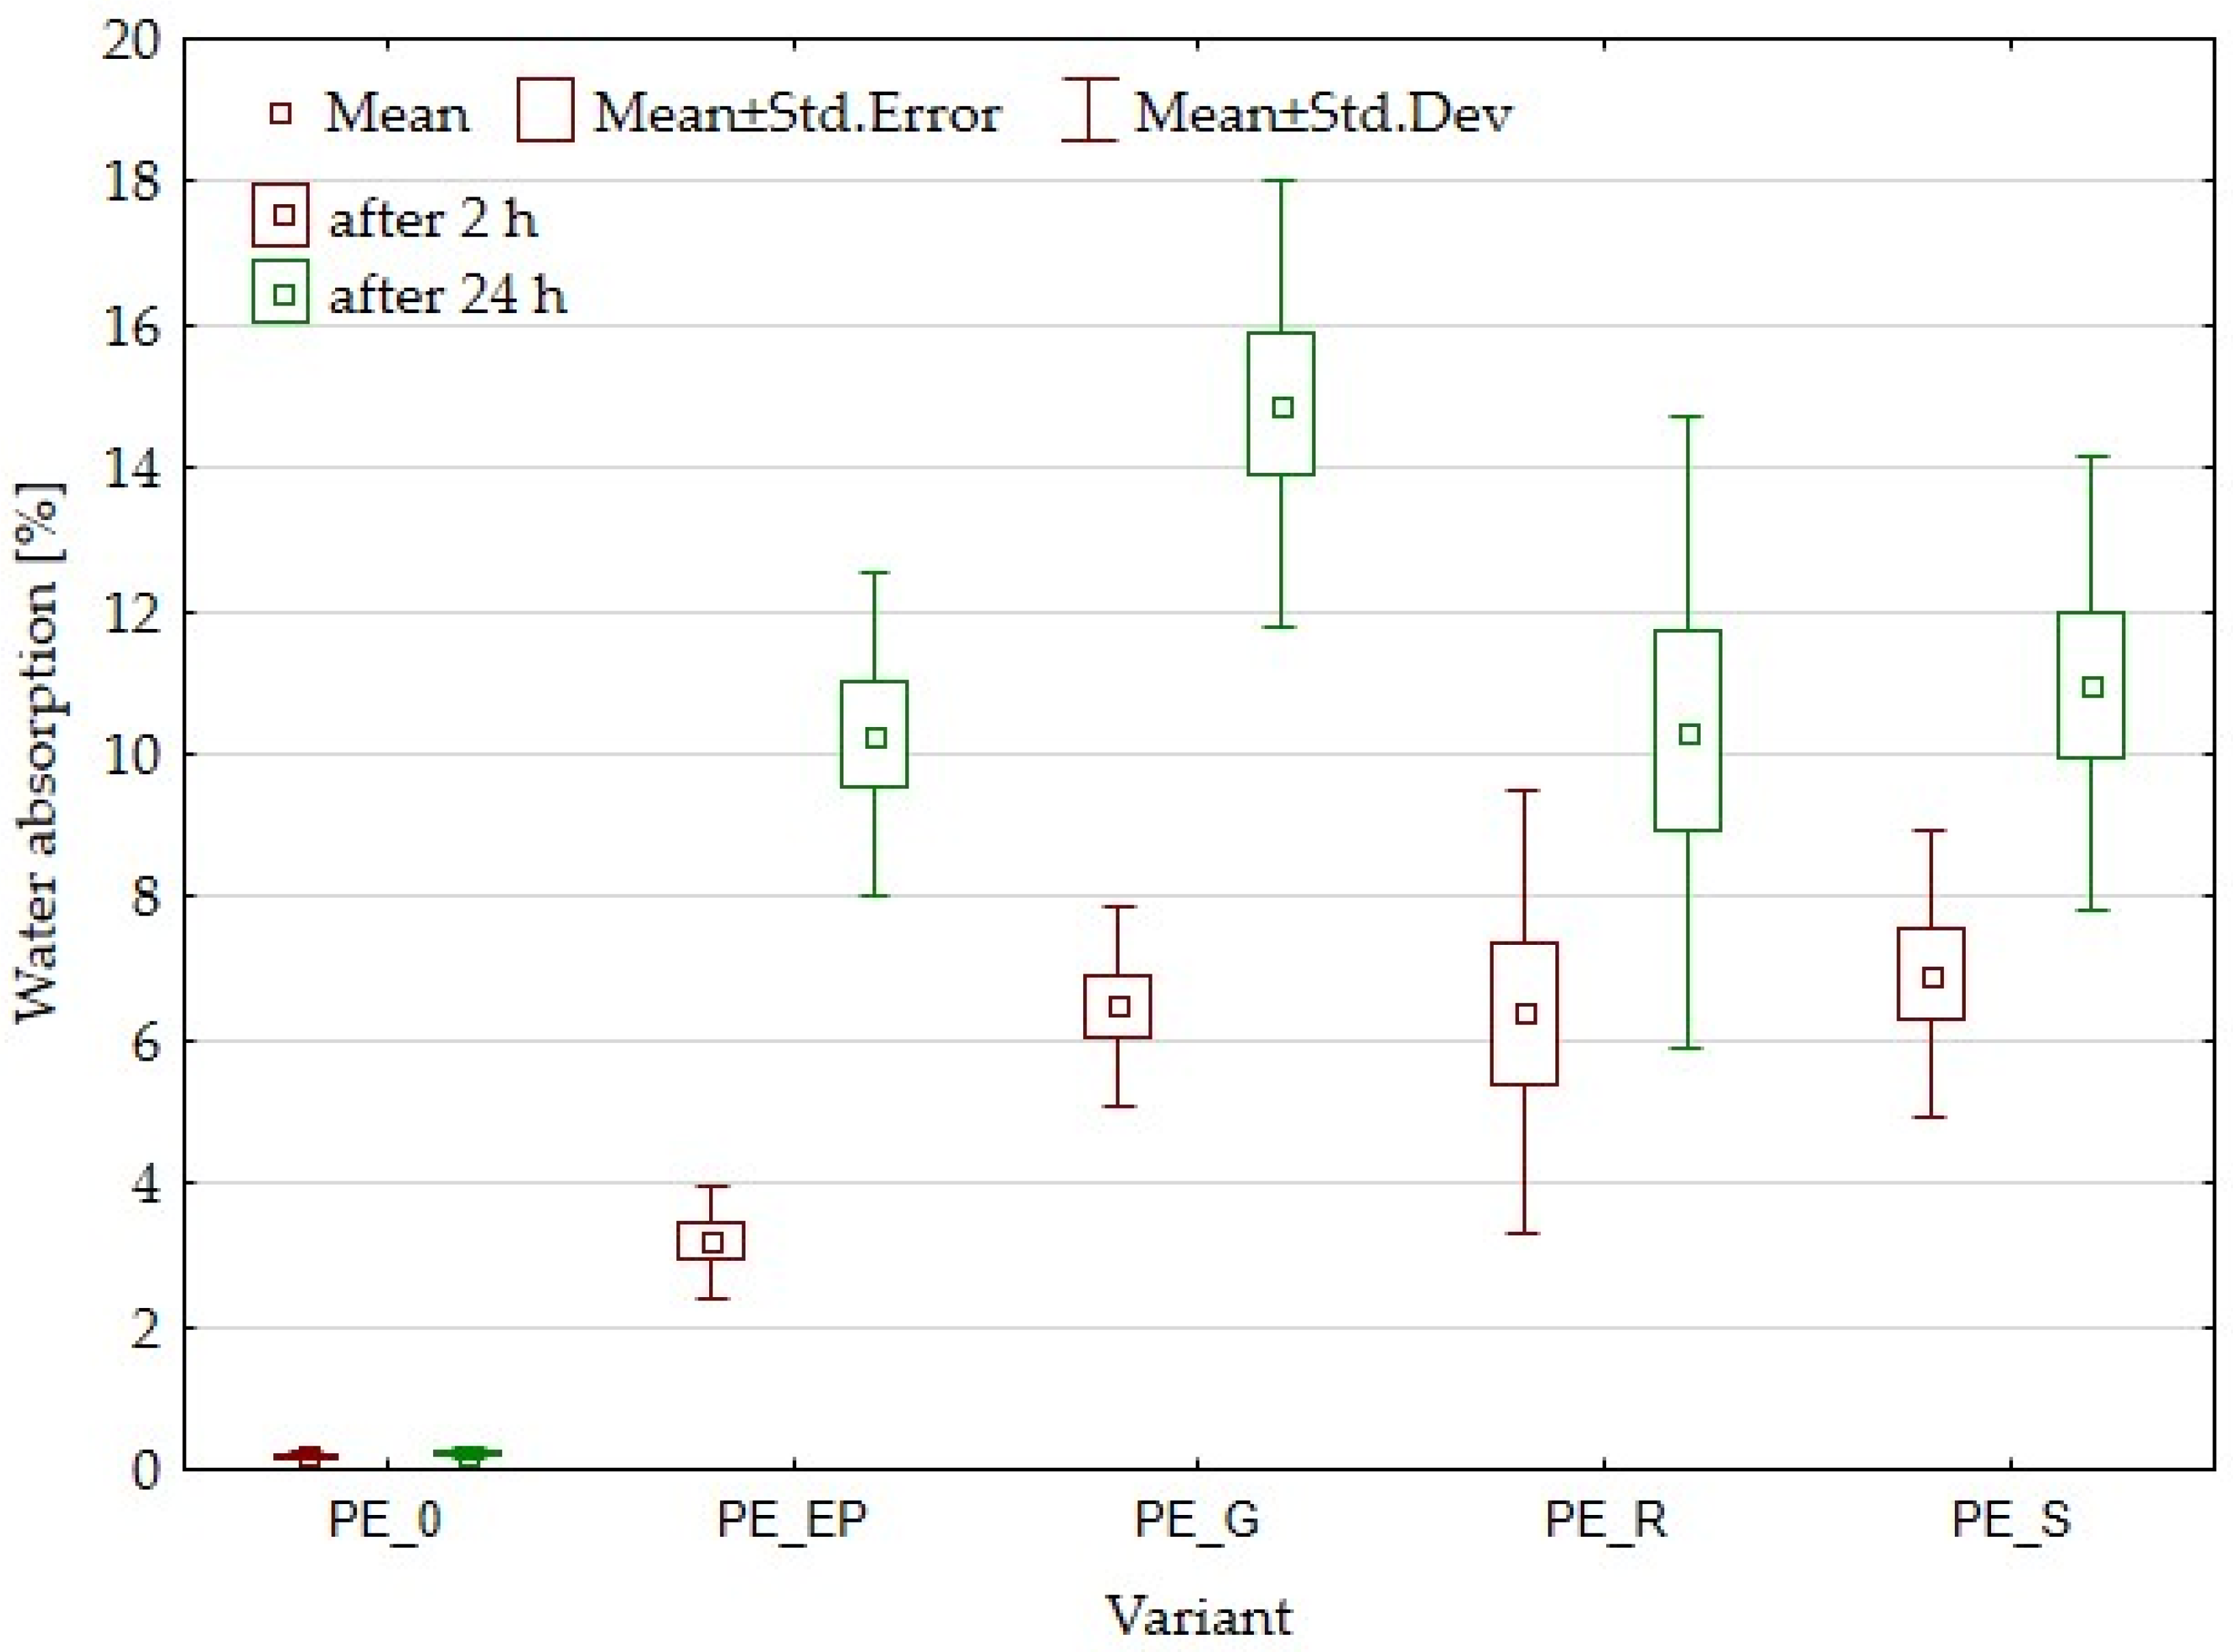
3.4. Water Absorption and Thickness Swelling

Polyethylene itself shows minimal swelling in thickness or water absorption [68]. As presented in Figure 7 and Figure 8, the addition of lignocellulosic particles, which are inherently hygroscopic [62], resulted in the expected increase in the values of the assessed features. Although these parameters did not show significant differences between variants, high statistical dispersion is noticeable. Lignocellulosic filler content in composites may result in differing densities, particle distribution, and degree of adhesion with the polymer, potentially causing differences in the rate of water absorption and thickness swelling in particular tested samples.
When comparing both TS and WA parameters, it is worth noticing that, in the case of WA2, PE_G, PE_R, and PE_S composites were characterized by having higher WA2 values than PE_EP composite, while TS showed no significant differences. This may be due to the more compact structure of the PE_EP composite, which had the highest density of all the variants produced, so the particles absorbed water less intensively in the first hours of the test due to the lack of free spaces. After 24 h, parameters equalized, but statistical dispersion was noticeable.

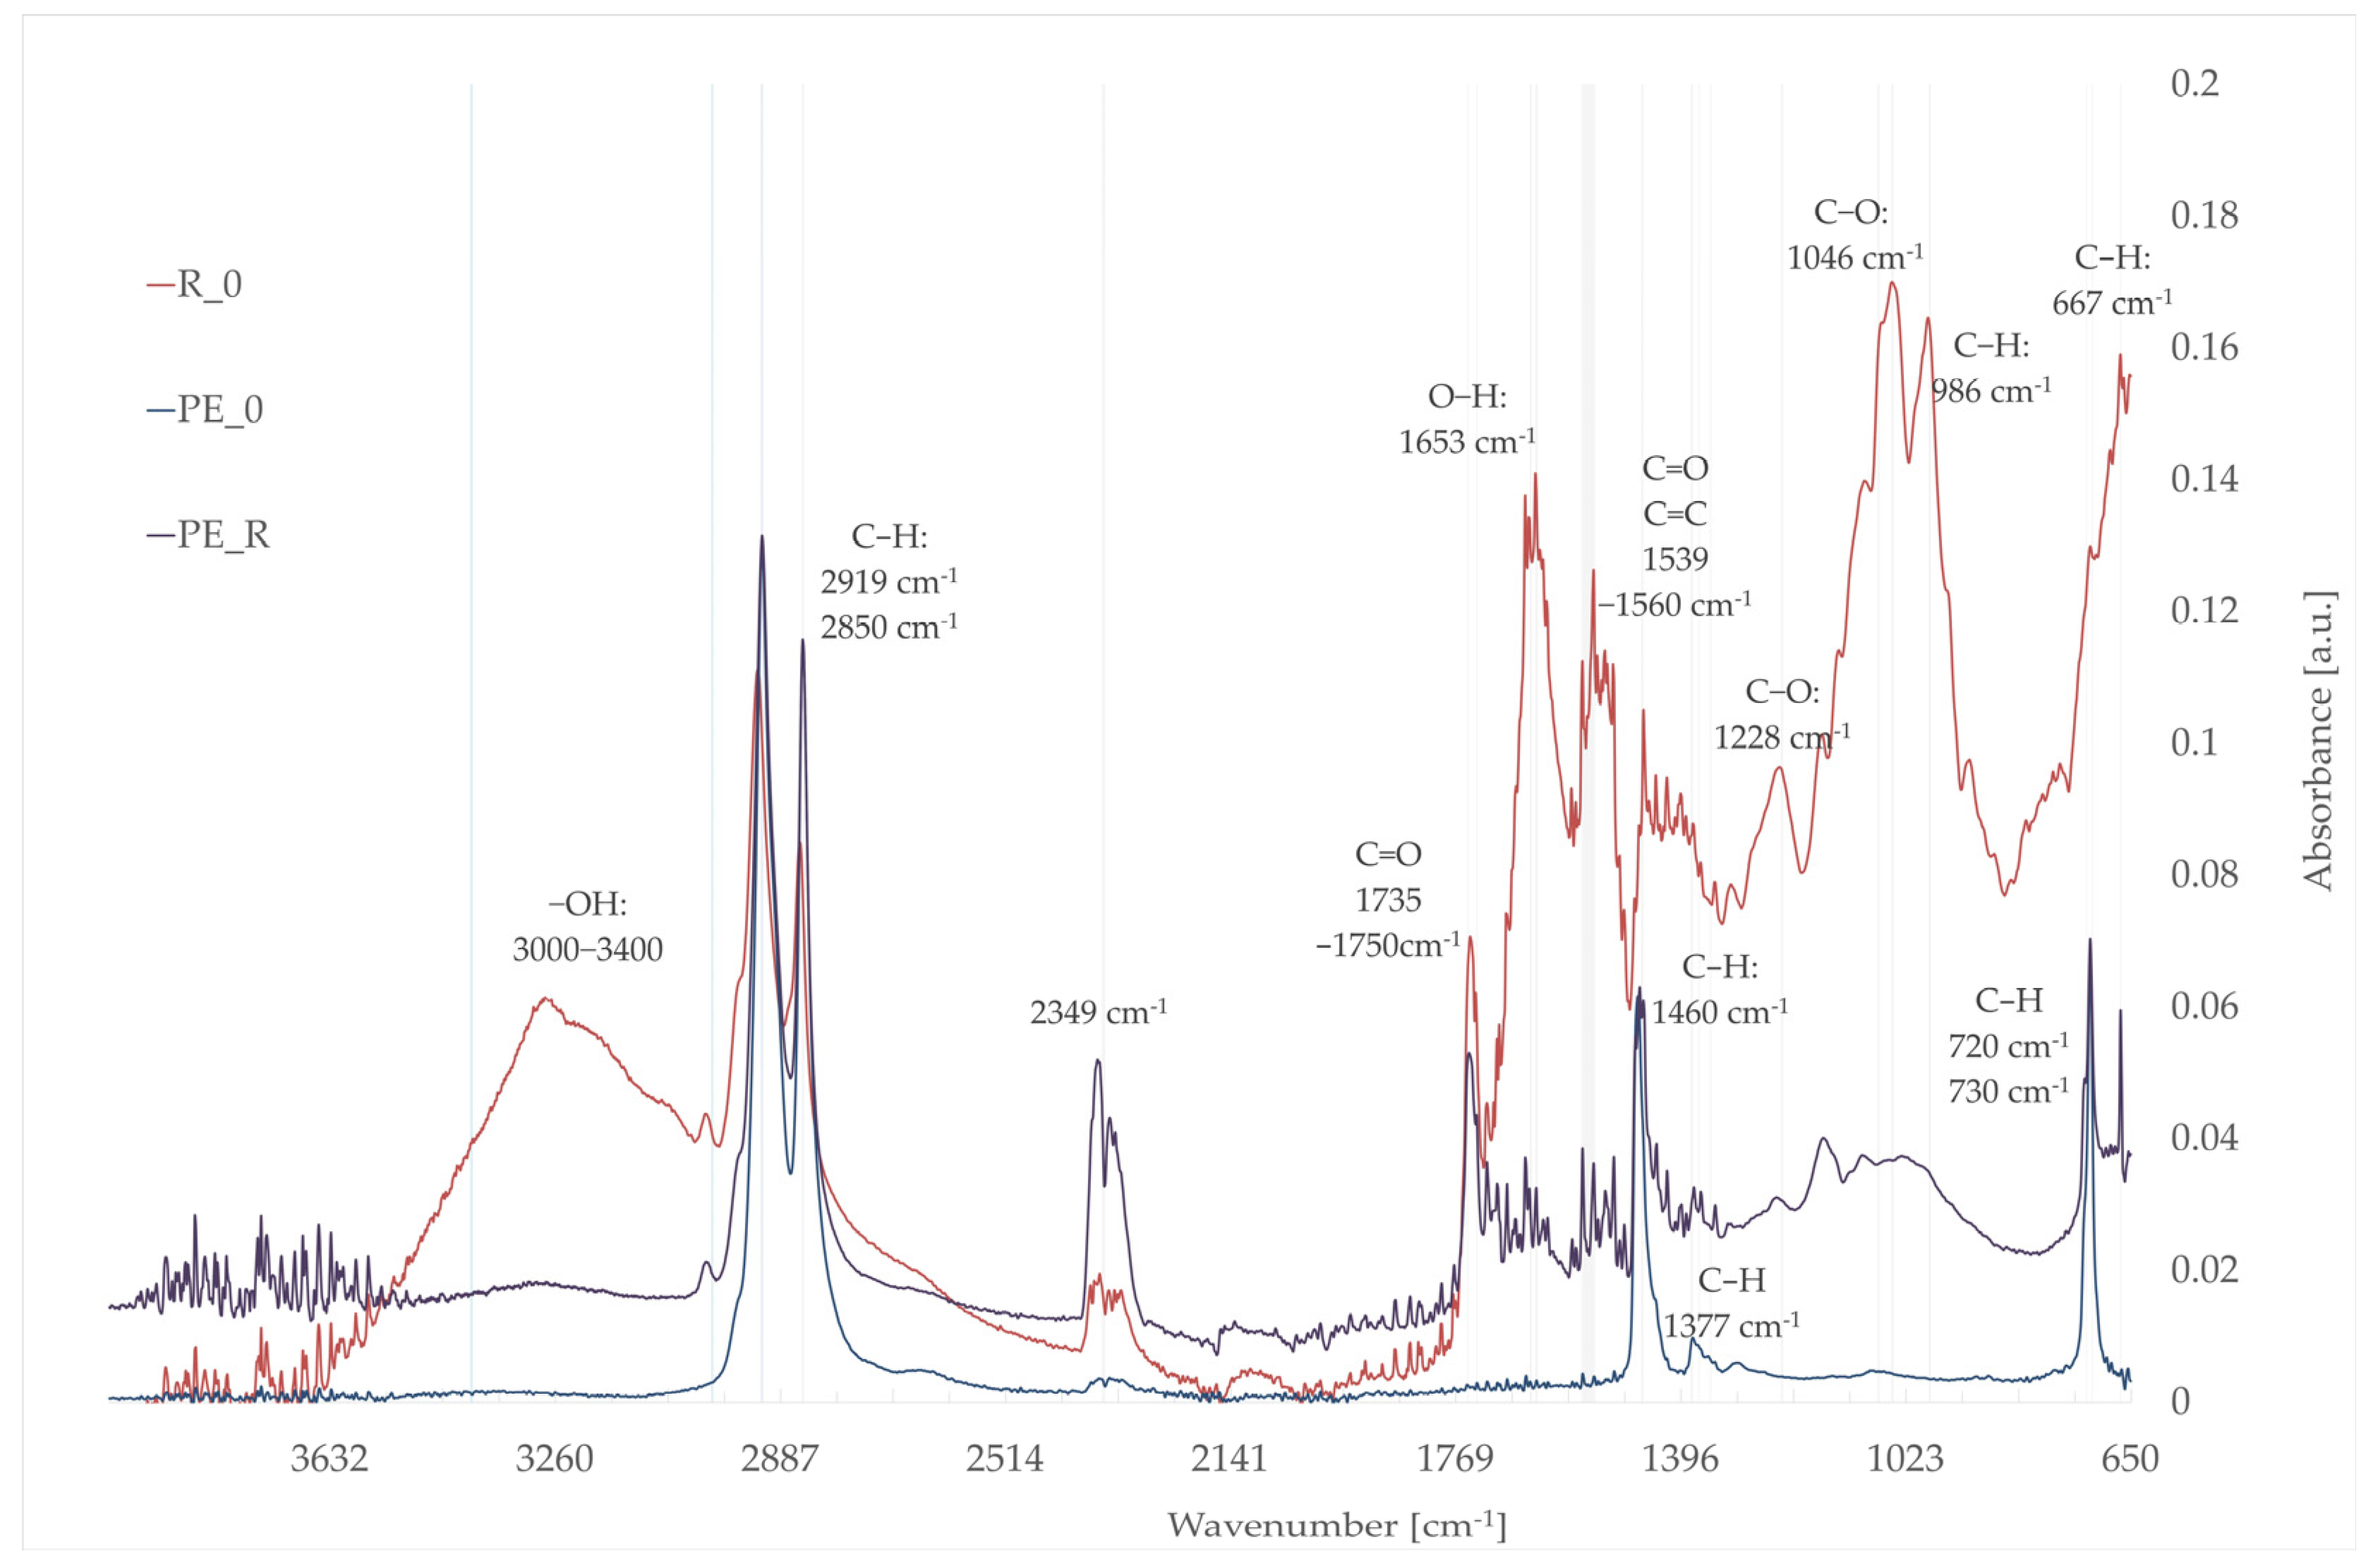
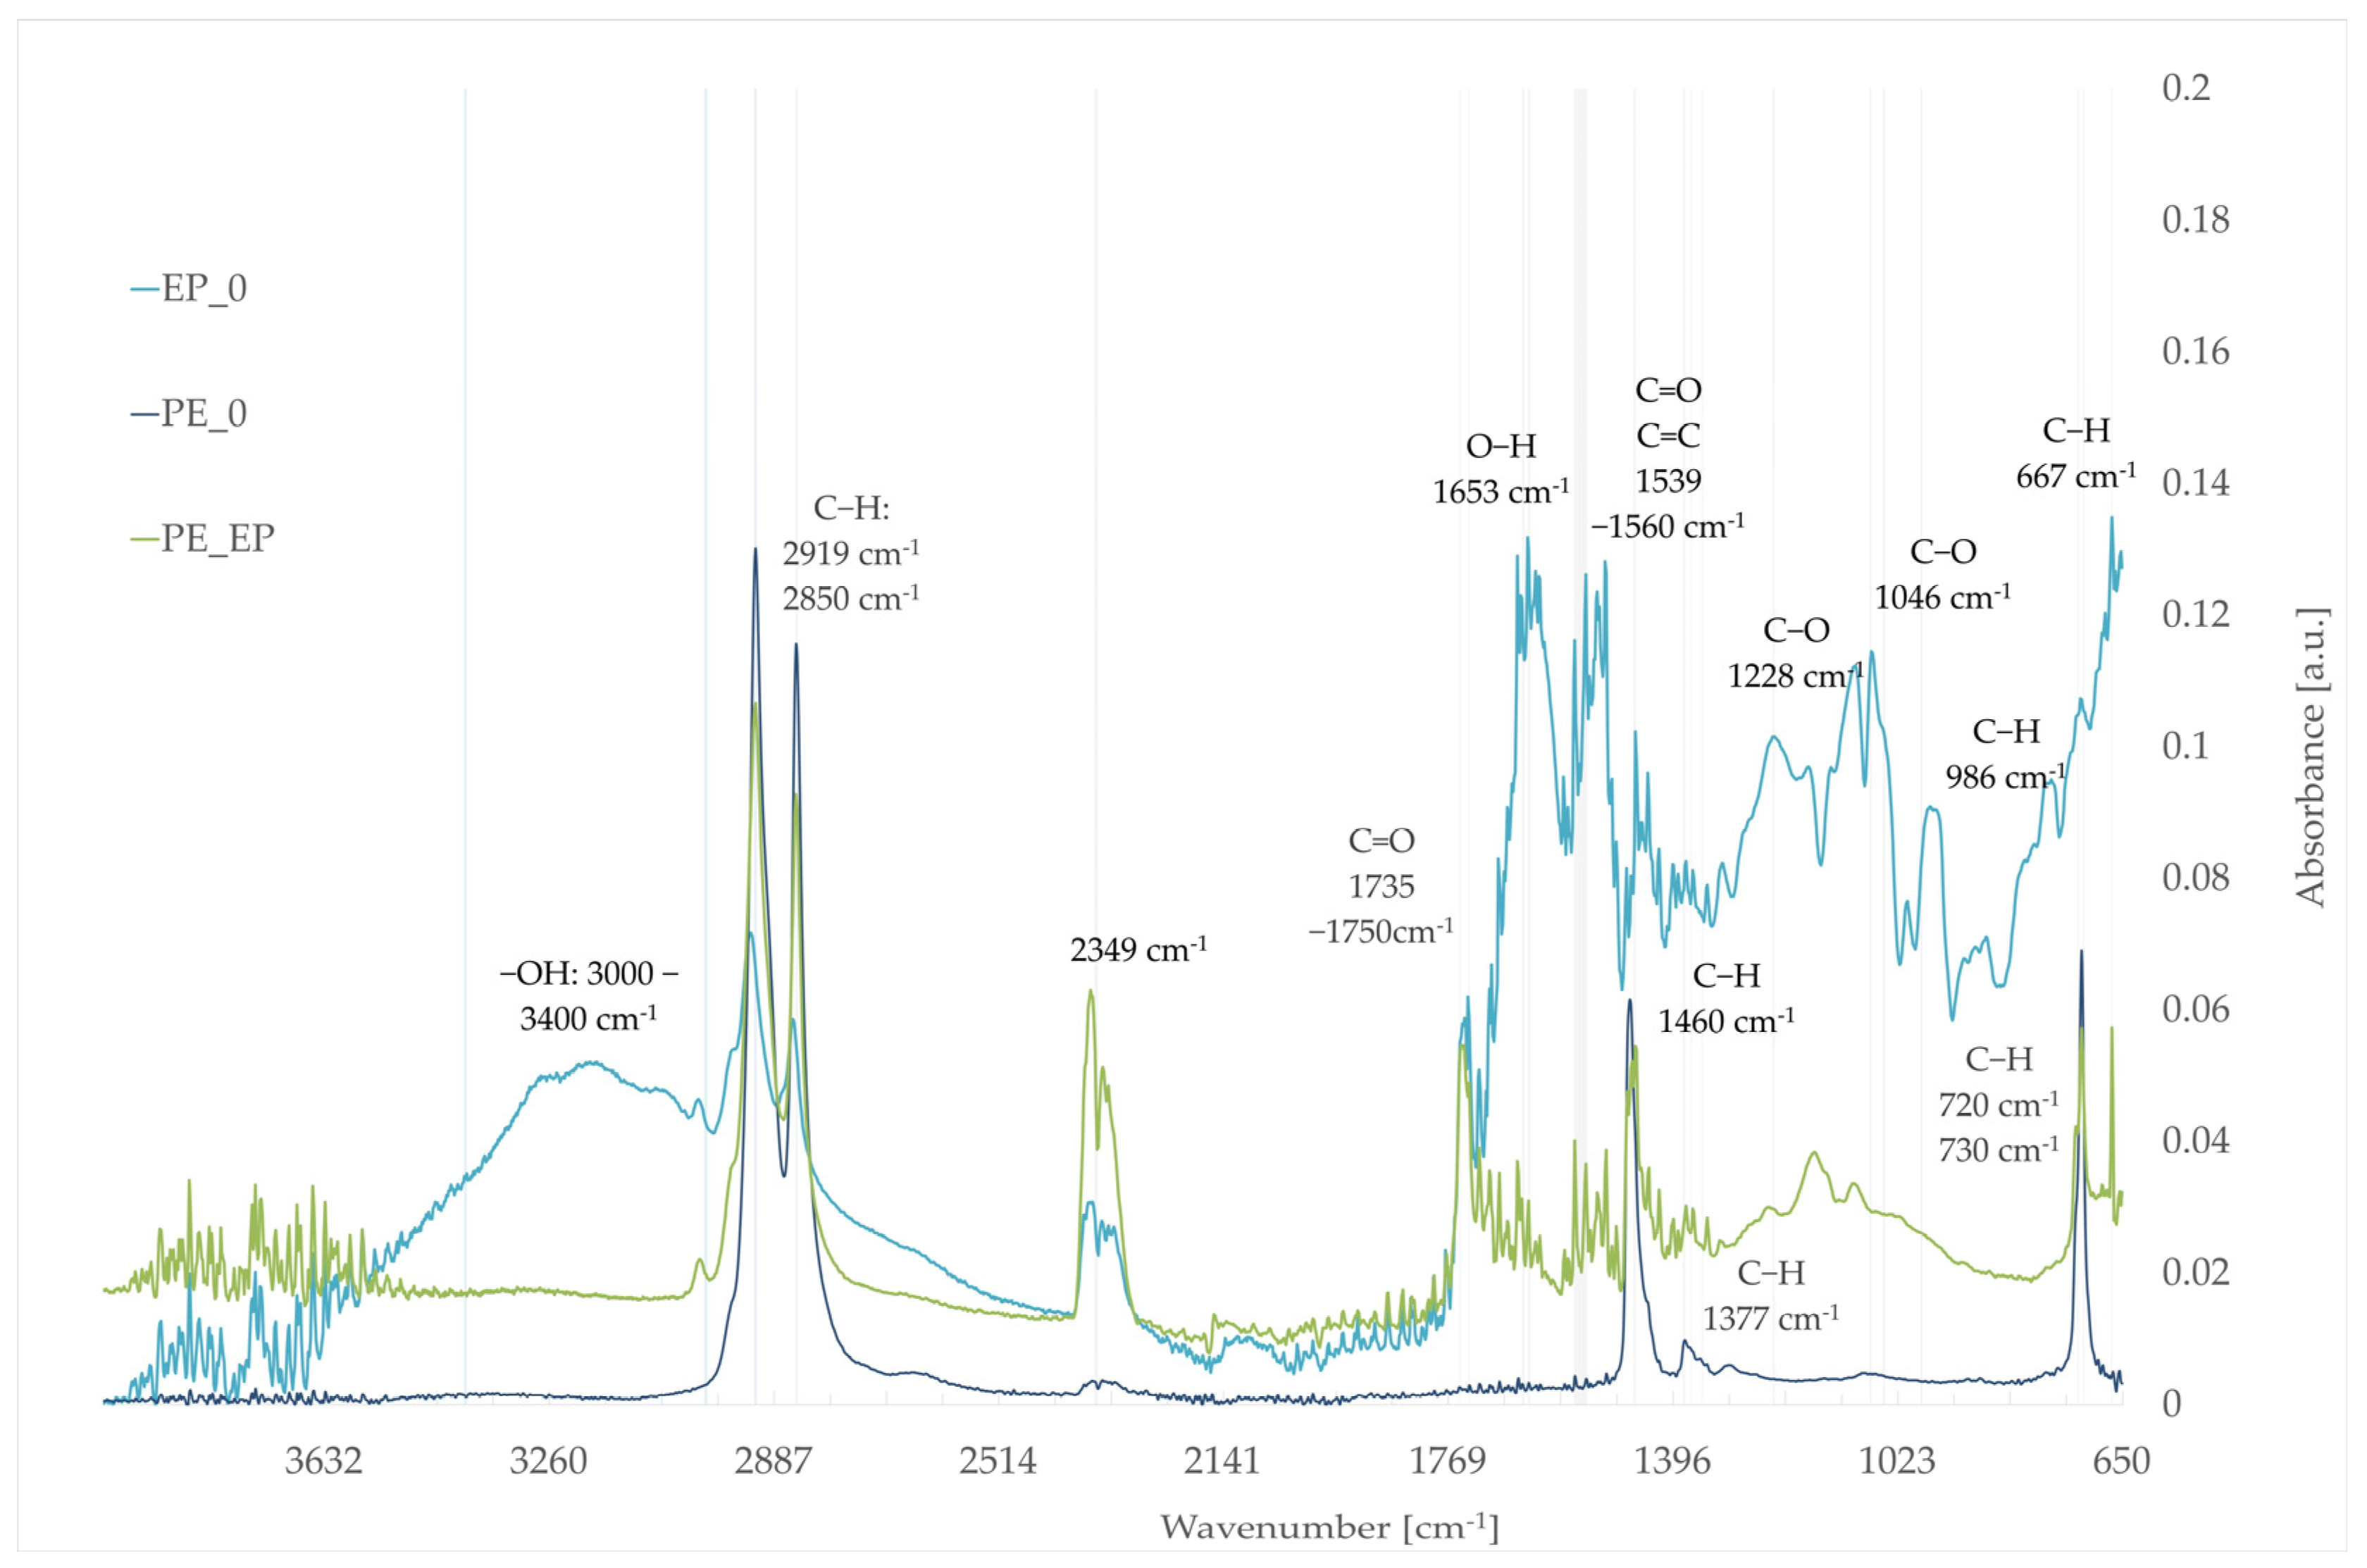
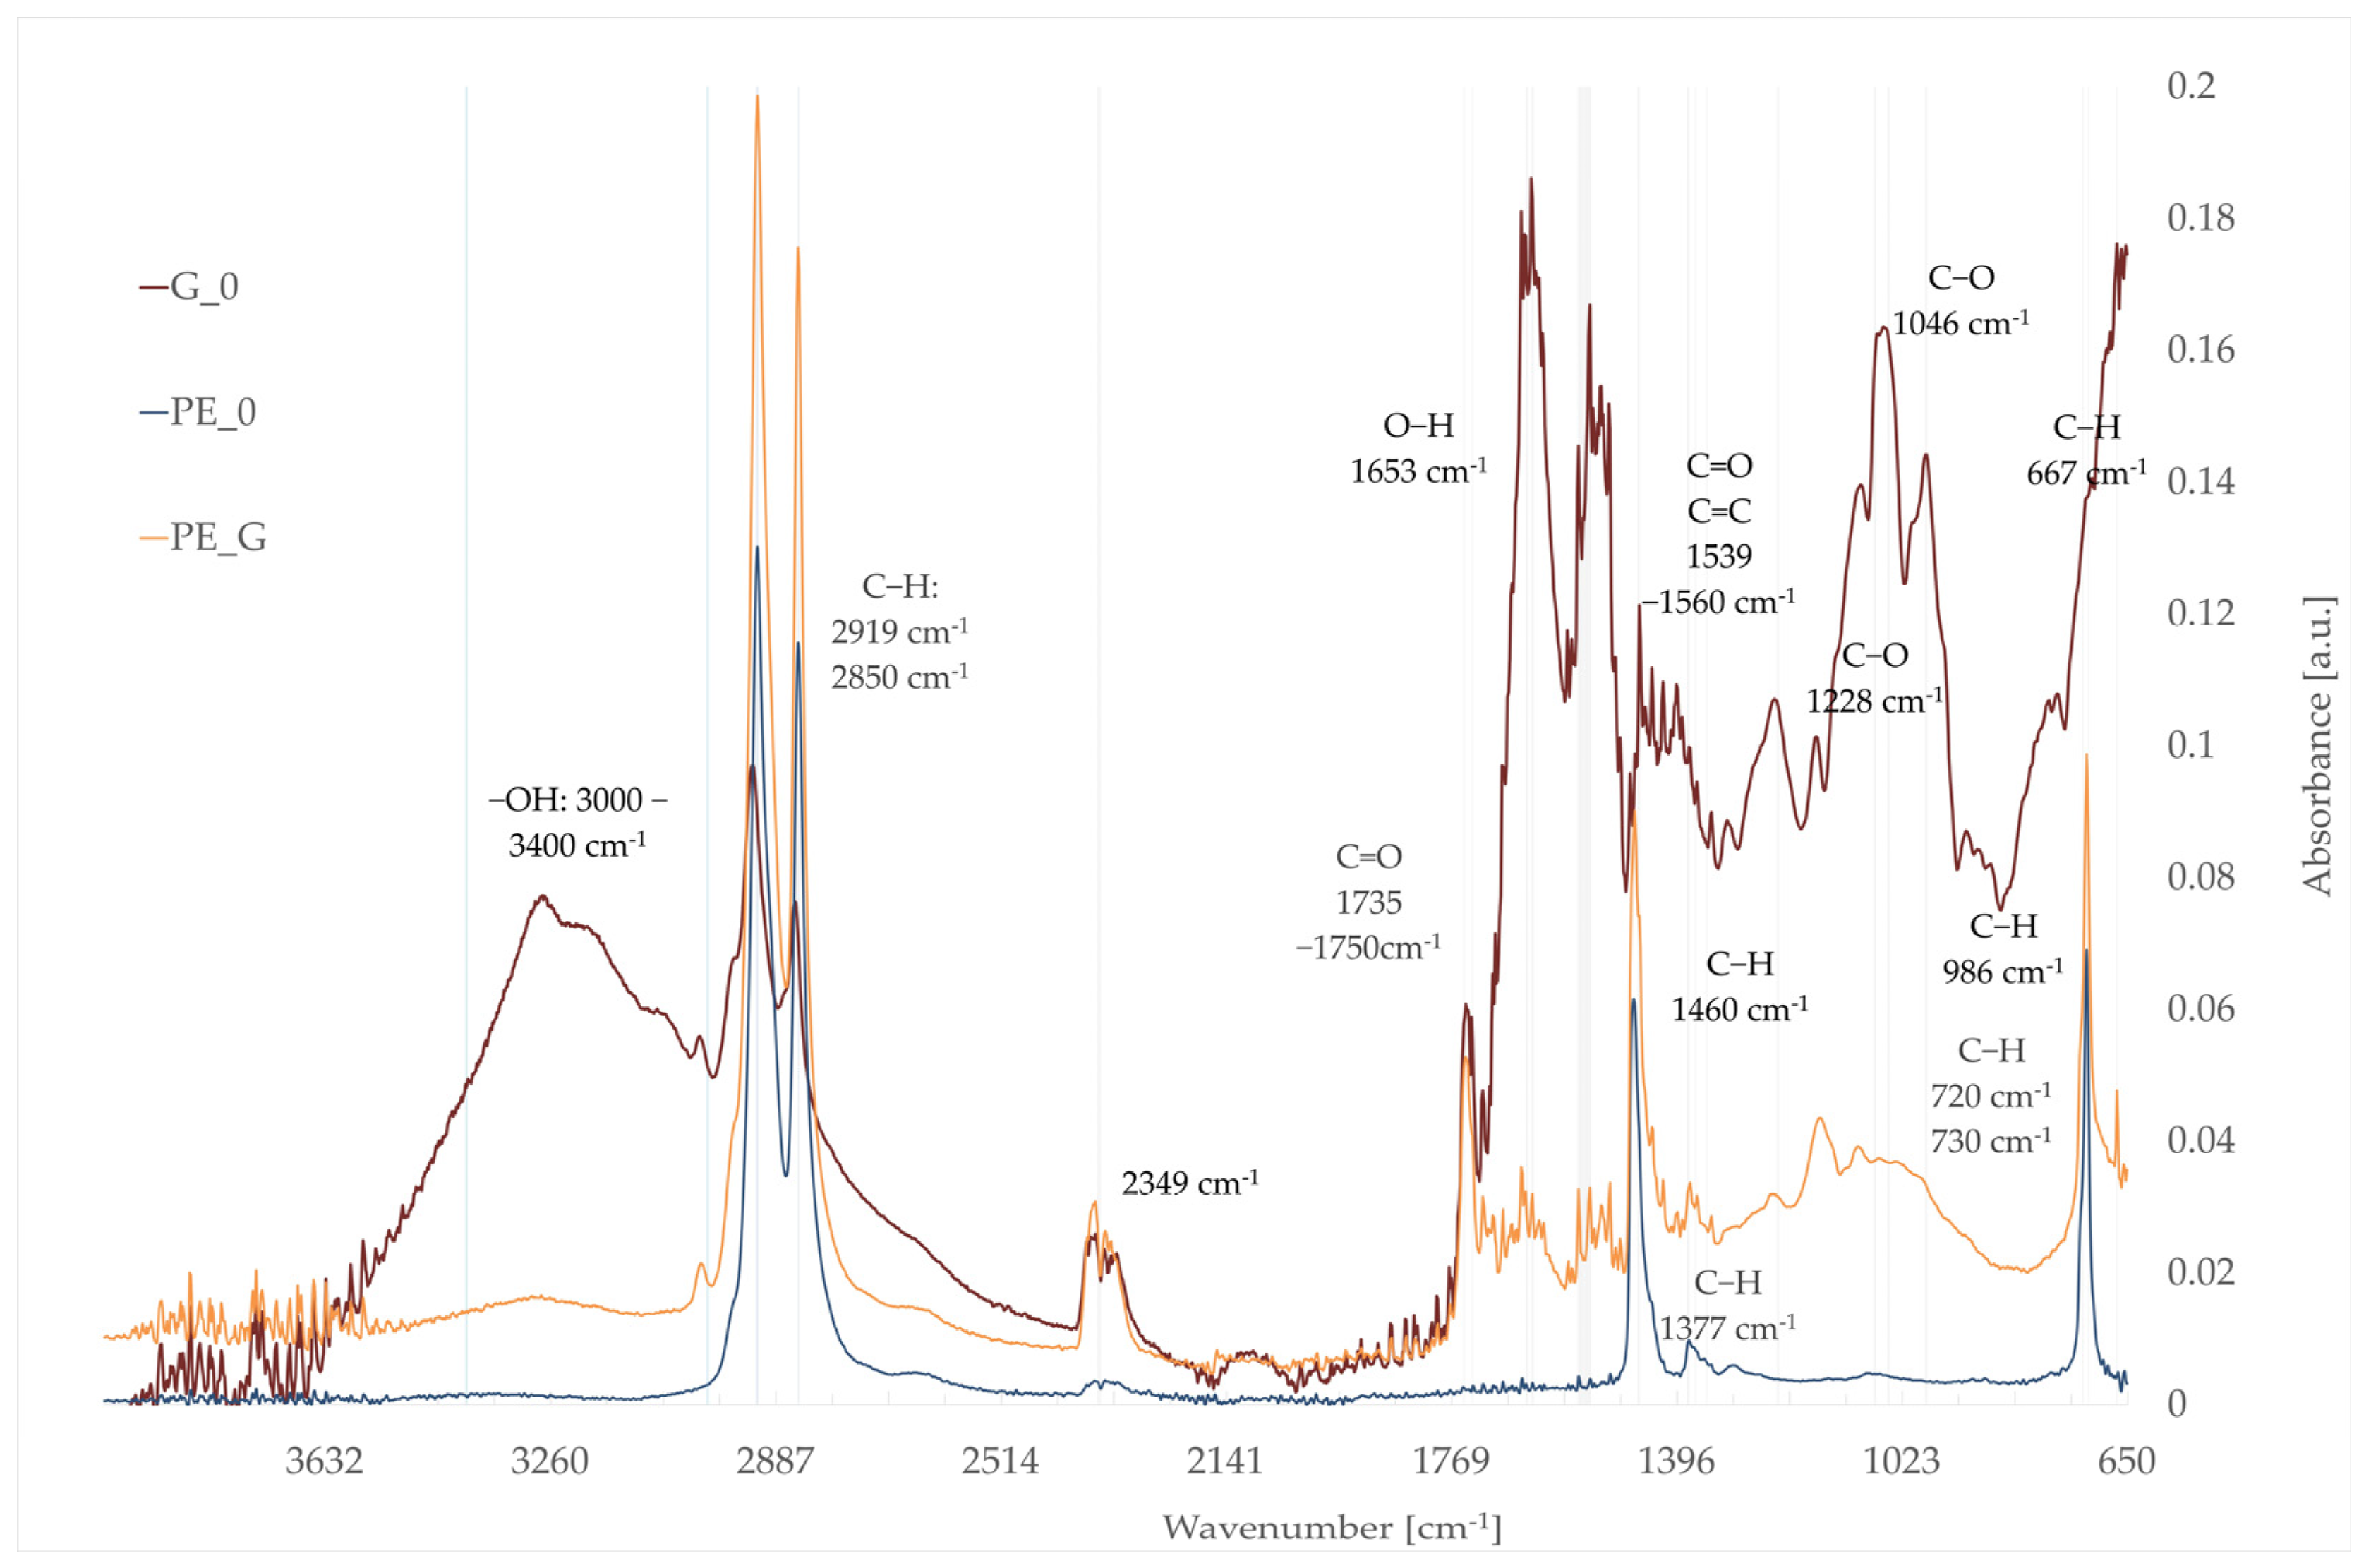
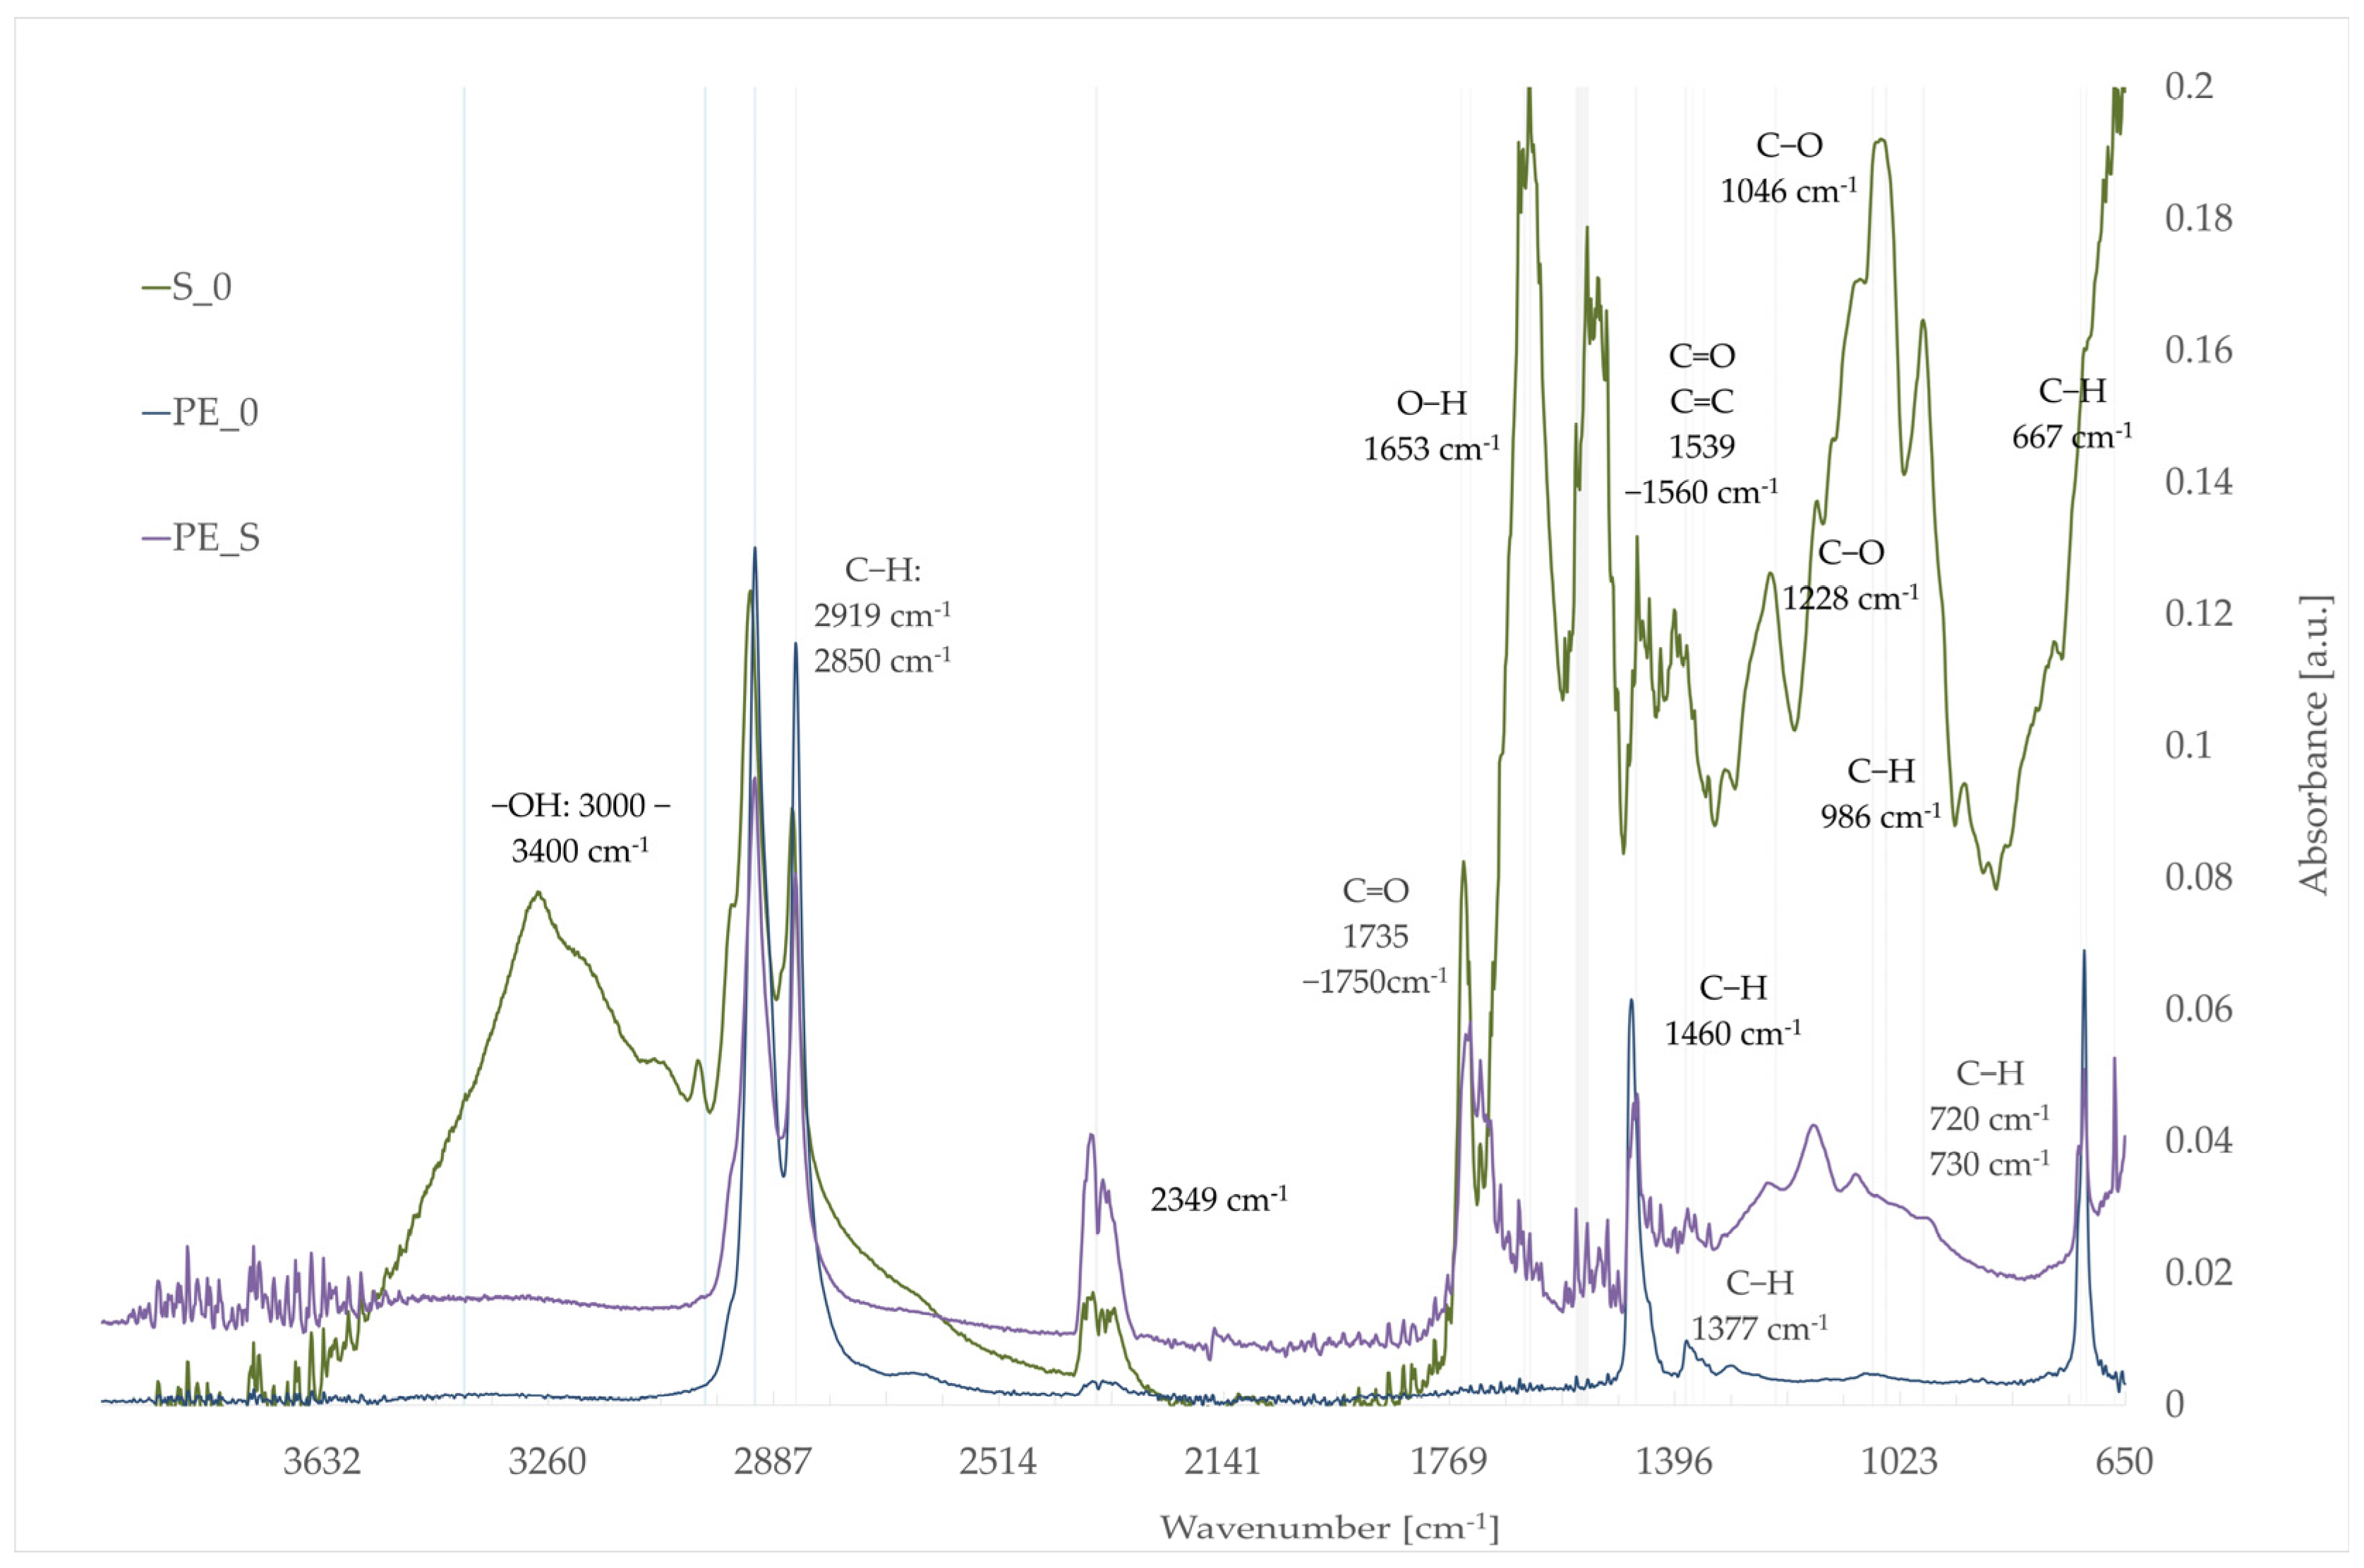
3.5. Fourier-Transform Infrared Spectroscopy (FTIR)

Figure 9, Figure 10, Figure 11 and Figure 12 display the infrared absorbance spectra for pure polyethylene, the raw extrudate, and the composite. This arrangement enables the comparison of the transformations in the substrates that occurred after the composite was produced and simultaneously allows for the analysis of the components. The data are categorized according to the type of lignocellulosic filler used. For this analysis, raw materials were marked with the following codes:
  • EP_0: evening primrose seed pomace;
  • G_0: gold of pleasure seed pomace;
  • R_0: rapeseed seed pomace;
  • S_0: sunflower seed pomace.
In each figure, it can be observed that the characteristics of polyethylene peak at 2919 cm−1 and 2850 cm−1 for asymmetric and symmetric C-H stretches, and at 720 cm−1 and 730 cm−1 because of rocking vibrations of CH2 groups bonding [69]. A small peak at 1377 cm−1 is connected to C-H symmetric deformation [70], and a peak at 1460 cm−1 is due to a methyl or methylene group [71]. Due to the non-reactive nature of polyethylene, all the characteristics of the pure polyethylene peaks are still visible in the composite spectra [72].
Rapeseed, gold of pleasure, sunflower, and evening primrose pomace contain residual oils that can influence the FTIR spectra. These oils are rich in triglycerides, fatty acids, and other organic compounds [73] that contribute to the observed peaks. The peaks at 2919 cm−1 and 2850 cm−1 are also visible in composite and raw materials. They are sometimes listed according to lignocellulosic material spectra and linked to the aliphatic hydrocarbons in the lignocellulosic material [74], but in this case, they may also be related to the presence of oil residues in pomace material. The analyzed FTIR spectra of rapeseed [75], gold of pleasure, sunflower [76], and evening primrose [77] oils reveal these particular peaks. The absorbance differs between particular types of pomace fillers in raw material spectra and composites, and it should be noticed that PE_G was characterized by having the highest value, probably because of the accumulation of the absorbance values from matrix and filler.
The broad peak around 3000–3400 cm−1 is attributed to the stretching vibrations of O-H bonds in free hydroxyl groups [78] present in cellulose and hemicellulose (polysaccharides) [79]. The disappearance of this peak in the composite can be due to water vapor after thermal processing during composites production at 180 °C. The peak around 2349 cm−1 is typically associated with the presence of carbon dioxide (CO2) in the sample or the measurement environment and may be treated as spectra disturbance [80]. In this case, this can also be the result of thermal influence on residual oils during composite processing. The peak at 1735–1750 cm−1 corresponds to the C=O stretching vibrations in esters, ketones, and carboxylic acids in the hemicellulose and lignin structures [75], but it is also observed in the FTIR spectra of edible oils [81,82]. The peak at 1653 cm−1 observed in the raw material is associated with the -O-H bond in water [75,83], and it decreases in composites. The peak between 1539–1560 cm−1 is reported to be due to C=C and C=O vibrations in aromatic structures [84]. The decrease in composites may be due to degradation of less-ordered saccharides under heat [85] or the splitting of aliphatic side chains in lignin [86].
The peak at 1228 cm−1 is associated with the C-O stretching vibrations and is associated with lignin content [87,88], and its decreasing in composite may be due to thermal degradation of guaiacyl and syringyl groups in lignin [87]. The absorbance peak at 1046 cm−1 corresponds to C–O stretch in cellulose and hemicellulose [89] and its disappearance in composite suggests the degradation or structural alteration of hemicellulose [88]. Peaks at 986 cm−1 and 667 cm−1 correspond to C-H bending in aromatic compounds. The loss of this peak may be due to the decomposition of aromatic structures. Despite the fact that the raw material spectra did differ, mainly because of oil and other compounds content, in the final composites, differences were smaller, except for the 2920 cm−1 and 2850 cm−1 peaks in the PE_G composite.

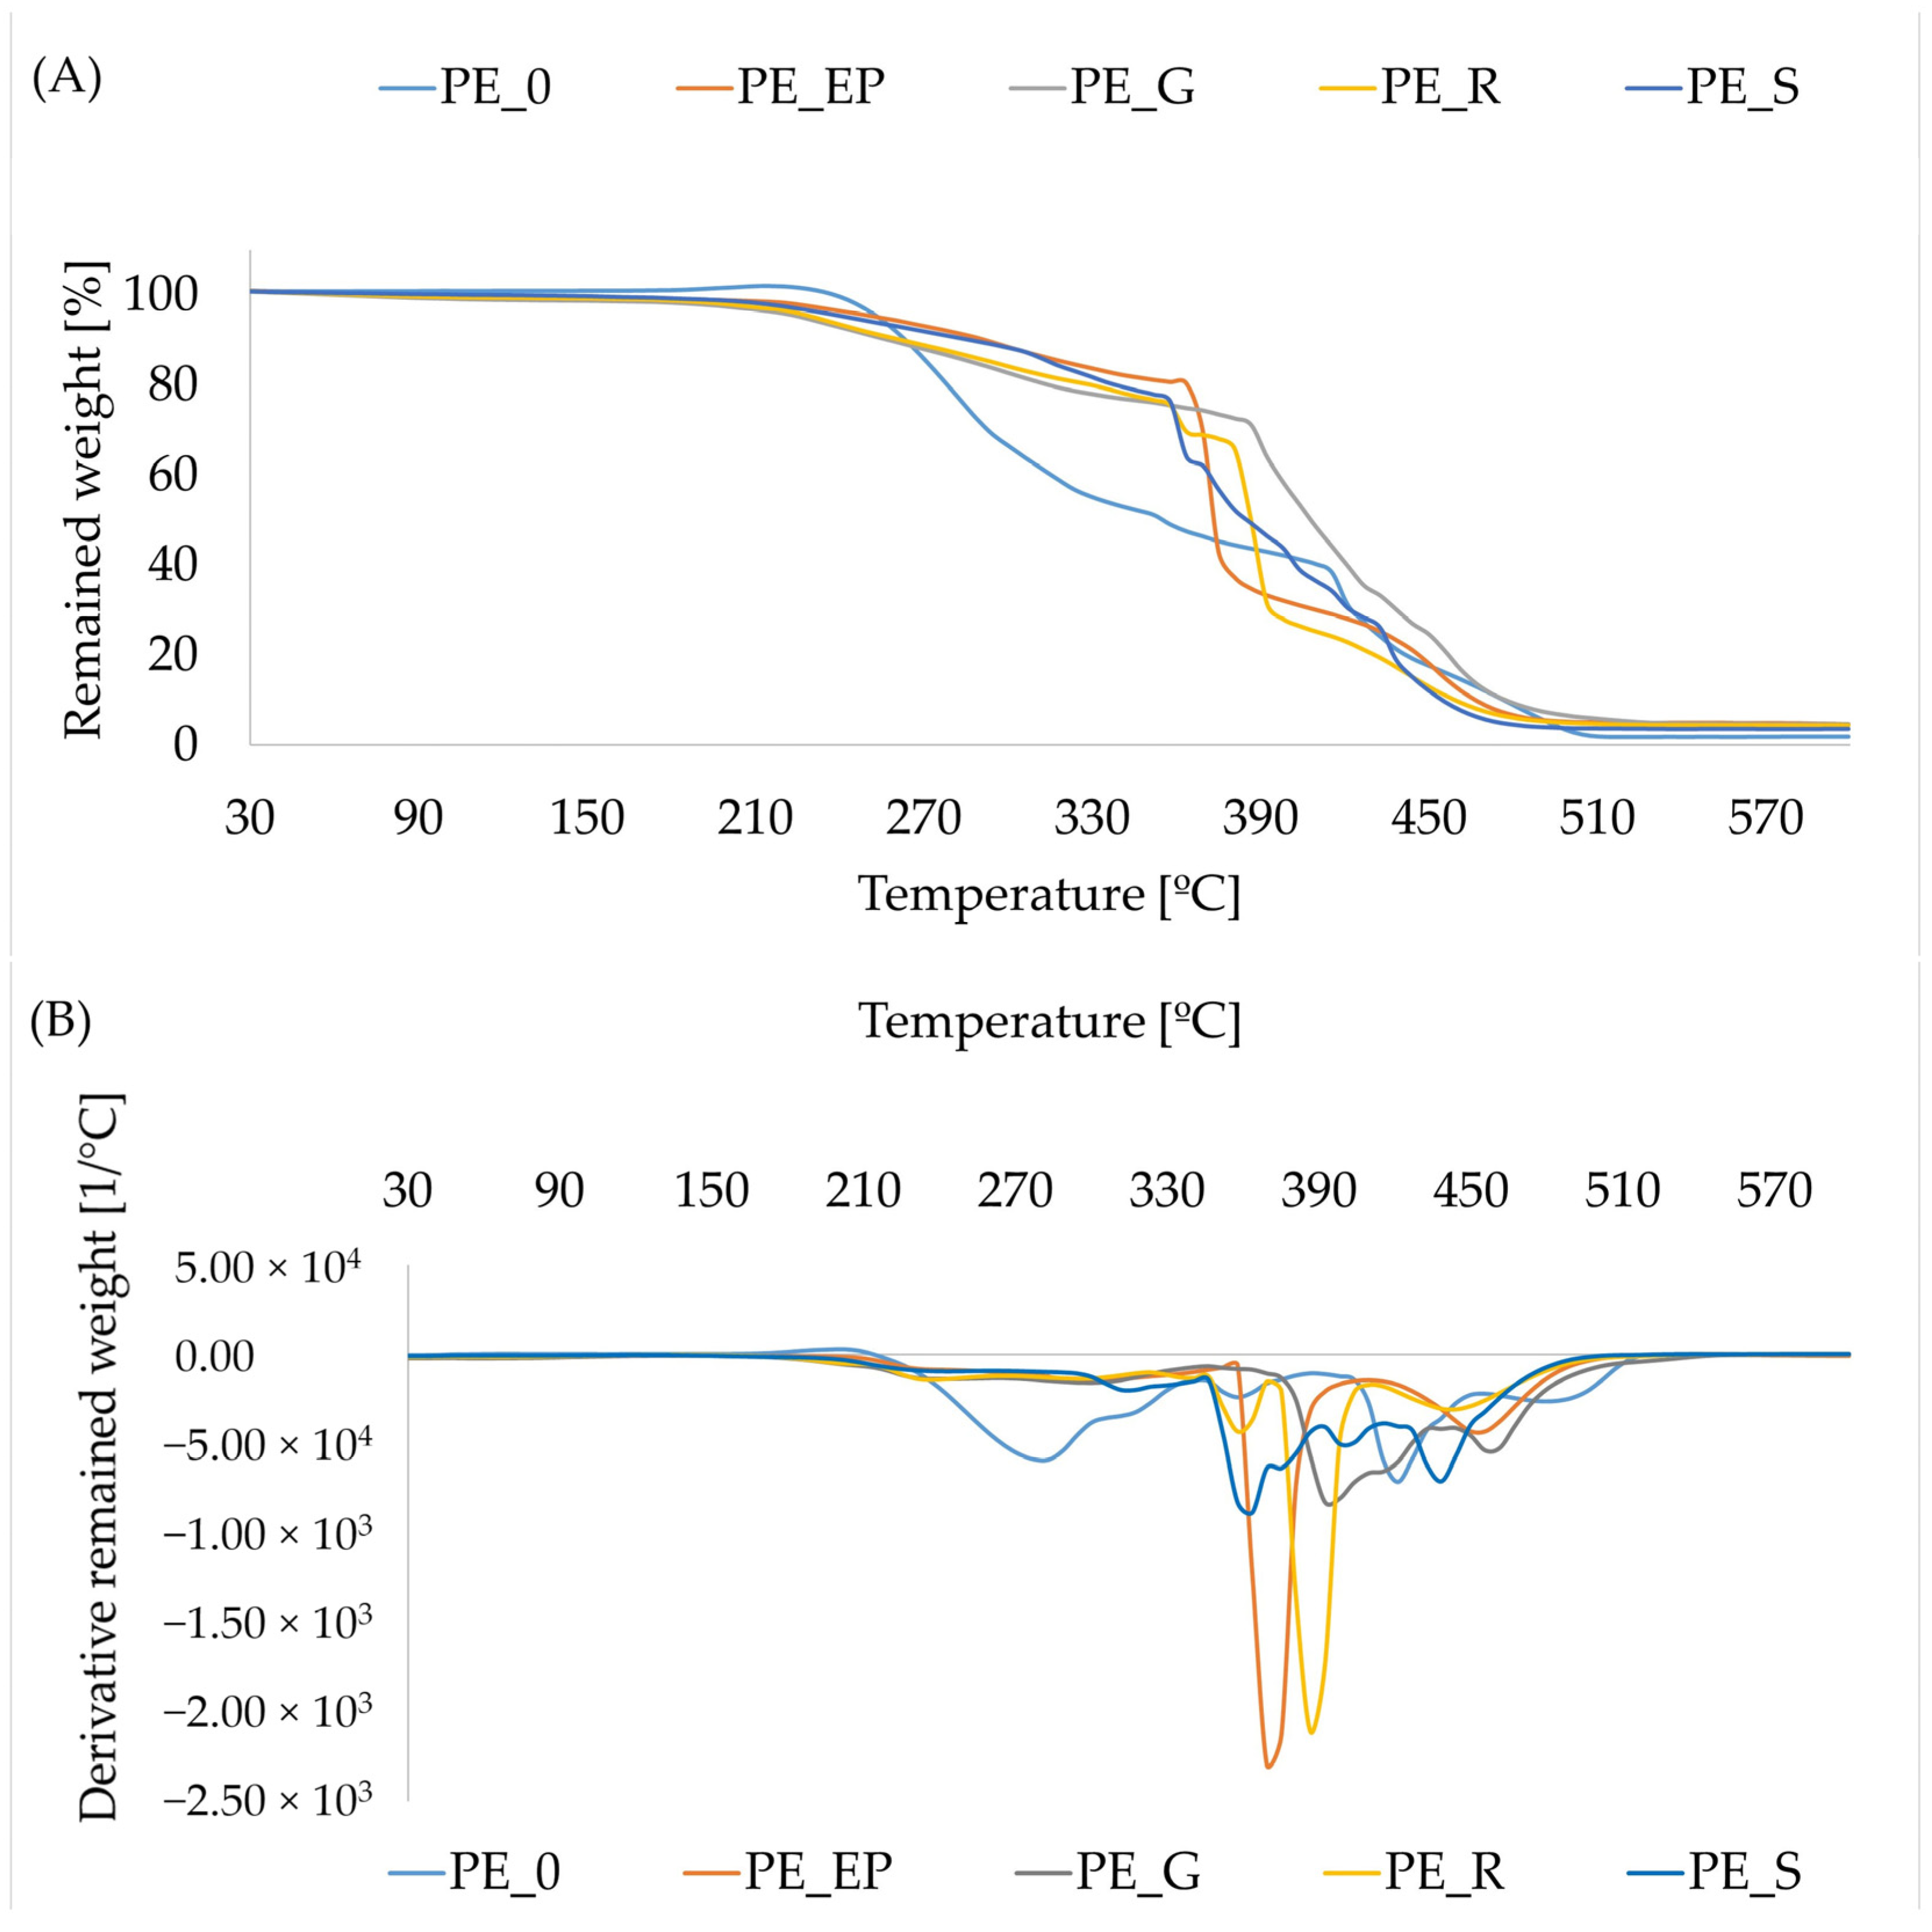
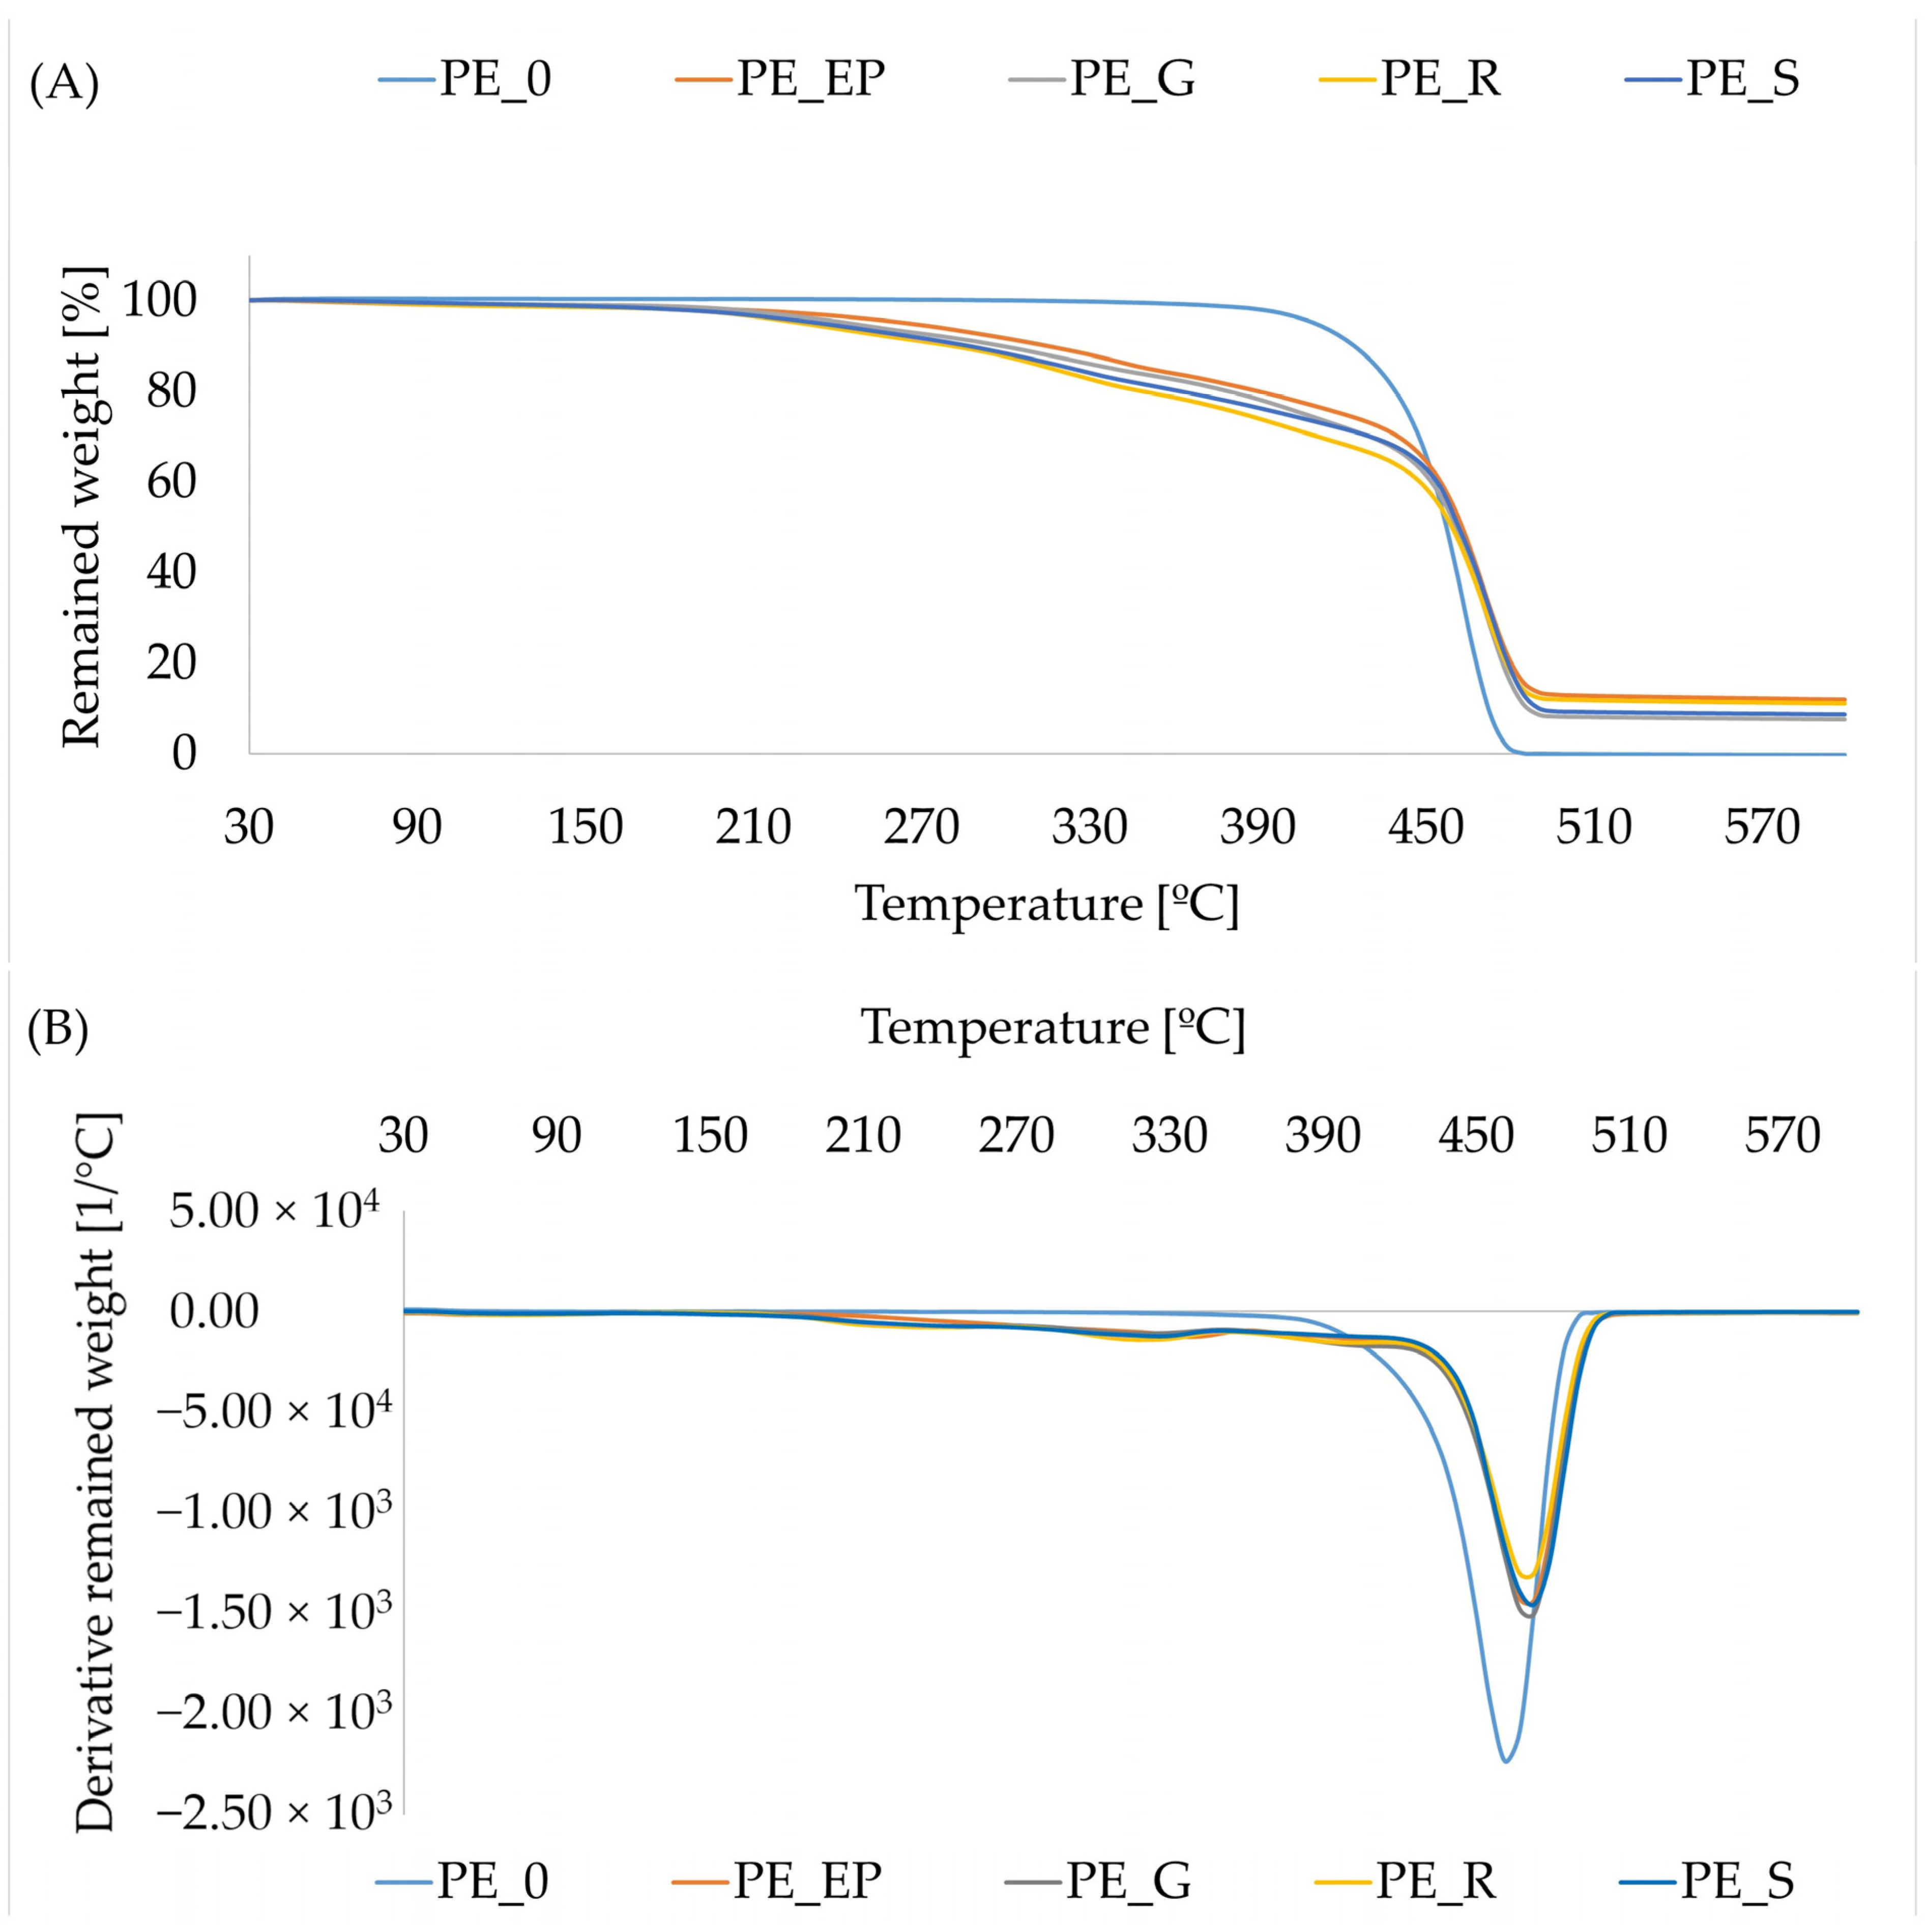
3.6. Thermal Properties of Composites
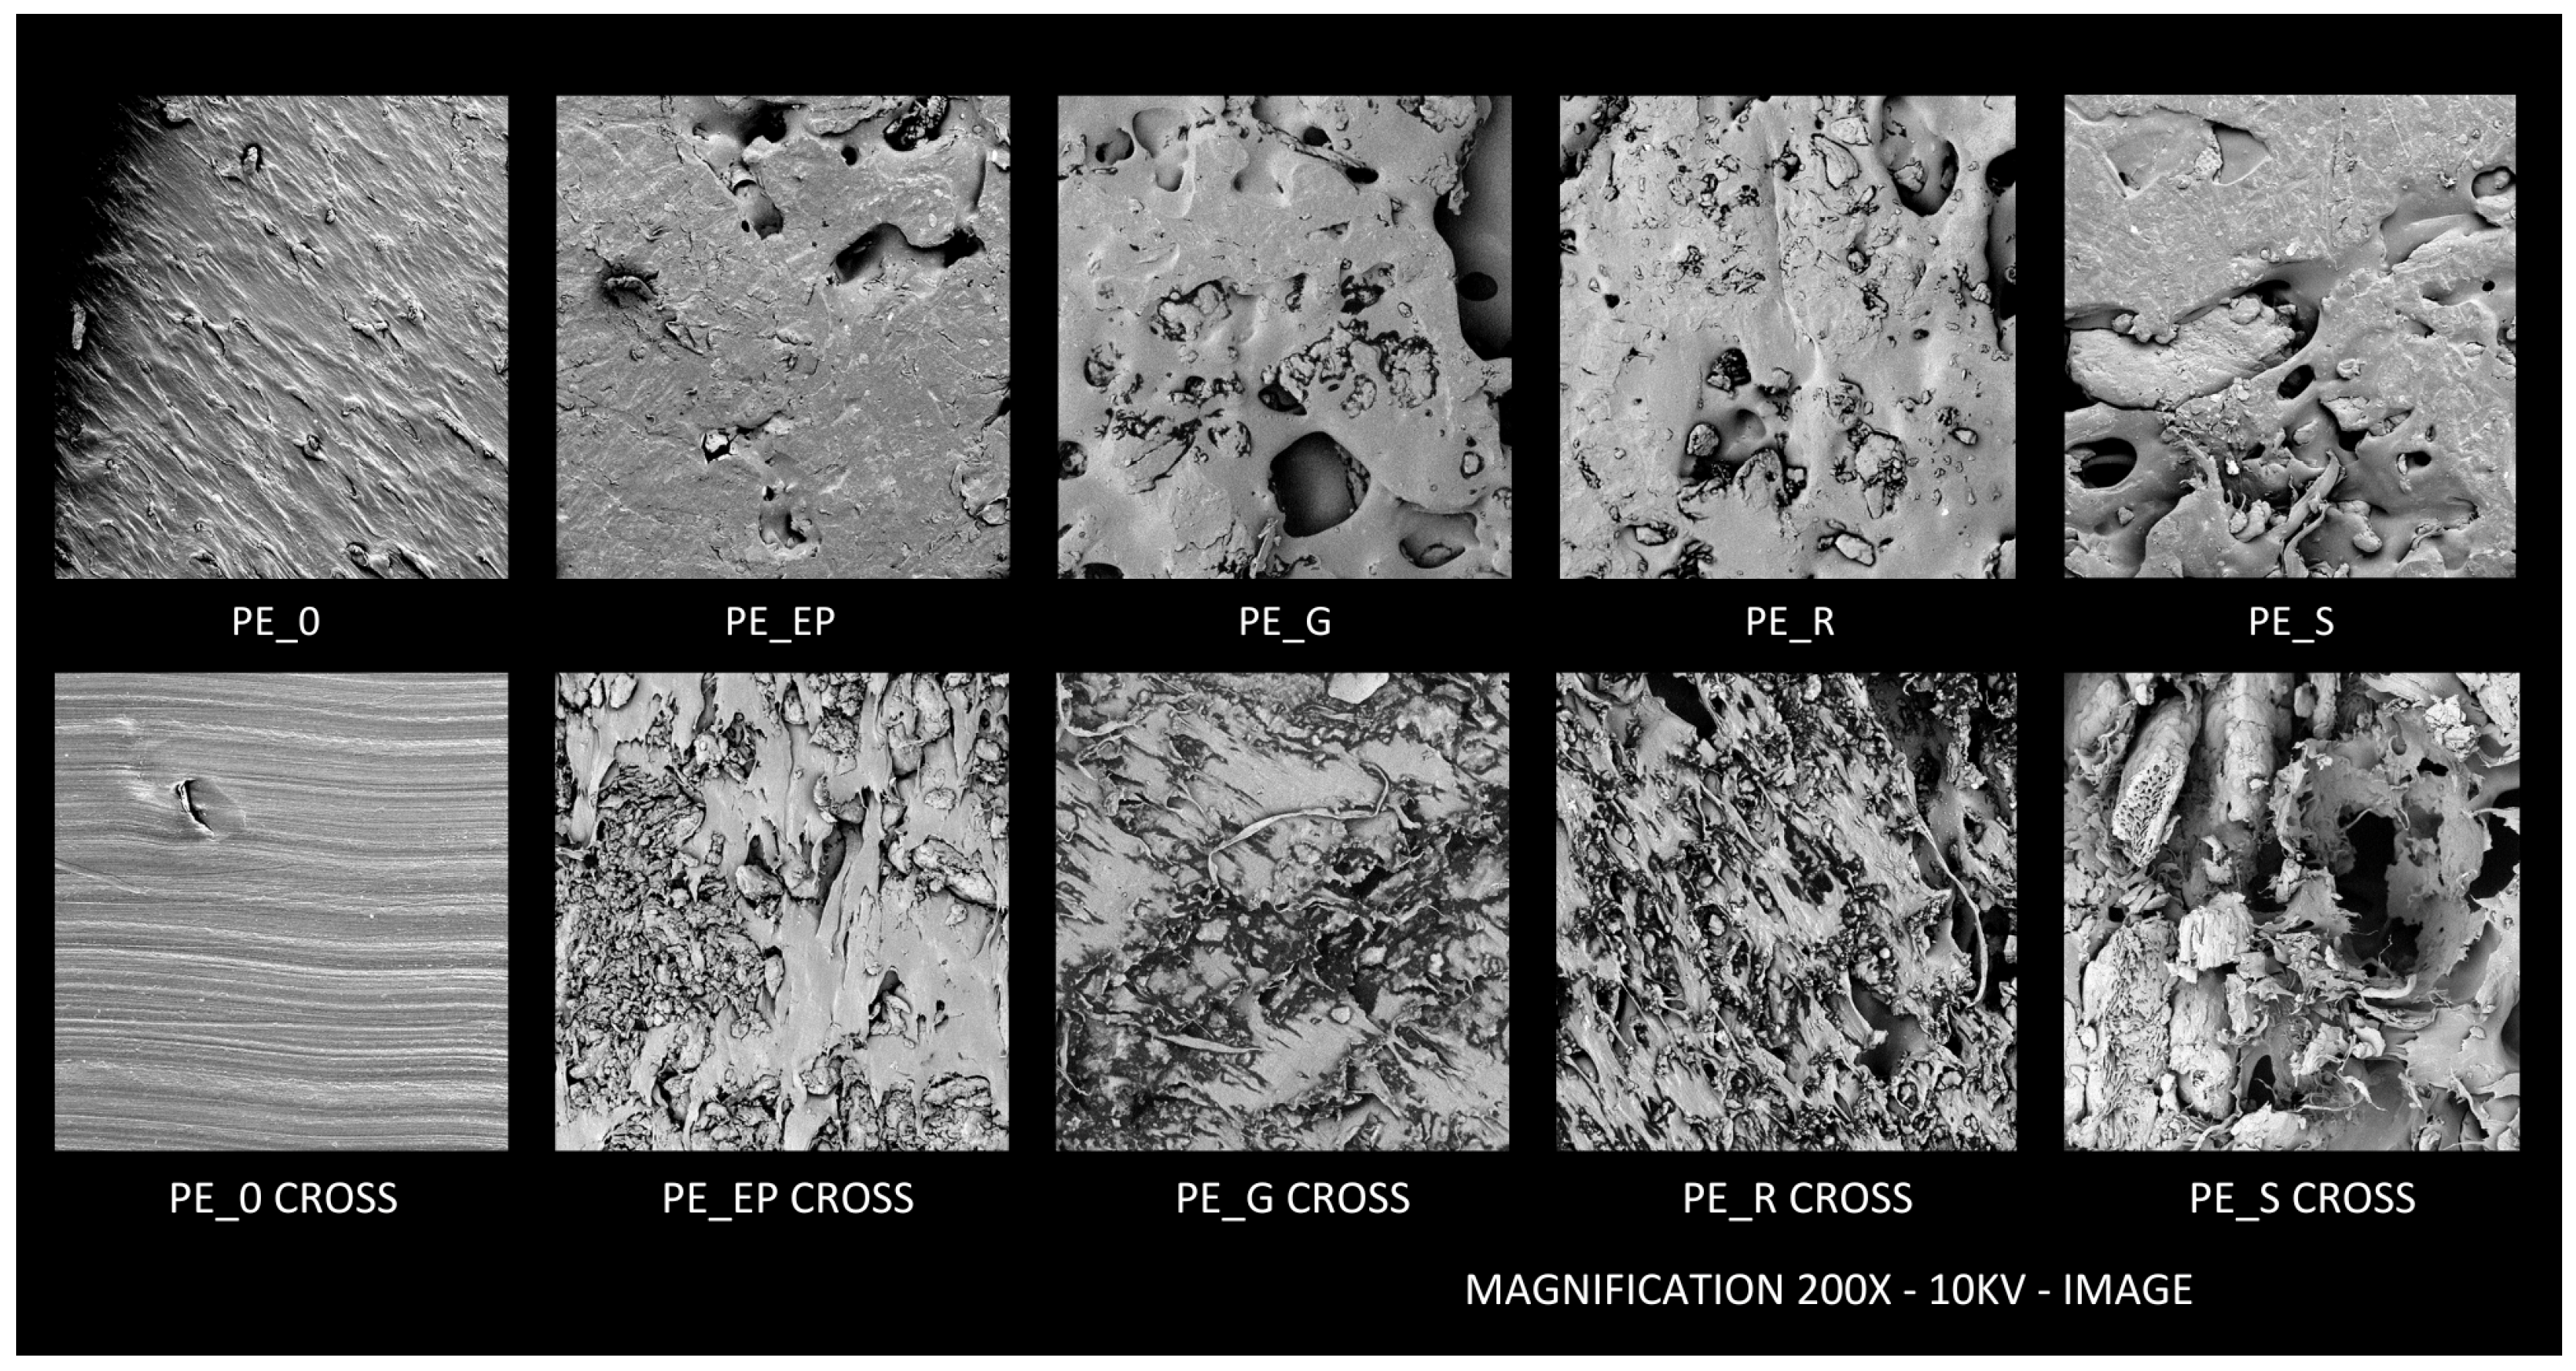
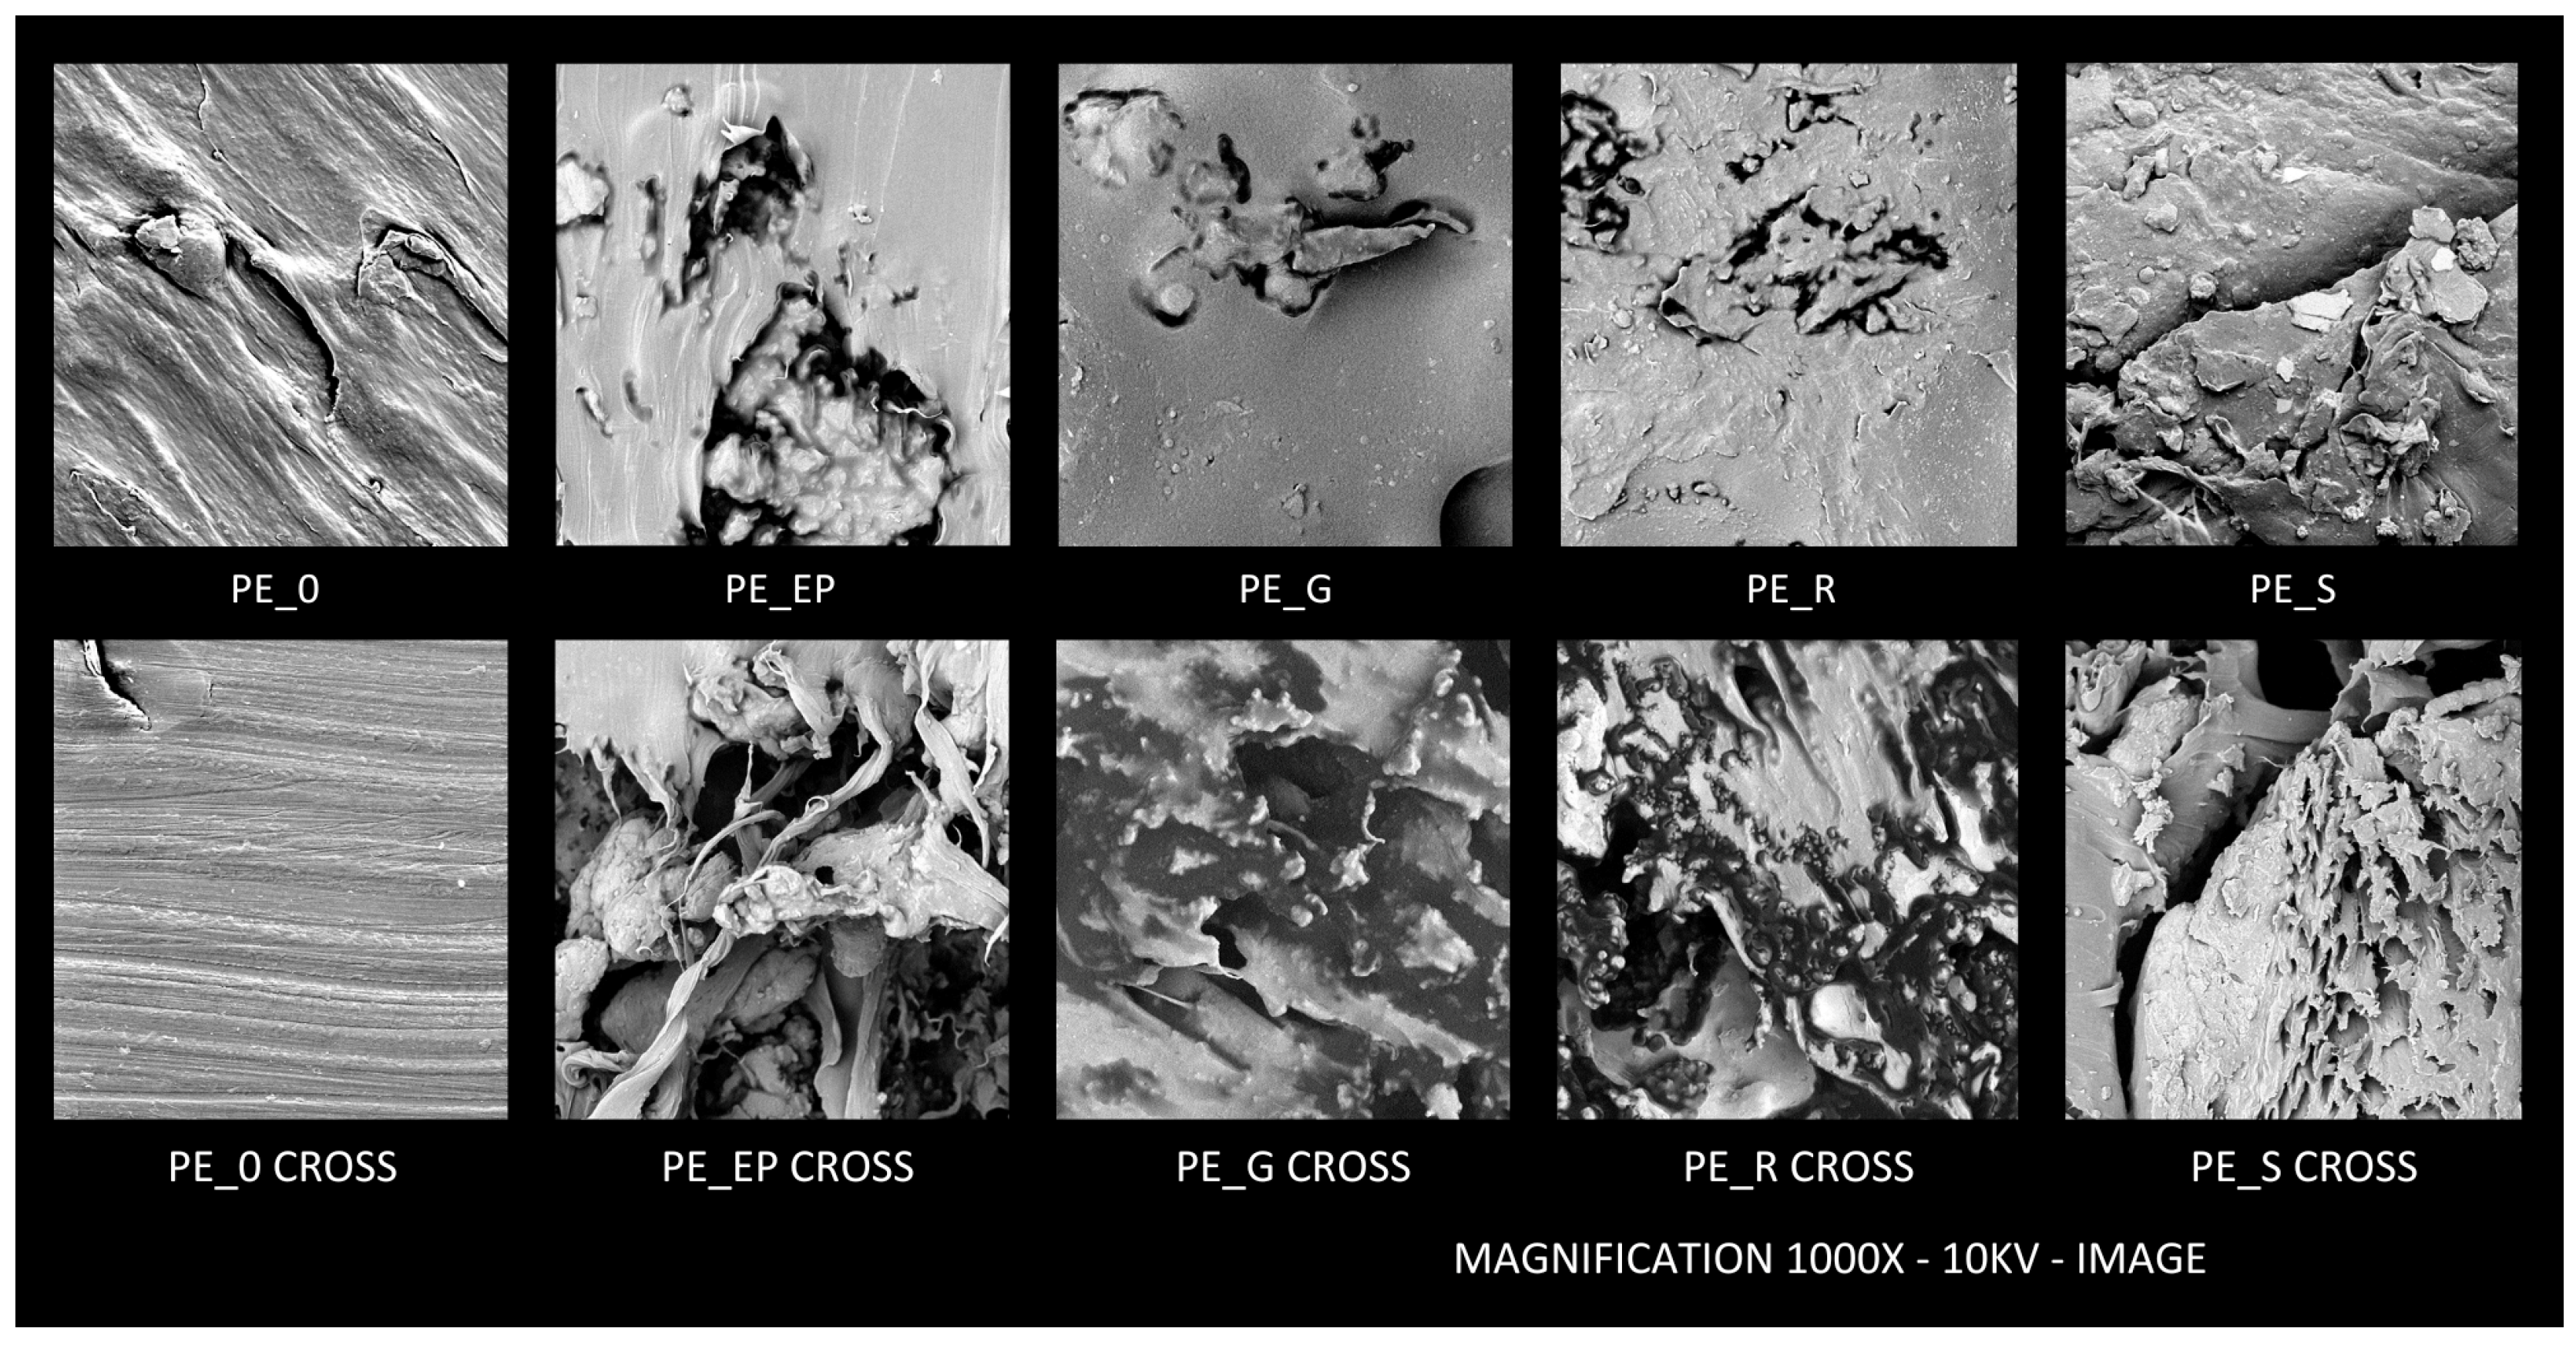
Thermogravimetric analysis (TGA) measures the change in mass of a material as a function of temperature or time under a controlled atmosphere. TGA can provide insights into the thermal stability, composition, and degradation behavior of materials. The results of the tests performed in oxygen are presented in Figure 13, and those performed in nitrogen in Figure 14. The composites (PE_EP, PE_G, PE_R, PE_S) exhibit different thermal profiles. The onset of degradation for these composites is slightly earlier than pure PE. Around 360 °C to 380 °C, a sudden weight loss can be observed in the composites, especially PE_R and PE_EP. The PE_S composite is less stable. The incorporation of lignocellulosic residues into the PE reduces the thermal stability of the composite.
Degradation in a nitrogen atmosphere (without oxidation) is more stable and uniform for polyethylene (PE) and its composites. The onset of degradation is earlier for the composites in nitrogen compared to pure PE. The various chemical composition of lignocellulosic fillers, in comparison to pure PE, resulted in a higher final residue amount.

3.7. SEM Analysis

The results of the SEM observations of the surface and cross-section of pure polyethylene samples and composites are presented in Figure 15 at 200× magnification and in Figure 16 at 1000× magnification. Analysis reveals noticeable voids between the polyethylene matrix and the lignocellulosic particles, indicating poor adhesion at the interface. This lack of effective bonding is further evidenced by the presence of these voids, which suggest suboptimal interaction between the polymer and the reinforcing fibers. Additionally, the SEM images show that the surface of the composites is characterized by pronounced roughness due to the protruding lignocellulosic particles. This surface roughness is a direct consequence of the incomplete integration of the particles within the polymer matrix, which impacts the overall mechanical properties and performance of the composites.

3.8. Growth of Fungi

The results of the degree of surface overgrowth by fungi are presented in Figure 17 for Trichoderma viride and in Figure 18 for Chaetomium globosum. Figure 19 presents examples of mold growth for Trichoderma viride and Figure 20 for Chaetomium globosum. In the case of Trichoderma viride, all variants except for the control sample were fully covered (100%) within 5 days post-inoculation. The initial growth rate was similar across all variants and the control. The pure polyethylene sample reached about 50% coverage when the other samples had already achieved 100% coverage. Among the composite variants, the PE_R variant exhibited the slowest initial growth rate. While Trichoderma viride partially covered the surface of the pure polyethylene sample, the degree of degradation was not assessed, so it can only be concluded that the fungus appeared on the sample surface.
For Chaetomium globosum, this fungus did not colonize the pure polyethylene sample at all. The growth curves for the other composites followed similar shapes but with different timing. The PE_EP composite was the first to reach full coverage, followed by PE_R, PE_S, and lastly PE_G. The PE_EP composite achieved 100% coverage within approximately 5 days, whereas all other composites reached 100% by day 10. Fungi are more likely to colonize materials with natural filler due to the presence of organic matter, which serves as a nutrient source. The presence of plant residue fillers in polyethylene composites significantly enhances the fungal overgrowth rate compared to pure polyethylene, which may be an indicator of their biodegradation.

4. Conclusions

The results of this study reveal that the inclusion of oil plant pomace as a filler in HDPE significantly impacts the material properties of the resulting composites. Despite generally causing a reduction in the strength parameters, in the case of the PE_EP composite, these parameters were relatively acceptable. The optimization of the manufacturing process to prevent the outflow of material is crucial for maintaining the intended density of the composite. Achieving the target density is likely to enhance the mechanical strength and surface roughness indicators, judging by the results obtained for the PE_EP variant. To improve the mechanical properties further, the use of adhesion promoters could be a promising strategy. While the increased water absorption and thickness swelling were anticipated, significant statistical variability in these results was observed. Achieving the target density through parameter optimization and the use of adhesion promoters could help standardize these properties. Utilizing pomace from oil plants contributes to the recycling of agricultural waste, promoting environmental sustainability and reducing the volume of waste that would otherwise need to be managed or disposed of. The other advantage is the low cost of these materials. Additionally, the susceptibility of the composites to colonization by cellulolytic fungi is a positive indicator of biodegradability. While pomace can enhance biodegradability, it may also lead to a reduction in the longevity of the composites, which could be a drawback for applications requiring long-term durability. Other potential disadvantages include mechanical parameters, decreased water resistance, and reduced thermal stability. Overall, the use of pomace from oil plants in composites offers a promising approach for creating more sustainable materials, though it is important to carefully manage and optimize the formulation to control the potential obstacles and achieve the desired performance characteristics.

Author Contributions

Conceptualization, I.B. and P.B.; methodology, I.B., P.B., K.R. and M.N.; software, I.B. and K.L.; validation, I.B., K.L. and P.B.; formal analysis, K.L. investigation, K.L. and I.B.; resources, I.B. and K.L.; data curation, I.B.; writing—original draft preparation, K.L. and I.B.; writing—review and editing, M.N. and P.B.; visualization, K.L.; supervision, I.B. and P.B.; project administration, I.B., K.L. and P.B.; funding acquisition, P.B. All authors have read and agreed to the published version of the manuscript.

Funding

This research received no external funding.

Institutional Review Board Statement

Not applicable.

Informed Consent Statement

Not applicable.

Data Availability Statement

The original contributions presented in the study are included in the article, further inquiries can be directed to the corresponding author..

Acknowledgments

The authors of the publication would like to thank Leszek Danecki from the Research & Development Center for Wood-Based Panels sp. z o. o., in Czarna Woda, for the preparation of biocomposites, and the Institute of Wood Sciences and Furniture, Warsaw University of Life Sciences, for their support in financing the research from the science development fund.

Conflicts of Interest

The authors declare no conflicts of interest.

References

  1. Lopez Barrera, E.; Hertel, T. Global Food Waste across the Income Spectrum: Implications for Food Prices, Production and Resource Use. Food Policy 2021, 98, 101874. [Google Scholar] [CrossRef]
  2. Vastola, A.; Viccaro, M.; Grippo, V.; Genovese, F.; Romano, S.; Cozzi, M. The Decoupling Effect in Italian Agricultural Waste: An Empirical Analysis. Sustainability 2023, 15, 16596. [Google Scholar] [CrossRef]
  3. Onu-Okpara, I.Q.; Oranusi, S.; Okagbue, H. Production of Probiotic-Fortified Composite Poultry Feed from Food and Agricultural Waste Material. J. Adv. Vet. Anim. Res. 2019, 6, 544–548. [Google Scholar] [CrossRef] [PubMed]
  4. Sugiura, K.; Yamatani, S.; Watahara, M.; Onodera, T. Ecofeed, animal feed produced from recycled food waste. Vet. Ital. 2009, 45, 397–404. [Google Scholar]
  5. Chiaraluce, G.; Bentivoglio, D.; Finco, A. The Circular Economy Model in the Agri Food Sector: A New Strategy for the Regional Development. AIMS Agric. Food 2023, 8, 851–872. [Google Scholar] [CrossRef]
  6. Dzepe, D.; Kuietche, H.M.; Magatsing, O.; Meutchieye, F.; Nana, P.; Tchuinkam, T.; Djouaka, R. From Agricultural Waste to Chicken Feed Using Insect-Based Technology. J. Basic Appl. Zool. 2023, 84, 18. [Google Scholar] [CrossRef]
  7. Barus, J.; Mustikawati, D.R.; Endriani; Meithasari, D.; Ernawati, R.; Wardani, N.; Soraya; Suretno, N.D.; Tambunan, R.D.; Silalahi, M. Evaluation of Composting of Several Plant Biomass Wastes with Different Types of Starters. Int. J. Recycl. Org. Waste Agric. 2023, 12, 503–514. [Google Scholar] [CrossRef]
  8. Panchami, P.S.; Gunasekaran, S. Extraction and Characterization of Pectin from Fruit Waste. Int. J. Curr. Microbiol. Appl. Sci. 2017, 6, 943–948. [Google Scholar] [CrossRef]
  9. Pourbafrani, M.; Forgács, G.; Horváth, I.S.; Niklasson, C.; Taherzadeh, M.J. Production of Biofuels, Limonene and Pectin from Citrus Wastes. Bioresour. Technol. 2010, 101, 4246–4250. [Google Scholar] [CrossRef]
  10. Ojewumi, M.E.; Emetere, M.E.; Amaefule, C.V.; Durodola, B.M.; Adeniyi, O.D. Bioconversion of orange peel waste by escherichia coli and saccharomyces cerevisiae to ethanol. Int. J. Pharm. Sci. Res. 2019, 10, 1246. [Google Scholar] [CrossRef]
  11. Perea-Moreno, M.A.; Manzano-Agugliaro, F.; Perea-Moreno, A.J. Sustainable Energy Based on Sunflower Seed Husk Boiler for Residential Buildings. Sustainability 2018, 10, 3407. [Google Scholar] [CrossRef]
  12. Grzelczyk, J.; Oracz, J.; Gałązka-Czarnecka, I. Quality Assessment of Waste from Olive Oil Production and Design of Biodegradable Packaging. Foods 2022, 11, 3776. [Google Scholar] [CrossRef] [PubMed]
  13. Mohanty, A.; Mankoti, M.; Rout, P.R.; Meena, S.S.; Dewan, S.; Kalia, B.; Varjani, S.; Wong, J.W.C.; Banu, J.R. Sustainable Utilization of Food Waste for Bioenergy Production: A Step towards Circular Bioeconomy. Int. J. Food Microbiol. 2022, 365, 109538. [Google Scholar] [CrossRef] [PubMed]
  14. Liu, H.; Chen, Y. Supporting Information Enhanced Methane Production from Food Waste Using Cysteine to Increase Biotransformation of L-Monosaccharide, VFA and Bio-Hydrogen. Environ. Sci. Technol. 2018, 52, 3777–3785. [Google Scholar] [CrossRef]
  15. Javourez, U.; O’Donohue, M.; Hamelin, L. Waste-to-Nutrition: A Review of Current and Emerging Conversion Pathways. Biotechnol. Adv. 2021, 53, 107857. [Google Scholar] [CrossRef]
  16. Raboanatahiry, N.; Li, H.; Yu, L.; Li, M. Rapeseed (Brassica napus): Processing, Utilization, and Genetic Improvement. Agronomy 2021, 11, 1776. [Google Scholar] [CrossRef]
  17. Khaksar, G.; Sirijan, M.; Suntichaikamolkul, N.; Sirikantaramas, S. Metabolomics for Agricultural Waste Valorization: Shifting Toward a Sustainable Bioeconomy. Front. Plant Sci. 2022, 13, 938480. [Google Scholar] [CrossRef]
  18. Esposito, T.; Paolucci, M.; Sansone, F.; Mencherini, T.; Pacifico, S.; Volpe, M.G. Exploitation and Valorization of Agro-Food Wastes from Grape Harvesting: Production, Characterization of Mae-Extracts from Vitis Vinifera Leaves and Stabilization in Microparticulate Powder Form. Appl. Sci. 2021, 11, 5827. [Google Scholar] [CrossRef]
  19. Rajendran, N.; Han, J. Integrated Polylactic Acid and Biodiesel Production from Food Waste: Process Synthesis and Economics. Bioresour. Technol. 2022, 343, 126119. [Google Scholar] [CrossRef] [PubMed]
  20. Balasuriya, P.W.; Ye, L.; Mai, Y.W.; Wu, J. Mechanical Properties of Wood Flake-Polyethylene Composites. II. Interface Modification. J. Appl. Polym. Sci. 2002, 83, 2505–2521. [Google Scholar] [CrossRef]
  21. Caton, P.A.; Carr, M.A.; Kim, S.S.; Beautyman, M.J. Energy Recovery from Waste Food by Combustion or Gasification with the Potential for Regenerative Dehydration: A Case Study. Energy Convers. Manag. 2010, 51, 1157–1169. [Google Scholar] [CrossRef]
  22. Johari, A.; Ahmed, S.I.; Hashim, H.; Alkali, H.; Ramli, M. Economic and Environmental Benefits of Landfill Gas from Municipal Solid Waste in Malaysia. Renew. Sustain. Energy Rev. 2012, 16, 2907–2912. [Google Scholar] [CrossRef]
  23. Mizielińska, M.; Lisiecki, S. Coating of Polylactide Films to Generate Their Antimicrobial Properties Powlekanie Folii Polilaktydowej w Celu Nadania Jej Właściwości Antymikrobowych. Przemysł Chem. 2015, 94, 752–755. [Google Scholar] [CrossRef]
  24. Takács, K.; Pregi, E.; Vági, E.; Renkecz, T.; Tátraaljai, D.; Pukánszky, B. Processing Stabilization of Polyethylene with Grape Peel Extract: Effect of Extraction Technology and Composition. Molecules 2023, 28, 1011. [Google Scholar] [CrossRef] [PubMed]
  25. Hafeez, M.A.; Maan, A.A.; Butt, M.S.; Zia, M.A. Development and Characterization of Biodegradable Food Packaging Films from Food Industrial Wastes. Pak. J. Agric. Sci. 2021, 58, 609–619. [Google Scholar] [CrossRef]
  26. Spiridon, I.; Ursu, R.G.; Spiridon, I.A.C. New Polylactic Acid Composites for Packaging Applications: Mechanical Properties, Thermal Behavior, and Antimicrobial Activity. Int. J. Polym. Anal. Charact. 2015, 20, 681–692. [Google Scholar] [CrossRef]
  27. Gowman, A.; Rodriguez-Uribe, A.; Defersha, F.; Mohanty, A.K.; Misra, M. Statistical Design of Sustainable Composites from Poly(Lactic Acid) and Grape Pomace. J. Appl. Polym. Sci. 2020, 137, 49061. [Google Scholar] [CrossRef]
  28. Bruna, J.E.; Castillo, M.; López de Dicastillo, C.; Muñoz-Shugulí, C.; Lira, M.; Guarda, A.; Rodríguez-Mercado, F.J.; Galotto, M.J. Development of Active Biocomposite Films Based on Poly(Lactic Acid) and Wine by-Product: Effect of Grape Pomace Content and Extrusion Temperature. J. Appl. Polym. Sci. 2023, 140, e54425. [Google Scholar] [CrossRef]
  29. Banat, R. Olive Pomace Flour as Potential Organic Filler in Composite Materials: A Brief Review. Am. J. Polym. Sci. 2019, 9, 10–15. [Google Scholar] [CrossRef]
  30. Oulidi, O.; Nakkabi, A.; Elaraaj, I.; Fahim, M.; Moualij, N. El Incorporation of Olive Pomace as a Natural Filler in to the PA6 Matrix: Effect on the Structure and Thermal Properties of Synthetic Polyamide 6. Chem. Eng. J. Adv. 2022, 12, 100399. [Google Scholar] [CrossRef]
  31. Luo, Z.; Li, P.; Cai, D.; Chen, Q.; Qin, P.; Tan, T.; Cao, H. Comparison of Performances of Corn Fiber Plastic Composites Made from Different Parts of Corn Stalk. Ind. Crops Prod. 2017, 95, 521–527. [Google Scholar] [CrossRef]
  32. Castrillón, H.D.C.; Aguilar, C.M.G.; Álvarez, B.E.A. Circular Economy Strategies: Use of Corn Waste to Develop Biomaterials. Sustainability 2021, 13, 8356. [Google Scholar] [CrossRef]
  33. Pratheep, V.G.; Priyanka, E.B.; Thangavel, S.; Gousanal, J.J.; Antony, P.T.B.; Kavin, E.D. Investigation and Analysis of Corn Cob, Coir Pith with Wood Plastic. Mater. Today-Proc. 2021, 45, 549–555. [Google Scholar] [CrossRef]
  34. Chong, T.Y.; Law, M.C.; Chan, Y.S. The Potentials of Corn Waste Lignocellulosic Fibre as an Improved Reinforced Bioplastic Composites. J. Polym. Environ. 2021, 29, 363–381. [Google Scholar] [CrossRef]
  35. Shen, T.; Li, M.; Zhang, B.; Zhong, L.; Lin, X.; Yang, P.; Li, M.; Zhuang, W.; Zhu Chenjie and Ying, H. Enhanced Mechanical Properties of Polyvinyl Chloride-Based Wood-Plastic With Pretreated Corn Stalk. Front. Bioeng. Biotechnol. 2022, 9, 829821. [Google Scholar] [CrossRef]
  36. Lipska, K.; Ufnowski, P. Corn Pomace as a Substitute for Wood Raw Material in Lignocellulosiccomposite Technology. Ann. WULS For. Wood Technol. 2023, 123, 109–117. [Google Scholar] [CrossRef]
  37. Lipska, K.; Goławski, S. Flax Pomace as a Substitute for Wood Raw Material in Lignocellulosiccomposite Technology. Ann. WULS For. Wood Technol. 2023, 123, 86–95. [Google Scholar] [CrossRef]
  38. Khedr, R.F.; Elnahas, H.H. Preparation of Wood Plastic Composite from Flax Fibers and Post Consumed Foam Based on Environmental and Economical Scales. J. Thermoplast. Compos. Mater. 2024, 37, 869–884. [Google Scholar] [CrossRef]
  39. Gursoy, M.; Sargin, I.; Mujtaba, M.; Akyuz, B.; Ilk, S.; Akyuz, L.; Kaya, M.; Cakmak, Y.S.; Salaberria, A.M.; Labidi, J.; et al. False Flax (Camelina Sativa) Seed Oil as Suitable Ingredient for the Enhancement of Physicochemical and Biological Properties of Chitosan Films. Int. J. Biol. Macromol. 2018, 114, 1224–1232. [Google Scholar] [CrossRef]
  40. Jeffrey, J.A.; Sivakumar, A.; Kumar, R.N.; Anbazhagan, A.; Manojkumar, G.; Al Obaid, S.; Alfarraj, S.; Sivakumar, S.; Rajkumar, S. Influence of Flax Fibre Hybridization on Mechanical Behaviour of Sisal Fibre-Polypropylene Composites Prepared with an Injection Moulding Machine. Adv. Mater. Sci. Eng. 2021, 2021, 4594465. [Google Scholar] [CrossRef]
  41. Van Thiem, Q.; Nguyen, V.-T.; Phan, D.T.T.; Minh, P.S. Injection Molding Condition Effects on the Mechanical Properties Of-Wood-Powder-Based Polymer Composite. Polymer 2024, 16, 1225. [Google Scholar] [CrossRef]
  42. Pradhan, S.K.; Dwarakadasa, E.S.; Reucroft, P.J. Processing and Characterization of Coconut Shell Powder Filled UHMWPE. Mater. Sci. Eng. A 2004, 367, 57–62. [Google Scholar] [CrossRef]
  43. Nadzri, S.N.I.H.A.; Sultan, M.T.H.; Shah, A.U.M.; Safri, S.N.A.; Talib, A.R.A.; Jawaid, M.; Basri, A.A. A Comprehensive Review of Coconut Shell Powder Composites: Preparation, Processing, and Characterization. J. Thermoplast. Compos. Mater. 2022, 35, 2641–2664. [Google Scholar] [CrossRef]
  44. Liminana, P.; Garcia-Sanoguera, D.; Quiles-Carrillo, L.; Balart, R.; Montanes, N. Development and Characterization of Environmentally Friendly Composites from Poly(Butylene Succinate) (PBS) and Almond Shell Flour with Different Compatibilizers. Compos. B Eng. 2018, 144, 153–162. [Google Scholar] [CrossRef]
  45. Ivorra-Martinez, J.; Manuel-Mañogil, J.; Boronat, T.; Sanchez-Nacher, L.; Balart, R.; Quiles-Carrillo, L. Development and Characterization of Sustainable Composites from Bacterial Polyester Poly(3-Hydroxybutyrate-Co-3-Hydroxyhexanoate) and Almond Shell Flour by Reactive Extrusion with Oligomers of Lactic Acid. Polymer 2020, 12, 1097. [Google Scholar] [CrossRef] [PubMed]
  46. Ramos, M.; Dominici, F.; Luzi, F.; Jiménez, A.; Garrigós, M.C.; Torre, L.; Puglia, D. Effect of Almond Shell Waste on Physicochemical Properties of Polyester-Based Biocomposites. Polymer 2020, 12, 835. [Google Scholar] [CrossRef] [PubMed]
  47. García, A.I.; García, A.M.; Bou, S.F. Study of the Influence of the Almond Shell Variety Onthe Mechanical Properties of Starch-Basedpolymer Biocomposites. Polymer 2020, 12, 2049. [Google Scholar] [CrossRef]
  48. Ferrer, A.; Salas, C.; Rojas, O.J. Physical, Thermal, Chemical and Rheological Characterization of Cellulosic Microfibrils and Microparticles Produced from Soybean Hulls. Ind. Crops Prod. 2016, 84, 337–343. [Google Scholar] [CrossRef]
  49. Balla, V.K.; Tadimeti, J.G.D.; Kate, K.H.; Satyavolu, J. 3D Printing of Modified Soybean Hull Fiber/Polymer Composites. Mater. Chem. Phys. 2020, 254, 123452. [Google Scholar] [CrossRef]
  50. Nanda, M.R.; Misra, M.; Mohanty, A.K. Mechanical Performance of Soy-Hull-Reinforced Bioplastic Green Composites: A Comparison with Polypropylene Composites. Macromol. Mater. Eng. 2012, 297, 184–194. [Google Scholar] [CrossRef]
  51. Sivakumar, A.; Srividhya, S.; Prakash, R.; Subbarayan, M.R. Exploring the Effects of Eco-Friendly and Biodegradable Biocomposite with PLA Incorporating Eggshell and Walnut Powder as Fillers. Glob. Nest J. 2024, 26, 1–6. [Google Scholar] [CrossRef]
  52. Chaturvedi, A.; Ranakoti, L.; Rakesh, P.K.; Mishra, N.K. Experimental Investigations on Mechanical Properties of Walnut Shell And Pine Needle Ash Polylactic Acid Biocomposites. Compos. Theory Pract. 2021, 21, 114–120. [Google Scholar]
  53. Karagöz, İ. Production and Characterization of Sustainable Biocompatible PLA/Walnut Shell Composite Materials. Polym. Bull. 2024, 81, 11517–11537. [Google Scholar] [CrossRef]
  54. Orue, A.; Eceiza, A.; Arbelaiz, A. The Use of Alkali Treated Walnut Shells as Filler in Plasticized Poly(Lactic Acid) Matrix Composites. Ind. Crops Prod. 2020, 145, 111993. [Google Scholar] [CrossRef]
  55. Song, X.; Guan, W.; Qin, H.; Han, X.; Wu, L.; Ye, Y. Properties of Poly(Lactic Acid)/Walnut Shell/Hydroxyapatite Composites Prepared with Fused Deposition Modeling. Sci. Rep. 2022, 12, 11563. [Google Scholar] [CrossRef] [PubMed]
  56. Betlej, I.; Borysiuk, P.; Borysiak, S.; Rybak, K.; Nowacka, M.; Barlak, M.; Andres, B.; Krajewski, K.; Lipska, K.; Cebulak, T.; et al. Pomace from Oil Plants as a New Type of Raw Material for the Production of Environmentally Friendly Biocomposites. Coatings 2023, 13, 1722. [Google Scholar] [CrossRef]
  57. EN 323:1999; Wood-Based Panels—Determination of Density. ISO: Geneva, Switzerland, 1999.
  58. EN 310:1994; Wood-Based Panels—Determination of Modulus of Elasticity in Bending and of Bending Strength. ISO: Geneva, Switzerlan, 1994.
  59. EN ISO 21920-2:2022-06; Product Geometry Specifications (GPS)—Geometric Structure of Surfaces: Profile—Part 2: Terms, Definitions and Parameters of Geometric Structure of Surfaces. ISO: Geneva, Switzerlan, 2022.
  60. EN 317:1999; Particleboards and Fiberboards—Determination of Swelling to Thickness after Immersion in Water. European Committee for Standardization: Brussels, Belgium, 1999.
  61. FTIR Functional Group Database Table with Search—InstaNANO. Available online: https://instanano.com/all/characterization/ftir/ftir-functional-group-search/ (accessed on 30 June 2024).
  62. Stokke, D.D.; Wu, Q.; Han, G. Introduction to Wood and Natural Fiber Composites; Wiley Series in Renewable Resources; John Wiley & Sons: Hoboken, NJ, USA, 2013. [Google Scholar]
  63. Patsiaoura, D.; Tarani, E.; Bikiaris, D.N.; Pavlidou, E.; Chrissafis, K. Lignocellulosic-Based/High Density Polyethylene Composites: A Comprehensive Study on Fiber Characteristics and Performance Evaluation. Appl. Sci. 2024, 14, 3582. [Google Scholar] [CrossRef]
  64. Meekum, U. Manufacturing of Wood Plastic Composite from Polyethylene/Poly(Ethylene Terephthalate) Waste/Ultra High Molecular Weight Polyethylene Blends and Rice Husk Fiber: Raw Materials Preparation and Preliminary Processing Investigation. Bioresources 2023, 18, 1293–1329. [Google Scholar] [CrossRef]
  65. Khan, A.; Mishra, A.; Patidar, R.; Pappu, A. Effect of Lignocellulosic Corn Stalk on Mechanical, Physical, and Thermal Properties of Injection Moulded Low Density Polyethylene Composites: An Approach towards a Circular Economy. Heliyon 2024, 10, e25287. [Google Scholar] [CrossRef]
  66. Hasanin, M.S.; Abd El-Aziz, M.E.; El-Nagar, I.; Hassan, Y.R.; Youssef, A.M. Green Enhancement of Wood Plastic Composite Based on Agriculture Wastes Compatibility via Fungal Enzymes. Sci. Rep. 2022, 12, 19197. [Google Scholar] [CrossRef]
  67. Berger, C.; Mattos, B.D.; Amico, S.C.; Antonio De Farias, J.; Coldebella, R.; Gatto, D.A.; Missio, A.L. Production of Sustainable Polymeric Composites Using Grape Pomace Biomass. Biomass Convers. Biorefinery 2022, 12, 5869–5880. [Google Scholar] [CrossRef]
  68. Mishra, M.; Duan, B. The Essential Handbook of Polymer Terms and Attributes; CRC Press: Boca Raton, FL, USA, 2024. [Google Scholar]
  69. Smith, B.C. Infrared Spectral Interpretation: A Systematic Approach; CRC Press: Boca Raton, FL, USA, 1998; ISBN 0849324637. [Google Scholar]
  70. Gulmine, J.V.; Janissek, P.R.; Heise, H.M.; Akcelrud, L. Polyethylene Characterization by FTIR. Polym. Test. 2002, 21, 557–563. [Google Scholar] [CrossRef]
  71. Smith, B.C. The Infrared Spectra of Polymers II: Polyethylene. Spectroscopy 2021, 36, 24–29. [Google Scholar] [CrossRef]
  72. Fernandes, E.M.; Mano, J.F.; Reis, R.L. Polyethylene Composites with Lignocellulosic Material. In Polyethylene-Based Blends, Composites and Nanocomposites; John Wiley & Sons: Hoboken, NJ, USA, 2015; pp. 117–161. [Google Scholar]
  73. Patel, A.R. (Ed.) Edible Oil Structuring: Concepts, Methods and Applications; The Royal Society of Chemistry: London, UK, 2017; ISBN 978-1-78262-829-3. [Google Scholar]
  74. Kaur, K.; Kaur, R.; Kaur, H. A Systematic Review of Lignocellulosic Biomass for Remediation of Environmental Pollutants. Appl. Surf. Sci. Adv. 2024, 19, 100547. [Google Scholar] [CrossRef]
  75. Yuzhen, L.; Changwen, D.; Yanqiu, S.; Jianmin, Z. Characterization of Rapeseed Oil Using FTIR-ATR Spectroscopy. J. Food Sci. Eng. 2014, 4, 244–249. [Google Scholar] [CrossRef]
  76. Radu, M.C.; Tampu, R.; Nedeff, V.; Patriciu, O.I.; Schnakovszky, C.; Herghelegiu, E. Experimental Investigation of Stability of Vegetable Oils Used as Dielectric Fluids for Electrical Discharge Machining. Processes 2020, 8, 1187. [Google Scholar] [CrossRef]
  77. Agatonovic-Kustrin, S.; Ristivojevic, P.; Gegechkori, V.; Litvinova, T.M.; Morton, D.W. Essential Oil Quality and Purity Evaluation via Ft-Ir Spectroscopy and Pattern Recognition Techniques. Appl. Sci. 2020, 10, 7294. [Google Scholar] [CrossRef]
  78. Kondo, T. The Assignment of IR Absorption Bands Due to Free Hydroxyl Groups in Cellulose. Cellulose 1997, 4, 281–292. [Google Scholar] [CrossRef]
  79. Hospodarova, V.; Singovszka, E.; Stevulova, N.; Hospodarova, V.; Singovszka, E.; Stevulova, N. Characterization of Cellulosic Fibers by FTIR Spectroscopy for Their Further Implementation to Building Materials. Am. J. Anal. Chem. 2018, 9, 303–310. [Google Scholar] [CrossRef]
  80. Bruun, S.W.; Kohler, A.; Adt, I.; Sockalingum, G.D.; Manfait, M.; Martens, H. Correcting Attenuated Total Reflection-Fourier Transform Infrared Spectra for Water Vapor and Carbon Dioxide. Appl. Spectrosc. 2006, 60, 1029–1039. [Google Scholar] [CrossRef]
  81. Bakhattar, I.; Asbik, M.; Koukouch, A.; Aadnan, I.; Zegaoui, O.; Belandria, V.; Bonnamy, S.; Sarh, B. Physicochemical Characterization, Thermal Analysis and Pyrolysis Kinetics of Lignocellulosic Biomasses. Biofuels 2023, 14, 1015–1026. [Google Scholar] [CrossRef]
  82. Zhang, H.; Ma, J.; Miao, Y.; Tuchiya, T.; Chen, J.Y. Analysis of Carbonyl Value of Frying Oil by Fourier Transform Infrared Spectroscopy. J. Oleo Sci. 2015, 64, 375–380. [Google Scholar] [CrossRef] [PubMed]
  83. Kotilainen, R.A.; Toivanen, T.J.; Alén, R.J. FTIR Monitoring of Chemical Changes in Softwood during Heating. J. Wood Chem. Technol. 2000, 20, 307–320. [Google Scholar] [CrossRef]
  84. Apaydın Varol, E.; Mutlu, Ü. TGA-FTIR Analysis of Biomass Samples Based on the Thermal Decomposition Behavior of Hemicellulose, Cellulose, and Lignin. Energies 2023, 16, 3674. [Google Scholar] [CrossRef]
  85. Sikora, A.; Kačík, F.; Gaff, M.; Vondrová, V.; Bubeníková, T.; Kubovský, I. Impact of Thermal Modification on Color and Chemical Changes of Spruce and Oak Wood. J. Wood Sci. 2018, 64, 406–416. [Google Scholar] [CrossRef]
  86. Windeisen, E.; Wegener, G. Behaviour of Lignin during Thermal Treatments of Wood. Ind. Crops Prod. 2008, 27, 157–162. [Google Scholar] [CrossRef]
  87. Liu, Y.; Hu, T.; Wu, Z.; Zeng, G.; Huang, D.; Shen, Y.; He, X.; Lai, M.; He, Y. Study on Biodegradation Process of Lignin by FTIR and DSC. Environ. Sci. Pollut. Res. 2014, 21, 14004–14013. [Google Scholar] [CrossRef]
  88. Hao, Y.; Pan, Y.; Du, R.; Wang, Y.; Chen, Z.; Zhang, X.; Wang, X. The Influence of a Thermal Treatment on the Decay Resistance of Wood via FTIR Analysis. Adv. Mater. Sci. Eng. 2018, 2018, 8461407. [Google Scholar] [CrossRef]
  89. Reyes-Rivera, J.; Terrazas, T. Lignin Analysis by HPLC and FTIR. In Methods in Molecular Biology; Humana Press Inc.: Totowa, NJ, USA, 2017; Volume 1544, pp. 193–299. [Google Scholar]
Figure 1. Box plot for modulus of elasticity of composites and control samples.
Sustainability 16 07088 g001
Figure 2. Box plot for modulus of rupture of composites and control samples.
Sustainability 16 07088 g002
Figure 3. Box plot for Rz parameters of composites and control samples.
Sustainability 16 07088 g003
Figure 4. Box plot for Ra parameters of composites and control samples.
Sustainability 16 07088 g004
Figure 5. Box plot for Rq parameters of composites and control samples.
Sustainability 16 07088 g005
Figure 6. Box plot for contact angle of composites and control sample at 5, 20, 40, and 60 s.
Sustainability 16 07088 g006
Figure 7. Box plot for thickness swelling after 2 h and 24 h soaking in water for composites and control samples.
Sustainability 16 07088 g007
Figure 8. Box plot for water absorption after 2 h and 24 h soaking in water for composites and control samples.
Sustainability 16 07088 g008
Figure 9. FTIR spectra for pure polyethylene (PE_0), rapeseed pomace (R_0) and PE_R composite.
Sustainability 16 07088 g009
Figure 10. FTIR spectra for pure polyethylene (PE_0), evening primrose pomace (EP_0) and PE_EP composite.
Sustainability 16 07088 g010
Figure 11. FTIR spectra for pure polyethylene (PE_0), gold of pleasure pomace (G_0) and PE_G composite.
Sustainability 16 07088 g011
Figure 12. FTIR spectra for pure polyethylene (PE_0), sunflower pomace (S_0) and PE_S composite.
Sustainability 16 07088 g012
Figure 13. Thermogravimetric curves TGA (A) and DTG (B) for combustion in oxygen for composites and control samples.
Sustainability 16 07088 g013
Figure 14. Thermogravimetric curves TGA (A) and DTG (B) for heating in nitrogen atmosphere for composites and control samples.
Sustainability 16 07088 g014
Figure 15. The SEM results of the surface observation of composites and control pure polyethylene sample—magnification ×200.
Sustainability 16 07088 g015
Figure 16. The SEM results of the surface observation of composites and control pure polyethylene sample—magnification ×1000.
Sustainability 16 07088 g016
Figure 17. Results of the growth of Trichoderma viride on the surface of composites and control samples.
Sustainability 16 07088 g017
Figure 18. Results of the growth of Chaetomium globosum on the surface of composites and control samples.
Sustainability 16 07088 g018
Figure 19. Example of mold growth (Trichoderma viride) after 8 days of exposure—control sample and composites.
Sustainability 16 07088 g019
Figure 20. Example of mold growth (Chaetomium globosum) after 12 days of exposure—control sample and composites.
Sustainability 16 07088 g020
Table 1. Density of composites and control samples.
VariantAverage Density
[kg/m3]
Coefficient of Variation
[%]
PE_08971
PE_EP9847
PE_G92113
PE_R91810
PE_S90612
Disclaimer/Publisher’s Note: The statements, opinions and data contained in all publications are solely those of the individual author(s) and contributor(s) and not of MDPI and/or the editor(s). MDPI and/or the editor(s) disclaim responsibility for any injury to people or property resulting from any ideas, methods, instructions or products referred to in the content.

