Article

Research on the Socio-Spatial Resilience Evaluation and Evolution of the Central Area of Beijing in Transitional China

1
Key Laboratory of the Evaluation and Monitoring of Southwest Land Resources (Ministry of Education), Sichuan Normal University, Chengdu 610068, China
2
The Faculty of Geography & Resource Sciences, Sichuan Normal University, Chengdu 610101, China
3
School of Geography, Nanjing Normal University, Nanjing 210023, China
*
Author to whom correspondence should be addressed.
Sustainability 2024, 16(16), 7098; https://doi.org/10.3390/su16167098
Submission received: 21 June 2024 / Revised: 7 August 2024 / Accepted: 10 August 2024 / Published: 19 August 2024

Abstract

:
In recent decades, the increasing threats of global climate change, natural disasters, and epidemics have brought extensive attention to resilience theory. However, most studies focus on the physical aspects of cities, overlooking the significance of the social perspective. This study addresses this gap by using social areas as the core spatial unit for analysis. By constructing a scientific indicator system and employing the set pair analysis method, this study comprehensively evaluates the multidimensional resilience levels of Beijing’s central area during its transitional period (1990–2020). The findings reveal that socio-spatial divisions, which emphasize the network structure of social relations and the dynamic changes in social spaces, are more suitable than traditional administrative divisions as fundamental units for resilience assessment. During Beijing’s transitional period, the comprehensive resilience of the central area and all social areas steadily increased, although social capital resilience faced the challenges of loss and slow recovery. Social areas with a unique internal connection, such as those based on ethnicity, exhibited more positive social capital resilience development. Additionally, social areas with lower population diversity and greater homogeneity tended to have higher comprehensive resilience and a more positive trend in social capital resilience development, whereas highly heterogeneous social areas faced significant constraints in resilience development. These findings may provide valuable insights for cities and communities to enhance their capacity to address future uncertainties and assist policymakers in making informed governance decisions.

1. Introduction

Although it has a history of over 100 years, resilience theory has experienced a burgeoning currency in the past two or three decades, in parallel with global climate change and ensuing natural disasters, as well as epidemic disease, fluctuating financial markets, and a global escalation in terrorist attacks. What was rooted in psychology as an enquiry into individual persistence now converges with explorations into ecosystem dynamics and has grown into a broad and exciting field of study, gaining increasing popularity among academics, and capturing the interest of both policymakers and the general public. Not only does resilience theory provide an increasingly vigorous and sophisticated body of analysis, it also offers the prospect of more integrated and effective policy making aimed at sustainability [1]. To some extent, ‘resilience is to the 2000s and 2010s what sustainability was to the 1980s and 1990s’ [2].
It would be natural to wonder why multiple independent threads of research with different subjects, methods, and terminology have coalesced around the broad theoretical structure of resilience [3]. The authors believe that the subjects in question have one thing in common: humanity. Tremendous attention has been paid to the risks facing humanity and its inter-coupled social-ecological systems through the lens of resilience thinking. This is why resilience research is prevailing and thriving in so many disciplines and cross-fields. Resilient thinking concerns humanity, and the fundamental happiness and wellness of all human beings, individuals, families, communities, cities, nations, and the entire global population, regardless of whether it is in the fields of psychology, ecology, economics, emergency management, or disaster risk reduction. The other reason resilience is so vital is that change is normal and inevitable in both nature and human society. We always have to prepare for, respond to, and recover from hardships and adversity in order to survive and thrive, especially when we are facing a locally and globally fast-changing natural and social environment. Therefore, resilience may be a ‘response to a generalized contemporary sense of uncertainty and insecurity and a search for formulas for adaptation and survival’ [4].
Unsurprisingly, the concept of resilience and its research framework are rapidly gaining widespread recognition and application across various fields, particularly in the evolving environments of cities and communities. Globally, the number of people living in cities has recently increased to 57% [5]. A similar process is occurring in China. In 2023, the urbanization rate of China reached 66.16%, which means more than 700 million people are currently living in cities in China. Urban resilience is the ability of a city as a complex dynamic system to maintain and recover its original state in response to various risks, ensuring the normal functioning of its internal systems. As climate change and its resultant extreme weather events and induced natural disasters increasingly affect cities, many city governments are considering enhancing urban resilience as a key coping strategy. According to the existing literature, research into urban resilience primarily focuses on two main areas: ecological sciences and engineering. Research topics such as urban emergency management, disaster mitigation, and climate change adaptation dominate most emerging research agendas in resilience thinking. Some scholars have assessed the urban resilience of Beijing using mixed-methods research, expert consultation, and factor analysis, exploring the strong link between resilience and climate change adaptation [6]. Other scholars have comprehensively assessed the resilience level of the Beijing–Tianjin–Hebei region, analyzing the dynamic relationship between climate factors such as temperature, precipitation, and wind speed and urban resilience, subsequently proposing targeted improvement measures [7]. Research related to urban disaster risk focuses on cities’ ability to adapt to natural disasters, with in-depth explorations of specific types of disasters, such as floods [8,9], earthquakes [10,11], and landslides [12]. As the application scope and theoretical connotation of resilience theory continue to expand, the perspective of urban resilience research has gradually shifted from the ecological, natural, and engineering fields to internal social problems within cities.
In general, resilience research rarely integrates social structure with physical space. This study posits that resilience should be redefined from the perspective of urban sociology, emphasizing the role of space in social dynamics. From a geographical perspective, the concept of resilience must be linked to the uneven development of capital across different spatial regions and scales [13]. One viewpoint suggests that resilient spaces align with the interests of capital, transforming themselves periodically to meet the demands of capital accumulation within the context of economic globalization. From this perspective, both resilience and external interferences are components of the capital system, with capitalist resilience necessitating specific regions and groups to bear the costs of cyclical adjustments and transformations [14]. An alternative perspective views resilience as a manifestation of different social relationships, where the health and integrity of the social and physical environment take precedence, and capital is seen as an external disturbance and deconstructive force. This perspective aligns with the principles of social justice. This paper supports the latter view, especially in transitional economies like China’s socialist market economy, where the resilience of social space cannot be fully explained within the capital system. The so-called spatial resilience of capital is merely a terminological rebranding of capitalist space, leading to both spatial destruction and social deconstruction, rather than genuine socio-spatial resilience. To thoroughly analyze the essence of socio-spatial resilience, it is essential to re-examine the connotations of social space. Social space is a construct that integrates material, spiritual, and social dimensions. It is a product of human activities, both shaped by and shaping these activities, grounded in the material environment and social relations. Simultaneously, it reproduces the material environment and social relations, embodying the materialization of social existence. Given the richness of social space, it naturally aligns with the concept of resilience. Resilience refers to the capacity to remain stable, adapt to change, and recover in the face of challenges or pressures. Due to its inherent diversity, dynamism, and complexity, social space has the potential to address various challenges and changes. Therefore, exploring the resilience of social space involves investigating how to maintain the stability and vitality of social space to achieve its sustainable and healthy development in an ever-changing social environment.
The whole of China has been experiencing a rapid process of urbanization over the last few decades following its ‘opening-up’ policy of 1978. New towns have been built almost overnight, while old ones have been rapidly torn down. Numerous projects to renew ancient inner-city areas have led to the loss of city culture and heritage, social segregation, housing and job spatial mismatch, traffic congestion, the degradation of the environment, soaring real estate prices, indifferent social relations, frequent corruption, and even collective community demonstrations and social rioting induced by forced population relocation. These problems have just begun to manifest themselves. The magnitude of their impact will last for a long time, and may leave multiple complex issues for future generations to solve. Lessons should be learned from the past; fresh angles or new mindsets, and more dynamic and holistic perspectives and insights, ought to be applied to comprehensively and systematically analyze these issues faced by inner cities and communities. Resilience thinking is one such theory and angle of approach. With its cross-disciplinary and systemic nature, it can provide us with the basis for improving the quality of life of inner-city residents and inner-city environmental sustainability.
Following the outbreak of COVID-19, the crucial value of resilience came to the fore in combating the pandemic and restoring the normal functioning of cities and communities, including the resumption of production. Numerous studies into resilience as seen from various perspectives have emerged. Some scholars have developed a dynamic resilience assessment framework to quantify the resilience of different cities during large-scale public health events. This framework thoroughly analyses urban resilience across various epidemic scenarios and policy contexts, providing decision-makers with a basis for balancing the control of public health events and the maintenance of normal city operations [15]. Additionally, some researchers constructed a comprehensive four-dimensional evaluation model to assess urban resilience in terms of physical structure, infrastructure, socio-economic status, and environmental factors. These researchers calculated the resilience levels of 351 communities in Tehran, Iran in the context of the COVID-19 pandemic [16]. By combining these resilience levels with confirmed case data, the close relationship between community resilience and the severity of the impact of the pandemic has been further elucidated. These studies have partially validated the definition and understanding of socio-spatial resilience as proposed in this study. However, related research remains deeply constrained by administrative divisions when selecting spatial scales, failing to fully capture the complex aspects of human social relations. This significantly constrains the depth of such research and its applicability to real-world scenarios. After the COVID-19 pandemic, a new round of economic stimulus policies allocated tens of trillions of dollars toward the renovation of old cities and communities in China. In this context, the internal socio-spatial structure of Chinese cities will undoubtedly undergo significant changes and evolution, with corresponding adjustments to their patterns of resilience.
Against this background, this study first categorized the types of social space in the central area of Beijing City. It then conducted a comprehensive resilience assessment of these social areas across multiple dimensions and time periods, spanning various administrative regions. This deep-dive approach aimed to understand the complexity and diversity of social spaces. By exploring the development paths of social areas and the dynamic trends in their resilience in central Beijing, this study provides theoretical support and practical guidance for addressing black swan events, such as COVID-19, and other potential crises, thereby actively promoting the construction of resilient cities. The structure of the study is outlined as follows:
This study used socio-spatial division as its foundational spatial units. It conducted comprehensive resilience construction, assessment, and evolution analysis on each social area in central Beijing across eight dimensions—the economy, population, institutions, social capital, ecology, engineering, networks, and morphology—at multiple time points. First, Section 1 defines the concept of urban socio-spatial resilience by systematically comparing the connectivity between urban resilience and urban social space, as well as reviewing the progress in related research. Section 2 provides an overview of the study area, data sources, the construction of the indicator system, and the research framework, along with the specific implementation methods. Section 3 offers a detailed analysis of the multidimensional resilience dynamics in Beijing’s central area as a whole, as well as within its individual social areas. In Section 4, the study further explores how the internal homogeneity and heterogeneity of social spaces contribute to resilience building. Additionally, this section discusses the research limitations and proposes directions for future studies. Finally, Section 5 presents the conclusions of this work.

2. Data and Methodology
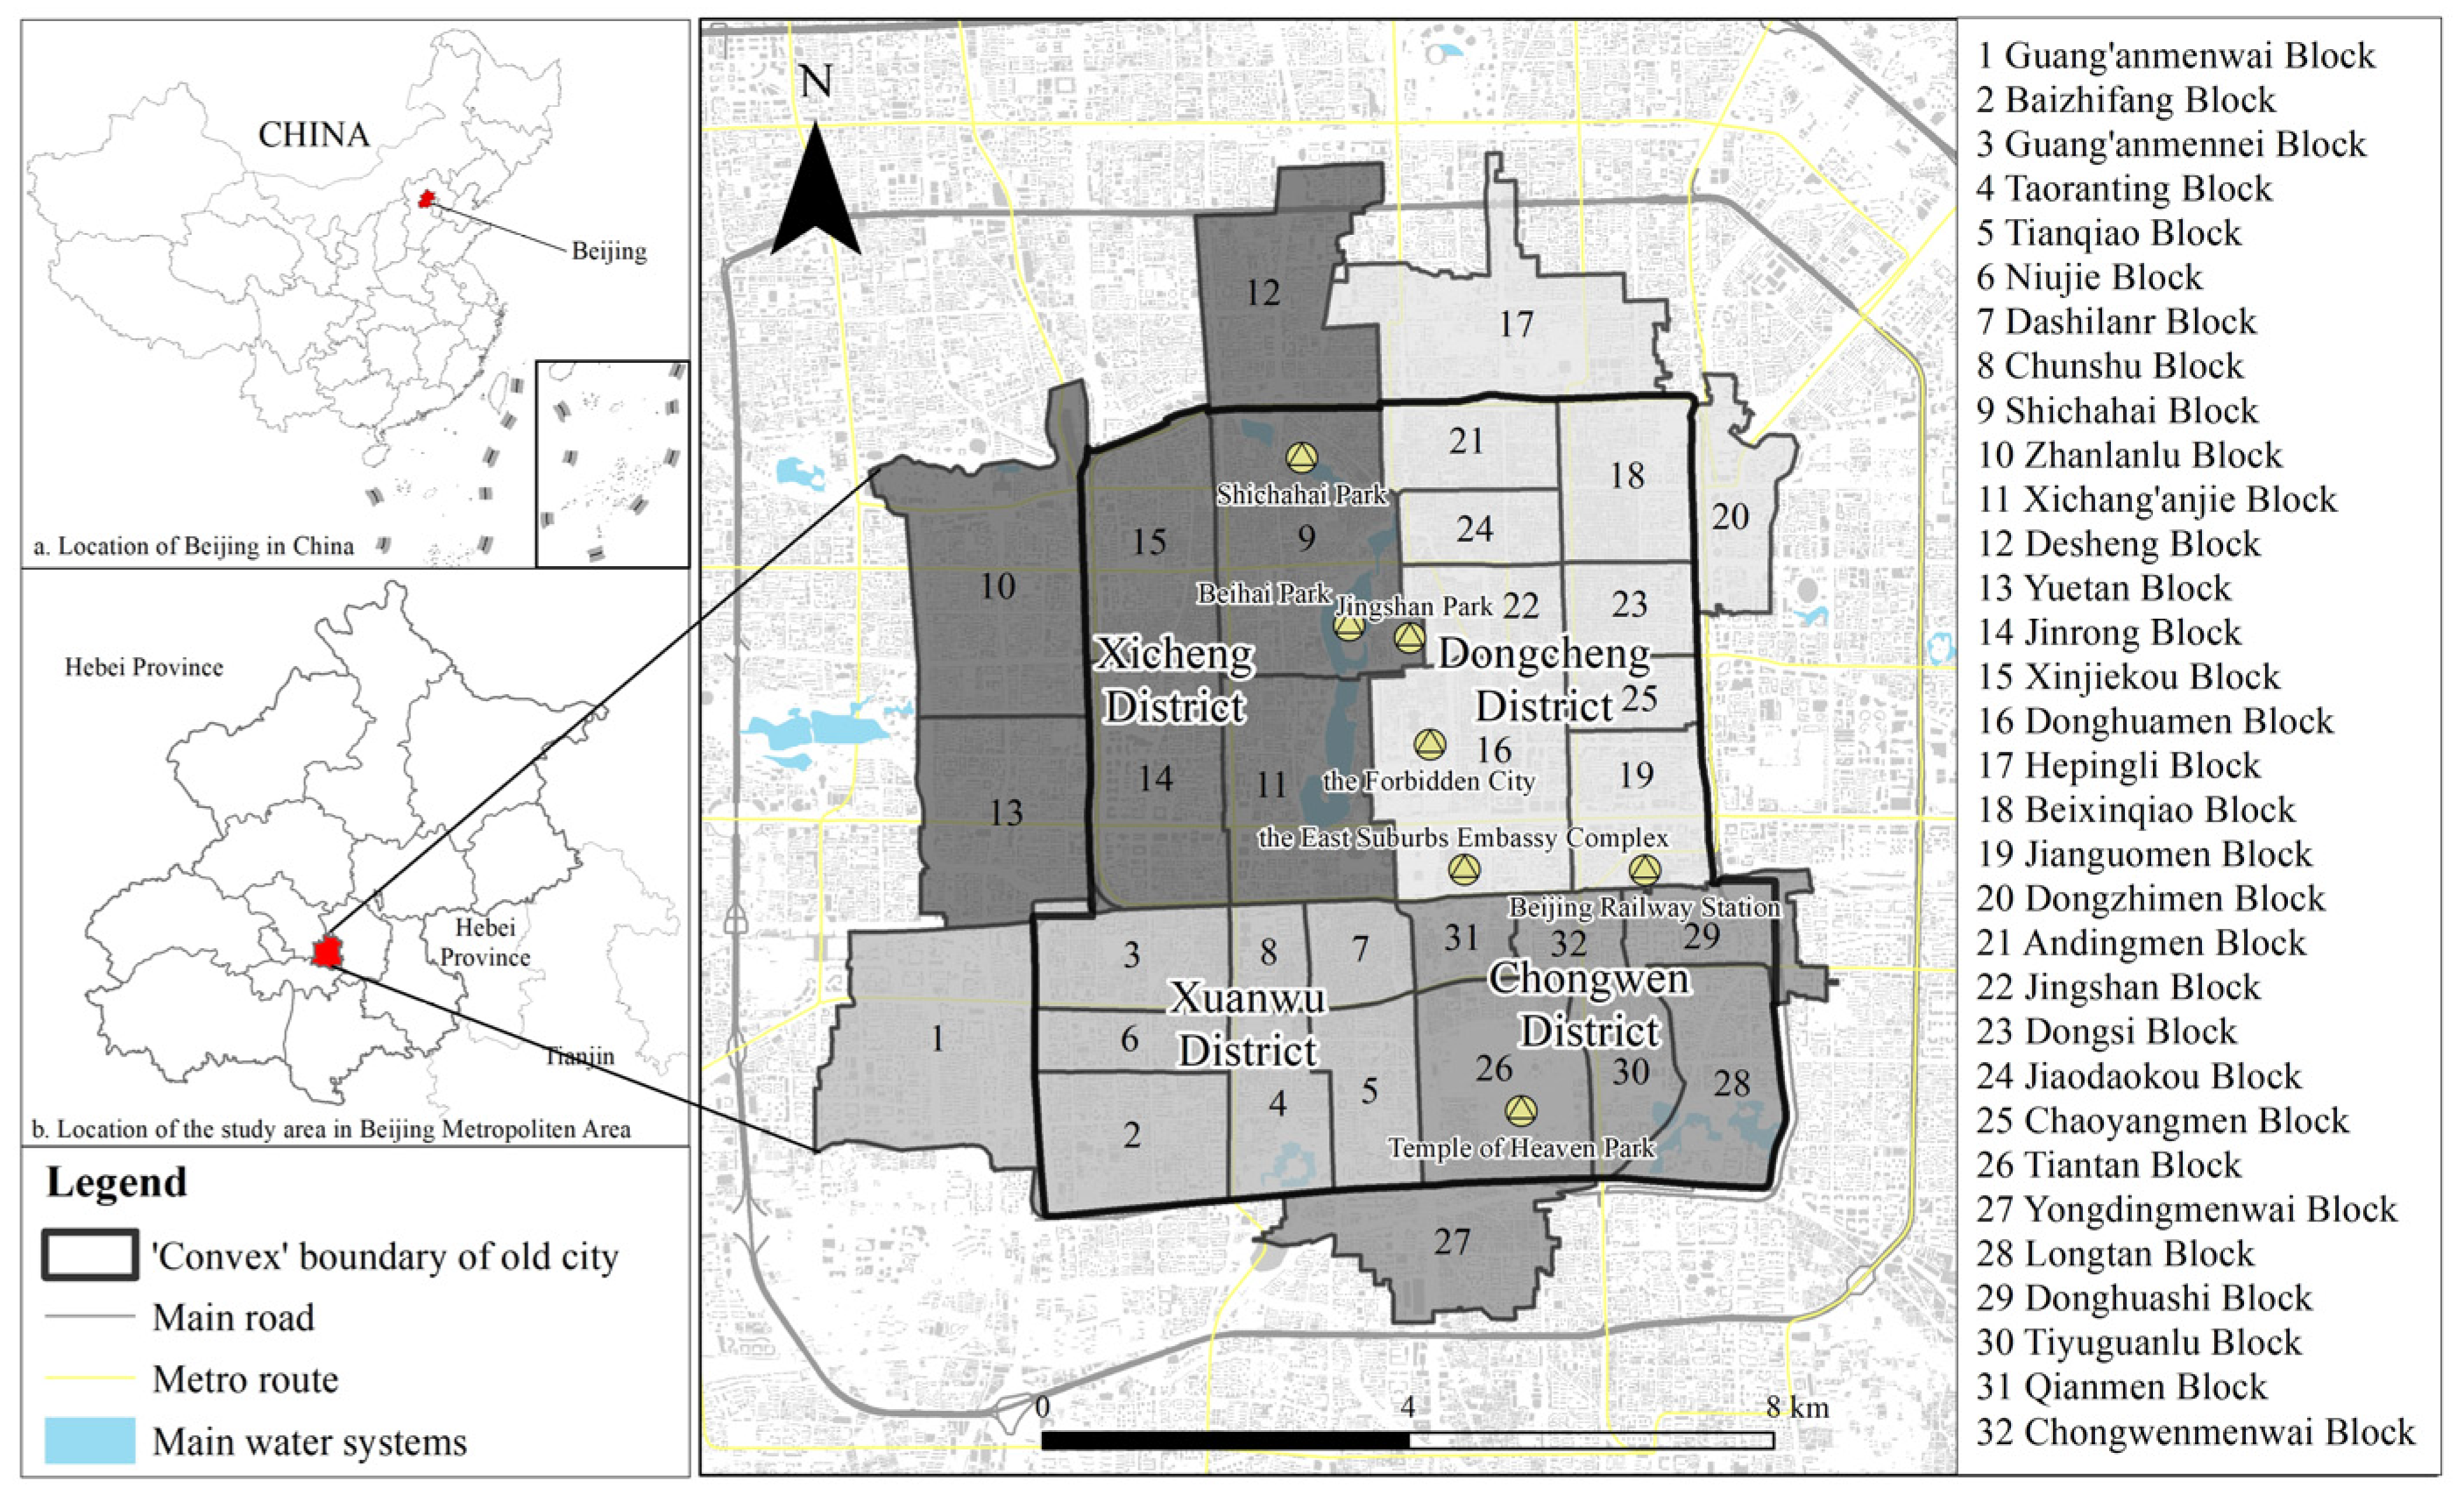
2.1. Study Area

Beijing is located at longitudes 115.7°–117.4° E and latitudes 39.4°–41.6° N, encompassing an area of approximately 16,410.54 km2. The study area selected for this paper is the central area of Beijing, as shown in Figure 1. Specifically, it includes the Dongcheng and Xicheng Districts, established following the 2010 adjustment of Beijing’s administrative divisions, which consolidated the original Dongcheng, Chongwen, Xuanwu, and Xicheng Districts (See Figure 1). These districts form the central area for the protection of Beijing’s historical and cultural heritage and the core functional area of the capital, as delineated in the Beijing Main Functional Areas Plan. This central area covers 32 blocks and an area of 92.39 km2.
Since 1978 and the introduction of reform and ‘opening-up’ policies, Beijing has experienced rapid development as China’s capital, driven by its unique status and its international and historical value. The influx of elite talent and the rapid expansion of industries and economic markets have significantly contributed to the population growth in Beijing’s central area, particularly since 1990. As a renowned historical and cultural city and the political center of China, the development of Beijing’s central area is of paramount importance to the Communist Party of China and the People’s Republic of China for policy formulation and future planning. The central area faces a dual conflict between modern social development and the preservation of its historical and cultural heritage. Its historical legacy and associated socio-spatial changes pose obstacles for modern urban construction. The urban structure of this area of central Beijing has been of unique sociopolitical importance since the Ming and Qing dynasties, and has a rich history, diverse culture, and varied ethnic composition. As the heart of Beijing, it has undergone substantial change over different periods in response to economic development. The sustainable development of Beijing’s central area is crucial for realizing the overall functions of the city, yet it faces numerous socio-spatial dilemmas. During the planned economy era, the central area had a ‘decentralized group’ spatial structure, characterized by a mix of old and new housing and generally poor construction standards. Following the introduction of reform and ‘opening-up’ policies, the functions and land structure of the area were reconstructed, bringing new socio-spatial problems, including housing issues for poor residents and the preservation of the old city’s history and culture. Today, issues such as traffic congestion from daily commuting through old urban areas and related environmental problems remain pressing concerns. During public health crises like the SARS outbreak of 2003 and the COVID-19 pandemic, Beijing’s central area faced considerable challenges in its response capabilities. This paper argues that the historical development and current realities of Beijing’s central area offer a suitable paradigm for the socio-spatial resilience framework defined in this study. Consequently, this area is the scope of this study.

2.2. Data

The research period of this study spans from 1990 to 2020, aligning closely with a critical phase in China’s economic and structural transition from centralized economy towards a more market-oriented one. Starting in 1990, Beijing initiated a large-scale renovation program for old city areas and concurrently promoted systematic reforms in the housing sector. By 2010, the housing stock and structure of Beijing’s central areas had undergone accelerated reconstruction and social differentiation. The global outbreak of the COVID-19 pandemic in 2020 added complexity and variability to the context of this study. The pandemic has reshaped the global economy and profoundly impacted China’s socioeconomic structures, including those of Beijing. Given Beijing’s unique strategic position as the national capital, its diverse demographic composition, and the significant socio-economic changes it has experienced over the past three decades, this study focuses on an in-depth analysis of the central area of the city during the period from 1990 to 2020. Notably, the four years 1990, 2000, 2010 and 2020 correspond to national census years, providing valuable and detailed demographic data for this study. In terms of data collection and processing, the study additionally relies on the compilation of statistical data from these four key census years, including authoritative publications such as the Beijing Social and Economic Statistical Yearbook and the Beijing Statistical Yearbook. Additionally, the administrative divisions of the central area of Beijing underwent several adjustments during the study period. To ensure the spatiotemporal consistency of the data and accuracy of the results, data were merged and adjusted as necessary to accurately reflect the actual changes.

2.3. Methodology

The general research framework of this study is as follows: Initially, an index system for resilience assessment was developed, and the corresponding weights were calculated. Subsequently, set pair analysis was utilized to obtain the proximation of each dimension and year to the optimal set of evaluations in order to measure the corresponding level of resilience. Finally, the overall resilience value of the central area was summarized, and the resilience analysis of each dimension based on the results of the division into social areas was elaborated upon.

2.3.1. Construction of the Indicator System

Due to the inherent difficulties in measuring network resilience and morphological resilience with indicators, as well as the challenges of collecting early network-related data and maintaining the time series consistency of urban-morphology-related indicators, this paper selected only two indicators: the number of mobile phones per 10,000 households (to represent network resilience), and road network density (to represent morphological resilience). This selection of indicators adheres to the principles of scientific rigor, feasibility, and simplicity. Initially, alternative indicators were identified by synthesizing a substantial body of literature on resilience indicator systems to be included in the conceptual framework of socio-spatial resilience presented in this paper [17,18,19,20,21,22,23,24,25,26,27,28,29,30,31,32,33,34,35,36,37]. These indicators were grouped into two major categories: social and spatial resilience. These categories encompass the subcategories of economic resilience, demographic resilience, institutional resilience, social capital, ecological resilience, engineering resilience, network resilience, and morphological resilience, which can be collectively used to build an evaluation index system for urban socio-spatial resilience. The first four subcategories focus on the social level, while the last four focus on the spatial level.
After applying the principles of data continuity, reliability, accessibility, and the significance of the indicators, a total of 73 three-level resilience indicators were selected for this study. Specifically, the set includes 12 indicators of economic resilience, 12 of demographic resilience, 12 of institutional resilience, 12 of social capital, and 12 of ecological resilience. Additionally, there are 11 indicators of engineering resilience, along with a single indicator each for network resilience and morphological resilience. The entropy weight method was employed to assign weights and determine the final indicator system, as illustrated in Table A1.

2.3.2. Entropy Weight Method

The entropy value method is an objective weighting approach widely used in various assessment frameworks. It is applicable to a range of comprehensive evaluation problems and determines the weight of each indicator by calculating the degree of data dispersion, thus avoiding the potential influence of subjective judgment and human influence. Consequently, it more accurately reflects the true contribution of each indicator in the comprehensive evaluation system and helps improve the accuracy and reliability of the evaluated results.
In the evaluation index system for socio-spatial resilience in Beijing’s central area, assuming there are n blocks, m years, and s indicators in the evaluation model, the jth indicator of block i in the ath year can be expressed as Xaij. In this paper, n, m, and s are 32, 4, and 73, respectively.
To eliminate scale differences between various indicators and ensure comparability of the processed data, this study employed the extreme value method. Indicators in the system are classified into two categories: positive indicators (where higher values are preferable) and negative indicators (where lower values are preferable).
Positive indicator:
X a i j = X a i j min { X j } max { X j } min { X j } .
Negative indicator:
X a i j = max { X j } X a i j max { X j } min { X j } ,
where X a i j is the standardized indicator value, Xj is the raw data of the jth indicator of block i in the ath year, and max{Xj} and min{Xj} are the maximum and minimum values of the raw data for the jth indicator over 4 years and 32 blocks.
To eliminate the impact of the extreme value ‘0’ appearing in the logarithmic calculation process after standardization, this study shifted the standardized indicator value by 0.0001, thus:
X a i j = X a i j + 0.0001 ,
where X a i j is the adjusted indicator value, and 0.0001 is the adjustment margin.
The index value after translation was transformed using the following formula:
P a i j = X a i j a = 1 m i = 1 n X a i j ,
where Paij is the indicator weight of item j for block i in year a.
Finally, this study calculated the entropy value ej of each index according to Formula (5) and calculated the entropy weight value Wj of the jth index using Formula (6), thus:
e j = 1 ln ( m n ) a = 1 m i = 1 n P a i j ln ( P a i j ) ,
W j = 1 e j j = 1 s 1 e j .

2.3.3. Set Pair Analysis

Set pair analysis (SPA) is a methodology that uses the number of connections to describe and manage certainty and uncertainty in complex systems [38]. This method subdivides certainty into ‘identity’ and ‘discrepancy’, and terms uncertainty as ‘contrary’. It aims to explore the interaction between two interrelated sets in a dynamic system by analyzing the degree of connection among these three aspects. Since its introduction by Chinese scholar Keqin Zhao in 1989, the theoretical framework and practical approach of SPA have been widely applied in interdisciplinary fields, particularly in earth and environmental sciences [39].
Cities are complex and open systems, whose functioning and evolution are influenced by numerous deterministic and uncertain factors. Urban resilience refers to the capacity of a city to maintain stability and recover swiftly amidst uncertainty. Its essential characteristics closely align with those of complex systems, which are effectively addressed by SPA. Given that some scholars have already conducted studies using SPA to evaluate single or multiple subsystems within a city [40,41,42], the method has established a well-developed theoretical framework and methodological foundation in urban research. This study therefore aimed to quantify resilience using SPA in order to analyze the trajectory of change and gain a deeper insight into the internal operational mechanisms of the urban system. Using this method, it is possible to capture more accurately the performance of urban resilience across different dimensions, track its trends over time and space, and thus provide robust data support and a theoretical foundation for formulating scientific urban planning and management strategies. The details of the method are as follows:
The basic premise of SPA is that, given a specific problem context W, there exist sets M and N, denoted as set pair H. The expression for the connection degree μ is:
{ μ ( W ) = S N + F N i + P N j = a + b i + c j a + b + c = 1 a , b , c [ 0 , 1 ] i [ 1 , 1 ] j = 1 ,
where N is the total number of elements possessed by the set pair H, while S, F, and P represent the number of identical properties, discrepant properties, and contrary properties of the two sets M and N. Without considering the weights, a, b, and c represent the degrees of ‘identity’, ‘discrepancy’, and ‘contrariness’ of the set pair H vis-à-vis the problem W being discussed. Here, i is the uncertainty coefficient, and j is the contrary coefficient.
In the specific multi-attribute evaluation problem Q = { F , D , E , W } used to evaluate the socio-spatial resilience of Beijing’s central area, F = { f 1 , f 2 , , f m } is the assessed year set, and fm denotes the mth year. D = { d 1 , d 2 , , d s } is the evaluation indicator set, and ds represents the sth index. E = { e 1 , e 2 , , e n } is the evaluation object set, and the en represents the nth block. W = { w 1 , w 2 , , w s } is the evaluation indicator weight set. By collecting the appropriate extreme value for each assessing index (the maximum for positive indicators and the minimum for negative indicators), the optimal evaluation set can be generated, marked as U = { u 1 , u 2 , , u s } , while the pessimal evaluation set is marked as V = { v 1 , v 2 , , v s } . us and vs, respectively, express the optimal and pessimal value of the index ds from 1990 to 2020. The connection degree of the set pair { f m , U } over [ V , U ] is expressed as:
{ μ ( f m , U ) = a m + b m i + c m j a m = w p a p k c m = w p c p k p = ( 1 , 2 , , s ) k = ( 1 , 2 , , n ) ,
where apk and cpk represent the identity degree and contrary degree, respectively, of the evaluation index dpk with the set [vp, up]. Additionally, wp denotes the weight of the pth index.
When dpk has a positive impact on the evaluation result:
{ a p k = d p k u p + v p c p k = u p v p d p k ( u p + v p ) .
When dpk has a negative impact on the evaluation result:
{ a p k = u p v p d p k ( u p + v p ) c p k = d p k u p + v p .
The approximate degree rm of the subset fm to the optimal evaluation set U can be defined as:
r m = a m a m + c m
where rm reflects the degree of connection between the evaluated subset fm and the optimal evaluation set U. The larger the value of rm, the closer the evaluated subset is to the optimal scheme. Using this method, the apk and cpk values for the corresponding indicators of each block in the central area of Beijing from 1990 to 2020 could be obtained. By weighting these indicators, the apk and cpk values for each block could be aggregated, using the block as the base unit, to calculate the am and cm values for the entire central area or for each social area, before subsequently deriving the corresponding rm values.
This study employed SPA to address the specific issue of socio-spatial resilience in the central area of Beijing. Multiple sets (different years within the same study area) were combined to provide a detailed analysis of resilience characteristics. The evaluation indices of socio-spatial resilience were synthesized into an approximate degree rm in terms of the optimal evaluation set in order to reflect the resilience level. Here, a greater rm value indicates a higher level of socio-spatial resilience, and vice versa.

3. Results and Analysis

3.1. Results of the Evaluation of the Comprehensive Resilience of the Central Area of Beijing

Taking the entire central area as the analytic unit, the performance of each resilience indicator in Beijing’s central area gradually improved from 1990 to 2020 in terms of its approximation to the optimal evaluation set, indicating that the area’s comprehensive resilience was on a steady upward trend. Specifically, the comprehensive resilience value increased from 0.3154 to 0.6703, demonstrating a consistent rise in resilience and improved risk resistance. Even though using only a single evaluative indicator for both the network and the morphological resilience may have affected the overall accuracy of the assessment, analysis after the exclusion of these two indicators still showed a consistent overall trend in the comprehensive resilience values. However, when the indicators were grouped into two dimensions, spatial and social, based on their nature, the central area showed some differences in how its resilience evolved. Spatial resilience grew significantly year on year due to infrastructure investment and road network optimization; social resilience exhibited fluctuations while trending upwards, with a short-term decline followed by a rapid rebound due to economic, demographic, and housing policy changes in 2000, reflecting the challenges and adaptations after the restructuring of the social fabric. By 2020, both dimensions had grown significantly, reflecting an overall increase in the city’s comprehensive resilience, as shown in Table 1.
Although the overall resilience of Beijing’s central area grew during the study period, there were significant differences in performance across the various dimensions, as shown in Figure 2. Economic resilience climbed dramatically, with its value in 2020 reaching 6.7 times that of 1990. Population resilience grew slowly and consistently due to rising educational attainment, labor influx, and improved healthcare, but further growth was hindered by severe aging by 2020. Institutional resilience, although generally rising, slowed in 2000 due to economic transformation, increasingly complex demographic structures, and intensified demolition and relocation conflicts that occurred during the renovation of the old city. However, it showed significant growth with the optimization of housing policy, continuous legal improvements, and the development of the tertiary industry sector. By 2020, institutional resilience had achieved a significant breakthrough in its growth rate, fully demonstrating its high degree of adaptability and regulatory ability. The resilience of social capital was deeply affected by the renovation of the old city and the gentrification it brought about, resulting in significant fluctuations. From 1990 to 2000, socio-economic transformation, the renovation of the old city, and the commercialization of housing led to drastic changes in the area’s social structure. The original community network in the central area was disrupted, causing a sharp decline in the resilience of social capital. By 2010, the restructuring of the urban and social structure created conditions for the reconstruction of social networks, leading to a brief rebound in social capital resilience, though it only slightly surpassed the 2000 level and failed to return to the 1990 benchmark. Between 2010 and 2020, the central area’s economic structure transitioned from a balanced emphasis on manufacturing and services to an international, world-class economic system centered on high-end services. Meanwhile, the rise in China’s internet and platform economies led to a diversification of employment patterns, with a significant increase in professionals working in emerging industries. Their reduced participation in traditional social groups, such as trade unions, coupled with a significant reduction in the number of staff in other mass organizations, such as people’s mediators, led to a significant decline in social capital resilience by 2020. Ecological and engineering resilience both showed a step-by-step stable growth, with ecological resilience rising even more due to increased greening, environmental management, and energy efficiency. This highlights the importance Beijing has placed on urban ecological and environmental protection over the past few decades, and the overall strength and success of its pollution prevention and control efforts. Network resilience stabilized after a significant increase in the popularity of smartphones and the mobile internet. Morphological resilience rose sharply after an initial decline, influenced to some extent by adjustments to the statistics caliber of road length, but also reflecting the continuous optimization of the road network in the central area and the compact nature of the urban road pattern.
The construction of resilient cities requires an integrated approach that combines the urban physical substrate with human society. However, urban resilience analysis is often conducted based upon administrative divisions and specific communities, with few studies using social areas as spatial units. Utilizing data from four population censuses, this study first divided the social space of Beijing’s central area into eleven types of social areas: a relatively marginal population social area; an industrial worker social area; a Hui minority social area; a working-class social area; a high-density mixed-use social area; a middle-class social area; a middle-class and working-class mixed social area; an elite-class social area; a capital-class social area; a high-density scientific research talent social area; and a mixed immigrant social area. The relevant research methods, division criteria, and detailed processes are described in the earlier part of this research team’s previous work [43]. Subsequently, this study used each social area as the basic spatial unit for resilience assessment to comprehensively and systematically evaluate the multidimensional comprehensive resilience level of Beijing’s central area across the four census years.
As shown in Figure 2, a stable domestic and international socio-economic environment has promoted the rapid development of Chinese society. Along with the continuous strengthening of macro-policies, the comprehensive resilience of social areas in the central area has grown steadily. However, the internal variations in the resilience of social areas exhibit a dynamic change, first converging and then expanding. Specifically, in 1990, the middle-class social area was significantly ahead in terms of comprehensive resilience, while the Hui minority social area showed the lowest resilience. By 2000, the middle-class social area had maintained its advantage, while the working-class social area had experienced a decline in resilience to the lowest level. During this period, the disparities in comprehensive resilience narrowed but then tended to widen. By 2010, the middle-class social area had a narrow lead over the relatively marginal population social area, continuing to occupy the optimal position, while the high-density mixed social area became the social area with the lowest comprehensive resilience. By 2020, the Hui minority social area exhibited the highest comprehensive resilience, while the working-class social area again showed the lowest value. In summary, the middle-class social area and the relatively marginal population social area demonstrated higher comprehensive resilience over the long term. The former maintained a high level of comprehensive resilience due to its resource advantage and sensitivity to social change, while the latter relied on a stable living environment and community network to build strong social resilience. With the overall development of the central area and policy support, the Hui minority social area significantly increased its resilience, becoming the most resilient of all social areas by 2020.
Figure 2. Multidimensional resilience of Beijing’s central area, 1990–2020.
Sustainability 16 07098 g002
From the perspective of spatial distribution, the spatial location and scope of social areas have undergone significant change, but still maintain a certain degree of inheritance (See Figure 3 and Figure 4). In 1990, high-resilience social areas were concentrated in the central area’s mid-western parts, forming a compact layout; low-resilience social areas were mainly distributed on the area’s northern and southern fringes. In 2000, some high-resilience social areas expanded to the periphery of the central area, while the former Chongwen District, known for its concentration of dilapidated housing, became home to the majority of low-resilience blocks. In 2010, some of the low-resilience social areas shifted inward into the central area, and the spatial distribution tended to be fragmented. By 2020, the scope of high-resilience social areas was expected to shrink significantly and become concentrated in the newly-formed Xicheng District. In contrast, the scope of low-resilience social areas expanded significantly into the central and eastern parts of the central area. This expansion may have been related to the regrouping of the working-class and migrant populations, which, due to limited resources and weak community ties, were drawn to the employment opportunities in these areas.
Figure 3. Distribution and evolution of the comprehensive resilience of different social areas in Beijing’s central area across four time points. (a) 1990; (b) 2000; (c) 2010; and (d) 2020.
Sustainability 16 07098 g003
Figure 4. Bubble chart of the comprehensive resilience ranking changes across different social areas in Beijing’s central area (1990–2020).
Sustainability 16 07098 g004
In analyzing the complicated process of urban socio-spatial resilience evolution, it is necessary to focus on the development of comprehensive resilience within social areas, and to interpret any changes in socio-spatial resilience within a complex urban system from many different dimensions. This study was based on two core dimensions, i.e., spatial and social, so that the research could be comprehensively conducted. The spatial perspective focused on the physical substrate of the city from the vantage point of four dimensions: its morphology, ecology, engineering, and network. The central area’s social dimension was discussed from the perspective of another four dimensions: its economy, population, institutions, and social capital. Together, these eight dimensions constitute the basic structure and operating mechanisms of society and provide insight into the internal characteristics and risk response capacity of the central area of a mega-city.

3.2. Resilience Evaluation and Evolution Analysis from the Spatial Perspective

The development of morphological resilience has been somewhat uneven, with overall levels exhibiting an increase amidst fluctuations (See Figure 5 and Figure 6). The primary reason for this may be adjustments to the statistics caliber of road length, which have affected the continuity of historical data and led to a significant decline in the morphological resilience value of some historical and cultural conservation areas. By 2010, the blocks where the Forbidden City and the Temple of Heaven are located had the lowest morphological resilience in the central area. However, by 2020, these areas showed significant resilience recovery and improvement, closely mirroring the overall enhancement of morphological resilience related to adjustments to the statistics caliber of road length. Meanwhile, historical and cultural conservation areas, due to their location in the city center, dense road networks, and the benefits of effective maintenance and restoration strategies, rapidly recovered their morphological resilience. From the perspective of the overall evolution of morphological resilience rankings, the Hui minority social area and the middle-class social area demonstrated a consistent upward trend. In contrast, the high-density mixed social area initially experienced an increase but later saw a decline, while the area with relatively marginal populations underwent an initial decline followed by a subsequent rise. These trends reflect the differences in road network construction within the central areas. Despite these fluctuations, the overall level of morphological resilience made rapid progress between 2010 and 2020.
Figure 5. Distribution and evolution of the morphological resilience of different social areas in Beijing’s central area across four time points. (a) 1990; (b) 2000; (c) 2010; and (d) 2020.
Sustainability 16 07098 g005aSustainability 16 07098 g005b
Figure 6. Bubble chart of the morphological resilience ranking changes across different social areas in Beijing’s central area (1990–2020).
Sustainability 16 07098 g006
In terms of the development of ecological resilience in social areas, the relatively marginal population social area performed well, while the Hui minority social area experienced a shift from the lowest to the highest ecological resilience (See Figure 7 and Figure 8). Significant differences in the developmental histories of these social areas’ ecological resilience can be attributed to their geographic location and level of economic development. The relatively marginal population social area has a more stable settlement structure, located as it is on the northern side of the city’s ‘convex’ structure; this area includes multiple historical and cultural conservation areas and ecological reserves such as Shichahai Park and Beihai Park. These areas have not undergone large-scale reconstruction, thus preserving their original ecological advantages. The Hui minority population is highly concentrated in the Niujie Block, a small area on the edge of Beijing’s inner city that is predominantly composed of Hui residents. This population initially struggled with outdated environmental conditions and imperfect ecological management measures, making it difficult to improve ecological resilience. By 2020, ecological protection measures and development policies for minority residential areas began to take effect, leading to a significant improvement in ecological resilience. The middle-class population’s ecological resilience gradually improved due to its pursuit of a high-quality living environment. In contrast, the high-density mixed social area consistently exhibited low levels of ecological resilience, as ecological conservation efforts have not been prioritized in this area.
Figure 7. Distribution and evolution of the ecological resilience of different social areas in Beijing’s central area across four time points. (a) 1990; (b) 2000; (c) 2010; and (d) 2020.
Sustainability 16 07098 g007
Figure 8. Bubble chart of the ecological resilience ranking changes across different social areas in Beijing’s central area (1990–2020).
Sustainability 16 07098 g008
In the field of engineering resilience, the development of the relatively marginal population social area and the middle-class social area exhibited some similarities (See Figure 9 and Figure 10), but there were significant differences in their underlying causes. From 1990 to 2010, the engineering resilience in both of the aforementioned social areas grew slowly during the first decade and then accelerated dramatically in the second decade, leading to considerable year-on-year variations in rankings. The relatively marginal population social area encompasses many traditional housing conservation blocks (e.g., Dashilanr, Jingshan), where restrictions on building height and floor area ratio were imposed during the area’s renovation processes. Additionally, these areas contain a high density of dilapidated houses, which renders renovation projects unprofitable for developers and has led to delays in redevelopment efforts. Consequently, this has slowed the progress of resilience-building initiatives. Since 2000, the government’s active efforts to balance the renovation of dilapidated buildings with heritage conservation and urban development have led to rapid improvements in infrastructure. As a result, the renovation projects in the old city have been progressively completed, leading to substantial increases in engineering resilience. By 2020, while the level of engineering resilience continued to rise, Beijing’s rapid urbanization had reached an advanced and mature stage. This progression led to a significant slowdown in the rate of improvement in engineering resilience, as construction and renovation at the physical level approached saturation.
The development of engineering resilience in the middle-class social area can be intricately linked to changes in this population’s location. In 2000, the inner city’s middle- class social areas were situated in the former Dongcheng District, a key region earmarked for old city renovation. This area faced challenges such as balancing environmental protection and development, property disputes, and insufficient funds, which hindered renovation projects and delayed the construction of engineering resilience. Subsequently, as housing prices within the central area soared, the middle-class social area shifted back to the periphery of the central area. In these areas, where land available for development was more available and construction restrictions were less stringent, there was a significant improvement in engineering resilience. Furthermore, the engineering resilience of the Hui minority social area fluctuated significantly during the study period, showing rapid initial development followed by a slowdown and then a rebound. This fluctuation was primarily due to the unique characteristics of ethnic minority groups and historical factors. In 2000, due to the protection of religious buildings such as mosques and the preservation of ethnic customs, engineering renovation was limited. This resulted in a stable built environment and better engineering resilience in the Hui minority social areas compared to others undergoing significant transformation. However, as reconstruction efforts deepened, the constraints imposed by cultural conservation areas slowed down the upgrading of infrastructure and emergency facilities, gradually causing engineering resilience in these areas to lag behind that of other social areas that had completed substantial renovation. By 2020, the Hui minority social area experienced significant improvements in public services and infrastructure. This was due to the explicit requirements of the 13th Five-Year Plan for strengthening infrastructure in ethnic minority areas, as well as the adoption and implementation of advanced technologies such as intelligent transportation systems and disaster risk reduction technology. These factors contributed to a notable enhancement in the engineering resilience of the Hui minority social area.
Figure 9. Distribution and evolution of the engineering resilience of different social areas in Beijing’s central area across four time points. (a) 1990; (b) 2000; (c) 2010; and (d) 2020.
Sustainability 16 07098 g009aSustainability 16 07098 g009b
Figure 10. Bubble chart of the engineering resilience ranking changes across different social areas in Beijing’s central area (1990–2020).
Sustainability 16 07098 g010
With the widespread adoption and rapid development of mobile internet technologies, the impact of network infrastructure on urban resilience is increasing. However, early challenges in data collection prevented the refinement of network resilience indicators at the block and social area levels, thus limiting the differential expression of this spatial dimension. From a temporal perspective, network resilience experienced a significant leap between 1990 and 2020. Nonetheless, in the absence of major technological innovations and with the reliance on a single indicator, the development potential of network resilience became increasingly constrained between 2000 and 2020, resulting in a slowdown of its growth rate.

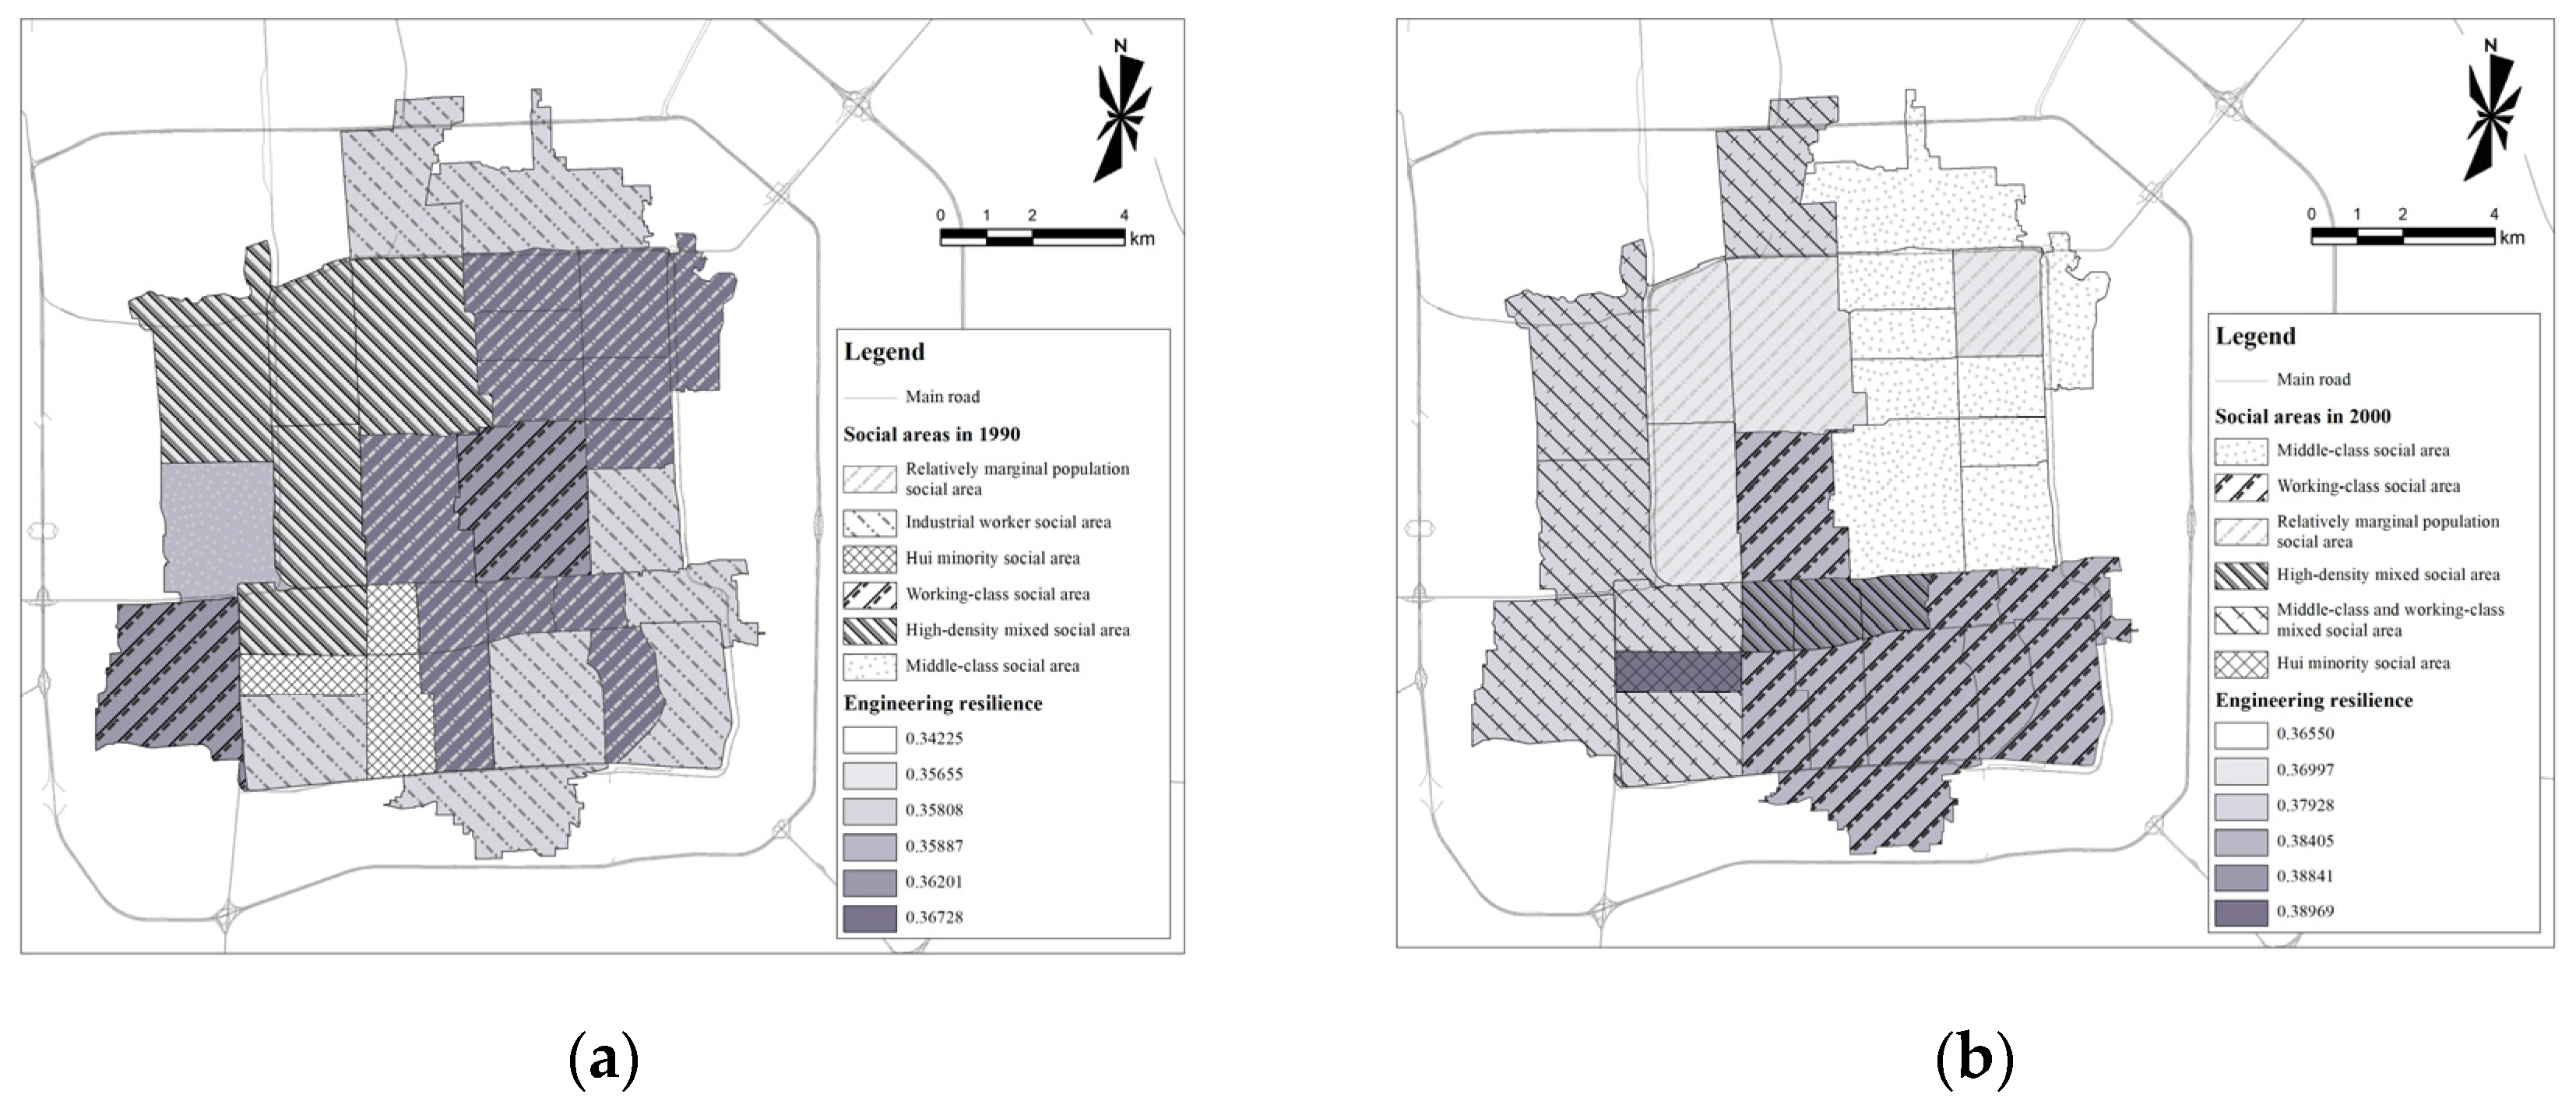
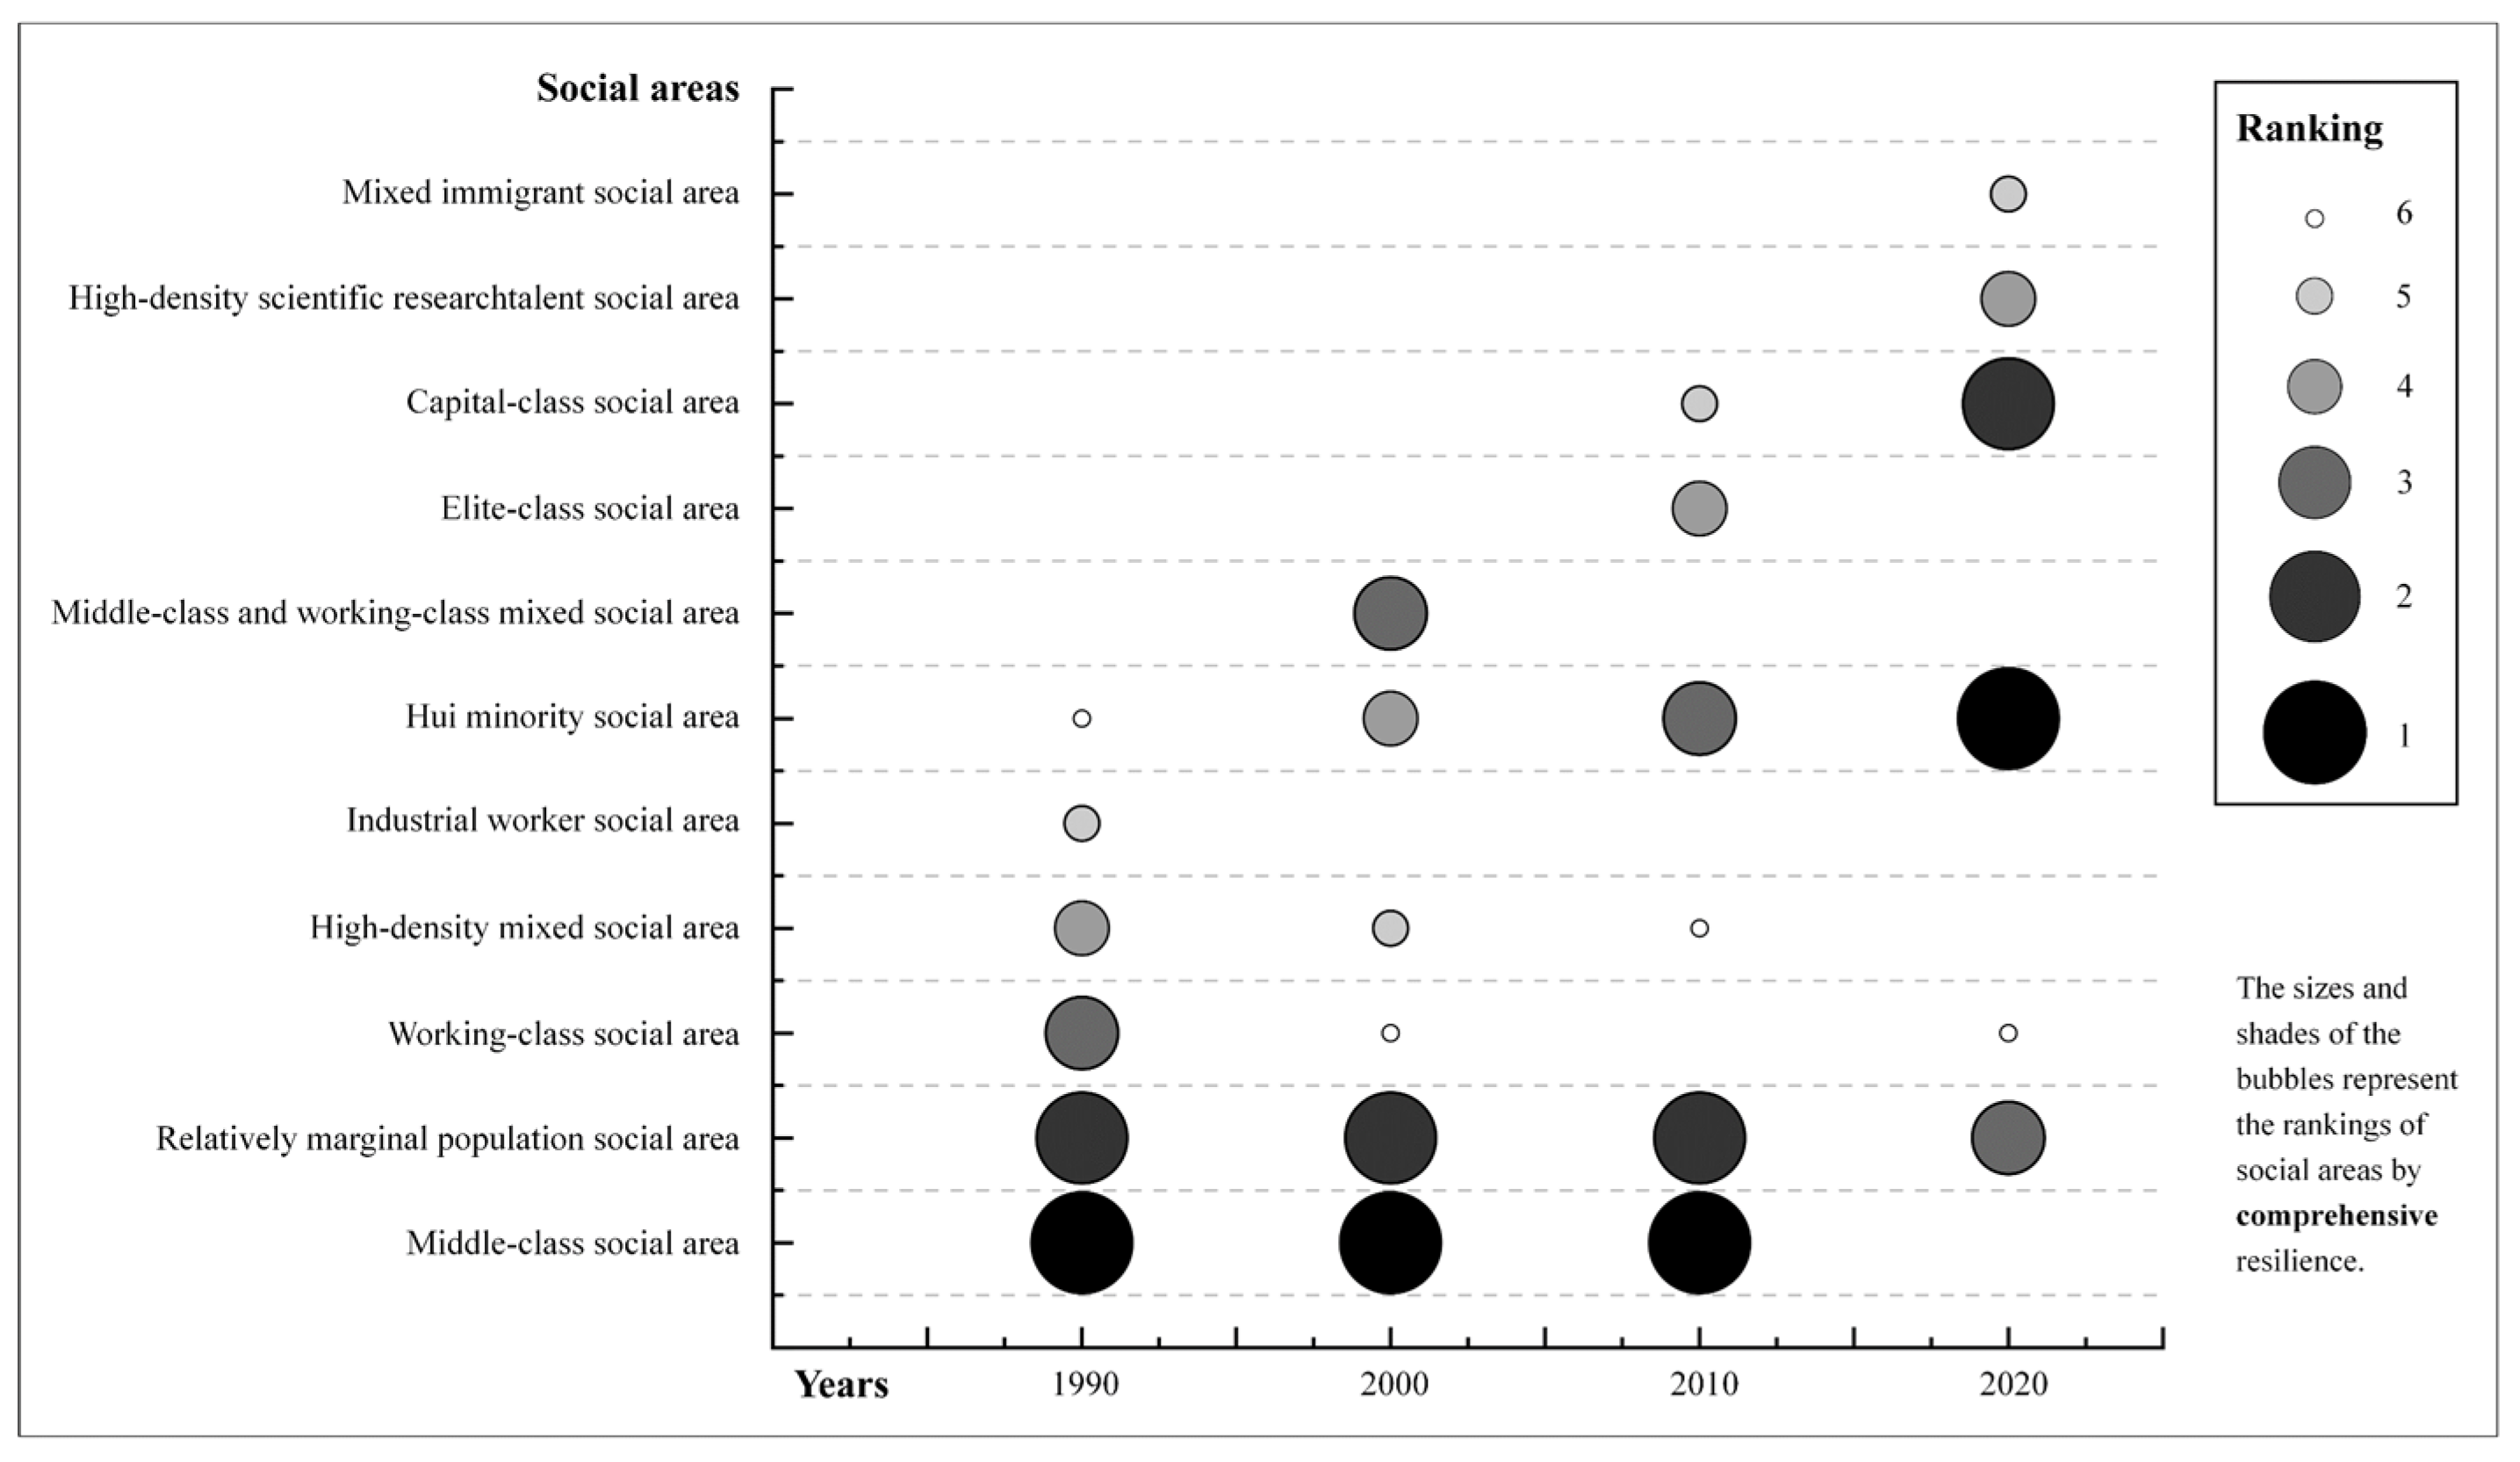
3.3. Resilience Evaluation and Evolution Analysis from the Social Perspective

Social resilience in Beijing’s central area has undergone multilevel, differentiated development. Economic, demographic, and institutional resilience all exhibited positive and stable growth, except for social capital resilience, which fluctuated significantly. Since the implementation of reform and ‘opening-up’ policies and the establishment of the market economy system, diverse market entities have become the core driving force behind urban development. As the country’s economic frontier, the central area of Beijing has experienced a significant enhancement in economic resilience, and the disparity in economic resilience between social areas has gradually diminished over time (See Figure 11 and Figure 12).
Typically, marginalized populations are often viewed as groups with low literacy and low economic status. However, in central Beijing, social areas comprising such groups have demonstrated substantial economic resilience over an extended period. It is therefore important to clarify that the marginal populations discussed in this paper are not defined by absolute poverty. Instead, they primarily refer to a large group of non-local residents with relatively lower educational attainment who are somewhat marginalized within the central area. This social area is situated in a region with a strong economic base, where business has boomed since the ‘opening-up’ policies of the late 1970s. The tertiary sector has risen in importance, attracting a large number of migrants. The labor market in this area is characterized by high gender equality, and the economy is active and open. The advantages that come with the area’s central location have provided relatively marginal populations with more opportunities to engage in diverse economic activities. As a result, these areas are predominantly inhabited by service industry workers, commercial migrant workers, and ethnic minorities, many of whom initially settled here to tap into economic opportunities as self-employed individuals. Over time, they have established stable and substantial sources of income, contributing to the overall high economic resilience of the area.
Between 1990 and 2010, the economic resilience of the central area’s high-density mixed social area remained consistently low, though the growth rate accelerated in later years. Since the gradual transformation of China’s housing system towards commercialization and marketization began, Beijing, as a pioneer city in these reforms, has piloted the sale of public housing, thereby enhancing residential mobility [44]. In 1990, this social area was mainly concentrated in the northwestern part of the central area, affected by housing policy reforms and an influx of migrant population. This resulted in a complex residential structure, large economic disparities, high unemployment rates, and weak economic resilience. By 2000, the high-density mixed social area had shifted to the Qianmen area, leveraging its traditional location advantages and historical industrial base, and thereby facilitating higher employment levels for residents and improved economic resilience. By 2010, the scope of the social area expanded and dispersed around Beijing’s ‘convex’ old city. This expansion led to more diversified economic activities, a broader distribution of resources, increased economic vitality, and a significant improvement in economic resilience. By 2020, a new social area emerged in the central area characterized by a high density of people with scientific research talent. The high economic resilience of this area can be primarily attributed to the residents’ high educational background, high income levels, concentrated employment in research-related positions, and strong job stability. These factors have collectively enhanced the area’s economic resilience.
Located in the southwestern part of Beijing’s central area, the Hui minority social area has long been affected by historical and social factors. The residents’ educational attainment and economic status have been low, and commercial development has been limited, mainly meeting the basic needs of residents’ lives, resulting in poor economic resilience. However, with the improvement of the subway, bus, and other transport networks, the advancement of social mores, and the increase in population mobility, commercial development in this social area has accelerated significantly, gradually improving its economic resilience. Between 2010 and 2020, the Niujie Block attracted many domestic and foreign tourists due to its high visibility in overseas Islamic countries and the wide dissemination of its unique culinary culture on the internet. Commercial activities flourished, and economic vitality increased, making it a new economic growth engine, and significantly raising the level of economic resilience in the Hui minority social area.
Figure 11. Distribution and evolution of the economic resilience of different social areas in Beijing’s central area across four time points. (a) 1990; (b) 2000; (c) 2010; and (d) 2020.
Sustainability 16 07098 g011
Figure 12. Bubble chart of the economic resilience ranking changes across different social areas in Beijing’s central area (1990–2020).
Sustainability 16 07098 g012
Population resilience is a direct reflection of residents’ ability to cope with multiple social, political, and environmental pressures, highlighting the importance of human initiative. Within the central area, the middle-class social area has maintained a high level of population resilience over an extended period due to its young demographic structure, high gender equity, and high education level (See Figure 13 and Figure 14). The Hui minority social area has consistently been in the upper middle range in terms of population resilience since 1990, due to its historical heritage and ethnic diversity. Within the context of the rapid development of modern cities, the elevated status of ethnic minorities, their increased access to education, the flourishing of new commercial opportunities, and increased population mobility have all led to a continuous improvement in the population resilience of the Hui minority social area. By 2020, while the population resilience ranking of the Hui minority social area remained relatively high, its absolute value had declined compared to 2010. This decline was due to multiple factors, including the worsening trend of aging and population outflow caused by industrial restructuring. These factors have affected the original Hui-dominated population structure and weakened its population resilience.
The 2010 social area classification clearly identifies regions inhabited by the capital and elite classes, often considered to be of high social status; however, these areas have exhibited deficiencies in population resilience. These areas are characterized by low population densities, small living spaces per capita, and limited ethnic diversity. The elite class is concentrated in the Donghuamen and Tiantan Blocks, which encompass extensive areas of land for public facilities due to their deep historical heritage and special social status, resulting in limited living spaces and consequently low population densities. The situation is similar for members of the capital class. They are also concentrated in blocks where residential land is scarce, such as the Jinrongjie Block, which is characterized by a high density of office buildings; Jianguomen, known for its cultural relics and transport hub functions; and Qianmen, a historical and cultural district predominantly used for commercial purposes. These factors have all contributed to relative lower population densities in these areas.
In 2020, the population resilience of the working-class social area significantly increased to the highest level in the central area. This phenomenon is mainly attributed to the optimal allocation of educational resources and significant economic growth, which led to a substantial increase in the average educational attainment of the working-class population. As society has developed, the sector of the working-class population with higher-than-average educational attainment has seen increased employment opportunities in the business sector, and women’s occupational participation has gradually risen. Additionally, the large-scale renovation of the old city in the central area has effectively expanded the area’s total living space, providing more spacious residential environments for the working class, thereby comprehensively improving their population resilience.
Figure 13. Distribution and evolution of the population resilience of different social areas in Beijing’s central area across four time points. (a) 1990; (b) 2000; (c) 2010; and (d) 2020.
Sustainability 16 07098 g013aSustainability 16 07098 g013b
Figure 14. Bubble chart of the population resilience ranking changes across different social areas in Beijing’s central area (1990–2020).
Sustainability 16 07098 g014
Institutional resilience reflects the ability of urban socio-spaces to withstand and adapt to multidimensional environmental changes. It is a critical component of urban socio-spatial resilience, showcasing the coordination and flexibility of macro-structures and their elements [45,46]. The middle-class social area has undergone a significant transformation in institutional resilience, shifting from weak to strong (See Figure 15 and Figure 16). This trend of increased resilience has become more evident with population growth and areal expansion. In 1990, the Yuetan Block, which housed a concentration of middle-class residents, experienced political fragmentation, which impaired the block’s administrative efficiency and weakened internal stability, resulting in a low level of institutional resilience. As Beijing’s economy thrived, the middle class expanded rapidly. Between 1990 and 2010, its composition became more diverse, including highly educated individuals and other family groups with higher socio-economic status. Faced with institutional changes brought about by the city’s rapid development, these groups adapted quickly and exhibited excellent coping strategies, becoming the core driving force behind the stable development of the area’s institutional resilience.
The institutional resilience of the working-class social area has experienced a complex evolution throughout the study period, in parallel with its spatial changes. These areas are dominated by residents engaged in technical jobs and characterized by a certain level of education and professional skills. In 1990, these characteristics greatly facilitated the governance of the working-class social area and enabled the region to exhibit significant institutional resilience. However, the spatial extent of the working-class social area has changed considerably due to the renovation of the old city and its subsequent gentrification. In 2000, the working-class social area was concentrated in the relatively less redeveloped former Chongwen District. By 2020, members of this social class had dispersed throughout the new Dongcheng District. Between 1990 and 2000, their institutional resilience value declined, dropping from the highest level in the central area to the lowest. By 2020, although the absolute value of institutional resilience of the working-class social area had increased, it remained at the lowest ranking within the central area. This decline was likely due to employment pressures from economic change, which complicated social governance, thus reducing institutional resilience.
From 1990 to 2010, the institutional resilience of both the high-density mixed social area and the Hui social area remained constantly low. The low institutional resilience of the high-density mixed social area was closely related to its complex demographic composition, lack of social security, and governmental challenges. In contrast, the Hui social area’s institutional resilience ranking has decreased annually, primarily due to geographical limitations and relatively lagging overall levels of educational attainment. However, by 2020, the institutional resilience of the Hui social area saw a significant increase, reflecting the positive impact of improved education levels among ethnic minorities.
Between 2010 and 2020, the level of institutional resilience in the capital-class social area increased significantly, rising from a mid-level to the highest level in the central area. During this period, the spatial distribution of the capital-class social area gradually evolved from dispersed to concentrated. By 2020, these areas were primarily concentrated in the Jinrongjie Block, and their spatial concentration gave them prominence in all facets of institutional resilience.
Figure 15. Distribution and evolution of the institutional resilience of different social areas in Beijing’s central area across four time points. (a) 1990; (b) 2000; (c) 2010; and (d) 2020.
Sustainability 16 07098 g015
Figure 16. Bubble chart of the institutional resilience ranking changes across different social areas in Beijing’s central area (1990–2020).
Sustainability 16 07098 g016
Social capital encompasses the total resources, both actual and potential, accessible through individuals’ social networks, which is a critical dimension in discussions of socio-spatial resilience. The level of social capital resilience reflects the diversity and stability of internal connections within social groups and indicates their collective capacity for cooperation, mutual support, and resource mobilization in the face of risks [47,48,49,50,51,52]. This resilience serves as a strong internal impetus for groups when confronting challenges. During the study period, the central area of Beijing exhibited significant variations in social capital resilience across different social areas (See Figure 17 and Figure 18). The middle-class social area consistently maintained high and stable social capital resilience, while the relatively marginal population social area experienced marked fluctuations. Additionally, the capital-class social area and Hui minority social area showed relative improvements in social capital resilience.
The middle-class social area has long demonstrated high levels of social capital resilience. During China’s planned economy period (approximately 1949–1978), the welfare housing allocation system created a work–residence integration model, known as the Danwei (Danwei refers to a Chinese work unit that, during the socialist era, often provided not only employment but also housing and other amenities to its workers. The Danwei system was a cornerstone of urban life in socialist China, serving as more than just a workplace; it was a central organizing principle of daily life. This system significantly influenced the social and spatial organization of urban communities, where all aspects of life were closely tied to the workplace. However, by the 1990s and 2000s, the Danwei system had largely lost its central role in Chinese urban life, though remnants of it persist, particularly in older state-owned enterprises and government institutions.), in which workplace location dictated residential patterns [53,54]. It significantly influenced the social and spatial organization of urban communities, where all aspects of life were closely tied to the workplace. This arrangement persisted into the 1990s, with Beijing’s central area still influenced by the dual forces of the Danwei system and the household registration system. Housing construction and the use of space remained constrained by these systems, intricately linking residential areas to workplaces. The middle-class social area was primarily concentrated in the Yuetan Block, home to numerous national and municipal government institutions. Residents often had dual roles as neighbors and colleagues, and shared similar educational levels of attainment and value systems, thereby fostering tightly knit, well-structured social networks. This multilayered social framework facilitated a strong sense of community, further reinforcing social ties and establishing stable social capital resilience. However, between 1990 and 2000, the functional upgrading of the central area, the promotion of housing commercialization policies, and the economic boom led to increased residential mobility among residents, which in turn contributed to the gentrification process. During this period, the original Dongcheng District became a focal point for the renovation of dilapidated housing due to lower relocation costs. Commercial areas and high-end apartments replaced old buildings, attracting an influx of middle-class residents. The middle-class population and residential space expanded, with some local residents ascending to the new middle class while also drawing in many new middle-class migrants. This internal structural change contributed to a decline in social capital resilience. Nevertheless, the relatively favorable economic conditions of these communities and their active participation in social organizations fostered the formation of new social networks. Consequently, by 2000, the social capital resilience of the middle-class social area in central Beijing remained relatively high compared to other areas.
By 2010, the gentrification process in Beijing’s central area had further accelerated, leading to the gradual migration of the middle class out of the inner-city core, to be replaced by a more stratified elite and capital class. The relatively brief history of these newly-formed communities likely resulted in less frequent interactions among residents. Moreover, the nature of this elite class, which often prioritizes work and professional commitments, contributed to weaker social bonds within the community. This limited their collective capacity to collaborate effectively when facing challenges, resulting in relatively lower levels of social capital resilience. However, due to the high spatial concentration and reduced population mobility within the capital-class social area, the initially weak social interactions among neighbors began to strengthen over time. This increased social cohesion helped mitigate the decline in social capital resilience by 2020. As a result, the social capital resilience in these areas eventually improved, reaching a relatively high level within Beijing’s central area.
The social capital resilience in the relatively marginal social area has experienced complex fluctuations. In 1990, these marginal populations were dispersed, primarily concentrated in the former Dongcheng and Chongwen Districts, with a few in the former Xuanwu District. Historically, Beijing’s inner city (between the Second Ring Road and the Forbidden City) was home to impoverished populations and ethnic minorities. As the economy flourished, the area attracted a significant influx of migrants, with some neighborhoods gradually evolving into key areas for the relatively marginal social area. The diversity and inclusiveness of the residential structure in these areas fostered frequent interactions and mutual assistance among residents, leading to relatively high levels of social capital resilience. Between 2000 and 2020, the spatial distribution of these areas remained relatively stable, with minimal areal redevelopment. The pre-existing strong social networks in these areas were preserved, maintaining high levels of social capital resilience.
Amid rapid gentrification and profound socio-spatial changes, the Hui minority social area in southwestern Beijing’s central area has demonstrated unique residential stability. Centered around the Niujie Block, this area, rich in its historical and cultural heritage and characterized by distinct ethnic features, has maintained spatial stability due to high rates of residents returning to their original residential locations during urban renewal projects, allowing long-term neighborhood relationships to persist. However, significant differences in religious beliefs and lifestyles between the Hui population and other ethnic groups has led to challenges such as inadequate living conditions and insufficient resource allocation, resulting in relatively weak social capital resilience from 1990 to 2000. Over time, as the overall cultural literacy and socioeconomic status of ethnic minorities have improved, the Hui minority social area has not only overcome these challenges but also gained more opportunities for social participation, thereby strengthening internal social bonds. The strong cultural cohesion and community identity within the Hui minority social area has supported the rapid growth of social capital resilience. The shared religious beliefs and cultural background within the Hui community have also deepened spiritual ties among its members. In addition to the Hui population, the Niujie Block hosts a diverse mix of over 20 different ethnic minorities within its 1.44 square kilometers. This multicultural environment fosters frequent interactions among different ethnic groups, enhancing community cohesion and centripetal force, thereby constructing a stable and vibrant social network. As a result, since 2010, this social area has consistently maintained the highest level of social capital resilience within Beijing’s central area.
Figure 17. Distribution and evolution of the social capital resilience of different social areas in Beijing’s central area across four time points. (a) 1990; (b) 2000; (c) 2010; and (d) 2020.
Sustainability 16 07098 g017
Figure 18. Bubble chart of the social capital resilience ranking changes across different social areas in Beijing’s central area (1990–2020).
Sustainability 16 07098 g018

4. Discussion

Before the full impact of China’s reform and ‘opening-up’ policies was felt, the Danwei and household registration systems, as part of the planned economy, restricted residents’ occupational choices, residential locations, and freedom of movement. Socio-economic differences between residents were therefore relatively small, and their places of residence and work were closely intertwined, resulting in low population mobility. Consequently, residents easily formed close social ties through occupational affiliation or long-term cohabitation and geographic ties [55]. The overlap of the Danwei system of occupational affiliation and the geographic relationship of being neighbors for generations built a deep emotional foundation, a strong identity, and robust collective cohesion among residents of such work-housing units, nurturing the high social capital resilience of social areas observed in 1990. From the late 1970s onwards, Chinese society entered a period of rapid transformation characterized by promotion of a social market economy, urbanization, the liberalization of labor mobility, and the commercialization of housing [56,57,58]. As a consequence, this period also saw rapid social differentiation and the formation of new social areas. The liberalization of the housing market increased residents’ freedom of housing choice, and at the same time, its commercialization contributed to the hierarchical differentiation of urban communities. With increased freedom of movement within and across regions, residential segregation became more apparent, forming a new pattern marked by small-scale residential homogeneity and large-scale segregation [59]. From 1990 to 2000, the reorganization of social space and changes in residential structures disrupted existing social ties, leading to a sharp decline in social capital resilience [55]. The weakening of social interactions between individuals challenged the reconstruction of social relations and cohesion within communities, resulting in a slow recovery in social capital resilience in central Beijing’s social areas between 2000 and 2010.
The homogeneity explored in this study refers to the convergence or similarity of different community residents in terms of their social background, cultural roots, and economic income levels within a given social area. It reflects the spatial manifestation of urban stratification and constitutes an opposing conceptual category to heterogeneity. There are two mainstream views on how homogeneity and heterogeneity shape social relations and affect the accumulation of social capital. One view posits that increased heterogeneity facilitates the exchange of knowledge and information, increases the potential for reciprocal behaviors, and is conducive to the accumulation of social capital [60,61,62]. The other view emphasizes that increased homogeneity stimulates members’ psychological resonance and identity, promotes harmonious interactions through community participation, and builds a close social network, thereby contributing to the accumulation of social capital [63,64]. Some scholars, through practical research, have suggested that a community environment combining moderate homogeneity and heterogeneity provides the ideal route to achieve the in-depth development of social relations and the extensive accumulation of social capital [65,66,67]. Based on existing research by Chinese scholars, the mainstream view is that during China’s economic and social transition, increased heterogeneity within the community negatively impacted the accumulation of social capital, weakened residents’ sense of community identity and belonging, and led to decentralized and fragmented community management [68,69,70,71,72,73]. This view is consistent with the findings of this study.
In this study, the high-density mixed social area exhibited the most complex and heterogeneous demographic structure. During China’s period of transition, this area’s social capital resilience declined significantly, making it the only social area to witness a decline in social capital resilience, while many other social areas in the central area experienced recovery from 2000 to 2010. In contrast, the Hui minority social area showed the highest percentage in social capital resilience recovery between 2000 and 2010 due to its long history of settlement and strong homogeneity. Although the capital-class social area also has a high degree of homogeneity, its social capital resilience was relatively low in 2010. This can be attributed to a lack of both participation in community activities and a common cultural identity arising from nuanced differences in the socio-economic conditions of its residents, thereby impeding the formation of strong social ties. In 2020, the social areas within the central area experienced a significant decline in specific indicators, resulting in a general weakening of social capital resilience. However, the capital-class social area exhibited the least decline in social capital resilience compared to other types of social areas. This is closely related to the fact that after a certain degree of contraction in the original settlement space, the interactions between residents increased, and neighborhood ties were strengthened and solidified over time. This highlights the complexity and multidimensionality of the influence of homogeneity in constructing social capital resilience within social areas. The strength of social capital resilience is not only related to a community’s typological characteristics and the degree of homogeneity among its residents but is also affected by the intertwined influences of the broader socio-economic context.
The theoretical emphasis on a high degree of socio-spatial mixing has perhaps been overemphasized in past research, and its appropriateness in real social contexts is questionable [74,75,76]. When significant differences exist between communities, particularly when they have hugely different values and interests, forcing them into the same spatial boundary can easily lead to serious disagreements. This phenomenon is particularly prominent in the mixed construction of commercial and affordable housing within the same communities. Developers often build a ‘separating wall’ to distinguish between these two types of communities [77]. Differentiated treatment in living environments, facilities, and community management can lead to physical separation, resulting in disagreements over the sharing of public space and the use of facilities [78,79]. These conflicts can be difficult to reconcile and may eventually evolve into violent confrontations. Since 2017, there have been frequent incidents of conflict around separating walls in mixed-housing neighborhoods in Beijing, Shenzhen, Guangzhou, and other Chinese cities. Therefore, in certain contexts, moderate spatial segregation and functional differentiation should be re-evaluated, as they may serve as effective means to foster community harmony and mitigate potential conflicts, rather than being seen as forms of social exclusion. Based on the findings of this study, communities that were still significantly shaped by the Danwei system in 1990 exhibited positive trends in social capital resilience. It is therefore to be recommended that cities integrate the development of industrial parks and residential areas for employees into the planning of new development zones, especially for low-pollution or non-polluting tertiary industry parks. Integrating this approach with the currently promoted ‘15 min’ urban life cycle will enhance the job–housing balance. This strategy will also significantly reduce carbon emissions and support sustainable urban development [80]. Additionally, it has the potential to greatly enhance community participation, a sense of belonging, and interpersonal interactions, cultivating a high degree of social capital resilience. This approach could enable residents to achieve a true sense of stability and well-being in urban life.
Although this study has, to a certain extent, revealed the evolutionary characteristics of multidimensional resilience in the central area of Beijing over the 30-year period from 1990 to 2020, it possesses several limitations that need to be addressed and further validated by subsequent studies. Due to the spatial resolution constraints of the publicly available data from the Seventh National Population Census of 2020, significant quantities of data are only available at the district level, lacking detail at the block level. This resulted in a lower degree of refinement of the 2020 data compared to that of 1990–2010, affecting the continuity and accuracy of the study to some extent. Although the construction of the evaluation index system in this study is generally logical and reasonable, the selection and design of individual indicators remain debatable. The indicators used in the evaluation dimension of social capital resilience are more traditional and fail to fully capture the complexity of the dynamic changes affecting modern society. Given the development of the internet and big data, it becomes necessary to introduce more diversified data sources, such as mobile communication data and social network data, to provide a more detailed and comprehensive depiction of community connection networks and to evaluate social capital resilience more accurately [81,82]. In evaluating population resilience, this study’s treatment of the two indicators, i.e., population density and living space per capita, has failed to fully explore their positive and negative aspects. These indicators should be regarded as moderate; values that are either too high or too low are not conducive to resilience. Morphological resilience indicators could also be enriched in the future by extracting key information, such as road network structure, through high-precision remote sensing images to enrich their dimensional representations and achieve a more detailed and accurate analysis [83]. Another significant issue is that, as the core of an international metropolis, the resilience of Beijing’s central area is also obviously influenced by short-term tourists and long-term foreign residents, though their specific impacts are beyond this study’s scope. Future research could expand to include these groups, offering a fuller understanding of the complexity and multidimensional nature of resilience in central Beijing.
Despite this study exploring the entropy weight method and set pair analysis, the current conclusions are mainly based on a relatively idealized single case study. The novelty of this paper lies in its selection of social areas as the unit of analysis for the resilience assessment of metropolitan core areas. In scenarios involving long time spans and multiple time points, social areas composed of similar social groups tend to exhibit spatial discontinuities. However, the settlement characteristics of the same social group can still be accurately recognized in different spatial locations. Therefore, exploring the multidimensional resilience of such social areas is of significant research value. Considering the unique nature and complexity of metropolitan core areas, the manifestation of multidimensional resilience and the characteristics brought about by the homogeneity or heterogeneity of social groups within different metropolitan areas over the same time period may vary. A multi-city study using a multidimensional comparative analysis approach would provide a key route to further deepening practical research. Empirical validation in more complex contexts would help improve and verify the generalizability and replicability of the analytical framework proposed in this study [84,85,86], thereby establishing potentially more instructive resilience assessment and governance strategies.

5. Conclusions

Resilience, as an emerging concept for addressing uncertainty and achieving sustainable development, has gradually transitioned from theory to practice. This shift is evident in the resilience assessments and constructions being undertaken from the national to the city and community level. However, relying solely on traditional administrative divisions for resilience assessment can result in scale and scope discrepancies. This study examined the central area of Beijing, the capital of a rapidly transforming China, and explored a multifaceted resilience assessment regime based on social area units. The findings indicated that, compared to traditional administrative boundaries, socio-spatial divisions that emphasize the network structure of social relations and the dynamic changes within social areas might be more suitable as fundamental units for resilience assessment. These divisions can be dynamically adjusted over time, more flexibly reflecting the true conditions within civil society, rather than relying solely on physical space inferences.
Against the backdrop of China’s rapid transition from a planned economy to a social market economy, Beijing’s central area underwent extensive renovation of its ancient city and significant gentrification from 1990 to 2000. During this period, the overall resilience of the central area and all social areas steadily increased, while social capital resilience notably declined. From 2000 to 2010, although residents in various social areas endeavored to rebuild their networks of connections, leading to some recovery in social capital resilience, it was insufficient to compensate for the losses caused by urban renovation. Between 2000 and 2010, the high-density mixed social area, due to its extraordinarily complex and heterogeneous demographic structure, was the only social area where social capital resilience declined. Its reconstruction and restoration of social capital resilience faced significant challenges. By 2020, the overall level of social capital resilience of the central area had further decreased. Meanwhile, the socio-spatial structure within the central area underwent changes, with some new social areas being delineated. Among these new social areas, social capital resilience was relatively high in the high-density scientific research talent social area, whereas it was lowest in the mixed immigrant social area, which had the most complex demographic composition. Contrary to traditional beliefs that have emphasized the benefits of socio-spatial heterogeneity, this study found that social areas with lower heterogeneity and higher homogeneity in Beijing’s central area during the transition period exhibited higher overall resilience and a more positive trend in the development of their social capital resilience. In contrast, high-density mixed social areas encountered significant obstacles in fostering resilience. These conclusions provide innovative perspectives and references for cities and communities that may aid enhanced resilience in the face of future uncertainties, and for policymakers in selecting appropriate governance strategies.

Author Contributions

Conceptualization, C.X.; Methodology, C.X.; Project administration, C.X.; Software, Y.L. and S.B.; Supervision, C.X.; Visualization, S.Z.; Writing—original draft, Y.L. and S.B.; Writing—review & editing, C.X. All authors have read and agreed to the published version of the manuscript.

Funding

This research was funded by the College Students’ innovation and entrepreneurship training program (X202410636259).

Institutional Review Board Statement

Not applicable.

Informed Consent Statement

Not applicable.

Data Availability Statement

The data utilized in this study are not publicly accessible. To protect the intellectual property rights of the data authors, we regret that sharing the data in its entirety is not currently permitted. However, parts of the data that are already public can be obtained under certain conditions. If readers are interested, please contact the corresponding author for further details.

Acknowledgments

We would like to express our sincere gratitude to the postgraduates who helped with data acquisition and processing, which has laid the foundations for this study. They are Zichuan Guo from Nanjing Normal University and Qi An from Central China Normal University. Miao Ju, Jiayuan Liu, and Zihan Huang from Sichuan Normal University have also offered their support, for which we are grateful.

Conflicts of Interest

The authors declare no conflicts of interest.

Appendix A

Table A1. Beijing’s central area resilience evaluation indicator system.
DimensionIndicatorsAttributeWeight
Economy
(0.2143)
Fiscal revenue per unit area (10,000 yuan/km2)+0.0327
Per capita fixed asset investment (Chinese yuan)+0.0230
Urban registered unemployment rate (%)0.0061
Average wage of on-the-job employees in urban areas (yuan)+0.0331
Per capita disposable income of urban residents (yuan)+0.0325
Consumer price index (CPI, 1980 = 100)0.0107
Engel coefficient (%)0.0080
Gini coefficient of urban households0.0104
Proportion of female employment in the labor force (%)+0.0025
Number of persons in charge of state organs, party and mass organizations, enterprises, and public institutions (%)+0.0032
Per capita retail sales of consumer goods (Chinese yuan)+0.0342
Per capita actual utilization of foreign capital (Chinese yuan)+0.0179
Population
(0.0682)
Percentage of population with college education or above (%)+0.0090
Percentage of population aged 60 and over (%)0.0032
Percentage of population under 15 years old (%)0.0020
Natural change rate in registered population (‰)+0.0032
Population density (persons/km2)+0.0031
Average household size (persons/household)+0.0035
Infant mortality rate (%)0.0104
Living space per capita (m2/person)0.0089
Sex ratio (Female = 100)0.0007
Percentage of ethnic minority population (%)+0.0087
Proportion of population in commerce and service sectors (%)+0.0066
Ratio of population with college education or above to population with high school education or below (%)+0.0090
Institution
(0.1555)
Human development index (HDI)+0.0109
Employment elasticity coefficient+0.0048
Number of technical transactions (in billion Chinese yuan)+0.0252
Proportion of granted patents to individuals (%)+0.0115
Number of administrative cases received by courts0.0085
Percentage of healthcare expenditure in fiscal expenditure (%)+0.0144
Food hygiene compliance rate for catering units (%) +0.0055
Average direct economic loss per fire incident0.0065
Number of proposals submitted by members of the CPPCC (Chinese People’s Political Consultative Conference)+0.0165
Total number of certificates issued by notary offices+0.0407
Corruption Perceptions Index (CPI)+0.0098
Political fragmentation level (%)0.0012
Social Capital
(0.1412)
Percentage of family households versus total households (%)+0.0012
Number of children enrolled in childcare institutions+0.0105
Proportion of educational expenditure versus total local financial expenditure (%)+0.0087
Proportion of urban residents enjoying minimum social security versus the total permanent registered population (%)0.0090
Number of religious professionals per 100,000 people+0.0411
Number of social organization members per 10,000 people+0.0264
Number of trade union members per 10,000 people+0.0090
Number of full-time women’s federation cadres per 10,000 persons+0.0096
Percentage of resident population classed as permanent (%)+0.0041
Percentage of migrants from other provinces versus total number of
permanent residents (%)
0.0026
Number of mediators per 10,000 people+0.0088
Clearance rate for criminal cases (%)+0.0100
Ecology
(0.1399)
Number of trees per square kilometer at year-end+0.0055
Number of lawns per square kilometer at year-end+0.0064
Green coverage rate of built-up areas (%)+0.0046
Percentage of days with air quality at grade II or better (%)+0.0095
Daily average atmospheric sulfur dioxide content (mg/m2)0.0077
Urban domestic wastewater treatment rate (%)+0.0105
Comprehensive utilization rate of industrial solid waste (%)+0.0119
Average regional environmental noise (dB)0.0086
Proportion of environmental investment in urban infrastructure investment (%)+0.0101
Energy consumption per 10,000 Chinese yuan of GDP (tons of standard coal)0.0085
Energy consumption elasticity coefficient0.0341
Electricity consumption elasticity coefficient0.0225
Engineering
(0.2413)
Per capita managed residential building area+0.0414
Per capita passenger volume (people)+0.0116
Per capita completed residential building area+0.0646
Average number of hospital and clinic beds per 1000 persons+0.0053
Power supply redundancy+0.0307
Water supply redundancy+0.0114
Proportion of district roads versus total urban area (%)+0.0148
Proportion of infrastructure investment versus total social fixed asset investment (%)+0.0153
Per capita passenger transport volume (persons)+0.0231
Per capita freight transport volume (tons)+0.0144
Average daily public transport rides per capita+0.0087
Network
(0.0114)
Number of mobile phones per 10,000 households+0.0114
Morphology
(0.0281)
Road network density (kilometers/square kilometers)+0.0281

References

  1. Leach, M. Re–Framing Resilience: A Symposium Report. In Working Paper 13; STEPS Centre: Brighton, UK, 2008. [Google Scholar]
  2. Foster, K.A. Regional resilience. In How Do We Know It When We See It. Conference on Urban and Regional Policy and Its Effects; Brookings Institution: Washington, DC, USA, 2010; Volume 4. [Google Scholar]
  3. Martin-Breen, P.; Anderies, J.M. Resilience: A Literature Review; Institute of Development Studies: Brighton, UK, 2011. [Google Scholar]
  4. Christopherson, S.; Michie, J.; Tyler, P. Regional resilience: Theoretical and empirical perspectives. Camb. J. Reg. Econ. Soc. 2010, 3, 3–10. [Google Scholar] [CrossRef]
  5. Consultancy, W.C. Demographia World Urban Areas (Built Up Urban Areas or World Agglomerations) 19th Annual Edition; New Geography; Wendel Cox Consultancy: Los Angeles, CA, USA, 2023; p. 5. [Google Scholar]
  6. Zheng, Y.; Xin-Lu, X.; Chen-Zhen, L.; Mou, W.; Xiao-Jia, H. Development as adaptation: Framing and measuring urban resilience in Beijing. Adv. Clim. Chang. Res. 2018, 9, 234–242. [Google Scholar] [CrossRef]
  7. Liu, L.; Lei, Y.; Zhuang, M.; Ding, S. The impact of climate change on urban resilience in the Beijing-Tianjin-Hebei region. Sci. Total Environ. 2022, 827, 154157. [Google Scholar] [CrossRef]
  8. Capozzo, M.; Rizzi, A.; Cimellaro, G.; Domaneschi, M.; Barbosa, A.; Cox, D. Multi-hazard resilience assessment of a coastal community due to offshore earthquakes. J. Earthq. Tsunami 2019, 13, 1950008. [Google Scholar] [CrossRef]
  9. Koren, D.; Rus, K. The potential of open space for enhancing urban seismic resilience: A literature review. Sustainability 2019, 11, 5942. [Google Scholar] [CrossRef]
  10. Li, Z.; Zhang, X.; Ma, Y.; Feng, C.; Hajiyev, A. A multi-criteria decision making method for urban flood resilience evaluation with hybrid uncertainties. Int. J. Disaster Risk Reduct. 2019, 36, 101140. [Google Scholar] [CrossRef]
  11. Zhong, M.; Lin, K.; Tang, G.; Zhang, Q.; Hong, Y.; Chen, X. A framework to evaluate community resilience to urban floods: A case study in three communities. Sustainability 2020, 12, 1521. [Google Scholar] [CrossRef]
  12. Zhang, X.; Song, J.; Peng, J.; Wu, J. Landslides-oriented urban disaster resilience assessment—A case study in ShenZhen, China. Sci. Total Environ. 2019, 661, 95–106. [Google Scholar] [CrossRef]
  13. Smith, N. Uneven Development: Nature, Capital, and the Production of Space; University of Georgia Press: Athens, GA, USA, 2010. [Google Scholar]
  14. MacKinnon, D.; Derickson, K.D. From resilience to resourcefulness: A critique of resilience policy and activism. Prog. Hum. Geogr. 2013, 37, 253–270. [Google Scholar] [CrossRef]
  15. Zhang, J.; Wang, T. Urban resilience under the COVID-19 pandemic: A quantitative assessment framework based on system dynamics. Cities 2023, 136, 104265. [Google Scholar] [CrossRef]
  16. Lak, A.; Hakimian, P.; Sharifi, A. An evaluative model for assessing pandemic resilience at the neighborhood level: The case of Tehran. Sustain. Cities Soc. 2021, 75, 103410. [Google Scholar] [CrossRef] [PubMed]
  17. Bruneau, M.; Chang, S.E.; Eguchi, R.T.; Lee, G.C.; O’Rourke, T.D.; Reinhorn, A.M.; Shinozuka, M.; Tierney, K.; Wallace, W.A.; Von Winterfeldt, D. A framework to quantitatively assess and enhance the seismic resilience of communities. Earthq. Spectra 2003, 19, 733–752. [Google Scholar] [CrossRef]
  18. Allenby, B.; Fink, J. Toward inherently secure and resilient societies. Science 2005, 309, 1034–1036. [Google Scholar] [CrossRef]
  19. Cutter, S.L.; Barnes, L.; Berry, M.; Burton, C.; Evans, E.; Tate, E.; Webb, J. A place-based model for understanding community resilience to natural disasters. Glob. Environ. Chang. 2008, 18, 598–606. [Google Scholar] [CrossRef]
  20. Norris, F.H.; Stevens, S.P.; Pfefferbaum, B.; Wyche, K.F.; Pfefferbaum, R.L. Community resilience as a metaphor, theory, set of capacities, and strategy for disaster readiness. Am. J. Community Psychol. 2008, 41, 127–150. [Google Scholar] [CrossRef]
  21. Cutter, S.L.; Burton, C.G.; Emrich, C.T. Disaster resilience indicators for benchmarking baseline conditions. J. Homel. Secur. Emerg. Manag. 2010, 7, 1–22. [Google Scholar] [CrossRef]
  22. Pendall, R.; Foster, K.A.; Cowell, M. Resilience and regions: Building understanding of the metaphor. Camb. J. Reg. Econ. Soc. 2010, 3, 71–84. [Google Scholar] [CrossRef]
  23. Sherrieb, K.; Norris, F.H.; Galea, S. Measuring capacities for community resilience. Soc. Indic. Res. 2010, 99, 227–247. [Google Scholar] [CrossRef]
  24. Kulig, J.C.; Edge, D.S.; Townshend, I.; Lightfoot, N.; Reimer, W. Community resiliency: Emerging theoretical insights. J. Community Psychol. 2013, 41, 758–775. [Google Scholar] [CrossRef]
  25. Cutter, S.L.; Ash, K.D.; Emrich, C.T. The geographies of community disaster resilience. Glob. Environ. Chang. 2014, 29, 65–77. [Google Scholar] [CrossRef]
  26. Wang, Z.; Deng, X.; Wong, C.; Li, Z.; Chen, J. Learning urban resilience from a social-economic-ecological system perspective: A case study of Beijing from 1978 to 2015. J. Clean. Prod. 2018, 183, 343–357. [Google Scholar] [CrossRef]
  27. Da Mata Martins, M.C.; Da Silva, A.N.R.; Pinto, N. An indicator-based methodology for assessing resilience in urban mobility. Transp. Res. Part D Transp. Environ. 2019, 77, 352–363. [Google Scholar] [CrossRef]
  28. Kammouh, O.; Zamani Noori, A.; Cimellaro, G.P.; Mahin, S.A. Resilience assessment of urban communities. ASCE-ASME J. Risk Uncertain. Eng. Syst. Part A Civ. Eng. 2019, 5, 04019002. [Google Scholar]
  29. Feng, X.; Xiu, C.; Bai, L.; Zhong, Y.; Wei, Y. Comprehensive evaluation of urban resilience based on the perspective of landscape pattern: A case study of Shenyang city. Cities 2020, 104, 102722. [Google Scholar] [CrossRef]
  30. Sajjad, M.; Chan, J.C.; Chopra, S.S. Rethinking disaster resilience in high-density cities: Towards an urban resilience knowledge system. Sustain. Cities Soc. 2021, 69, 102850. [Google Scholar] [CrossRef]
  31. Shi, Y.; Zhai, G.; Xu, L.; Zhou, S.; Lu, Y.; Liu, H.; Huang, W. Assessment methods of urban system resilience: From the perspective of complex adaptive system theory. Cities 2021, 112, 103141. [Google Scholar] [CrossRef]
  32. Liu, L.; Lei, Y.; Fath, B.D.; Hubacek, K.; Yao, H.; Liu, W. The spatio-temporal dynamics of urban resilience in China’s capital cities. J. Clean. Prod. 2022, 379, 134400. [Google Scholar] [CrossRef]
  33. Lu, H.; Zhang, C.; Jiao, L.; Wei, Y.; Zhang, Y. Analysis on the spatial-temporal evolution of urban agglomeration resilience: A case study in Chengdu-Chongqing Urban Agglomeration, China. Int. J. Disaster Risk Reduct. 2022, 79, 103167. [Google Scholar] [CrossRef]
  34. Serdar, M.Z.; Koç, M.; Al-Ghamdi, S.G. Urban transportation networks resilience: Indicators, disturbances, and assessment methods. Sustain. Cities Soc. 2022, 76, 103452. [Google Scholar] [CrossRef]
  35. Ye, C.; Hu, M.; Lu, L.; Dong, Q.; Gu, M. Spatio-temporal evolution and factor explanatory power analysis of urban resilience in the Yangtze River Economic Belt. Geogr. Sustain. 2022, 3, 299–311. [Google Scholar] [CrossRef]
  36. Zhao, R.; Fang, C.; Liu, J.; Zhang, L. The evaluation and obstacle analysis of urban resilience from the multidimensional perspective in Chinese cities. Sustain. Cities Soc. 2022, 86, 104160. [Google Scholar] [CrossRef]
  37. Wang, H.; Liu, Z.; Zhou, Y. Assessing urban resilience in China from the perspective of socioeconomic and ecological sustainability. Environ. Impact Assess. Rev. 2023, 102, 107163. [Google Scholar] [CrossRef]
  38. Ma, L.; Zhao, J.H.; Hong, M.; Chen, L.L. Application of set pair analysis model based on entropy weight for comprehensive evaluation of water resources carrying capacity. Appl. Mech. Mater. 2012, 195, 764–769. [Google Scholar] [CrossRef]
  39. Su, F.; Li, P.; He, X.; Elumalai, V. Set pair analysis in earth and environmental sciences: Development, challenges, and future prospects. Expo. Health 2020, 12, 343–354. [Google Scholar] [CrossRef]
  40. Su, M.; Yang, Z.; Chen, B. Set pair analysis for urban ecosystem health assessment. Commun. Nonlinear Sci. Numer. Simul. 2009, 14, 1773–1780. [Google Scholar] [CrossRef]
  41. Su, F.; Zhang, P. Vulnerability assessment of petroleum city’s economic system based on set pair analysis: A case study of daqing city. Acta Geogr. Sin. 2010, 65, 454–464. [Google Scholar]
  42. Su, F.; Chen, Y.; Zhang, P. Vulnerability assessment of tourism city’s economic system based on the set pair analysis: A case study of Zhoushan city. Sci. Geogr. Sin. 2013, 33, 538–544. [Google Scholar]
  43. Xu, C.; An, Q.; Guo, Z.; Yu, X.; Zhang, J.; Tang, K. Comparative Study on Socio-Spatial Structures of the Typical Plain Cities of Chengdu and Beijing in Transitional China. Sustainability 2023, 15, 4364. [Google Scholar] [CrossRef]
  44. Bai, B. Analysis of the dynamics of Chinese housing policy changes since Reform and Opening-up: From the perspective of Multiple-Streams framework. J. Public Manag. 2010, 7, 76–85. [Google Scholar]
  45. Young, O.R. Institutional dynamics: Resilience, vulnerability and adaptation in environmental and resource regimes. Glob. Environ. Chang. 2010, 20, 378–385. [Google Scholar] [CrossRef]
  46. Ribeiro, P.J.G.; Gonçalves, L.A.P.J. Urban resilience: A conceptual framework. Sustain. Cities Soc. 2019, 50, 101625. [Google Scholar] [CrossRef]
  47. Coleman, J.S. Foundations of Social Theory; Harvard University Press: Cambridge, MA, USA, 1994. [Google Scholar]
  48. Lochner, K.; Kawachi, I.; Kennedy, B.P. Social capital: A guide to its measurement. Health Place 1999, 5, 259–270. [Google Scholar] [CrossRef] [PubMed]
  49. Pretty, J.; Ward, H. Social capital and the environment. World Dev. 2001, 29, 209–227. [Google Scholar] [CrossRef]
  50. Putnam, R. Social capital: Measurement and consequences. Can. J. Policy Res. 2001, 2, 41–51. [Google Scholar]
  51. Fukuyama, F. Social capital and development. SAIS Rev. 2002, 22, 23–37. [Google Scholar] [CrossRef]
  52. Sandefur, R.L.; Laumann, E.O. A paradigm for social capital. In Rationality and Society; Routledge: London, UK, 1998; Volume 10, pp. 481–501. [Google Scholar]
  53. Bjorklund, E. The Danwei: Socio-spatial characteristics of work units in China’s urban society. Econ. Geogr. 1986, 62, 19–29. [Google Scholar] [CrossRef]
  54. Bray, D. Social Space and Governance in Urban China: The Danwei System from Origins to Reform; Stanford University Press: California, CA, USA, 2005. [Google Scholar]
  55. Cai, H.; He, X. Urban community heterogeneity and cohesion: A study of neighborhood relationships. J. Sun Yat-Sen Univ. (Soc. Sci. Ed.) 2014, 54, 133–151. [Google Scholar]
  56. Huang, Y. From work-unit compounds to gated communities: Housing inequality and residential segregation in transitional Beijing. In Restructuring the Chinese City; Routledge: London, UK; New York, NY, USA, 2004; pp. 172–198. [Google Scholar]
  57. Zhang, C.; Chai, Y.; Chen, L. The evolution from Danwei community to citizen community: Case study of Tongrentang in Beijing. Urban Plan. Int. 2009, 24, 33–36. [Google Scholar]
  58. Chai, Y.; Zhang, C. Geographical approach to Danwei in Chinese cities: A key to understand the transition of urban China. Urban Plan. Int. 2009, 24, 2–6. [Google Scholar]
  59. Mu, X.; Yang, W. Homogeneity of habitation and the community reconstruction in urban spatial evolvement in big cities: A case study of three mega-communities in Beijing. Hum. Geogr. 2013, 28, 24–30. [Google Scholar]
  60. Narayan-Parker, D. Voices of the Poor: Poverty and Social Capital in Tanzania; ESD Studies and Monographs Series; World Bank Publications: Washington, DC, USA, 1997; Volume 20. [Google Scholar]
  61. Stolle, D.; Rochon, T.R. Are all associations alike? Member diversity, associational type, and the creation of social capital. Am. Behav. Sci. 1998, 42, 47–65. [Google Scholar] [CrossRef]
  62. Grootaert, C. Social Capital, Household Welfare and Poverty in Indonesia; Local Level Institutions Working Paper 6; World Bank Publications, Social Development Department: Washington, DC, USA, 1999. [Google Scholar]
  63. Alesina, A.; La Ferrara, E. Participation in heterogeneous communities. Q. J. Econ. 2000, 115, 847–904. [Google Scholar] [CrossRef]
  64. Alesina, A.; La Ferrara, E. Who trusts others? J. Public Econ. 2002, 85, 207–234. [Google Scholar] [CrossRef]
  65. Gans, H.J. The balanced community: Homogeneity or heterogeneity in residential areas? J. Am. Inst. Plan. 1961, 27, 176–184. [Google Scholar] [CrossRef]
  66. Majka, T.J.; Donnelly, P.G. Cohesiveness within a heterogeneous urban neighborhood: Implications for community in a diverse setting. J. Urban Aff. 1988, 10, 141–159. [Google Scholar] [CrossRef]
  67. Gans, H.J. The Levittowners: Ways of Life and Politics in a New Suburban Community; Columbia University Press: New York, NY, USA, 2017. [Google Scholar]
  68. Wang, Y. A case study on urban community in Shanghai community classification spatial distribution and changing tendencies. Urban Plan. Forum 2002, 6, 33–40+79. [Google Scholar]
  69. Li, J.; Huang, R.; Feng, A. A study of urban community heterogeneity and neighborhood socialcapital. Fudan J. (Soc. Sci. Ed.) 2007, 5, 67–73. [Google Scholar]
  70. Sun, B. Community toward heterogeneous structure: The case of a danwei block. Nanjing J. Soc. Sci. 2012, 9, 49–54. [Google Scholar]
  71. He, X.; Liu, P. Reasearch on heterogeneous social structure and neighborhood relationship in urban communities. Hum. Geogr. 2016, 31, 1–9. [Google Scholar]
  72. Cai, H.; Zhang, Y. Urban community heterogeneity and integration: An analysis based on the 2014 China Labor Force Dynamics Survey. Soc. Sci. Front. 2017, 182–193. [Google Scholar]
  73. Liu, Y.; He, S. Unpacking the heterogeneity of poor neighbourhoods and neighbouring in large Chinese cities. Area Dev. Policy 2017, 2, 294–313. [Google Scholar] [CrossRef]
  74. Arthurson, K. Creating inclusive communities through balancing social mix: A critical relationship or tenuous link? Urban Policy Res. 2002, 20, 245–261. [Google Scholar] [CrossRef]
  75. Bolt, G.; Phillips, D.; Van Kempen, R. Housing policy, (de)segregation and social mixing: An international perspective. Housing Studies. 2010, 25, 129–135. [Google Scholar] [CrossRef]
  76. Bacqué, M.H.; Fijalkow, Y.; Launay, L.; Vermeersch, S. Social mix policies in Paris: Discourses, policies and social effects. Int. J. Urban Reg. Res. 2011, 35, 256–273. [Google Scholar] [CrossRef]
  77. Ye, D.; Chen, S.; Zhang, J. Research on living conflict of affordable housing community from the mixed living perspective: A case study of R community in Fuzhou city. Mod. Urban Res. 2023, 10, 68–74. [Google Scholar]
  78. Lv, C. Conflicts and integration of different classes’ living styles in big cities: Theory, practice and introspection of housing mix and social mix. J. Harbin Inst. Technol. (Soc. Sci. Ed.) 2019, 21, 47–53. [Google Scholar]
  79. Gu, Y. The declining of ‘Publicity’ in urban mixed community and its reconstruction. Study Pract. 2018, 7, 92–99. [Google Scholar]
  80. Wang, D.; Chai, Y. The jobs–housing relationship and commuting in Beijing, China: The legacy of Danwei. J. Transp. Geogr. 2009, 17, 30–38. [Google Scholar] [CrossRef]
  81. Xie, L.; Pinto, J.; Zhong, B. Building community resilience on social media to help recover from the COVID-19 pandemic. Comput. Hum. Behav. 2022, 134, 107294. [Google Scholar] [CrossRef] [PubMed]
  82. Liu, Y.; Wang, X.; Song, C.; Chen, J.; Shu, H.; Wu, M.; Guo, S.; Huang, Q.; Pei, T. Quantifying human mobility resilience to the COVID-19 pandemic: A case study of Beijing, China. Sustain. Cities Soc. 2023, 89, 104314. [Google Scholar] [CrossRef] [PubMed]
  83. Zhang, S.; Lei, J.; Zhang, X.; Tong, Y.; Lu, D.; Fan, L.; Duan, Z. Assessment and optimization of urban spatial resilience from the perspective of life circle: A case study of Urumqi, NW China. Sustain. Cities Soc. 2024, 109, 105527. [Google Scholar] [CrossRef]
  84. Zhang, L.; Zhao, J.; Liu, J.; Chen, K. Community disaster resilience in the COVID-19 outbreak: Insights from shanghai’s experience in china. Risk Manag. Healthc. Policy 2021, 13, 3259–3270. [Google Scholar] [CrossRef]
  85. Hu, X.; Li, L.; Dong, K. What matters for regional economic resilience amid COVID-19? Evidence from cities in Northeast China. Cities 2022, 120, 103440. [Google Scholar] [CrossRef] [PubMed]
  86. Li, S.; Chen, P.; Hui, F.; Gong, M. Evaluating urban vitality and resilience under the influence of the COVID-19 pandemic from a mobility perspective: A case study in Shenzhen, China. J. Transp. Geogr. 2024, 117, 103886. [Google Scholar] [CrossRef]
Figure 1. Location map of the study area.
Sustainability 16 07098 g001
Table 1. Multi-perspective resilience of Beijing’s central area.
Resilience Configuration1990200020102020
Comprehensive resilience0.31540.34310.46280.6703
Comprehensive resilience
(Excluding network and morphological dimensions)
0.32570.34910.46010.6567
Spatial resilience0.27810.34780.46110.6927
Social resilience0.34020.33990.46430.6544
Disclaimer/Publisher’s Note: The statements, opinions and data contained in all publications are solely those of the individual author(s) and contributor(s) and not of MDPI and/or the editor(s). MDPI and/or the editor(s) disclaim responsibility for any injury to people or property resulting from any ideas, methods, instructions or products referred to in the content.

