Article

The Impact of Environmental Courts on Green Total Factor Productivity in Chinese Cities

Economics and Management School, Wuhan University, Wuhan 430072, China
*
Author to whom correspondence should be addressed.
Sustainability 2024, 16(16), 7007; https://doi.org/10.3390/su16167007
Submission received: 23 June 2024 / Revised: 5 August 2024 / Accepted: 12 August 2024 / Published: 15 August 2024
(This article belongs to the Topic Emerging Technologies, Law and Policies)

Abstract

:
As a judicial environmental regulation strategy designed to promote environmental protection, environmental courts have drawn substantial interest. However, whether they can effectively balance the economy and the environment requires further exploration. In this study, we utilized data from 282 Chinese cities from 2004 to 2019 to examine the relationship between environmental courts and green total factor productivity using a multi-period difference-in-differences model. The findings were as follows: (1) Environmental courts led to a notable increase in green total factor productivity. (2) The reduction in carbon intensity and the enhancement of administrative environmental regulation mediated the increase driven by environmental courts. (3) The financial institutions’ support and green technology innovation positively moderated the impact of environmental courts. (4) The role of environmental courts was more pronounced in the western region and in non-low-carbon pilot cities. We explored environmental courts’ effects on green economy development and the internal mechanisms of this, providing policy recommendations to achieve more effective judicial impacts.

1. Introduction

With the rapid expansion of the economy, environmental concerns have become increasingly prominent. The current inefficient and highly polluting economic development model has led to serious environmental issues, such as high carbon emissions, water pollution, and resource wastage [1,2,3]. Countries around the world are paying close attention to this issue, pursuing a mutually beneficial relationship between the environment and the economy, and actively seeking effective strategies to achieve this objective. Reducing resource consumption, lowering carbon emissions, enhancing public environmental awareness, and ensuring high-quality green economic development have become key priorities for China [4,5]. Since 1989, the Chinese government has implemented environmental protection laws and committed to protecting the environment through a mechanism primarily based on administrative penalties, with judicial protection as a supplement [6,7]. However, the administrative penalties of this mechanism were not initially sufficient [8]. Environmental courts, as an effective judicial environmental regulation strategy that aimed to address the shortcomings of administrative environmental regulation, were proven to play a significant role in reducing carbon emissions, controlling environmental pollution, and enhancing energy efficiency [9,10,11], offering robust legal safeguarding for Chinese green and sustainable development [12]. Studies have shown that the contribution of environmental courts to environmental protection is undeniable. However, green economic development requires both environmental protection and economic growth, and both are equally important. Some studies have shown that environmental courts can achieve environmental goals without affecting economic growth [13]; however, no effect on economic growth does not necessarily mean a promotion of green economic growth. Whether environmental courts can achieve a win–win situation for environmental protection and economic growth is an ongoing topic of study, with research remaining relatively sparse. Therefore, studying the role and impact mechanism of environmental courts on green economic development has practical significance.
In this study, we focused on the impact of environmental courts on regional green total factor productivity (GTFP), used environmental court policies as exogenous policy shocks, and employed a multi-period DID model for quasi-natural experiments. We further verified the mediating effect of carbon intensity and administrative environmental regulation and the moderating effect of financial institution loans on green technology innovation and conducted heterogeneity tests based on whether cities were designated as low-carbon pilot cities and the different regions they were in. This comprehensive approach elucidated the actual role of environmental courts in green economic development.
In this paper, we made three main contributions. Firstly, we proposed a new research perspective. While studies on the impact of environmental courts on various indicators of green development, such as green innovation and carbon emission intensity, are common, studies that consider economic benefits are relatively lacking. In this study, we used GTFP to measure green economic development and enriched the research by examining the environmental courts’ influence on GTFP. Secondly, we explored the intrinsic connections between different types of environmental regulations. As a crucial policy supplement to administrative environmental regulation, whether environmental courts also influence administrative environmental regulation was worth investigating. We used administrative environmental regulation as a mediator to reveal the transmission of impacts among various types of environmental regulations. Finally, through moderation effect analysis, we identified objective conditions under which environmental courts generate more positive impacts. Achieving green economic development not only requires strengthening environmental regulations, but also necessitates comprehensive urban development to provide adequate financial and technological support.

2. Literature Review and Research Hypothesis

2.1. Research on Environmental Courts

In the mid-20th century, the United States and Australia were the first to establish specialized courts for hearing environmental resource cases [14]. The number of environmental courts increased dramatically, demonstrating significant advantages in both common law and civil law countries, and attracted widespread attention from the academic community [15,16]. China drew lessons from abroad and established the first environmental court at the Intermediate People’s Court of Qingzhen, in Guizhou Province, in 2007 [17]. Subsequently, China has established environmental courts nationwide, with a total of 1353 environmental courts at all levels set up by 2019, marking significant progress in the specialized judicial reform of environmental protection [18]. At the same time, studies on environmental courts have progressively expanded. Some studies have shown that the environmental courts not only effectively reduce carbon emissions [9] but also help combat green crimes [19], break the collusion between local authorities and businesses [20], directly increase corporate environmental investment, and promote green innovation [12,21]. Other studies have also indicated that environmental courts play a role in advancing environmental litigation and enhancing the level of environmental justice; however, the mechanisms of environmental courts are not well understood, and their territorial jurisdiction and support measures require improvement [22].
The environmental courts in China have taken various forms, including specialized environmental resource tribunals established by provincial high people’s courts or intermediate people’s courts, as well as environmental resource collegiate benches and circuit courts established by basic people’s courts [22]. After years of effort, the environmental judicial system in China has evolved such that environmental courts are now commonly set up in high courts, and as needed in intermediate and basic courts [23]. Collegiate benches and circuit courts are flexible in terms of handling environmental cases, but they are often temporary and have unstable judicial personnel. In comparison, judicial tribunals have more stable personnel, cover a wider range of cases, and have a stronger ongoing impact on environmental protection [22]. Furthermore, according to the judicial principle of “two-instance final judgment” for civil cases in China, most cases are initially handled by intermediate or lower people’s courts. Only when both parties have objections to the judgment results does the higher people’s court further review the case [24]. Most environmental cases are typically resolved within the jurisdiction of the intermediate people’s court. Therefore, the environmental courts of intermediate courts in various prefecture-level cities have exerted the most immediate influence on the local economy, government, and society, drawing significant research interest [9,17,25,26].

2.2. Research on GTFP

The pursuit of green sustainable development has long been a topic of global concern [27,28,29]. Researchers have widely used GTFP as a composite efficiency indicator for green economic development, which incorporates non-desirable outputs such as energy consumption and environmental pollution into the calculation of total factor productivity to balance economic growth and environmental improvement [30,31]. Many researchers conducting panel data research have employed the Global Malmquist–Luenberger (GML) index method to assess fluctuations in GTFP over time [31,32,33]. Compared to single indicators such as carbon emissions [34], GTFP better reflects comprehensive economic efficiency and more accurately measures the quality of green development [35]. Numerous researchers have utilized GTFP as an indicator for assessing green economic development and have investigated the influence of factors such as policies [36], research and development investment [37], and mechanization [38]. The level of green economic development in different regions shows a degree of variability due to differences in the relevant factors in each region. Researchers have studied the regional differences in Chinese green economic development by establishing the GTFP evaluation index system [39]. Other researchers have focused on the impact of industrial GTFP on green development in different regions or neighboring regions [33]. These studies have all indicated that GTFP is crucial for achieving a balance between economic growth and environmental management in China [40].

2.3. Research Hypothesis

We predicted the positive impact of environmental courts on GTFP considering the following two aspects. First, previous studies have confirmed the influence of environmental policies on GTFP [41]. Various environmental policies such as the “Air Pollution Control and Prevention Action Plan” [42], environmental and economic policies [43], and carbon emission constraints [44], affect GTFP. As an important environmental policy, environmental courts were expected to enhance GTFP. Second, some studies have confirmed that the establishment of environmental courts helps to improve judicial efficiency and strengthen environmental protection [10,13] and effectively reduces carbon intensity [21], and since carbon emissions are a key component in calculating GTFP [44,45], a reduction in carbon intensity due to environmental courts was expected to promote GTFP growth. Therefore, we proposed the following hypothesis:
Hypothesis 1.
The environmental courts have a positive impact on GTFP by reducing the carbon intensity.
The establishment of environmental courts as a form of judicial environmental regulation has enhanced government attention to environmental issues and increased administrative penalties for environmental cases [12]. The strengthened administrative environmental regulations are reflected in government work reports and have directly influenced the development of the regional green economy [46,47]. Some studies have also indicated that environmental courts not only help combat green crimes [20], but also disrupt collusion between local authorities and businesses [22]. Based on this, we inferred that judicial environmental regulation has a positive impact on administrative environmental regulation, and proposed the following hypothesis:
Hypothesis 2.
The environmental courts strengthen administrative environmental regulation, thereby promoting the growth of GTFP.
Some researchers have suggested that financial loan support helps companies rapidly achieve green transformation, thereby reducing environmental violations [48,49]. Additionally, other studies have indicated a correlation between the advancement of green technology and environmental courts, suggesting that judicial environmental pressure can force companies to rely on green patent research and development to quickly reduce carbon emissions and avoid fines [50,51]. Relying on financial loan support and green technology innovation enables companies to quickly move towards a positive development path, thereby achieving green and sustainable growth in regional economies. Based on this, we proposed two hypotheses:
Hypothesis 3.
Financial loans facilitate the environmental courts to exert positive effects.
Hypothesis 4.
Green technology innovation facilitates the environmental courts to exert positive effects.
Due to regional differences in relevant factors, green economic development levels vary [39]. The environmental courts have jurisdictional divisions, and their effects vary in different regions [10]. Conducting a regional heterogeneity analysis proved crucial [52]. Additionally, research has indicated that low-carbon pilot projects can help enterprises rapidly achieve green transformation, making their impact noteworthy [53,54]. As another significant environmental policy, the low-carbon pilot policy, which has lasted from 2010 to present, had considerable overlap with environmental court policy from 2007 to present. Therefore, it was also essential to test for heterogeneity based on whether cities were low-carbon pilot cities. Consequently, we conducted two heterogeneity analyses based on different regions or whether the cities under study were low-carbon pilot cities.

3. Environmental Courts in China and the GTFP Calculation

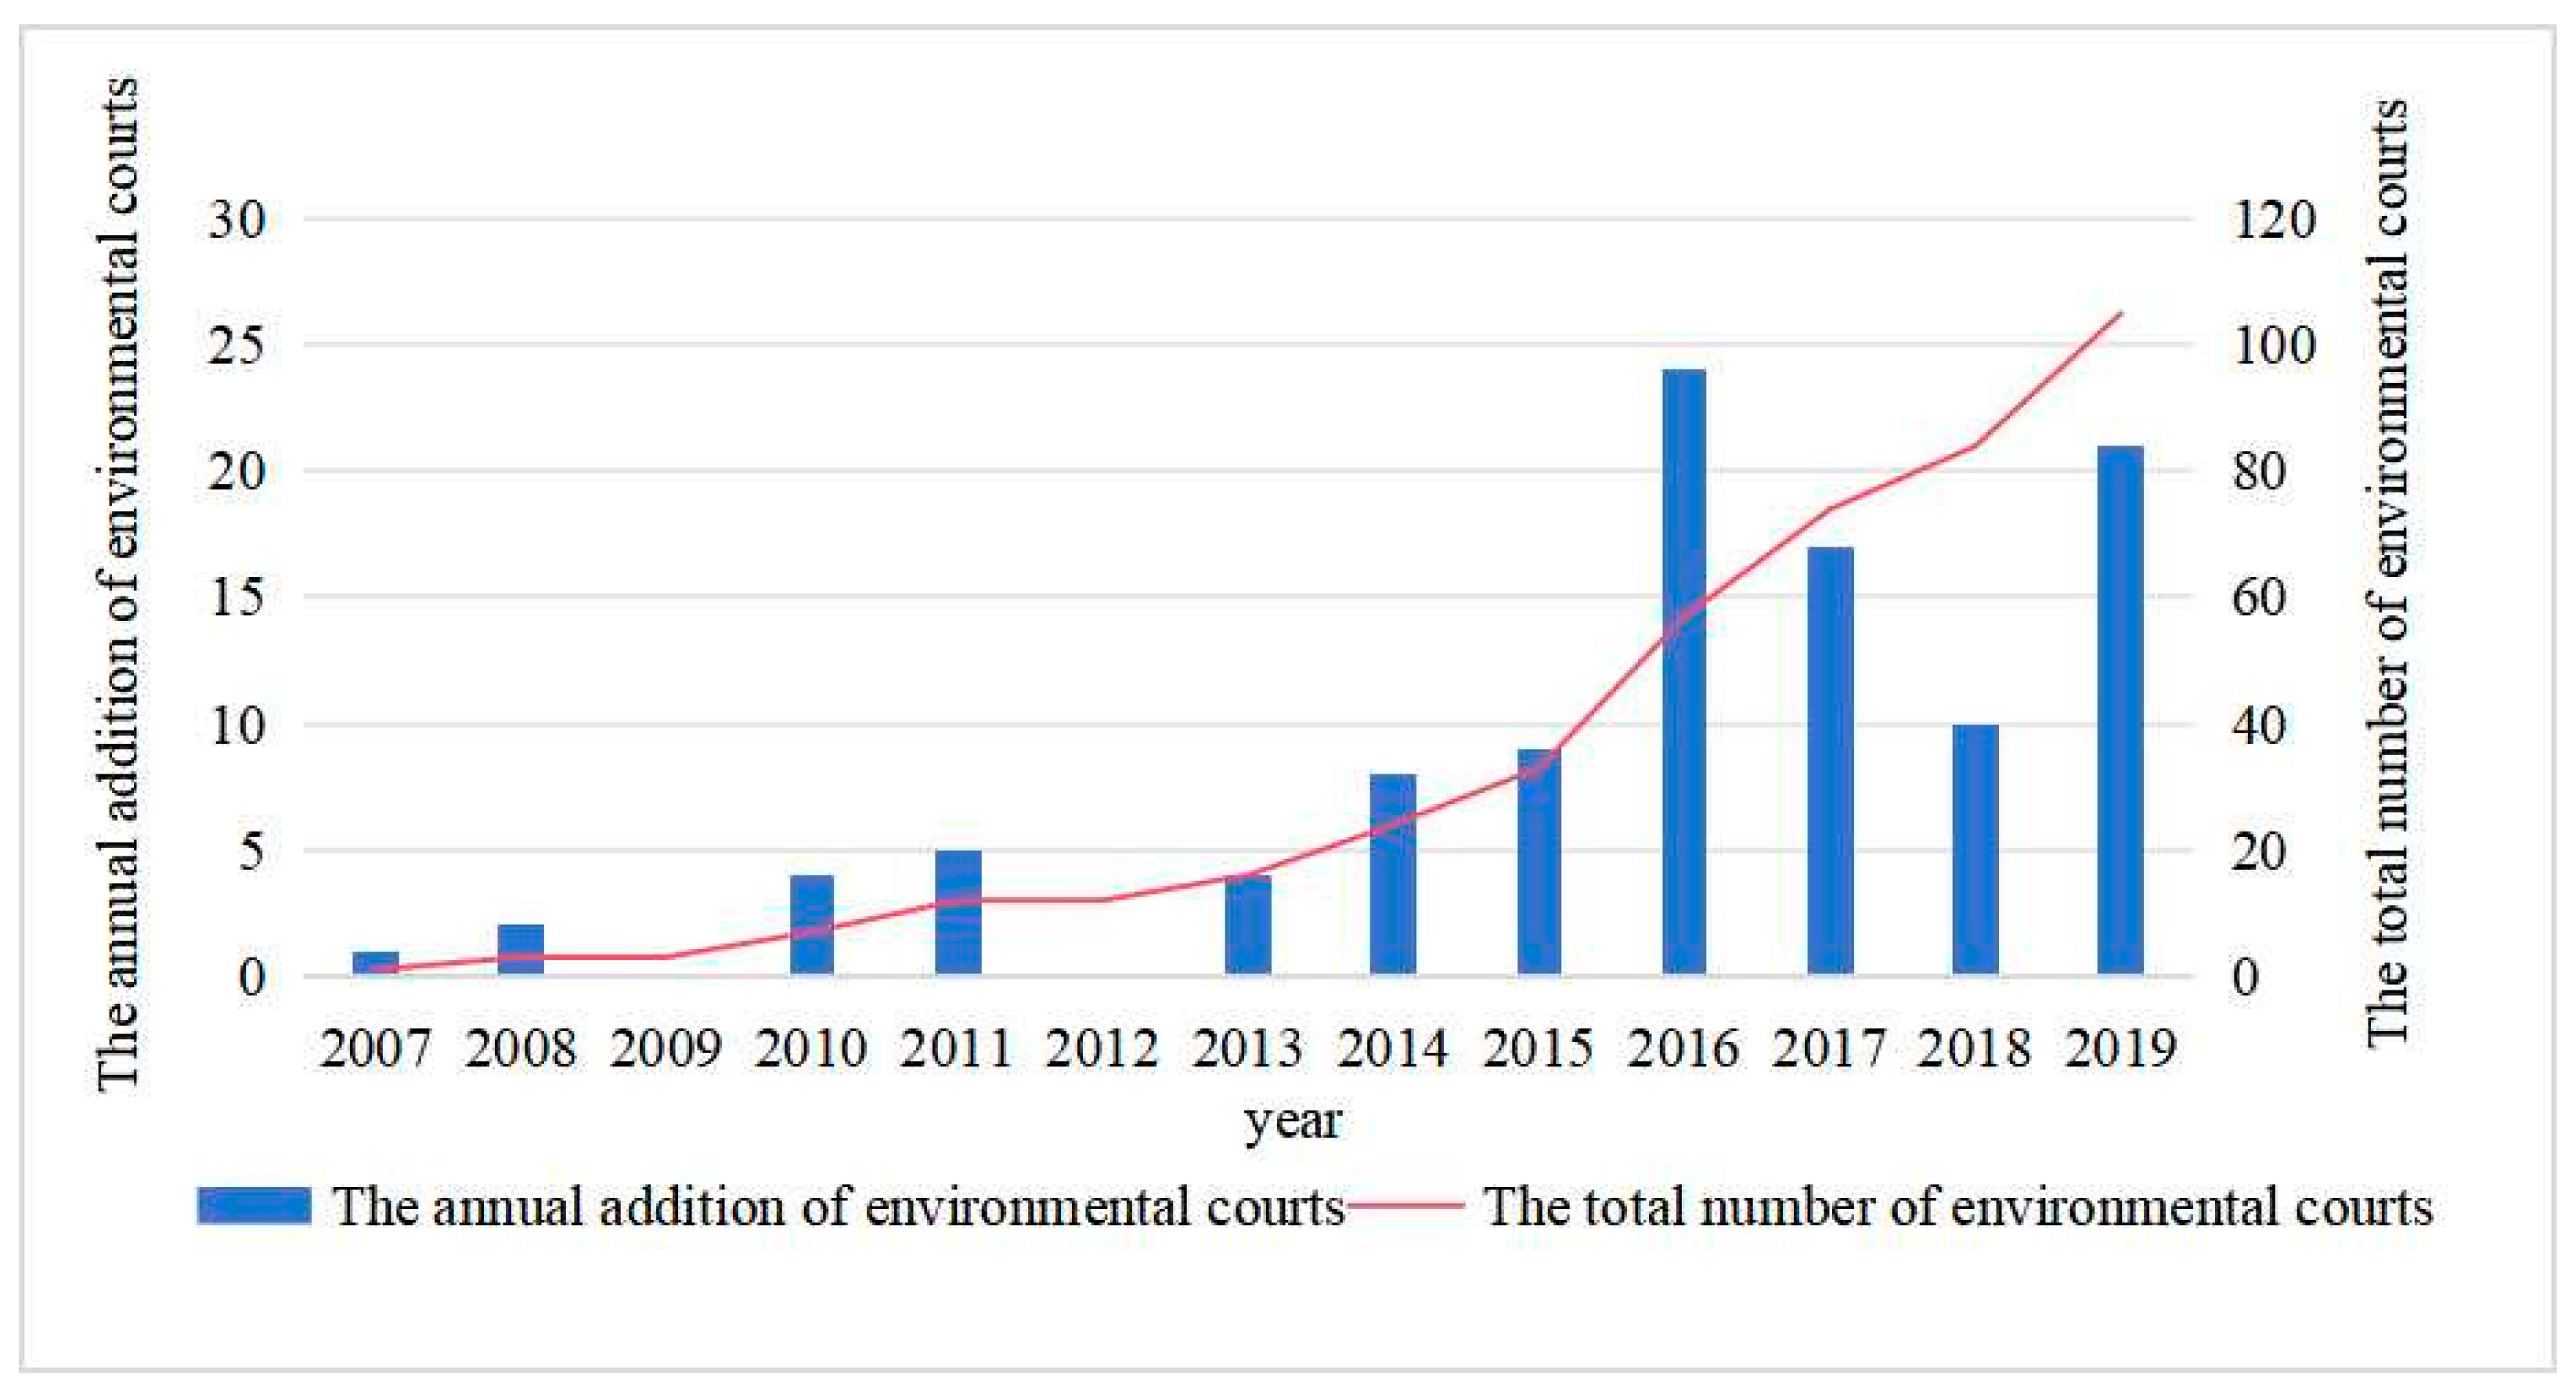
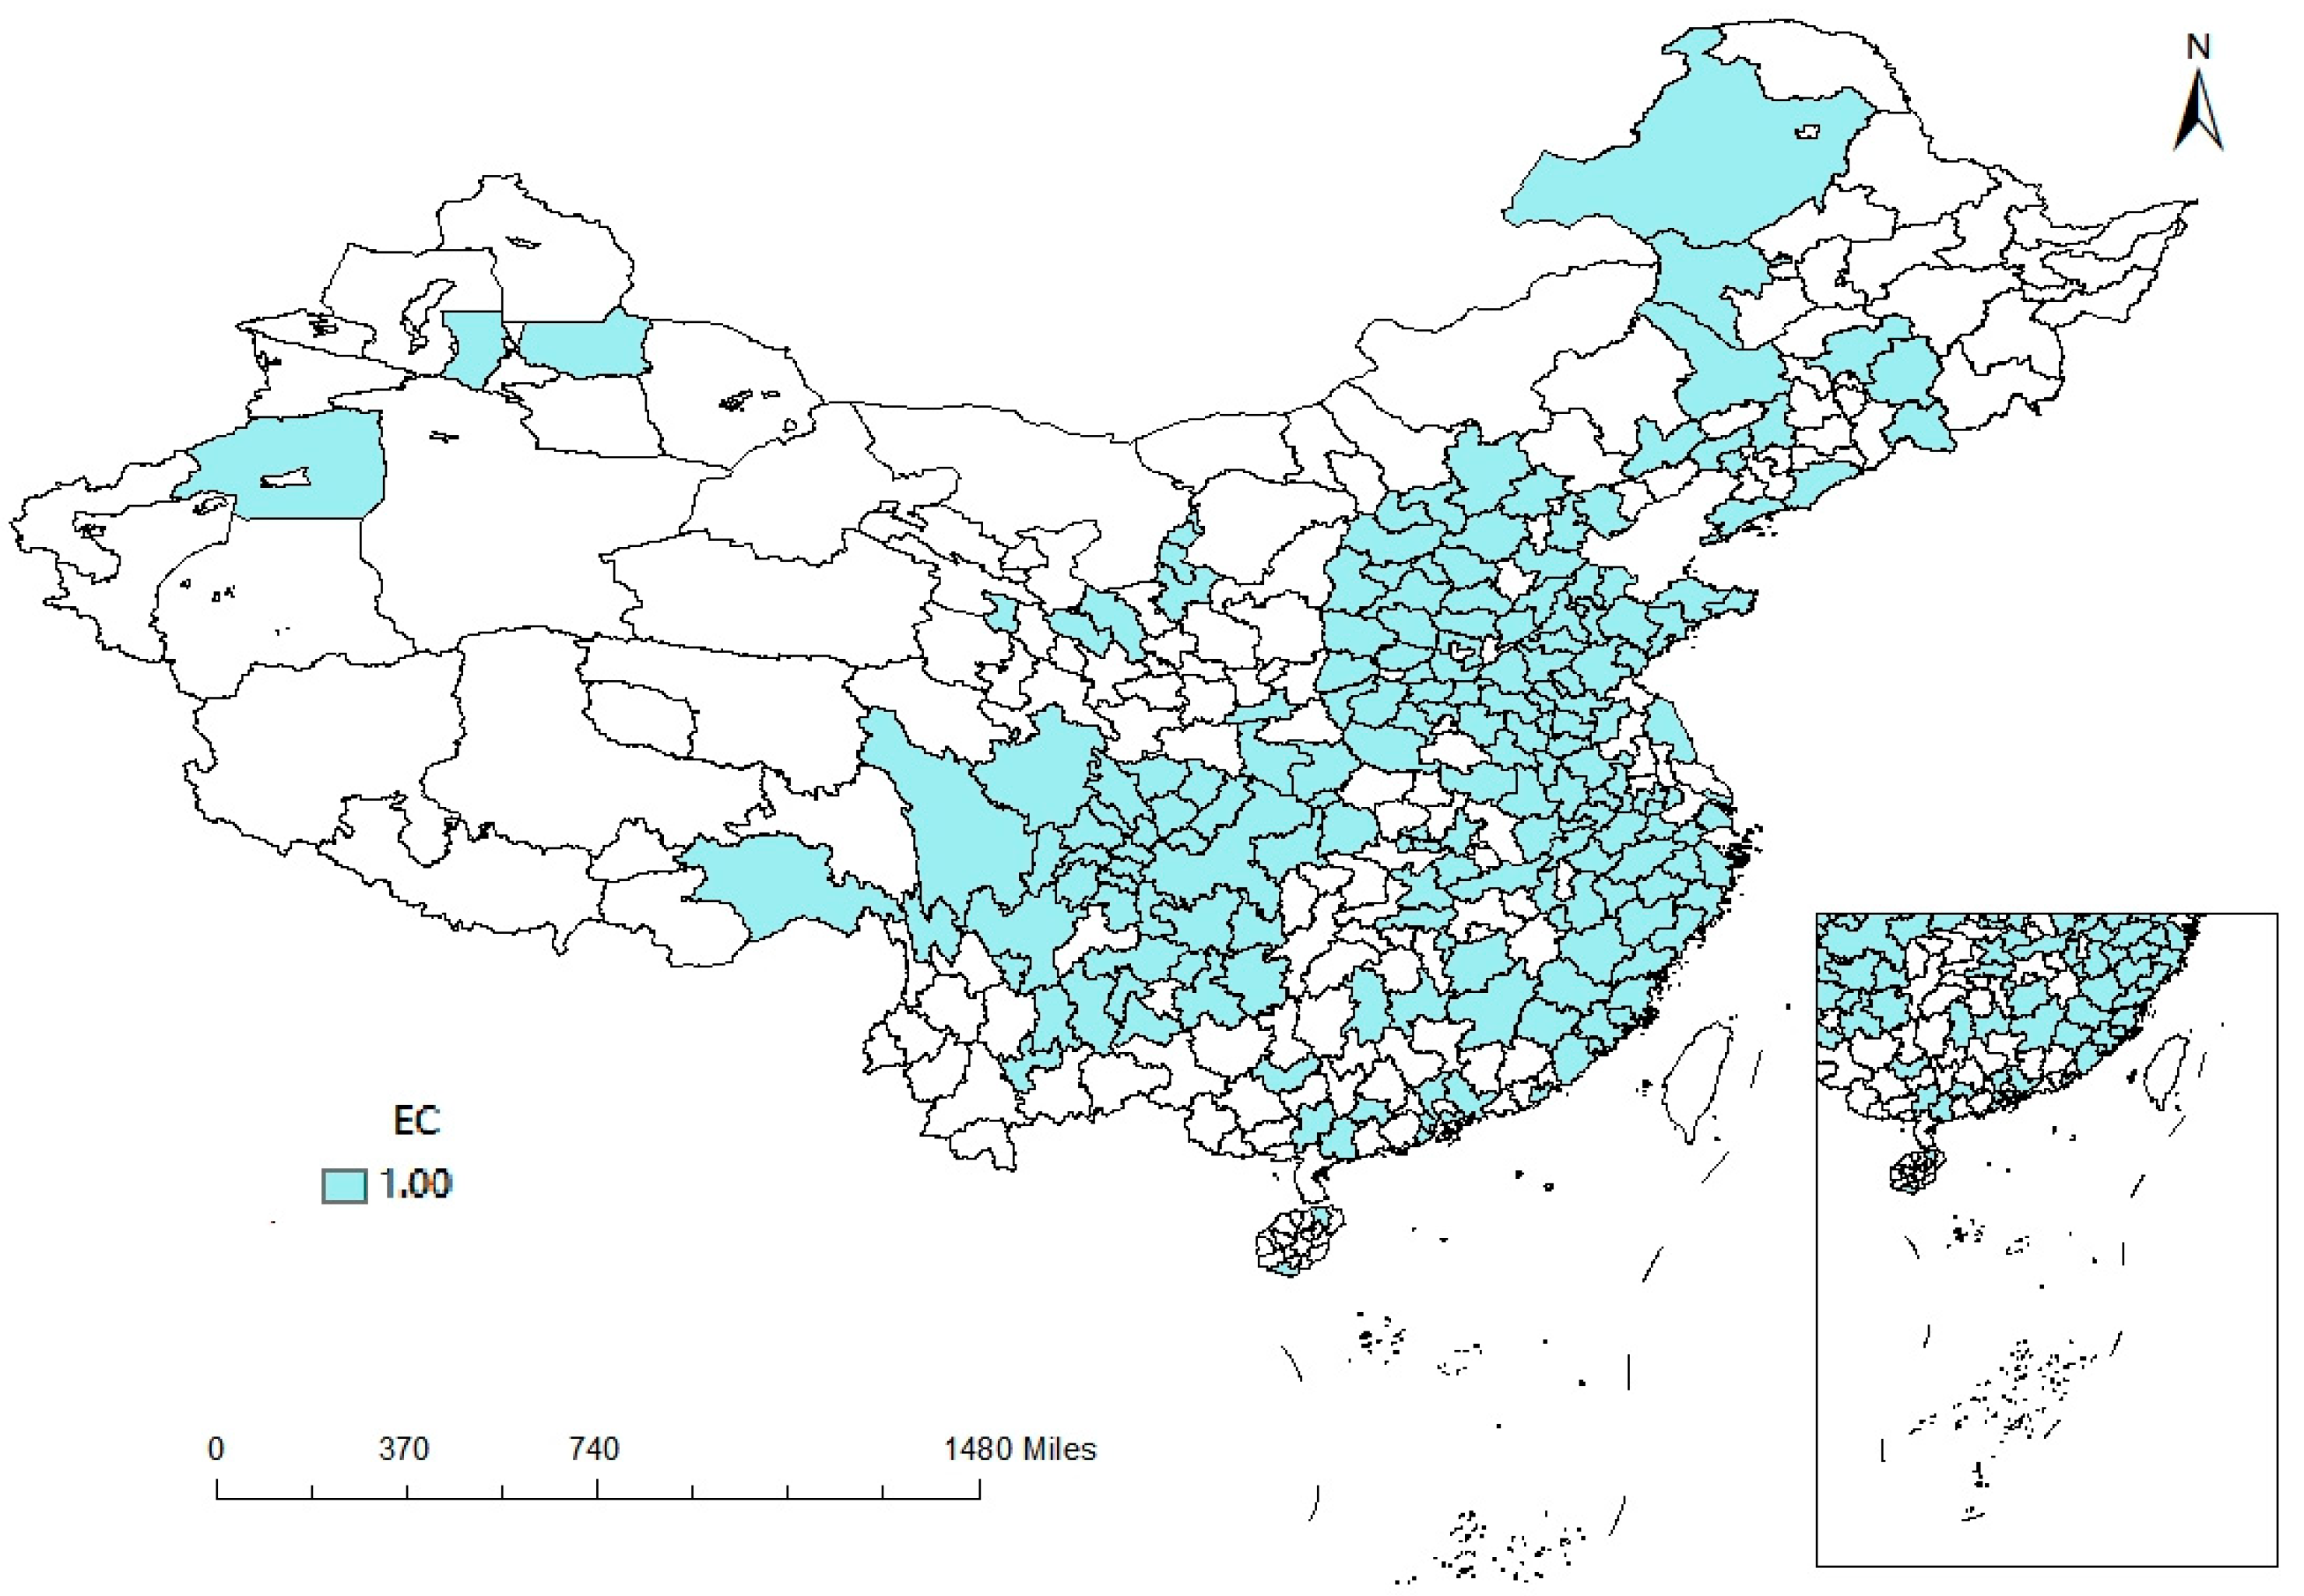
3.1. Environmental Courts in China

Referencing the perspectives of other researchers in the literature review, we also selected the environmental courts established by the intermediate court as the research subject. In the following, all environmental courts that were the subject of this study were environmental adjudication divisions established by intermediate people’s courts. We collected data on the establishment of environmental courts from the official websites of intermediate people’s courts in various cities. Figure 1 shows the number of environmental courts established by the intermediate courts in 349 major cities in China from 2007 to 2019. It was observed that, since the implementation of the policy in 2007, the number of environmental courts has steadily increased. After 2015, the growth rate significantly accelerated, with the total number of environmental courts nationwide exceeding 100 by the end of 2019. The map in Figure 2 depicts the distribution of environmental courts in cities in 2019. Environmental courts have achieved broad implementation across pivotal cities for economic development, encompassing the eastern, central, and western regions of China. The coverage of environmental courts is highest in the economically developed cities along the eastern coast, the emerging cities in the southwest, and the cities showing growth prospects in the North China Plain. Additionally, partial coverage has been achieved in the northeast, northwest, Xinjiang, Hainan, and other regions. Environmental courts are therefore able to provide strong judicial support nationwide [55].

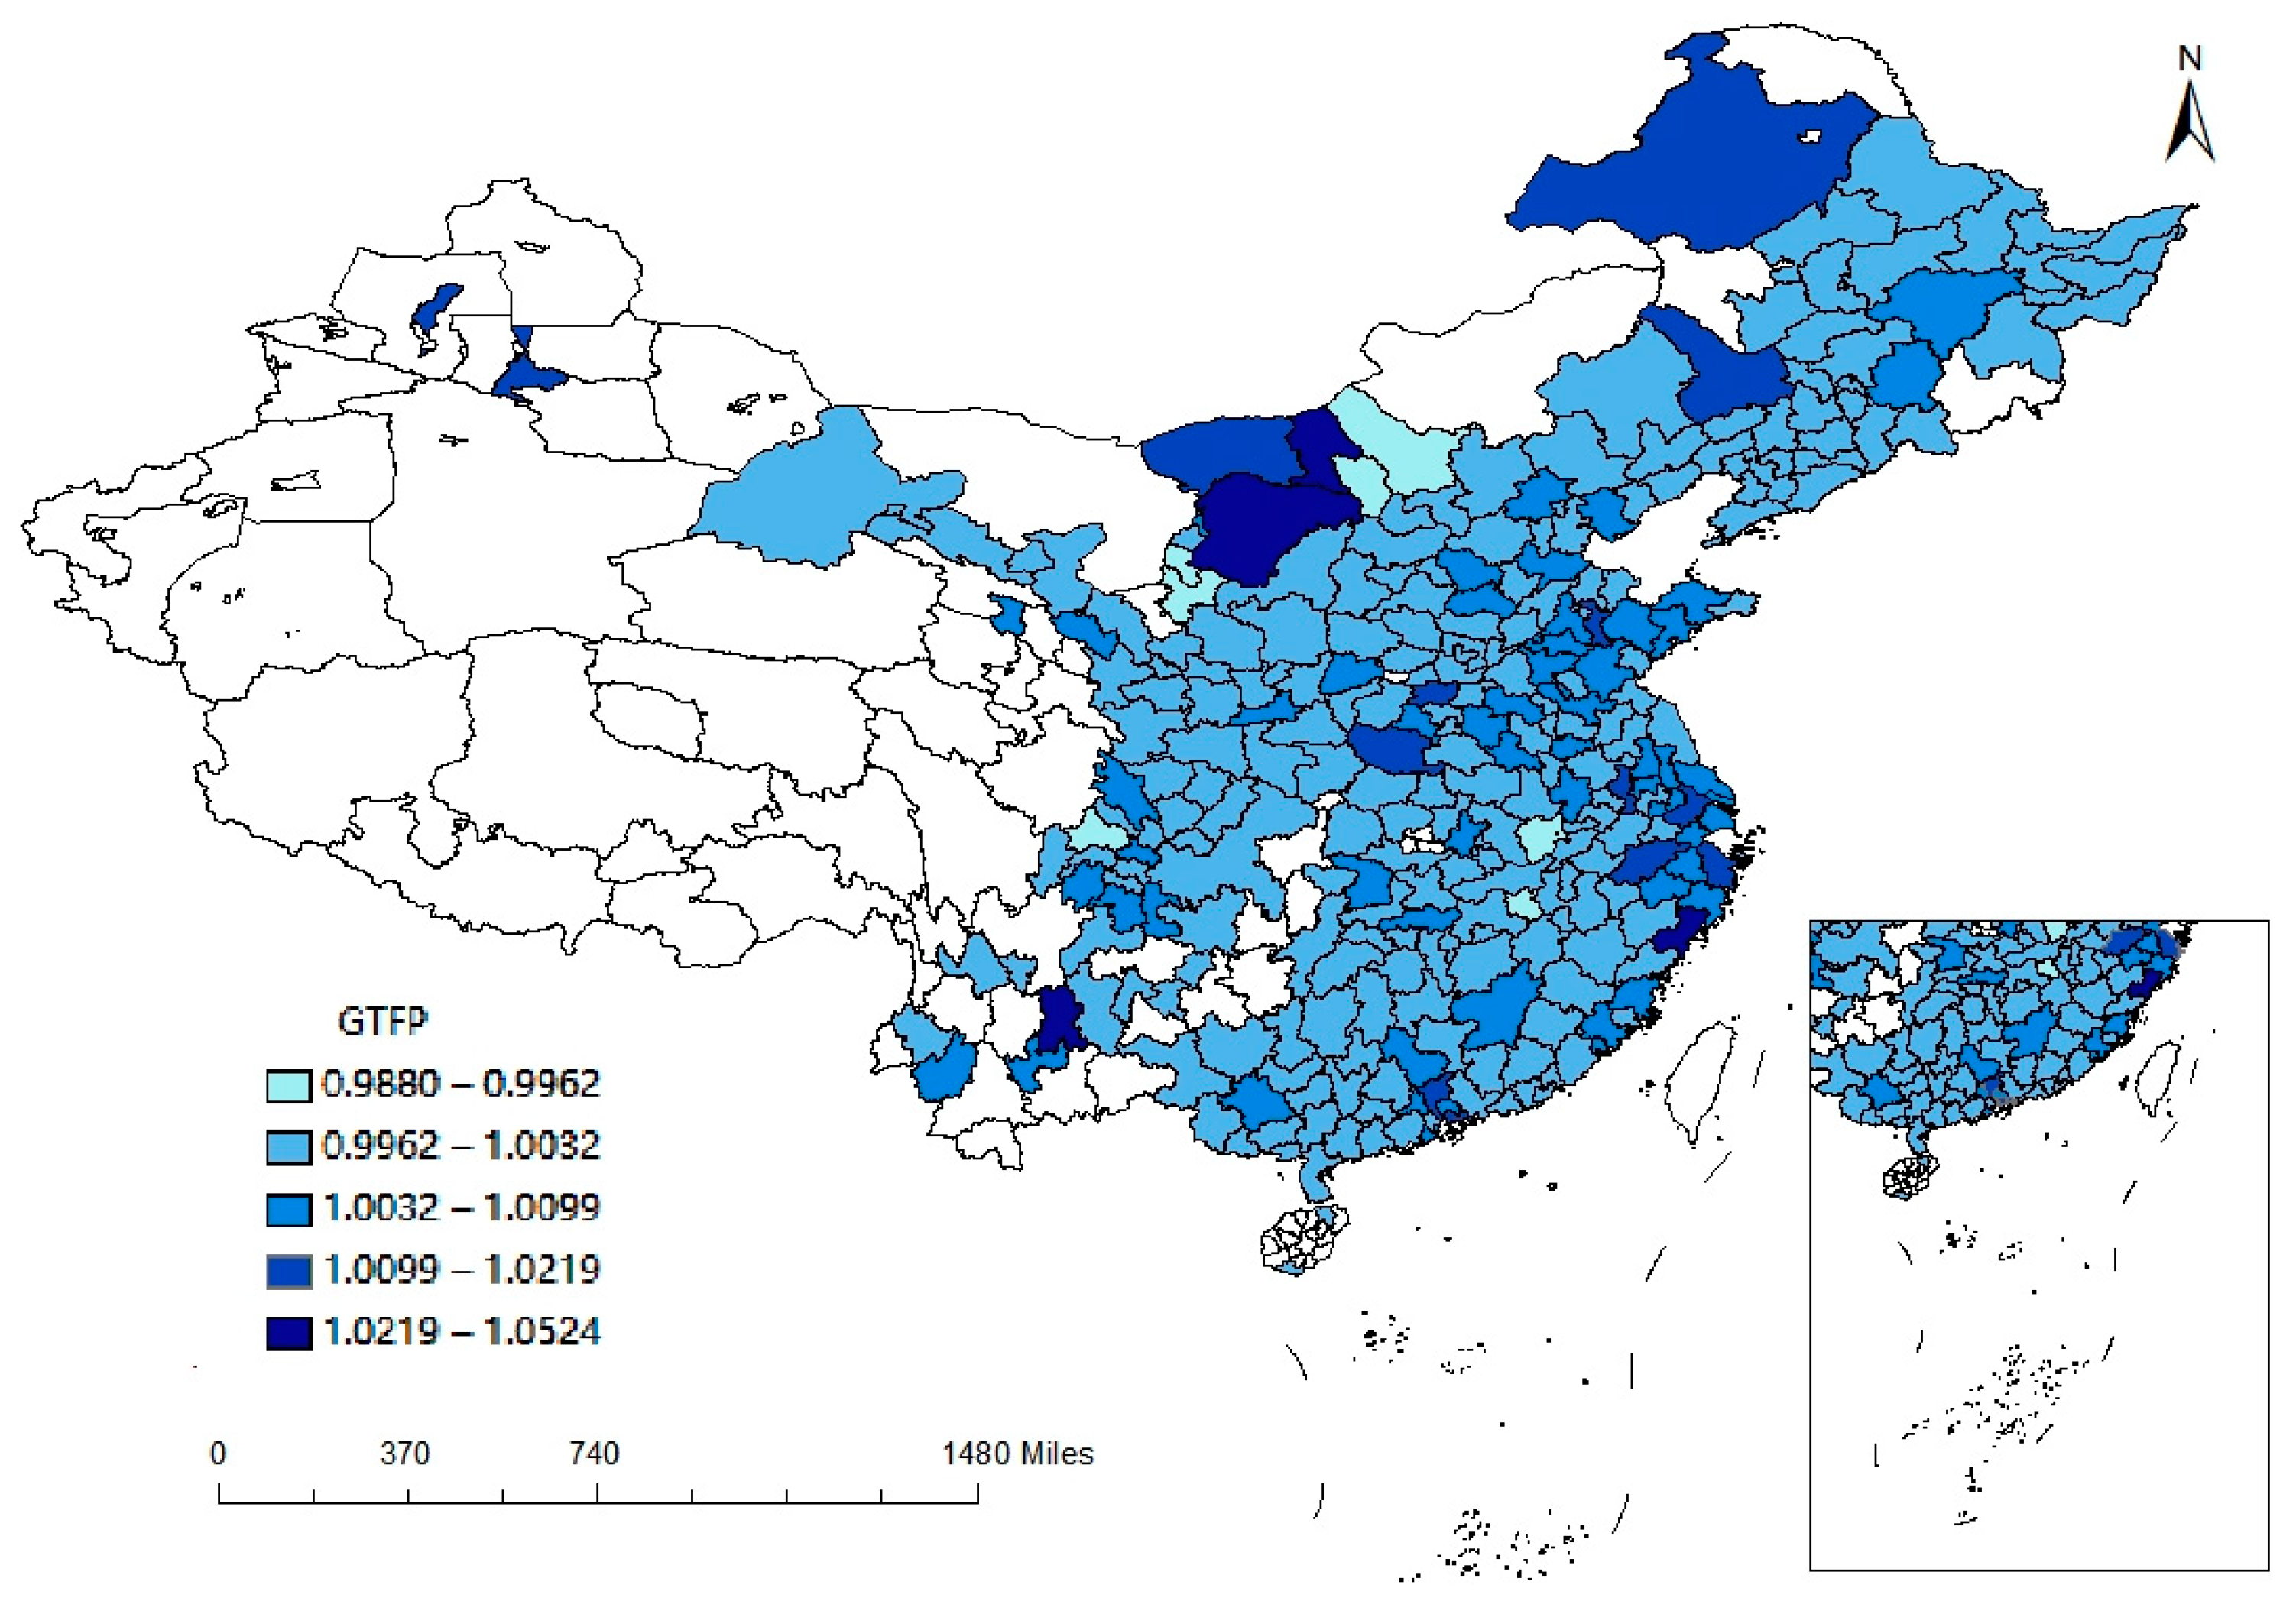
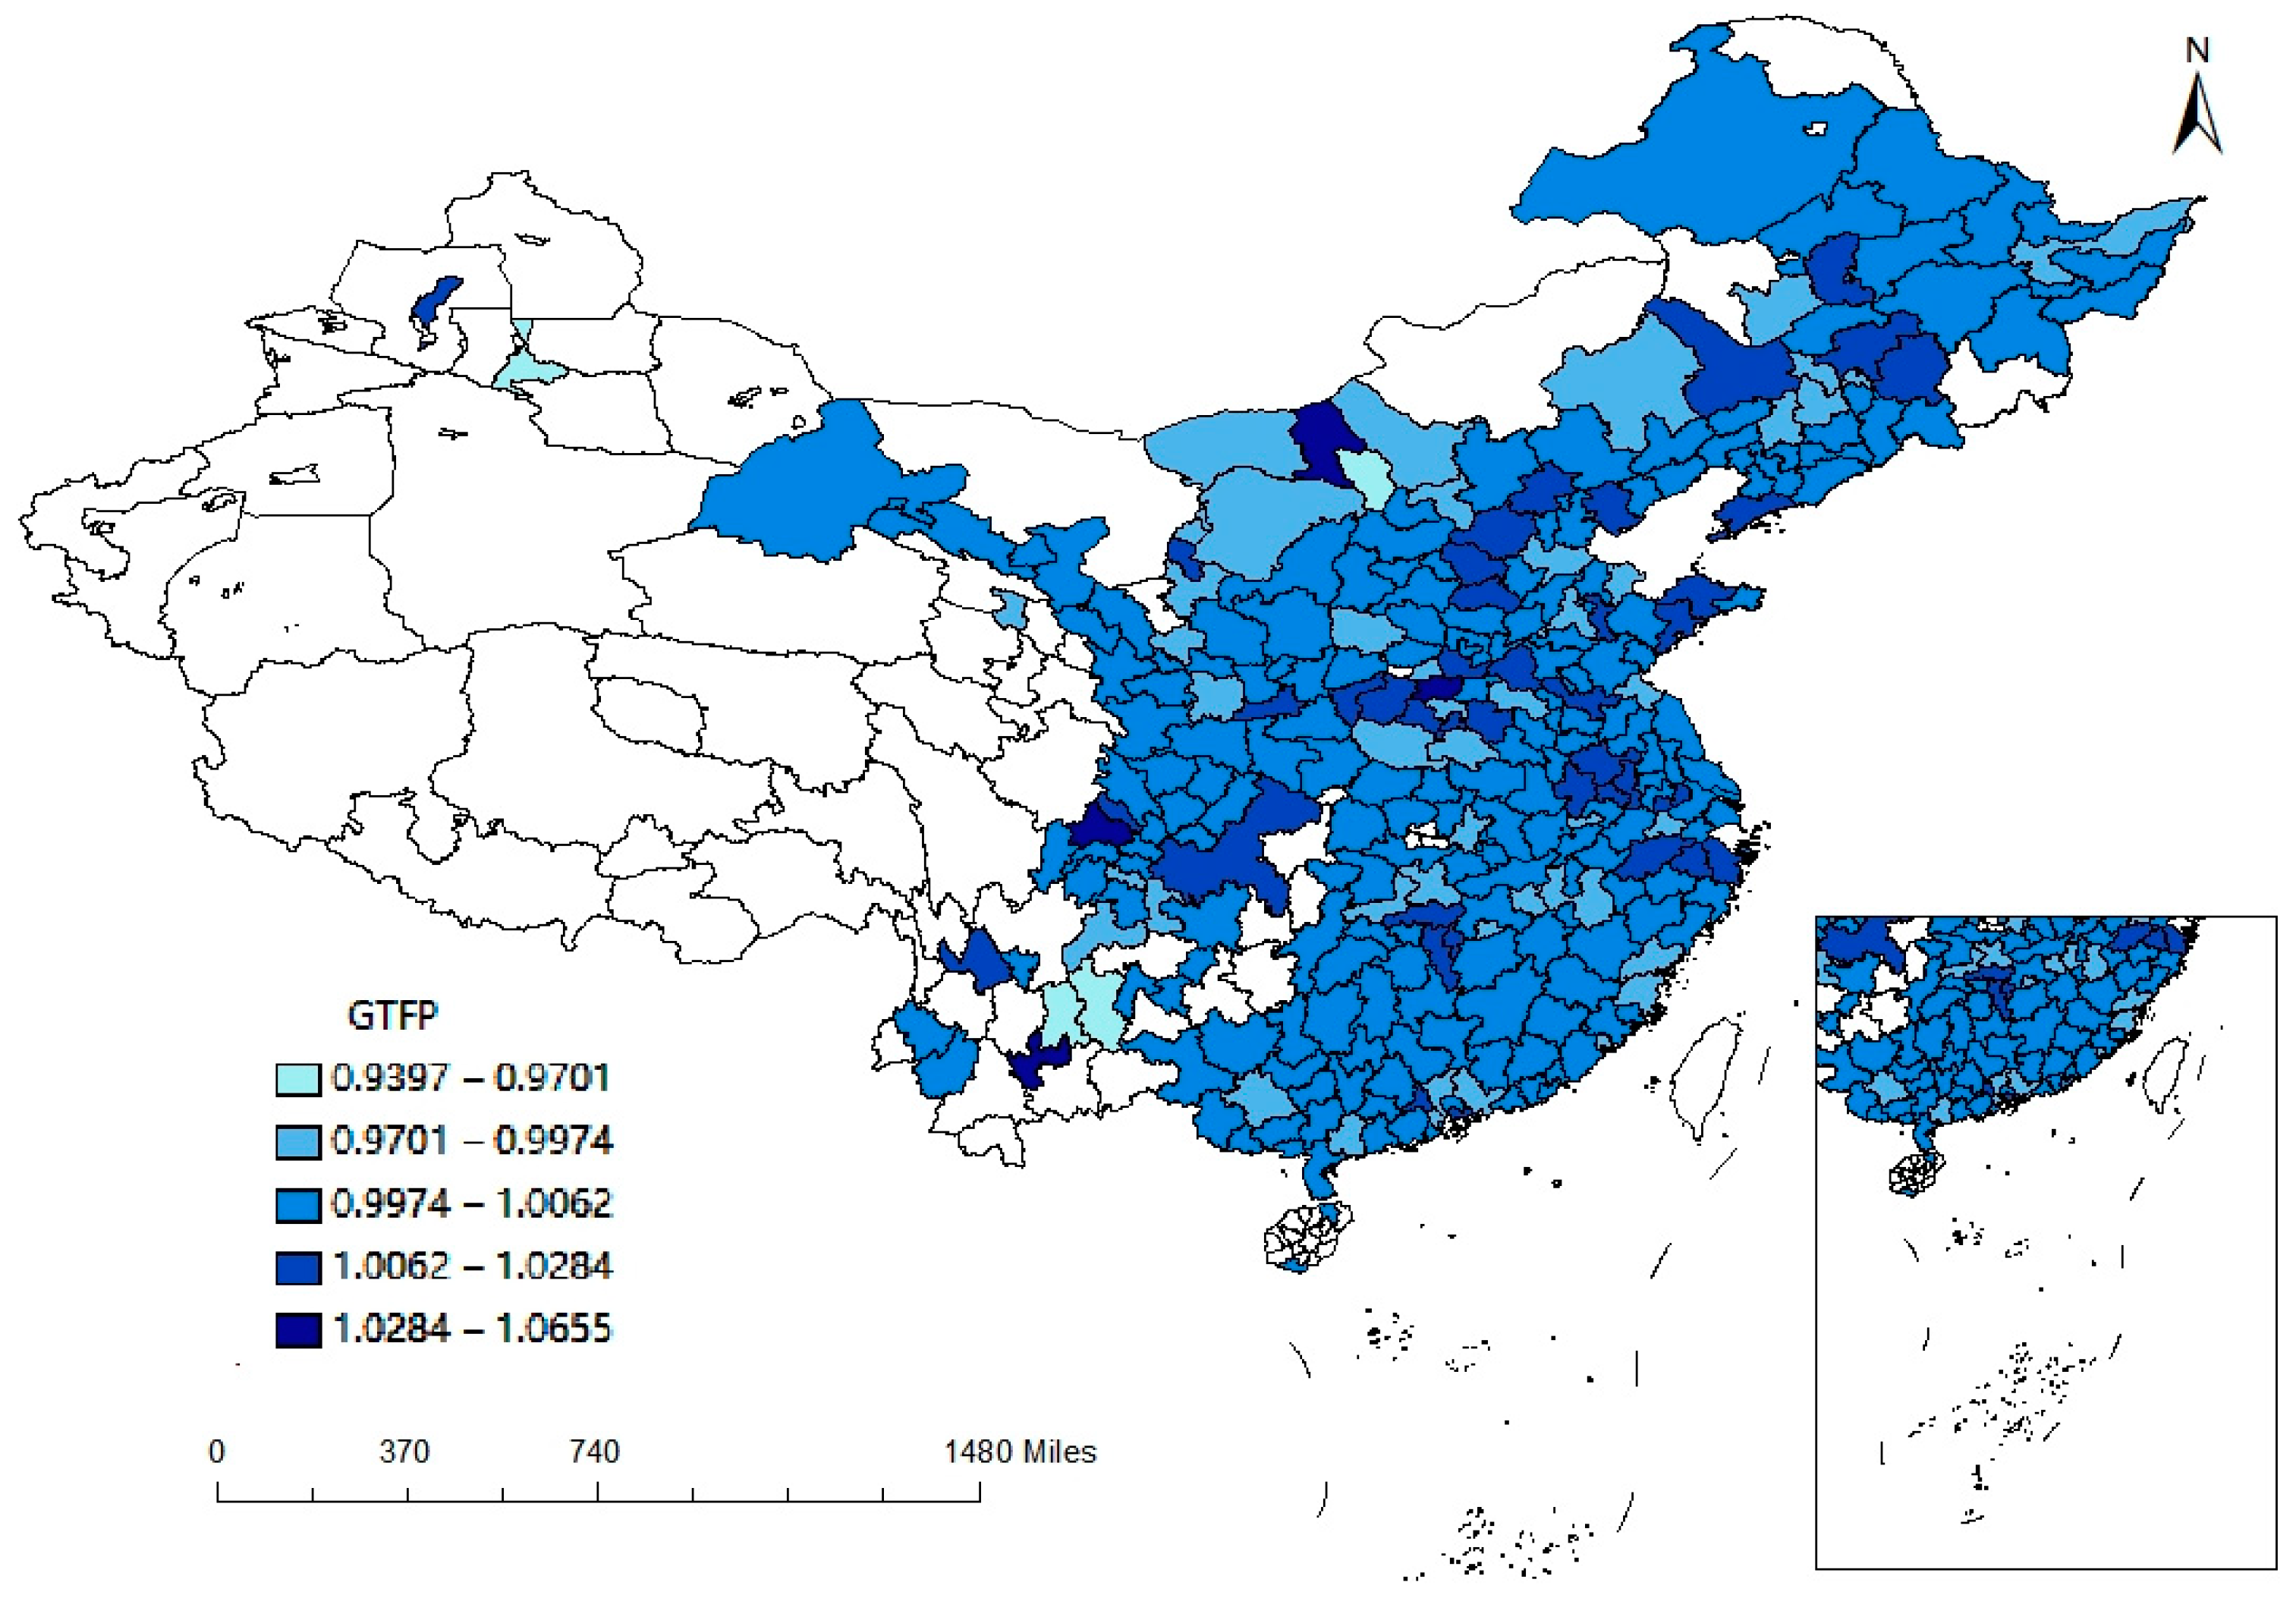
3.2. GTFP Calculation

In this study, we mainly focused on the impact of environmental courts in intermediate people’s courts of various cities on GTFP. Therefore, we divided the analysis by city and calculated GTFP based on the GML index. Referring to the variable selection of other researchers [45], when calculating GTFP, the fixed asset capital stock [56], the annual electricity consumption [57], and the number of employees [45] were chosen as input factors, the constant-price gross domestic product (GDP) [58] was chosen as the expected output, and carbon emissions [44] were chosen as the unexpected output. The original data from each city, excluding carbon emissions, were sourced from the “China City Statistical Yearbook”, “China Regional Economic Statistical Yearbook”, various city statistical yearbooks, the CSMAR database, and the CEIC database [59,60,61,62]. The fixed asset capital stock referred to Zhang Jun’s research using the perpetual inventory method, with a depreciation rate of 9.6% [63]. The carbon emissions data were derived from the CEADs carbon emissions inventory [64] and calculated using the CEADs energy consumption inventory [9,65]. Excluding cases where data were missing and could not be calculated, we used the GML index model to calculate the GTFP of 282 cities in China from 2004 to 2019.
Figure 3 and Figure 4 show the distribution maps based on the calculated GTFP results. Figure 3 illustrates the distribution of GTFP among different Chinese cities in 2006, representing the period prior to the establishment of environmental court policies. Figure 3 reflects the green economic development in China before the impact of environmental court policies. Except for regions like northeast China, Inner Mongolia, and a few cities with relatively high GTFP, most cities’ GTFP values ranged from 0.9962 to 1.0032. Some economically developed cities did not exhibit higher GTFP values compared to less developed cities. This was because, before the comprehensive implementation of environmental policies in China, the traditional model of extensive economic development concurrently achieved economic expansion, while also leading to elevated levels of pollution and emissions. The developed cities performed well in terms of economic indicators but poorly in terms of GTFP. These findings were in line with conclusions drawn by other researchers [66,67]. Figure 4 shows the distribution of GTFP in 2019 after the implementation of environmental court policies. Compared with Figure 3, a significant increase in GTFP values in most cities in China can be observed, ranging from 0.9974 to 1.0062. The development of the green economy was occurring nationwide during this period.

4. Material and Methods

4.1. Variables and Data Sources

This study covered the three years before the establishment of environmental courts in 2007. An observation period from 2004 to 2019 was chosen to examine the long-term effects of the environmental court system. Before conducting the empirical research, we first collected all the necessary data for prefecture-level cities for the study period. Some cities had large amounts of missing data and were excluded, leaving 282 prefecture-level cities included in the study. Table 1 provides a comprehensive overview of all variables.

4.1.1. Independent Variable

The independent variable was a dummy variable for the establishment of environmental courts. If the intermediate people’s court of a city started or had established an environmental court in the same year, it was assigned a value of 1; otherwise, it was assigned a value of 0. To obtain this information, the establishment announcements of environmental courts were manually collected from the official websites of intermediate people’s courts in different prefecture-level cities in China. The data on the establishment dates and the operational status were cross-verified using the information from the “China Court websites” and news from other news websites.

4.1.2. Dependent Variable

The dependent variable was the GTFP of the city, calculated by the GML index model. The original data sources and calculation method of the dependent variable are explained in Section 3.

4.1.3. Controlled Variables

Some studies have suggested a close relationship between the level of economic development and the local environmental situation [9,68]. The secondary industry includes most traditionally high-polluting industries [69]. After industrial restructuring, the development of high-tech and service industries in the tertiary industry became increasingly related to environmental protection [70]. The financial situation of the region’s government [71] and higher education resources [72] also provide basic support for green economic development. Therefore, we considered GDP per capita, the proportion of the secondary industry to GDP, the proportion of the tertiary industry to GDP, the number of universities per million people, and the ratio of local general public budget expenditure to GDP as control variables to measure the economic conditions, industry status, education status, and governance strength of different cities. The remaining variables were mechanism analysis and heterogeneity testing variables, and are detailed in the following sections. Data for all controlled variables were obtained from the China City Statistical Yearbook [60].

4.1.4. Mediating Variables

Through the literature analysis, we found that environmental courts are an effective tool for reducing carbon emissions [9,26]. They can exert strong constraints on companies through fair and efficient adjudication to compel them to lower their carbon intensity. Ultimately, a mutually beneficial outcome between environmental preservation and economic progress can be attained. Therefore, carbon intensity was selected as the mediating variable to analyze the impact mechanism of environmental courts on the green economy. The carbon intensity data were calculated from the city carbon emissions published by CEADs and the local GDP [64].
As a mechanism of judicial environmental regulation, environmental courts inevitably increase the government’s attention and action towards environmental issues [36]. The proportion of the frequency of environmental protection vocabulary appearing in government work reports to the total vocabulary frequency could reflect the local government’s handling of environmental issues in the current year [46]. Using this as a mediating variable, it was possible to measure the impact of environmental courts on the development of the regional green economy through the strengthening of administrative environmental regulation. To obtain the administrative environmental regulation data, we followed Chen’s method [73], manually collecting government work reports from 2004 to 2019. We counted the frequency of 15 vocabulary terms related to the environment and calculated the proportion of the frequency of environmental protection vocabulary appearing to the total vocabulary frequency.

4.1.5. Moderator Variables

The green transformation that companies undergo to achieve environmental goals requires substantial financial support [74]. Therefore, bank loans become a crucial facilitator for companies to achieve green transformation and regional green development [52]. We used the ratio of year-end outstanding loans of financial institutions to GDP as the moderator variable to measure the financial support available to local companies [55]. The data were obtained from the China City Statistical Yearbook [60].
The innovation of green technology not only helps companies achieve economic benefits but also contributes to improving environmental quality [75]. Utilizing the quantity of green patent applications proved to be an effective measure for assessing advancements in green technological innovation. The quantity of green patent applications proved to be an effective measure for assessing advancements in green technological innovation. The variable of green technology innovation was represented by the ratio of green patent applications to total patent applications. The data were obtained from the China National Intellectual Property Administration Patent Search Website [76] and the CNRDS database [77].

4.1.6. Other Variables

The region division data were obtained from the China City Statistical Yearbook [60]. Low-carbon pilot data were sourced from the low-carbon pilot projects list announced by the Central People’s Government official website [78].

4.2. The Baseline Model

Multi-period difference-in-differences (DID) is a statistical method that extends the traditional DID approach. It assesses the impact of policies on both treatment and control groups across multiple time points, providing a more comprehensive evaluation of policy effects [12,21,55]. In this study, we examined the establishment of environmental courts in intermediate courts in Chinese cities as a policy shock, and designed a multi-period DID model as the baseline model:
l n g t f p i t = β 0 + β 1 e c i t + β 2 l n p e r g d p i t + β 3 l n g d p 02 i t + β 4 l n g d p 03 i t + β 5 l n e d u i t + β 6 l n f i n i t + γ i + δ t + ε i t
where lngtfpit represents the logarithm of the GTFP of Chinese cities, i represents the city, and t represents the year. γi, δt, and Ɛit represent city fixed effects, year fixed effects, and the error term, respectively. ec is a dummy variable established by the environmental court. lnpergdp, lngdp02, lngdp03, lnedu, and lnfinand are logarithms of various control variables. β1 is the focal point, representing the estimated coefficient of the environmental court’s impact on GTFP. To mitigate concerns regarding heteroscedasticity and serial correlation, clustering was performed at the city level.

4.3. Mechanism Test Model

In the previous theoretical analysis, it was found that environmental courts play a positive role in local green economic development by reducing carbon intensity and enhancing government enforcement. Support from financial loans and green patents to local companies further strengthens the impact of environmental courts. Therefore, we used two methods, mediation effect analysis and moderation effect analysis, to test the mechanism.
Initially, following Jiang’s approach, a mediation effect model was established. In the traditional three-step mediation effect model, the third step involved adding the independent variable and the mediator variable simultaneously to the regression, leading to multicollinearity [79]. Therefore, based on the model design of other researchers [80,81], the third-step regression of the mediator and independent variables on the dependent variable was no longer conducted. The first-step model can be represented as Equation (1) and the second-step mediation effect model is as follows:
l n m e d i a t o r i t = β 0 + β 1 e c i t + β 2 l n p e r g d p i t + β 3 l n g d p 02 i t + β 4 l n g d p 03 i t + β 5 l n e d u i t + β 6 l n f i n i t + γ i + δ t + ε i t
Lnmediatorit represents the logarithm of the mediating variable. The other parameters were the same as in Equation (1). If the independent variable (ec) significantly affected the dependent variable (gtfp) in Equation (1), and the coefficient β1 in Equation (2) passed a significance test, it indicated the presence of a mediating effect by the mediatorit.
Furthermore, we designed the following moderation effect model to measure whether financial institution loans and green technologies have a moderating effect [82,83]:
l n g t f p i t = β 0 + β 1 e c i t + β 2 l n m o d e r a t o r i t × e c i t + β 3 l n m o d e r a t o r i t + β 4 l n p e r g d p i t + β 5 l n g d p 02 i t + β 6 l n g d p 03 i t + β 7 l n e d u i t + β 8 l n f i n i t + γ i + δ t + ε i t
Lnmoderatorit represents the logarithm of the moderator variable, and lnmoderatorit*ec is an interaction term between the moderator and the independent variable (ec) to reflect the moderating effect. If the coefficient β2 in Equation (3) passed a significance test, it indicated the presence of a moderating effect by the moderatorit.

5. Results

5.1. Descriptive Statistics

After matching all the data, samples with missing data were removed. Less than 1% and more than 99% were winsorized, resulting in a final sample of 4511. Table 2 presents the descriptive statistics of all variables.

5.2. Baseline Regression Results

We employed a multi-period DID model with two-way fixed effects, clustered at the city level, to investigate the impact of environmental courts on GTFP. The findings of the baseline regression are displayed in Table 3 in column (1). The outcomes are depicted without the control variables, while column (2) presents the outcomes with control variables. It was observed that in the regression of column (1), the estimated coefficient of the independent variable (ec), was 0.00234 and passed the 1% significance test, which suggests that the environmental courts enhance GTFP. In column (2), adding control variables, the estimated coefficient of ec was 0.00212, which was similar to the results in column (1) and also reached the 1% significance level. Taking the results in column (2) as the baseline regression results, the establishment of environmental courts have a positive impact on green economic development. Hypothesis 1 is confirmed. The establishment of an environmental court in the intermediate people’s court of the city led to a 2.12‰ increase in the local GTFP growth rate. Previous research has indicated that environmental courts advance environmental protection efforts, fostering regional green development, and this is consistent with the findings in this paper [11,13].

5.3. Robustness Test Results

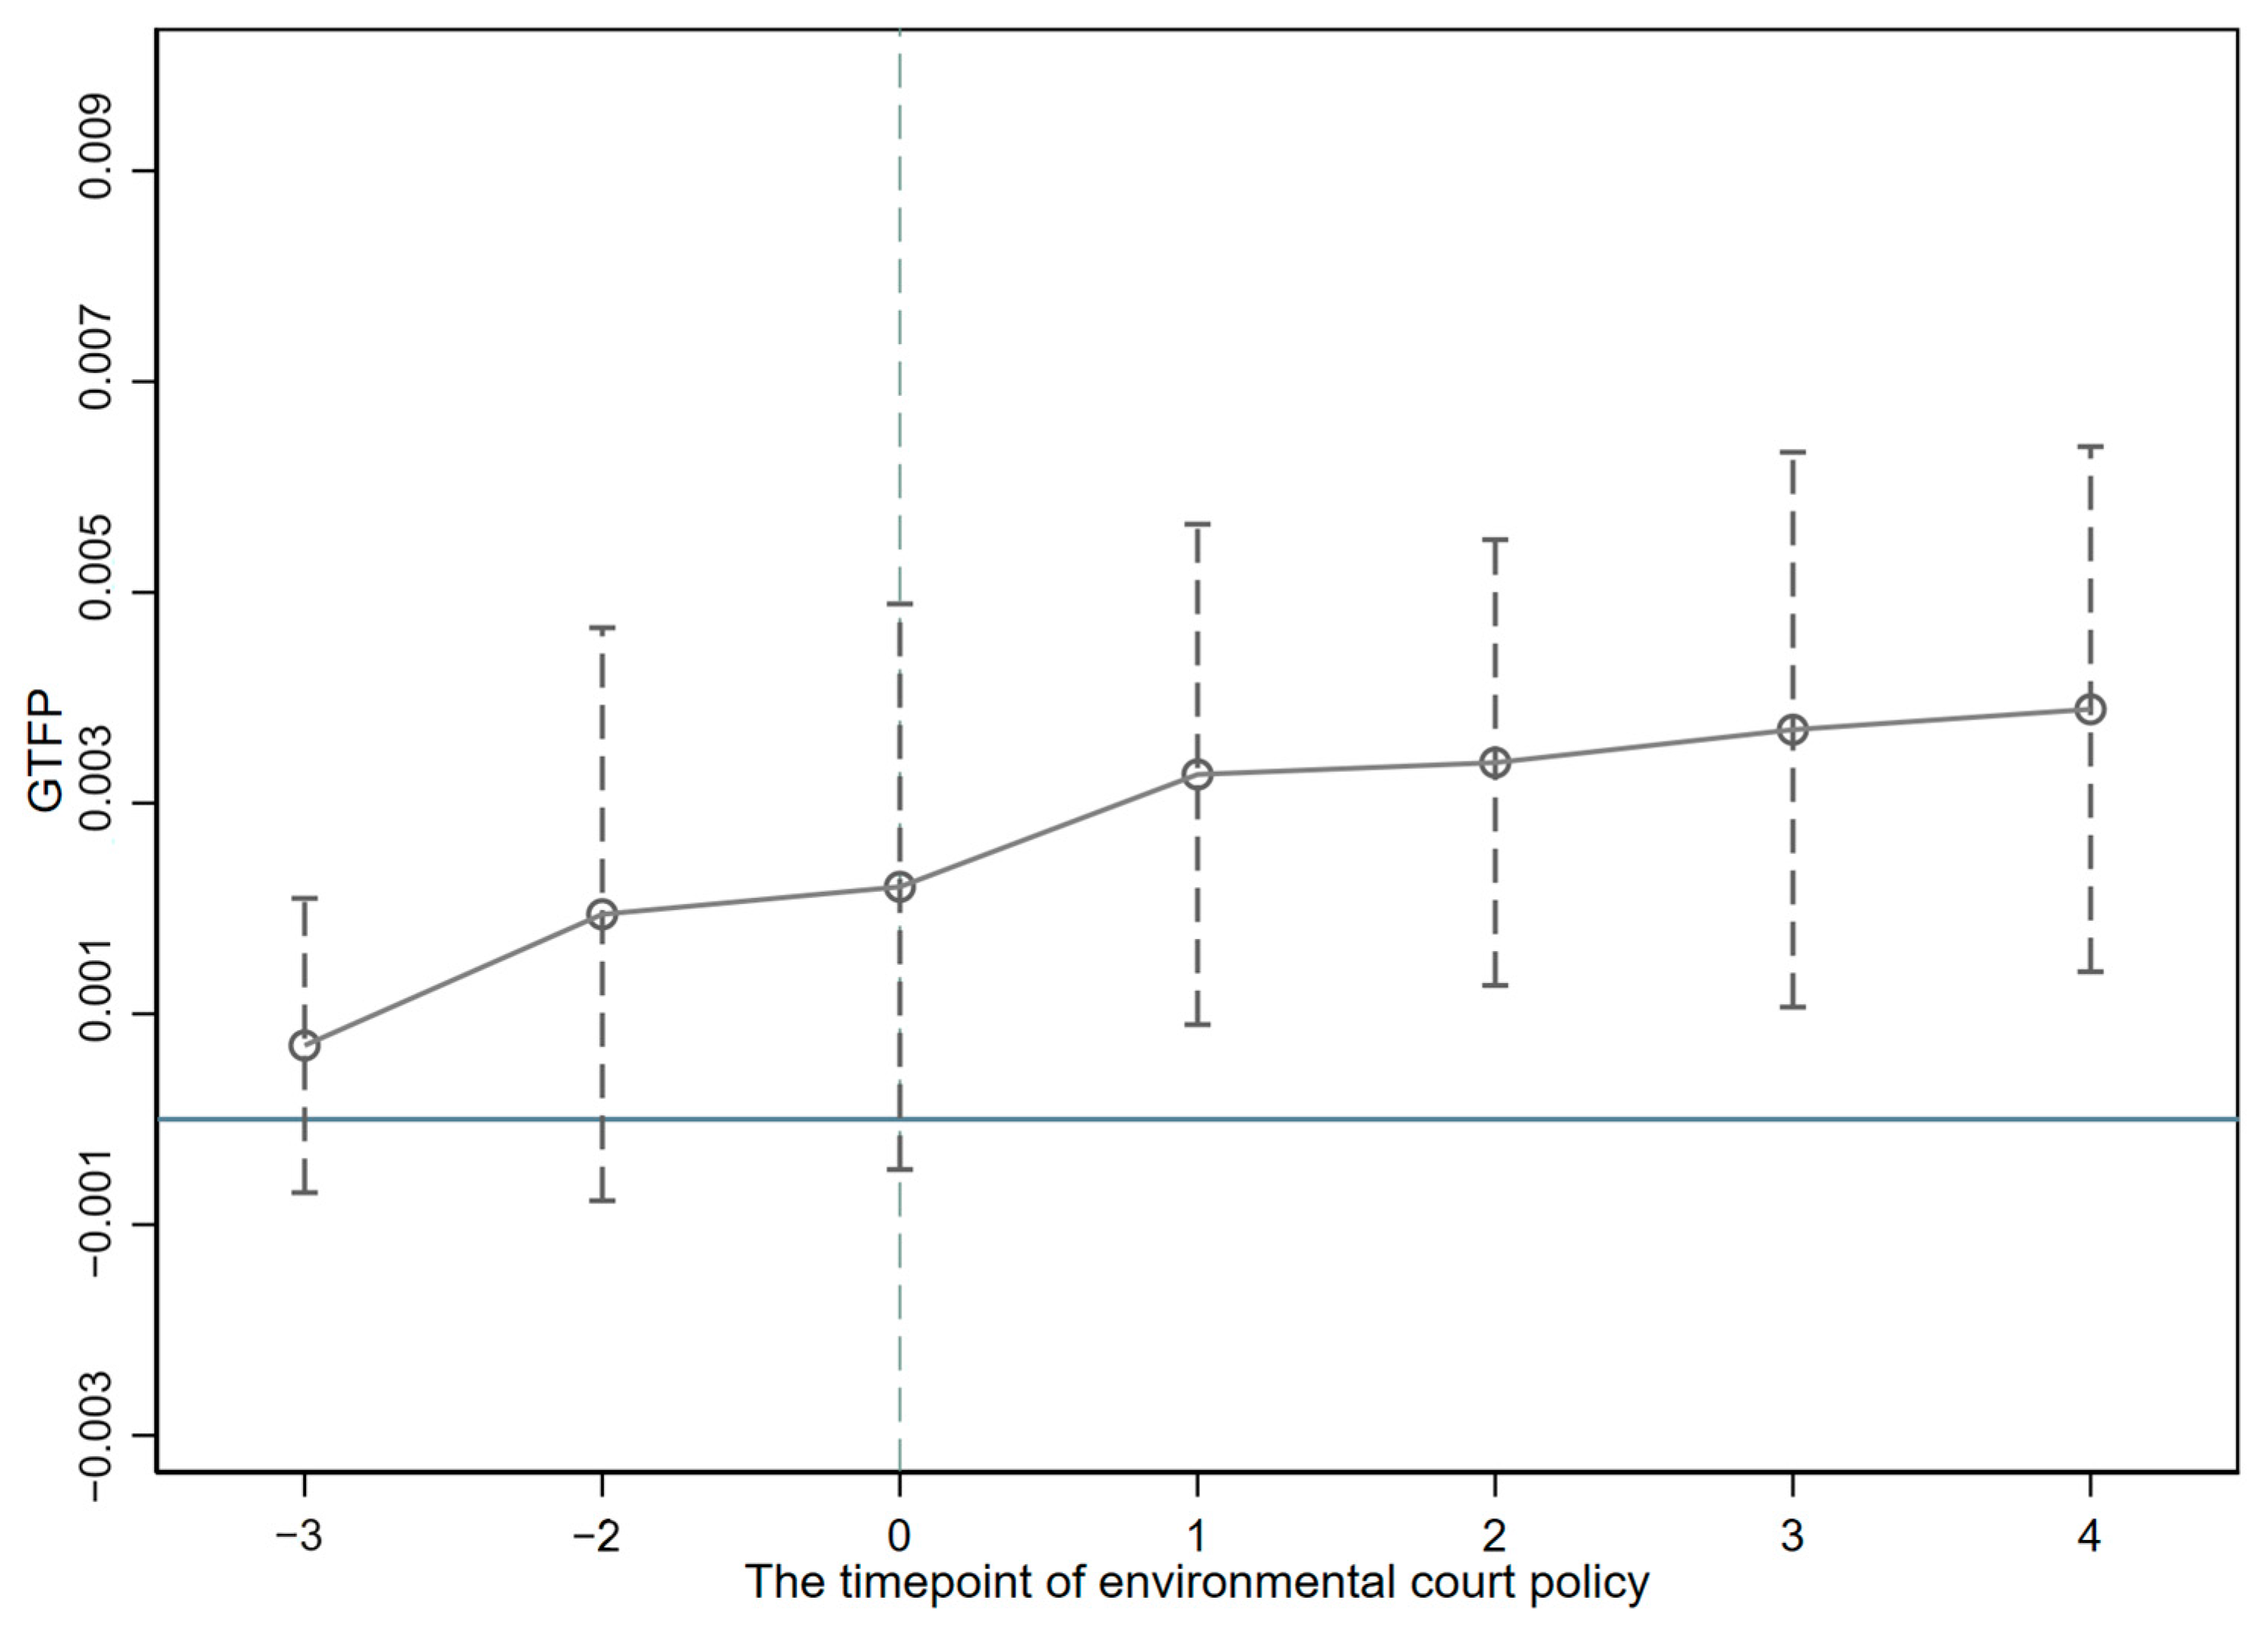
5.3.1. Parallel Trends Test
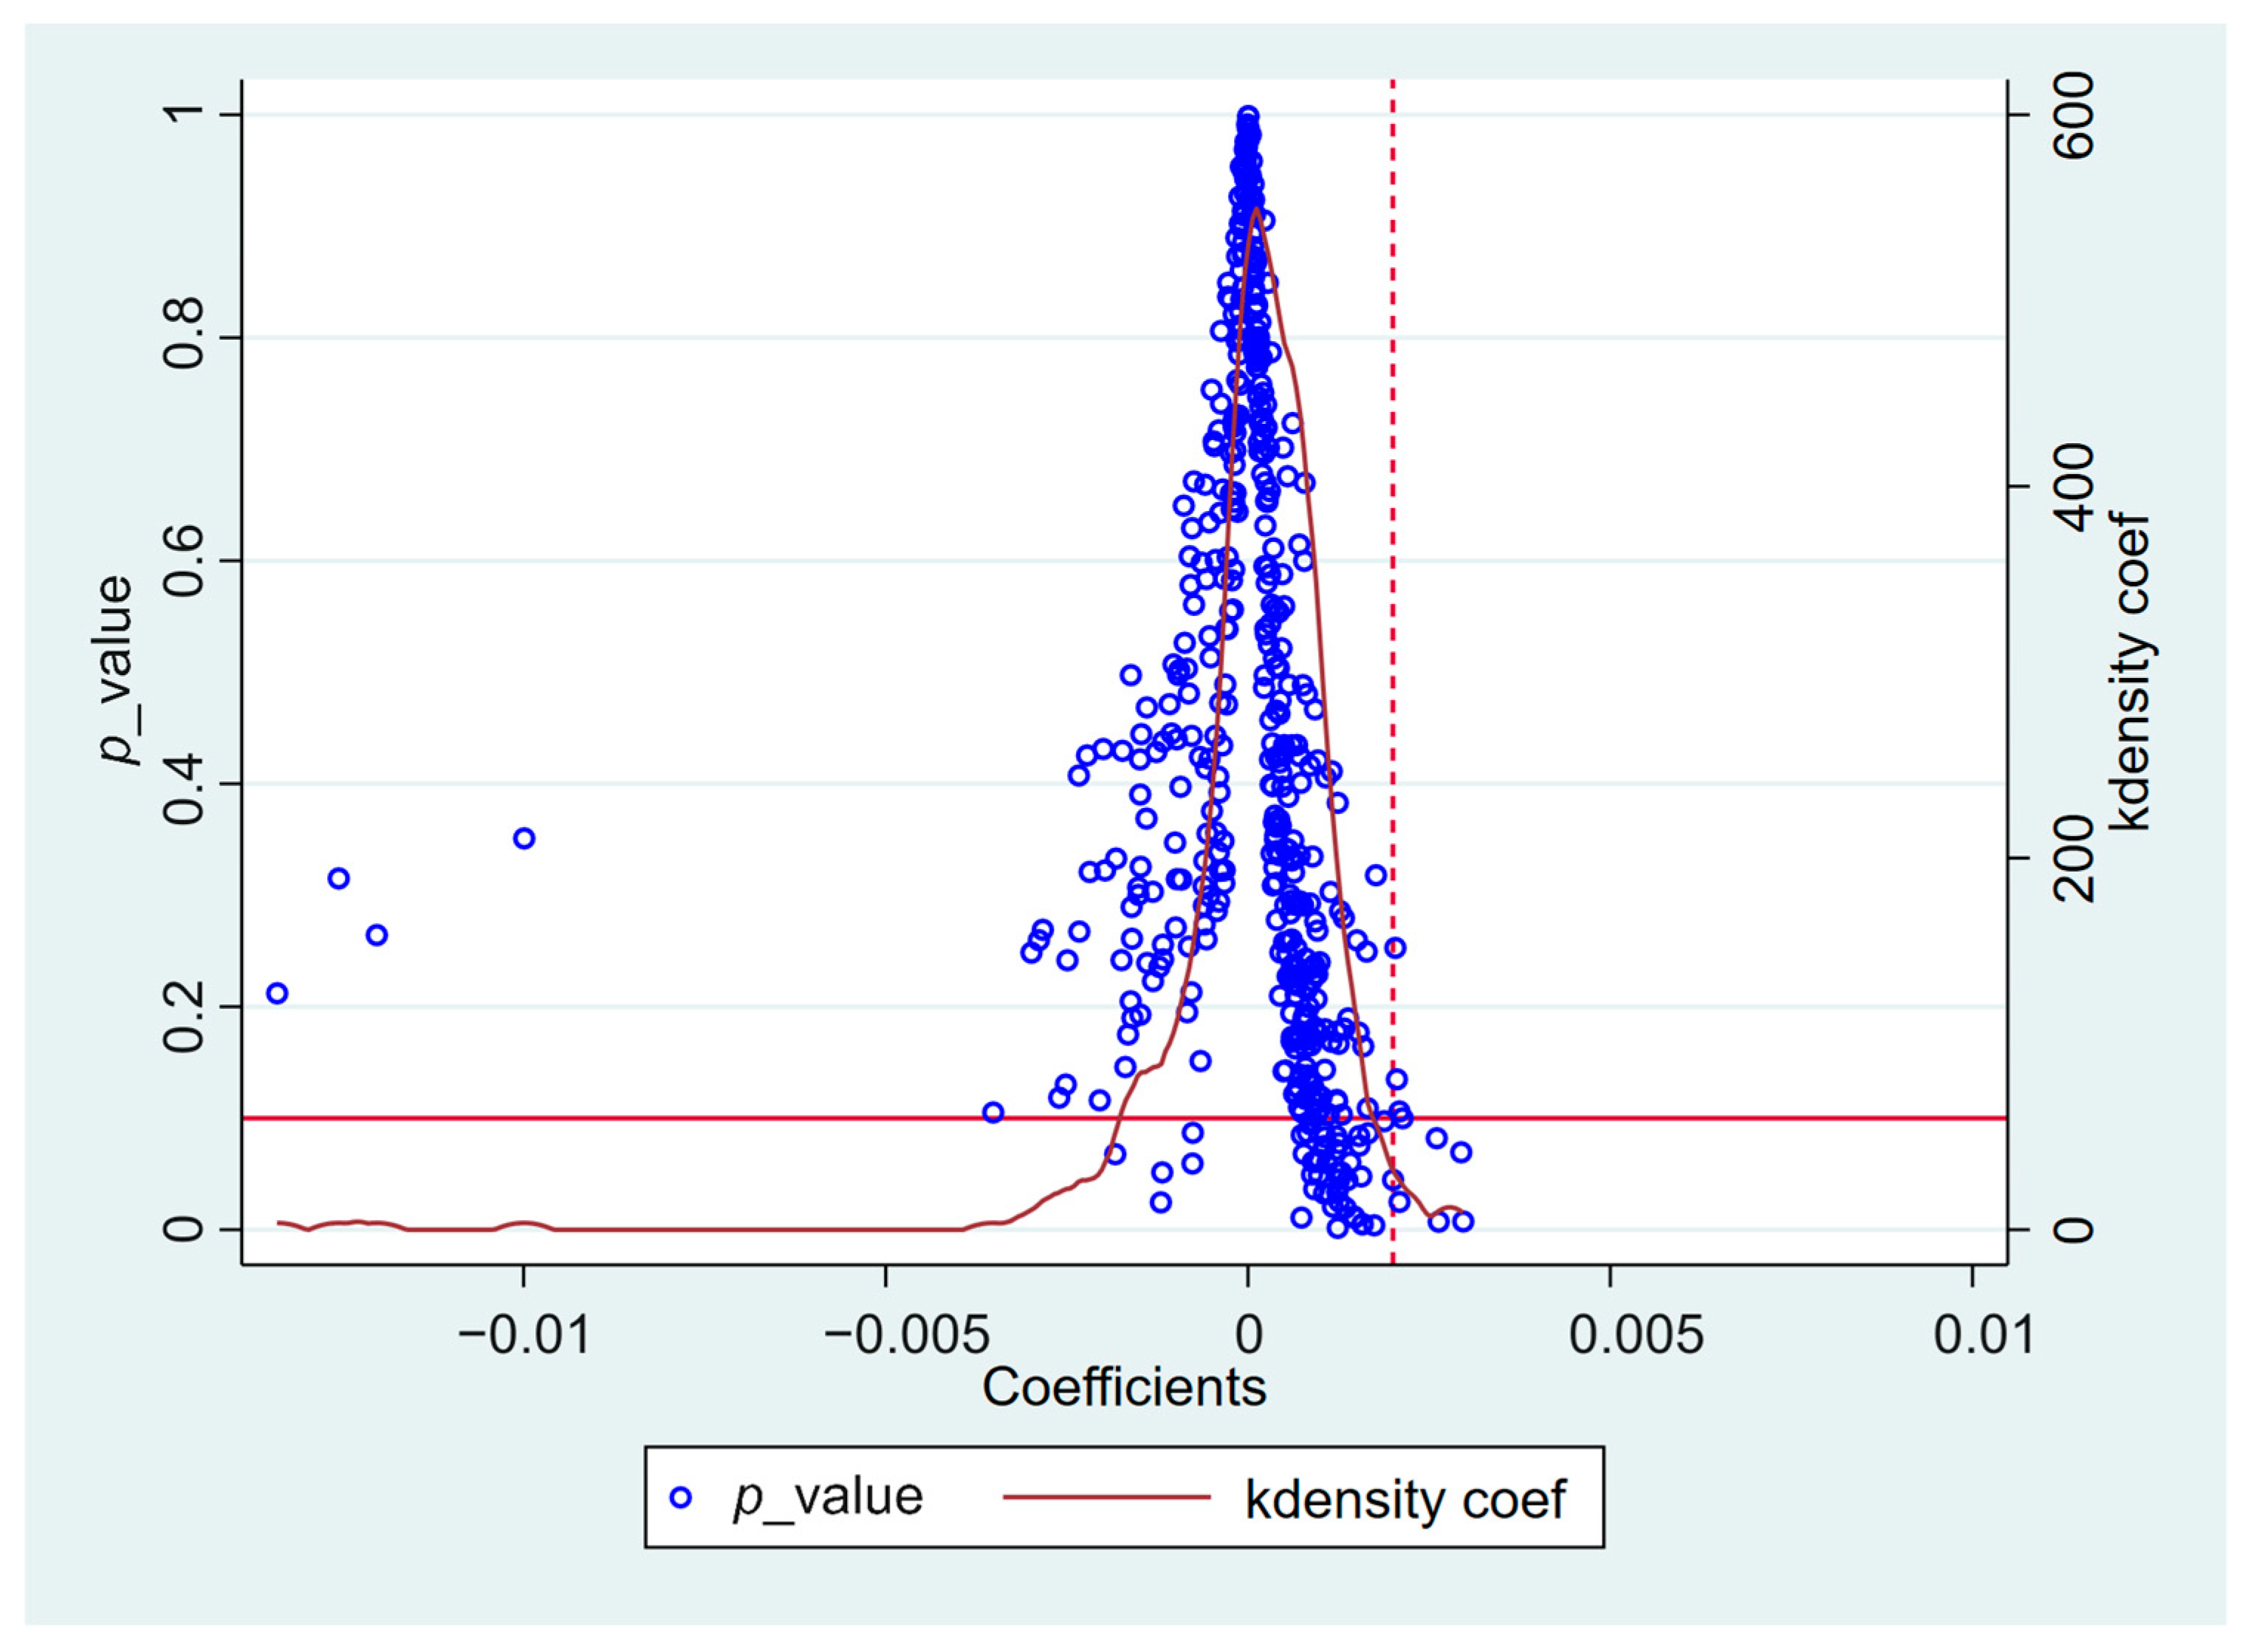
The prerequisite for the effective use of the multi-temporal DID model was the fulfillment of the parallel trends test [84], which required that the two groups of samples prior to the policy shock of the establishment of environmental tribunals were comparable. Referring to methods from other studies for the parallel trend test [21,22], we used the treatment group (establishment of environmental tribunals) and the control group (no establishment of environmental tribunals) to conduct the parallel trend test and plotted the parallel trend graph in Figure 5. As shown in Figure 5, before the time point of the onset of the environmental tribunal policy, the vertical lines of the upper and lower confidence intervals contained 0, suggesting that there was no notable difference between the treatment group and the control group. After that time point, the vertical lines of the confidence intervals did not contain 0, demonstrating a notable difference. Therefore, the DID model in this study satisfied the parallel trend, indicating the regression results were reliable.

5.3.2. Placebo Test

To further ensure the effectiveness of the multi-time point DID model, a placebo test was conducted. The placebo test is a method used to verify the robustness of research results. It validates the reliability of the original research results by simulating an ineffective intervention or policy shock to ensure the conclusions are not influenced by unobserved factors [9,21]. To randomize the policy impact of setting up environmental courts in various cities, a city that had established environmental courts was randomly assigned. A total of 500 placebo tests were carried out. The distribution graph, displaying 500 estimated coefficients, is illustrated in Figure 6. From the graph, it is evident that the coefficients are predominantly concentrated around 0, with the majority of estimated p-values exceeding 0.1. This indicated that the DID estimation results in the baseline regression were unlikely to be influenced by unobserved factors, thus confirming the robustness of the original conclusion.

5.3.3. PSM-DID

PSM-DID combines propensity score matching (PSM) and DID to improve the accuracy of the causal inference. It more effectively controls for selection bias and unobserved heterogeneity, providing more reliable estimates of causal effects [9,85]. We utilized propensity score matching (PSM) to establish a control group for an additional robustness test. The control variables were used as covariates. The propensity scores were estimated using the Logit model. The individuals from the treatment group whose propensity scores were closest to the control group were selected to reconstitute the new control group, ensuring no significant differences in the matched sample individuals except whether environmental courts were established. The matched sample was then entered into the multi-time point DID model for the regression analysis. The results in column (2) of Table 4 indicate that the environmental courts still significantly improved GTFP at the 10% level and the coefficient was 0.00211, which was close to the original conclusion shown in Table 3.

5.4. Mediation Effect Analysis

In this study, we drew on Jiang’s method to design a mediation effect model and did not proceed with the third step of regression [79]. Numerous studies have already demonstrated that reducing carbon intensity can significantly increase GTFP [44,86,87]. Hence, even though Jiang’s model no longer had the traditional third step of the mediation effect, the mediation effect remained effective. The findings related to carbon intensity as a mediating variable are displayed in column (1) of Table 5. The results indicate that establishing an environmental court reduced the carbon intensity growth rate in the city by 4.5%, and achieved a significance level of 1%. This indicates that the establishment of environmental courts effectively constrains companies by enhancing environmental law enforcement capabilities, resulting in reduced carbon emissions [9]. Furthermore, environmental courts strengthen legal constraints beyond administrative penalties, reducing instances where local governments collude with companies and overlook environmental issues in favor of economic development [20]. With the gradual decrease in the carbon intensity growth rate, the city’s economic development model becomes greener and more environmentally friendly, leading to an increase in GTFP [87]. Therefore, reducing carbon intensity is one of the pathways by which environmental courts promote green economic development in cities. Hypothesis 1 is proven.
Previous research has elucidated that there is a strategic interaction between different environmental regulatory measures, which collectively influences the regional GTFP. We also explored the mediating effect of the administrative environmental regulation of local governments. Similar to the analysis of the first mediating effect, numerous studies have demonstrated that the administrative environmental regulatory measures of local government can significantly impact GTFP [36,46,47], so the mediating effect analysis did not undergo a third regression. The results are shown in Table 5. Column (2) shows the mediating effect of administrative environmental regulation, which passed a significance test at the 1% level. The establishment of environmental courts increased the growth rate of the proportion of environmental vocabulary by 12.1%. The proportion of environmental vocabulary in government work reports measured the intensity of local administrative environmental regulation [46]. Therefore, this indicates that as well as providing judicial environmental regulation, environmental courts also strengthen the impact of administrative environmental regulation. This may occurr because judicial environmental regulation supplements administrative environmental regulation, reducing the government’s inaction on pollution in favor of economic development [20]. It may also be due to environmental courts increasing societal environmental awareness through judicial judgments, which in turn could influence the government’s emphasis on environmental protection [88]. In summary, the mediating effect of administrative environmental regulation is significant, validating Hypothesis 2.

5.5. Moderation Effect Analysis

The environmental courts not only apply judicial constraints to companies but also impose greater pressure on them. The more sufficient the financial support, the better companies cope with the environmental regulation applied by the environmental courts, allowing them to embark on a trajectory of robust and sustainable growth. The results in column (1) of Table 6 indicate that the variable (ec*lnloa) achieved a significant moderating effect at the 5% level, with a coefficient of 0.00223, suggesting that adequate financial institution loans are a crucial condition for environmental courts to exert their maximum effectiveness. Environmental courts can end companies’ short-sighted behavior of prioritizing the economy over the environment, forcing them to accelerate their green transformation. This requires substantial financial support [74]. The moderating effect results of financial institution loans demonstrates that providing financial support helps companies achieve green transformation. The focus of urban green economic development lies in companies. If companies successfully turn toward green practices, cities can better achieve green economic growth. Hypothesis 3 is supported.
The establishment of environmental courts compels companies to pay more attention to environmental protection via judicial judgments, promoting research into green technologies. Furthermore, green technologies aid environmental courts in furthering the objective of fostering a green economy. A symbiotic connection has emerged between environmental justice and green technology [50,51]. We proposed that the higher the proportion of green patent applications, the greater the impact of the environmental courts on GTFP. The results in column (2) of Table 6 show that the proportion of green patent applications had a moderating effect on environmental courts, with a coefficient of 0.00328, reaching the 5% significance level. Hypothesis 4 is confirmed. This indicates that green technologies truly help companies achieve green transformation, avoiding judicial penalties from environmental courts for environmental damage [51]. Green technologies help environmental courts achieve both economic benefits and improved environmental quality [75].

5.6. Heterogeneity Analysis

Due to significant differences in economic, judicial, and administrative levels across different regions in China, we divided Chinese cities geographically into the eastern, central, and western regions to study the regional impact of environmental courts [9,70]. Table 7 shows that environmental courts in the eastern, central, and western regions of China all have a positive effect on GTFP, but the degree of impact varies. In the eastern and western regions of China, the coefficients were 0.00119 and 0.00156, respectively, indicating a comparable influence. In the western region, the coefficient was 0.00368, markedly surpassing those in the eastern and central regions, and was notably higher than the baseline regression coefficient of 0.00212. This indicates that environmental courts exert the most significant promotional impact on GTFP in the western region. This may be due to the relatively advanced development of cities in the eastern and central regions, where economic levels, administrative intensity, financial system completeness, and environmental awareness are much higher than in the western cities. Therefore, the stimulating effect of environmental courts on local GTFP is more pronounced in the western region, where there is a lack of environmental regulation [89]. It might also be because environmental courts have improved social perceptions regarding environmental protection in the western region, thereby promoting the development of a green economy [90]. This further demonstrates that environmental court policies enhance the judicial capacity of underdeveloped regions and effectively promote nationwide green development through judicial regulation.
In pursuit of energy efficiency and emissions reduction, the National Development and Reform Commission of China initiated three rounds of low-carbon pilot programs in 2010, 2012, and 2017 [53,54]. These projects aimed to reduce carbon emissions and included various perspectives, such as the economy, government reform, rural policies, and social management [54]. The impact of low-carbon pilot policies on regional green economic development has been significant [91]. As environmental regulatory measures, the implementation of low-carbon pilot policies and environmental court policies in the same region might have a synergistic effect. Alternatively, one policy might have a limited impact due to another policy fully taking effect [89]. In this study, we differentiated samples based on whether they were low-carbon pilot areas for heterogeneity testing. The results presented in Table 8 reveal that while the influence of environmental courts on GTFP was insignificant in the low-carbon pilot cities, it was significant in the non-low-carbon pilot cities, with a coefficient of 0.0015. Low-carbon pilot cities have more comprehensive environmental regulations, which reduces the likelihood of environmental damage in pursuit of economic benefits [53]. Therefore, there were relatively few cases requiring penalties from environmental courts, and the effectiveness of environmental courts is insignificant. In contrast, non-low-carbon pilot cities have relatively weak environmental regulations. Environmental courts, as judicial measures for punishing pollution, effectively supplement the lack of local environmental regulations [89]. Environmental courts played a significant role in non-low-carbon pilot cities. This heterogeneity test result also indirectly confirms that the low-carbon pilot policy has been positive and effective.

6. Conclusions

In this study, we employed a multi-period DID model to investigate the relationship and underlying mechanism between environmental courts and the green economic development of Chinese cities from 2004 to 2019. The following conclusions were drawn:
(1)
Environmental courts increased the efficiency of green economic development by reducing carbon intensity. This conclusion remained valid following a battery of robustness tests.
(2)
The establishment of environmental courts not only signified the improvement of judicial environmental regulation but also strengthened the administrative regulatory power of the government. The combined effect of various environmental regulatory measures prompted cities to transition to a greener development approach.
(3)
The financial support of local financial institutions and green technology innovation helped to induce the positive effect of the environmental court.
(4)
Environmental courts had more impact on promoting green economic development in the western regions and non-low-carbon pilot cities of China. Comparatively, their influence was relatively smaller in the more economically developed eastern and central regions and was not significant in low-carbon pilot cities.

7. Discussion and Policy Implications

7.1. Discussion

All of the research hypotheses were supported by the results. The environmental courts, as a means of judicial environmental regulation, effectively curtail the short-sighted behaviors that neglect environmental protection in the pursuit of economic development. They reduce carbon intensity [9], thereby driving an increase in GTFP [87]. The mediation effect analysis further confirmed the significant role of environmental courts in advancing the green economy. The environmental courts not only effectively address the inadequacy of judicial environmental regulation but also strengthen the government’s administrative environmental regulation, reducing the government’s inaction on pollution issues [20]. The moderation effect results confirmed the positive impact of financial loans and green technology innovation on green economic development [52,75], demonstrating their key role in transforming judicial pressure into development momentum. The heterogeneity test further explored the role of the environmental courts, showing that in the western regions, which lack environmental regulation, environmental courts fill the gap in legal enforcement [89]. Similarly, in non-low-carbon pilot cities, the more significant impact of environmental courts is due to their addressing the regulatory void in these cities. The results also reaffirmed the effectiveness of environmental court policies.

7.2. Policy Implications

Therefore, we propose the following policy implications: First, the effectiveness of environmental courts in promoting green economic development has been demonstrated. China should accelerate the construction of environmental courts and continuously improve the environmental judicial framework, especially in underdeveloped regions. Second, China must implement systematic environmental regulation policies. While actively implementing various environmental policies, China should coordinate environmental regulation efforts from the judicial, administrative, and market perspectives to harness the comprehensive guiding effect of various environmental regulations. Third, achieving green economic development requires not only an effective judicial system but also comprehensive societal support. A healthy financial sector provides sufficient funding for green transformation, while green technological innovation offers technical support for sustainable development. Only when cities achieve comprehensive development can they fully support green economic growth.

7.3. Limitations

In this study, we examined the impact of environmental court policies on GTFP from 2004 to 2019. However, judicial interventions have long-term sustainability, and future research would greatly benefit from focusing on the long-term effects of environmental courts. In addition, we briefly explored the mediating effect of administrative environmental regulation on judicial environmental regulation. However, China’s environmental regulatory system includes not only judicial and administrative environmental regulation, but also market environmental regulation. Future research should focus more on the interactions and systemic effects between different types of environmental regulation. Finally, legal policies and social ethics are closely related and complement each other. Future research should consider social ethics. This could provide more effective guidance for the development of China’s green economy.

Author Contributions

Conceptualization, S.S.; methodology, S.S.; software, S.S.; validation, S.S.; formal analysis, S.S.; resources, S.S.; data curation, S.S.; writing—original draft preparation, S.S.; writing—review and editing, H.Q.; visualization, S.S.; supervision, H.Q.; project administration, H.Q. All authors have read and agreed to the published version of the manuscript.

Funding

This research received no external funding.

Institutional Review Board Statement

Not applicable.

Informed Consent Statement

Not applicable.

Data Availability Statement

Data are available upon request from the authors.

Conflicts of Interest

The authors declare no conflicts of interest.

References

  1. Yang, X.; Jin, K.; Duan, Z.; Gao, Y.; Sun, Y.; Gao, C. Spatial-temporal differentiation and influencing factors of carbon emission trajectory in Chinese cities—A case study of 247 prefecture-level cities. Sci. Total Environ. 2024, 928, 172325. [Google Scholar] [CrossRef] [PubMed]
  2. Xu, J.; Xu, M.; Zhao, Y.; Wang, S.; Tao, M.; Wang, Y. Spatial-temporal distribution and evolutionary characteristics of water environment sudden pollution incidents in China from 2006 to 2018. Sci. Total Environ. 2021, 801, 149677. [Google Scholar] [CrossRef]
  3. Mangla, S.K.; Luthra, S.; Jakhar, S.; Gandhi, S.; Muduli, K.; Kumar, A. A step to clean energy—Sustainability in energy system management in an emerging economy context. J. Clean. Prod. 2020, 242, 118462. [Google Scholar] [CrossRef]
  4. Sun, Y.H.; Ding, W.W.; Yang, Z.Y.; Yang, G.C.; Du, J.T. Measuring China’s regional inclusive green growth. Sci. Total Environ. 2020, 713, 136367. [Google Scholar] [CrossRef]
  5. Li, R.Y.M.; Wang, Q.Q.; Zeng, L.Y.; Chen, H. A Study on Public Perceptions of Carbon Neutrality in China: Has the Idea of ESG Been Encompassed? Front. Environ. Sci. 2023, 10, 949959. [Google Scholar] [CrossRef]
  6. Zhang, K.; Liu, Y.T. A review of the system of “daily continuous penalty” in China’s environmental protection practice-From the perspective of law and economics. Environ. Impact Assess. Rev. 2023, 98, 106976. [Google Scholar] [CrossRef]
  7. Du, W.J.; Li, M.J. Assessing the impact of environmental regulation on pollution abatement and collaborative emissions reduction: Micro-evidence from Chinese industrial enterprises. Environ. Impact Assess. Rev. 2020, 82, 106382. [Google Scholar] [CrossRef]
  8. Allen, F.; Qian, J.; Qian, M.J. Law, finance, and economic growth in China. J. Financ. Econ. 2005, 77, 57–116. [Google Scholar] [CrossRef]
  9. Zhao, Y.H.; Zheng, L.; Zhu, J.Z. Could environmental courts reduce carbon intensity? Evidence from cities of China. J. Clean. Prod. 2022, 377, 134444. [Google Scholar] [CrossRef]
  10. He, W.M.; Wang, B. Environmental jurisdiction and energy efficiency: Evidence from China’s establishment of environmental courts. Energy Econ. 2024, 131, 107358. [Google Scholar] [CrossRef]
  11. Fan, Z.; Zhao, R. Does rule of law promote pollution control? Evidence from the establishment of the environmental court. Econ. Res. J. 2019, 54, 21–37. [Google Scholar]
  12. Gao, W.Y.; Wang, Y.Z.; Wang, F.R.; Mbanyele, W. Do environmental courts break collusion in environmental governance? Evidence from corporate green innovation in China. Q. Rev. Econ. Financ. 2024, 94, 133–149. [Google Scholar] [CrossRef]
  13. Yuan, H.X.; Zou, L.H.; Feng, Y.D. How to achieve emission reduction without hindering economic growth? The role of judicial quality. Ecol. Econ. 2023, 209, 107839. [Google Scholar] [CrossRef]
  14. Pearlman, M.L. The land and environment court of New South Wales—A model for environmental protection. Water Air Soil Pollut. 2000, 123, 395–407. [Google Scholar] [CrossRef]
  15. Preston, B.J. Characteristics of Successful Environmental Courts and Tribunals. J. Environ. Law 2014, 26, 365–393. [Google Scholar] [CrossRef]
  16. Angstadt, J.M. Can Domestic Environmental Courts Implement International Environmental Law? A Framework for Institutional Analysis. Transnatl. Environ. Law 2023, 12, 318–342. [Google Scholar] [CrossRef]
  17. Deng, J.J.; Li, M.X.; Li, Y.; Lu, J. Effect of Environmental Courts on Pollution Abatement: A Spatial Difference-in-Differences Analysis. Sustainability 2024, 16, 1452. [Google Scholar] [CrossRef]
  18. Network, C.C. The Report on the Development of Environmental Justice in China (2019). Available online: https://www.chinacourt.org/article/detail/2020/05/id/5195810.shtml (accessed on 5 October 2023).
  19. Walters, R.; Westerhuis, D.S. Green crime and the role of environmental courts. Crime Law Soc. Change 2013, 59, 279–290. [Google Scholar] [CrossRef]
  20. Stern, R.E. The Political Logic of China’s New Environmental Courts. China J. 2014, 72, 53–74. [Google Scholar] [CrossRef]
  21. Zhang, Q.; Yu, Z.; Kong, D.M. The real effect of legal institutions: Environmental courts and firm environmental protection expenditure. J. Environ. Econ. Manag. 2019, 98, 102254. [Google Scholar] [CrossRef]
  22. Yu, W. Challenges and solutions for China’s environmental court in context of environmental judicial specialization. China Popul. Resour. Environ. 2017, 27, 62–68. [Google Scholar]
  23. Supreme People’s Court of China. Environment and Resources Adjudication in China; Supreme People’s Court of China: Beijing, China, 2020; p. 42.
  24. Jin, Z.N. Environmental Impact Assessment Law in China’s courts: A study of 107 judicial decisions. Environ. Impact Assess. Rev. 2015, 55, 35–44. [Google Scholar] [CrossRef]
  25. Huang, X.Q.; Liu, W.; Cao, Z. Environmental courts and foreign direct investments: Evidence from China. Environ. Sci. Pollut. Res. 2022, 29, 31400–31412. [Google Scholar] [CrossRef] [PubMed]
  26. Hou, X.S.; Yang, J.; Hou, C.H. Can strengthening environmental justice promote carbon reduction? Evidence from environmental courts in China. Environ. Sci. Pollut. Res. 2024, 1–18. [Google Scholar] [CrossRef]
  27. Chen, X.H.; Zhou, P.; Hu, D.B. Influences of the ongoing digital transformation of the Chinese Economy on innovation of sustainable green technologies. Sci. Total Environ. 2023, 875, 162708. [Google Scholar] [CrossRef] [PubMed]
  28. Cao, J.H.; Law, S.H.; Samad, A.R.B.; Mohamad, W.; Wang, J.L.; Yang, X.D. Effect of financial development and technological innovation on green growth-Analysis based on spatial Durbin model. J. Clean. Prod. 2022, 365, 132865. [Google Scholar] [CrossRef]
  29. Cabernard, L.; Pfister, S. A highly resolved MRIO database for analyzing environmental footprints and Green Economy Progress. Sci. Total Environ. 2021, 755, 142587. [Google Scholar] [CrossRef]
  30. Ma, Y.H.; Lin, T.; Xiao, Q.F. The Relationship between Environmental Regulation, Green-Technology Innovation and Green Total-Factor Productivity-Evidence from 279 Cities in China. Int. J. Environ. Res. Public Health 2022, 19, 16290. [Google Scholar] [CrossRef]
  31. Lyu, Y.; Wang, W.; Wu, Y.; Zhang, J. How does digital economy affect green total factor productivity? Evidence from China. Sci. Total Environ. 2023, 857, 159428. [Google Scholar] [CrossRef]
  32. Zhang, W.; Ge, Y. The Spatial Effect Analysis of OFDI on Green Total Factor Productivity. Chin. J. Manag. Sci. 2021, 29, 26–35. [Google Scholar]
  33. Wang, S.S.; Xiao, S.Y.; Lu, X.X.; Zhang, Q.D. North-south regional differential decomposition and spatiotemporal dynamic evolution of China’s industrial green total factor productivity. Environ. Sci. Pollut. Res. 2023, 30, 37706–37725. [Google Scholar] [CrossRef]
  34. Tong, D.; Zhang, Q.; Zheng, Y.X.; Caldeira, K.; Shearer, C.; Hong, C.P.; Qin, Y.; Davis, S.J. Committed emissions from existing energy infrastructure jeopardize 1.5 °C climate target. Nature 2019, 572, 373–377. [Google Scholar] [CrossRef] [PubMed]
  35. Chen, Y.F.; Liu, K.L.; Ni, L.F.; Chen, M.X. Impact of carbon lock-in on green economic efficiency: Evidence from Chinese provincial data. Sci. Total Environ. 2023, 892, 164581. [Google Scholar] [CrossRef] [PubMed]
  36. Peng, X. Strategic interaction of environmental regulation and green productivity growth in China: Green innovation or pollution refuge? Sci. Total Environ. 2020, 732, 139200. [Google Scholar] [CrossRef] [PubMed]
  37. Zhao, S.K.; Cao, Y.Q.; Feng, C.; Guo, K.; Zhang, J.N. How do heterogeneous R&D investments affect China’s green productivity: Revisiting the Porter hypothesis. Sci. Total Environ. 2022, 825, 154090. [Google Scholar] [CrossRef]
  38. Zhu, Y.; Zhang, Y.; Piao, H. Does agricultural mechanization improve the green total factor productivity of China’s planting industry? Energies 2022, 15, 940. [Google Scholar] [CrossRef]
  39. Zhang, H.P.; Dong, Y. Measurement and Spatial Correlations of Green Total Factor Productivities of Chinese Provinces. Sustainability 2022, 14, 5071. [Google Scholar] [CrossRef]
  40. Zhao, P.Y.; Wu, H.Y.; Lu, Z.G.; Kou, J.L.; Du, J. Spatial differences, distributional dynamics, and driving factors of green total factor productivity in China. Front. Environ. Sci. 2022, 10, 1058612. [Google Scholar] [CrossRef]
  41. Cui, H.R.; Wang, H.R.; Zhao, Q.Z. Which factors stimulate industrial green total factor productivity growth rate in China? An industrial aspect. Greenh. Gases-Sci. Technol. 2019, 9, 505–518. [Google Scholar] [CrossRef]
  42. Li, T.H.; Ma, J.H.; Mo, B. Does Environmental Policy Affect Green Total Factor Productivity? Quasi-Natural Experiment Based on China’s Air Pollution Control and Prevention Action Plan. Int. J. Environ. Res. Public Health 2021, 18, 8216. [Google Scholar] [CrossRef]
  43. Shen, J.; Sun, H.; Yang, R.; Shao, J. An Empirical Study of China’s Environmental Economic Policy and the Effect of Industrial Green Transformation—Based on Data Envelopment Analysis Model. In Proceedings of the International Conference on Information Economy, Data Modeling and Cloud Computing, ICIDC 2022, Qingdao, China, 17–19 June 2022. [Google Scholar]
  44. Liu, P.D.; Zhu, B.Y. Temporal-spatial evolution of green total factor productivity in China’s coastal cities under carbon emission constraints. Sustain. Cities Soc. 2022, 87, 104231. [Google Scholar] [CrossRef]
  45. Wang, K.L.; Pang, S.Q.; Zhang, F.Q.; Miao, Z.; Sun, H.P. The impact assessment of smart city policy on urban green total-factor productivity: Evidence from China. Environ. Impact Assess. Rev. 2022, 94, 106756. [Google Scholar] [CrossRef]
  46. Shi, Y. The Impact and Spillover Effects of Environmental Regulation on GTFP. SHS Web Conf. 2023, 154, 03023. [Google Scholar] [CrossRef]
  47. Feng, X.W.; Xin, M.S.; Cui, X.H. The spatial characteristics and influencing factors of provincial green total factor productivity in china-based on the spatial durbin model. Fresenius Environ. Bull. 2021, 30, 8705–8716. [Google Scholar]
  48. Wang, B.; Wang, C. Green Finance and Technological Innovation in Heavily Polluting Enterprises: Evidence from China. Int. J. Environ. Res. Public Health 2023, 20, 3333. [Google Scholar] [CrossRef] [PubMed]
  49. Neagu, F.; Tatarici, L.; Dragu, F.; Stamate, A. Are green loans less risky? Micro-evidence from a European Emerging Economy. J. Financ. Stab. 2024, 70, 101208. [Google Scholar] [CrossRef]
  50. Kesidou, E.; Wu, L. Stringency of environmental regulation and eco-innovation: Evidence from the eleventh Five-Year Plan and green patents. Econ. Lett. 2020, 190, 109090. [Google Scholar] [CrossRef]
  51. Han, L.; Xiao, Z.J.; Yu, Y.Z. Environmental judicature and enterprises’ green technology innovation: A revisit of the porter hypothesis. J. Asian Econ. 2024, 91, 101693. [Google Scholar] [CrossRef]
  52. Tao, S.; Hai, M.D.; Fang, Z.W.; Zheng, D.C. The role of environmental justice reform in corporate green transformation: Evidence from the establishment of China’s environmental courts. Front. Environ. Sci. 2023, 11, 1090853. [Google Scholar] [CrossRef]
  53. Wang, T.H.; Song, Z.; Zhou, J.; Sun, H.P.; Liu, F.Q. Low-Carbon Transition and Green Innovation: Evidence from Pilot Cities in China. Sustainability 2022, 14, 7264. [Google Scholar] [CrossRef]
  54. Song, Q.J.; Qin, M.; Wang, R.C.; Qi, Y. How does the nested structure affect policy innovation?: Empirical research on China’s low carbon pilot cities. Energy Policy 2020, 144, 111695. [Google Scholar] [CrossRef]
  55. Qi, X.L.; Wu, Z.F.; Xu, J.Q.; Shan, B.O. Environmental justice and green innovation: A quasi-natural experiment based on the establishment of environmental courts in China. Ecol. Econ. 2023, 205, 107700. [Google Scholar] [CrossRef]
  56. Li, S.-E.; Cheng, K.-M. Do large cities have a productivity advantage in China? From the perspective of green total factor productivity growth. J. Clean. Prod. 2022, 379, 134801. [Google Scholar] [CrossRef]
  57. Zhao, X.; Nakonieczny, J.; Jabeen, F.; Shahzad, U.; Jia, W. Does green innovation induce green total factor productivity? Novel findings from Chinese city level data. Technol. Forecast. Soc. Change 2022, 185, 122021. [Google Scholar] [CrossRef]
  58. Guan, Y.; Wang, H.; Guan, R.; Ding, L. Measuring inclusive green total factor productivity from urban level in China. Front. Environ. Sci. 2022, 10, 966246. [Google Scholar] [CrossRef]
  59. Statistics, N.B.O. China Regional Economic Statistical Yearbook. Available online: https://navi.cnki.net/knavi/yearbooks/YZXDR/detail?uniplatform=NZKPT (accessed on 28 October 2023).
  60. Statistics, N.B.O. China City Statistical Yearbook. Available online: https://navi.cnki.net/knavi/yearbooks/YZGCA/detail?uniplatform=NZKPT (accessed on 26 October 2023).
  61. CSMAR. CSMAR Database. Available online: https://data.csmar.com/ (accessed on 21 October 2023).
  62. CEIC. CEIC Database. Available online: https://www.ceicdata.com.cn/zh-hans (accessed on 28 October 2023).
  63. Zhao, P.-J.; Zeng, L.-E.; Lu, H.-Y.; Zhou, Y.; Hu, H.-Y.; Wei, X.-Y. Green economic efficiency and its influencing factors in China from 2008 to 2017: Based on the super-SBM model with undesirable outputs and spatial Dubin model. Sci. Total Environ. 2020, 741, 140026. [Google Scholar] [CrossRef] [PubMed]
  64. CEASDs. CEASDs Database. Available online: https://www.ceads.net.cn/ (accessed on 19 October 2023).
  65. Shan, Y.; Liu, J.; Liu, Z.; Xu, X.; Shao, S.; Wang, P.; Guan, D. New provincial CO2 emission inventories in China based on apparent energy consumption data and updated emission factors. Appl. Energy 2016, 184, 742–750. [Google Scholar] [CrossRef]
  66. Zhang, X.; Zhong, S.; Yao, F.G.; Li, Y.X.; Li, J. Industrial green total factor productivity in China’s Yangtze River Economic Zone: Temporal and spatial difference analysis based on 108 panel data. PLoS ONE 2022, 17, e0259366. [Google Scholar] [CrossRef] [PubMed]
  67. Fu, L.; Zhang, S.Y.; Guo, S.D. A Study on the Changes of Green Total Factor Productivity in Chinese Cities under Resource and Environmental Constraints. Sustainability 2024, 16, 1658. [Google Scholar] [CrossRef]
  68. Jimenez, R.; Mercado, J. Energy intensity: A decomposition and counterfactual exercise for Latin American countries. Energy Econ. 2014, 42, 161–171. [Google Scholar] [CrossRef]
  69. Xiao, S.; Wang, S.; Zeng, F.; Huang, W.-C. Spatial Differences and Influencing Factors of Industrial Green Total Factor Productivity in Chinese Industries. Sustainability 2022, 14, 9229. [Google Scholar] [CrossRef]
  70. Tao, C.L.; Liao, Z.L.; Hu, M.X.; Cheng, B.D.; Diao, G. Can Industrial Restructuring Improve Urban Air Quality?-A Quasi-Experiment in Beijing during the COVID-19 Pandemic. Atmosphere 2022, 13, 119. [Google Scholar] [CrossRef]
  71. Tian, Y.; Pang, J. The role of internet development on green total-factor productivity-An empirical analysis based on 109 cities in Yangtze River economic belt. J. Clean. Prod. 2022, 378, 134415. [Google Scholar] [CrossRef]
  72. Wang, C.R.; Gou, L.F.; Li, X.M. Is Education Beneficial to Environmentally Friendly Behaviors? Evidence from CEOs. Int. J. Environ. Res. Public Health 2022, 19, 11391. [Google Scholar] [CrossRef] [PubMed]
  73. Shiyi, C.; Shixiong, C. Haze pollution and economic green transformation assessment of Chinese cities: 2004–2016. Fu Dan Xue Bao She Hui Ke Xue Ban 2018, 6, 122. [Google Scholar]
  74. Kawecka-Wyrzykowska, E. Financing Energy Transition in Poland: Possible Contribution of EU Funds. Eur. Integr. Stud. 2022, 16, 65–77. [Google Scholar] [CrossRef]
  75. Wu, J.; Xia, Q.; Li, Z. Green innovation and enterprise green total factor productivity at a micro level: A perspective of technical distance. J. Clean. Prod. 2022, 344, 131070. [Google Scholar] [CrossRef]
  76. China National Intellectual Property Administration. Patent Search and Analysis Website. Available online: https://pss-system.cponline.cnipa.gov.cn/conventionalSearch (accessed on 25 October 2023).
  77. CNRDS. Chinese Research Data Services Platform. Available online: https://www.cnrds.com/Home/Login (accessed on 17 October 2023).
  78. Website, G. Low-Carbon Pilot Projects List. Available online: https://www.gov.cn/yaowen/ (accessed on 25 November 2023).
  79. Jiang, T. Mediating effects and moderating effects in causal inference. China Ind. Econ. 2022, 5, 100–120. [Google Scholar]
  80. Song, T.; Dian, J.; Chen, H. Can smart city construction improve carbon productivity?—A quasi-natural experiment based on China’s smart city pilot. Sustain. Cities Soc. 2023, 92, 104478. [Google Scholar] [CrossRef]
  81. Du, Y.; Zhou, J.; Bai, J.; Cao, Y. Breaking the resource curse: The perspective of improving carbon emission efficiency based on digital infrastructure construction. Resour. Policy 2023, 85, 103842. [Google Scholar] [CrossRef]
  82. Zhang, K.S.; Pan, Z.; Janardhanan, M. Relationship between the Degree of Internationalization and Greenwashing of Environmental Responsibilities in China-Based on the Legitimacy Perspective. Sustainability 2022, 14, 2794. [Google Scholar] [CrossRef]
  83. Dong, F.; Zhu, J.; Li, Y.F.; Chen, Y.H.; Gao, Y.J.; Hu, M.Y.; Qin, C.; Sun, J.J. How green technology innovation affects carbon emission efficiency: Evidence from developed countries proposing carbon neutrality targets. Environ. Sci. Pollut. Res. 2022, 29, 35780–35799. [Google Scholar] [CrossRef] [PubMed]
  84. Becker, S.O.; Pascali, L. Religion, Division of Labor, and Conflict: Anti-Semitism in Germany over 600 Years. Am. Econ. Rev. 2019, 109, 1764–1804. [Google Scholar] [CrossRef]
  85. Cao, Y.W.; Zhang, Y.T.; Yang, L.; Li, R.Y.M.; Crabbe, M.J.C. Green Credit Policy and Maturity Mismatch Risk in Polluting and Non-Polluting Companies. Sustainability 2021, 13, 3615. [Google Scholar] [CrossRef]
  86. Yang, Y.; Chen, L.; Su, Z.X.; Wang, W.B.; Wang, Y.; Luo, X. Study on Spatiotemporal Features and Factors Influencing the Urban Green Total Factor Productivity in the Yellow River Basin under the Constraint of Pollution Reduction and Carbon Reduction. Processes 2023, 11, 730. [Google Scholar] [CrossRef]
  87. Ma, W.J.; Ding, Y.F.; Bai, M.Q.; Aihemaiti, A.; Zhou, L.J.; Yang, Z.N.; Ma, Q.; Aslam, S.B. Assessing green total factor productivity and spatial spillover effect in China’s maize industry for sustainable food production: A carbon emissions perspective. Front. Sustain. Food Syst. 2023, 7, 1235132. [Google Scholar] [CrossRef]
  88. Zhang, L.S.; Yue, M.Y.; Wang, S.; Wan, Y.T.; Qu, L.F. Research on public participation in environmental litigation: Empirical evidence in China. Environ. Res. Commun. 2023, 5, 115016. [Google Scholar] [CrossRef]
  89. Zhai, H.; Liu, Y. Does environmental justice specialization promote corporate environmental governance? Quasi natural experiments from special environmental courts. China Popul. Resour. Environ. 2019, 29, 138–147. [Google Scholar]
  90. Li, R.Y.M.; Li, Y.L.; Crabbe, M.J.C.; Manta, O.; Shoaib, M. The Impact of Sustainability Awareness and Moral Values on Environmental Laws. Sustainability 2021, 13, 5882. [Google Scholar] [CrossRef]
  91. Qiu, S.L.; Wang, Z.L.; Liu, S. The policy outcomes of low-carbon city construction on urban green development: Evidence from a quasi-natural experiment conducted in China. Sustain. Cities Soc. 2021, 66, 102699. [Google Scholar] [CrossRef]
Figure 1. The number of environmental courts established by intermediate people’s courts in China, 2007–2019.
Sustainability 16 07007 g001
Figure 2. The distribution of environmental courts established by intermediate people’s courts in China, 2019.
Sustainability 16 07007 g002
Figure 3. The distribution of green total factor productivity (GTFP) in China, 2006.
Sustainability 16 07007 g003
Figure 4. The distribution of GTFP in China, 2019.
Sustainability 16 07007 g004
Figure 5. Parallel trends test results.
Sustainability 16 07007 g005
Figure 6. Placebo test results.
Sustainability 16 07007 g006
Table 1. Variable definitions.
VariableVariable DefinitionsUnit
gtfpGreen total factor productivity.-
ecDummy variable for environmental courts: assigned as 1 if environmental court exists; otherwise, assigned as 0.-
pergdpGDP per capita at the end of the year.CNY10000
per person
gdp02The proportion of the secondary industry to GDP.%
gdp03The proportion of the tertiary industry to GDP.%
eduThe number of universities per million people.per million people
finThe ratio of local general public budget expenditure to GDP.%
ciThe carbon emission per unit of GDP.tons/CNY10000
erThe proportion of the frequency of environmental protection vocabulary appearing in the government work report to the total vocabulary frequency.%
loaThe ratio of year-end outstanding loans of financial institutions to GDP.%
greenThe proportion of green patent applications to total patent applications.%
ecwDummy variables for regions: assigned as 1 for the eastern region of China, 2 for the central region of China, and 3 for the western region of China.-
lcThe dummy variable for low-carbon city pilot projects: assigned as 1 if it belongs to a low-carbon city pilot project; otherwise, assigned as 0.-
Table 2. Descriptive statistical analysis.
VariableNMeanSDMinMax
gtfp45111.0030.0240.5051.983
ec45110.0960.2940.0001.000
pergdp45113.4564.1980.21552.050
gdp0245110.4760.1120.0000.910
gdp0345110.3900.1010.0000.853
edu45111.7782.1720.00026.610
fin45110.2260.1460.0071.407
ci45115.2455.7990.09172.810
er43120.0050.0020.0000.018
loa45111.1460.8460.13314.880
green45110.0840.0410.0000.610
ecw45111.9360.8011.0003.000
lc45110.1890.3910.0001.000
Table 3. Baseline regression results.
(1)(2)
lngtfplngtfp
ec0.00234 ***0.00212 ***
(0.00058)(0.00058)
lnpergdp 0.00301 **
(0.00143)
lngdp02 0.00366 *
(0.00208)
lngdp03 0.00480
(0.00309)
lnedu −0.00230 **
(0.00106)
lnfin 0.00045
(0.00158)
_cons0.00223 ***0.00812 **
(0.00006)(0.00323)
City fixed effectYesYes
Year fixed effectYesYes
N45114464
R20.0180.018
Standard errors in parentheses. * p < 0.1, ** p < 0.05, *** p < 0.01.
Table 4. PSM-DID estimation results.
(1)(2)
PSM-DIDPSM-DID
ec0.00222 *0.00211 *
(0.00121)(0.00119)
_cons0.00248 ***0.01470
(0.00040)(0.01080)
ControlNoYes
City fixed effectYesYes
Year fixed effectYesYes
N44644464
R20.1990.203
Standard errors in parentheses. * p < 0.1, *** p < 0.01.
Table 5. The mediation effect results.
(2)(2)
lncilner
ec−0.04520 ***0.12100 ***
(0.01050)(0.03240)
_cons1.43000 ***−5.40500 ***
(0.06330)(0.18500)
ControlYesYes
City fixed effectYesYes
Year fixed effectYesYes
N44644258
R20.9890.616
Standard errors in parentheses. *** p < 0.01.
Table 6. The moderating effect results.
(2)(2)
lnloalngreen
ec0.00141 *0.00978 ***
(0.00074)(0.00341)
ec*lnloa0.00223 **
(0.00112)
lnloa−0.00071
(0.00061)
ec*lngreen 0.00328 **
(0.00136)
lngreen −0.00016
(0.00177)
_cons0.00952 ***0.00899 **
(0.00337)(0.00402)
ControlYesYes
City fixed effectYesYes
Year fixed effectYesYes
N42584406
R20.0190.019
Standard errors in parentheses. * p < 0.1, ** p < 0.05, *** p < 0.01.
Table 7. The heterogeneity analyses results by geographical location.
(1)(2)(3)
lngtfplngtfplngtfp
Eastern CitiesCentral CitiesWestern Cities
ec0.00119 **0.00156 **0.00368 *
(0.000595)(0.000713)(0.00207)
_cons−0.002740.006010.0182 **
(0.00419)(0.00467)(0.00887)
ControlYesYesYes
City fixed effectYesYesYes
Year fixed effectYesYesYes
N160015861278
R20.2530.0150.024
Standard errors in parentheses. * p < 0.1, ** p < 0.05.
Table 8. The heterogeneity analyses results of the low-carbon city.
(1)(2)
lngtfplngtfp
Non-Low-CarbonLow-Carbon
ec0.00150 **0.00229
(0.000623)(0.00182)
_cons0.0105 ***0.00729
(0.0037)(0.0235)
ControlYesYes
City fixed effectYesYes
Year fixed effectYesYes
N3612851
R20.0180.15
Standard errors in parentheses. ** p < 0.05, *** p < 0.01.
Disclaimer/Publisher’s Note: The statements, opinions and data contained in all publications are solely those of the individual author(s) and contributor(s) and not of MDPI and/or the editor(s). MDPI and/or the editor(s) disclaim responsibility for any injury to people or property resulting from any ideas, methods, instructions or products referred to in the content.

