Abstract
Vehicles equipped with internal combustion engines (ICE) are major contributors to greenhouse gas (GHG) emissions and dependence on fossil fuels. Alternatives such as electric, hydrogen fuel cell and biofuel-based propulsions are being considered as a replacement for the well-established ICE vehicles to reduce GHG emissions and provide sustainable transportation. This paper will compare various heavy-duty vehicle (HDV) propulsion combinations using a well-to-wheel (WTW) analysis, separated into two parts: Well-to-Tank (WTT) and Tank-to-Wheel (TTW). The WTW analysis of ICE HDV is based on a Euro VI heavy-duty test engine coupled to an engine dynamometer. The energy consumption and GHG emissions are measured, not estimated, providing a closer to real-life comparison. The paper will provide a detailed comparison of alternative propulsions to the internal combustion engine based on WTW analysis. Final results suggest, even with the EU’s fairly fossil energy carrier-dependent energy mix, the usage of electric propulsion systems can reach up to 56% of GHG emission cut compared to conventional ICE.
1. Introduction
1.1. Research Hypothesis
In the European Union, reportedly 13% [1] of greenhouse gas emissions are linked to transportation. As the EU plans to reduce GHG emissions in all economic sectors, transportation is no exception. The current consensus to reach that goal is the conversion of the whole fleet to zero-emission vehicles (ZEV). Lawmakers, on one side, introduce stricter emission requirements and, on the other side, provide incentives to switch to ZEV. In the passenger car (PC) segment, business analysts are predicting the turnover in favor of battery electric vehicles (BEV) is closer than anticipated [2]. By the end of the decade, BEVs will possess the main market share. An often-overlooked fact is that while local emissions of ZEVs are zero; their global emission is in correspondence with the energy mix of the place of usage (economic region). In the case of passenger cars, the inherently lower daily mileage covered [3] allows the BEV to be a sufficient mobility solution. At the same time, the heavy-duty (HD), especially for long-distance transportation, the internal combustion engine is not so easy to replace. The International Energy Agency (IEA) has proposed the implementation of low-carbon alternatives to internal combustion engine (ICE) vehicles to reduce the emissions of greenhouse gases (GHG) and decrease dependence on fossil fuels in the transportation sector. Such alternatives include electric vehicles (EVs), hydrogen fuel cell vehicles (FCVs), and biofuel-powered vehicles as a means to mitigate the impacts of climate change and ensure sustainable transportation.
Recently the European Commission’s Joint Research Centre (JRC) published its latest study [4] on transportation-related GHG emission quantification. It has been a waypoint for industry stakeholders throughout the years. In this latest issue, heavy-duty vehicles have finally been involved as well, introducing the current and estimated future emission figures. Carmakers and fleet management companies are equally invested in understanding if their strategy aligns with JRC expectations since these studies have been the baseline of every emission regulation in the EU. This paper aims to provide a more accurate comparison of alternative propulsions to internal combustion engine vehicles by using a WTW analysis with baseline data obtained from a Euro VI test engine coupled to an engine dynamometer. This approach allows for a more realistic assessment of energy consumption and greenhouse gas (GHG) emissions, as the data is not based on estimates but actual measurements. Therefore, a comparison can be made between current and expected fuel pathways and propulsion systems between this study and the official figures of JRC.
The analysis will be divided into two parts: a Well-to-Tank analysis, which will examine the energy and emissions associated with the production and delivery of the fuel, and a Tank-to-Wheel analysis, which will examine the energy consumption and emissions of the vehicles themselves during operation. The goal is to evaluate the overall environmental impact and energy efficiency of each propulsion option to provide a comprehensive understanding of their potential as a replacement for ICE vehicles by integrating WTT and TTW into a single Well-to-Wheel analysis. WTW analysis is a methodology that evaluates the entire energy consumption and emissions of a vehicle, including the production, processing, and transportation of the fuel, as well as the vehicle operation. In order to quantitatively compare the environmental impact, energy efficiency, and lifecycle costs of various vehicle-fuel combinations, several studies have been conducted using Well-to-Wheel analysis. Williamson and Emadi [5] have conducted a WTW analysis to compare the efficiencies of hybrid electric vehicles (HEVs) and fuel cell electric vehicles (FCEVs) that operate on conventional hydrocarbon fuels such as petrol and diesel. Similarly, Offer et al. [6] have conducted a WTW analysis to compare the lifecycle costs of battery electric vehicles (BEVs), hydrogen-based FCEVs, and fuel cell hybrid electric vehicles. Another study by Campanari et al. [7] used WTW analysis based on drive cycle simulations to evaluate the influence of primary energy supply and range on emissions and the efficiency of BEVs and FCEVs. Wang et al., [8] compared all available hydrogen production pathways in China and integrated them into a WTW analysis, which was showing FCEV is in between BEV and ICE propulsions in terms of GHG emission. It is worth mentioning that all of these studies use different methodologies and data. Thus, the result may vary. This paper aims to provide a more accurate comparison of alternative propulsions to internal combustion engine vehicles by using a WTW analysis with baseline data obtained from a Euro VI test engine coupled to an engine dynamometer. This approach allows for a more realistic assessment of energy consumption and greenhouse gas (GHG) emissions, as the data is not based on estimates but actual measurements. Additionally, factors such as air drag, rolling resistance, and road incline are simulated by the official Vecto software and added as an additional load to the analysis. For battery electric vehicles (BEVs) and fuel cell electric vehicles (FCEVs), the analysis will focus on the WTT stage, as their local emissions are zero. The WTT data will be sourced from the European Commission’s Joint Research Centre (JRC) research.
1.2. Explaining Greenhouse Gases
The majority of the solar energy radiated by the sun to Earth is reflected back to space. The greenhouse gases (GHG) residing in the atmosphere prevent that reflection by adsorption. Therefore, the heat is trapped. This effect makes planet Earth habitable, as we know; without GHG, the average temperature would be −18 °C on the surface. This natural balance of the greenhouse effect has been altered by human activities. The main sectors responsible for additional GHG emissions are manufacturing (23%), electricity, gas supply (19%), household activities (17%), transportation and storage (13%), and agriculture (13%), according to the latest report of Eurostat [1]. Since the end of the 19th century, the planet’s average temperature has increased by 1 °C. The global warming rate is now nearly 0.2 °C per decade. The Intergovernmental Panel on Climate Change (IPCC) warns, based on the latest climate models [9], drought, extreme temperature peaks, and irreversible changes will occur in living organisms and ecosystems if global warming exceeds the 1.5 °C threshold set by the Paris agreement [10]. Several studies extrapolate the current industrialization rate and show that the chance of global warming staying below 2 °C is less than 10% until the end of the 21st century [11]. Fortunately, EU lawmakers and key industry stakeholders have recognized the severity of the GHG emissions, and their combined efforts resulted in a 32% GHG emission cut in the 1990–2020 period [12]. The future goals of the EU are separated to reach 45% CO2 equivalent emission reduction by 2030 and net zero by 2050 [13].
Greenhouse gases are classified in terms of the global warming potential (GWP). The main gas component is carbon dioxide by penetration. Therefore, the other gases are weighted in equivalency to CO2 [14]. The weight factors of the four main GHG can be seen below:
- Carbon-dioxide (CO2) = 1 [CO2-equivalent],
- Methane (CH4) = 25 [CO2-equivalent],
- Nitrous oxide (N2O) = 298 [CO2-equivalent],
- Sulphur hexafluoride (SF6) = 22,800 [CO2-equivalent],
Carbon dioxide can be released by burning fossil energy carriers or any carbon-based material. CO2 sequestering (removal) can be achieved via absorption into plants as a part of the natural carbon cycle. Although there are currently many artificial solutions that exist for CO2 removal, in 2022, a Japan-based research team unveiled a liquid-based carbon catcher, which is twice as fast as previous solutions, and the removal efficiency is over 99% [15]. Methane concentration is the second largest among the greenhouse gases. It is 25 times as potent as CO2 in terms of GWP. The anthropogenic (human-influenced) methane emission is twice as high as at the end of the 19th century. The main sources are coal, natural gas mining, and livestock production. That is mainly explainable by the rapid increase in energy and meat demand over the last decades [16]. Methane’s lifetime in the atmosphere is relatively short; therefore if the emission output decreases, a significant reduction could be seen over a short period. The reduction can be achieved by increasing the renewable energy penetration over fossil energy carriers and meat-substituting nutrition sources. Nitrous oxide (N2O) is a byproduct of artificial fertilizer; it’s 298 times more potent greenhouse gas than CO2, and the life expectancy is over 110 years in the atmosphere. According to IPCC, N2O is responsible for 6% of GHG globally [9]. It is commonly mistaken for nitrogen oxides (NOx: NO, NO2), which are not considered as primary GHG. Moreover, N2O is rarely produced during internal combustion engine operation [17]. The modern food supply chain relies on plannable crop yield, and the cornerstone of that steady yield is synthetic fertilizers which are identified as the main N2O sources. Sulphur Hexafluoride’s (SF6) global warming potential is 22,800 times the CO2 and resides in the atmosphere for up to 3200 years after it is emitted. These shocking discoveries have led to the 1997 Kyoto Protocol [18], where SF6 has been recognized to be included among the most significant greenhouse gases. It is not widely known, but SF6 is an inescapable element of the modern world, ranging from mobile phones to the battery electric vehicle (BEV) batteries. Its popularity is due to its excellent electrical insulator properties. In fact, no other known material could substitute it, although EU lawmakers are trying to phase it out and reduce the allowed quantity by regulations [19].
2. Materials and Methods
2.1. Overview of Methods
The study will be divided into Well-to-Tank (WTT) and Tank-to-Wheel (TTW) sections. The WTT evaluation will be based on research conducted by the Joint Research Centre (JRC) [20]. The TTW evaluation will only be performed for internal combustion engine (ICE) propulsions, as zero-emission vehicles (ZEVs) do not have any local emissions. Therefore, the TTW analysis does not apply. The different propulsions allocation to corresponding analysis is summarized in Table 1.

Table 1.
Allocating propulsion systems for corresponding analysis.
2.2. Well-to-Tank Evaluation
This section provides information on the Well-to-Tank (WTT) values for different fuel types and pathways that will be used in the WTW analysis. There are a great number of hidden energy consumption and GHG emitting processes until the fuel reaches the end user. For prudent comparison, all fuel types and pathways have been evaluated by the same production milestones, which are respectively:
- Production and conditioning at the source (All operations linked to the extraction of the primary energy source)
- Transformation at source (First stage refinery of the primary energy source)
- Transportation to the EU (Crude or first-stage refined energy carrier transportation)
- Transformation in the EU (Refining process for market requirements)
- Conditioning and distribution (Final refinery stage of fuels and distribution for individual refueling points
In Table 2. The expended energy and the GHG emission columns integrate the energy consumption and the emissions of the above-said pathways. The commercial readiness level introduces an aid to scale each fuel pathway’s high-volume commercial readiness. The methodology has been developed by ARENA [21] and is available in open access. In this study only the highest CRL fuel pathways are considered for clarity.
Table 2.
WTT analysis for various fuel types, data source: JEC WTT [20].
The first fuel type listed is diesel, which is a commonly used fuel for heavy-duty trucks. The table provides WTT values for two different scenarios—typical EU supply and typical EU supply with carbon capture and storage (CCS). The typical EU supply, in this case, corresponds to the following description based on JRC WTT [20]: crude oil from typical EU supply, transport by sea, refining in EU (marginal production), typical EU distribution and retail routes. The expended energy for a typical EU supply is 0.26 MJ/MJ fuel, while the GHG emissions are 92.06 g CO2 eq/MJ fuel. With CCS, the expended energy increases to 0.32 MJ/MJ fuel, but the GHG emissions decrease to 86.90 g CO2 eq/MJ fuel. This shows the potential impact of using carbon capture and storage technologies to reduce emissions associated with the production of diesel fuel. Two different scenarios are listed for electricity—EU-mix 2013 and EU-mix 2030 estimation. The expended energy for EU-mix 2013 is 1.83 MJ/MJ fuel, while the GHG emissions are 105.38 g CO2 eq/MJ fuel. For EU-mix 2030 estimation, the expended energy decreases to 1.24 MJ/MJ fuel, and the GHG emissions decrease to 71.35 g CO2 eq/MJ fuel. This shows the potential for reducing emissions associated with electricity production through the increased use of renewable energy sources. There are two different scenarios listed as well for hydrogen production—natural gas-based production and production via methane cracking. The expended energy for natural gas-based production is 0.94 MJ/MJ fuel, while the GHG emissions are 109.44 g CO2 eq/MJ fuel. For production via methane cracking, the expended energy decreases to 0.37 MJ/MJ fuel, and the GHG emissions decrease to 30.74 g CO2 eq/MJ fuel. This shows the potential for reducing emissions associated with hydrogen production through the use of alternative production methods.
Finally, WTT values for two different biodiesel scenarios—rapeseed-based biodiesel and waste cooking oil-based biodiesel. The expended energy for rapeseed-based biodiesel is 1.11 MJ/MJ fuel, while the GHG emissions are 48.44 g CO2 eq/MJ fuel. For waste cooking oil-based biodiesel, the expended energy decreases to 0.19 MJ/MJ fuel, and the GHG emissions decrease to 8.33 g CO2 eq/MJ fuel. This shows the potential for reducing emissions associated with biodiesel production through the use of alternative feedstocks. Overall, a comparative analysis of different fuel types commonly used in transportation in terms of their commercial readiness, expended energy, and GHG emissions is summarized in Table 2. This data is extracted from JEC latest WTT report [20].
2.3. Tank to Wheel Evaluation
Based on Table 1. the FCEV and BEV powered vehicles are excluded from this section, as they do not emit harmful emissions locally. The diesel heavy-duty trucks are likely to remain prevalent in long-hauling routes for the foreseeable future, due to the limitations of battery technology and infrastructure for BEV and FCEV trucks. That is why only the long-hauling cycle is considered throughout this evaluation. The flow chart of the diesel powered TTW definition process can be seen on Figure 1.
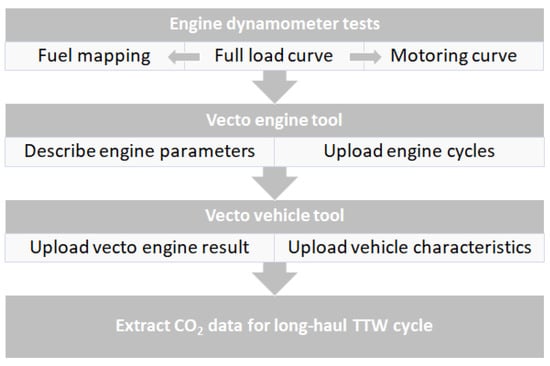
Figure 1.
Tank-to-Wheel ICE evaluation flow chart.
Firstly, engine dynamometer bench tests are required to feed the output data to the Vecto engine, then finally to the Vecto vehicle simulation software. Vecto tools [22] have been mandatory for the CO2 declaration of heavy-duty vehicles since 2019 in the European Union [23].
2.3.1. Engine Dynamometer Test
The engine bench tests were performed in the Exhaust System Evaluation department of Ibiden Hungary’s Technical Center. An AVL HD 500 kW engine dynamometer test cell was used with fully equipped engine fluid conditioners. The unit under test was a Euro VI-d compliant diesel engine, detailed specifications can be seen in Table 3.
Table 3.
Detailed test engine specifications.
The Vecto engine tool requires three types of datasets from the actual test engine (as can be seen on Figure 2.) to prepare a file summarizing the engine profile: full load curve, fuel map and motoring curve. The full load curve (FLC) is carried out by applying 100% load while increasing the engine speed to the maximum rated speed. The usual rate to reach maximum engine speed is 8 [1/min] per second, but at the Vecto tool, the recommended rate is 2 [1/min] per second. The full load curve is the dataset mainly used to confirm and map an engine’s profile. The fuel mapping cycle is derived from the full load curve data and represents the engine’s fuel consumption rate and exhaust emissions under different engine loads and speeds.

Figure 2.
Engine dynamometer test cell.
The fuel mapping cycle predicts the engine’s performance under real-world driving conditions. The motoring curve is also derived from the full load curve data and represents the engine’s frictional losses and mechanical efficiency under different engine speeds and loads. The motoring curve is used to determine the engine’s brake-specific fuel consumption (BSFC), which is a measure of the engine’s fuel efficiency.
2.3.2. Vecto Engine Evaluation
The Vecto engine tool is used to evaluate the engine’s performance under a range of driving conditions, including urban, suburban, and long-haul routes. The tool calculates the engine’s fuel consumption and CO2 emissions based on the fuel mapping cycle and motoring curve data, and full load curve. The applied input data can be seen in Figure 3.
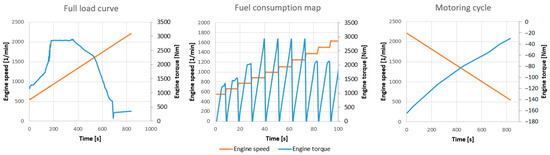
Figure 3.
Input data for Vecto engine.
2.3.3. Vecto Vehicle Evaluation
The Vecto vehicle is used to evaluate the performance of the entire heavy-duty truck, with a “bottom-up” approach that includes the engine, transmission, and driveline components. The tool simulates the truck’s operation under a range of driving conditions and calculates the vehicle’s fuel consumption and CO2 emissions. The Vecto tool has been developed by TU Graz [24] to establish a deterministic certification process for heavy-duty trucks. Since 2019 this tool has been mandatory for type approval in the EU. The interface of the simulation tool is displayed in Figure 4.

Figure 4.
Vecto vehicle simulation software interface.
Several measured data are needed to conduct a full-scale simulation to extrapolate to standardized driving cycles such as long-haul, regional delivery, and urban delivery. In this simulation, only the long hauling cycles will be calculated as it is the most likely to stay important for ICE as well. Other than the engine data, the rest is in accordance with the JRC TTW analysis and referred to as generic data [25].
3. Results
3.1. Result Overview
The CONCAWE, the EUCAR, and the European Commission have developed an official Well-to-Wheel methodology to assess the energy consumption and the greenhouse gas emissions of various fuels used in the transportation sector. This WTW methodology uses a set of equations to calculate total energy expended and GHG emissions associated with a certain fuel type. The equations consider factors such as energy inputs during fuel production, energy losses during fuel distribution, energy consumption, and emissions during vehicle operations. The measured TTW results will be integrated into the JEC study [24] by applying this methodology.
The below Equations (1) and (2) were used to integrate the WTT and TTW results.
Based on that, the results are formulated in Table 4.
Table 4.
WTW summary table. Data source: JEC WTW study [25] and calculated results.
Table 4.
WTW summary table. Data source: JEC WTW study [25] and calculated results.
| Fuel | WTW Summary | |||
|---|---|---|---|---|
| Type | Description | Code | Total Energy | Total GHG Emissions |
| Diesel | Typical EU supply | COD1 | 88.60 | 118.63 |
| Diesel | Typical EU supply, with CCS | COD1C | 92.85 | 115.02 |
| Electricity | EU-mix 2013 | EMEL1a | 77.65 | 44.64 |
| Electricity | EU-mix 2030 - best case | EMEL1b | 52.32 | 30.22 |
| Hydrogen | Natural gas based production | GMCH1 | 55.04 | 63.79 |
| Hydrogen | Production via methane cracking | GPCH4b2 | 21.47 | 17.92 |
| Biodiesel | Rapeseed based biodiesel | ROFA1 | 81.07 | 89.36 |
| Biodiesel | Waste cooking oil based biodiesel | WOFA3 | 13.63 | 60.15 |
WTWe = Total Well-to-Wheel energy used ; TTWe100km = Tank-to-Wheel energy used covering 100 km distance ; λ = variable for fossil fuel (λ = 1) and for renewable fuel (λ = 0) [−]; WTTe = Well-to-tank total expended energy
WTWGHG = Total Well-to-Wheel GHG emission ; TTWGHG = Tank-to-Wheel GHG emissions, covering 1 km distance ; TTWe = Tank-to-Wheel energy used covering 100 km distance ; WTTGHG = Well-to-tank GHG emissions over 1 MJ fuel consumption .
3.2. Common Diesel Fuel—ICE
For diesel, two different supply types were compared: typical EU supply and typical EU supply with carbon capture and storage (CCS). The WTW analysis shows that the addition of CCS reduces GHG emissions from diesel by about 4% but increases its energy use by about 5%. This suggests that while CCS may be effective at reducing GHG emissions, it comes at the cost of increased energy consumption, as is seen in Figure 5.
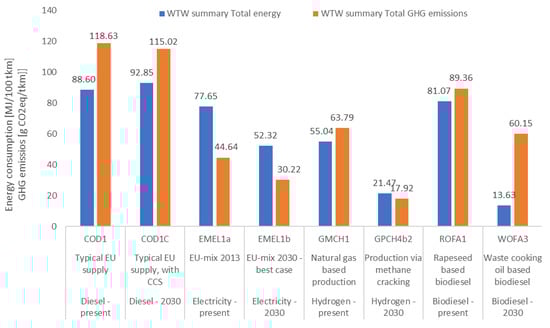
Figure 5.
WTW result chart.
3.3. Electricity—BEV
The WTW analysis shows that the best-case EU-mix 2030 results in a significant reduction in both energy use and GHG emissions compared to the current EU-mix 2013.
EMEL1a represents EU-mix electricity in 2013, while EMEL1b represents the best-case scenario for EU-mix electricity in 2030. The table shows that the total energy content of EMEL1b is significantly lower than that of EMEL1a, indicating that there will be a shift towards more efficient and less carbon-intensive electricity generation technologies by 2030. Additionally, the total GHG emissions of EMEL1b are also lower than those of EMEL1a, indicating that the best-case scenario for 2030 will significantly reduce GHG emissions from the electricity sector. The difference in GHG emissions between the two types of electricity is around 46.2%. This suggests that improvements in the generation and distribution of electricity could lead to significant environmental benefits in the transportation sector and pull more users towards BEV. The only question will be the battery’s energy density, whether it can reach a point where it is sufficient for long hauling distances or not.
3.4. Hydrogen—FCEV
The methane cracking method results in significantly lower energy use and GHG emissions than the natural gas-based method. GMCH1 represents the natural gas-based production of hydrogen, while GPCH4b2 represents the production of hydrogen via methane cracking. The table shows that the total energy content of GMCH1 is higher than that of GPCH4b2, indicating that the natural gas-based production process is more energy-intensive. However, the total GHG emissions of GMCH1 are also higher than those of GPCH4b2, indicating that the methane cracking process is less carbon intensive. The difference in GHG emissions between the two types of hydrogen is around 71.4%. This suggests that if hydrogen is to be used as a fuel in the transportation sector, it may be preferable to produce it via methane cracking. The commercial readiness is low for all production methods compared to other fuels. However, in theory, this could be the future propulsion, as for now, it is very far from high-volume commercial usage.
3.5. Biodiesel—ICE
Regarding biodiesel, two different feedstocks: rapeseed and waste cooking oil, were assessed. ROFA1 represents rapeseed-based biodiesel, while WOFA3 represents waste cooking oil-based biodiesel. The table shows that the total expended energy of ROFA1 is significantly higher than WOFA3, indicating that the rapeseed-based production process is more energy-intensive. However, the total GHG emissions of ROFA1 are also significantly higher than those of WOFA3, indicating that waste cooking oil-based biodiesel has a much lower carbon footprint. The difference in GHG emissions between the two types of biodiesel is around 83.6%. The analysis shows that waste cooking oil-based biodiesel produces significantly lower energy use than rapeseed-based biodiesel but higher GHG emissions. This suggests that the choice of feedstock has important implications for the environmental performance of biodiesel.
4. Discussion
The study has been divided into the current technology level and an estimation for 2030. It was a necessary addition because the transportation industry is going through a major development, therefore, stating only the current outcome isn’t enough for making long-term decisions. Implementing the latest Euro VI-d engine showed how the ICE technology has progressed since the latest JEC report in 2020 [25] and how new vehicles’ (TTW) GHG emissions can be calculated and integrated with different fuel types. It is apparent that even with the EU energy mix, the BEV propulsions are currently the lowest GHG emitters; despite that, the low energy density of batteries does not make them sufficient for long-hauling routes. Closely following the hydrogen-based FCEV, commercial readiness is far from desirable, although it may be a perfect candidate in the future if the infrastructure is viable for commercial purposes. It is important to add that in 2030, the FCEVs could be the lowest GHG emitters if methane-cracking hydrogen production becomes a viable solution. The last two candidates are the bio and common diesel-powered ICE trucks. The WTT alters between these two; the biodiesel waste cooking oil variant is the best choice by merely looking at the numbers. Although quantity and quality-wise, it may not be the best solution, as the impact on the ICE exhaust after-treatment component isn’t negligible [26]. It is important to emphasize that the European Union won’t ban heavy-duty ICE vehicles even after 2035, probably because there isn’t any scientifically viable substitution. Observing Figure 6. It is visible that future (~2030) fuel production technology in the case of renewable fuels will considerably cut greenhouse gas emissions. Regarding non-renewable diesel fuels, a slight decrease is possible in the coming years. Between JEC and this study’s measurement, there isn’t much of a difference; a ~2% GHG cut can be seen. It is due to the latest Euro VI-d compliant test engine used in this study, while the JEC study was published in 2020 with a less advanced test unit.
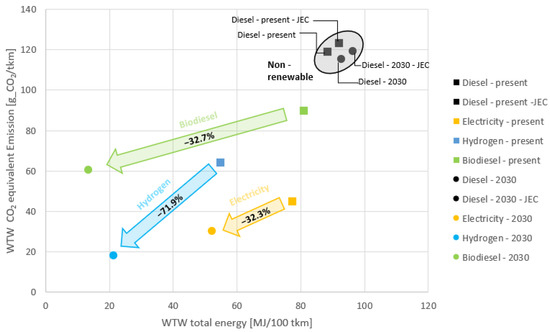
Figure 6.
WTW fuel technology based GHG change over 7 years.
Companies, municipal areas, and other legal entities are struggling with setting out sustainable, cost-effective, and future-proof plans for transportation means. This isn’t a simple question to answer regarding a choice between propulsion technologies. Electricity seems the easy way, but by evaluating the environmental impact of electricity production in different countries, it’s important to take into account the specific mix of energy sources that each country relies on. In Germany, for example, coal is still a major source of electricity production (40% fossil energy carriers), while in Sweden, nuclear and renewable energy sources such as hydropower and wind power are dominant (77% of energy production is GHG-free) [27]. As a result, the carbon footprint of electricity production in Germany is likely to be much higher than in Sweden. That is why it is important to conduct such an analysis by the stakeholders, like in this paper, to make scientifically supported decisions.
It is worth knowing that while this study involves the production emission of fuel, vehicle production emissions are not included. That would require a life cycle analysis (LCA), a cradle-to-grave approach with a much more complex calculation method. The paper concentrates on a fleet management viewpoint, which is not directly affected by production emissions. Moreover, in this paper, only the ICE propulsion with conventional diesel fuel has been evaluated empirically. This exclusion is due to limitations on research facilities which are rarely equipped with test cells that are enabled for FCEV and BEV applications. Furthermore the official EU Vecto tool lacks the capabilities to simulate the above-mentioned alternative propulsions. It would be an important addition because alternative propulsions are also subject to efficiency loss in terms of TTW, although much less than their ICE counterparts. This indicates that on-road, laboratory, and simulation tool development [28,29] and synergy are also essential goals to pursue for more accurate emission quantification methods.
Author Contributions
Conceptualization, N.B.; methodology, N.B.; formal analysis, N.B.; writ-ing—original draft preparation, N.B.; review and editing, P.K. All authors have read and agreed to the published version of the manuscript.
Funding
This research received no external funding.
Institutional Review Board Statement
Not applicable.
Informed Consent Statement
Not applicable.
Data Availability Statement
The data presented in this study are available on request from the corresponding author. The data are not publicly available due to the research data can aid com-petitors of the company where the experiments were carried out.
Acknowledgments
Many thanks to Ysabella Manlangit for thorough language proofreading.
Conflicts of Interest
The authors declare no conflict of interest.
Abbreviations
| GHG | greenhouse gases |
| ICE | internal combustion engine |
| FCEV | fuel cell electric vehicle |
| BEV | battery electric vehicle |
| ZEV | zero emission vehicle |
| WTT | well-to-tank |
| TTW | tank-to-wheel |
| WTW | well-to-wheel |
| LCA | life cycle analysis |
| IPCC | intergovernmental panel on climate change |
| GWP | global warming potential |
| JRC | joint research center |
| JEC | merged denomination of JRC, EUCAR and CONCAWE |
| CONCAWE | European association for environment, health and safety in refining and distribution |
| EUCAR | European council for automotive research and development |
| CCS | carbon capture and storage |
| E MIX | electricity production mix |
| IEA | international energy agency |
| VECTO | vehicle energy consumption calculation tool |
| CO2 EQ | carbon dioxide equivalent |
References
- Eurostat. Available online: https://ec.europa.eu/eurostat/statistics-explained/index.php?title=Quarterly_greenhouse_gas_emissions_in_the_EU (accessed on 19 March 2023).
- Ernst & Young. Available online: https://www.ey.com/hu_hu/news/2023/01/4-even-beluel-atveszik-a-vezetest-az-elektromos-jarmvek-europaba (accessed on 12 March 2023).
- Eurostat. Available online: https://ec.europa.eu/eurostat/statistics-explained/index.php?title=Passenger_mobility_statistics#Distance_covered (accessed on 19 March 2023).
- Prussi, M.; Yugo, M.; De Prada, L.; Padella, M.; Edwards, R. JEC Well-to-Wheels Report v5; EUR 30284 EN; Publications Office of the European Union: Luxembourg, 2020; Available online: https://publications.jrc.ec.europa.eu/repository/handle/JRC121213 (accessed on 10 March 2023).
- Williamson, S.S.; Emadi, A. Comparative Assessment of Hybrid Electric and Fuel Cell Vehicles Based on Comprehensive Well-to-Wheels Efficiency Analysis. IEEE Trans. Veh. Technol. 2005, 54, 856–862. Available online: https://ieeexplore.ieee.org/document/1433231 (accessed on 15 March 2023). [CrossRef]
- Offer, G.J.; Howey, D.; Contestabile, M.; Clague, R.; Brandon, N.P. Comparative Analysis of Battery Electric, Hydrogen Fuel Cell and Hybrid Vehicles in a Future Sustainable Road Transport System. Energy Policy 2010, 38, 24–29. Available online: https://www.sciencedirect.com/science/article/abs/pii/S0301421509006260?via%3Dihub (accessed on 22 March 2023). [CrossRef]
- Campanari, S.; Manzolini, G.; de la Iglesia, F.G. Energy analysis of electric vehicles using batteries or fuel cells through well-to-wheel driving cycle simulations. J. Power Sources 2009, 186, 464–477. Available online: https://www.sciencedirect.com/science/article/abs/pii/S0378775308018934?via%3Dihub (accessed on 22 March 2023). [CrossRef]
- Wang, Q.; Xue, M.; Lin, B.; Lei, Z.; Zhang, Z. Well-to-Wheel Analysis of Energy Consumption, Greenhouse Gas and Air Pollutants Emissions of Hydrogen Fuel Cell Vehicle in China. J. Clean. Prod. 2020, 275, 123061. Available online: https://www.sciencedirect.com/science/article/pii/S0959652620331061 (accessed on 28 March 2023). [CrossRef]
- Intergovernmental Panel on Climate Change (IPCC). Available online: https://www.ipcc.ch/report/ar6/wg3/downloads/report/IPCC_AR6_WGIII_FullReport.pdf (accessed on 12 March 2023).
- UN Climate Change (UNFCCC). Available online: https://unfccc.int/sites/default/files/english_paris_agreement.pdf (accessed on 12 March 2023).
- Gao, Y.; Gao, X.; Zhang, X. The 2 °C Global Temperature Target and the Evolution of the Long-Term Goal of Addressing Climate Change—From the United Nations Framework Convention on Climate Change to the Paris Agreement. Engineering 2017, 3, 272–278. Available online: https://www.sciencedirect.com/science/article/pii/S2095809917303077 (accessed on 27 March 2023). [CrossRef]
- European Comission. Available online: https://climate.ec.europa.eu/system/files/2021-11/policy_strategies_progress_com_2021_960_en.pdf (accessed on 19 March 2023).
- European Comission. Available online: https://climate.ec.europa.eu/eu-action/climate-strategies-targets/2050-long-term-strategy_en (accessed on 19 March 2023).
- Intergovernmental Panel on Climate Change (IPCC). Available online: https://archive.ipcc.ch/publications_and_data/ar4/wg1/en/ch2s2-10-2.html (accessed on 10 March 2023).
- Science Museum Group. Available online: https://www.sciencemuseumgroup.org.uk/blog/carbon-dioxide-catcher-unveiled-in-japan/ (accessed on 3 March 2023).
- Ritchie, H.; Rosado, P.; Roser, M. Meat and Dairy Production. OurWorldInData. 2017. Available online: https://ourworldindata.org/meat-production (accessed on 25 March 2023).
- Norwegian University of Science and Technology. Available online: https://norwegianscitechnews.com/2016/05/hva-er-det-egentlig-med-denne-nox-en/ (accessed on 10 March 2023).
- UN Climate Change (UNFCCC). Available online: https://unfccc.int/kyoto_protocol?gclid=EAIaIQobChMI8te5vp7o_QIV1tvVCh0VxgXQEAAYASAAEgL55fD_BwE (accessed on 10 March 2023).
- European Comission. Available online: https://climate.ec.europa.eu/eu-action/fluorinated-greenhouse-gases_en (accessed on 19 March 2023).
- Prussi, M.; Yugo, M.; De Prada, L.; Padella, M.; Edwards, R.; Lonza, L. JEC Well-to-Tank Report v5; EUR 30269 EN; Publications Office of the European Union: Luxembourg, 2020; Available online: https://publications.jrc.ec.europa.eu/repository/handle/JRC119036 (accessed on 22 March 2023).
- ARENA. Available online: https://arena.gov.au/assets/2014/02/Commercial-Readiness-Index.pdf (accessed on 12 March 2023).
- European Comission. Available online: https://climate.ec.europa.eu/system/files/2018-12/201811_background_en.pdf (accessed on 13 March 2023).
- EU Law (EUR-LEX). Available online: https://eur-lex.europa.eu/legal-content/EN/TXT/PDF/?uri=CELEX:32017R2400 (accessed on 10 March 2023).
- European Comission. Available online: https://climate.ec.europa.eu/eu-action/transport-emissions/road-transport-reducing-co2-emissions-vehicles/vehicle-energy-consumption-calculation-tool-vecto_en (accessed on 13 March 2023).
- Röck, M.; Martin, R.; Hausberger, S.; Hanarp, P.; Bersia, C.; Colombano, M.; Gräser, H.; Gomes Marques, G.; Mikaelsson, H.; De Prada, L.; et al. JEC Tank-to-Wheels Report v5: Heavy Duty Vehicles; EUR 30271 EN; Publications Office of the European Union: Luxembourg, 2020; Available online: https://publications.jrc.ec.europa.eu/repository/handle/JRC117564 (accessed on 26 March 2023).
- Louise, G.; Malmborg, V.B.; Falk, J.; Markula, L.; Novakovic, M.; Shamun, S.; Axel, C.E.; Thomas, B.K.; Svenningsson, B.; Tunér, M.; et al. Effects of Renewable Fuel and Exhaust Aftertreatment on Primary and Secondary Emissions from a Modern Heavy-Duty Diesel Engine. J. Aerosol Sci. 2021, 156, 105781. Available online: https://www.sciencedirect.com/science/article/pii/S0021850221005139 (accessed on 30 March 2023).
- Eurostat. Available online: https://ec.europa.eu/eurostat/web/products-eurostat-news/w/DDN-20230119-1 (accessed on 24 March 2023).
- Lakatos, I. An integrated analysis of processes concerning traffic and vehicle dynamics, development of laboratory applying real traffic scenarios. Int. J. Heavy Veh. Syst. 2018, 12. [Google Scholar]
- Lakatos, I. Diagnostic measurement for the effective performance of motor vehicles. Acta Polytech. Hung. 2013, 10, 239–249. [Google Scholar] [CrossRef]
Disclaimer/Publisher’s Note: The statements, opinions and data contained in all publications are solely those of the individual author(s) and contributor(s) and not of MDPI and/or the editor(s). MDPI and/or the editor(s) disclaim responsibility for any injury to people or property resulting from any ideas, methods, instructions or products referred to in the content. |
© 2023 by the authors. Licensee MDPI, Basel, Switzerland. This article is an open access article distributed under the terms and conditions of the Creative Commons Attribution (CC BY) license (https://creativecommons.org/licenses/by/4.0/).