Abstract
A new in-soil tensile test apparatus was developed to simulate the in-soil stress condition of geosynthetics in a real working state. An in-soil tensile test with or without friction was conducted, along with in-air tensile tests of eight types of geosynthetics, to evaluate tensile properties, including tensile load and secant tensile stiffness under different confining stresses using various methods. Under confinement, the tensile properties of geosynthetics increased with growing confinement, which were greater than those for the in-air tensile test, and the tensile properties were similar for tests with or without friction. The tensile load improvement factors FT−σ and fT−σ were introduced to quantify the confinement and reinforcement–soil friction differences between different tests, and the improvement ratios γ1 and γ2 were proposed to quantify the improvement of tensile load under confinement for the test with and without friction, respectively. Two formulas were proposed to predict the confined tensile properties of geosynthetics. The results showed that confinement was the major factor that improved the tensile properties of geosynthetics compared to reinforcement–soil friction. When the improvement ratio is not less than 1.5, the confined tensile load should replace the in-air tensile load with the tensile strength design of geosynthetics, which provides an insight into the design of reinforced soil structures.
1. Introduction
Through their engineering practices, geosynthetics-reinforced soil structures have benefits in engineering, economy and environment. At present, geosynthetics are used frequently in reinforced soil walls [1,2], reinforced slopes [3], reinforced embankments [4,5] and geosynthetic liner systems [6,7,8]. The engineering properties of geosynthetics, along with the filling and the reinforcement–soil interface (i.e., the geosynthetic–soil interface), have important influences on the mechanical behavior and stability of the reinforced soil structure.
Numerous tests have investigated the tensile load–strain properties of geosynthetics used in reinforced soil structures. Using the centrifuge model test and digital image analysis, Zornberg and Arriaga [9] proved that the maximum peak strain of the reinforcement occurs roughly at the mid-height position of the reinforced slopes. Won and Kim [10] performed the wide-width tensile test under 70 kPa confinement and found that the deformation range of nonwoven geotextile was larger than that of woven geotextile and geogrid. Viswanadham and Mahajan [11] found that a particular failure (i.e., catastrophic failure) of geotextile-reinforced slope depended on the tensile strength–strain characteristics of the geotextile-reinforced layer (i.e., rupture of reinforcement layers) through centrifuge model tests. After conducting centrifuge model tests, Viswanadham and König [12] concluded that the maximum strain of geosynthetics was concentrated at the bottom of the reinforced slope. Portelinha et al. [13] performed field monitoring of geotextiles-reinforced retaining walls and found that the nonwoven geotextile section had less strain than the woven geotextile section due to soil confinement. Ahmadi and Bezuijen [14] carried out the full-scale model tests on mechanically stabilized earth (MSE) walls, observing that the facing panel had an influence on lateral soil pressure, which affected the maximum tensile force of the reinforced layer facing panel. Plácido et al. [15] conducted a four-year field study of a geosynthetics-reinforced soil (GRS) wall and concluded that the confinement of vertical earth pressure had a distinct influence on the deformation of nonwoven geotextile. Djeffal and Belkacemi [16] reported that the reinforcement tension distribution of a reinforced slope was determined by the interaction coefficient of reinforcement–soil interaction by comparing the test results of the centrifuge model with the published field test results. The above-mentioned research results indicated that the tensile load–strain characteristics of geosynthetics used as reinforcement were affected by the confinement of soil. However, the tensile load–strain characteristics of geosynthetics were constantly measured by in-air wide-width tensile tests according to ASTM D4595 and D6637 [17,18], which did not reflect the force and deformation of geosynthetics in engineering sites. As the mechanical properties of geosynthetics without the confinement and friction of soil are significantly different from those under confinement, the test procedures suggested by ASTM D4595 and D6637 [17,18] are not stand-ins for the real tensile properties of geosynthetics and the reinforcement–soil interaction in the working state. Therefore, it was necessary to investigate the tensile properties of geosynthetics within soil to understand and predict geosynthetics deformation in reinforced soil structures.
There are two main types of tensile equipment for testing geosynthetics in soil. For the first type of device, the reinforcement–soil interaction occurs when the geosynthetics are subjected to tension. Kokkalis and Papacharisis [19] improved a large shear box apparatus to obtain the load–tensile properties of geotextiles under confinement, discovering that the elastic modulus of geotextiles increased with the confinement, and that the increase depended on the confinement. Balakrishnan and Viswanadham [20] found an increase of secant tensile stiffness of the geogrid under normal stress from soil using an in-soil tensile test of the geogrid, with the friction of the reinforcement–soil interface measured using a developed in-soil tensile setup in soil. A stiffness improvement factor was introduced to quantify the improvement of secant tensile stiffness. For the second type of device, the reinforcement–soil interaction is not considered when the geosynthetics are subjected to tension. The influence of reinforcement–soil interactions can be removed in two ways: in one method, geosynthetics and soil are stretched simultaneously so that the geosynthetics show concurrent deformation with the soil. Boyle et al. [21] performed in-soil tensile tests of both woven and nonwoven geotextiles with simultaneous horizontal deformation of soil, finding that the nonwoven geotextiles were affected by confinement while woven geotextiles were not affected. Portelinha et al. [22] developed a test device that could conduct the tensile test of geosynthetics under confinement to simulate the load–strain performance of geosynthetics in mechanically stabilized earth (MSE) walls. The other way to prevent friction of the reinforcement–soil interface is to isolate the geosynthetics from the soil using wooden blocks or membrane, which ensures the geosynthetics are only affected by confinement. An in-membrane test with friction under the confinement of a rubber membrane was carried out by Ling et al. [23], showing that the tensile stiffness and strength of geotextiles increased under confinement. Mendes et al. [24] conducted a tensile test without friction using a new in-soil tensile test apparatus. The geotextile was confined by the lubricated wooden blocks and sand to minimize the friction of the reinforcement–soil interface. The above-mentioned test results showed that the tensile stiffness and strength of geotextiles increased under confinement of soil compared to the unconfined conditions of the in-soil tensile test. Therefore, the tensile properties of geosynthetics should be tested in soil to simulate the confinement of actual engineering rather than only in air.
To reflect the tensile property of geosynthetics under confinement, a new multifunctional in-soil tensile test apparatus was developed and successfully used in the tensile tests; this apparatus is presented in this paper. Compared to the previous test apparatus, the flexible surcharge loading arrangement (using an air bag) was selected in the new test apparatus to ensure that soil dilatancy was not suppressed. The uniform and bilateral confining stresses were applied, eliminating the interaction between clamp and soil, ensuring that the sleeve moved simultaneously with the clamp and could safely achieve the necessary tests, including the in-soil tensile test, the in-air tensile test, the pullout test, the unilateral tensile test and the bilateral tensile test. The improvement on the tensile load and secant tensile stiffness of eight types of geosynthetics under the influence of different confinements (including different confining stresses and different confining methods) on the tensile properties of geosynthetics using the new in-soil tensile test apparatus was studied. The tensile load under confinement and in air with the elongation of geosynthetics were obtained by the tests.
2. Experiments of Geosynthetics
2.1. Overview of Test Apparatus
The new in-soil tensile test apparatus in this study was developed to simulate the real working state of geosynthetics and measure the in-soil tensile load of geosynthetics under different confinements. The apparatus consisted of a rigid test box containing the soil and geosynthetic specimen, loading clamps, movable sleeves, support frames, a flexible normal surcharging system (using air bag), displacement control and data acquisition system. The schematic diagram of the in-soil tensile test apparatus is shown in Figure 1, and the photograph is shown in Figure 2.
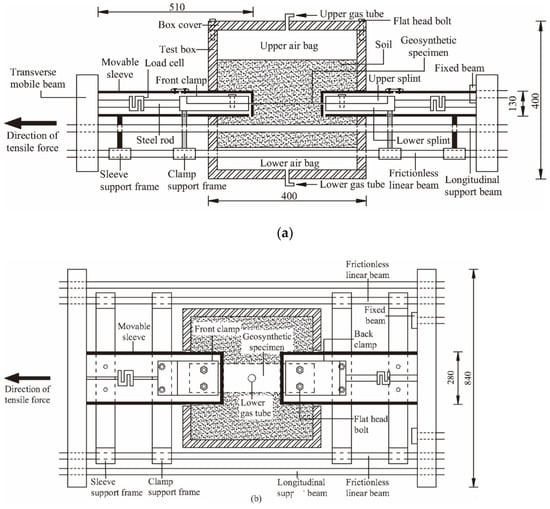
Figure 1.
Schematic diagram of the in-soil tensile test apparatus (unit: mm): (a) cross-sectional view; (b) top view.
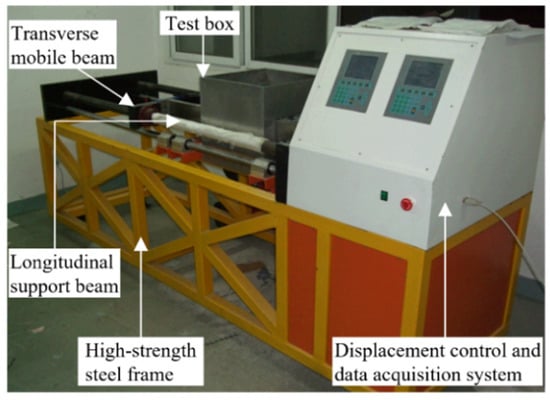
Figure 2.
Photograph of in-soil tensile test apparatus.
The dimensions of the test box were 400 mm × 400 mm × 400 mm (length × width × depth), containing the soil and providing an in-soil environment to the in-soil geosynthetics tests. Two separate pressurized air bags were used on the upper and lower parts of the test box to apply uniform confining stress to the upper and lower soil. The upper air bag was connected to a box cover. Air pressure was exerted by an air compressor in the laboratory. The air bags were anchored to the top of the test box using flat-head bolts. The air bag inflated by the upper and lower gas tubes could apply confining pressures as high as 200 kPa. The maximum pulling force of the test apparatus was 100 kN, moving at a displacement rate of 0.01–100 mm/min and with an elongation resolution of 0.001 mm. The upper or lower splint with interior groove of each loading clamp was manufactured from steel plates, bolted together by flat-head bolts rigidly gripping the geosynthetic specimen. A rigid movable sleeve with dimensions of 510 mm × 280 mm × 130 mm (indicating length × width × depth) was used to contain the clamp attached to the load cell. To make the sleeve move with the clamp simultaneously, the sleeve support frames maintaining a horizontal displacement were applied to support the sleeve.
The sleeve, in most studies, was fixed on the front wall of the test box, so the effect of its weight was eliminated. The clamp moving through the sleeve had relative displacement with the existing apparatus [25,26,27], which created interaction between the clamp and sleeve that caused inaccurate measurement of the tensile load of geosynthetics. The technical characteristics of the new in-soil tensile test apparatus in this study can be summarized as follows: compared to the previous test apparatus, the tensile load of the specimen was accurately measured by setting the sleeve outside the clamp and moving it simultaneously with the clamp. The new in-soil tensile test apparatus can simulate the real working state of geosynthetics and apply uniform confining stress to the upper and lower soil in the test box. The new apparatus can safely perform various tests, including the in-soil tensile test, the in-air tensile test, the pullout test, the unilateral tensile test and the bilateral tensile test.
2.2. Test Program and Procedures
Geosynthetic experiments were conducted to study the tensile properties of eight types of geosynthetics under different confinements and validate the performance of the test apparatus. The properties of sand are shown in Table 1. The properties of eight different geosynthetics are listed in Table 2. The effective size of the geosynthetic specimen under tension was 200 mm × 200 mm (length × width) according to ASTM D4595 (2011). According to the symmetry in the physical and mechanical properties of the geosynthetic [28,29], the middle line as an axis of symmetry in it was the fixed end of the geosynthetic, while the other end of the geosynthetic was stretched.

Table 1.
Properties of sand.

Table 2.
Properties of different geosynthetics.
The tensile test was mainly used to test the physical properties of the geosynthetics themselves. To prepare the in-soil tensile test with friction, the sand initially filled the bottom of the test box until it reached the bottom of the movable sleeves. After the predetermined spacing between the front and the back clamp was adjusted and determined, the geosynthetic specimen of dimensions 400 mm × 200 mm (length × width) was laid down, and both ends of 100 mm for the geosynthetic were gripped by the clamp. The fixed beam was installed to fix the back clamp for performing the unilateral tensile test. The upper half of the test box was then filled with soil up to 20 mm from the upper opening of the test box. Then, the rigid box cover, in contact with the upper air bag, was placed at the top of the soil so that the air bag was applying confining stress. The initial confining stress was corrected and zeroed by operating the apparatus display screen, following which, the confining stress was set according to the test requirement. To start the test, the sleeve and clamp started to move at a displacement rate of 40 mm/min, and the displacement and load data were recorded 50 times per second. The test stopped when a total displacement of 20 mm was reached, or at the earliest rupture of the geosynthetic [20]. For the in-soil tensile test without friction, a geosynthetic specimen with upper and lower layers of Teflon membrane were simultaneously clamped into the front and black clamps. The in-air tensile test was conducted according to the wide-width tensile test from ASTM D4595 (2011), and the soil and air bags were not used. The shear force and cohesion of soil were not considered in the new in-soil tensile test apparatus when conducting the in-soil tensile test with or without friction and the in-air tensile test. The friction force related to the airbag pressure was also not considered in the in-soil tensile test. The function of the air bag is mainly to apply confining stress to geosynthetics.
A total of 128 tensile tests were conducted in this study. Each specimen was stretched under three different confinement conditions. For the unconfined condition (i.e., in air), there was no confining stress. For the confined condition with friction, four different levels of confining stress were used: 25 kPa, 50 kPa, 100 kPa and 150 kPa. For the confined condition without friction, three different levels of confining stress were used: 50 kPa, 100 kPa and 150 kPa. This design was created by considering the possible burial depth of geosynthetics in engineering applications and increasing the confining stress at a spacing of 50 kPa to facilitate the quantitative analysis of the test. The difference between the two types of in-soil tensile test was whether the interaction at the reinforcement–soil interface was eliminated by the Teflon membrane or not. The same number of parallel tests was carried out for each test. The details of tensile tests were listed in Table 3.

Table 3.
Details of tensile tests.
3. Results and Discussion
3.1. Effects of Confinement
The effect of confinement on the tensile properties of geosynthetics was evaluated by performing an in-air tensile test and in-soil tensile test with or without friction on eight types of geosynthetics under the confining stresses of σ = 0 kPa, 25 kPa, 50 kPa, 100 kPa and 150 kPa, respectively. Since the test results of eight types of geosynthetics had similar trends, this study chose to present the results of nonwoven #1, and the results of the other seven types of geosynthetics (i.e., nonwoven #2, nonwoven #3, woven, glass fiber geogrid, plastic geogrid, geomembrane and geonet) are shown in Figures S1–S7 of the Supplementary Materials.
Figure 3 shows the tensile test results for nonwoven geotextile #1 with the increase in the strain. Figure 3a shows the tensile load–strain curves at the strain from 0% to 20% in air and in soil (under confinement). The in-air tensile load–strain curve with a steady upward trend showed the smallest tensile load of 2.01 kN/m at 20% strain. The greatest tensile load of 15.56 kN/m at 20% strain occurred in the load–strain curve of the in-soil tensile test without friction under the confining stress of 150 kPa. The tensile load increased with the improvement of the confinement within a range of certain strains. The confined tensile load–strain curve grew more quickly before the approximate strain of 4%, but grew steadily after the 4% strain. The change in confined tensile load was similar in the tests with and without friction. Figure 3b shows the secant tensile stiffness–strain curves with the increase of the strain from 1% to 20%. The 1% strain was chosen according to [20]. The smallest secant tensile stiffness of 10.50 kN/m occurred in the in-air tensile test and the greatest secant tensile stiffness of 313.86 kN/m occurred in the in-soil tensile test without friction under the confining stress of 150 kPa. The confined secant tensile stiffness–strain curve decreased more quickly before the approximate strain of 4% compared to after the 4% strain. The geosynthetics under greater confinement had a greater secant tensile stiffness in the in-soil tensile test. The confined secant tensile stiffness for the test with friction was similar to the one without friction, but the former was slightly greater than the latter.
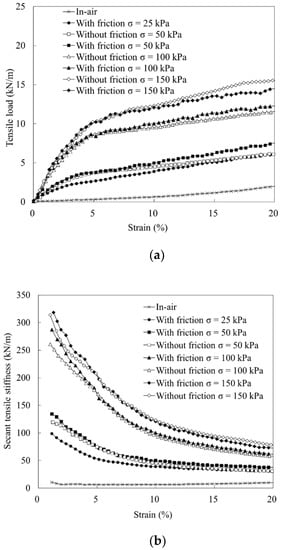
Figure 3.
Tensile test results of nonwoven #1: (a) tensile load–strain curves; (b) secant tensile stiffness–strain curves.
Figure 3 shows that the tensile load and secant tensile stiffness of the nonwoven geotextile under confinement (with or without friction) were significantly greater than that without confinement (representing the in-air test). It indicated that the conventional in-air tensile test cannot fully reflect the tensile properties of geosynthetics in soil, as similar results were observed by many researchers through various tensile tests [19,20,22,23,24]. However, the main influence factors (i.e., confinement or friction of the reinforcement–soil interface) on the tensile properties of geosynthetics under confinement were not discussed in their studies.
Figure 4 shows the tensile load of eight types of geosynthetics under different confining stresses at 2% strain. The tensile load at 2% strain was commonly used to study the properties of geosynthetics according to [22,24], showing that the tensile load with the friction of geosynthetics improved with the increase of the confining stress. For the glass fiber geogrid, the tensile load with friction was 17.77 kN/m in air, so the tensile load of 28.91 kN/m under the confining stress of 50 kPa was 62.69% higher than that in air. Under the confining stress of 100 kPa, the tensile load of 32.74 kN/m was 13.25% greater than that under the confining stress of 50 kPa. Figure 4b shows that the tensile load without friction from geosynthetics increased with the growth of the confining stress. Each geosynthetic had the greatest tensile load at the greatest confining stress of 150 kPa. Some researchers [20,23,24] have observed similar results to the findings presented in this paper. Whether the tensile tests were conducted with or without friction, the tensile load for each type of geosynthetic had the smallest value under no confining stress (representing the in-air test) and had the greatest value under the confining stress of 150 kPa. However, the tensile loads for the tests with and without friction are similar, indicating that the friction had little influence on the tensile properties of the geosynthetics. For the in-soil tensile test with friction, a greater tensile load and secant tensile stiffness of geosynthetics were found compared to that in the in-air tensile test, which was mainly due to the confinement and the interaction of reinforcement–soil interface. The geosynthetics deformed and had displacement relative to the soil particles after the application of the tensile force, so the interface friction between reinforcement and soil increased the tensile properties of geosynthetics. For the geogrid-type geosynthetics (i.e., glass fiber geogrid, plastic geogrid and geonet) under confinement, the passive resistance existed between geosynthetics and soil except for the friction, which restricted the ability of the geogrid for displacement that would improve its tensile load. Additionally, the confinement restricted the movement and necking of geosynthetics in soil and made soil particles penetrate into geosynthetics (i.e., nonwoven and woven geotextiles) that increased the friction of the reinforcement–soil interface, improving the tensile load and secant tensile stiffness of geosynthetics. For the in-soil tensile test without friction, the friction of the reinforcement–soil interface was eliminated, and the penetration of soil particles was restricted into geosynthetics by the frictionless Teflon membrane, so the greater tensile load and secant tensile stiffness of geosynthetics were mostly due to the confinement.
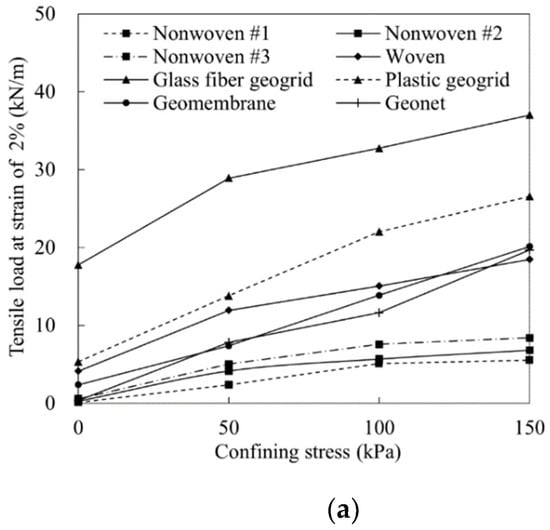
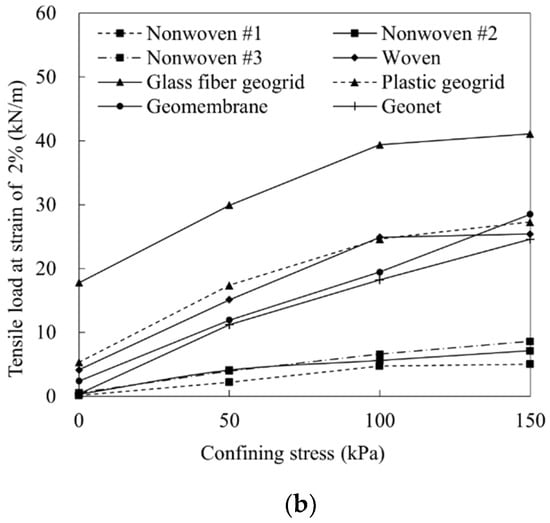
Figure 4.
Tensile load of eight types of geosynthetics under different confining stresses at 2% strain: (a) with friction; (b) without friction.
The tensile load improvement factors fT−σ and FT−σ were introduced to quantify the difference of tensile load between different tensile tests and gain the main influence factor of the two factors (confinement and friction) on the tensile properties of geosynthetics. The fT−σ in Equation (1) expresses the improvement of confined tensile load for the test with friction compared to the test without friction. The FT−σ in Equation (2) expresses the improvement of the confined tensile load compared to in-air tensile load for the test without friction:
where T1 is the confined tensile load with friction in kN/m, T2 is the confined tensile load without friction in kN/m, x is the in-air tensile load in kN/m and σ is confining stress in kPa.
The tensile load improvement factors fT−σ and FT−σ of different geosynthetics at 2% strain are listed in Table 4 and are based on Equations (1) and (2). The largest value of fT−σ, indicating the improvement of tensile properties induced by the friction of different geosynthetics under different confinements, was only 1.15. The value of FT−σ, indicating the improvement of tensile properties induced by confinement of different geosynthetics under different confinements, ranged from 1.72 to 71.53, and the variation was significantly greater than that caused by friction for fT−σ. The confinement had a large impact on the tensile properties of geosynthetics, while the friction of reinforcement–soil interface had less impact. This is because that the geosynthetics of the in-soil tensile test without friction still showed changes in mechanical properties and compression under confinement even though the friction and penetration of soil particles were eliminated by using the Teflon membrane. Therefore, the confinement was the major factor in improving the tensile properties of geosynthetics compared with the friction of the reinforcement–soil interface. It can be seen from the table that constraints have an insignificant effect on the tensile properties of the geogrid since the geogrid is constrained by having a small forced area and a small part, so there is little effect from confining stress; this depends on the physical properties of different materials. The influence of constraints on geosynthetics may also depend on the physical properties of different geosynthetics.

Table 4.
The tensile load improvement factor of different geosynthetics at 2% strain.
3.2. Product-Specific Secant Tensile Stiffness–Strain Relationships
The power relation in Equation (3), which describes the secant tensile stiffness varying with tensile strain, was put forward in [24] to predict the secant tensile stiffness of geotextile at different confining stresses. The corresponding fitting parameters a and b at different confining stresses were given. To predict the secant tensile stiffness using a common equation under different confinements σ and different tensile strains ε, Equation (4), derived from Equation (3), was proposed.
where J is the secant tensile stiffness in kN/m, ε is the tensile strain in %, σ is the confining stress in kPa and a, b and d are fitting coefficients.
Figure 5 shows nonlinear surface-fitting using Equation (4) for tests with the woven geotextile under different confinements and different tensile strains for the in-soil tensile test with and without friction. The nonlinear surface-fitting of the other seven types of geosynthetics are shown in Figures S7–S14 in the Supplementary Materials. The red sphere represents the test values, which were close to the fitting value of the colorful surface that represents the fitting confined secant tensile stiffness. A high-quality surface fitting can be seen, and the specific fitting coefficients of a, b and d were deduced to estimate secant tensile stiffness for the geosynthetics used in our tests. Table 5 shows the fitting functions and coefficient of determination R2 for every type of geosynthetics in the in-soil tensile test, both with and without friction, at a certain tensile strain. The R2 had a range from 0.902 to 0.991 for the in-soil tensile test with friction, and it varied from 0.924 to 0.992 for the in-soil tensile test without friction. Figure 6 revealed the comparison of confined secant tensile stiffness between the test value and calculated value from Equation (4) at 2% strain. The calculated value of confined secant tensile stiffness was closed to the test value, indicating the good fitting result of the equation and the good correlation between the calculated and test value.
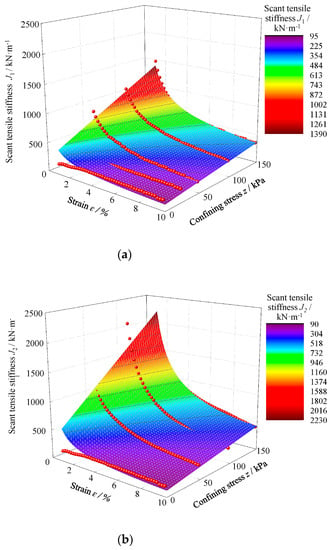
Figure 5.
Fitting results of secant tensile stiffness of woven geotextile under confinement: (a) with friction; (b) without friction.

Table 5.
Fitting functions and coefficient of determination (R2) for secant tensile stiffness J.
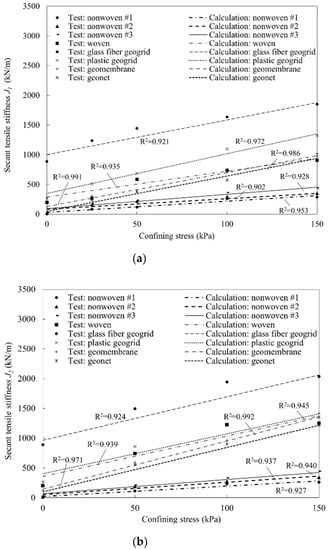
Figure 6.
Comparison of confined secant tensile stiffness between the test value and calculated value at 2% strain: (a) with friction; (b) without friction.
3.3. Product-Specific Tensile Load–Strain Relationships
To estimate the confined tensile load of geosynthetics conveniently when the in-air tensile load and confining stress were obtained, instead of measuring confined tensile load using the tensile test in soil, a mathematical representation of the relationship among three variates (i.e., confined tensile load, in-air tensile load and confining stress) was established. A binary linear regression analysis was conducted on confined tensile load, in-air tensile load and confining stress based on [30], then the width of specimen w (in m) was introduced, and the fitting coefficient e was given dimension in kN/m to bring uniform dimensions on both sides of the equals sign for mathematical representation, as shown in Equation (5).
where T is the confined tensile load with or without friction in kN/m, x is the in-air tensile load in kN/m, σ is the confining stress in kPa, w is the effective width of specimen in m and w = 0.2 m in this study, e is the fitting coefficient with dimension in kN/m and f and g are fitting coefficients without dimension.
Figure 7 shows the linear surface-fitting results between the confined tensile load and in-air tensile load using Equation (5) for tests with geomembrane under different confinements. The linear surface-fitting of the other seven types of geosynthetics are shown in Figures S15–S21 in the Supplementary Materials. The red sphere represents the test values, which were close to the fitting value of the colorful surface that represents the fitting confined tensile load. The fitting functions and coefficient of determination (R2) for the confined tensile load of the geosynthetics are listed in Table 6 at the strain rate of 40 mm/min. The R2 had a range from 0.814 to 0.953 for the in-soil tensile test with friction, and from 0.849 to 0.935 for the in-soil tensile test without friction. Figure 8 revealed the comparison of confined tensile load between the test value and calculated value from Equation (5) at 2% strain, indicating the good fitting result of the equation and the good correlation between the calculated value and test value. The tensile load showed an improvement under confinement compared to that without confinement (in-air). The confined tensile load gives a better estimation than the in-air tensile load for the tensile strength design of geosynthetics in reinforced soil structures.
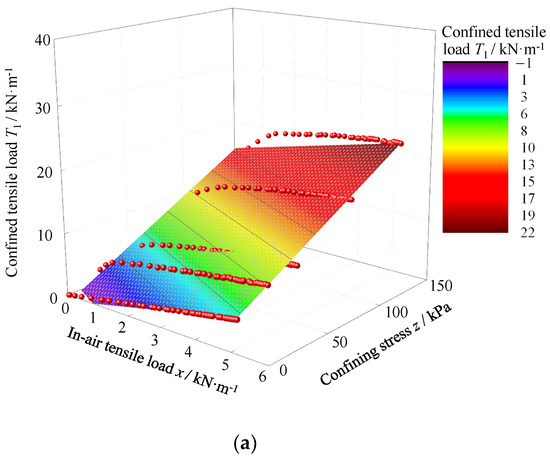
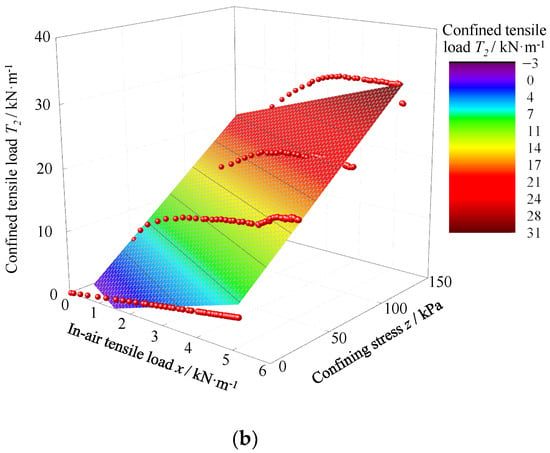
Figure 7.
Fitting results of confined tensile load of geomembrane: (a) with friction; (b) without friction.

Table 6.
Fitting functions and coefficient of determination (R2) for confined tensile load T.
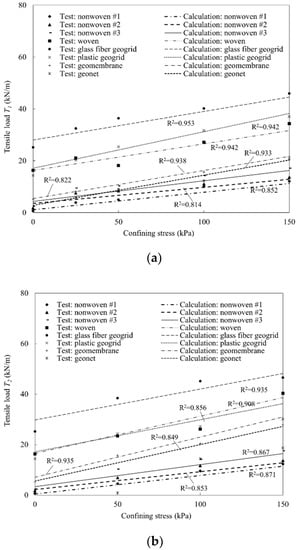
Figure 8.
Comparison of confined tensile load between the test value and calculated value at 2% strain: (a) with friction; (b) without friction.
To validate Equation (5), the results of existing in-soil tensile tests under different confining stresses were fitted using Equation (5), and the fitting results are listed in Table 7. In the study conducted by [20], the coefficient of determination R2 was 0.866. The fitting results reported by [24] had an R2 range from 0.774 to 0.820. The R2 in the study of [19] was 0.976, indicating the good fitting results and the applicability of the equation to these studies. The fitting results showed a good application of the proposed Equation (5), although the experimental conditions (i.e., strain rate, the properties of geosynthetics and soil) of these studies were different from those in this study.

Table 7.
Fitting results of existing in-soil tensile tests using Equation (5).
3.4. Quantization of Improvement on Tensile Properties
To quantify the improvement on tensile properties under confinement compared to that in air (without confinement), the dimensionless improvement ratios γ1 and γ2 were proposed as Equations (6) and (7), respectively. The γ1 in Equation (6) represents the improvement of confined tensile load with friction compared to in-air tensile load, and the γ2 in Equation (7) represents the improvement of confined tensile load without friction compared to in-air tensile load.
where γ1 is the improvement ratio of confined tensile load with friction compared to in-air tensile load, γ2 is the improvement ratio of confined tensile load without friction compared to in-air tensile load, T1 is the confined tensile load with friction in kN/m, T2 is the confined tensile load without friction in kN/m and x is the in-air tensile load in kN/m.
Figure 9 shows the improvement ratio γ1 (for the test with friction) and γ2 (for the test without friction) of geosynthetics at 2% strain as calculated by Equations (6) and (7). Figure 9a shows the improvement ratio γ1 increased with the increase in confining stress, indicating the confined tensile load with friction improved more compared to in-air tensile load under greater confining stress. The improvement ratios of tensile load for nonwoven geotextile #1 and geonet were far greater than 2.0. Figure 9b shows that the improvement ratio γ2 increased with the increase in confining stress, indicating the confined tensile load without friction improved more compared to in-air tensile load under greater confining stress. The nonwoven geotextiles and geonet still had greater improvement ratios γ2 compared to the other four types of geosynthetics.
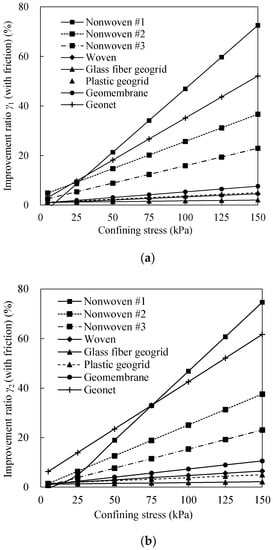
Figure 9.
Improvement ratio of confined tensile load for eight types of geosynthetics at 2% strain: (a) with friction; (b) without friction.
To prevent the conservative selection and dosage of reinforcement materials in the construction of reinforced soil structure and consider its safety, it is recommended that the tensile strength of reinforcement be designed using the confined tensile load. Firstly, the confined tensile load was calculated using the binary regression Equation (5) after obtaining the in-air tensile load from the in-air tensile tests. The fitting formula in Table 7 was used to obtain the increased ratio calculated by tensile strength in soil relative to air in reference [31], which was less than 50%. The increased ratio calculated by tensile strength in soil relative to air was expected to be at least greater than 50%, according to reference [32]. Therefore, if the improvement ratio calculated by Equations (6) and (7) is not less than 1.5, the in-air tensile load should be replaced by the calculated confined tensile load for the tensile strength design of geosynthetics in reinforced soil structures. If not, the in-air tensile load should still be used for the tensile strength design of geosynthetics while the calculated confined tensile load should be regarded as an alternative parameter, providing a new vision of reinforced design for reinforcement soil structures.
4. Conclusions
In this study, an in-soil tensile test with or without friction and in-air tensile test of eight types of geosynthetics were conducted using the new in-soil tensile test apparatus, and the improvements in the tensile properties of geosynthetics under different confinements were discussed. Several indicators were proposed for investigating the performances of the eight types of geosynthetics qualitatively. Tensile load improvement factors were introduced to quantify the difference in tensile load between different tensile tests and determine the main influencing factor between the two factors (confinement and friction) on the tensile properties of geosynthetics. A power relation of product-specific secant tensile stiffness–strain with the confining stress was proposed to predict the secant tensile stiffness by a given confining stress and tensile strain. A binary regression relation was proposed to predict the confined tensile load using a given confining stress and the in-air tensile load as measured by the in-air tensile test. An improvement ratio was introduced to quantify the improvement in tensile properties under confinement compared to that in air (without confinement).
The tensile load and secant tensile stiffness of geosynthetics showed an improvement under confinement compared to that in air and improved with an increase in confinement, which could be attributed to better interlocking of soil particles and more restraints of necking under confinement. The confinement was the major factor in improving the tensile properties of geosynthetics compared to the friction of the reinforcement–soil interface. According to the results of this study, the confined tensile load can be considered to perform the tensile strength reinforcement function to prevent selection and dosage of reinforcement materials that are too conservative in the construction of reinforced soil structure. When the improvement ratio is not less than 1.5, the confined tensile load should replace the in-air tensile load with the tensile strength design of geosynthetics; otherwise, the in-air tensile load should be still used while the confined tensile load should be regarded as an alternative parameter. This study provides a new vision of reinforcement design for reinforced soil structures.
Supplementary Materials
The following supporting information can be downloaded at: https://www.mdpi.com/article/10.3390/su15097376/s1. Figure S1. Tensile test results of nonwoven #2: (a) tensile load-strain curves; (b) secant tensile stiffness-strain curves; Figure S2. Tensile test results of nonwoven #3: (a) tensile load-strain curves; (b) secant tensile stiffness-strain curves; Figure S3. Tensile test results of woven: (a) tensile load-strain curves; (b) secant tensile stiffness-strain curves Figure S4. Tensile test results of glass fiber geogrid: (a) tensile load-strain curves; (b) secant tensile stiffness-strain curves; Figure S5. Tensile test results of plastic geogrid: (a) tensile load-strain curves; (b) secant tensile stiffness-strain curves; Figure S6. Tensile test results of geomembrane: (a) tensile load-strain curves; (b) secant tensile stiffness-strain curves; Figure S7. Tensile test results of geonet: (a) tensile load-strain curves; (b) secant tensile stiffness-strain curves; Figure S8. Fitting results of secant tensile stiffness of nonwoven #1 under confinement: (a) with friction; (b) without friction; Figure S9. Fitting results of secant tensile stiffness of nonwoven #2 under confinement: (a) with friction; (b) without friction; Figure S10. Fitting results of secant tensile stiffness of nonwoven #3 under confinement: (a) with friction; (b) without friction; Figure S11. Fitting results of secant tensile stiffness of glass fiber geogrid under confinement: (a) with friction; (b) without friction; Figure S12. Fitting results of secant tensile stiffness of plastic geogrid under confinement: (a) with friction; (b) without friction; Figure S13. Fitting results of secant tensile stiffness of geomembrane under confinement: (a) with friction; (b) without friction; Figure S14. Fitting results of secant tensile stiffness of geonet under confinement: (a) with friction; (b) without friction; Figure S15. Fitting results of confined tensile load of nonwoven #1: (a) with friction; (b) without friction; Figure S16. Fitting results of confined tensile load of nonwoven #2: (a) with friction; (b) without friction; Figure S17. Fitting results of confined tensile load of nonwoven #3: (a) with friction; (b) without friction; Figure S18. Fitting results of confined tensile load of woven: (a) with friction; (b) without friction; Figure S19. Fitting results of confined tensile load of glass fiber geogrid: (a) with friction; (b) without friction; Figure S20. Fitting results of confined tensile load of plastic geogrid: (a) with friction; (b) without friction; Figure S21. Fitting results of confined tensile load of geonet: (a) with friction; (b) without friction.
Author Contributions
Conceptualization and methodology, D.L. and D.W.; software and validation, Y.L. and D.L.; writing—original draft preparation, Y.L. and C.L.; writing—review and editing, Y.Y. (Yanxin Yang), C.L., Y.Y. (Yang Yi) and J.W.; supervision, D.W. and Y.Y. (Yanxin Yang). All authors have read and agreed to the published version of the manuscript.
Funding
This research was supported by the National Natural Science Foundation of China Grant (No. 42067044) and the Opening Project of Sichuan Province University Key Laboratory of Bridge Non-destruction Detecting and Engineering Computing (No. 2019OYJ01).
Institutional Review Board Statement
Not applicable.
Informed Consent Statement
Not applicable.
Data Availability Statement
Not applicable.
Conflicts of Interest
The authors declare no conflict of interest.
Nomenclature
| a | Fitting coefficient (dimensionless) |
| b | Fitting coefficient (dimensionless) |
| c | Cohesion (kPa) |
| Cc | Curvature coefficient (dimensionless) |
| Cu | Uniformity coefficient (dimensionless) |
| d | Fitting coefficient (dimensionless) |
| e | Fitting coefficient (kN/m) |
| ε | Tensile strain (%) |
| f | Fitting coefficient (dimensionless) |
| fT−σ | Tensile load improvement factor expressing the improvement of confined tensile load with friction compared to that without friction (dimensionless) |
| FT−σ | Tensile load improvement factor expressing the improvement of confined tensile load without friction compared to in-air tensile load (dimensionless) |
| g | Fitting coefficient (dimensionless) |
| J | Secant tensile stiffness (kN/m) |
| R2 | Coefficient of determination (dimension-less) |
| T | Confined tensile load with or without friction in (kN/m) |
| T1 | Confined tensile load with friction (kN/m) |
| T2 | Confined tensile load without friction (kN/m) |
| w | Effective width of specimen (m) |
| x | In-air tensile load (kN/m) |
| γ1 | Improvement ratio of confined tensile load with friction compared to in-air tensile load (dimensionless) |
| γ2 | Improvement ratio of confined tensile load without friction compared to in-air tensile load (dimension-less) |
| σ | Confining stress (kPa) |
| φ | Internal friction angle (°) |
References
- Zhang, W.; Chen, J.F.; Yu, Y. Influence of toe restraint conditions on performance of geosynthetic-reinforced soil retaining walls using centrifuge model tests. Geotext. Geomembr. 2019, 47, 653–661. [Google Scholar] [CrossRef]
- Yang, K.H.; Chiang, J.; Lai, C.W.; Han, J.; Lin, M.L. Performance of geosynthetic-reinforced soil foundations across a normal fault. Geotext. Geomembr. 2020, 48, 357–373. [Google Scholar] [CrossRef]
- Yang, K.H.; Nguyen, T.S.; Li, Y.H.; Leshchinsky, B. Performance and design of reinforced slopes considering regional hydrological conditions. Geosynth. Int. 2019, 26, 451–473. [Google Scholar] [CrossRef]
- Aqoub, K.; Mohamed, M.; Sheehan, T. Quantitative analysis of shallow unreinforced and reinforced piled embankments with different heights subject to cyclic loads: Experimental study. Soil Dyn. Earthq. Eng. 2020, 138, 106277. [Google Scholar] [CrossRef]
- Shen, P.; Xu, C.; Han, J. Geosynthetic-reinforced pile-supported embankment: Settlement in different pile conditions. Geosynth. Int. 2020, 27, 315–331. [Google Scholar] [CrossRef]
- Kavazanjian, J.E.; Wu, X.; Arab, M.; Matasovic, N. Development of a numerical model for performance-based design of geosynthetic liner systems. Geotext. Geomembr. 2018, 46, 166–182. [Google Scholar] [CrossRef]
- Kavazanjian, J.E.; Gutierrez, A. Large scale centrifuge test of a geomembrane-lined landfill subject to waste settlement and seismic loading. Waste Manag. 2017, 68, 252–262. [Google Scholar] [CrossRef]
- Zornberg, J.G.; Kavazanjian., J.E. Prediction of the performance of a geogrid-reinforced slope founded on solid waste. Soils Found. 2001, 41, 1–16. [Google Scholar] [CrossRef]
- Zornberg, J.G.; Arriaga, F. Strain Distribution within Geosynthetic-Reinforced Slopes. J. Geotech. Geoenviron. Eng. 2003, 129, 32–45. [Google Scholar] [CrossRef]
- Won, M.S.; Kim, Y.S. Internal deformation behavior of geosynthetic-reinforced soil walls. Geotext. Geomembr. 2007, 25, 10–22. [Google Scholar] [CrossRef]
- Viswanadham, B.V.S.; Mahajan, R.R. Centrifuge model tests on geotextile reinforced slopes. Geosynth. Int. 2007, 14, 365–379. [Google Scholar] [CrossRef]
- Viswanadham, B.V.S.; König, D. Centrifuge modeling of geotextile-reinforced slopes subjected to differential settlements. Geotext. Geomembr. 2009, 27, 77–88. [Google Scholar] [CrossRef]
- Portelinha, F.H.M.; Zornberg, J.G.; Pimentel, V. Field performance of retaining walls reinforced with woven and nonwoven geotextiles. Geosynth. Int. 2014, 21, 270–284. [Google Scholar] [CrossRef]
- Ahmadi, H.; Bezuijen, A. Full-scale mechanically stabilized earth (MSE) walls under strip footing load. Geotext. Geomembr. 2018, 46, 297–311. [Google Scholar] [CrossRef]
- Plácido, R.; Portelinha, F.H.M.; Futai, M.M. Field and laboratory time-dependent behaviors of geotextiles in reinforced soil walls. Geosynth. Int. 2018, 25, 215–229. [Google Scholar] [CrossRef]
- Djeffal, H.; Belkacemi, S. Effect of soil-reinforcement interaction coefficient on reinforcement tension distribution of reinforced slopes. Geotext. Geomembr. 2020, 48, 572–580. [Google Scholar] [CrossRef]
- ASTM D4595; Standard Test Method for Tensile Properties of Geotextiles by the Wide-Width Strip Method. ASTM International: West Conshohocken, PA, USA, 2014.
- ASTM D6637; Standard Test Method for Determining Tensile Properties of Geogrids by the Single or Multi-Rib Tensile Method. ASTM International: West Conshohocken, PA, USA, 2015.
- Kokkalis, A.; Papacharisis, N. A simple laboratory method to estimate the in soil behaviour of geotextiles. Geotext. Geomembr. 1989, 8, 147–157. [Google Scholar] [CrossRef]
- Balakrishnan, S.; Viswanadham, B.V.S. Evaluation of tensile load-strain characteristics of geogrids through in-soil tensile tests. Geotext. Geomembr. 2017, 45, 35–44. [Google Scholar] [CrossRef]
- Boyle, S.R.; Gallagher, M.; Holtz, R.D. Influence of strain rate, specimen length and confinement on measured geotextile properties. Geosynth. Int. 1996, 3, 205–225. [Google Scholar] [CrossRef]
- Portelinha, F.H.M.; Santos, M.C.; Futai, M.M. A laboratory device to evaluate geosynthetic load–strain behaviour in MSE walls. Geosynth. Int. 2021, 28, 32–47. [Google Scholar] [CrossRef]
- Ling, H.I.; Wu, J.T.H.; Tatsuoka, F. Short-term strength deformation characteristics of geotextiles under typical operational conditions. Geotext. Geomembr. 1992, 11, 185–219. [Google Scholar] [CrossRef]
- Mendes, M.J.A.; Palmeira, E.M.; Matheus, E. Some factors affecting the in-soil load–strain behaviour of virgin and damaged nonwoven geotextiles. Geosynth. Int. 2007, 14, 39–50. [Google Scholar] [CrossRef]
- Pant, A.; Datta, M.; Ramana, G.V.; Bansal, D. Measurement of Role of Transverse and Longitudinal Members on Pullout Resistance of PET Geogrid. Measurement 2019, 148, 106944. [Google Scholar] [CrossRef]
- Taghavi, S.H.S.; Mosallanezhad, M. Experimental analysis of large-scale pullout tests conducted on polyester anchored geogrid reinforcement systems. Can. Geotech. J. 2017, 54, 621–630. [Google Scholar] [CrossRef]
- Prasad, P.S.; Ramana, G.V. Imperial smelting furnace (zinc) slag as a structural fill in reinforced soil structures. Geotext. Geomembr. 2016, 44, 406–428. [Google Scholar] [CrossRef]
- Feng, S.; Xu, R.; Cheng, K.; Yu, J.; Jia, Q. Centrifuge Model Test on the Performance of Geogrid-Reinforced and Pile-Supported Embankment Over Soft Soil. Soil Mech. Found. Eng. 2020, 57, 244–251. [Google Scholar] [CrossRef]
- Zhang, J.; Liu, S.; Pu, H. Evaluation of an Improved Technique for Geosynthetic-Reinforced and Pile-Supported Embankment. Adv. Mater. Sci. Eng. 2015, 2015, 612760. [Google Scholar] [CrossRef]
- Wu, D.; Luo, C.; Li, D.; Xu, C. A Comparative Study between the In-soil and In-air Tensile Strength of Geosynthetics. J. Yangtze River Sci. Res. Inst. 2022, 39, 94–101. (In Chinese) [Google Scholar] [CrossRef]
- Xu, F.; Leng, W.M.; Nie, R.S.; Zhang, Q.; Yang, Q. New Structure for Strengthening Soil Embankments. Adv. Civ. Eng. 2018, 2018, 4809034. [Google Scholar] [CrossRef]
- Wu, L.J.; Liu, J.H. Development of A New Type of Hot Melt Integral Plastic Drain Plate. Adv. Sci. Technol. Water Resour. 2007, 27, 60–63. (In Chinese) [Google Scholar]
Disclaimer/Publisher’s Note: The statements, opinions and data contained in all publications are solely those of the individual author(s) and contributor(s) and not of MDPI and/or the editor(s). MDPI and/or the editor(s) disclaim responsibility for any injury to people or property resulting from any ideas, methods, instructions or products referred to in the content. |
© 2023 by the authors. Licensee MDPI, Basel, Switzerland. This article is an open access article distributed under the terms and conditions of the Creative Commons Attribution (CC BY) license (https://creativecommons.org/licenses/by/4.0/).