Article

Statistical and Mathematical Modeling for Predicting Caffeine Removal from Aqueous Media by Rice Husk-Derived Activated Carbon

by
Mehdi Bahrami
1,†,
Mohammad Javad Amiri
1,†,
Mohammad Reza Mahmoudi
2,* and
Anahita Zare
1
1
Department of Water Engineering, Faculty of Agriculture, Fasa University, Fasa 74616-86131, Iran
2
Department of Statistics, Faculty of Science, Fasa University, Fasa 74616-86131, Iran
*
Author to whom correspondence should be addressed.
These authors contributed equally to this work.
Sustainability 2023, 15(9), 7366; https://doi.org/10.3390/su15097366
Submission received: 9 March 2023 / Revised: 22 April 2023 / Accepted: 26 April 2023 / Published: 28 April 2023

Abstract

:
One of the solutions to deal with water crisis problems is using agricultural residue capabilities as low-cost and the most abundant adsorbents for the elimination of pollutants from aqueous media. This research assessed the potential of activated carbon obtained from rice husk (RHAC) to eliminate caffeine from aqueous media. For this, the impact of diverse parameters, including initial caffeine concentration (C0), RHAC dosage (Cs), contact time (t), and solution pH, was considered on adsorption capacity. The maximum caffeine uptake capacity of 239.67 mg/g was obtained under the optimum conditions at an RHAC dose of 0.5 g, solution pH of 6, contact time of 120 min, and initial concentration of 80 mg/L. The best fit of adsorption process data on pseudo-first-order kinetics and Freundlich isotherm indicated the presence of heterogeneous and varying pores of the RHAC, multilayer adsorption, and adsorption at local sites without any interaction. Additionally, modeling the adsorption by using statistical and mathematical models, including classification and regression tree (CART), multiple linear regression (MLR), random forest regression (RFR), Bayesian multiple linear regression (BMLR), lasso regression (LR), and ridge regression (RR), revealed the greater impact of C0 and Cs in predicting adsorption capacity. Moreover, the RFR model performs better than other models due to the highest determination coefficient (R2 = 0.9517) and the slightest error (RMSE = 2.28).

1. Introduction

The existence of organic materials, such as caffeine in aqueous media and their increasing concentration, has caused concern among researchers. Caffeine is an alkaloid that associates with the methyl xanthine class and is composed of carbon, hydrogen, nitrogen, and oxygen. Caffeine as a natural stimulant can be found in more than sixty plants, such as coffee beans, tea leaves, cocoa pods, and cola beans. It is a white powder with a bitter taste and odorless solvent in hot water, and it is toxic for most aquatic organisms [1,2]. Caffeine is detected in groundwater, surface water, and highly concentrated effluents (10 µg/L) [3]. Caffeine has been identified as emerging pollutant that is representative of human pollution and has been found in various water environments [4]. A variety of methods are available for caffeine removal from wastewater such as coagulation [5], biological treatment [6], ion exchange [7], electrochemical advanced oxidation process [8], and adsorption [9,10]. Adsorption is one of these techniques that is widely used to remove contaminants from the aquatic environment. Adsorption has become an effective phenomenon in removing biodegradable contaminants from aqueous media due to its simplicity and diversity of adsorbents [11]. Other advantages of the adsorption method are high efficiency, flexibility, simplicity of design, low cost, and easy performance, which make it superior to other techniques used [12]. Among the different adsorbents used to eliminate emergent contaminates from water, activated carbon is the most effective and widely used material due to its unique characterization [13,14,15,16,17,18]. The high adsorption capacity of activated carbon can be related to specific surface area, surface structure, distribution of pore size, and functional groups [19]. As commercial activated carbon is an expensive material, numerous studies have been performed on the agricultural waste-derived activated carbon [14,20]. In this regard, the successful performance of renewable and inexpensive agricultural residues such as fruit kernels, sugarcane, almond shells, rice husk, canola stalk, etc. have been reported [14,21,22,23,24].
One of the abundant and cheap sources of activated carbon production in Iran is rice husks [24]. Rice husk is insoluble in water due to its grain structure and has high chemical strength and mechanical durability [25]. Some researchers have studied the rice husk activated carbon for removal of pollutants from an aqueous medium, which includes the following studies: Ghosh et al. [26] used the rice husk and rice husk ash to adsorb chromium; Scapin et al. [27] minimized organic compounds in water using rice husk activated carbon; Danish [28] adsorbed caffeine from an aqueous solution by wood activated carbon; Elewa et al. [29] used the chemically activated carbon of rice husk to remove Mn (II) and Fe (III) from aqueous media.
As the relationship between pollutant removal and effective parameters is too complex, numerical [30] and artificial neural network [31] approaches are used to model the adsorption process. However, the convergence problems of numerical techniques due to poor initialization and the strong dependence on artificial neural network approaches to the input data and more requiring trial and error in the training stage are the main limitations and drawbacks of these methods for adsorption modeling. Hereupon, choosing an efficient method for simulating and evaluating the impact of each input parameter is critical. Therefore, mathematical models [10,32] have been proposed as machine learning methods for nonlinear data correlation of adsorption experiments. Beigzadeh et al. [32] simulated the rice husk biochar performance to remove 2,4-D from an aqueous media by random forest regression, BMLR, and MLR.
Data mining methods are a set of activities used to find new, hidden, and unexpected patterns [33]. The decision tree is one of the classification methods in data mining that summarizes the classification procedure by presenting a tree [34]. The classification and regression tree (CART) algorithm is a subset of the decision tree algorithm that can be used to study the effect of diverse operational parameters on the adsorption capacity. The mathematical approaches such as lasso regression (LR), random forest regression (RFR), ridge regression (RR), and Bayesian multiple linear regression (BMLR) are novel and powerful machine learning methods that can simulate the nonlinear problem of the adsorption process [35]. Additionally, multiple linear regression (MLR) describes the linear relationships successfully and can be employed to model the adsorption process [32].
Therefore, this research aimed to model and estimate the adsorption capacity (q) of rice-husk activated carbon in the elimination of caffeine from aqueous media under the influence of operating factors of temperature, contact time, adsorbent dose, initial caffeine concentration, and pH using CART, RFR, BMLR, MLR, LR, and RR methods.

2. Material and Methods

2.1. Preparation of the Adsorbent

Activation of carbon from rice husk consists of a two-step process that includes (1) pre-carbonation of rice husk and (2) activation of rice husk charcoal steam [18]. Rice husk was obtained from local rice, milled, and sizes between 425 and 600 microns (geometric mean particle diameter 510 microns) were selected. About 5 g of rice husk was dried in an oven and then spread on a quartz glass sample holder. To pyrolyze the rice husk, the sample was subjected to nitrogen gas in a tubular electric furnace for 60 min at 406 °C. The rice husk coal was cooled to room temperature under nitrogen gas, again placed in the furnace, and heated under nitrogen flow to a temperature of 900 °C. When the final activation temperature was reached, without the nitrogen flow being turned off, the rice husk coal was activated using steam generated by pumping deionized water into the furnace by an HPLC pump. The resulting tarry product was moved into the cooling section of the furnace and trapped in the primary and secondary gas washing bottles before being emptied into the environment. The prepared activated carbon was first washed with 0.1 M hydrochloric acid and then with deionized water. When the activated carbon was washed, it was placed in an oven at 105 °C for 12 h and then cooled to room temperature after being removed from the oven [18]. The characterization of RHAC was evaluated by the textural properties such as specific surface area, total pore volume, micropore volume, mesopore volume, and mean pore diameter according to Brunauer–Emmett–Teller (BET) analysis.

2.2. Batch Studies

Caffeine was supplied with analytical purity from Sigma Aldrich, Germany. Caffeine stock solution was prepared and diluted for different concentrations of pollutant. All adsorption tests were performed in a batch study to investigate the various parameters’ effect on adsorption capacity. The studied parameters included initial concentration of caffeine (C0, 20–120 mg L−1), RHAC dose (Cs, 0.1–1.25 g), contact time (t, 1–360 min), and solution pH (2–12). In this experiment, the uptake capacity of RHAC at equilibrium (qe, mg g−1) and at any time (qt, mg g−1) as well as the removal efficiency of caffeine (%R) were formulated as:
q e = C 0 C e m × V
q t = C 0 C t m × V
R ( % ) = C 0 C e C 0 × 100
where C0 and Ce are the initial and equilibrium caffeine concentration (mg L−1), Ct is the caffeine concentration at any time (mg L−1), m is the adsorbent mass (g), and V is caffeine solution volume (L).

2.3. Adsorption Isotherms and Adsorption Kinetics

The isotherms and kinetics of the sorption must be determined to utilize each adsorbent for remediation purposes. The prevalent isotherm models including Freundlich, Langmuir, and Redlich–Peterson (R-P) were employed to depict the equilibrium adsorption. The common kinetic equations of the pseudo-first-order (PFO), pseudo-second-order (PSO), Elovich, and fractional power (FP) models were employed to determine the temporal changes of caffeine adsorption on RHAC. The utilized mathematical models of isotherms and kinetics in this study are represented in Table 1.

2.4. Statistical and Mathematical Modeling of the Adsorption Process

In this study, the robustness of various statistical and mathematical models was evaluated for the expression of caffeine removal from aqueous solution using rice husk-activated carbon in batch experiments. Four operating parameters including initial caffeine concentration (C0), adsorbent dose (Cs), contact time (t), and solution pH were selected as the input data and the adsorption capacity (q) of RHAC as the output. To implement the different statistical and mathematical models, 31 experimental data series were employed to investigate the models, in which 80% of the data were randomly selected to train the model, and 20% were used to validate the model. A minimum-maximum normalization method was used to normalize the parameters before data entry into the models. The final results of different models were tested against of the measured adsorption capacity to evaluate the accuracy of each model according to the determination coefficient (R2) and the root mean square error (RMSE).
A classification and regression tree (CART) is a way to build predictive data models [36,37]. In this algorithm, a target attribute is specified in the data set. The algorithm starts from the root node, and then each node is divided into two nodes [38]. Tree growth will continue until there is any new condition to split the data.
Random forest regression employs an ensemble learning procedure, which merges several machine learning approaches such as decision trees, naive Bayes, neural network, and support vector machines. RF involves a bagging bootstrap aggregation approach that generates the various specimens by utilizing random sampling with replacement. This method runs every model alone and finally aggregates the results of all models without precedence for any of models [32].
In Bayesian multiple linear regression (BMLR), the data with additional information about β and σ 2 were supplemented. According to the Bayes theorem, this additional information is compounded with the information of data to generate the new information about β and σ 2 called posterior information. The prior is usually chosen based on the domain and the available previous information. In the present research, the dataset was split into two groups (for 1000 times): the first group was used to reach the prior information, and the second group was used as observations (experiments). The posterior regression coefficients were computed by:
b P o s = ( X E x p T X E x p + X P r T X P r ) 1 ( X E x p T Y E x p + X P r T Y P r ) ,
such that Pr, Exp, and Pos indices are related to the prior, the observed, and the posterior, respectively.
Multiple linear regression (MLR), as a popular data analysis approach to evaluate the influences of one or several quantitative predictors X1, X2, …, Xk on a quantitative response variable Y, is as follows:
Y i = β 0 + β 1 X 1 i + β 2 X 2 i + + β k X k i + ε i ,       for   n   observations   i = 1 ,     ,   n ,
where β 0 ,   β 1 , …, β k are the coefficients or the parameters of the MLR method and ε i ,   i = 1 ,     ,   n , are the error of the model. The observed dataset is used to calculate the unidentified parameters β0, β1, …, βk by:
Y ^ i = b 0 + b 1 X 1 i + b 2 X 2 i + + b k X k i ,
where b0, b1, , bk are the estimations for the unidentified parameters of the MLR model, and Y ^ i is the estimation for the actual value of Y i . The MLR formula is usually represented by:
Y = X β + ε ,
where Y = ( y 1 ,   ,   y n ) T ,   β = ( β 0 ,   ,   β k ) T and ε = ( ε 1 ,   ,   ε n ) T are the response, parameter, and error vectors, and X is the design whose the first column is the constant vector ( 1 ,   ,   1 ) T and the l t h ( 2   l   k + 1 ) column is the values of the ( l 1 ) t h predictor. Moreover, we can write Y ^ = X b , where Y ^ = ( y ^ 1 ,   ,   y ^ n ) T is the predicted vector, and b = ( b 0 ,   ,   b k ) T is the estimated vector of the coefficients. For the normal observations, the maximum likelihood (or ordinary least squares) estimator of the coefficient vector β is as:
b = ( X T X ) 1 X T Y .
It is a typical way to assume the sufficient measurements to express something significant about β.
In common multiple linear regression, if the predictor variables are highly correlated, multicollinearity can evolve into a problem. This may provoke the unreliability of the coefficient estimation and high variance. The least absolute shrinkage and selection operator (LASSO) is a penalized regression that conducts both variable assignment and regularization to improve the forecast precision and interpretability of the resultant statistical model. In this method, a penalty function of the regression coefficients is utilized in the multiple linear regression process, which leads to removing the ineffective predictor factors from the model:
Y = β 0 + β 1 X 1 + + β k X k + λ i = 1 k | β i | + ϵ
where λ is the regulating parameter, ϵ is the random error of the model (with mean zero and variance σ 2 ). One of the most significant advantages of using such penalized regressions is, unlike ordinary regression models, usability for conditions where the number of input variables is more than the number of observations (k > n).
Same as lasso regression, ridge regression is known as the regularization technique because both models attempt to minimize the sum of squared residuals (RSS) along with some penalty terms. In other words, they restrain or regularize the coefficient estimations of the model. Nevertheless, the penalty terms they utilize are a bit different:
Y = β 0 + β 1 X 1 + + β k X k + λ i = 1 k β i 2 + ϵ
In the ridge regression, each predictor coefficient is reduced towards zero but none of them can go totally to zero, while in lasso regression it is possible that some of the coefficients could go totally to zero when λ gets sufficiently large. Contrary to lasso regression, when multiple predictor variables are significant in the model and their coefficients are approximately equal, ridge regression tends to act better because it maintains all the predictors in the model. The degree of conformity of the observed and estimated data by the models was investigated using R2 and RMSE:
R M S E = i = 1 n ( q p q o ) 2 n
where qp and qo are the predicted and the observed adsorption capacities, respectively, and n is the number of measurements. The best model is a model where RMSE has the least amount, and R2 is closer to one.

3. Results

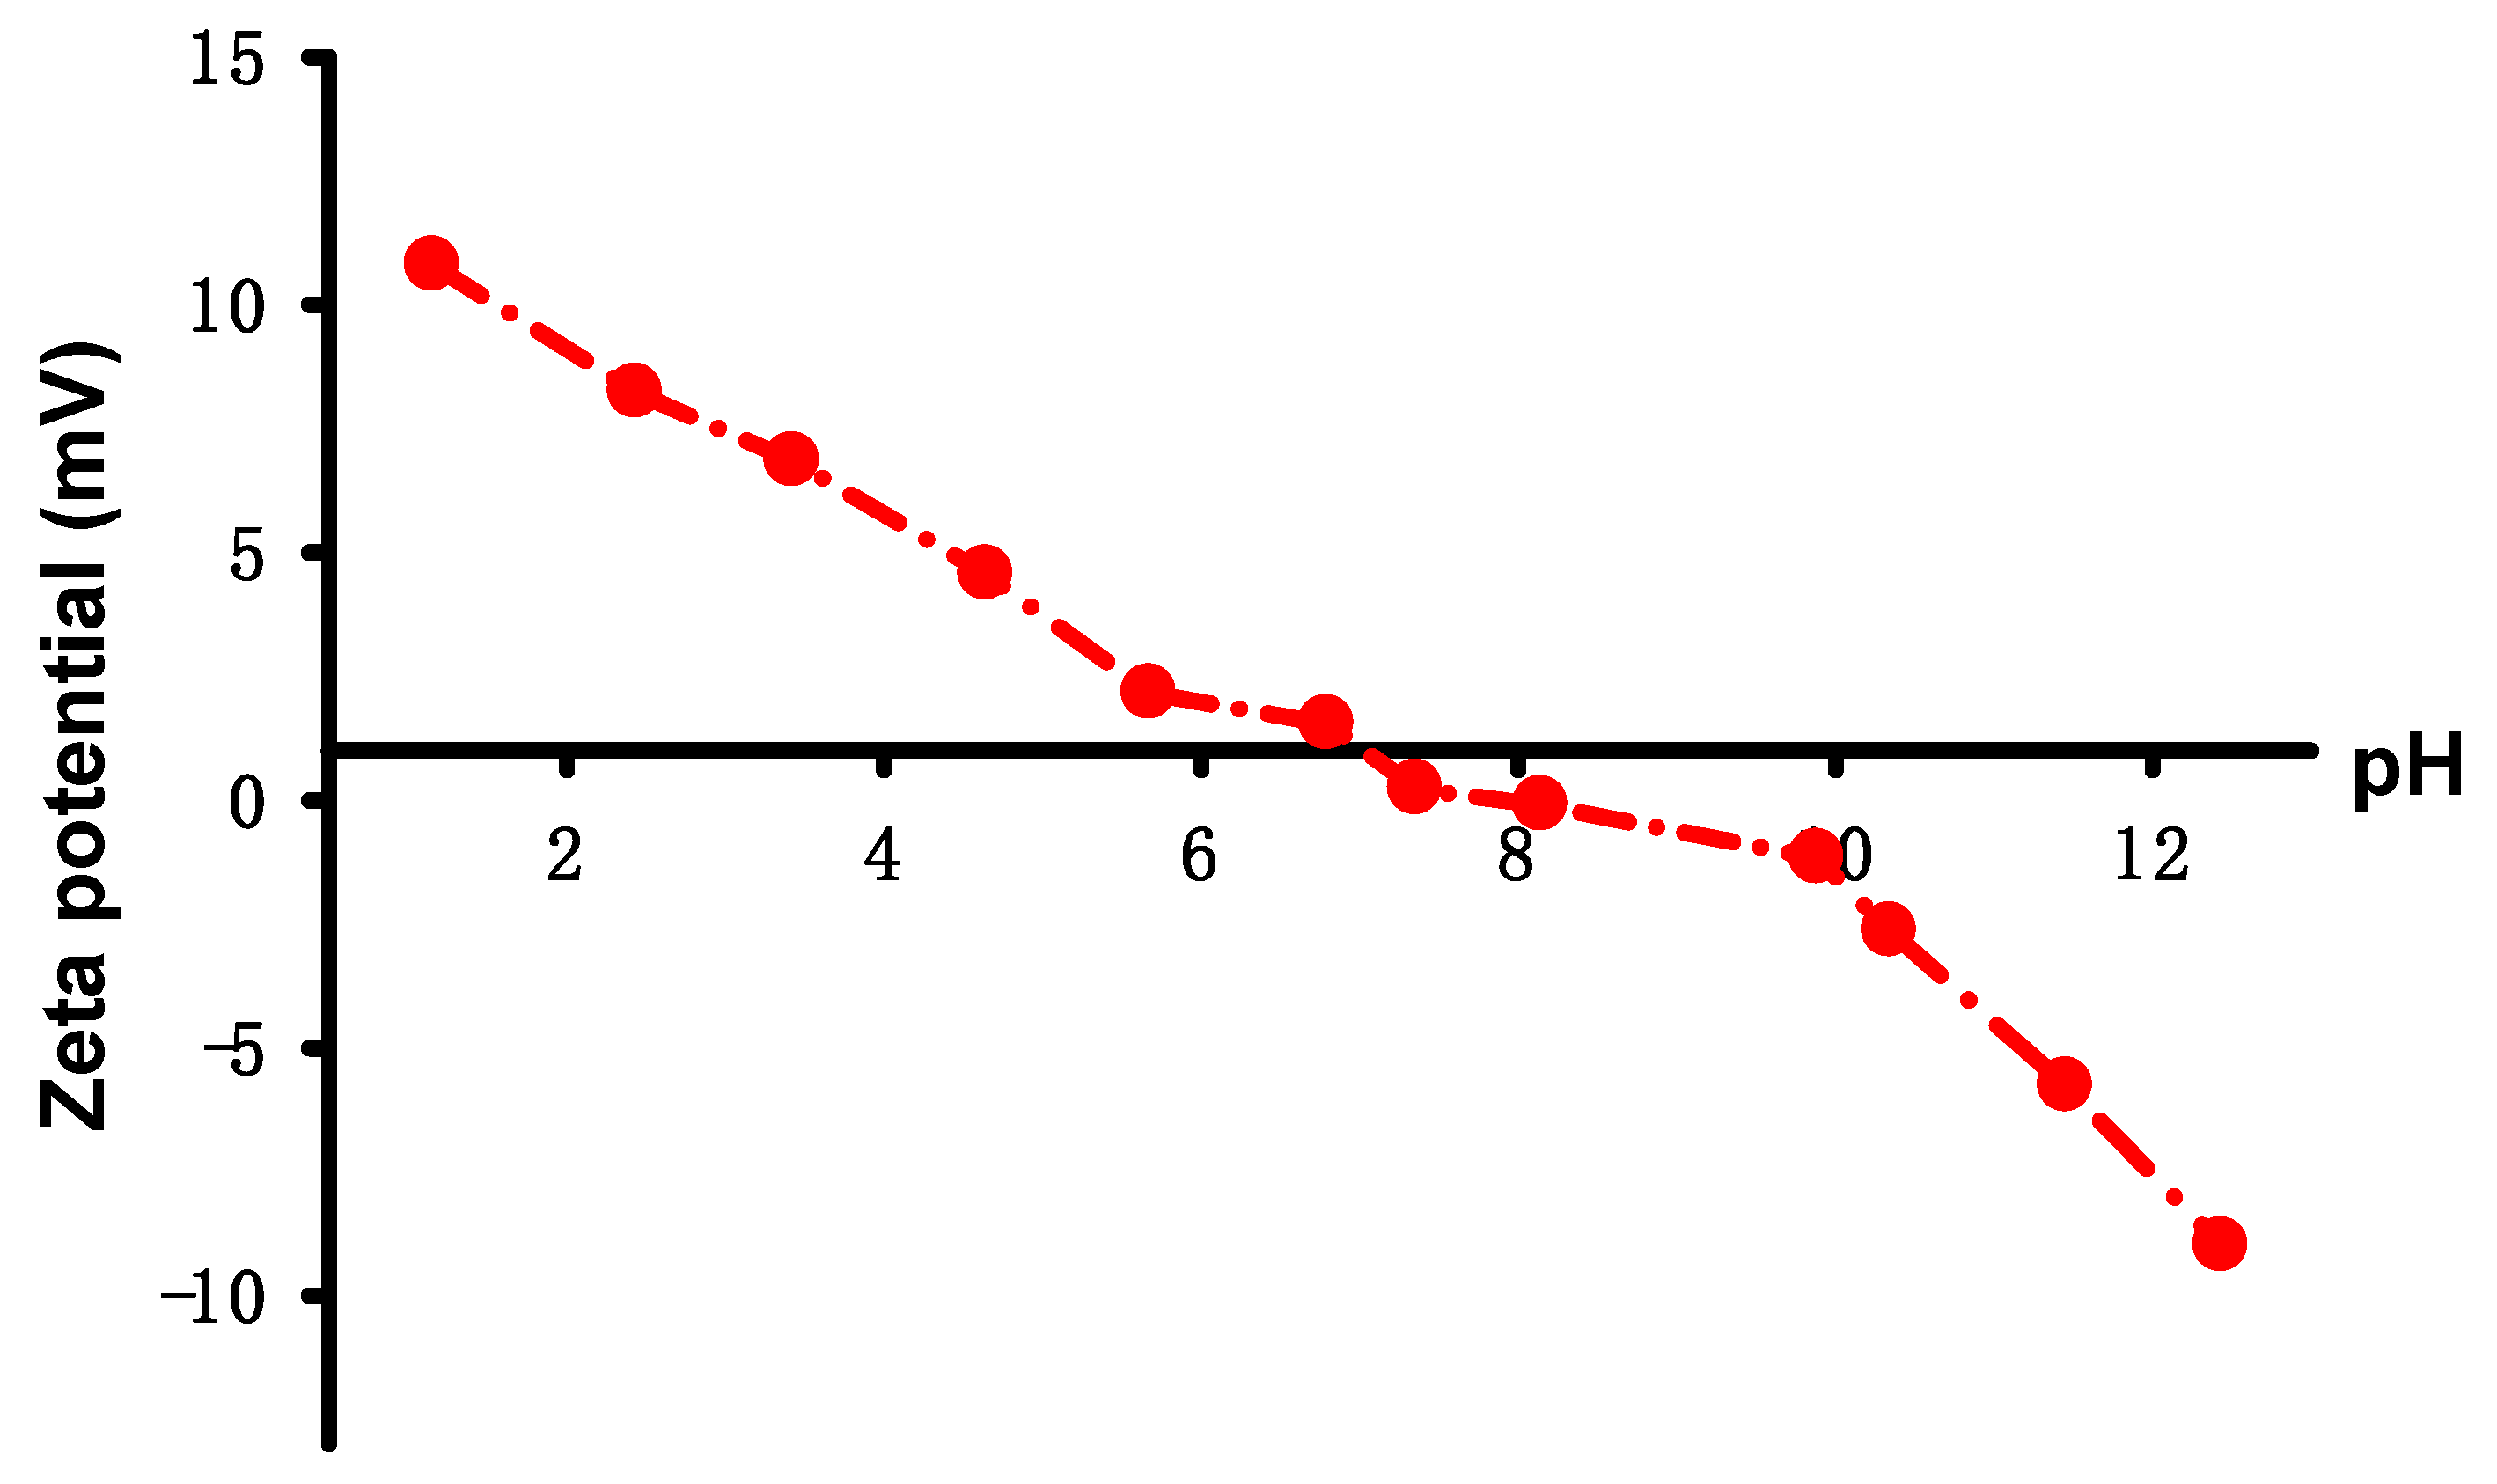
3.1. Textural Properties

According to the literature, raw rice husk has low textural characteristics [39]. The textural properties of RHAC, measured from the nitrogen adsorption at −196 °C displayed that the specific surface area and the average pore size of the sample increased, demonstrating the removal of volatiles from the decomposition of main compounds of raw rice husk after physical modification. The results showed that the specific surface area and total pore volume of RHAC were 332 m2 g−1, and 0.182 cm3 g−1, respectively. Micropores volume (0.131 cm3 g−1) and mesopore volume (0.051 cm3 g−1) contained about 72% and 28% of total pore volume, respectively. Therefore, activated carbon obtained from rice husk had a microporous structure with an average 2.2 nm diameter. The pHzpc of RHAC was measured as 7.8 (Figure 1), and the net charge of the RHAC under and above 7.8 is positive and negative, respectively.

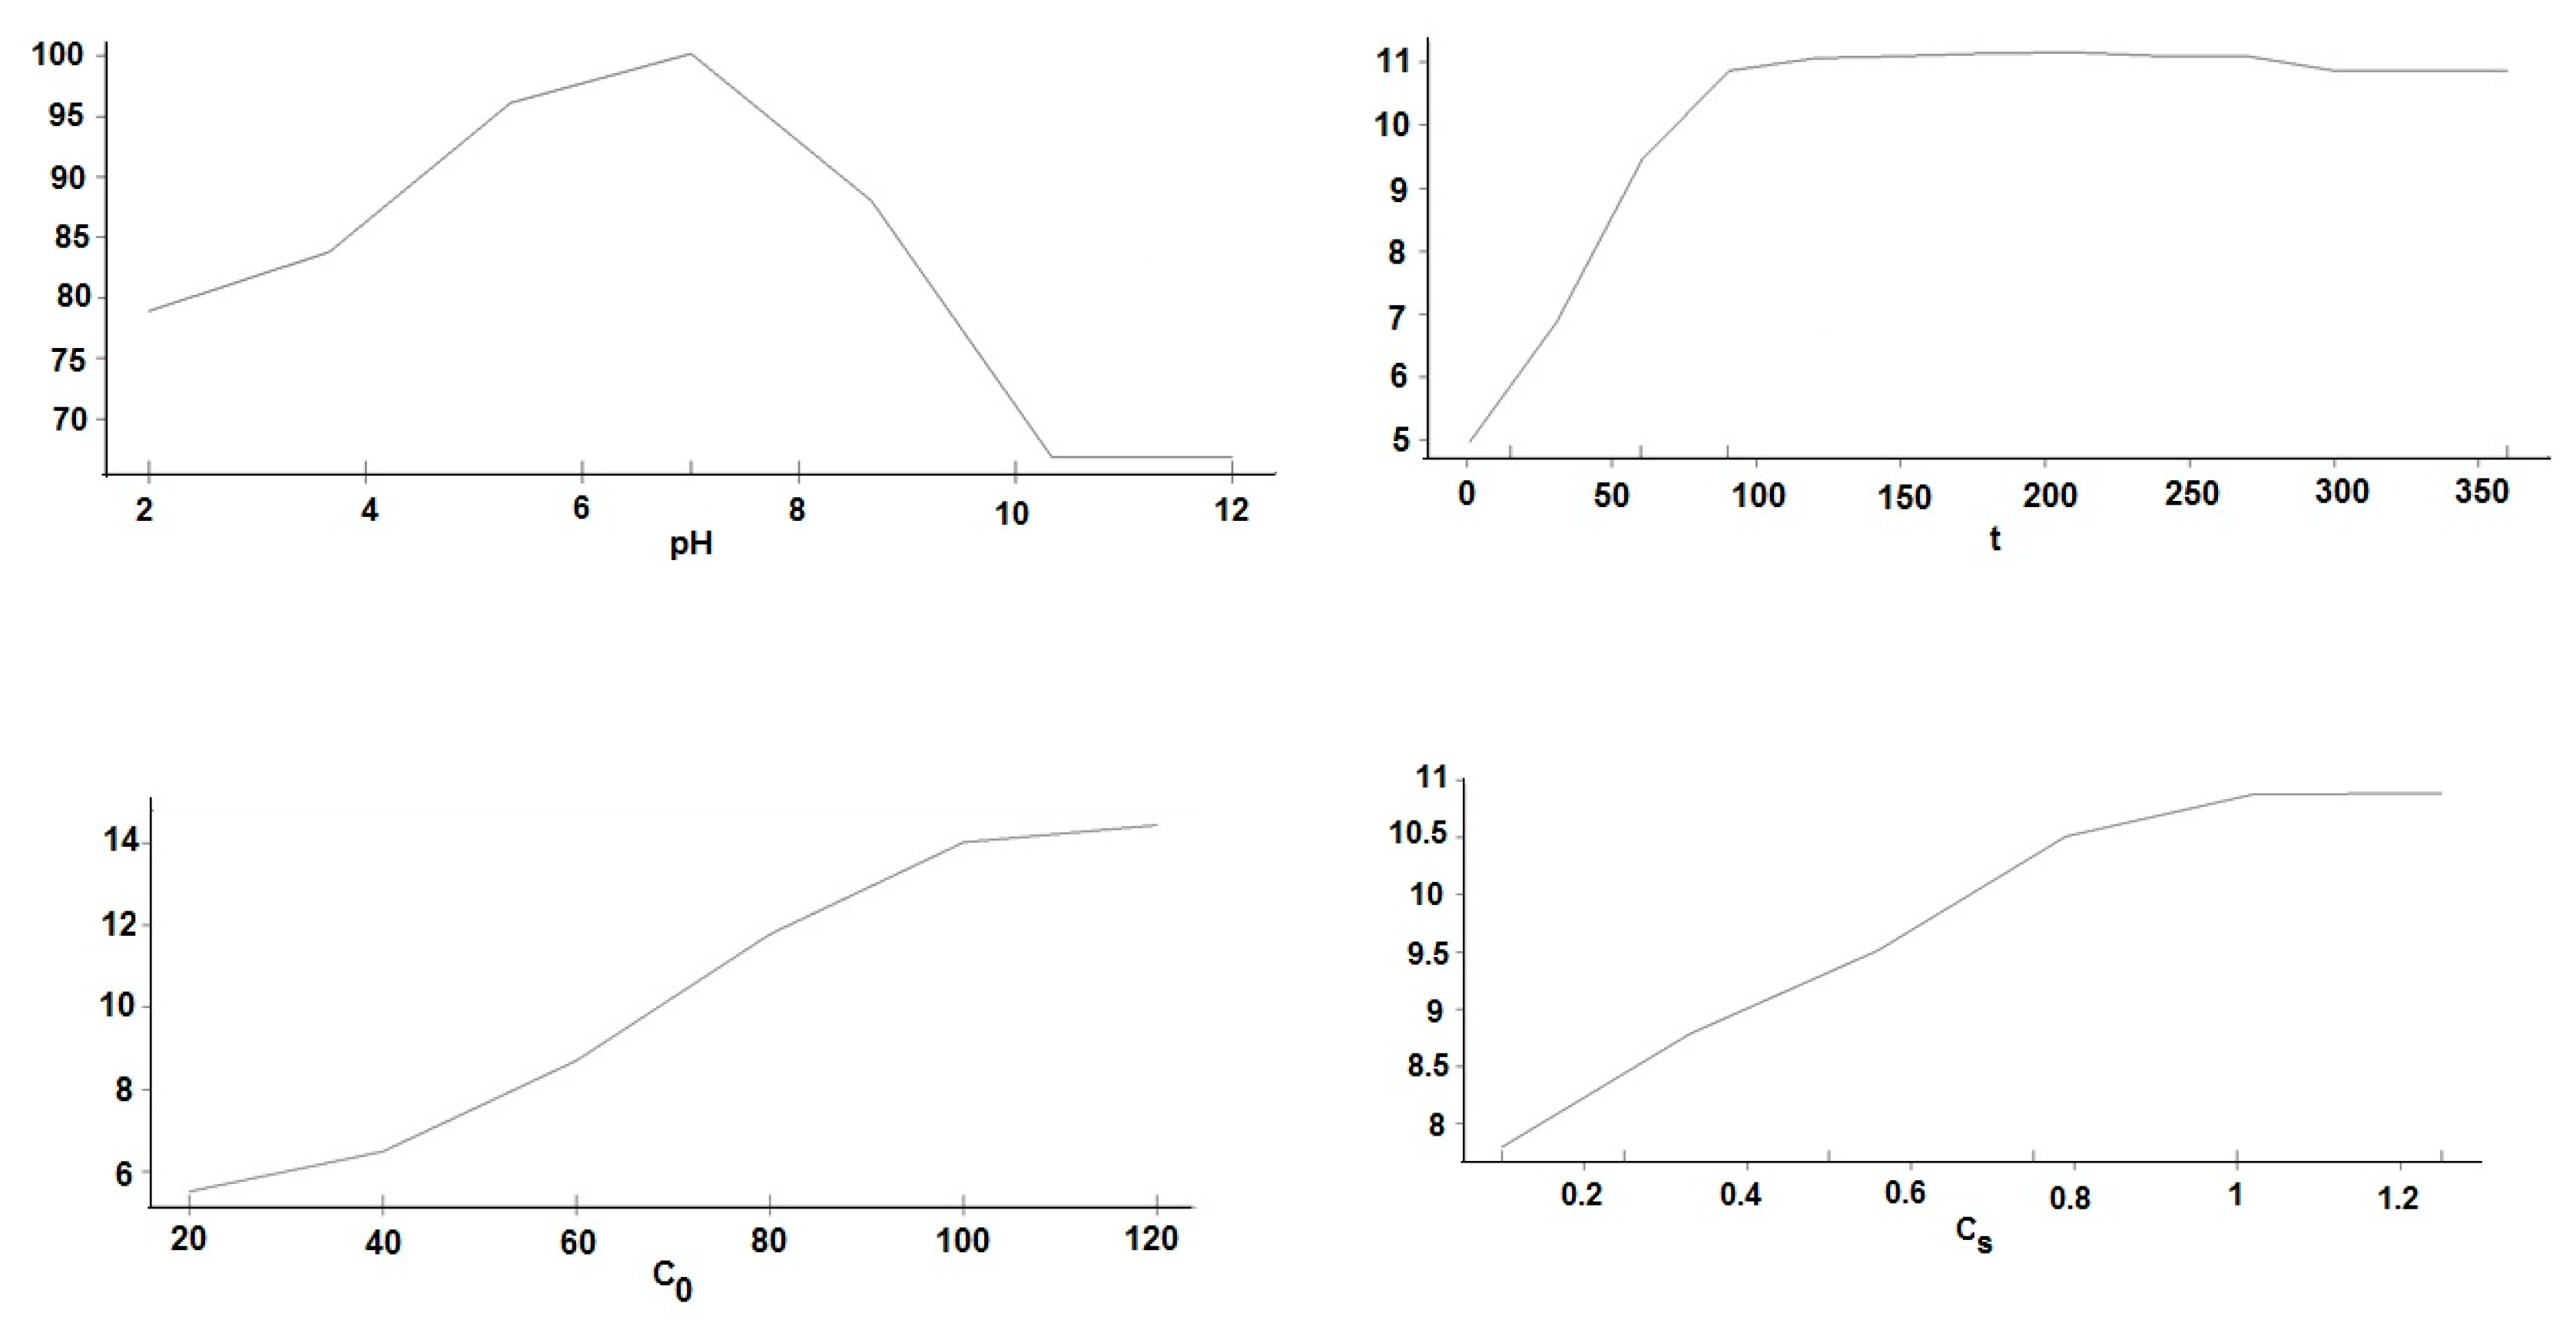
3.2. Investigation of Effective Parameters on the Adsorption
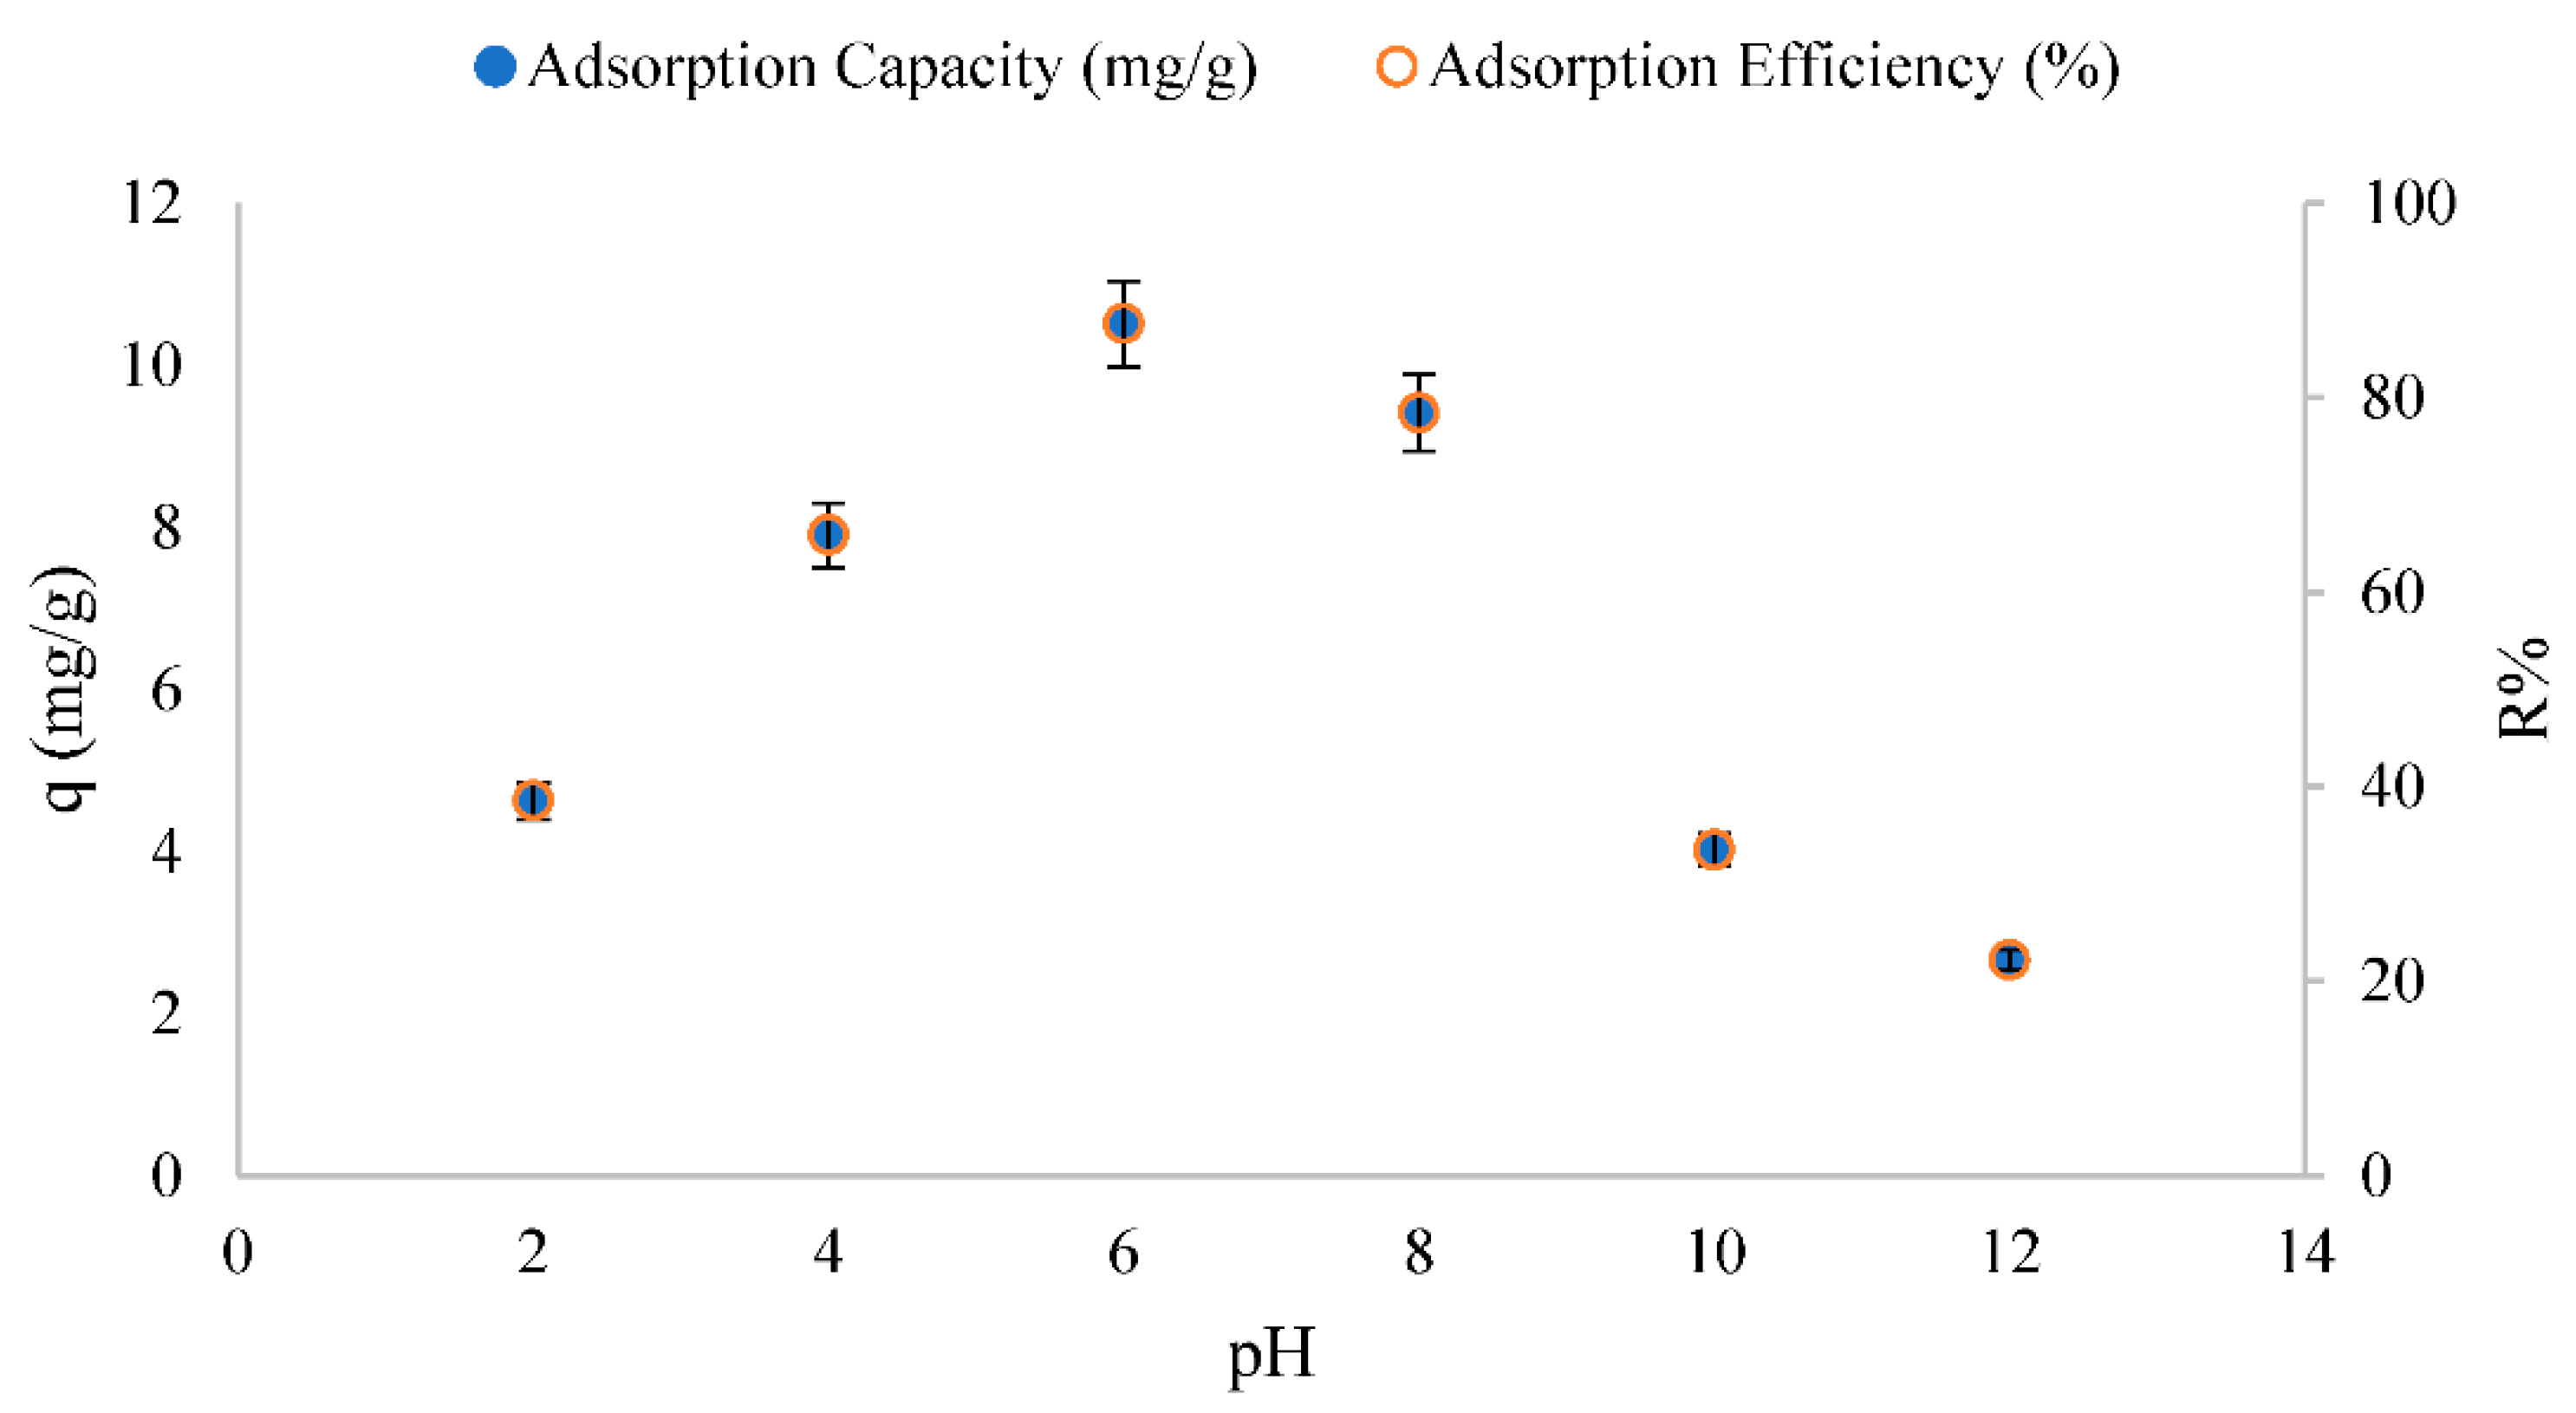
3.2.1. Effect of pH

As shown in Figure 2, adsorption capacity and adsorption efficiency increase from pH 2 to 6 but decrease at pH > 6. The adsorption efficiency reaches a maximum of 87.6% at pH 6, so this pH was selected as the optimal value. The solution pH specifies not only the predominant forms of the caffeine in the aqueous solution but also the surface state of the RHAC. The ionization of caffeine is highly affected by pH as it is a weak electrolyte (pKa = 8.3). So, the predominant species of caffeine are neutral and anionic forms at pHs lower and more than 8.3, respectively [40]. According to the previous literature, the adsorption of organic pollutants onto activated carbon is generally directly commensurate to the micropore volume [41]. Though the functionalization of rice husk activated carbon caused an increment in the specific surface area, leading to an enhancement in the microporous area, decreasing of caffeine adsorption at pH > 6 is attributed to the anionic form of caffeine (pH > pKa) along with the negative charge of the RHAC surface (pH > pHzpc). Thus, electrostatic repulsion between RHAC and caffeine molecules decrease the adsorption rate. For pHs less than 6 (pH < pHzpc), the RHAC surface is positively charged. However, caffeine is uptaken mainly in the neutral form based on the dissociation constant (pKa = 8.3). The reason for higher adsorption in these pHs is non-electrostatic forces, which include hydrogen bonding [9]. Other similar studies indicated that a complex interaction between electrostatic and non-electrostatic forces may occur for the adsorption of organic compounds onto carbon materials. This interaction is related to chemical characteristics of the solution and the properties of the carbon material and adsorbate [42].

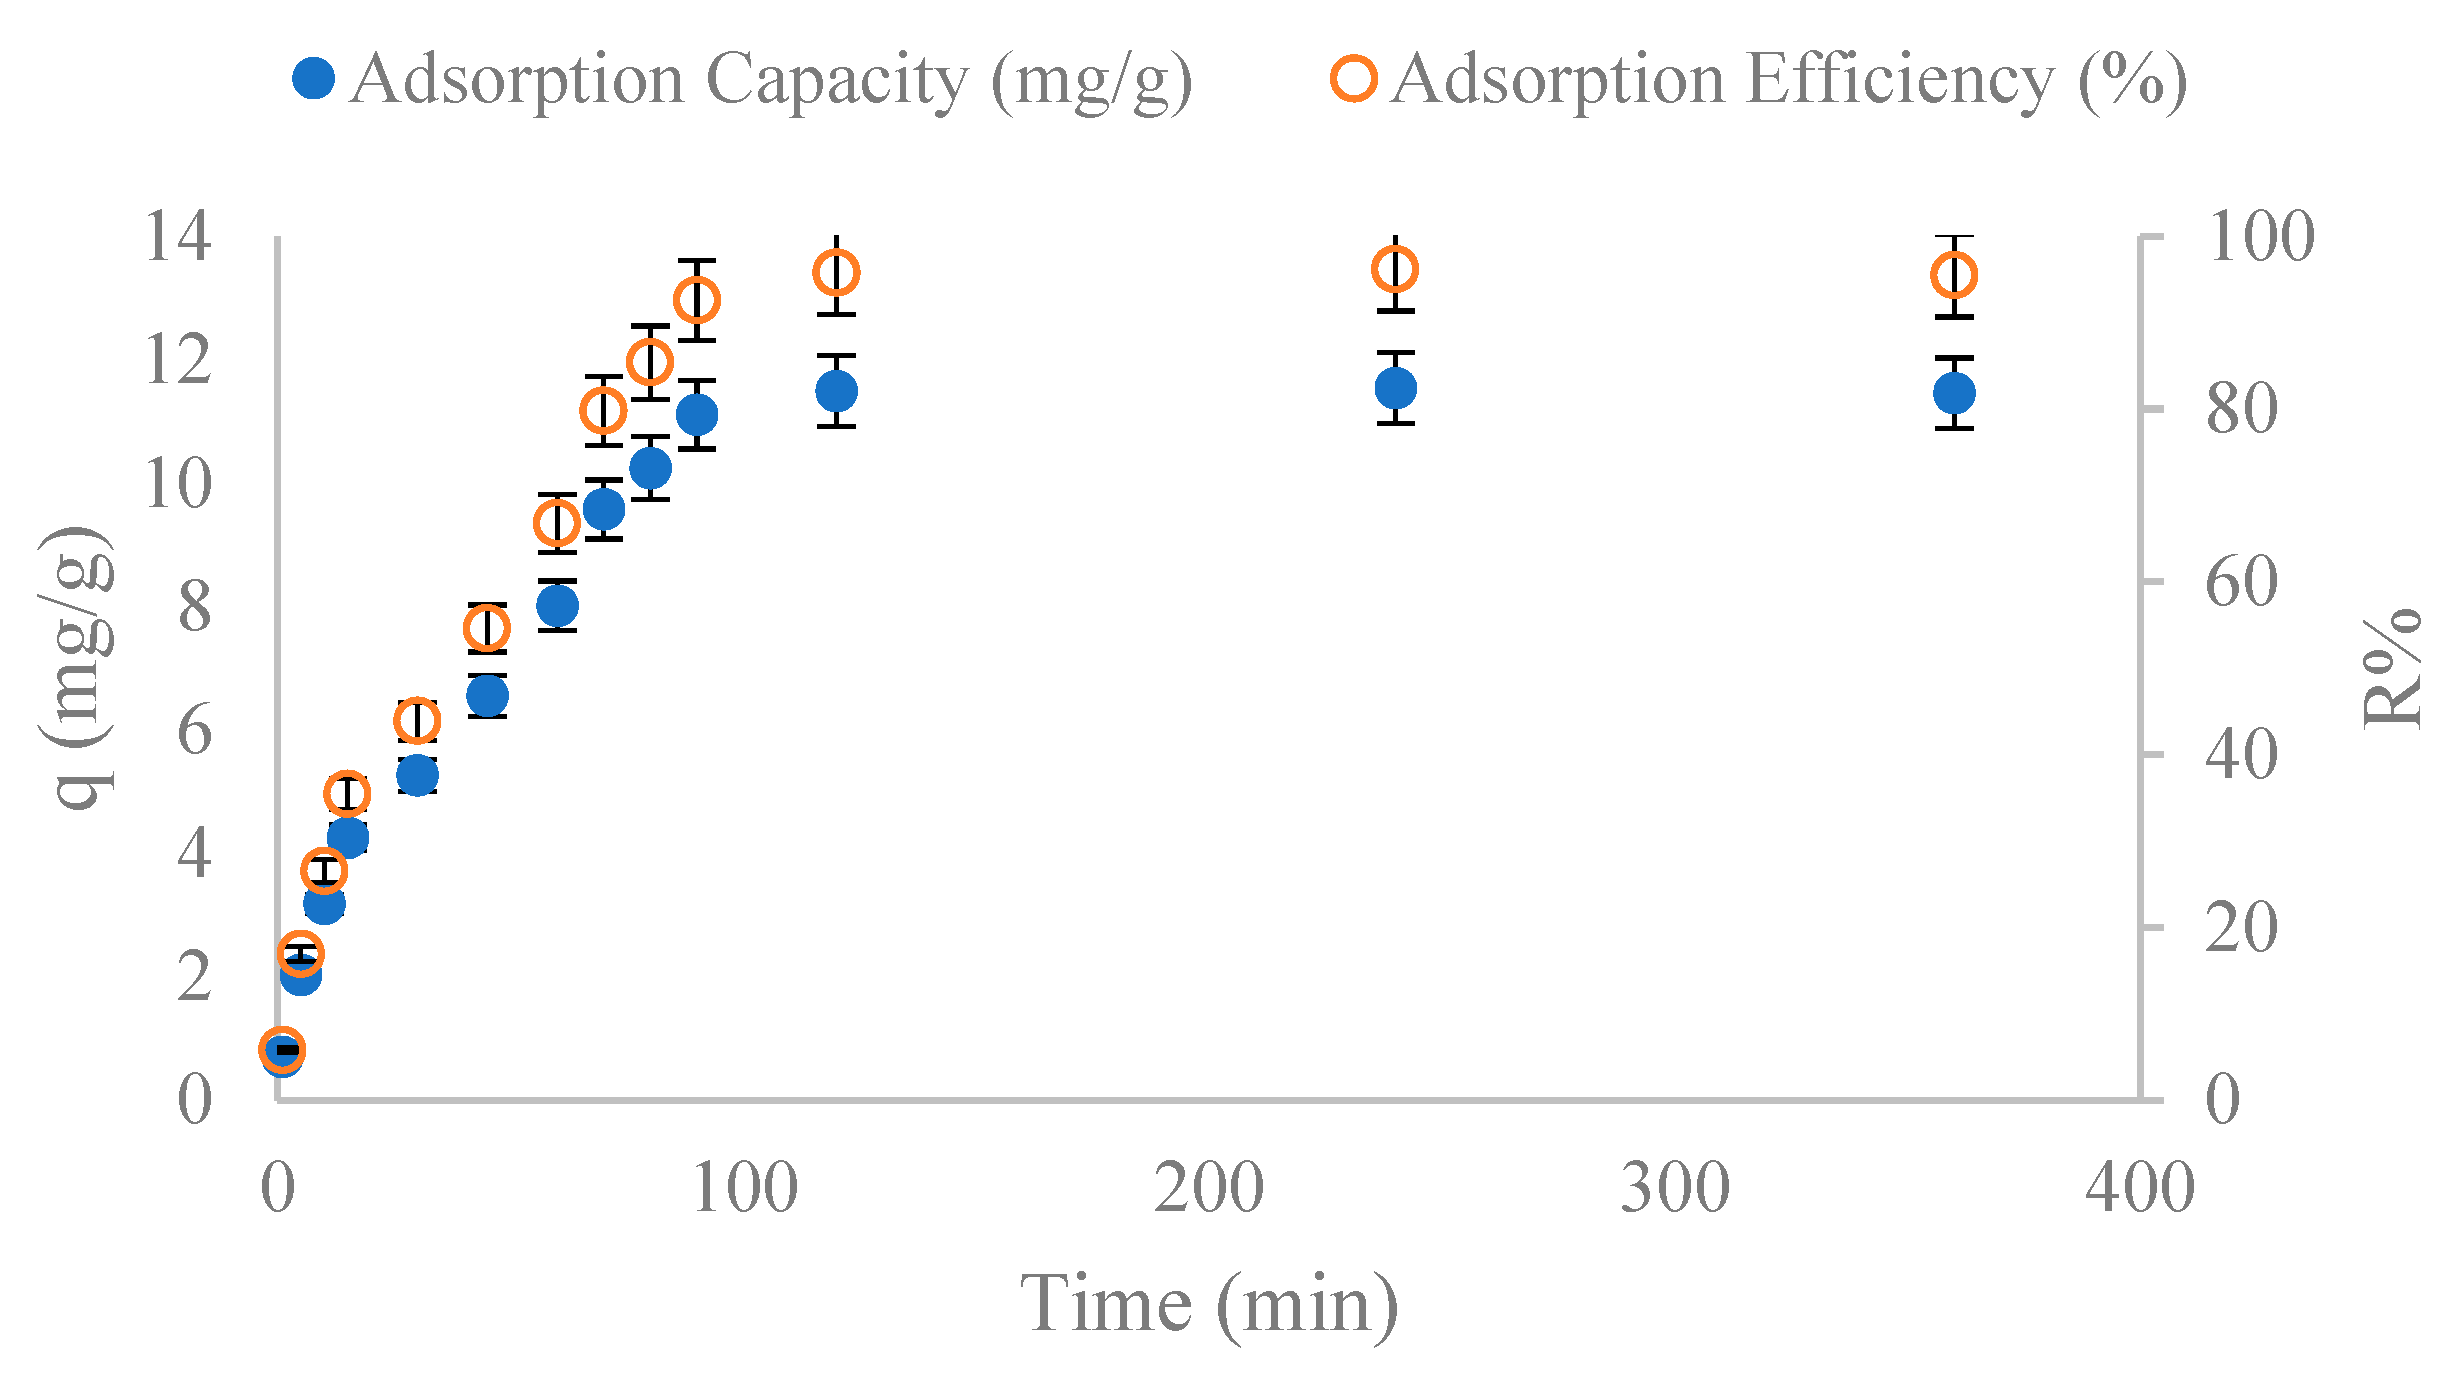
3.2.2. Effect of Contact Time

According to Figure 3, adsorption capacity and adsorption efficiency increase rapidly with enhancing contact time until reaching maximum values at 240 min (96.20% and 11.54 mg/g, respectively). This increase can be related to the longer contact time between the pollutant and the functional groups in the adsorbent structure. The adsorption is constant from 90 min onwards; therefore, this time can be selected as the optimal time.

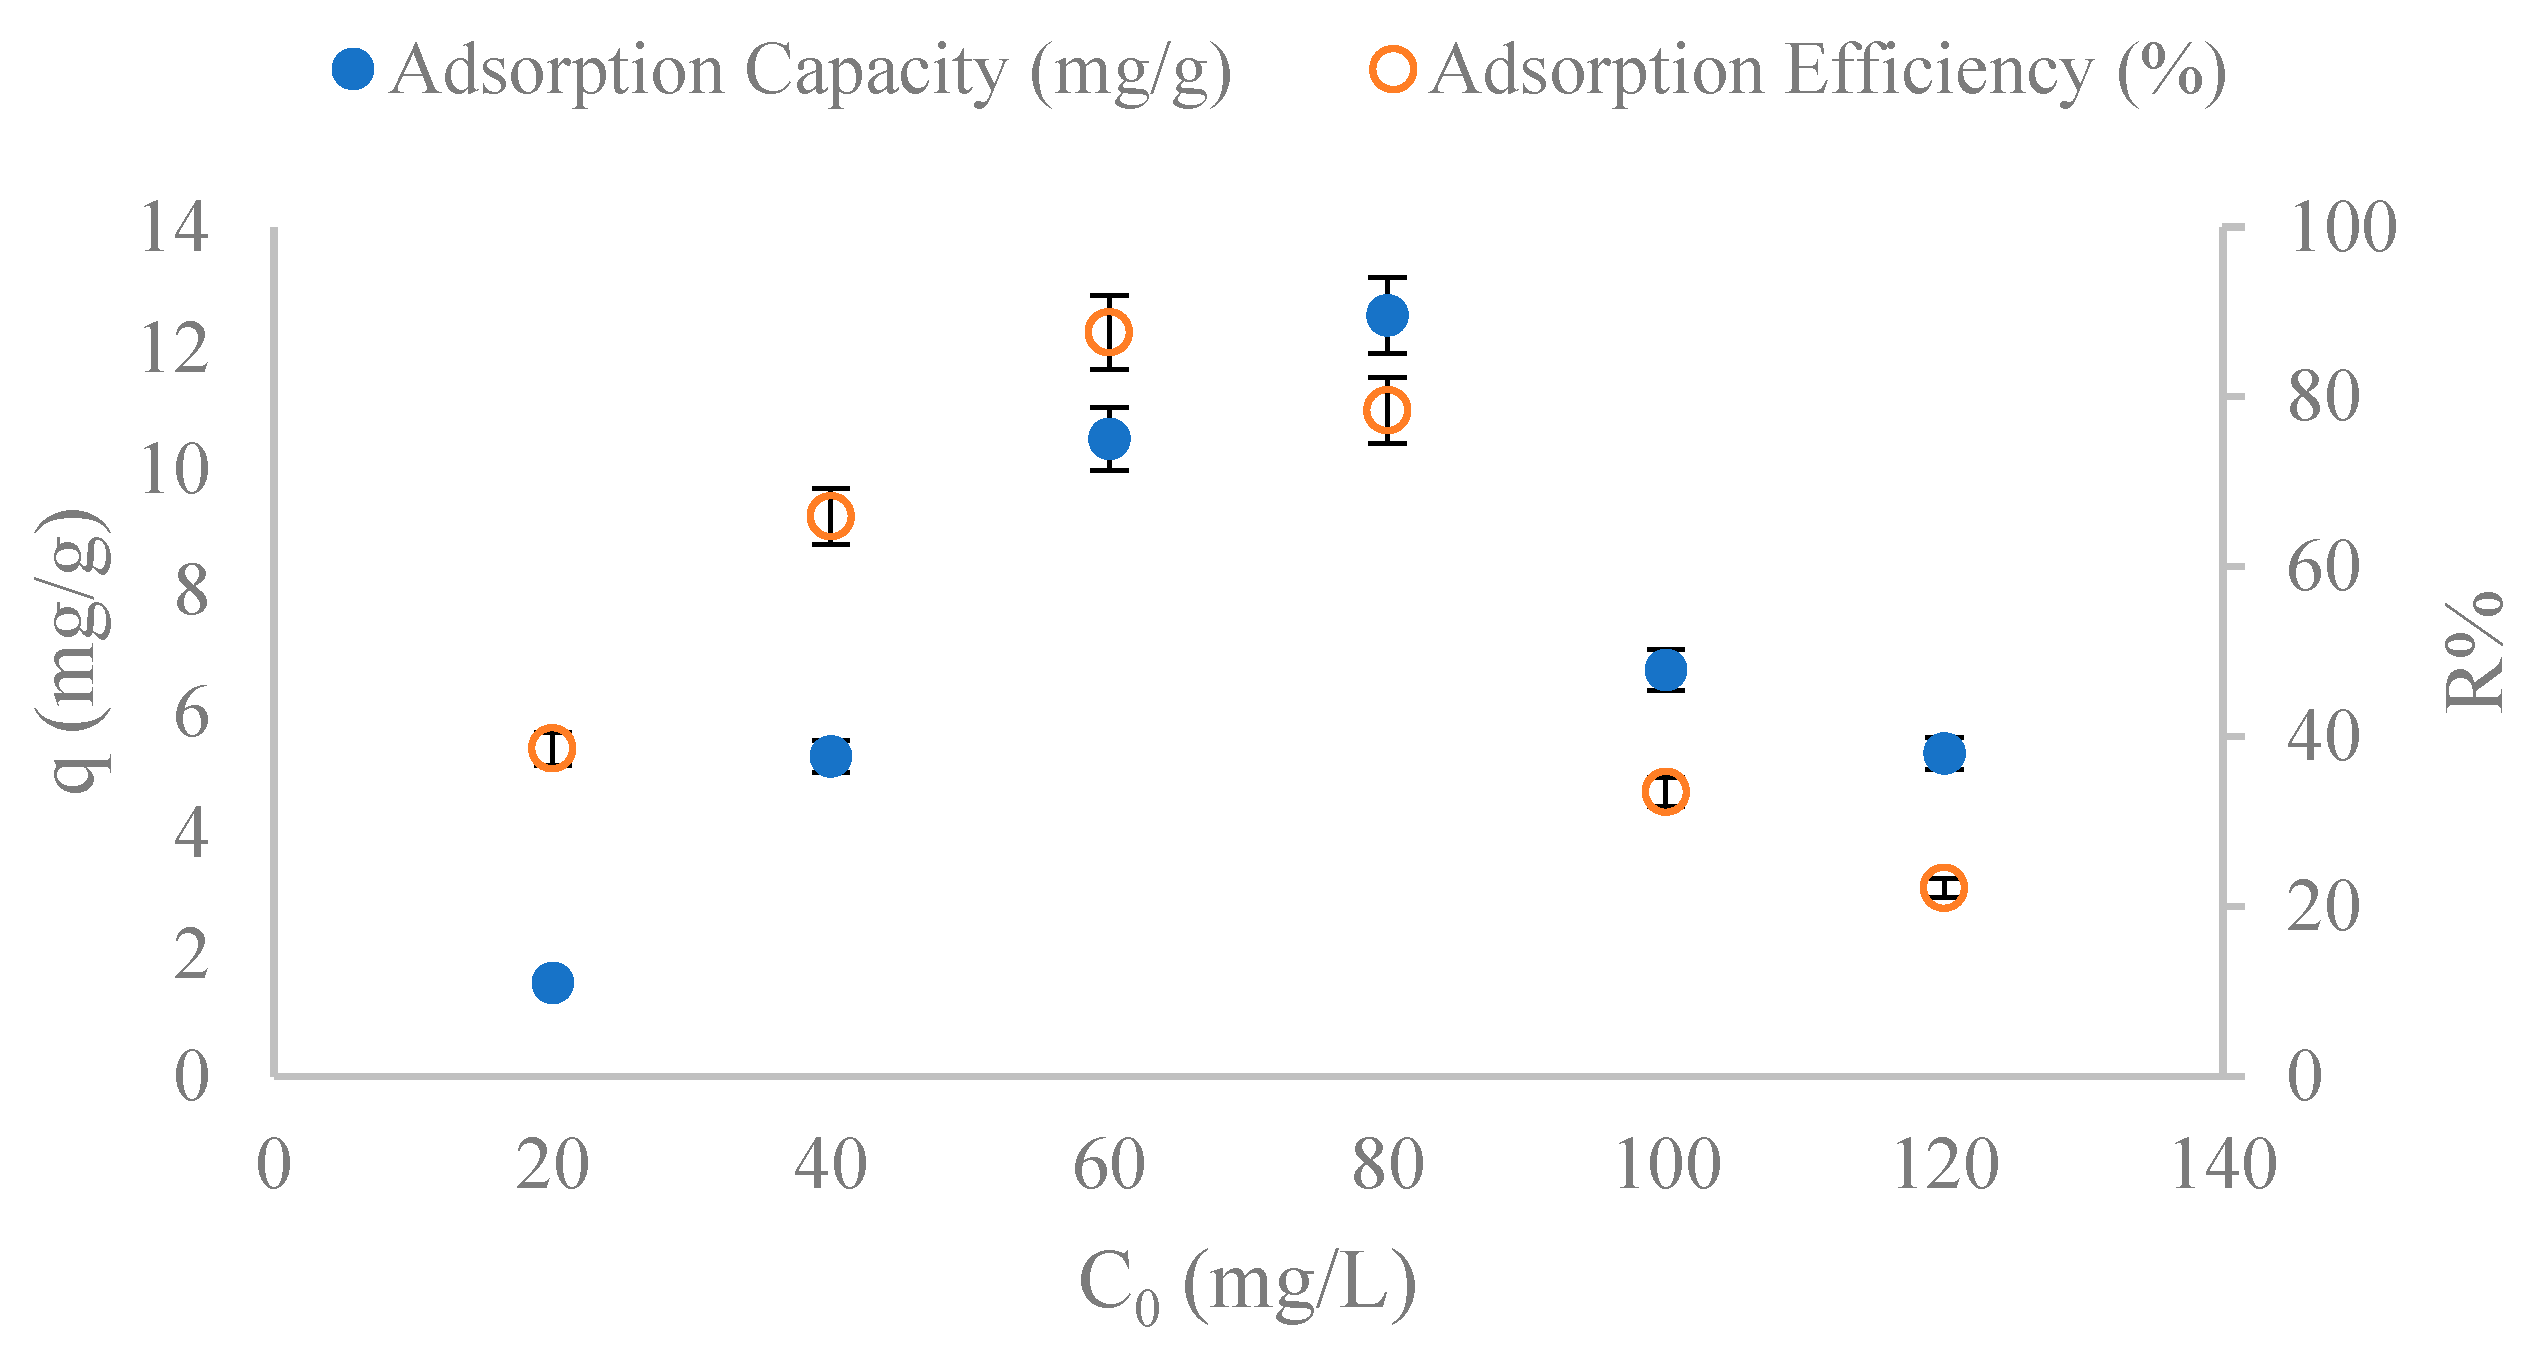
3.2.3. Effect of Initial Concentration of Caffeine

Figure 4 shows the changes in adsorption capacity and adsorption efficiency relative to the increase in the initial concentration of caffeine. Increasing the initial caffeine concentration from 20 to 60 mg/L enhanced the removal efficiency from 38.56% to 87.6%, and then it began to decline. The adsorption capacity also increased by enhancing the initial caffeine concentration from 20 to 80 mg/L and then declined. Augmented adsorption capacity with increasing caffeine initial concentration is related to the possible interaction between caffeine ions and the RHAC surface. However, after the caffeine concentration exceeded a certain level, the adsorption capacity decreased, which could be due to the occupation of most of the adsorbent sites in the early stages of adsorption.

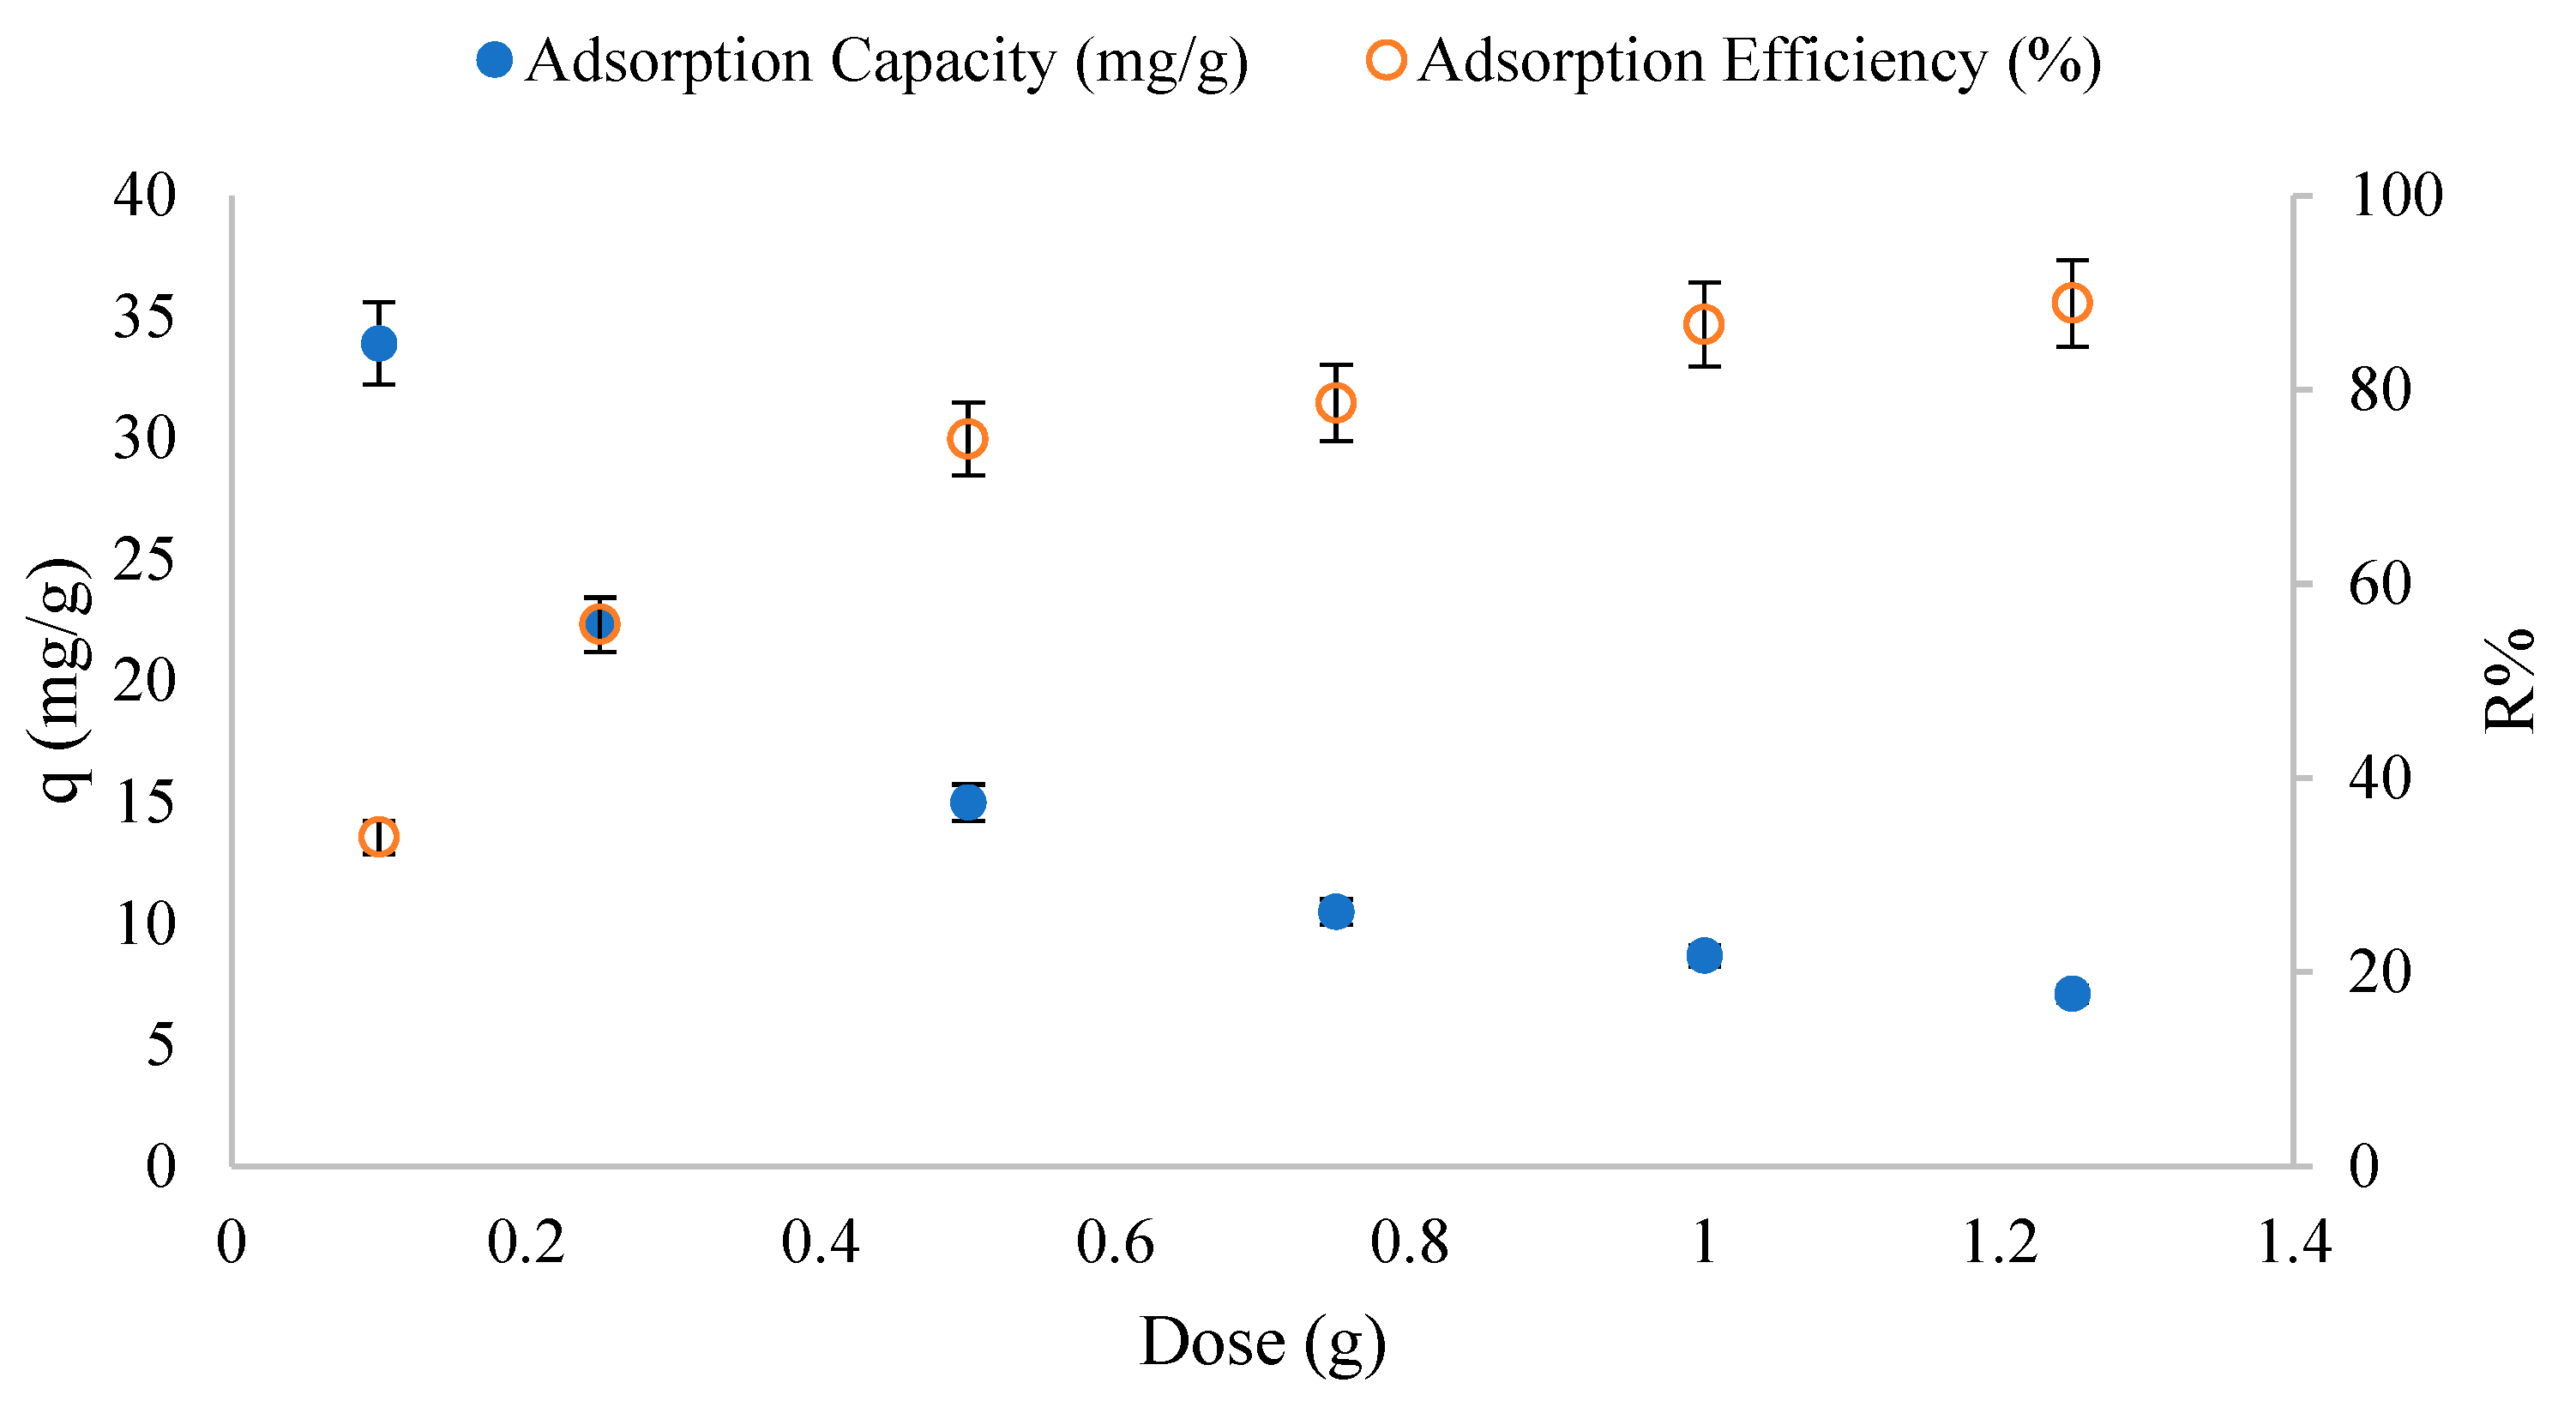
3.2.4. Effect of RHAC Adsorbent Dose

Figure 5 represents the effect of adsorbent dose on the adsorption capacity and adsorption efficiency of the rice husk activated carbon in removing caffeine from an aqueous solution. The adsorption capacity and the adsorption efficiency had the opposite reaction to increasing the adsorbent dose, as with increasing the RHAC dose from 0.1 to 1.25 g, R% increased from 33.9% to 88.9%, but q decreased from 33.9 to 7.11 mg/g. The reason for this trend is that the initial concentration of caffeine is constant, and the adsorbent dose increases [43]. The optimum adsorbent dose was selected as 0.5 g because the increase in adsorption efficiency and the decrease in adsorption capacity did not occur sharply from this value onwards.

3.3. Adsorption Models

According to the outputs of the isotherm and kinetic models presented in Table 2, the Freundlich and the pseudo-first-order models with the lowest RMSE (0.96 and 0.63, respectively) and the highest coefficient of determination (99.74% and 99.41%, respectively) had the best-fitting model for the adsorption of caffeine by RHAC. The value of 1/n is between 0.1–1, which represents the multilayer adsorption of caffeine onto the heterogeneous surface of the RHAC [44]. Additionally, the adsorption capacity constant (KF) was found to be 0.76 (mg/g) (mg/L)−n. The adsorption capacity calculated by the pseudo-first-order model (11.77 mg/g) is very close to the value measured in the experiment (11.54 mg/g). A better fit of the PFO model on the kinetic data indicates that the caffeine uptake by the RHAC occurs only at local sites without any interaction [24].

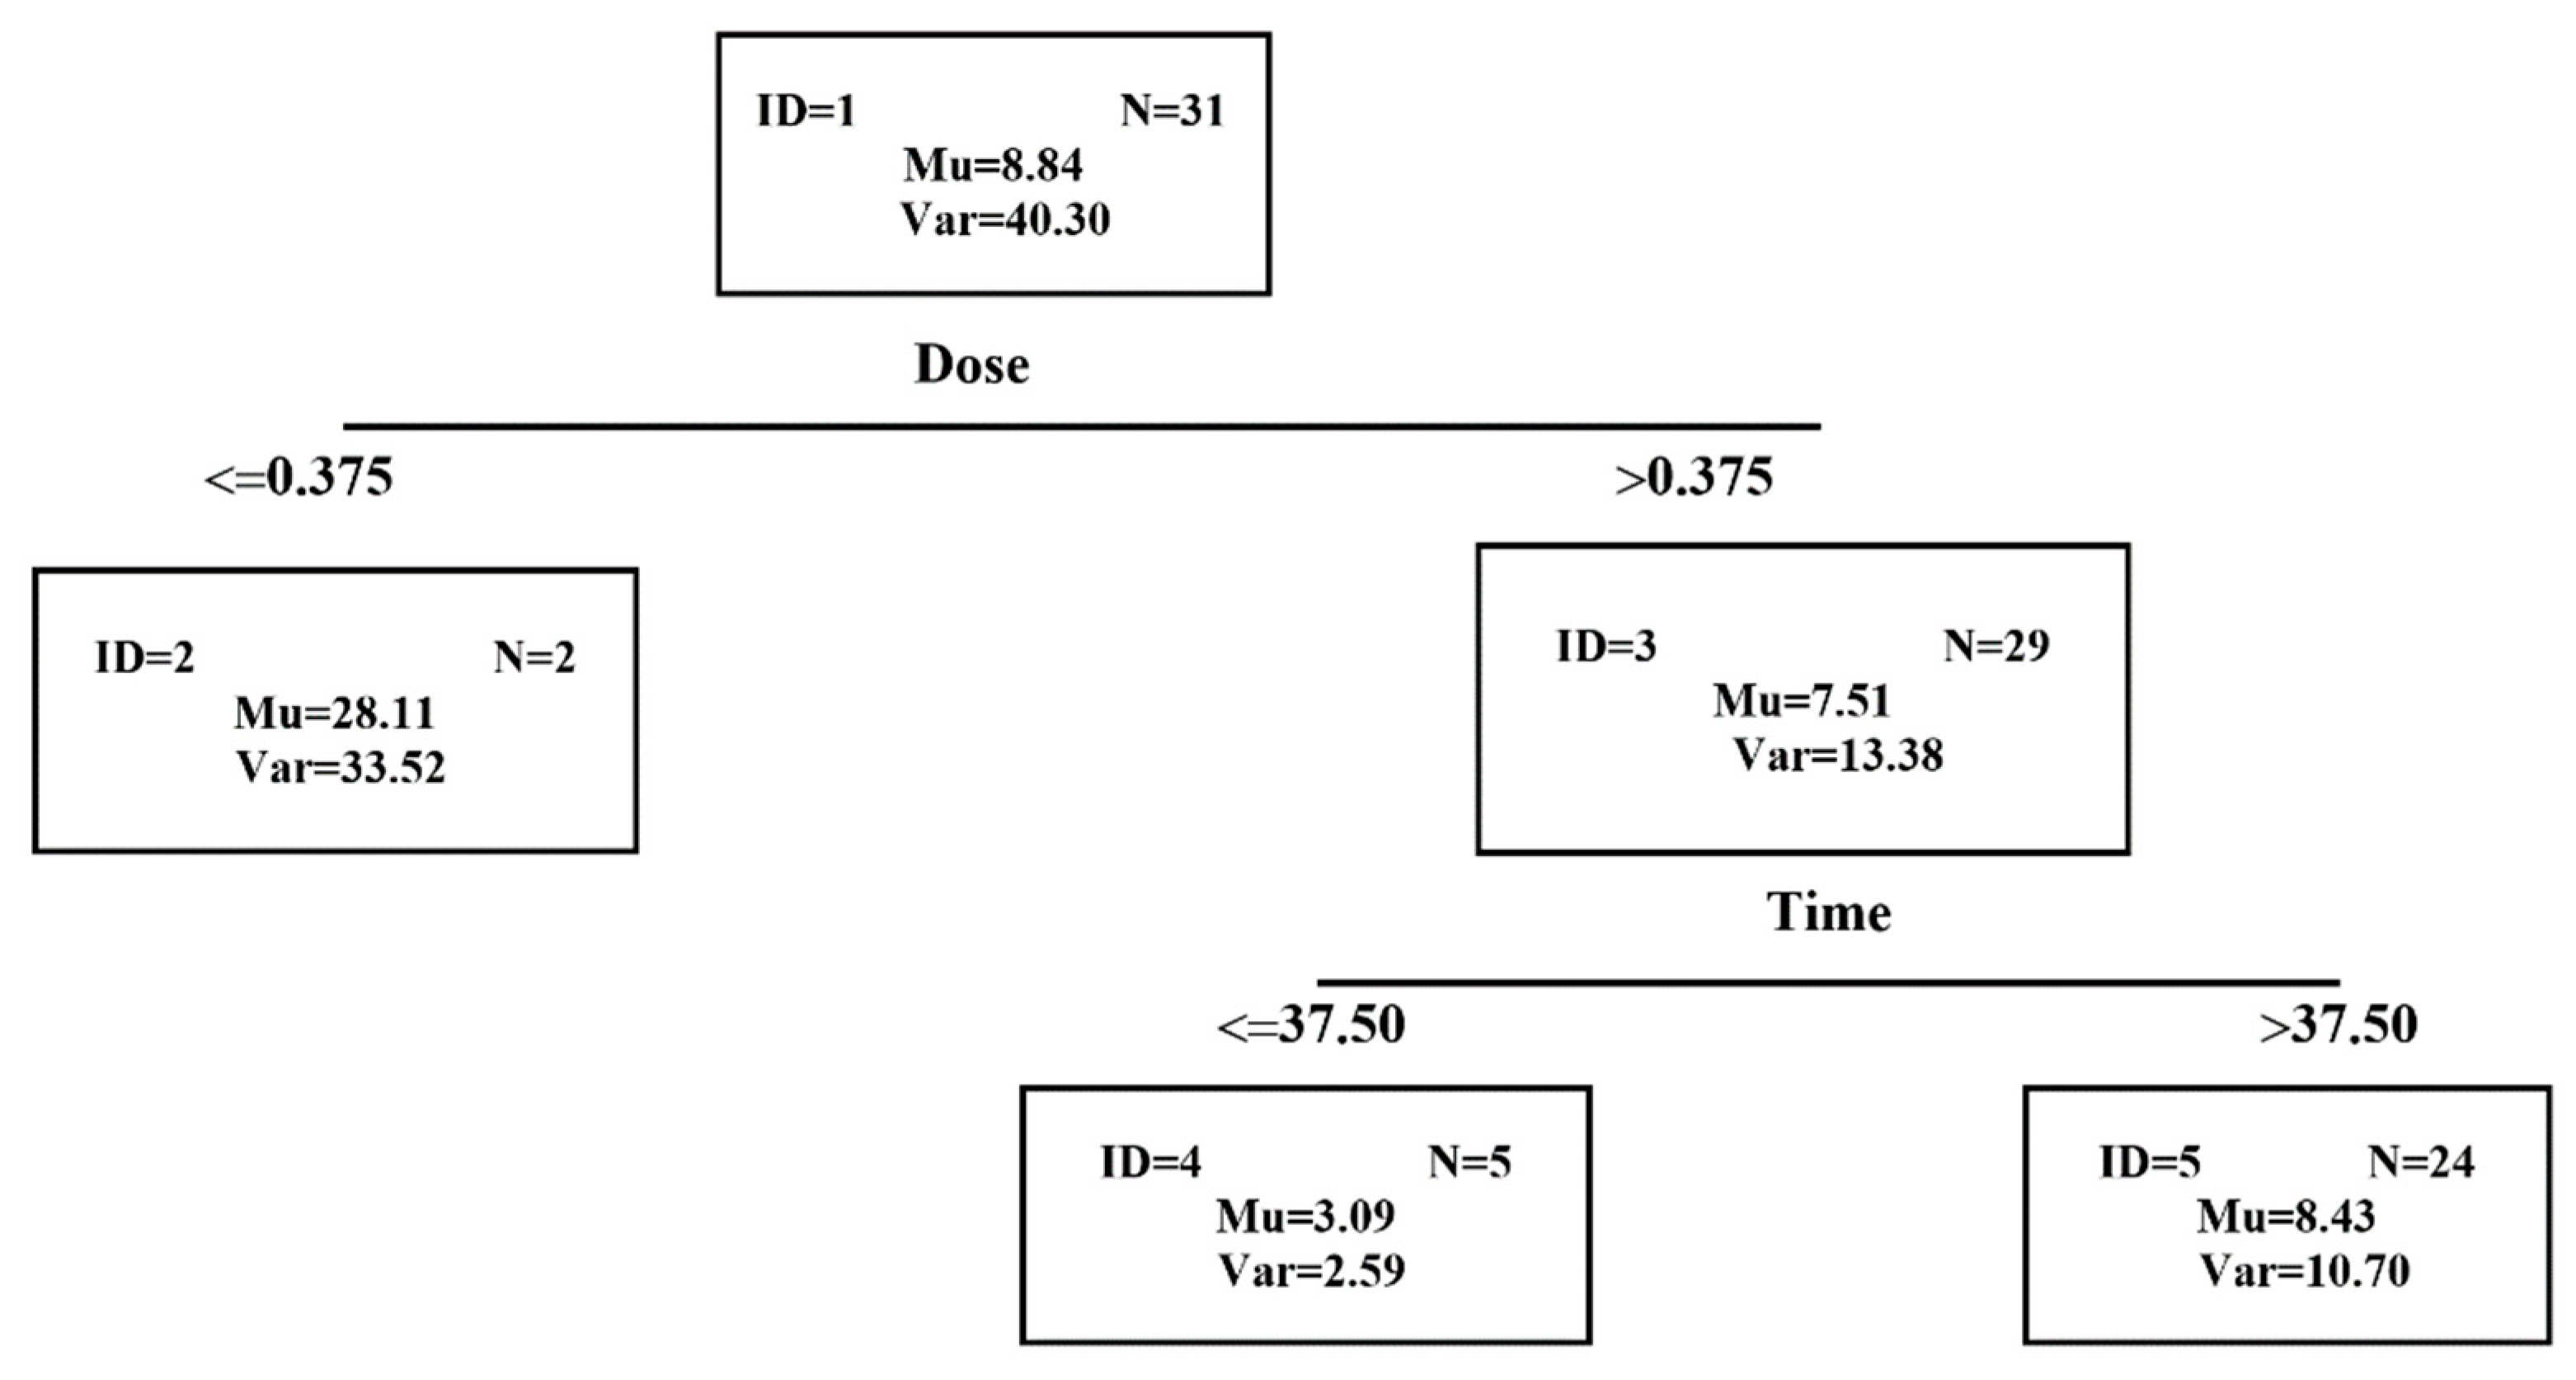
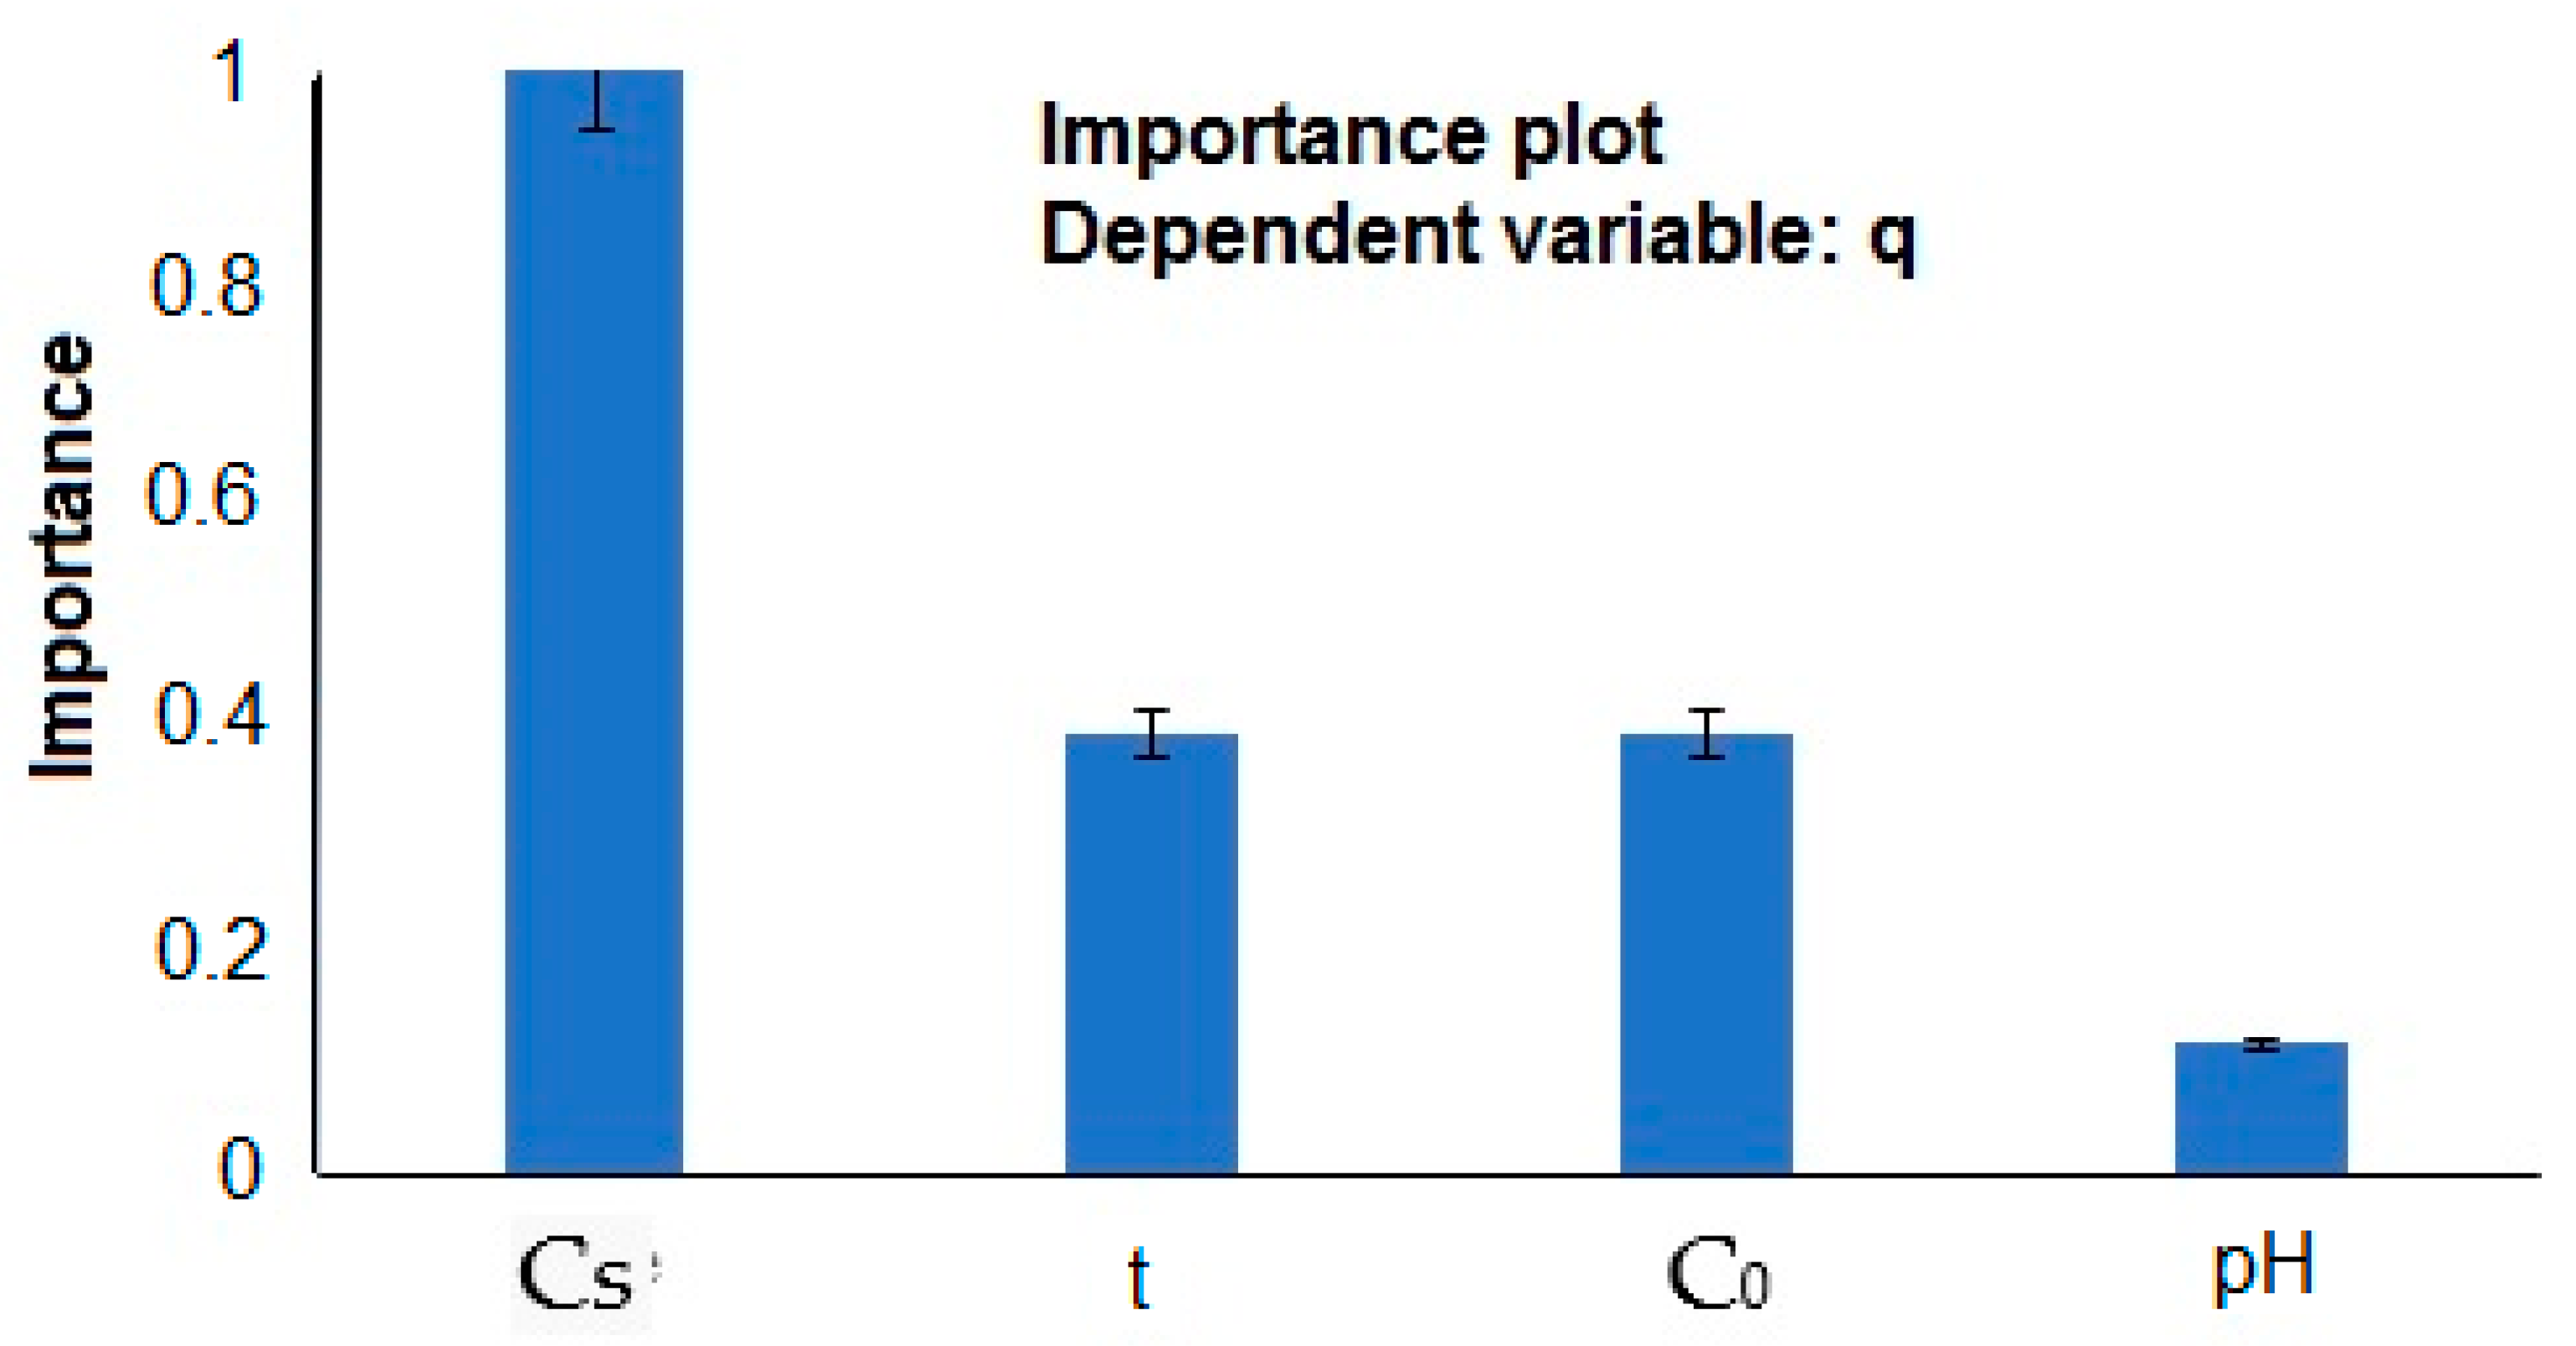
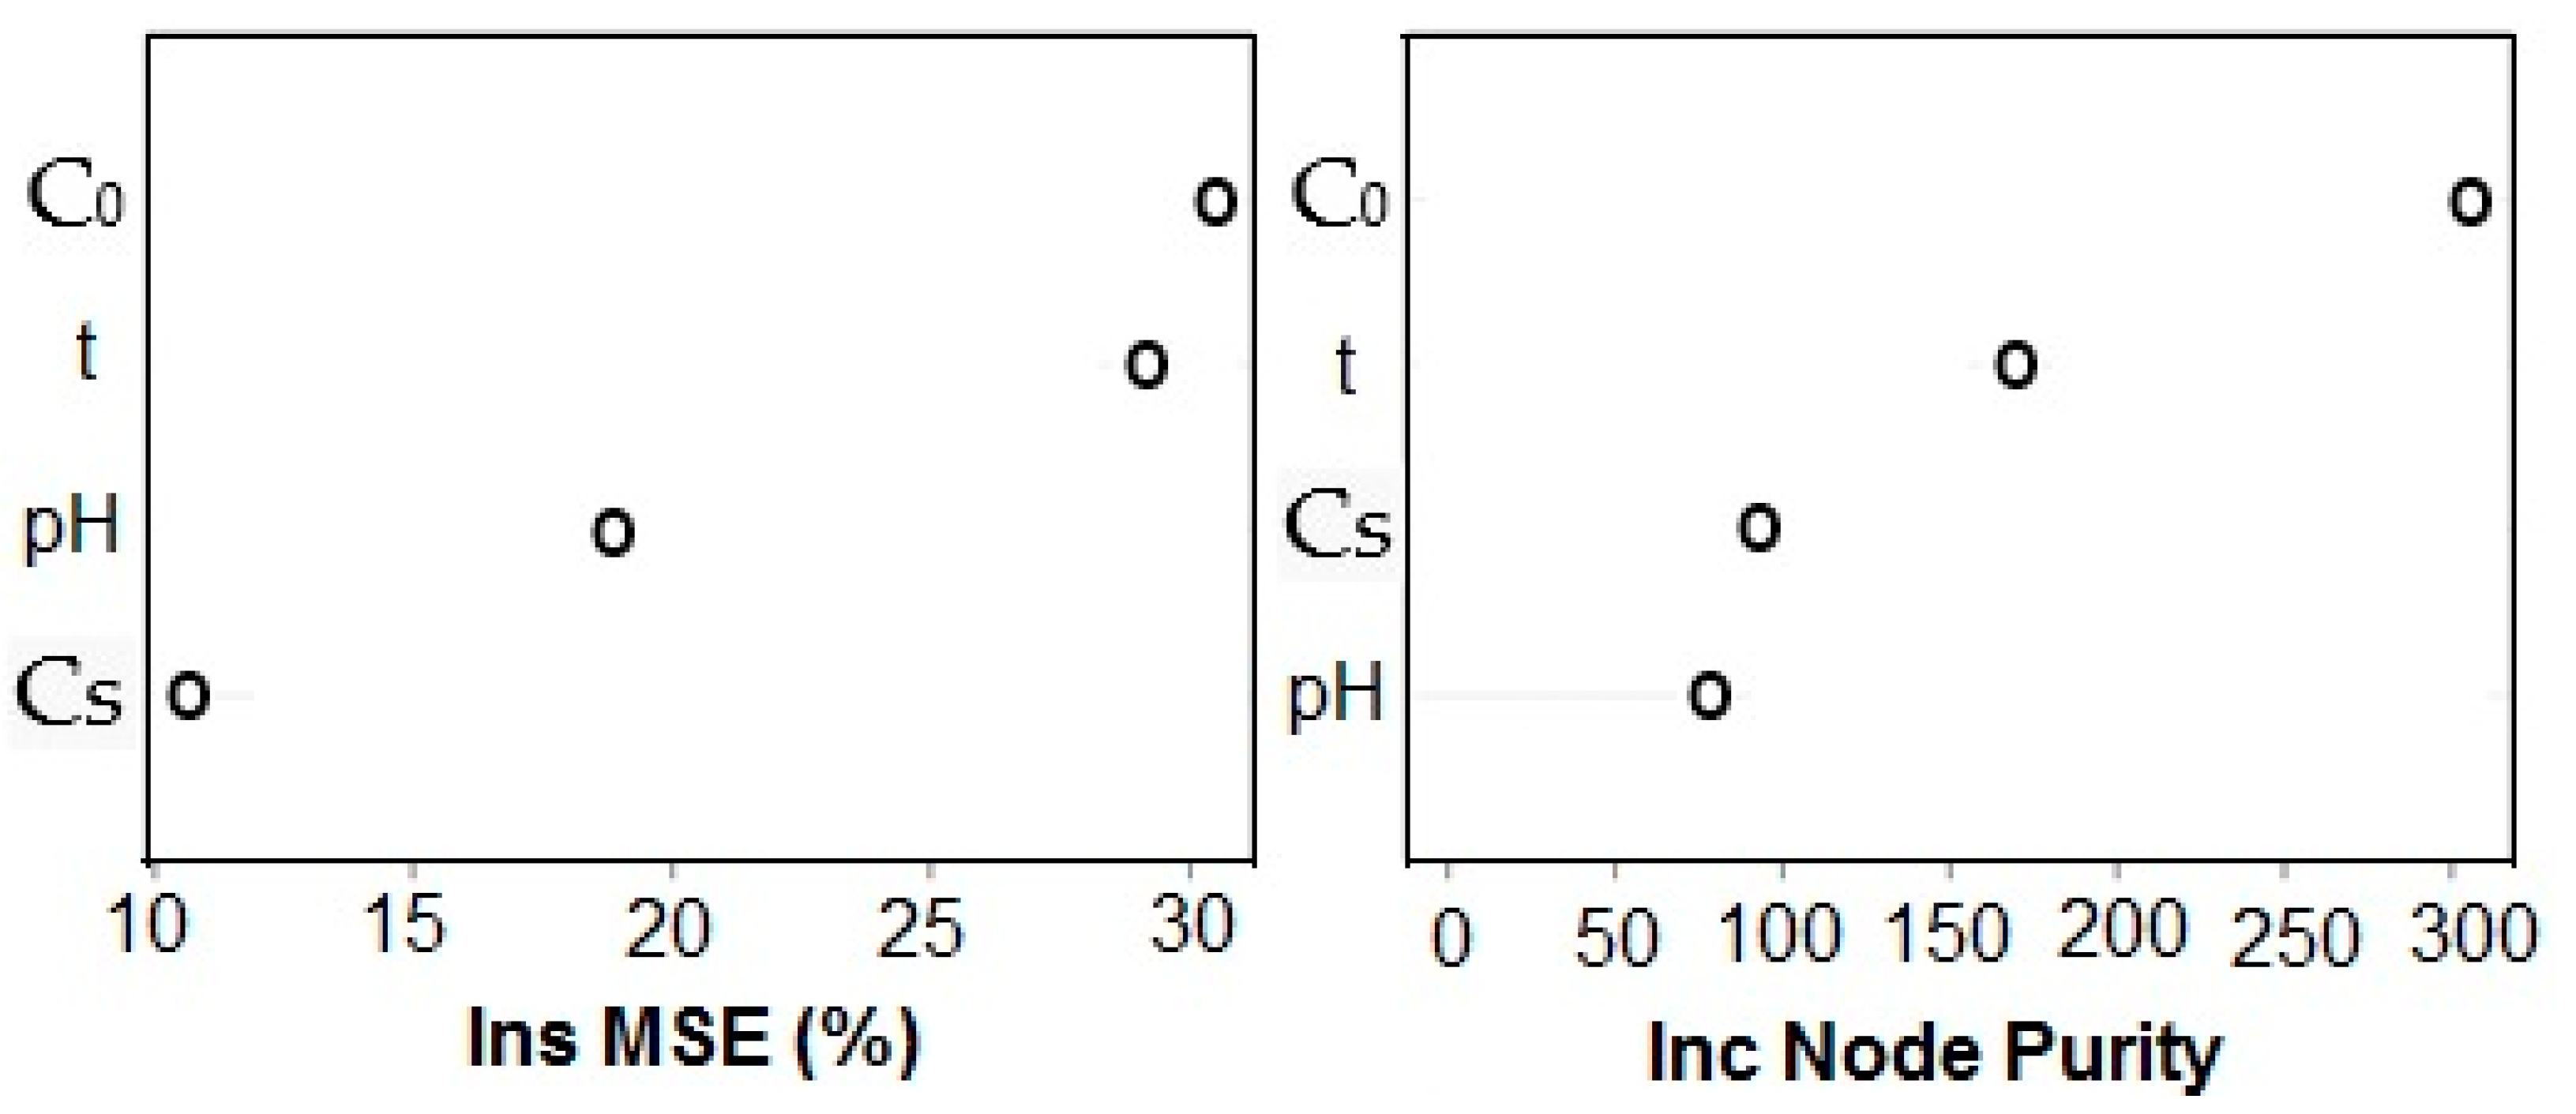
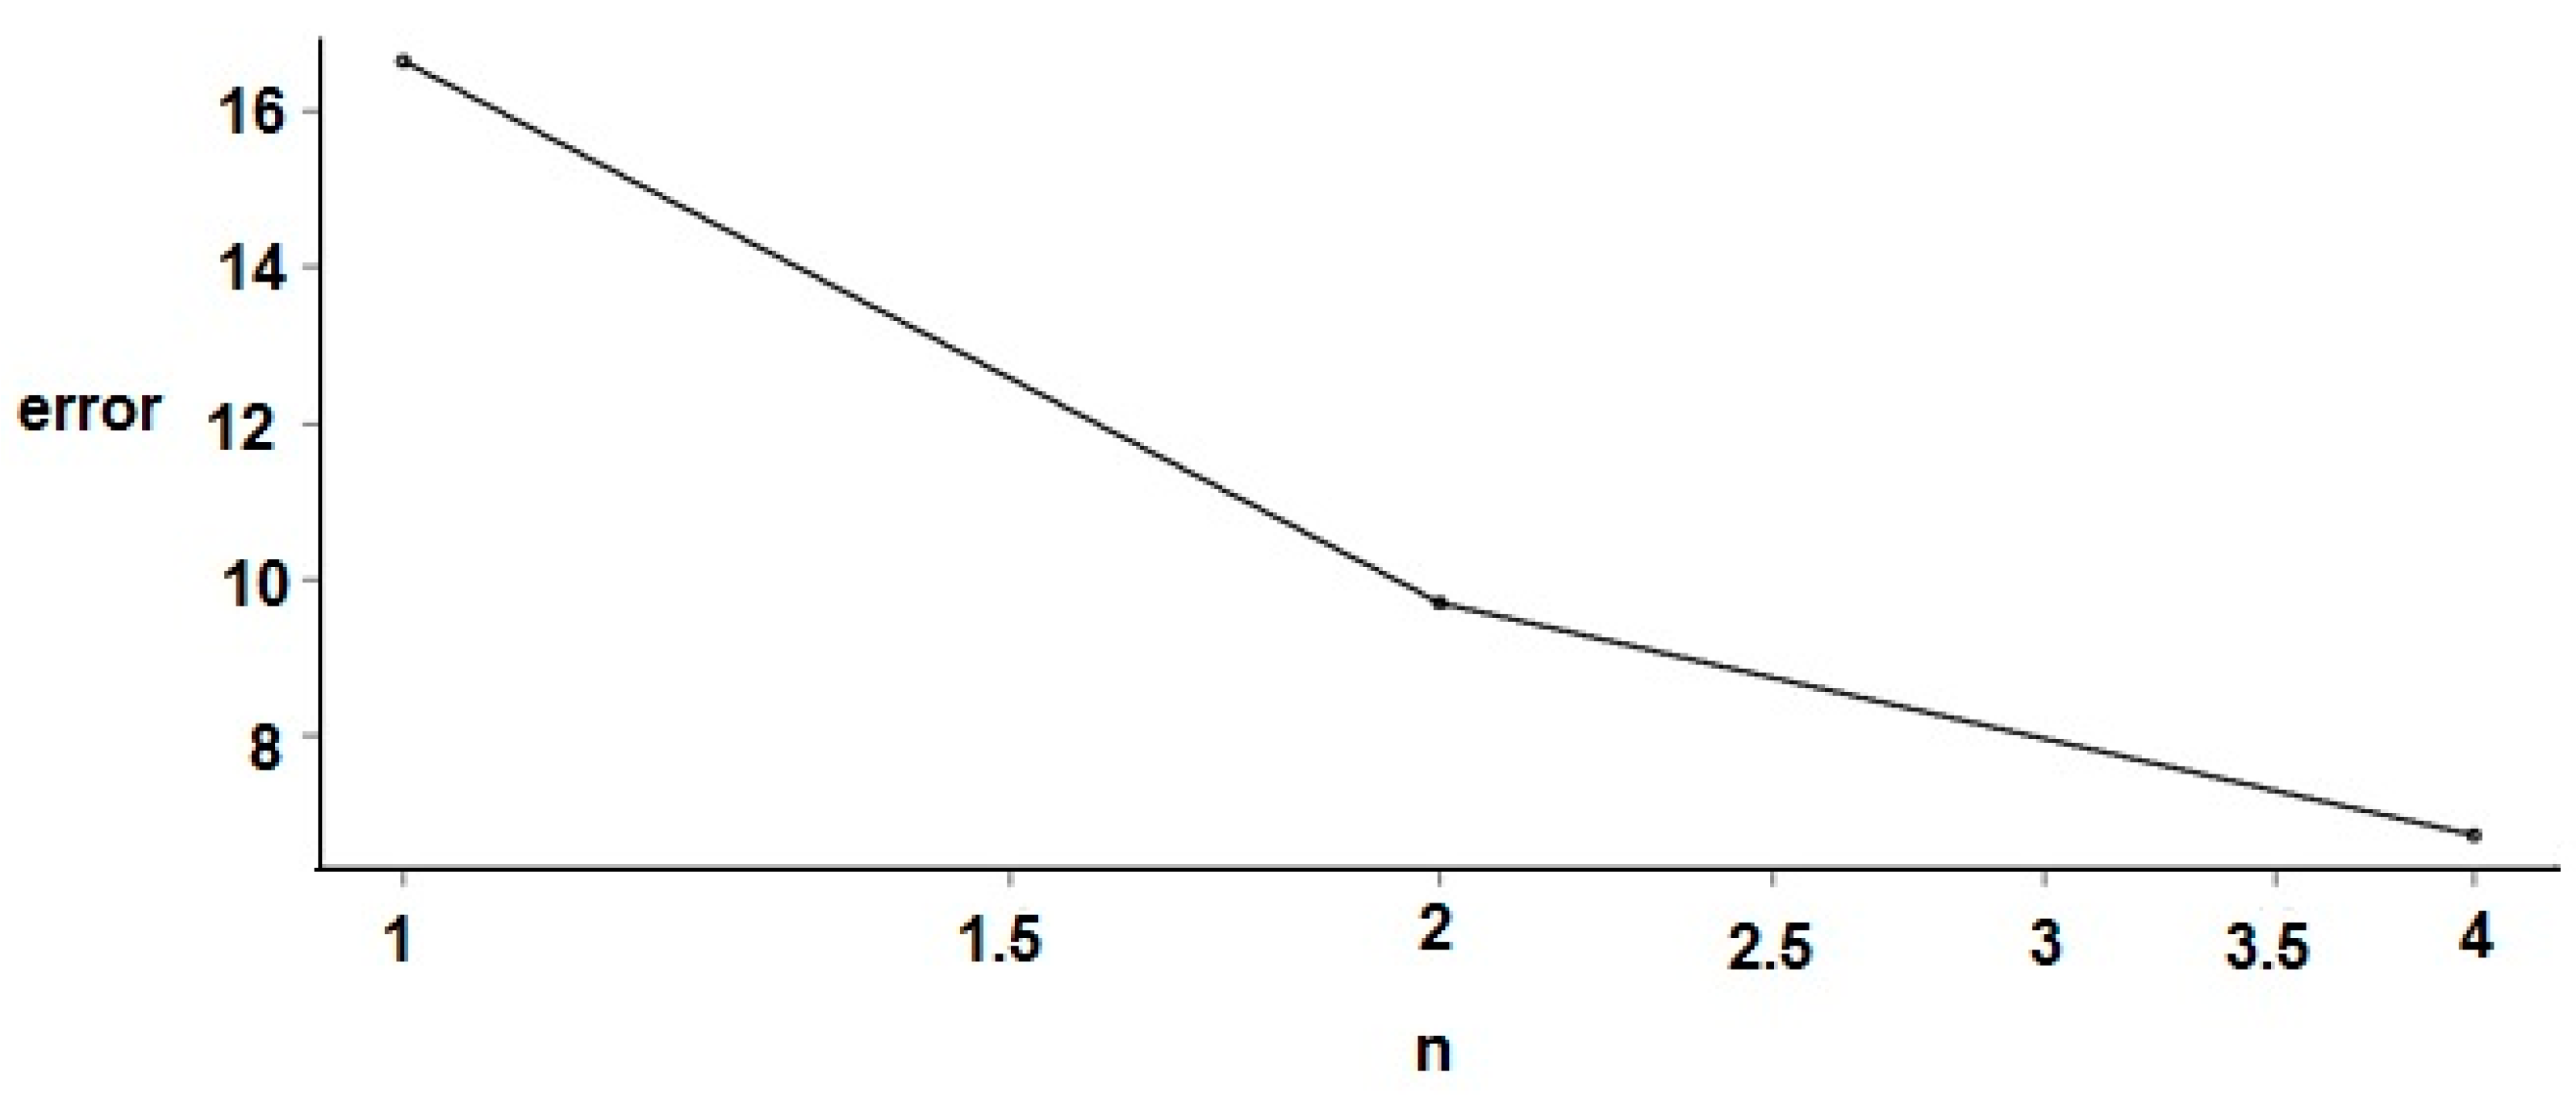
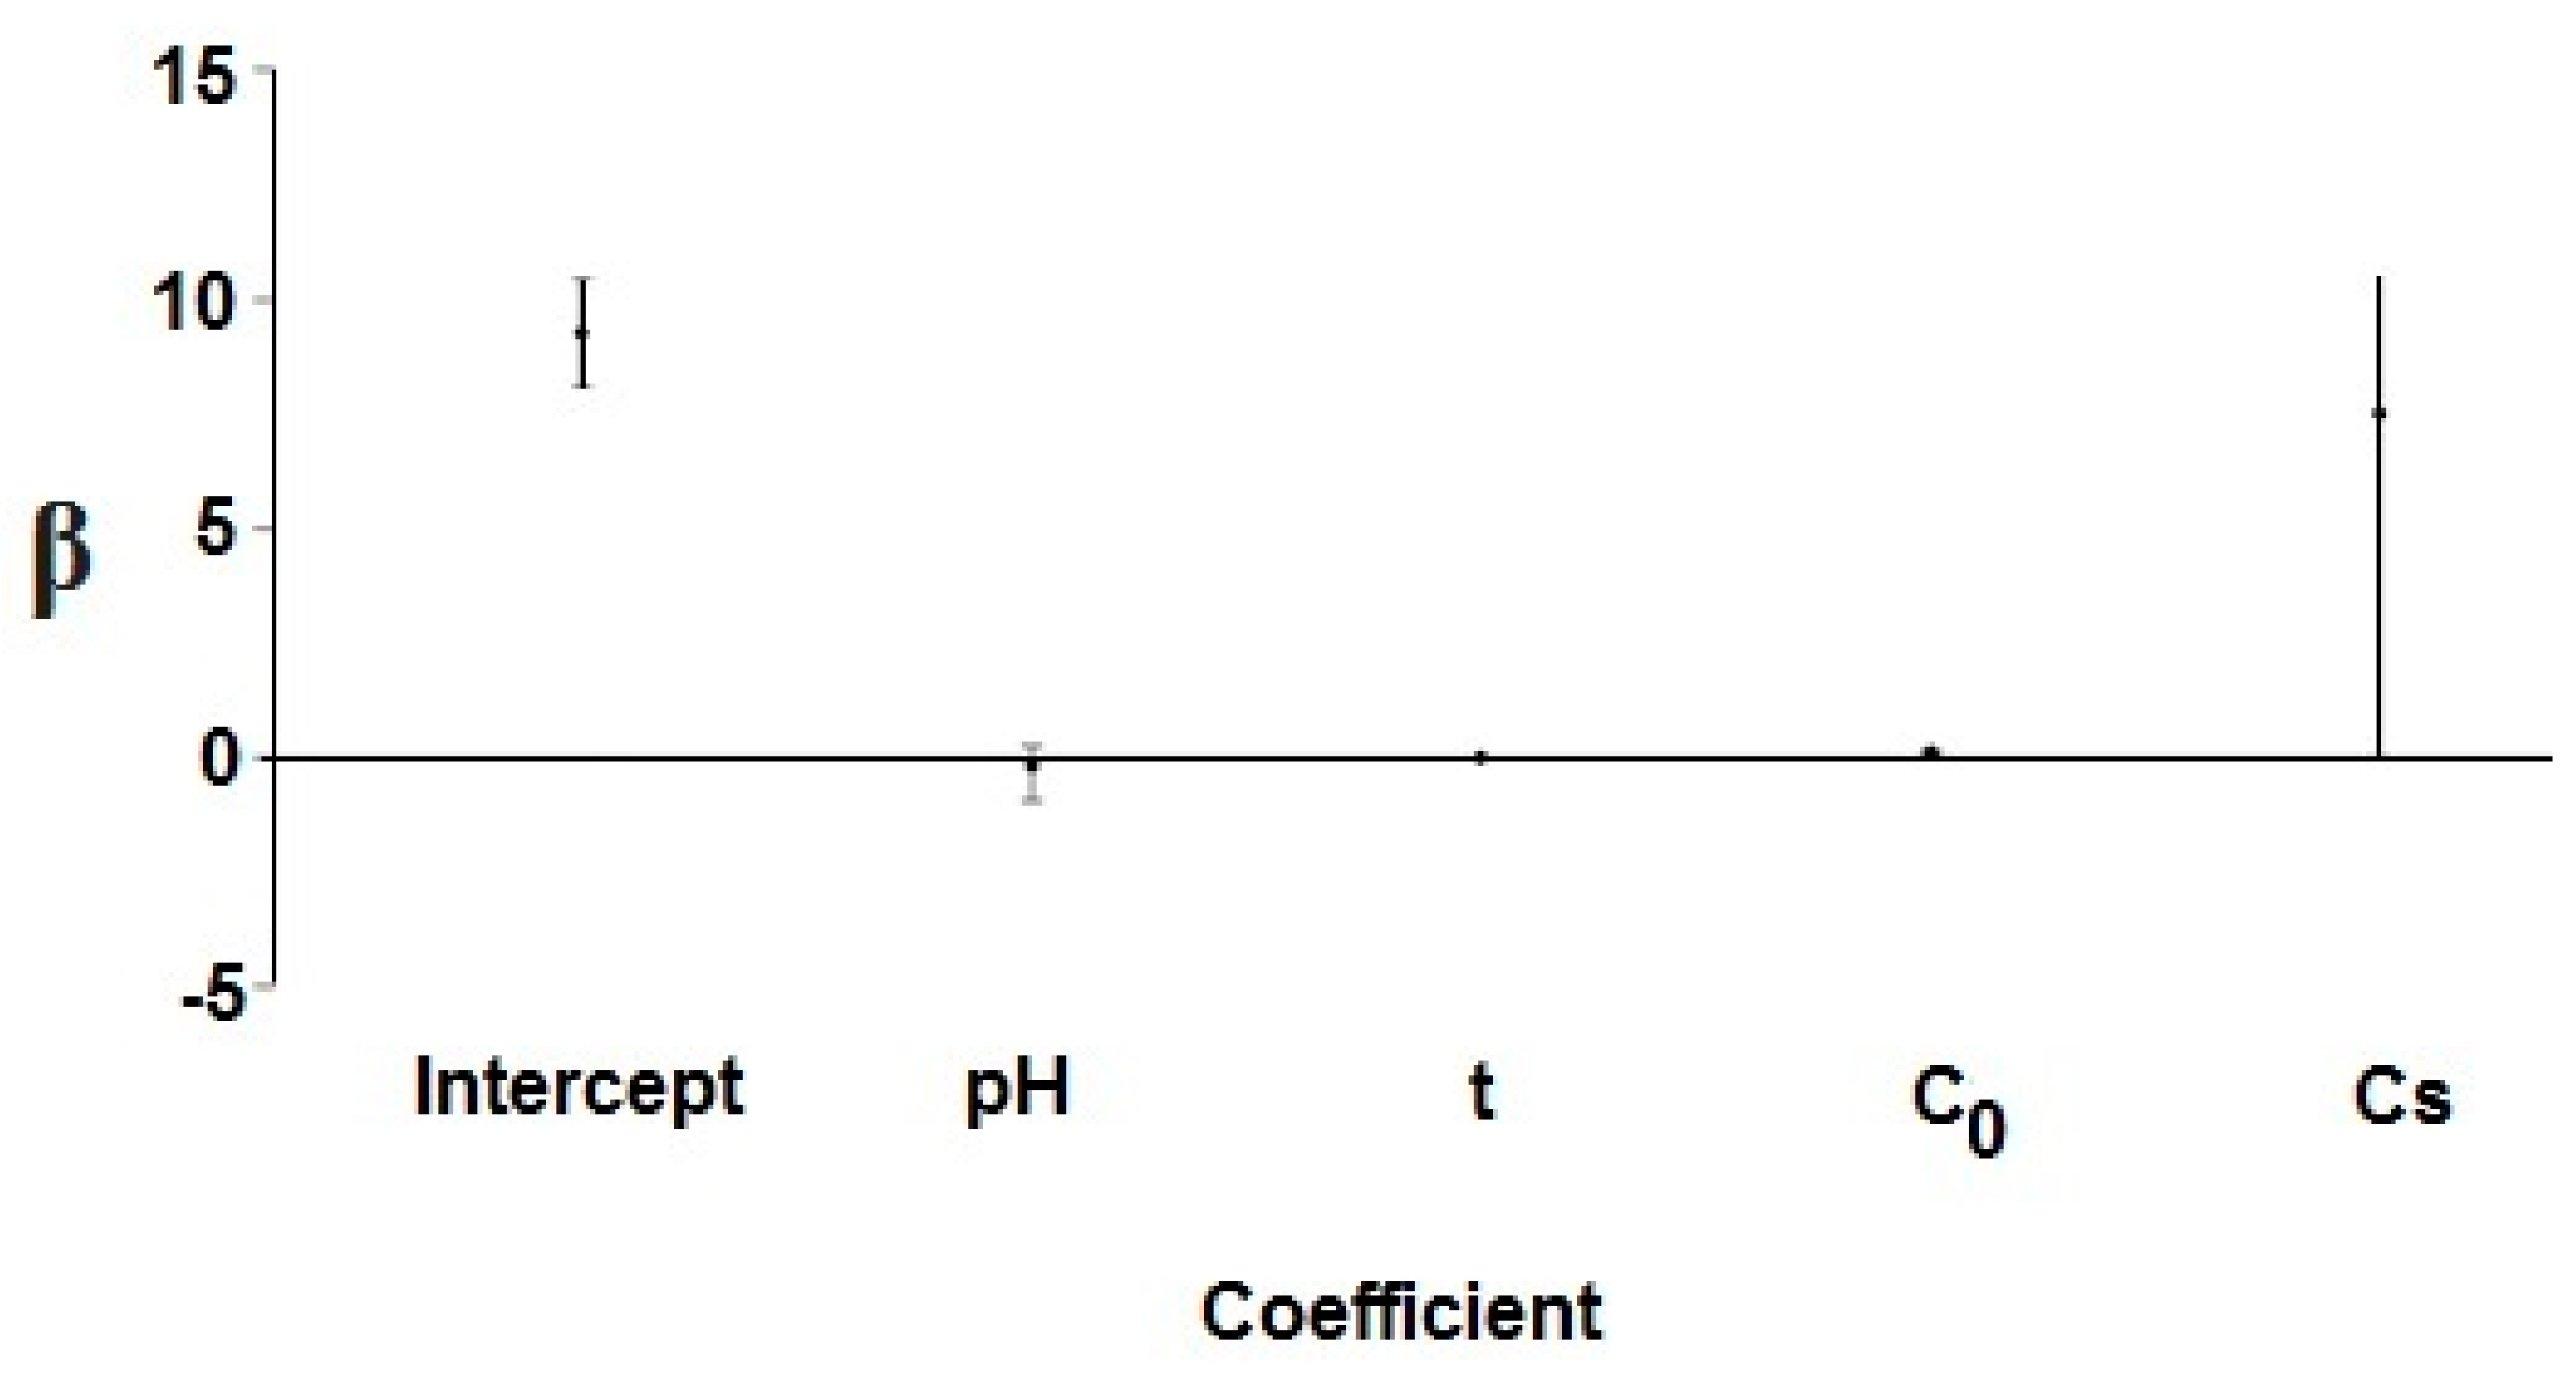
3.4. Statistical and Mathematical Modeling Results

The tree structure of the adsorption process simulated using the CART algorithm is presented in Figure 6, which shows the influence of independent variables (reaction time, initial caffeine concentration, adsorbent dose, and initial solution pH) on the dependent variable of uptake capacity (q). The CART algorithm has five nodes, and the last three nodes reveal a numerical quantity as an output (Mu), which represents the mean adsorption capacity of RHAC related to the information of that branch of the tree. Based on these results, the most effective parameter in determining the uptake capacity of RHAC adsorbent to eliminate caffeine from an aqueous media is the adsorbent dosage. In the first node, the adsorbent dose parameter was selected as the most significant attribute to create a branch, which indicates this variable’s effect on the adsorption capacity. The mean adsorption capacity in all 31 data sets is 8.83 mg g−1, but at the adsorbent dose greater and less than 0.37 g, it is 7.50 and 28.11 mg g−1, respectively. According to the uptake capacity equation, the lower the adsorbent dosage, the smaller the denominator, which increases the adsorption capacity [11]. In node 3, the contact time is divided into values greater and less than 37.5 min. The comparison of the mean adsorption capacity in nodes 4 and 5 shows that the contact time increases, and subsequently the caffeine uptake capacity also increases.
Figure 7 also confirms these results, so the order of the most effective parameters on the uptake capacity of RHAC is dose, reaction time, initial caffeine concentration (C0), and pH. The effect of reaction time and initial caffeine concentration on the uptake capacity is the same, but as shown in Figure 6, after the adsorbent dose, the contact time has the most significant effect on q. The RFR outputs in Figure 8 and Table 3 show that the adsorption capacity is more sensitive to C0, followed by t, pH, and (Cs) according to the percent increase of mean squared error index. Moreover, the increased node purity index categorized the factors as C0 >> time > Cs > pH.
To specify the priority of parameters according to both indices, their average rank was illustrated in Table 4. Based on these results, C0 has the most effects on q, while time, dose (Cs), and pH are in the later ranks that the latter two are equally effective. Commonly, the RFR procedure demonstrates that C0 and time factors were the most efficient forecasters of q, and Figure 9 proves this result. The R2 of the RFR method forecast ability was acquired at 99.08%, which signifies the adequacy of this model. Afterward, the uptake capacity sensitivity to each of the factors was studied by applying the simultaneous impacts of other factors. The obtained results represented in Figure 10 demonstrate that raising the pH leads to enhancing the adsorption capacity up to pH = 7 and then decreasing. The q increases with a mild slope from pH = 2 to about 3.8, then increases sharply to pH = 7 and finally decreases in the alkaline pH range. Therefore, the optimum amount of pH to acquire the maximum q is 7. The dominant neutral form of caffeine at acidic conditions (pH < pKa = 8.3) and positive charge of RHAC surface (pH < pHzpc = 7.8) reveal the performance of the non-electrostatic force including hydrogen bonding. Adsorption mitigation at the alkaline range is related to the repulsive electrostatic interactions between negatively charged RHAC surface and the anionic form of caffeine, as well as competition between the caffeine molecules and hydroxyl ions for binding to vacant sites [32].
The caffeine reduction using RHAC can be distinguished into three stages; (i) stage one: the relatively fast adsorption process at the initial stage of up to 40 min, (ii) stage two: a maximum adsorption capacity happened between 40 to 60, and (iii) stage three: the caffeine adsorption approaches equilibrium after 90 min. The uptake capacity of caffeine increases when the initial concentration is enhanced. This phenomenon might be explained by the increase in the mass transfer driving force as well as diffusion coefficient of caffeine molecules toward the RHAC pores at a higher concentration gradient [45].
Enhancing the RHAC dosage resulted in increasing the uptake capacity of caffeine due to the enhancement of the RHAC particles in the solution, resulting in the increase in active surface sites to receive the pollutant molecules [14].
Summary outputs of BMLR in Table 5 reveal that the importance of factors at uptake capacity attainment based on posterior probability is as C0 = 99.86%, Cs = 90.95%, time = 75.79%, and pH = 45.00%. Similar to RFR outputs, this technique also denotes that C0 is the most effective predictor of q. According to the PostProbs row in Table 5, model 1, which bodes on the validness of all factors, has the greatest abundance percent (37.52%). Moreover, model 2, which bodes on the validness of time, C0, and Cs factors, has an abundance percent of 33.63%. The other models owning less abundance percent display that extenuating the number of the parameters leads to model accuracy decrement, as model 5 boding on the effectiveness of only C0 (the most important predictor) has the least abundance percent (3.88%).
The coefficients and upper and lower limits of the effective factors fitted by BMLR are represented in Table 6. So, the acquired BMLR model can be stated as:
q ^ = 9.25 0.14 p H + 0.006 t i m e + 0.12 C 0 + 7.53 C s
If 7 < pH < 10.3; 1 min < t < 90 min; and 0.1 g < Cs < 1 g.
According to this equation, contact time, initial concentration of pollutant, and adsorbent dosage have a positive effect on adsorption capacity, while pH has a negative effect. Figure 11 shows the β values and upper and lower limits of the coefficients related to each of the effective parameters. Finally, the coefficient of determination (R2) for the prediction capability of the BMLR model obtained 99.27%, which bodes on the adequacy of the BMLR model.
The results of different parameters’ importance on adsorption capacity investigated by multiple linear regression (MLR) are tabulated in Table 7. The adsorption capacity was the response parameter, and the other parameters were continuous predictor variables. Based on these results, only the effects of C0 and Cs are significant in adsorption capacity. Both of the significant parameters have a positive effect on q. Additionally, based on the significance level, the initial concentration of pollution is the most significant parameter affecting the adsorption capacity. Therefore, the obtained equation of the MLR model was presented as:
q ^ = 2.80 0.32   p H + 0.01   t + 0.12   C 0 + 8.21   C s
If 7 < pH < 10.3; 1 min < t < 90 min; and 0.1 g < Cs < 1 g.
Based on the final model, the input factors of t, C0, and Cs have a positive effect on uptake capacity, of which the latter two factors are significant. On the other hand, pH has a negative impact on adsorption capacity. The R2 value for the estimation capability of the MLR model was determined at 63.30%.
The significant independent parameters impacting on RHAC adsorption capacity was determined by lasso regression. The fitted equation acquired is represented as:
q ^ = 2.14 + 0.0055   t + 0.0999   C 0 + 5.87   C s
It was observed from Equation (14) that the adsorbent dose and caffeine initial concentration followed by contact time were the most significant variables influencing adsorption capacity. That means these variables always have a positive impact on the RHAC adsorption capacity in eliminating caffeine.
Eventually, the coefficient of determination (R2) for the prediction capability of the lasso model was acquired at 91.67%. In addition, the p-value of more than 5% (0.68) revealed that the difference between observed and predicted adsorption capacity values is nonsignificant.
The ridge model, unlike the lasso model, determined all the independent parameters as significant on the adsorption capacity. The fitted equation obtained is represented as:
q ^ = 1.35 0.27   p H + 0.0075   t + 0.098   C 0 + 7.21   C s
If 7 < pH < 10.3; 1 min < t < 90 min; and 0.1 g < Cs < 1 g.
Accordingly, the Cs, C0, and contact time were the most significant variables positively influencing adsorption capacity. Meanwhile, pH, similar to other models, had a negative effect. Ultimately, the coefficient of determination (R2) for the prediction capability of the ridge model was achieved at 92.23%. Additionally, the p-value of more than 5% (0.76) indicated that the difference between observed and predicted adsorption capacity values is nonsignificant.

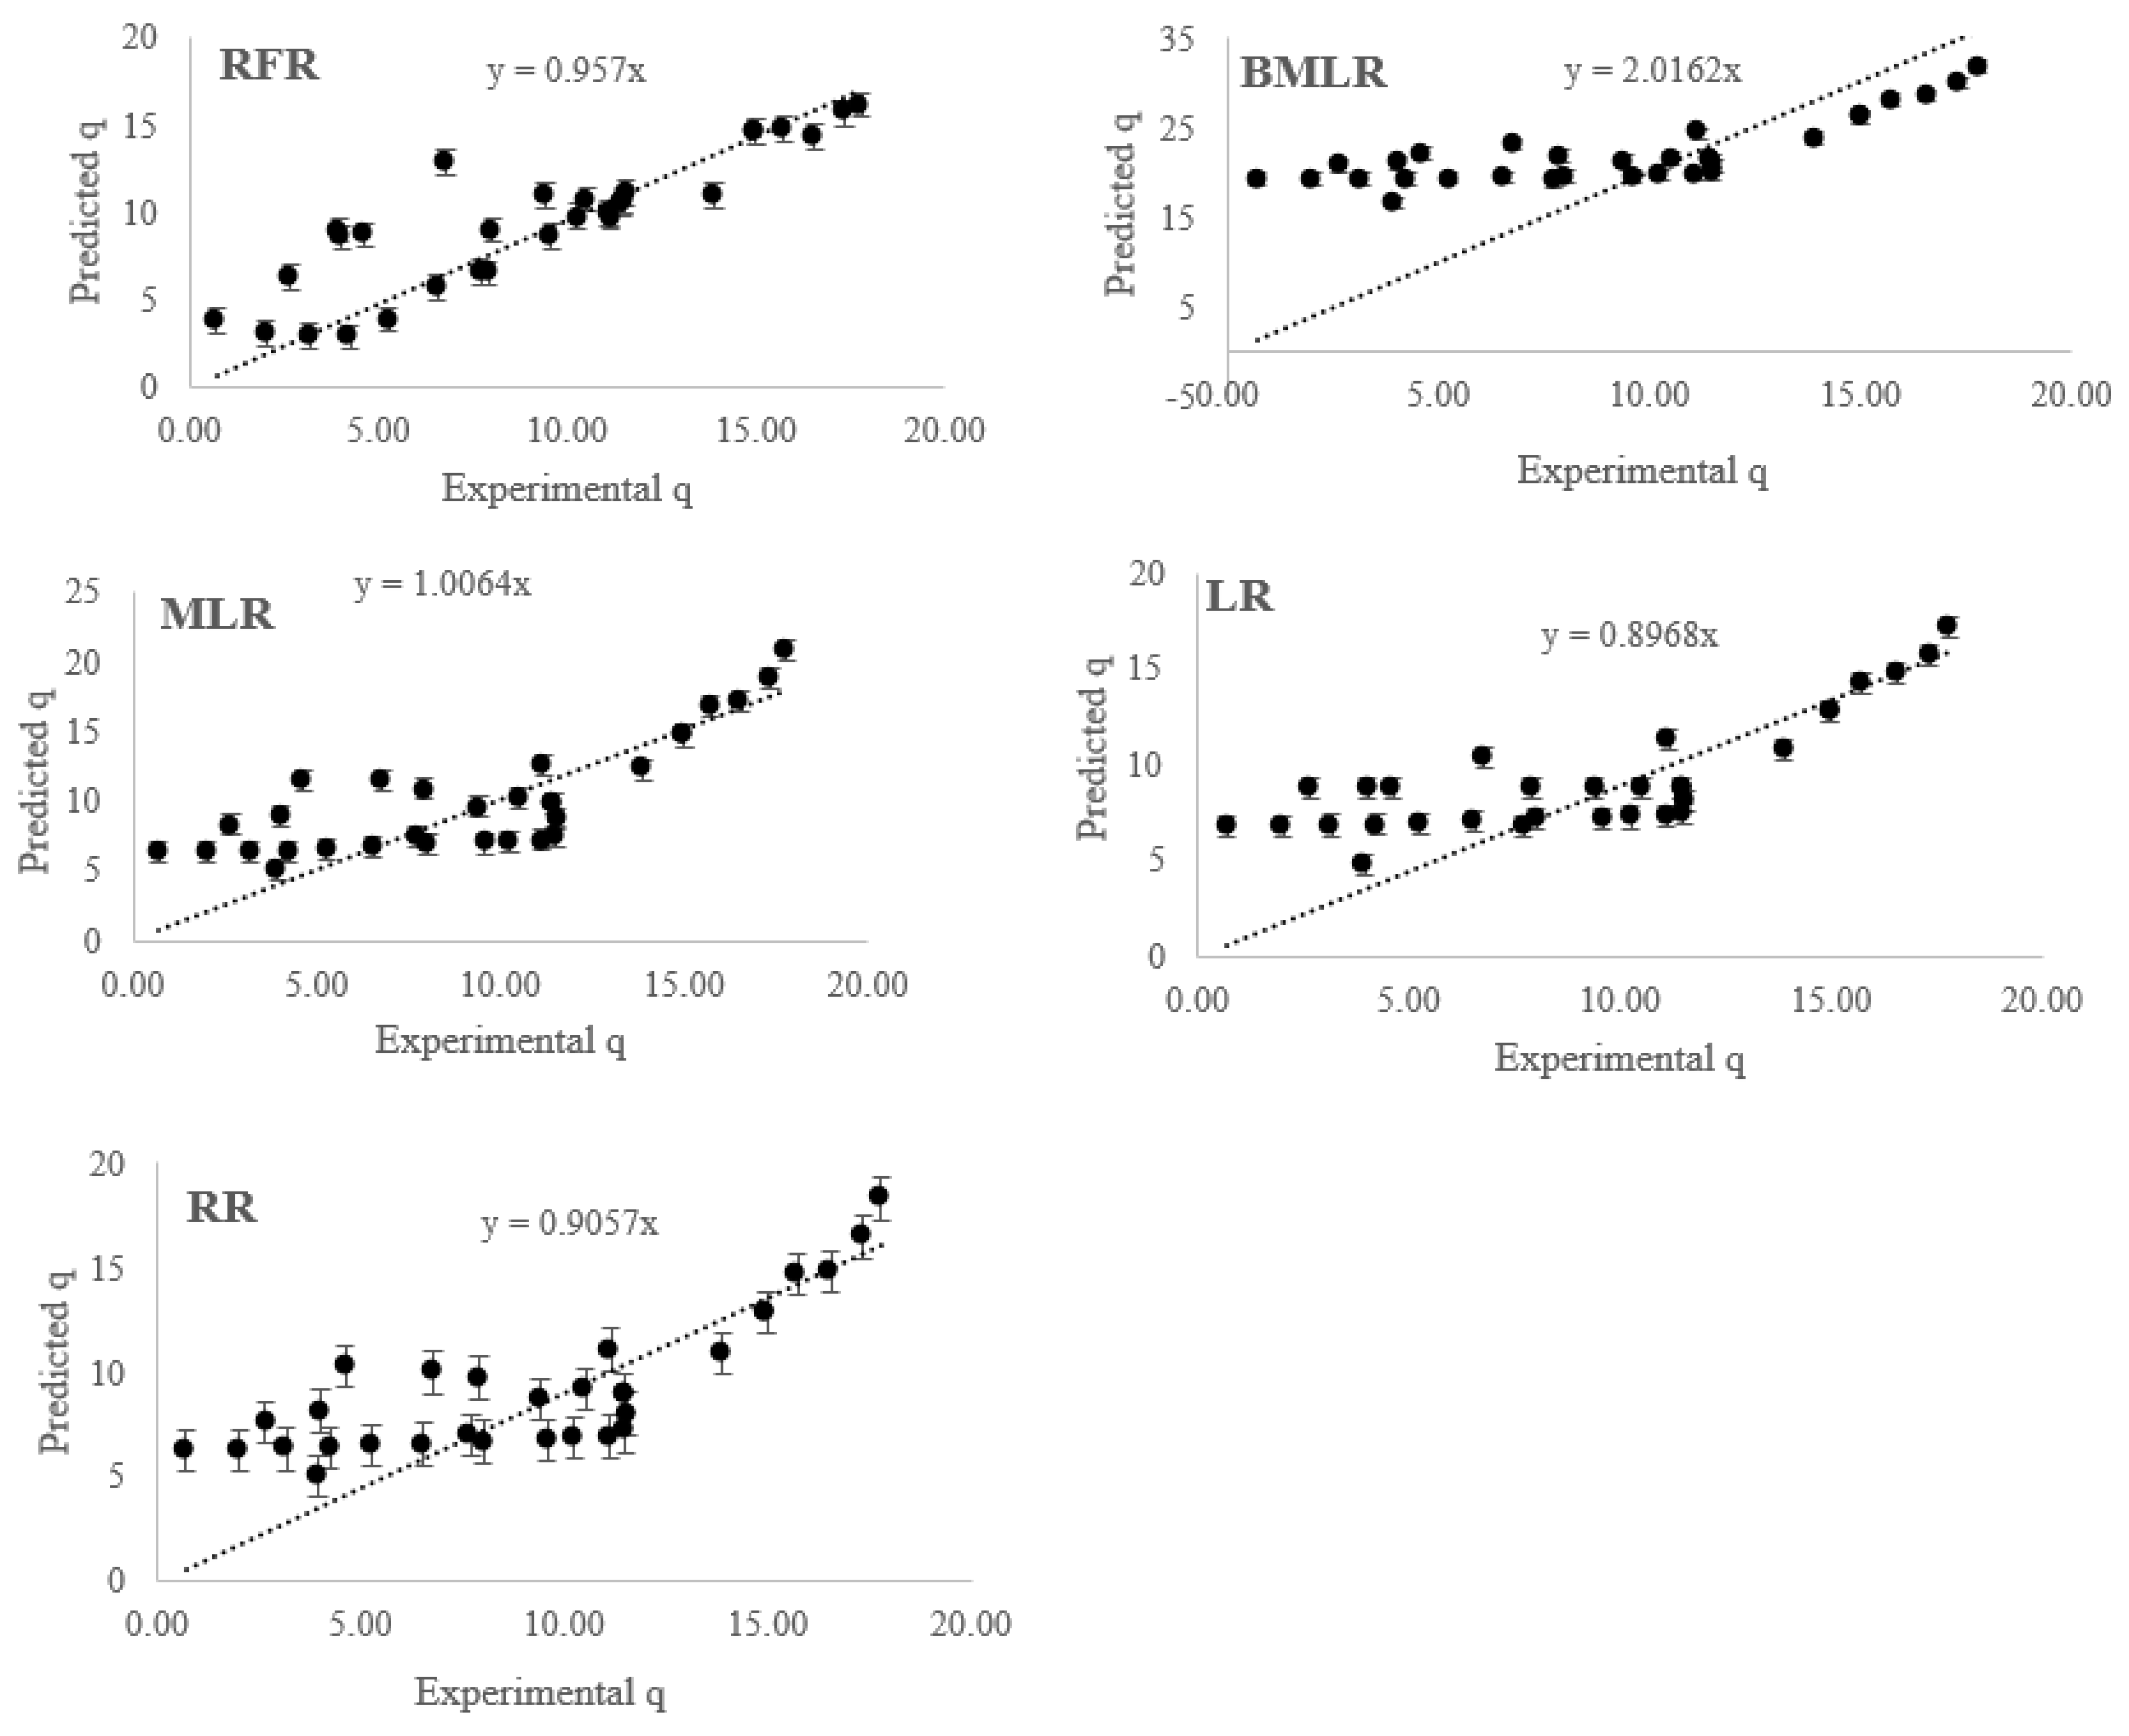
3.5. Comparison of Models

The performances of the CART, RFR, BMLR, MLR, LR, and RR models are presented in Table 8. The similarity between the predicted values and the experimental data of models is also represented in Figure 12. The RFR model exhibited the best execution with the highest determination coefficient (R2 = 0.9517) and the least error (RMSE = 2.28). Then, the RR, MLR, and LR models demonstrated better execution than the BMLR. Based on the coefficient of the 1:1 line, the MLR and RFR models forecasted the nearest values of q to experimental data, respectively. Moreover, the BMLR model overestimated the adsorption capacity values. These findings are consistent with the results of Beigzadeh et al. [32] in 2, 4-D removal modeling. Ranking the independent variables by various models demonstrated that the initial concentration of caffeine and RHAC adsorbent dose is the most effective parameter on the adsorption capacity.

3.6. Comparison with Other Adsorbents

The adsorption performance of RHAC as compared with some adsorbents recently reported for the elimination of Caffeine from wastewater is Tabulated in Table 9. According to Table 9, the adsorption capacity of RHAC is greater than other adsorbents for caffeine removal. The result reveals that the RHAC has a high potential to attenuate caffeine from the contaminated waters.

4. Conclusions

The selection of proper simulation and design models for adsorption processes is a great challenge in water quality prediction. In this regard, the performance of CART, RFR, MLR, BMLR, LR, and RR models was examined to predict the removal efficiency of caffeine by RHAC as a function of various experimental parameters. The textural properties determined by BET analysis showed an increase in the specific surface area and the average pore size of the sample. Fitting the adsorption data on pseudo-first-order kinetics and Freundlich isotherm is indicative of heterogeneous and varying pores of the RHAC, multilayer adsorption, adsorption at local sites, and no interaction between the adsorbed particles. Investigation of various parameters’ influence on caffeine adsorption by the efficient statistical and mathematical models (CART, RFR, MLR, BMLR, LR, and RR) showed that adsorbent dose and initial contamination concentration had a more significant impact on adsorbent capacity. Additionally, RFR was much more accurate in modeling the removal of caffeine compared to other techniques due to its ability to capture the non-linear relationships between operating parameters and the adsorption capacity of RHAC. It was concluded that the permanent monitoring of contaminated waters is possible with the suggested model application as an accurate and fast alternative to the experimental procedures. Moreover, the RFR model can be used instead of traditional models applied in the literature in adsorption modeling.

Author Contributions

Conceptualization, M.B. and M.J.A.; methodology, M.J.A.; data modeling, M.B. and M.R.M.; writing—original draft preparation, M.B., M.R.M. and A.Z.; writing—review and editing, M.J.A. and M.B.; supervision, M.B. and M.J.A. All authors have read and agreed to the published version of the manuscript.

Funding

This research received no external funding.

Institutional Review Board Statement

Not applicable.

Informed Consent Statement

Not applicable.

Data Availability Statement

Data are available in the paper.

Conflicts of Interest

The authors declare no conflict of interest.

References

  1. Chen, Y.H.; Huang, Y.H.; Wen, C.C.; Wang, Y.H.; Chen, W.L.; Chen, L.C.; Tsay, H.J. Movement disorder and neuromuscular change in Zebrafish embryos after exposure to caffeine. Neurotoxicol. Teratol. 2008, 30, 440–447. [Google Scholar] [CrossRef] [PubMed]
  2. Pollack, A.Z.; Louis, G.M.B.; Sundaram, R.; Lum, K.J. Caffeine consumption and miscarriage: A prospective cohort study. Fertil. Steril. 2010, 93, 304–306. [Google Scholar] [CrossRef]
  3. Glassmeyer, S.T.; Furlong, E.T.; Kolpin, D.W.; Cahill, J.D.; Zaugg, S.D.; Werner, S.L.; Meyer, M.T.; Kryak, D.D. Transport of chemical and microbial compounds from known wastewater discharges: Potential for use as indicators of human fecal contamination. Environ. Sci. Technol. 2005, 39, 5157–5169. [Google Scholar] [CrossRef]
  4. Dafouz, R.; Caceres, N.; Rodriguez-Gil, J.L.; Mastroianni, N.; de Alda, M.L.; Barcelo, D.; de Miguel, A.G.; Valcárcel, Y. Does the presence of caffeine in the marine environment represent an environmental risk? A regional and global study. Sci. Total Environ. 2018, 615, 632–642. [Google Scholar] [CrossRef]
  5. Ghecham, F.Z.; Guergazi, S.; Achour, S. Removal of caffeine by coagulation-flocculation with aluminum sulfate and effect of metal salts. LARHYSS J. 2018, 34, 115–126. [Google Scholar]
  6. Muthukumar, H.; Shanmugam, M.K.; Dash, S.S.; Gummadi, S.N. Comparison of Biological and Physicochemical Techniques for Treatment of Coffee Wastewater—A Comprehensive Review. In Biological Treatment of Industrial Wastewater; Shah, M.P., Ed.; Royal Society of Chemistry: London, UK, 2021; pp. 391–409. [Google Scholar]
  7. Jamil, S.; Loganathan, P.; Kandasamy, J.; Listowski, A.; McDonald, J.A.; Khan, S.J.; Vigneswaran, S. Removal of organic matter from wastewater reverse osmosis concentrate using granular activated carbon and anion exchange resin adsorbent columns in sequence. Chemosphere 2020, 261, 127549. [Google Scholar] [CrossRef] [PubMed]
  8. Raj, R.; Tripathi, A.; Das, S.; Ghangrekar, M.M. Removal of caffeine from wastewater using electrochemical advanced oxidation process: A mini review. CSCEE 2021, 4, 100129. [Google Scholar] [CrossRef]
  9. Bahrami, M.; Amiri, M.J.; Koochaki, S. Removal of caffeine from aqueous solution using multi-wall carbon nanotubes: Kinetic, isotherm, and thermodynamics studies. Pollution 2017, 3, 539–552. [Google Scholar]
  10. Bahrami, M.; Amiri, M.J.; Mahmoudi, M.R.; Koochaki, S. Modeling caffeine adsorption by multi-walled carbon nanotubes using multiple polynomial regression with interaction effects. J. Water Health 2017, 15, 526–535. [Google Scholar] [CrossRef]
  11. Rossi, M.M.; Matturro, B.; Amanat, N.; Rossetti, S.; Petrangeli Papini, M. Coupled Adsorption and Biodegradation of Trichloroethylene on Biochar from Pine Wood Wastes: A Combined Approach for a Sustainable Bioremediation Strategy. Microorganisms 2022, 10, 101. [Google Scholar] [CrossRef]
  12. Chwastowski, J.; Staroń, P.; Pięta, E.; Paluszkiewicz, C. Bioremediation of Crystal Violet by Organic Matter and Assessment of Antimicrobial Properties of the Obtained Product. Sustainability 2023, 15, 67. [Google Scholar] [CrossRef]
  13. Li, L.; Zou, J.; Han, Y.; Liao, Z.; Lu, P.; Nezamzadeh-Ejhieh, A.; Liu, J.; Peng, Y. Recent advances in Al(iii)/In(iii)-based MOFs for the detection of pollutants. New J. Chem. 2022, 46, 19577–19592. [Google Scholar] [CrossRef]
  14. Amiri, M.J.; Bahrami, M.; Beigzadeh, B.; Gil, A. A response surface methodology for optimization of 2, 4-dichlorophenoxyacetic acid removal from synthetic and drainage water: A comparative study. Environ. Sci. Pollut. Res. 2018, 25, 34277–34293. [Google Scholar] [CrossRef]
  15. Zheng, M.; Chen, J.; Zhang, L.; Cheng, Y.; Lu, C.; Liu, Y.; Singh, A.; Trivedi, M.; Kumar, A.; Liu, J. Metal organic frameworks as efficient adsorbents for drugs from wastewater. Mater. Today Commun. 2022, 31, 103514. [Google Scholar] [CrossRef]
  16. Pan, Y.; Rao, C.; Tan, X.; Ling, Y.; Singh, A.; Kumar, A.; Li, B.; Liu, J. Cobalt-seamed C-methylpyrogallol[4]arene nanocapsules-derived magnetic carbon cubes as advanced adsorbent toward drug contaminant removal. Chem. Eng. J. 2022, 433, 133857. [Google Scholar] [CrossRef]
  17. Zhong, Y.; Chen, C.; Liu, S.; Lu, C.; Liu, D.; Pan, Y.; Sakiyama, H.; Muddassir, M.; Liu, J. A new magnetic adsorbent of eggshell-zeolitic imidazolate framework for highly efficient removal of norfloxacin. Dalton Trans. 2021, 50, 18016–18026. [Google Scholar] [CrossRef] [PubMed]
  18. Menya, E.; Olupot, P.W.; Storz, H.; Lubwama, M.; Kiros, Y. Synthesis and evaluation of activated carbon from rice husks for removal of humic acid from water. Biomass Convers. Biorefin. 2022, 12, 3229–3248. [Google Scholar] [CrossRef]
  19. de Souza, C.C.; de Souza, L.Z.M.; Yılmaz, M.; de Oliveira, M.A.; da Silva Bezerra, A.C.; da Silva, E.F.; Machado, A.R.T. Activated carbon of Coriandrum sativum for adsorption of methylene blue: Equilibrium and kinetic modeling. Clean. Mater. 2022, 3, 100052. [Google Scholar] [CrossRef]
  20. Jjagwe, J.; Olupot, P.W.; Menya, E.; Kalibbala, H.M. Synthesis and application of Granular activated carbon from biomass waste materials for water treatment: A review. J. Bioresour. Bioprod. 2021, 6, 292–322. [Google Scholar] [CrossRef]
  21. Ricciardi, P.; Cillari, G.; Carnevale Miino, M.; Collivignarelli, M.C. Valorization of agro-industry residues in the building and environmental sector: A review. Waste Manag. Res. 2020, 38, 487–513. [Google Scholar] [CrossRef]
  22. Bushra, R.; Mohamad, S.; Alias, Y.; Jin, Y.; Ahmad, M. Current approaches and methodologies to explore the perceptive adsorption mechanism of dyes on low-cost agricultural waste: A review. Microporous Mesoporous Mater. 2021, 319, 111040. [Google Scholar] [CrossRef]
  23. Hidayat, N.; Suhartini, S.; Arinda, T.; Elviliana, E.; Melville, L. Literature review on ability of agricultural crop residues and agro-in-dustrial waste for treatment of wastewater. IJROWA 2022, 11, 553–585. [Google Scholar]
  24. Bahrami, M.; Amiri, M.J. Nitrate removal from contaminated waters using modified rice husk ash by Hexadecyltrimethylammonium bromide surfactant. React. Kinet. Mech. Catal. 2022, 135, 459–478. [Google Scholar] [CrossRef]
  25. Shukla, N.; Sahoo, D.; Remya, N. Biochar from microwave pyrolysis of rice husk for tertiary wastewater treatment and soil nourishment. J. Clean. Prod. 2019, 235, 1073–1079. [Google Scholar] [CrossRef]
  26. Ghosh, G.C.; Samina, Z.; Chakraborty, T.K. Adsorptive removal of Cr (VI) from aqueous solution using rice husk and rice husk ash. Desalin. Water Treat. 2018, 130, 151–160. [Google Scholar] [CrossRef]
  27. Scapin, E.; Maciel, G.P.S.; Polidoro, A.S.; Lazzari, E.; Jacques, R. Activated carbon from rice husk biochar with high surface area. Biointerface Res. Appl. Chem. 2020, 11, 10265–10277. [Google Scholar]
  28. Danish, M.; Birnbach, J.; Ibrahim, M.M.; Hashim, R.; Majeed, S.; Tay, G.S.; Sapawe, N. Optimization study of caffeine adsorption onto large surface area wood activated carbon through central composite design approach. Environ. Nanotechnol. Monit. Manag. 2021, 16, 100594. [Google Scholar] [CrossRef]
  29. Elewa, A.M.; Amer, A.A.; Attallah, M.F.; Gad, H.A.; Al-Ahmed, Z.A.M.; Ahmed, I.A. Chemically Activated Carbon Based on Biomass for Adsorption of Fe (III) and Mn (II) Ions from Aqueous Solution. Materials 2023, 16, 1251. [Google Scholar] [CrossRef] [PubMed]
  30. Amiri, M.J.; Roohi, R.; Gil, A. Numerical simulation of Cd(II) removal by ostrich bone ash supported nanoscale zero-valent iron in a fixed-bed column system: Utilization of unsteady advection-dispersion-adsorption equation. J. Water Process Eng. 2018, 25, 1–14. [Google Scholar] [CrossRef]
  31. Amiri, M.J.; Abedi-Koupai, J.; Jalali, S.M.J.; Mousavi, S.F. Modeling of fixed-bed column system of Hg (II) ions on ostrich bone ash/nZVI composite by artificial neural network. J. Environ. Eng. ASCE 2017, 143, 04017061. [Google Scholar] [CrossRef]
  32. Beigzadeh, B.; Bahrami, M.; Amiri, M.J.; Mahmoudi, M.R. A new approach in adsorption modeling using random forest regression, Bayesian multiple linear regression, and multiple linear regression: 2, 4-D adsorption by a green adsorbent. Water Sci. Technol. 2020, 82, 1586–1602. [Google Scholar] [CrossRef]
  33. Shoba, G.; Shobha, G. Water Quality prediction using data mining techniques: A survey. Int. J. Eng. Comput. Sci. 2017, 3, 6299–6306. [Google Scholar]
  34. Soleimanpour, S.M.; Mesbah, S.H.; Hedayati, B. Application of CART decision tree data mining to determine the most effective drinking water quality factors (case study: Kazeroon plain, Fars province). Iran. J. Health Environ. 2018, 11, 1–14. [Google Scholar]
  35. Bedoui, A.; Lazar, N.A. Bayesian empirical likelihood for ridge and lasso regressions. Comput. Stat. Data Anal. 2020, 145, 106917. [Google Scholar] [CrossRef]
  36. Loh, W.Y. Classification and regression trees. Wiley Interdiscip. Rev. Data Min. Knowl. Discov. 2011, 1, 14–23. [Google Scholar] [CrossRef]
  37. Gordon, L. Using classification and regression trees (CART) in SAS® enterprise miner TM for applications in public health. Public Health 2013, 089, 1–8. [Google Scholar]
  38. Sharma, H.; Kumar, S. A survey on decision tree algorithms of classification in data mining. Int. J. Sci. Res. 2016, 5, 2094–2097. [Google Scholar]
  39. Rostamian, R.; Heidarpour, M.; Mousavi, S.F.; Afyuni, M. Removal of calcium and magnesium by activated carbons produced from agricultural wastes. Adv. Environ. Biol. 2014, 8, 202–208. [Google Scholar]
  40. Couto, O.M., Jr.; Matos, I.; da Fonseca, I.M.; Arroyo, P.A.; da Silva, E.A.; de Barros, M.A.S.D. Effect of solution pH and influence of water hardness on caffeine adsorption onto activated carbons. Can. J. Chem. Eng. 2015, 93, 68–77. [Google Scholar] [CrossRef]
  41. Mestre, A.S.; Bexiga, A.S.; Proença, M.; Andrade, M.; Pinto, M.L.; Matos, I.; Fonseca, I.M.; Carvalho, A.P. Activated carbons from sisal waste by chemical activation with K2CO3: Kinetics of paracetamol and ibuprofen removal from aqueous solution. Bioresour. Technol. 2011, 102, 8253–8260. [Google Scholar] [CrossRef]
  42. Moreno-Castilla, C. Adsorption of organic molecules from aqueous solutions on carbon materials. Carbon 2004, 42, 83–94. [Google Scholar] [CrossRef]
  43. Alghamdi, A.A.; Al-Odayni, A.B.; Saeed, W.S.; Al-Kahtani, A.; Alharthi, F.A.; Aouak, T. Efficient adsorption of lead (II) from aqueous phase solutions using polypyrrole-based activated carbon. Materials 2019, 12, 2020. [Google Scholar] [CrossRef] [PubMed]
  44. Kuang, Y.; Zhang, X.; Zhou, S. Adsorption of methylene blue in water onto activated carbon by surfactant modification. Water 2020, 12, 587. [Google Scholar] [CrossRef]
  45. Girish, C.R.; Murty, V.R. Mass transfer studies on adsorption of phenol from wastewater using Lantana camara, forest waste. Int. J. Chem. Eng. 2016, 2016, 5809505. [Google Scholar] [CrossRef]
  46. Oliveira, E.N.; Meneses, A.T.; de Melo, S.F.; Dias, F.M.R.; Perazzini, M.T.B.; Perazzini, H.; Meili, L.; Soletti, J.I.; Carvalho, S.H.V.; Bispo, M.D. Highly effective adsorption of caffeine by a novel activated carbon prepared from coconut leaf. Environ. Sci. Pollut. Res. 2022, 29, 50661–50674. [Google Scholar] [CrossRef]
  47. Correa-Navarro, Y.M.; Giraldo, L.; Moreno-Piraján, J.C. Dataset for effect of pH on caffeine and diclofenac adsorption from aqueous solution onto fique bagasse biochars. Data Brief 2019, 25, 104111. [Google Scholar] [CrossRef]
  48. Carabineiro, S.A.C.; Thavorn-Amornsri, T.; Pereira, M.F.R.; Figueiredo, J.L. Adsorption of ciprofloxacin on surface-modified carbon materials. Water Res. 2011, 45, 4583–4591. [Google Scholar] [CrossRef]
  49. Sotelo, J.L.; Ovejero, G.; Rodríguez, A.; Álvarez, S.; García, J. Study of natural clay adsorbent sepiolite for the removal of caffeine from aqueous solutions: Batch and fixed-bed column operation. Water Air Soil Pollut. 2013, 224, 1466. [Google Scholar] [CrossRef]
Figure 1. Zeta potential of the sample.
Sustainability 15 07366 g001
Figure 2. Effect of pH on caffeine uptake by activated carbon of rice husk (caffeine initial concentration: 60 mg/L, adsorbent dose: 0.5 g, contact time: 360 min, temperature: 25 °C).
Sustainability 15 07366 g002
Figure 3. The influence of reaction time on caffeine uptake by rice husk-derived activated carbon (caffeine initial concentration: 60 mg/L, adsorbent dosage: 0.5 g, pH = 7, temperature: 25 °C).
Sustainability 15 07366 g003
Figure 4. Effect of caffeine initial concentration on caffeine uptake by activated carbon of rice husk (adsorbent dose: 0.5 g, contact time: 360 min, pH = 7, temperature: 25 °C).
Sustainability 15 07366 g004
Figure 5. Effect of activated carbon of rice husk adsorbent dose on caffeine adsorption (initial concentration of caffeine: 100 mg/L, contact time: 360 min, pH = 7, temperature: 25 °C).
Sustainability 15 07366 g005
Figure 6. Tree structure for estimating the amount of adsorption by CART model.
Sustainability 15 07366 g006
Figure 7. Importance of independent variables on adsorption capacity in CART model.
Sustainability 15 07366 g007
Figure 8. Variable importance measured by RFR.
Sustainability 15 07366 g008
Figure 9. Number of the most important factors in estimating q.
Sustainability 15 07366 g009
Figure 10. Sensitivity analysis of effective parameters on adsorption capacity by RFR.
Sustainability 15 07366 g010
Figure 11. Limits of the β amounts related to each of the effective factors.
Sustainability 15 07366 g011
Figure 12. Scatter plot between the estimated output and the experimental data of the RFR, BMLR, MLR, LR, and RR models.
Sustainability 15 07366 g012
Table 1. Kinetic and isotherm equations applied in this research.
ModelEquationParameter and Dimension
Kinetic models
PFO q t = q e ( 1 e K f t ) Kf (1/min)
qe (mg/g)
PSO q t = K s q e 2 t 1 + q e K s t Ks (mg/g min)
qe (mg/g)
Elovich q t = ( 1 β ) ln ( α β ) + ( 1 β ) ln t α (mg g−1 min−1)
β (g mg−1)
FP q t = a t b a (mg g−1)
Isotherm models b (h−1)
Langmuir q e = b q m C e 1 + b C e qm (mg/g)
b (L/mg)
Freundlich q e = K F C e 1 n KF (mg/g)(mg/L)−n
n: model exponent (–)
R-P q e = k R C e 1 + α C e β kR (L g−1)
α (L mg−1)β
β (-)
Table 2. The results of the kinetic and isotherm models.
ModelParametersR2RMSE
Kinetic models
PFOKf = 0.023 1/min
qe = 11.77 mg/g
99.410.63
PSOKs = 0.002 mg/g min
qe = 13.58 mg/g
99.160.76
Elovichα = 0.75 mg g−1 min−1
β = 0.34 g mg−1
98.451.02
FPa = 2.06 mg g−1
b = 0.32 h−1
97.011.42
Isotherm models
Langmuirqm = 239.67 mg/g
b = 0.002 L/mg
99.683.31
FreundlichKF = 0.76 (mg/g)(mg/L)−n
n = 1.11
99.740.96
R-PkR = 0.71 L g−1
α = 0.08 (L mg−1) β
β = 0.38
99.720.99
Table 3. Sensitivity of RFR to input data.
Factor%IncMSEIncNodePurity
pH18.8878.88
time29.13168.54
C030.45306.22
Dose (Cs)10.6692.09
Table 4. Ranking of parameters in estimating q.
ParameterI1I2Mean Rank
C0111
time222
pH343.5
Dose (Cs)433.5
Table 5. Results of BMLR model.
P(B! = 0|Y)Model 1Model 2Model 3Model 4Model 5
Intercept1.00000001.00000001.000001.00000001.00000001.0000000
pH0.44995081.00000000.000000.00000001.00000000.0000000
Time0.75787461.00000001.000000.00000000.00000000.0000000
C00.99864941.00000001.000001.00000001.00000001.0000000
Cs0.90948431.00000001.000001.00000001.00000000.0000000
BFNA0.27887261.000000.62943090.16556640.1153485
PostProbsNA0.37520000.336300.14110000.05570000.0388000
R2NA0.63340000.622800.56590000.57640000.4589000
DimNA5.00000004.000003.00000004.00000002.0000000
LogmargNA−94.40509−93.12809−93.59103−94.92647−95.28789
NA: Not Available.
Table 6. Coefficients of parameters in BMLR.
Post MeanPost SDPost p (B! = 0)2.5%97.5%Beta
Intercept9.2530.5721.0008.04710.4199.253
pH−0.1450.3000.449−0.9210.357−0.145
time0.0060.00490.757−0.00020.0150.006
C00.1210.03030.9980.05960.1850.121
Cs7.5263.8050.9090.00013.6727.526
Table 7. Results of MLR model.
EstimateStd. Errort ValuePr(>|t|)
Intercept−2.7963.473−0.8050.428
pH−0.3230.373−0.8650.395
t0.0080.0042.0100.055
C00.1150.0284.0600.000 **
Cs8.2123.0852.6620.013 *
“*” indicates significance at p < 0.05; “**” indicates significance at p < 0.01.
Table 8. Evaluation of the studied models’ performance in the adsorption process.
R2RMSE1:1 Line CoefficientVariables Rank
CART Cs > t > C0 > pH
RFR0.95172.280.9570C0 > t > pH, Cs
BMLR0.877513.142.0162C0 > Cs > t > pH
MLR0.92373.011.0064C0 > Cs
LR0.91663.010.8968
RR0.92232.900.9057
Table 9. Adsorption capacities for some adsorbents employed for caffeine elimination from aqueous solution.
AdsorbentAdsorption Capacity (mg/g)Reference
MWCNTs35.61[9]
Coconut leaf AC73.83[46]
Fique bagasse biochar19.5[47]
Granular AC88[48]
Sepiolite clay48.7[49]
RHAC239.67This study
Disclaimer/Publisher’s Note: The statements, opinions and data contained in all publications are solely those of the individual author(s) and contributor(s) and not of MDPI and/or the editor(s). MDPI and/or the editor(s) disclaim responsibility for any injury to people or property resulting from any ideas, methods, instructions or products referred to in the content.

