Article

Biosorption of Engine Oil Using Rice Husk in a Filtration System

by
Irfan Hafeez Aminuddin
1,
Siti Hajar Taufik
1,
Nurul Aini Puasa
1,
Syahirah Batrisyia Mohamed Radziff
1,
Nur Diyanah Zamree
1,
Noor Azmi Shaharudddin
1,2,
Che Azurahanim Che Abdullah
3,4,
Muhammad Fahdli Rahman
5,
Alyza Azzura Azmi
6,* and
Siti Aqlima Ahmad
1,3,7,*
1
Department of Biochemistry, Faculty of Biotechnology and Biomolecular Sciences, Universiti Putra Malaysia, Serdang 43400, Selangor, Malaysia
2
Institute of Plantation Studies, Universiti Putra Malaysia, Serdang 43400, Selangor, Malaysia
3
Material Synthesis and Characterization Laboratory, Institute of Advanced Technology, Universiti Putra Malaysia, Serdang 43400, Selangor, Malaysia
4
Department of Physics, Faculty of Science, Universiti Putra Malaysia, Serdang 43400, Selangor, Malaysia
5
Merbau Agrotechnology (M) Sdn. Bhd., JA2391, Jalan Sungai Renggi 2, Kampung Sungai Renggi, Merlimau 77300, Melaka, Malaysia
6
Faculty of Science and Marine Environment, Universiti Malaysia Terengganu, Kuala Nerus 21030, Terengganu, Malaysia
7
Laboratory of Bioresource Management, Institute of Tropical Forestry and Forest Products (INTROP), Universiti Putra Malaysia, Serdang 43400, Selangor, Malaysia
*
Authors to whom correspondence should be addressed.
Sustainability 2023, 15(19), 14599; https://doi.org/10.3390/su151914599
Submission received: 19 April 2023 / Revised: 17 May 2023 / Accepted: 5 June 2023 / Published: 9 October 2023

Abstract

:
Owing to its excellent qualities as a natural sorbent, rice husk (RH), a significant agricultural waste product obtained from the milling process, is employed as a biosorbent for engine oil. Engine oil spillages in rivers will flow to the ocean, exposing marine life to deadly contaminants. To date, there are very few natural sorbent studies specifically targeting engine oil removal. The purpose of this study was to optimise the significant factors in the efficiency of engine oil sorption by RH. Spectroscopic analyses using Fourier transform infrared spectroscopy (FTIR) and scanning electron microscopy (SEM) were performed to characterise the chemical composition and surface morphology of RH sorbent after pre- and post-treatment. A conventional optimisation approach, one-factor-at-a-time (OFAT), was used to assess the range of factors affecting the efficiency of engine oil sorption through heat treatment, heating time, packing density, and concentration of engine oil. The efficiency of engine oil removal obtained from this method was 74.5%. All the factors were assessed using a Plackett–Burman design (PBD) to eliminate non-significant factors. Furthermore, a central composite design (CCD) was employed to explore significant interactions among the factors. The quadratic model generated (R2 = 0.9723) fitted the data well. The optimised conditions from the CCD were 160 °C, 20 min, 0.16 g/cm3, and 12.5% (v/v), with improved oil sorption from 74.5% (OFAT) to 78.89% (RSM).

1. Introduction

The purpose of engine oil, often known as motor oil, is to lubricate, protect, and cool internal combustion engines while they are operating. Modern engine oils are largely based on polyalphaolefin, which has poor lubricating qualities. Hence, a combination of additives is required for it to accomplish its necessary functions [1,2,3]. Engine oil is subjected to various factors that can lead to its deterioration, including high temperatures and chemically active particles that affect its quality and lead to it being discarded [4,5]. When disposed of improperly, the range of pollutants present in engine oil, including lead, copper, arsenic, magnesium, chromium, zinc, cadmium, and polychlorinated biphenyls, can damage streams and groundwater [6,7,8,9]. Oil spills are usually caused by accidents that occur during the production and transportation of oil [10]. This phenomenon causes serious and long-term harm to marine ecosystems, the depletion of natural resources, and the disruption of the fragile ecological equilibrium [11,12,13]. A famous example is the oil spill catastrophe in Brazil in August 2019, which impacted almost 3000 km of the country’s coastline and was the worst oil leak in Brazilian history as well as the worst environmental disaster ever recorded in the tropical coastal region [14].
In recent years, biosorption has emerged as a promising approach for the removal of oil contamination [15,16,17]. Adsorption is the process in which certain components of a fluid phase, known as solutes, are transferred selectively to the surface of an insoluble solid [18,19]. When an adsorbent is placed in contact with a fluid phase, molecules from the fluid phase diffuse to the surface of the adsorbent (including the pores if the adsorbent is porous), where they either form chemical bonds with the solid surface or are physically held there by weak van der Waals forces [20,21]. This method is preferred due to its high removal effectiveness, low starting costs, design simplicity, and lack of toxicity selectivity [22,23,24].
Biosorption relies on the utilisation of natural materials, including agricultural wastes, which possess intrinsic properties enabling them to selectively absorb and eliminate oil from water [25]. Sorbents are used for materials with a mechanism that is absorbent or adsorbent or both, existing in natural or synthetic form [26,27]. These liquid-absorbing materials have great potential to be employed as the only means of cleaning small spills and for the removal of oil vestiges in areas such as wetlands and beaches [28,29]. The ability of sorbent material to float and have a low density is one of its benefits, making it an excellent option for use in situations involving oil and derivative spills in aquatic environments [26]. Another advantage of sorbents is their high regeneration capacity, which allows for their in-place application and sorption, the subsequent discharge of recovered oil, and their reuse in contaminated environments [30,31].
Natural organic sorbents have received more attention than their synthetic and inorganic counterparts, although all three types of sorbents have been studied in depth during the past few decades [32,33,34]. Kenaf fibre, cotton fibre, sawdust, wood fibre, corn cob, rice straw, kapok fibre, wool fibre, milkweed, coconut husk, rice husk (RH), oil palm empty fruit bunch (EFB), cattail fibre, hay, feathers, Guinea grass, and bagasse are examples of organic sorbents [29,35,36,37]. Among the diverse range of biosorbents available, rice husk (RH) has garnered significant attention owing to its abundance, renewability, and low cost [38]. RH is the protective covering on rice grains that is typically removed during the dehulling process, generating substantial quantities of waste material [39]. RH exhibits several characteristics that render it a promising sorbent material for engine oil remediation. RH is composed of organic substances (75% cellulose, hemicellulose, and lignin), as well as silica (15%) [40]. Several variables influence the composition of RH and rice husk ash (RHA), including agricultural practices (the type and amount of fertiliser applied) and geographical or meteorological conditions. These factors are the reason for the disposal of RH [41,42].
Materials derived from natural sources are found to be less costly, more abundant, and not as harmful to the environment, which makes them a more attractive option for effective waste disposal [36,42,43]. However, their primary drawback is that they have weak oleophilic/hydrophobic characteristics [42]. One way to enhance the oil sorption capability of natural sorbents is by using thermal treatment methods. Low-temperature thermal treatment, such as drying, has little effect on the sorbent’s oleophilic and hydrophobic characteristics. Its major action is the eliminating of certain surface contaminants, allowing for faster oil absorption [44]. A high-temperature thermal treatment, such as pyrolysis, leads to the carbonisation of the sorbent [45]. As a result, oil sorption capacity and oil-to-water selectivity can be greatly improved.
Natural sorbent materials that have been ground have a high oil sorption capacity per unit mass as the contact surface of the material is more accessible and the binding sites on smaller particles are more available [42]. Some natural sorbents have equivalent or even higher oil sorption capacities than synthetic sorbents, but they also absorb more water, which results in lower oil sorption capacities [35]. As a result, it is critical to ensure that the natural sorbent is extremely hydrophobic or lipophilic to retain high selectivity of oil over water. Moreover, natural organic sorbent-based devices have been proposed for use in small-scale oil spills on calm water surfaces [38]. A unique natural oil sorbent, non-woven cotton wadding has been claimed to have a significantly superior oil sorption capacity than synthetic products and is ecologically safe and straightforward to deploy in practical applications [29].
However, in order to harness the biosorption capabilities of RH and optimise its performance as a sorbent material for engine oil, it is crucial to gain a deeper understanding of the underlying mechanism and key factors influencing the biosorption process. Factors such as the composition and structure of RH, contact time, pH, temperature, and oil concentration influence the efficiency of the biosorption process. An in-depth investigation of these parameters and their interplay is essential for developing effective strategies to maximise the biosorption capacity of RH and enhance its suitability for practical applications.
Therefore, the aim of this study is to explore the biosorption of rice husk as a sustainable and efficient method for mitigating engine oil spills. Through the examination of the underlying mechanism and optimisation of the key parameters (temperature, time of heating, packing density, and engine oil concentrations) involved in the biosorption process, valuable insights can be obtained to guide the development of innovative and environmentally friendly approaches to oil spill clean-up. The outcomes of this study are anticipated to make significant contributions to the broader field of environmental remediation and offer practical solutions for addressing the challenges associated with engine oil spills.

2. Materials and Methods

2.1. Materials

The RH and biocharcoal RH used in this study were acquired from Kampung Agong, Penaga, Pulau Pinang, Malaysia. Meanwhile, engine oil was acquired at a workshop in Serdang, Selangor, while 70 L of distilled water (dH2O) was obtained from the laboratory and held at room temperature (25 °C ± 1 °C) until usage.

2.2. Filtration Setup

The combined components were placed in a filter system modified by Taufik et al. [29]. A 400 mL plastic bottle, a cylinder holder, and a 500 mL measuring cylinder were acquired. The latter was inverted onto the retort stands, and a wire mesh net was formed into a cylinder holder. The 500 mL measuring cylinder was used to collect the effluents by being placed beneath the bottle.

2.3. Sorption Capacity and Efficiency Evaluations

RH (15.71 g) was put into the cylinder holder, and 40 mL engine oil was mixed with 400 mL of dH2O. Then, the engine oil–water mixture was poured into the cylindrical container filled with RH and left for 10 min. The final sample weight and effluent were recorded.
Sorption capacity was evaluated in the laboratory (25 °C ± 1 °C) using the F 726-99 technique. The oil sorption capacity was used to determine the sorption capacity values (Equation (1)).
O i l   s o r p t i o n   c a p a c i t y ( g / g ) = X f X i X i
where Xf denotes the total mass (g) of the wet sample after immersion and Xi denotes the mass (g) of the sample prior to immersion. The efficiency of the engine oil absorption was determined using Equation (2).
E f f i c i e n c y   o f   e n g i n e   a b s o r p t i o n ( % ) = E i E E i
where Ei is the initial (v/v) concentration of engine oil and E is the concentration of engine oil after attaining equilibrium. The efficiency of the water absorption was determined using Equation (3).
E f f i c i e n c y   o f   w a t e r   a b s o r p t i o n ( % ) = W i W W i
where Wi is the dH2O at the beginning of the experiment, while W is the dH2O after attaining equilibrium.

2.4. Screening of the Different RH

The untreated, treated (heated at 160 °C for 20 min in a laboratory forced convection oven (Taisite, New York, NY, USA) with a temperature precision of ±1 °C), and biocharcoal RH samples were packaged (15.71 g) and placed in the cylinder holder to be examined.

2.5. Identification of RH

2.5.1. Fourier Transform Reflectance Infrared Spectroscopy (FTIR)

The chemical structures of the untreated, treated, and biocharcoal RH (before and after soaking with the oil–water combination) were studied using FTIR (Bruker Optik GmbH, Ettlingen, Germany). The FTIR spectra of each sample were analysed and obtained in the range from 4000 to 400 cm−1.

2.5.2. Scanning Electron Microscopy (SEM)

In order to investigate the components that make up RH, a variable pressure scanning electron microscope (VPSEM) (Carl Zeiss AG, Jena, Germany) was utilised. The RH samples had a gold sputter coating applied to them, and then they were secured to circular sample holders made of stainless steel using double-sided conductive adhesive tape. An accelerating voltage of 15 kV was utilised in order to analyse the SEM pictures.

2.6. Optimisation of Engine Oil Biosorption

2.6.1. One-Factor-at-a-Time (OFAT) Approach

The optimisation and assessment of the biosorption of engine oil into RH were carried out via the one-factor-at-a-time (OFAT) approach based on four selected parameters, namely, heat treatment (130, 140, 150, 160, 170, and 180 °C), time of heating (10, 20, 30, 40, 50, and 60 min), packing density (0.12, 0.14, 0.16, 0.18, and 0.20 g/cm3) and engine oil concentration (5, 10, 15, 20, and 25% (v/v)). The effects of these parameters were investigated by maintaining all the other factors at constant conditions except for the one factor of interest.

2.6.2. Response Surface Methodology (RSM)

The RSM-based optimisation employed two statistical mathematics designs: Plackett–Burman design (PBD) and central composite design (CCD). With minor modifications, the factors matched from OFAT were further analysed using Design-Expert software version 13.0 under the Factorial Miscellaneous Design (standard design). The significant parameters identified using the PBD were then further optimised using a CCD [46]. Experiments were conducted to further validate the statistical models, and the optimal values predicted by the models were used in the experiments. p < 0.05 was considered significant in all of the analyses. In the CCD, Equation (4) of the quadratic mathematical model of CCD design was employed:
Y = β 0 + i = 1 k β i x i + i = 1 k β i i x i 2 + 1 = i < j k β i j x i x j
where Y is the response variable, x is the independent factors that influence y, β0 is the intercept, βi is the ith linear coefficient, βii is the quadratic coefficient, βij is the coefficient of interaction effect, and k is the number of involved factors.

2.7. Statistical Analysis

All experiments were performed in triplicate, and the mean value and standard error of the mean were computed. The experiments that were conducted were analysed using GraphPad Prism. Statistical analysis was performed using ANOVA and Tukey’s test.

3. Results and Discussion

3.1. Screening of Rice Husk Samples

The screening procedure included three groups of untreated, treated (160 °C), and biocharcoal RH samples (Figure 1). Values are means ± the standard error of the mean (n = 3). The treated RH samples displayed the highest level of sorption capacity (2.7 g/g ± 0.07) and the most efficient oil absorption (48.95% ± 2.69). Therefore, the treated RH was selected for further experiments. Meanwhile, water absorption by the treated RH was lower (4.28% ± 0.40) compared to the other two, which were untreated (8.68% ± 0.57) and biocharcoal (9.71% ± 0.71). Due to the preferred lesser water absorption, the selection of treated RH was further proven [29].
Thermal treatment is by far the most common kind of electrical discharge and is widely used as it can alter the material’s physical qualities while still preserving the chemical components of the fibre [21]. Drying out the lignocellulose fibre bundles causes the bundles to split into single filaments when the plant fibre is heated to temperatures between 100 and 200 °C for varying amounts of time. Other non cellulose or chemical compounds with lower glass transition temperatures or constituents that are comparable to lignin will either be released from the fibre bundles or depolymerised from them [47].

3.2. Characterisation of RH

3.2.1. Spectroscopic Analysis Using Fourier Transform Infrared Spectroscopy (FTIR)

The use of FTIR in this experiment is to gain a better understanding of the mobility profile of functional groups within the macromolecules that are present in RH. A spectroscopy investigation of RH revealed that ionisable functional groups such as hydroxyl, amino, and carboxyl groups can combine and chelate with engine oil [48].
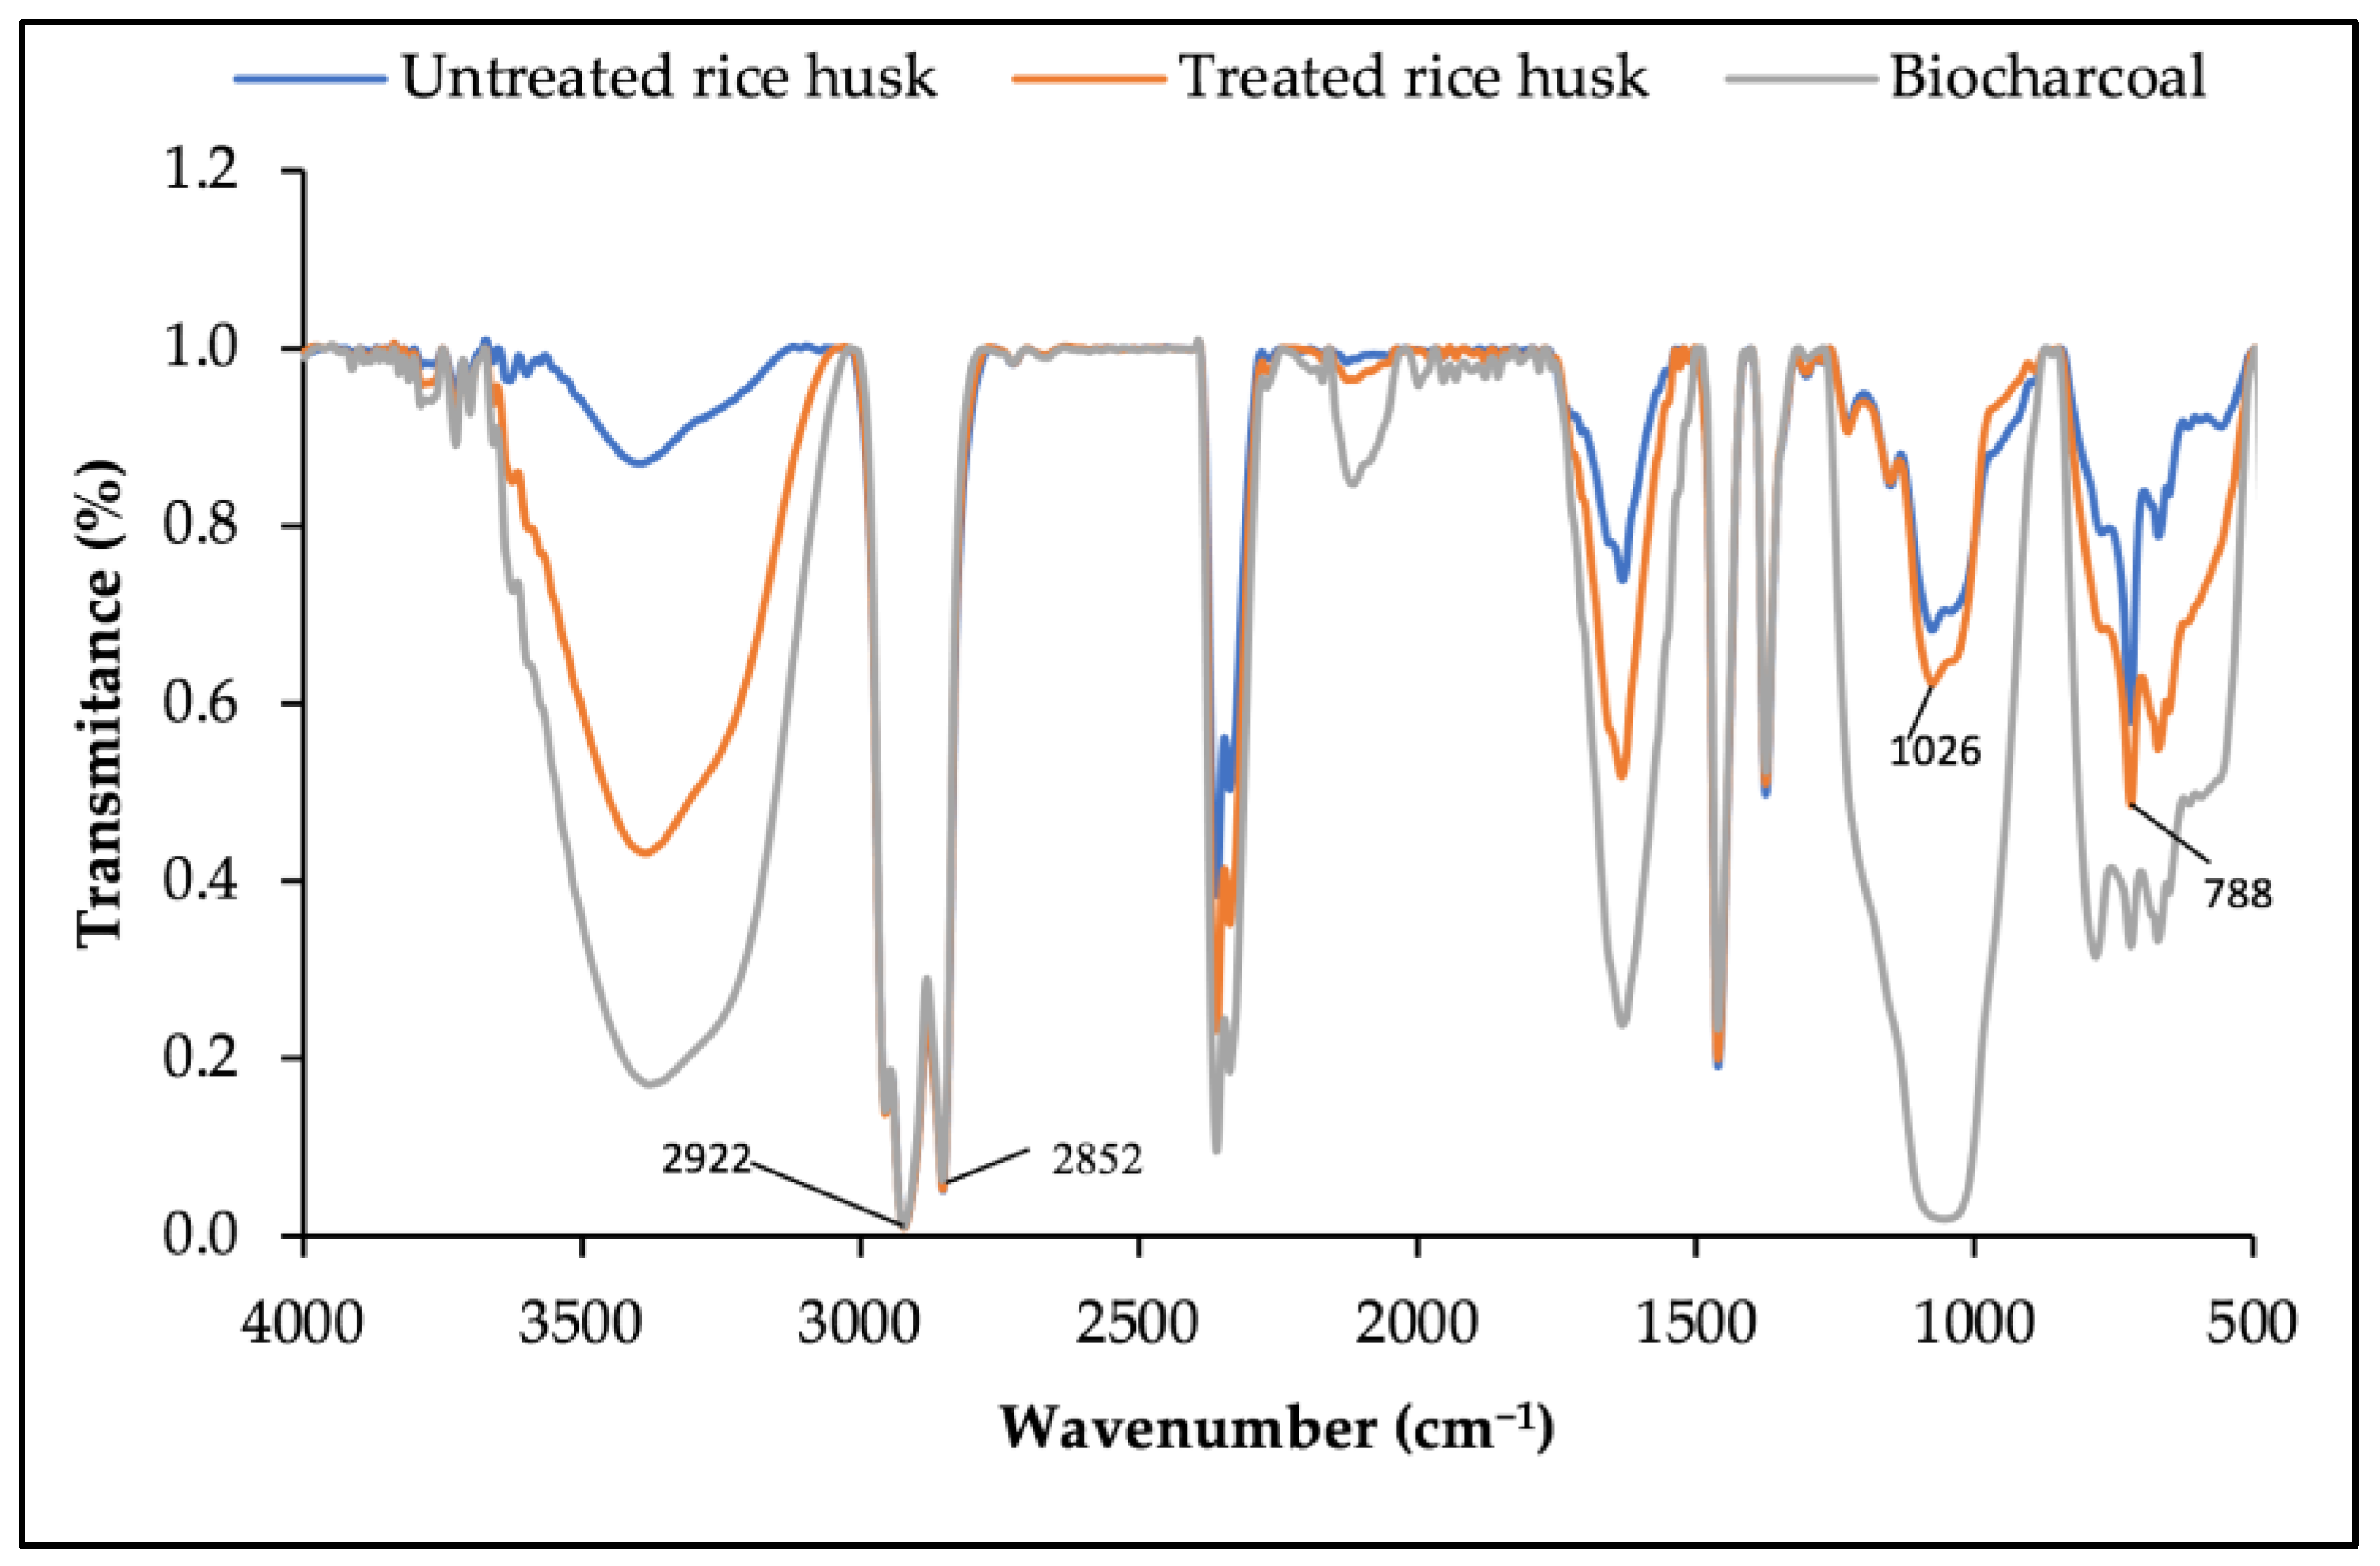
Figure 2 and Figure 3 display the infrared spectra of the untreated, treated, and biocharcoal RH both before and after the engine oil was absorbed into them. Prior to the adsorption process, the groups Si-O-Si, Si-H, and Si-O corresponded to some of the peaks in the spectrum. The peak with the highest intensity can be seen in the band at 1026.78 cm−1, which corresponded to the stretching vibrations of the siloxane group (Si-O-Si), whereas the peak that can be seen at 788.62 cm−1 corresponded to the stretching vibration of Si-H from the silane group. Both peaks can be seen in the spectrum. The presence of a significant amount of SiO2 in the RH was responsible for the observation of a peak at a frequency of 553.32 cm−1 that corresponded to Si-O.
The presence of silicon groups on the surface of the RHA is consistent with the findings reported in the literature, which suggested that silicon makes up 95% of the composition of RHA [21]. However, the removal of the silica bond vibration around 1068.13 cm−1 (Figure 3) showed that it may be possible to partially break down silica by the use of heat treatment at 160 °C [21].
It was determined that the O-H stretching of the silanol group (Si-OH) was responsible for the FTIR band seen in RH at 3000–3600 cm−1 [49]. The hydroxyl groups (OH) found on the surface of cellulose fibres give hydrophilicity, which might limit the application of cellulose fibres for cleaning oil from water. Cellulose fibres, however, can successfully absorb oil [29]. It may be possible to modify the surface of the sorbent to make it less hydrophilic by exchanging its OH groups [50]. Several different chemical processes may be used to attach functional groups of various substances to hydroxyl groups located on the cellulose chain (in the b-D glucopyranose).
The CO stretching vibration, which is typical of unconjugated ketones, aldehydes, and carboxyl, was determined to be the cause of the absorption seen for RH at a wavelength of 1639.99 cm−1 [49,51]. The peaks at 2922 cm−1 and 2852 cm−1 (Figure 2) vanished when the heating temperature was raised. High-temperature inputs can lead to the degradation of polysaccharides as well as the inclination of energy inputs. This implies the development of CO2 at increasing temperatures and leftover methylene group at peaks between 2935 and 2915 that may disintegrate [49].

3.2.2. Surface Morphology Characterisation by Scanning Electron Microscopy (SEM)

The rough surface of RH could be seen in all of its intricate texture in the SEM micrographs. The SEM shows what kinds of molecules were on the surface of the RH. Figure 4a,b show that untreated RH has a greater number of silica grooves than treated and biocharcoal RH (Figure 4a). In the treated and biocharcoal RH, there was a significant increase in the number of pores (Figure 5b,c). Under low magnification (500×), the traits that were seen were still evident.
The porous structure of adsorbents, in addition to the physical and chemical interactions of their functional groups with the components of engine oil, is what determines an adsorbent’s capacity for high petroleum sorption [52]. It is clear from the SEM pictures that subjecting the RH samples to heat treatment results in the production of a structure that is vastly different and has a larger porosity than before (Figure 4b).
The untreated and biocharcoal RH surfaces differ from the treated RH surface area. On the surface of the treated RH’s outer wall can be seen a great number of button-like structures with tiny pores (Figure 5b). These structures did not exist in the untreated RH particles. The particles suffered significant transformations during this high-temperature treatment. Pores became larger in quantity as well as in size, new types of pores emerged, smaller pores merged into larger ones, and changes occurred in the surface of the pores as well as in the volume of the pores [53].

3.3. Optimisation of Factors for Oil/Water Sorption Capacity Using OFAT

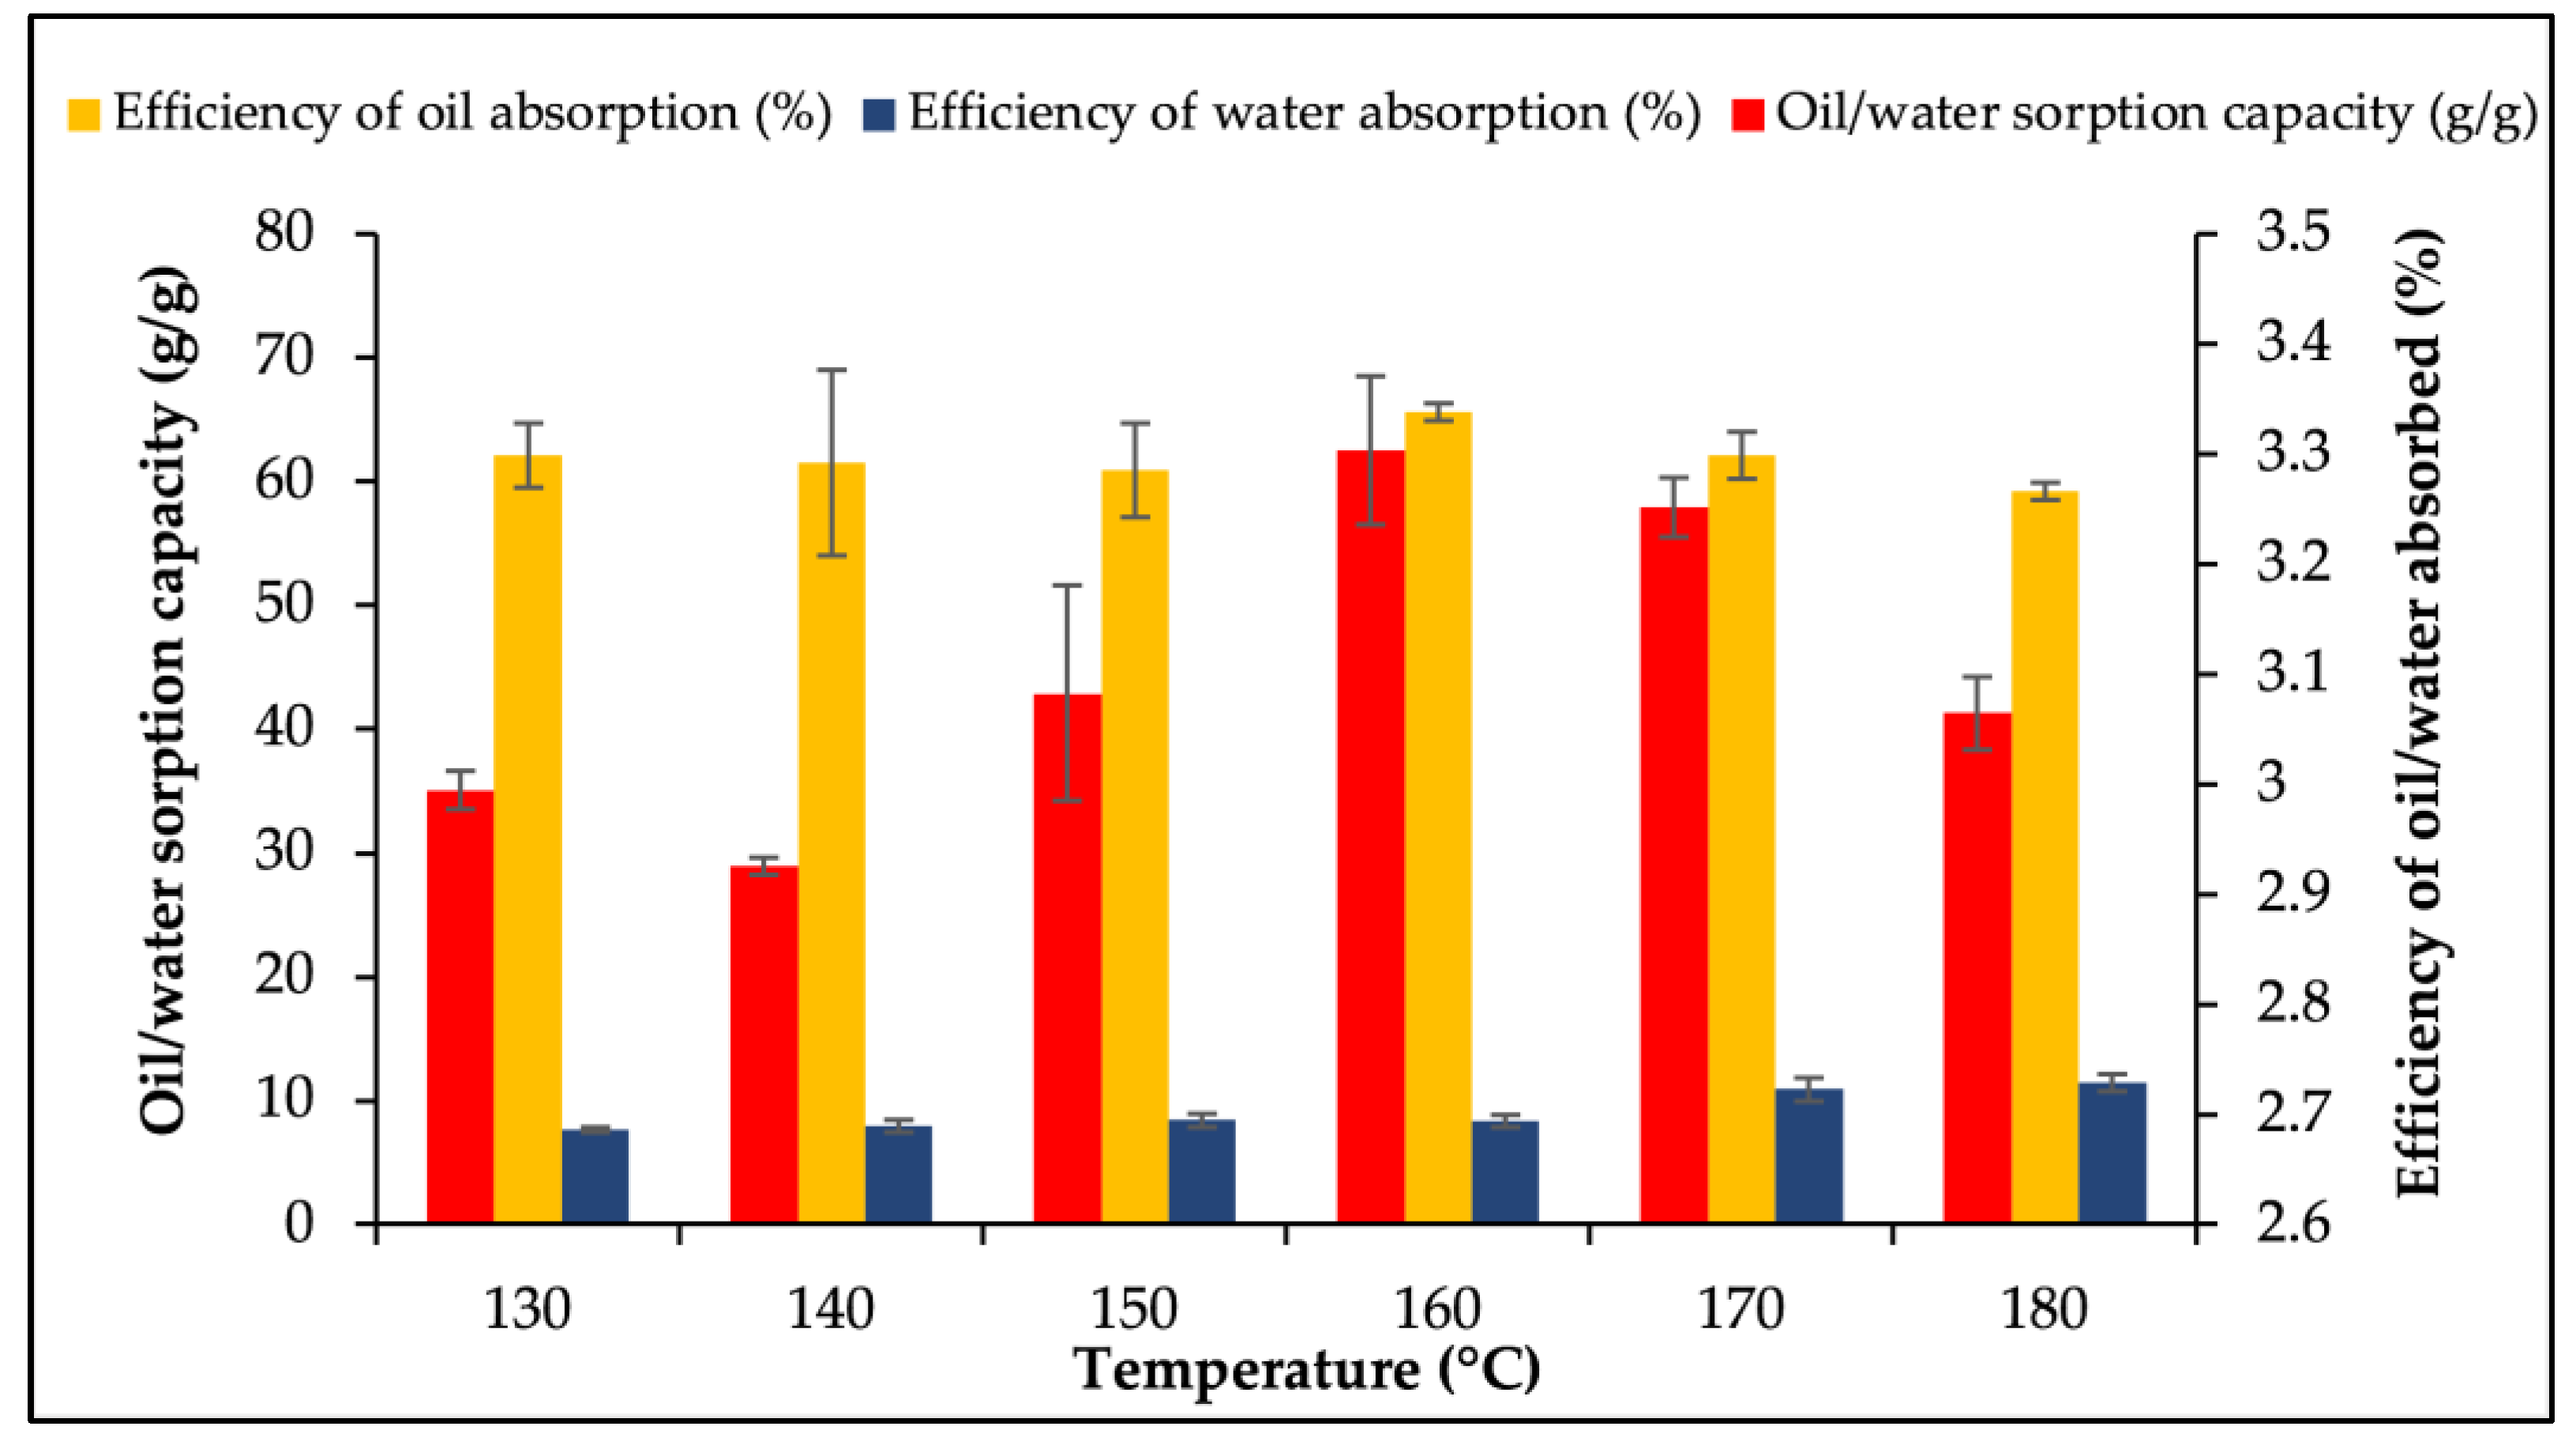
Figure 6 depicts the performance of RH following treatment at temperatures ranging from 130 to 180 °C. Based on the findings, 160 °C was the best treatment temperature, with a maximum sorption capacity of (3.30 g/g ± 0.067) and an engine oil absorption efficiency of 65.61% ± 0.71. ANOVA was significant (F6, 14 = 15.12, p < 0.0001), while Tukey’s post hoc pairwise comparisons indicated that all points in the range were substantially different from the untreated RH. In general, the features of RH are dependent on several parameters. These elements include the geological location, rice variety, climatic variation, cultivation methods, and fertilisers used in paddy growth [54].
Figure 7 displays the oil/water sorption capacity and absorption efficiency of the engine oil–water mixture for a time of heating for RH ranging from 10 to 60 min. When the heating time was extended, the efficiency of oil/water was improved due change in its fibre properties [41,55]. However, there was a significant drop when the temperature reached 50 min. The greatest amount of water that could be absorbed was demonstrated after 60 min of heating. The optimal amount of time for heating was found to be 40 min, which resulted in the highest oil/water sorption capacity (3.33 g/g ± 0.03) and efficiency of engine oil absorbed (72.03% ± 1.24) and yielded the lowest amount of water absorbed (8.17% ± 0.44). There was a statistically significant difference between RH (p = 0.0011) and engine oil sorption effectiveness (p = 0.0002) when compared with a heating time of 10 min. The results of the overall ANOVA revealed that there were significant variations in the amount of time it took to heat the RH (F5, 12 = 13.15, p = 0.0041), the amount of engine oil efficiency (F5, 12 = 10.30, p = 0.0002), and the amount of water sorption (F5, 12 = 6.313, p = 0.0213).
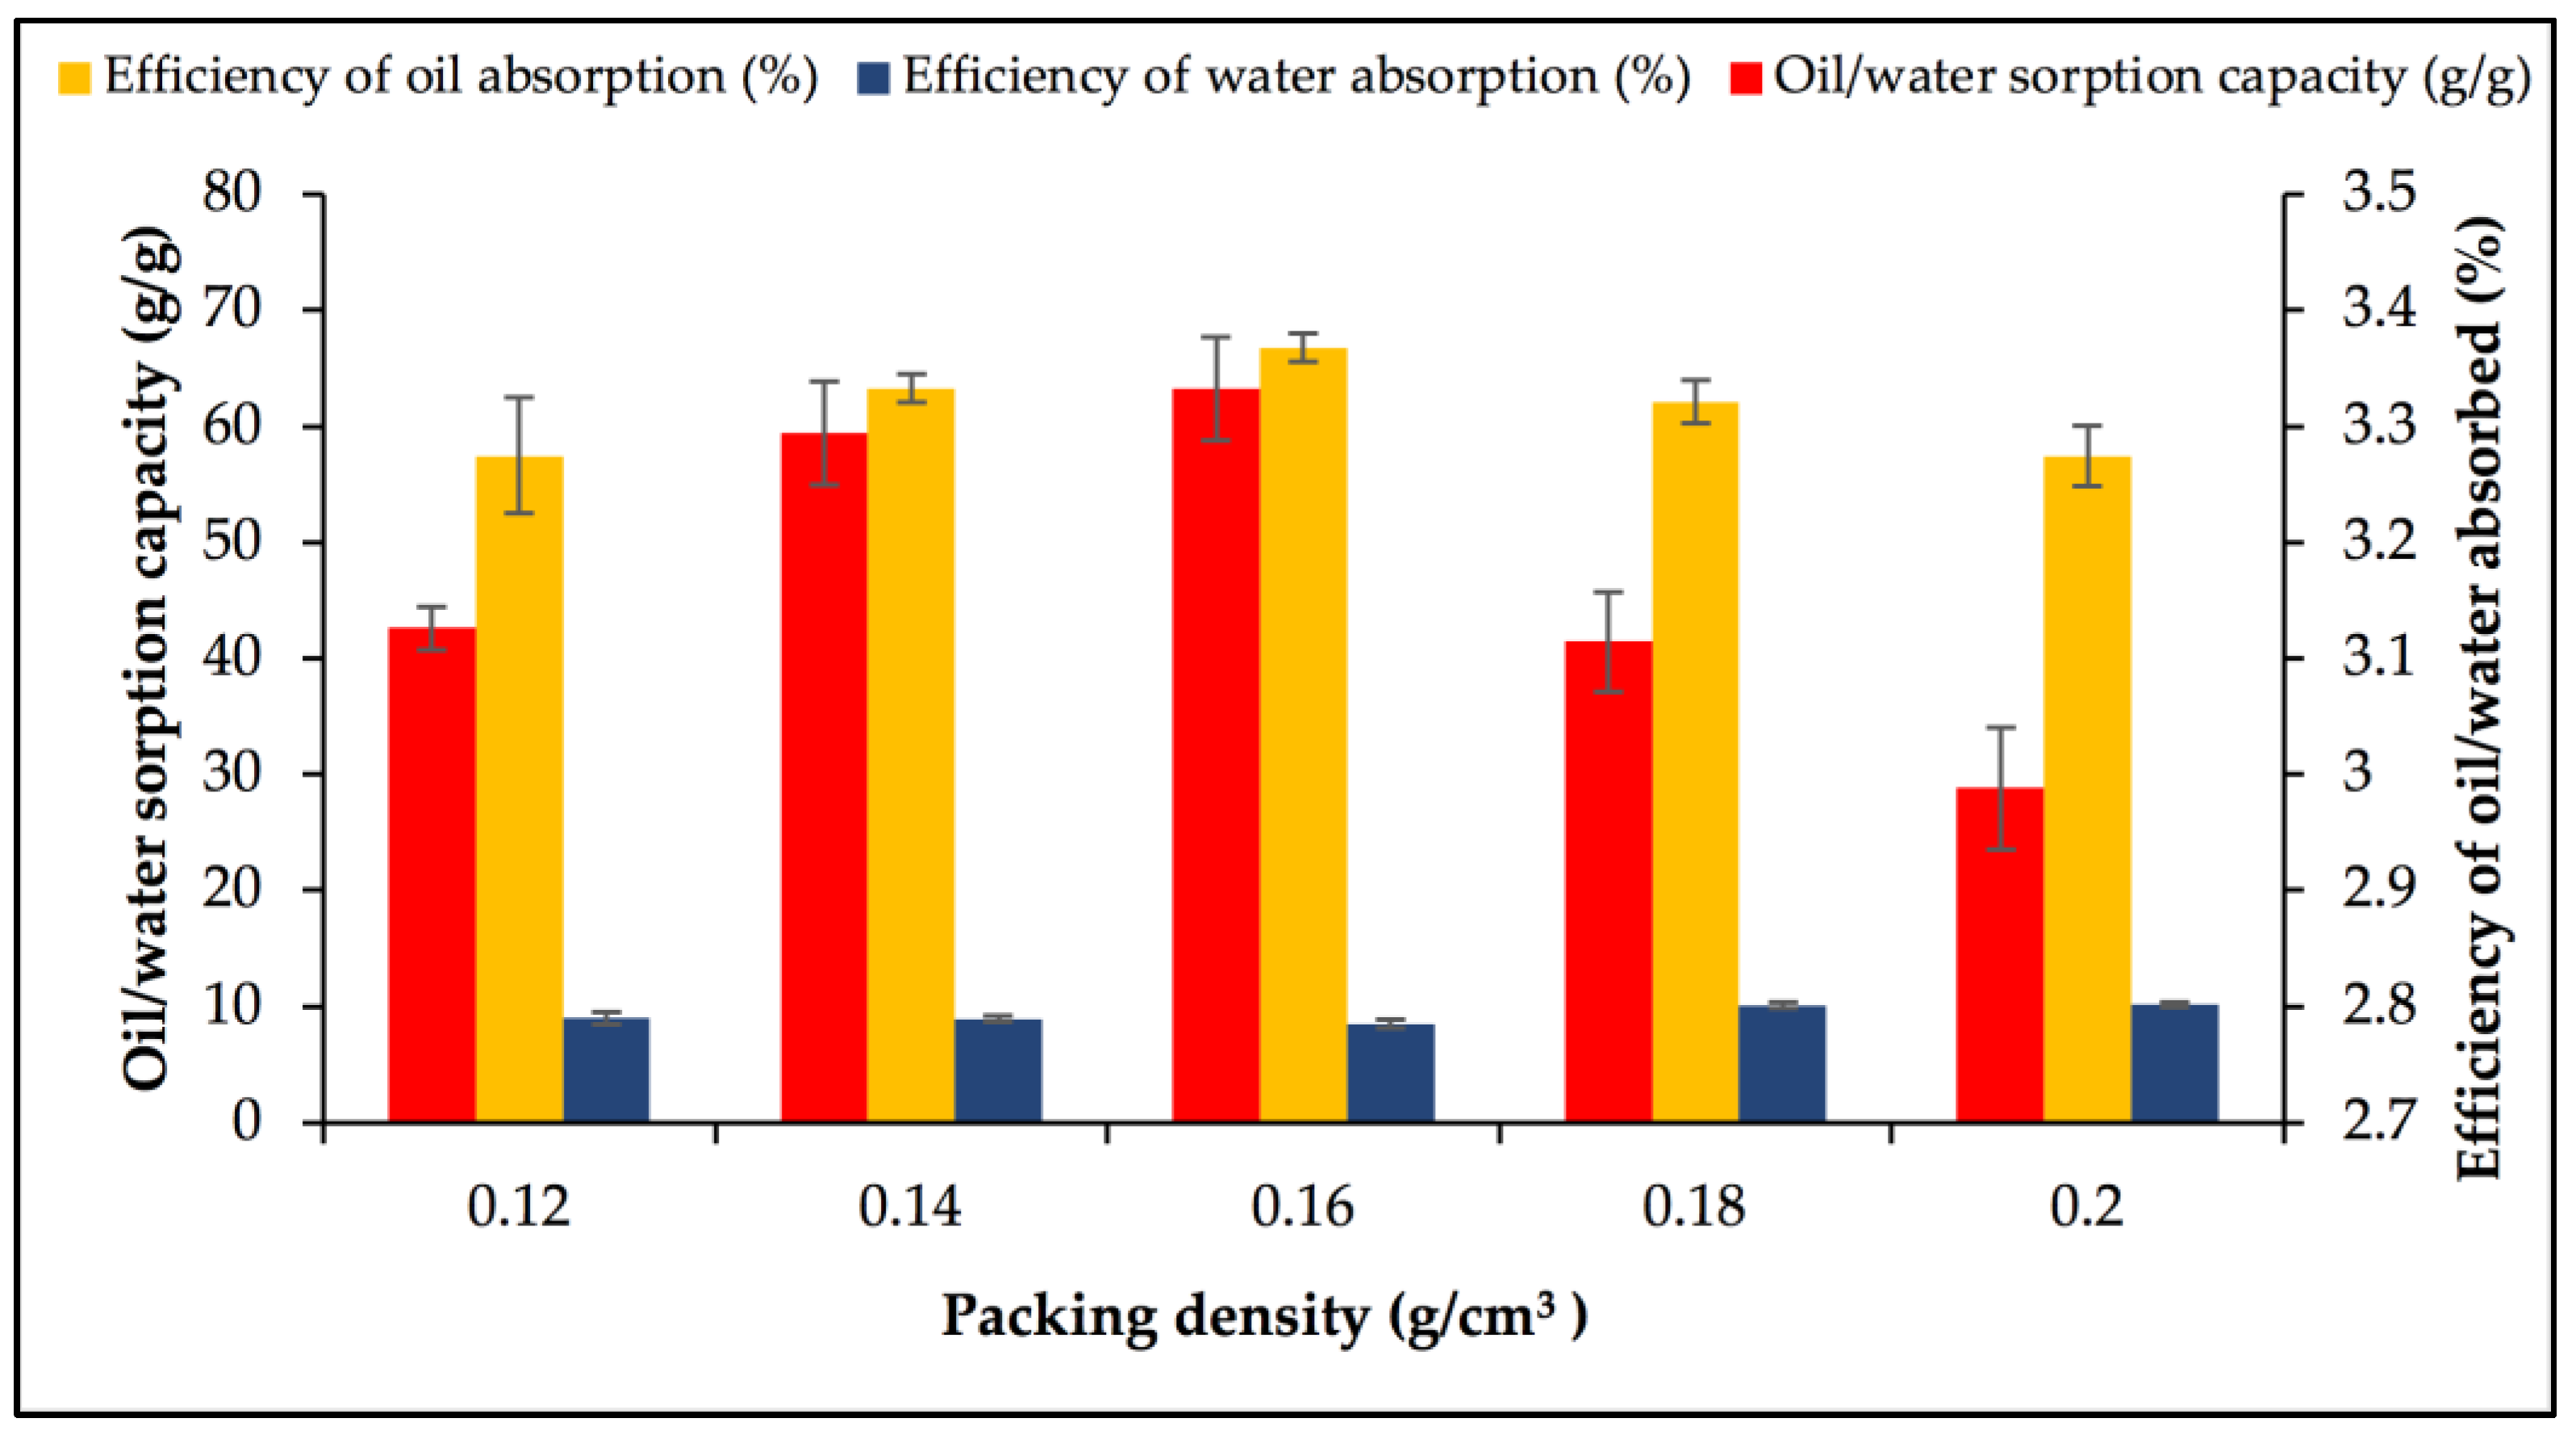
After that, a variety of various packing densities ranging from 0.12 to 0.2 g/cm3 were tested, while the RH treatment temperature and length of heating remained unchanged (Figure 8). At a low packing density, the surface area was increased because it correlated with the increased porosity that gave the rapid oil sorption results [33,56]. The results collected indicated that the packing density of 0.16 g/cm3 was the most effective one. This packing density offered the largest sorption capacity (3.33 g/g ± 0.04) and efficiency of engine oil absorption (66.78% ± 1.23) while also offering the lowest water absorption (8.5% ± 0.35). In this particular instance, however, an analysis of variance found no statistically significant differences between the treatments (F4, 10 = 1.112, p = 0.2143).
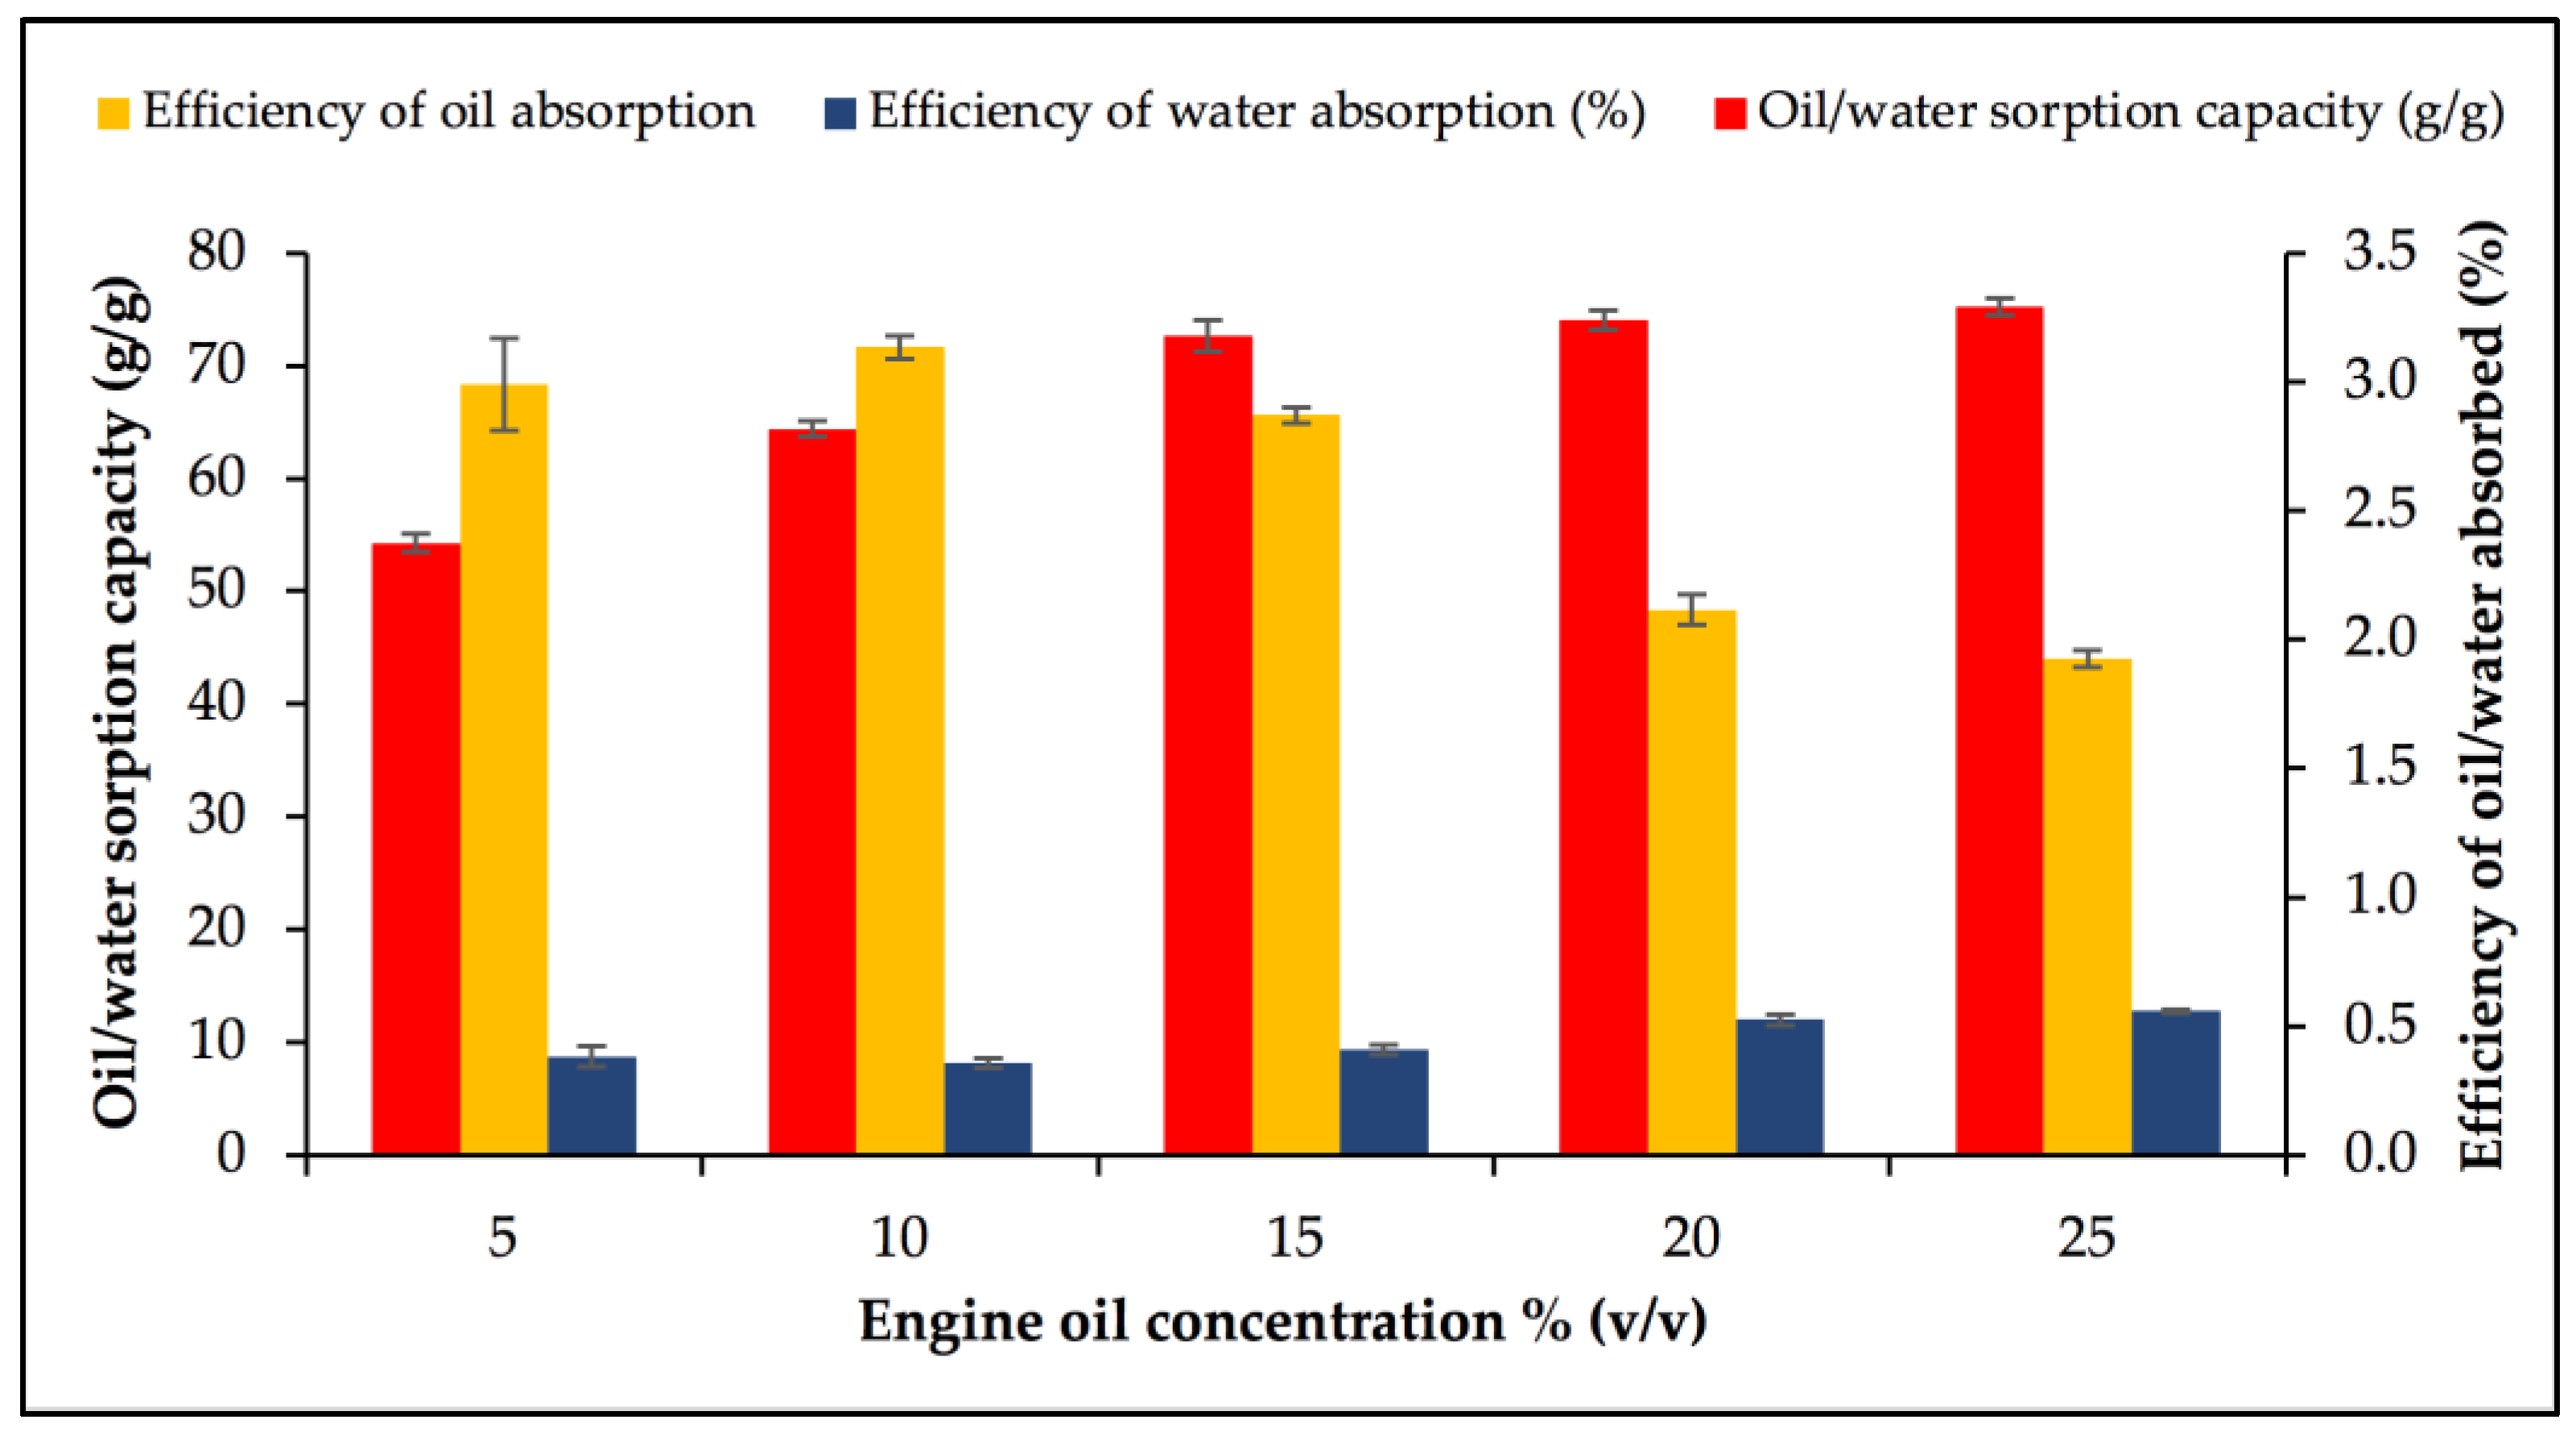
The last factor examined using OFAT was engine oil concentration. As shown in Figure 9, engine oil concentration ranging from 5% to 25% was carried out, while the other factors were fixed. The oil/water sorption capacity continued to increase, despite the fact that the efficiency of engine oil absorption (%) was decreasing from 10%. Puasa et al. [34] state that the equilibrium established when the reactive sites of sorbents are saturated with oil molecules, which encourage desorption, causes the efficiency of engine oil adsorption by RH to decline once the engine oil concentration approaches 10%. This is the reason that 10% was chosen as the best engine oil concentration, giving the highest efficiency of engine oil (71.67 ± 1.02) and the lowest water absorption (8.17 ± 0.44) compared to other concentrations. An analysis of variance (ANOVA) showed significant variations between the treatments that were shown to be impacted by the starting engine oil concentration in terms of the sorption capacity (F5, 12 = 16.88, p < 0.0001) and the efficiency of engine oil absorbed (%) (F5, 12 = 29.77, p < 0.0001). On the other hand, there was not a discernible change in the efficiency with which water was absorbed (F5, 12 = 1.512, p = 0.4375).

3.4. Response Surface Methodology (RSM) Optimisation

3.4.1. Optimisation of Factors by PBD

The PBD was used in the secondary analysis to exclude non-significant components following the OFAT analyses. With all factors aligned, 18 runs were generated (Table 1). The lowest experimental values found for engine oil–water sorption was achieved during run number 9, and they were 50 mL (45%) and 37 mL (8.67%), respectively.
The assessments for PBD go beyond the assessment that OFAT offers and also consider the likelihood of interactions going in both directions between the various factors [29]. The results of the ANOVA showed that the constructed model was very significant in general, with an R2 = 0.9699, and the packing density and the engine oil concentration were all relevant components (Table 2). These aspects were thus taken into consideration in the CCD analysis.

3.4.2. Interactions of Significant Factors Analysed Using CCD

The significant parameters determined using PBD were then subjected to additional analysis with the CCD to determine the optimal and interactive conditions that existed between the factors. After generating a total of 13 experimental runs based on two significant factors, an optimisation process using a five-level CCD approach was performed on the data. The experimental variables, along with the experimental and predicted values of engine oil–water mixture for the oil/water efficiency of RH, are presented in Table 3.
A quadratic model was adopted, and ANOVA was performed to examine the importance of each model term (Table 4). The significance of the quadratic model was determined to be extremely high (p < 0.0001), and its R2 value was found to be 0.9723.
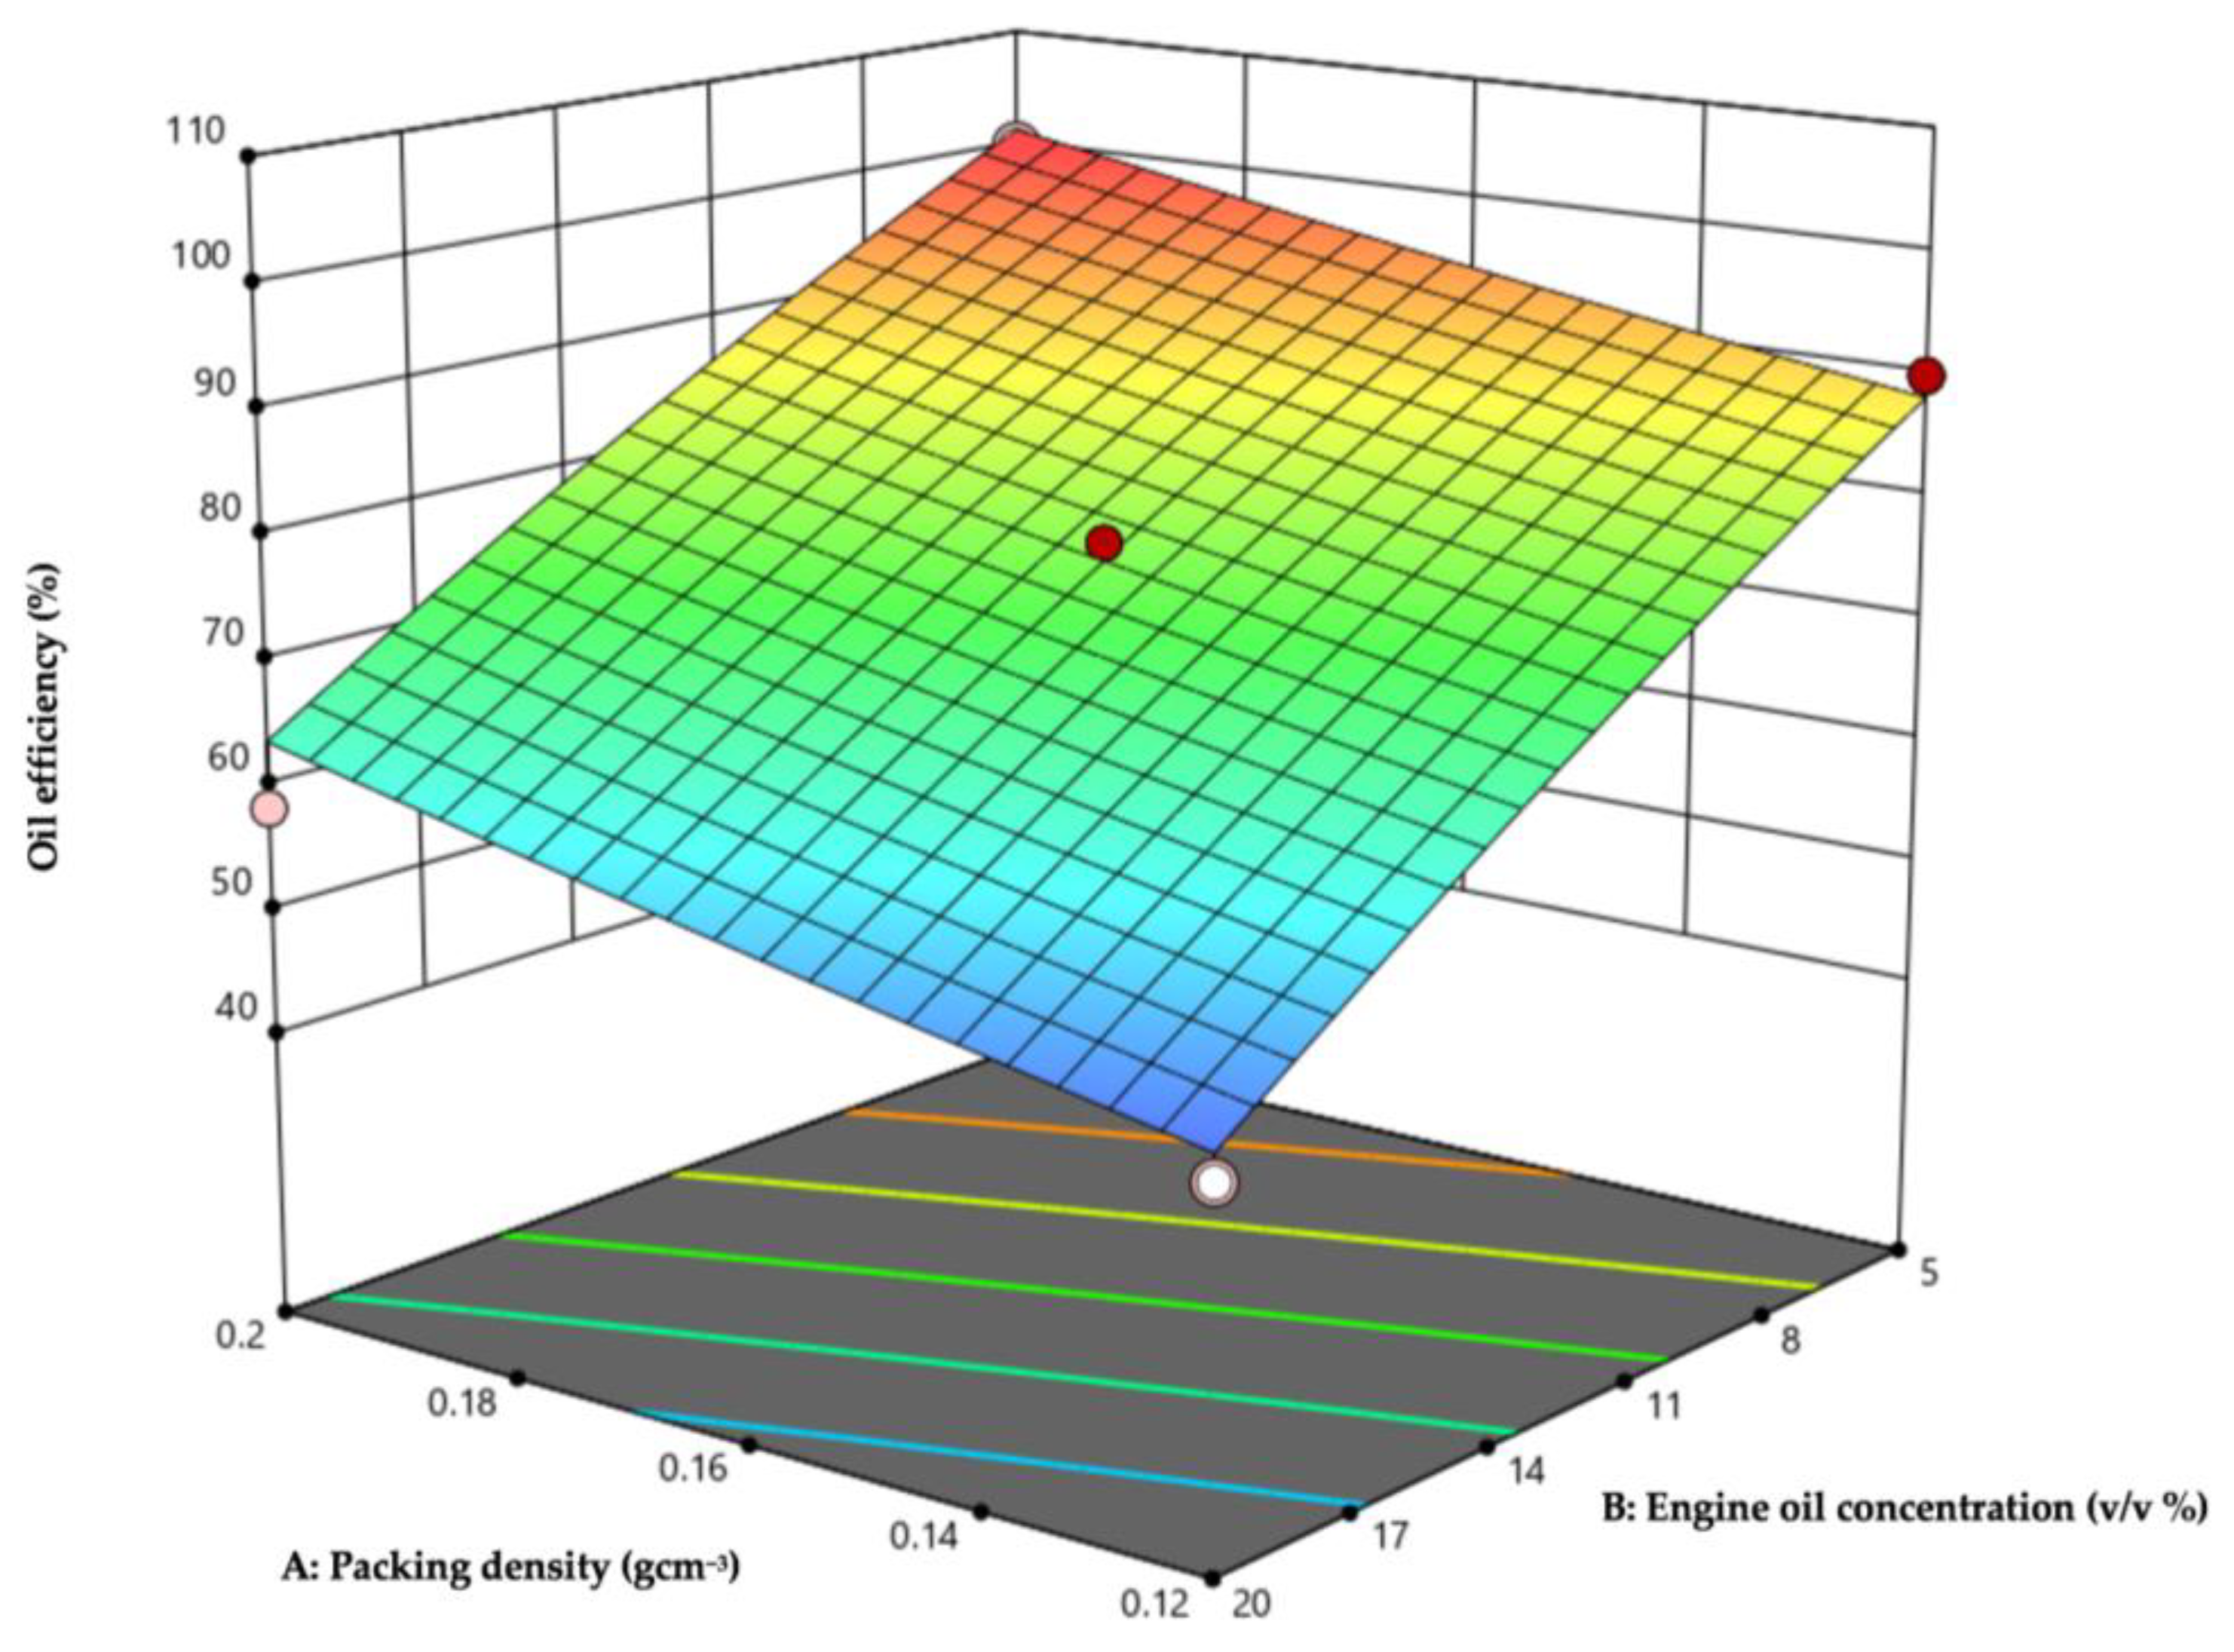
Although, the ANOVA did not find any significant pairwise interactions between any of the components (Table 4), two response surface contour plots were created. The packing density and the engine oil concentration were the relevant considerations, which were denoted by the letters A and B, respectively. The interaction between packing density (g/cm3) and engine oil concentration is depicted in Figure 10. At 0.16 g/cm3 and 12.5% (v/v) engine oil it was expected that there would be the most oil absorption (76.09%). However, the surfaces of the two plots are relatively flat rather than domed, which is consistent with the fact that substantial interactions were not found and that these two factors worked independently.

3.4.3. RSM Model Validation

Employing OFAT, the best conditions for sorption capacity and oil/water absorption were attained by using treated RH at 160 °C for 40 min, packed at 0.16 g/cm3 packing density, and exposed to 10% (v/v) engine oil. From these circumstances, 49 mL of engine oil and 30 mL of water were successfully captured (Table 5).
The effectiveness of oil absorption was 74.5% with a margin of error of 0.2. Using the PBD and the CCD techniques, the conditions advised were to treat RH at a temperature of 160 °C for 20 min, pack it at 0.148 g/cm3, and utilise engine oil at 12.5% (v/v). Under these conditions, the efficiency of oil absorption was 79.89% with a margin error of 0.5, which represented a marginal improvement over the use of OFAT on its own. In other words, both studies relied on the pure components working separately, and as a consequence, the near similarity in the results that were produced should not come as a surprise, as it is consistent with the fact that the interaction terms were found to be non-significant.

4. Conclusions

The biosorption of engine oil using RH offers several advantages over conventional oil spill clean-up methods, including cost-effectiveness, eco-friendliness, and the utilisation of a renewable and abundant resource. By utilising RH as a biosorbent, the negative impacts of oil spills on aquatic ecosystems and human health can be mitigated while minimising the depletion of natural resources and maintaining ecological balance. The findings of this study emphasise the potential of RH as a valuable tool in the field of oil spill remediation. Screening results indicated that treated RH outperformed the untreated and biocharcoal RH with a sorption capacity of 2.7 g/g ± 0.07 and oil absorption of 48.95% ± 2.69. The identification and molecular morphology before and after the RH was wetted with oil were also assessed, which further suggested that treated RH is better for absorption. The application of a statistical approach (RSM) for optimisation led to a significantly higher oil sorption efficiency of 78.89%, surpassing the conventional approach (OFAT) with an oil sorption efficiency of 74.5%.

Author Contributions

Conceptualisation, S.A.A. and N.A.S.; methodology, S.A.A., A.A.A. and N.A.S.; software, I.H.A., S.H.T., N.A.P., S.B.M.R. and A.A.A.; validation, S.A.A., N.A.S. and A.A.A.; formal analysis, I.H.A., S.A.A., S.H.T., N.A.P. and S.B.M.R.; investigation, I.H.A. and A.A.A.; resources, S.A.A., A.A.A., N.A.S., M.F.R. and C.A.C.A.; data curation, I.H.A., S.H.T., N.A.P. and S.B.M.R.; writing—original draft preparation, I.H.A.; writing—review and editing, S.A.A., A.A.A., N.A.S., S.H.T., N.A.P., S.B.M.R., N.D.Z. and C.A.C.A.; visualisation, I.H.A. and S.A.A.; supervision, S.A.A., N.A.S. and A.A.A.; project administration, S.A.A., A.A.A. and N.A.S.; funding acquisition, S.A.A. and A.A.A. All authors have read and agreed to the published version of the manuscript.

Funding

APC has been funded by Universiti Putra Malaysia (UPM) and Universiti Malaysia Terengganu (UMT). The authors also thank the Majlis Amanah Rakyat (MARA) for granting a personal scholarship to S.H. Taufik, N.A. Puasa, and S.B.M. Radziff.

Institutional Review Board Statement

Not applicable.

Informed Consent Statement

Not applicable.

Data Availability Statement

Not applicable.

Acknowledgments

The authors would like to thank the Eco-Remediation Technology Laboratory; the Institute of Advanced Technology and the Institute of Tropical Forestry and Forest Products (INTROP), Universiti Putra Malaysia; and Universiti Malaysia Terengganu and Merbau Agrotechnology (M) Sdn. Bhd.

Conflicts of Interest

The authors declare no conflict of interest.

References

  1. Nagy, A.L.; Knaup, J.C.; Zsoldos, I. Investigation of used engine oil lubricating performance through oil analysis and friction and wear measurements. Acta Tech. Jaurinensis. 2019, 12, 237–251. [Google Scholar] [CrossRef]
  2. Hasan-Zadeh, A.; Poshtiban, M. Car engine oil: Investigation of function and related challenges, and provision of environmental solutions. Asian J. Appl. Sci. 2021, 9, 35–44. [Google Scholar] [CrossRef]
  3. Rostek, E.; Babiak, M. The experimental analysis of engine oil degradation utilizing selected thermoanalytical methods selected thermoanalytical methods. Transp. Res. Procedia 2019, 40, 82–89. [Google Scholar] [CrossRef]
  4. Qurashi, I.A.; Swamy, A.K. Viscoelastic properties of recycled asphalt binder containing waste engine oil. J. Clean. Prod. 2018, 182, 992–1000. [Google Scholar] [CrossRef]
  5. Hameed, D.K. Deterioration in physical engine oil properties after different trip length. Kurd J. Appl. Res. 2021, 6, 13–20. [Google Scholar] [CrossRef]
  6. Özçelik, A.E.; öğüt, H. Determination of the effects of safflower biodiesel and its blends with diesel fuel on lubricating oil in a single cylinder diesel engine. J. Environ. Sci. Engin. 2012, 1, 1338–1345. [Google Scholar]
  7. Szyszlak-Bargłowicz, J.; Zając, G.; Wolak, A. Heavy metal content in used engine oils depending on engine type and oil change interval. Arch. Environ. Prot. 2021, 47, 81–94. [Google Scholar] [CrossRef]
  8. Jahromi, F.A.; Kannan, N.; Zakaria, M.P.; Aris, A.Z. Persistent Contaminants in Waste Oils: A Short Review on PCBs and PAHs as Main Contaminants. In From Sources to Solution; Aris, A.Z., Tengku Ismail, T.H., Harun, R., Abdullah, A.M., Ishak, M.Y., Eds.; Springer: Cham, Switzerland, 2014. [Google Scholar] [CrossRef]
  9. Aguirre, M.A.; Canals, A.; López-García, I.; Hernández-Córdoba, M. Determination of cadmium in used engine oil, gasoline and diesel by electrothermal atomic absorption spectrometry using magnetic ionic liquid-based dispersive liquid-liquid microextraction. Talanta 2020, 220, 121395. [Google Scholar] [CrossRef]
  10. Okeke, E.S.; Okoye, C.O.; Chidike Ezeorba, T.P.; Mao, G.; Chen, Y.; Xu, H.; Song, C.; Feng, W.; Wu, X. Emerging bio-dispersant and bioremediation technologies as environmentally friendly management responses toward marine oil spill: A comprehensive review. J. Environ. Manag. 2022, 322, 116123. [Google Scholar] [CrossRef]
  11. Lourenço, R.A.; Combi, T.; Alexandre, M.R.; Sasaki, S.T.; Zanardi-Lamardo, E.; Yogui, G.T. Mysterious oil spill along Brazil’s northeast and southeast seaboard (2019–2020): Trying to find answers and filling data gaps. Mar. Pollut. Bull. 2020, 156, 111219. [Google Scholar] [CrossRef] [PubMed]
  12. Saadoun, I.M.K. Impact of Oil Spills on Marine Life. In Emerging Pollutants in the Environment; Larramendy, M.L., Soloneski, S., Eds.; Book Metrics Overview; IntechOpen: London, UK, 2015. [Google Scholar] [CrossRef]
  13. Akpan, E. Environmental consequences of oil spills on marine habitats and the mitigating measures—The Niger Delta perspective. J. Geosci. Environ. Prot. 2022, 10, 191–203. [Google Scholar] [CrossRef]
  14. Xu, C.; Jiao, C.; Yao, R.; Lin, A.; Jiao, W. Adsorption and regeneration of expanded graphite modified by CTAB-KBr/H3PO4 for marine oil pollution. Environ. Poll. 2018, 233, 194–200. [Google Scholar] [CrossRef] [PubMed]
  15. Lutfee, T.; Al-Najar, J.A.; Abdulla, F.M. Removal of oil from produced water using biosorbent. IOP Conf. Ser. Mater. Sci. Eng. 2020, 737, 012198. [Google Scholar] [CrossRef]
  16. Dagde, K.K. Biosorption of crude oil spill using groundnut husks and plantain peels as adsorbents. Adv. Chem. Engin. Sci. 2018, 8, 161–175. [Google Scholar] [CrossRef]
  17. Annam, A.R.; Jagadeesan, A.K.; Deivasigamani, P.; Sundararaman, S.; Balakrishna Pillai Sankari, N.P. The bio-adsorption competence of tailor made lemon grass adsorbents on oils: An in-vitro approach. Environ. Res. 2023, 222, 115332. [Google Scholar] [CrossRef]
  18. Wang, J.; Guo, X. Adsorption kinetic models: Physical meanings, applications, and solving methods. J. Hazard. Mater. 2020, 390, 122156. [Google Scholar] [CrossRef]
  19. Yousef, R.; Qiblawey, H.; El-Naas, M.H. Adsorption as a process for produced water treatment: A review. Processes 2020, 8, 1657. [Google Scholar] [CrossRef]
  20. Erkey, C.; Türk, M. Thermodynamics and kinetics of adsorption of metal complexes on surfaces from supercritical solutions. In Supercritical Fluid Science and Technology; Elsevier: Amsterdam, The Netherlands, 2021; Volume 8, pp. 73–127. [Google Scholar] [CrossRef]
  21. Andrade, C.A.; Zambrano-Intriago, L.A.; Oliveira, N.S.; Vieira, J.S.; Quiroz-Fernández, L.S.; Rodríguez-Díaz, J.M. Adsorption behavior and mechanism of oxytetracycline on rice husk ash: Kinetics, equilibrium, and thermodynamics of the process. Water Air Soil Pollut. 2020, 231, 103. [Google Scholar] [CrossRef]
  22. Jiménez, S.; Micó, M.; Arnaldos, M.; Medina, F.; Contreras, S. State of the art of produced water treatment. Chemosphere 2018, 192, 186–208. [Google Scholar] [CrossRef]
  23. Arthur, J.D.; Langhus, B.G.; Patel, C. Technical Summary of Oil and Gas Produced Water Treatment Technologies; EPA: Washington, DC, USA, 2005.
  24. El-Nafaty, U.A.; Muhammad, I.M.; Abdulsalam, S. Biosorption and kinetic studies on oil removal from produced water using banana peel. Civil Environ. Res. 2013, 3, 125–136. [Google Scholar]
  25. Pandia, S.; Hutagalung, A.T.; Siahaan, A.D. Utilization of Cocoa Peel as Biosorbent for oil and color removal in palm oil mill effluent (POME). IOP Conf. Ser. Mater. Sci. Eng. 2018, 300, 012066. [Google Scholar] [CrossRef]
  26. Pagnucco, R.; Phillips, M.L. Comparative effectiveness of natural by-products and synthetic sorbents in oil spill booms. J. Environ. Manag. 2018, 225, 10–16. [Google Scholar] [CrossRef] [PubMed]
  27. Fingas, M. Physical Spill Countermeasures. In Oil Spill Science and Technology; Fingas, M., Ed.; Elsevier Inc.: Amsterdam, The Netherlands, 2011. [Google Scholar] [CrossRef]
  28. Michel, J.; Fingas, M. Oil spills: Causes, consequences, prevention, and countermeasures. Fossil Fuels 2015, 1, 159–201. [Google Scholar] [CrossRef]
  29. Taufik, S.H.; Ahmad, S.A.; Zakaria, N.N.; Shaharuddin, N.A.; Azmi, A.A.; Khalid, F.E.; Merican, F.; Convey, P.; Zulkharnain, A.; Khalil, A.K. Rice straw as a natural sorbent in a filter system as an approach to bioremediate diesel pollution. Water 2021, 13, 3317. [Google Scholar] [CrossRef]
  30. Oliveira, L.M.T.M.; Saleem, J.; Bazargan, A.; Duarte, J.L.S.; McKay, G.; Meili, L. Sorption as a rapidly response for oil spill accidents: A material and mechanistic approach. J. Hazard. Mater. 2021, 407, 124842. [Google Scholar] [CrossRef]
  31. Dong, T.; Wang, F.; Xu, G. Theoretical and experimental study on the oil sorption behavior of kapok assemblies. Ind. Crops Prod. 2014, 325–330. [Google Scholar] [CrossRef]
  32. Bhardwaj, N.; Bhaskarwar, A.N. A review on sorbent devices for oil-spill control. Environ. Poll. 2018, 243, 1758–1771. [Google Scholar] [CrossRef]
  33. Khalid, F.E.; Ahmad, S.A.; Zakaria, N.N.; Shaharuddin, N.A.; Sabri, S.; Azmi, A.A.; Khalil, K.A.; Verasoundarapandian, G.; Gomez-Fuentes, C.; Zulkharnain, A. Application of cogon grass (Imperata cylindrica) as biosorbent in diesel-filter system for oil spill removal. Agronomy 2021, 11, 2273. [Google Scholar] [CrossRef]
  34. Puasa, N.A.; Ahmad, S.A.; Zakaria, N.N.; Shaharuddin, N.A.; Khalil, K.A.; Azmi, A.A.; Gomez-Fuentes, C.; Merican, F.; Zulkharnain, A.; Kok, Y.-Y.; et al. Utilisation of oil palm’s empty fruit bunch spikelets for oil-spill removal. Agronomy 2022, 12, 535. [Google Scholar] [CrossRef]
  35. Ali, N.; El-Harbawi, M.; Abo Jabal, A.; Yin, C.-Y. Environmental technology characteristics and oil sorption effectiveness of kapok fibre, sugarcane bagasse and rice husks: Oil removal suitability matrix. Environ. Technol. 2012, 33, 481–486. [Google Scholar] [CrossRef]
  36. Mahato, N.; Sharma, K.; Sinha, M.; Baral, E.R.; Koteswararao, R.; Dhyani, A.; Cho, M.H.; Cho, S. Bio-sorbents, industrially important chemicals and novel materials from citrus processing waste as a sustainable and renewable bioresource: A review. J. Adv. Res. 2020, 23, 61–82. [Google Scholar] [CrossRef]
  37. Pete, A.J.; Bharti, B.; Benton, M.G. Nano-enhanced bioremediation for oil spills: A review. ACS EST Engg. 2021, 1, 928–946. [Google Scholar] [CrossRef]
  38. Azat, S.; Korobeinyk, A.V.; Moustakas, K.; Inglezakis, V.J. Sustainable production of pure silica from rice husk waste in Kazakhstan. J. Clean. Prod. 2019, 217, 352–359. [Google Scholar] [CrossRef]
  39. Al-Doury, M.K.W.; Hettiarachchy, N.S.; Horax, R. Rice-endosperm and rice-bran proteins: A review. J. Am. Oil Chem. Soc. 2018, 95, 943–956. [Google Scholar] [CrossRef]
  40. Alyosef, H.A.; Eilert, A.; Welscher, J.; Ibrahim, S.S.; Denecke, R.; Schwieger, W.; Enke, D. Characterization of biogenic silica generated by thermo chemical treatment of rice husk. Part. Sci. Technol. 2013, 31, 524–532. [Google Scholar] [CrossRef]
  41. Liu, J.; Xie, C.; Fu, C.; Wei, X.; Wu, D. Hydrochloric acid pretreatment of different types of rice husk ash influence on the properties of cement paste. Materials 2020, 13, 1524. [Google Scholar] [CrossRef]
  42. Zamparas, M.; Tzivras, D.; Dracopoulos, V.; Ioannides, T. Application of sorbents for oil spill cleanup focusing on natural-based modified materials: A review. Molecules 2020, 25, 4522. [Google Scholar] [CrossRef]
  43. Hoang, A.T.; Nguyen, X.P.; Duong, X.Q.; Huynh, T.T. Sorbent-based devices for the removal of spilled oil from water: A review. Environ. Sci. Pollut. Res. 2021, 28, 28876–28910. [Google Scholar] [CrossRef]
  44. Lam, S.S.; Liew, R.K.; Cheng, C.K.; Rasit, N.; Ooi, C.K.; Ma, N.L.; Ng, J.-H.; Lam, W.H.; Chong, C.T.; Chase, H.A. Pyrolysis production of fruit peel biochar for potential use in treatment of palm oil mill effluent. J. Environ. Manag. 2018, 213, 400–408. [Google Scholar] [CrossRef] [PubMed]
  45. El Gheriany, I.A.; Ahmad El Saqa, F.; Abd El Razek Amer, A.; Hussein, M. Oil spill sorption capacity of raw and thermally modified orange peel waste. Alex. Eng. J. 2020, 59, 925–932. [Google Scholar] [CrossRef]
  46. Verasoundarapandian, G.; Zakaria, N.N.; Shaharuddin, N.A.; Khalil, K.A.; Puasa, N.A.; Azmi, A.A.; Gomez-Fuentes, C.; Zulkharnain, A.; Wong, C.Y.; Rahman, M.F.; et al. Coco peat as agricultural waste sorbent for sustainable diesel-filter system. Plants 2021, 10, 2468. [Google Scholar] [CrossRef] [PubMed]
  47. Ahmad, R.; Hamid, R.; Osman, S.A. Physical and chemical modifications of plant fibres for reinforcement in cementitious composites. Adv. Civ. Eng. 2019, 2019, 5185806. [Google Scholar] [CrossRef]
  48. Li, W.C.; Law, F.Y.; Chan, Y.H.M. Biosorption studies on copper (II) and cadmium (II) using pretreated rice straw and rice husk. Environ. Sci. Pollut. Res. 2015, 24, 8903–8915. [Google Scholar] [CrossRef] [PubMed]
  49. Lee, W.-J.; Yu, C.-Y.; Chen, Y.-C. Preparation and characteristics of polyurethane made with polyhydric alco-hol-liquefied rice husk. J. Appl. Polym. Sci. 2017, 135, 45910. [Google Scholar] [CrossRef]
  50. Anuzyte, E.; Vaisis, V. Natural oil sorbents modification methods for hydrophobicity improvement. Energy Procedia 2018, 147, 295–300. [Google Scholar] [CrossRef]
  51. Emdadi, Z.; Asim, N.; Yarmo, M.A.; Sopian, K. Effect of chemical treatments on rice husk (RH) water absorption property. Int. J. Chem. Eng. Appl. 2015, 6, 273. [Google Scholar] [CrossRef]
  52. Nassar, H.N.; El-azab, W.I.M.; El-Gendy, N.S. Sustainable ecofriendly recruitment of bioethanol fermentation lignocellulosic spent waste biomass for the safe reuse and discharge of petroleum production produced water via biosorp-tion and solid biofuel production. J. Hazard. Mater. 2022, 422, 126845. [Google Scholar] [CrossRef]
  53. Kenes, K.; Yerdos, O.; Zulkhair, M.; Yerlan, D. Study on the effectiveness of thermally treated rice husks for petroleum adsorption. J. Non Cryst. Solids 2012, 358, 2964–2969. [Google Scholar] [CrossRef]
  54. Alam, M.K.; Bell, R.W.; Hasanuzzaman, M.; Salahin, N.; Rashid, M.H.; Akter, N.; Akhter, S.; Islam, M.S.; Islam, S.; Naznin, S.; et al. Rice (Oryza sativa L.) establishment techniques and their implications for soil properties, global warming potential mitigation and crop yields. Agronomy 2020, 10, 888. [Google Scholar] [CrossRef]
  55. Wong, C.; McGowan, T.; Bajwa, S.G.; Bajwa, D.S. Impact of fiber treatment on the oil absorption characteristics of plant fibers. Bioresources 2016, 11, 6452–6463. [Google Scholar] [CrossRef]
  56. Xu, Y.; Shen, H.; Xu, G. Evaluation of oil sorption kinetics behavior and wetting characteristic of cattail fiber. Cellulose 2020, 27, 1531–1541. [Google Scholar] [CrossRef]
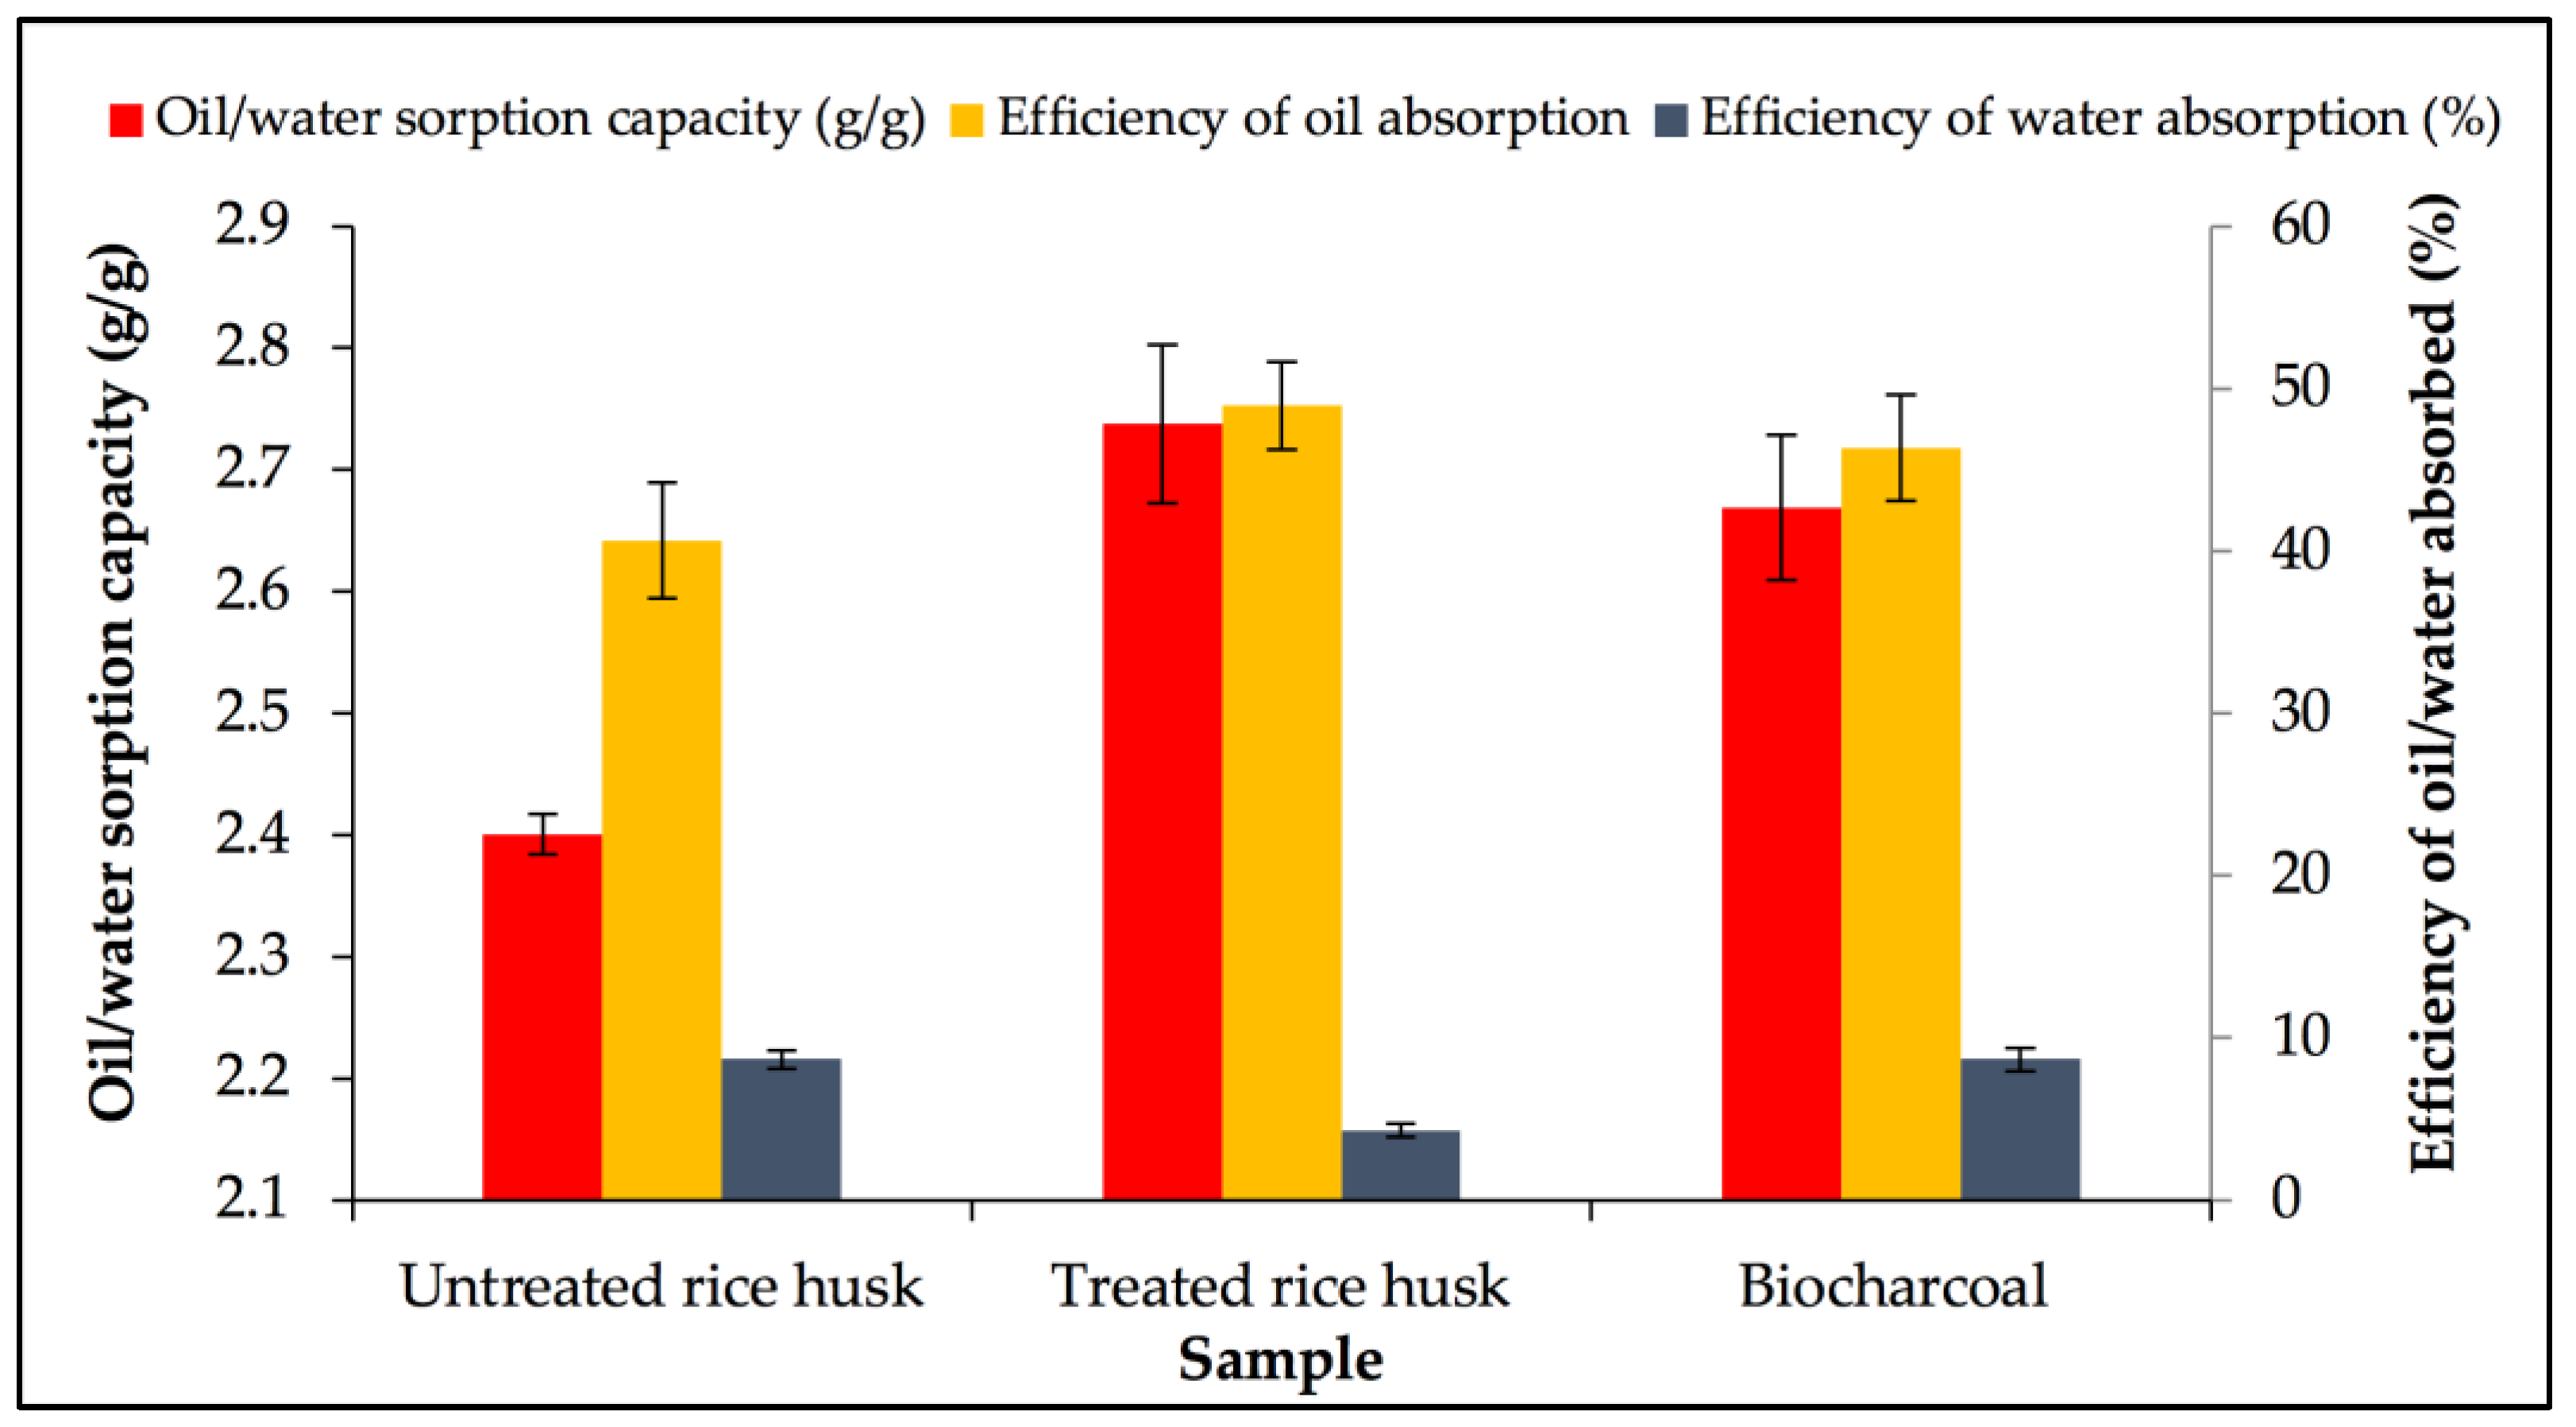
Figure 1. Screening of untreated and treated RH samples and biocharcoal sample.
Sustainability 15 14599 g001
Figure 2. FTIR spectroscopy of untreated, treated, and biocharcoal RH before wetting with engine oil–water mixture.
Sustainability 15 14599 g002
Figure 3. FTIR spectroscopy of untreated, treated, and biocharcoal RH after wetting with engine oil–water mixture.
Sustainability 15 14599 g003
Figure 4. Images from SEM: (ac) untreated, treated, and biocharcoal RH before wetting with engine oil–water mixture at 500× magnification.
Sustainability 15 14599 g004
Figure 5. Images from SEM: (ac) untreated, treated, and biocharcoal RH before wetting with engine oil–water mixture at 2500× magnification.
Sustainability 15 14599 g005
Figure 6. The effects of temperature on sorption and efficiency of engine oil–water absorbed by RH.
Sustainability 15 14599 g006
Figure 7. The effects of time of heating on the sorption capacity and efficiency of oil/water absorption by RH treated at 160 °C.
Sustainability 15 14599 g007
Figure 8. The effects of packing density on the sorption capacity and efficiency of oil/water absorption by RH treated at 160 °C and for 60 min.
Sustainability 15 14599 g008
Figure 9. The effects of engine oil concentration and efficiency of oil/water absorption by RH treated at 160 °C for 60 min and packed at 0.16 g/cm3.
Sustainability 15 14599 g009
Figure 10. Three-dimensional contour plot made through Design-Expert 13.0 (Stat-Ease, Inc., Minneapolis, MN, USA). A: packing density and B: engine oil concentration.
Sustainability 15 14599 g010
Table 1. Secondary screening of significant parameters affecting engine oil sorption using Plackett–Burman design (PBD).
RunABCDResponse 1
Oil Efficiency (%)
Response 2
Water Efficiency (%)
1180300.125.081.679.17
2165450.1612.576.679.33
3165450.1612.576.008.83
4180600.205.097.3310.08
5150600.2020.062.509.25
6150300.205.098.509.75
7165450.1612.574.678.42
8180600.125.096.509.33
9150300.1220.045.008.67
10165450.1612.576.679.41
11150600.1220.049.589.25
12180300.2020.062.509.17
13150300.125.081.677.58
14165450.1612.577.339.47
15180600.1220.054.5810.92
16165450.1612.580.009.58
17150600.205.098.679.25
18180300.2020.066.679.50
A: temperature (°C); B: time of heating (min); C: packing density (g/cm3); D: oil concentration % (v/v).
Table 2. ANOVA analysis for the PBD model to evaluate the significant factors affecting engine oil sorption by RH.
SourceSum of SquaresDFMean SquareF-Valuep-Value
Model4384.8441096.2196.73<0.0001significant
A: Temperature45.37145.374.000.0685
B: Time44.72144.723.950.0703
C: Packing density496.221496.2243.79<0.0001
D: Engine oil concentration3798.5213798.52335.20<0.0001
Curvature21.01121.011.850.1984
Residual135.991211.33
Lack of Fit111.60618.604.580.0433significant
Pure Error24.3864.06
Cor Total4541.8317
Std. Dev.3.37R20.9699
Mean75.36Adjusted R20.9599
C.V.%4.47Predicted R20.9168
Adeq precision20.125
Table 3. Secondary screening of significant parameters affecting engine oil sorption using a CCD.
RunABResponse 1
Oil Efficiency (mL)
Response 2
Water Efficiency (mL)
10.125.0090.007.92
20.1612.5075.339.00
30.1612.5078.008.92
40.1612.5078.008.92
50.1220.0046.257.67
60.2020.0058.338.83
70.205.0099.839.50
80.161.89100.008.25
90.1612.5078.008.67
100.1612.5073.338.83
110.2212.5091.339.42
120.1012.5066.678.67
130.1623.1150.969.42
A: Packing density (g/cm3); B: engine oil concentration % (v/v).
Table 4. ANOVA analysis for the CCD model to evaluate the significant factors affecting engine oil sorption by RH.
SourceSum of SquaresDFMean SquareF-Valuep-Value
Model3408.875681.7749.14<0.0001significant
A-Packing density403.291403.2929.070.0010
B-Engine oil concentration2988.1012988.10215.36<0.0001
AB1.2711.270.09120.7714
A20.733710.73370.05290.8247
B214.36114.361.040.3429
Residual97.12713.87
Lack of Fit78.99326.335.810.0611not significant
Pure Error18.1344.53
Cor Total3505.9912
Std. Dev.3.72 R20.9723
Mean75.85 Adjusted R20.9525
C.V.%4.91 Predicted R20.8317
Adeq precision21.7175
Table 5. Model validation for using the optimum condition.
Optimised FactorsValuePredicted ValueExperimental Value
Packing density0.16 g/cm349 mL of engine oil with 30 mL of water *49 mL of engine oil with 30 mL of water
±1 mL *
Engine oil concentration12.5% (v/v)
* The p-value that is statistically significant between predicted and experimental values (p = 0.9999).
Disclaimer/Publisher’s Note: The statements, opinions and data contained in all publications are solely those of the individual author(s) and contributor(s) and not of MDPI and/or the editor(s). MDPI and/or the editor(s) disclaim responsibility for any injury to people or property resulting from any ideas, methods, instructions or products referred to in the content.