Article

Unravelling Complex Interaction among Coastal Management and Marine Biodiversity: A Case Study in Southern Spain

by
Paloma Alcorlo
1,2,*,
Susana García-Tiscar
1,
María Rosario Vidal-Abarca
3,
María Luisa Suárez-Alonso
3 and
Fernando Santos-Martín
4
1
Department of Ecology Universidad Autónoma de Madrid, C/Darwin 2, Edificio de Biología, Universidad Autónoma de Madrid, 28049 Madrid, Spain
2
Centro de Investigación en Biodiversidad y Cambio Global (CIBC), Department of Ecology, C/Darwin 2, Edificio de Biología, Universidad Autónoma de Madrid, 28049 Madrid, Spain
3
Department of Ecology and Hydrology, Regional Campus of International Excellence “Campus Mare Nos-trum”-Universidad de Murcia, Campus de Espinardo, 30100 Murcia, Spain
4
Department of Chemical and Environmental Technology, Campus de Móstoles, Universidad Rey Juan Carlos, 28933 Madrid, Spain
*
Author to whom correspondence should be addressed.
Sustainability 2023, 15(8), 6544; https://doi.org/10.3390/su15086544
Submission received: 16 February 2023 / Revised: 30 March 2023 / Accepted: 7 April 2023 / Published: 12 April 2023

Abstract

:
In this work, we use an integrated modelling approach to explore the complex relationships and interconnections in marine ecosystems among anthropogenic pressures, biodiversity loss, delivery of ecosystem services (ES), and implemented conservation and management strategies. We selected 60 indicators at regional (34), national (12) and international (14) scales that provided long-term information during the 1985–2019 time frame. The results show a decline in marine biodiversity and its associated provisioning services despite the increasing number of responses delivered by a society which are not enough and/or need more time to exert their effects and highlight the pressure on exploited species of unknown conservation status. The decline in Provisioning ES is explained by the decrease in the overall biomass of the captures, mostly large and carnivorous commercially-targeted species and the increase in the number of small-bodied fish species included in the IUCN Red List. The degradation of ecosystem integrity and the continuing loss of biodiversity affect the ability of the ecosystem to provide Regulating ES. The Cultural ES delivery, related to artisanal fisheries, is better preserved in the Gulf of Cádiz. We conclude how the implementation of new management regulations is needed and should be developed through participatory processes to protect and improve marine ecosystem status.

1. Introduction

Marine ecosystems have been a source of multiple services (i.e., food, climate regulation) and contribute to human wellbeing. There is evidence of pelagic fisheries in the Pacific Ocean as old as 42,000 years [1], and in the Mediterranean Sea, Neanderthals exploited coastal resources, including molluscs, fish, and marine mammals in the upper Palaeolithic [2].
The development of human societies and technologies has allowed the exploitation of a wide variety of coastal and marine ecosystems around the globe. The emergence of other ecosystem services (ESs) associated with marine and coastal ecosystems goes beyond the provisioning function, especially regulating and cultural ESs that intimately connect natural systems to human societies, such as global climate regulation, recreational activities, or artisanal fisheries [3,4]. The importance of these ESs to human populations has exponentially increased during the last century [5]. In fact, the world fisheries sector reached an all-time production record in 2018, when 96.4 million tons of marine fish, molluscs, crustaceans, and other invertebrates were captured [6], with at least 34.2% of the assessed world stocks overexploited [6,7,8]. This situation dramatically increases in the Mediterranean Sea, and according to the Scientific Technical Economic Committee for Fisheries of the European Commission (STECF), 83% of the assessed fish stocks are overexploited [9]. This level of exploitation is both a cause and consequence of a “single species” managing strategy, in which the main goal is to keep all exploited stocks at their maximum sustainable yield simultaneously. Two main strategies have been set in motion during recent decades to address this situation: Marine Protected Areas (MPAs) with different levels of allowed fishing activities and focusing on spaces and conservation efforts and the Ecosystem-Based Fisheries Management (EBFM) approach for exploited stocks focusing on fishing stocks and resource management.
MPAs with different degrees of use and exploitation have been an important conservation tool for marine ecosystems during the last 25 years [10,11,12,13] and are part of conservation programs set by the Convention on Biological Diversity (Decision VII/5 of the 2004 COP [14]), the United Nations Environment Program [15], the European Union [16], and national governments (i.e., Spanish marine protection law, [17]). The scientific and social awareness of the distressed state of the oceans and marine biodiversity and positive experiences regarding the implementation of “no-take” areas have given impulse to the creation of new MPAs in every world ocean.
The EBFM strategy arises as a response to the traditional “single-stock” managing procedure that focuses exclusively on the provisioning service of the fishing activity. This ecosystem approach includes multiple species assessments and evaluations of the fishing stocks and considers possible relationships within the considered species assembly and with other species. It also takes into account the effects of the fishing industry on nonexploited biodiversity, ecosystem functioning and other ecosystem services [18,19,20,21,22].
Managing fisheries in a sustainable way that allows the production of high-quality food, income, and livelihood for human societies depending upon the fisheries, understanding the way fisheries create other ESs beyond provisioning, and minimising the negative effects on biodiversity are the challenges for the 21st century. The ES framework merges human needs and impacts with biodiversity state and conservation issues, allowing for an integrated decision-making process when managing coastal and marine ecosystems.
The objective of this work is to identify and understand the main interactions between marine ES and biodiversity and to assess the impact of different marine and coastal management strategies. We hypothesise that anthropogenic pressures increase marine biodiversity loss and decrease their associated ecosystem services, thus, decreasing the delivery of ecosystem services. Indeed, biodiversity loss impacts the conservation policy responses positively through the launching of regulations and MPAs.

2. Materials and Methods
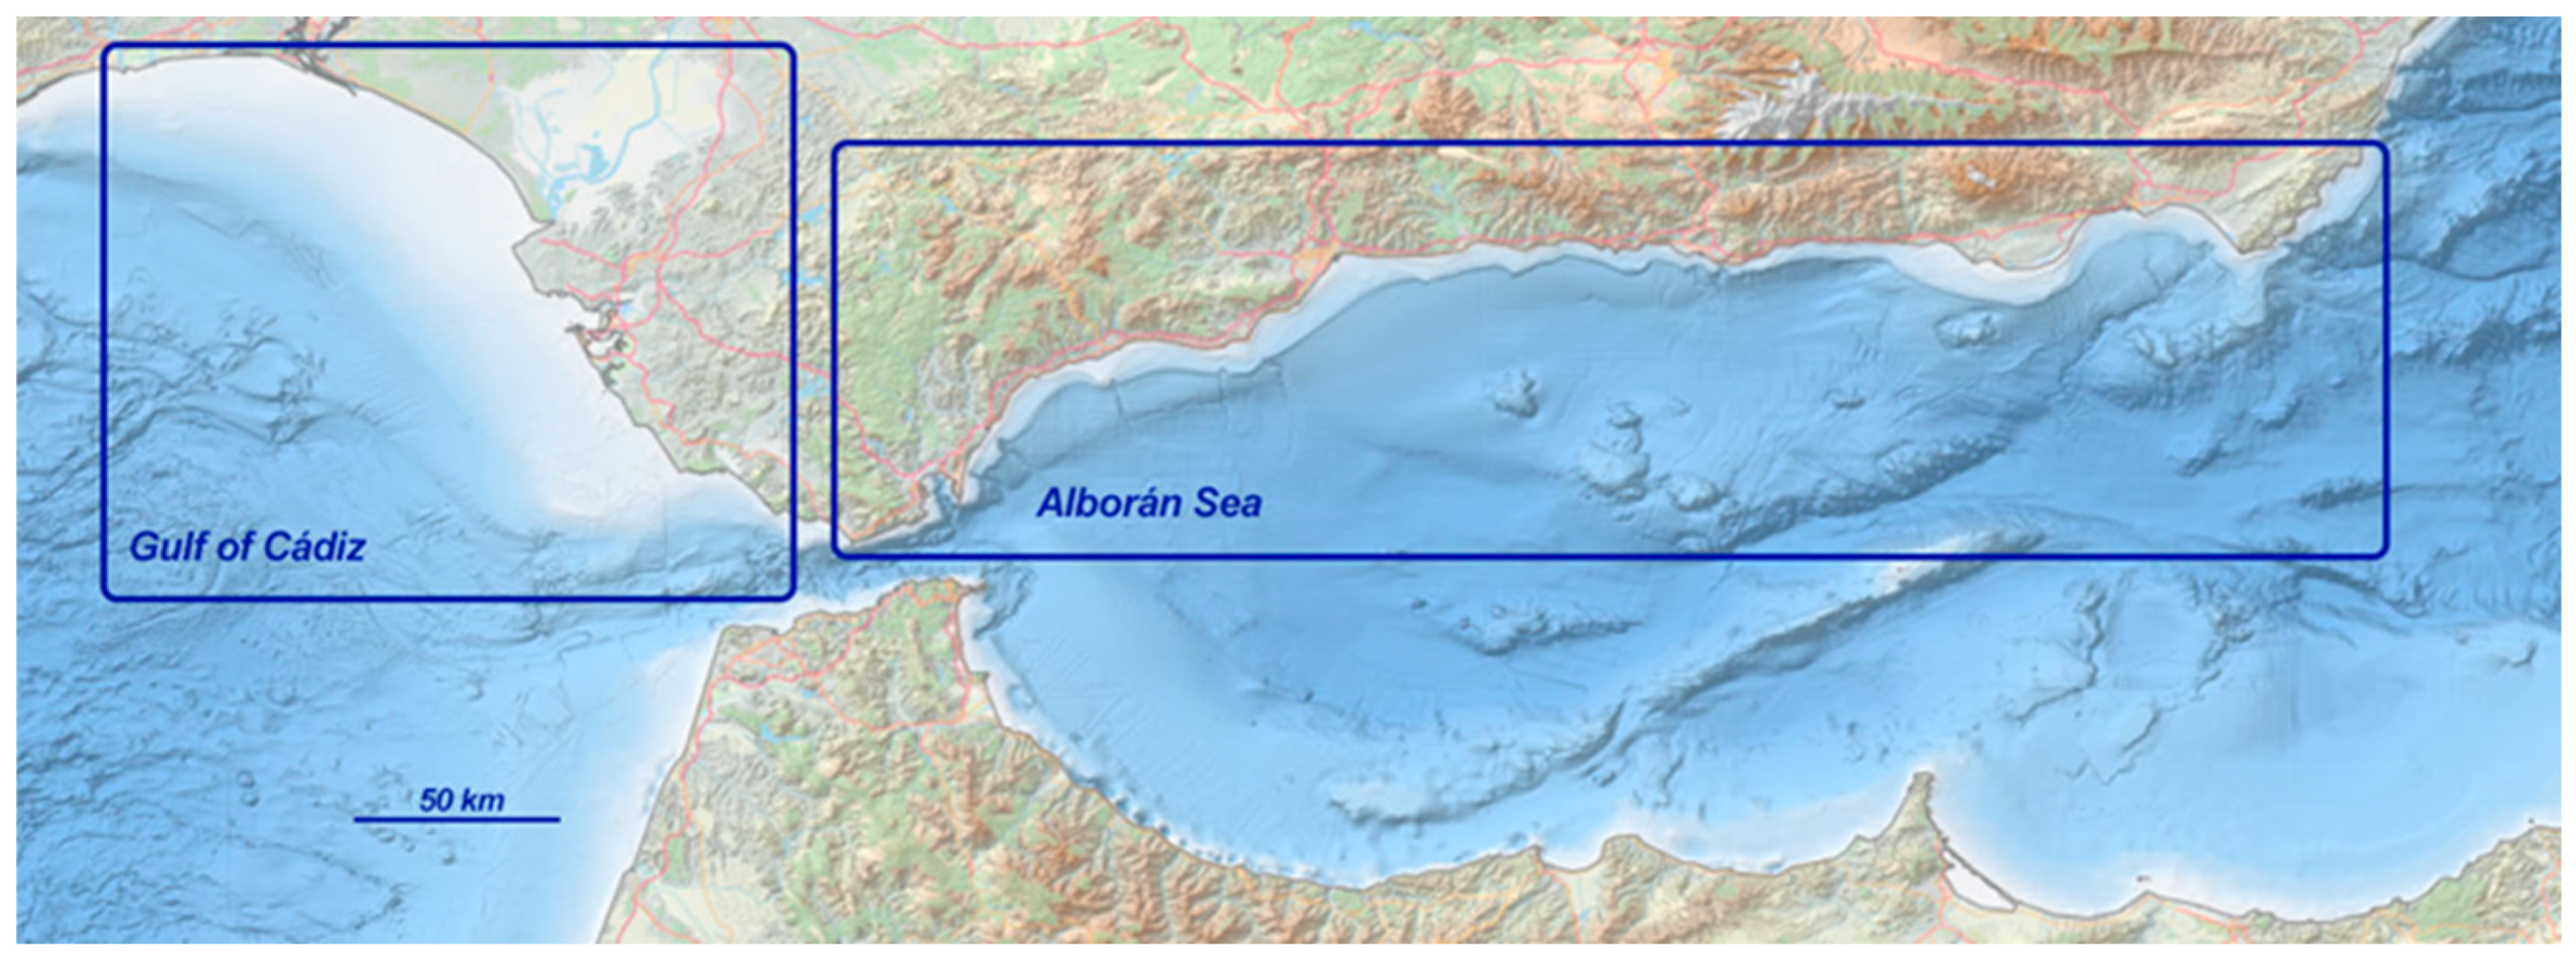
2.1. Study Area

The study area is located in two biodiversity hot spot areas [23,24,25]: (i) the Alborán Sea and (ii) the Gulf of Cádiz (Figure 1). They were chosen because they are included in the same administrative region, the Autonomous Community of Andalusia, but they belong to two different marine Demarcations and present different physiographic attributes. Due to biogeographic differences, the Alborán Sea and Gulf of Cádiz were studied separately, and every indicator was obtained separately for both areas, except those related to the conservation and management normative delivered at a regional scale.
The Alborán Sea is located in the westernmost part of the Mediterranean. It is a region of extraordinary oceanographic conditions due to its position in the transition zone between two seas: the Atlantic Ocean and the Mediterranean Sea, and its complex orography. It is in contact with the Atlantic Ocean through the Strait of Gibraltar, which, with a depth of approximately 350 m and approximately 14 km wide, is the only passage of water between the Mediterranean Sea and the Atlantic. The continental shelf is narrow, with an average width of 5 km and an average depth of 100 m. The continental slope is very complex and has numerous canyons and collapses [26]. The Alborán Sea basin is divided into two “subbasins” by a submarine ridge that extends in a southwest-northeast direction and rises to the surface at its northeastern end, giving rise to the island of Alborán. The average depth of the western subbasin is 500 m, reaching a maximum depth of 1300 m. The eastern subbasin reaches depths between 1800 and 2000 m and is separated from the Algerian-Balearic basin by a 500 m slope [27]. This set of oceanographic, physiographic, and climatic conditions forms bodies of deep waters rich in nutrients that are more or less deep depending on the meteorological conditions but never disappear and give rise to areas of great wealth, making the Alborán Sea one of the most productive areas of the entire Mediterranean with primary productivity of up to 150 mg/m2 [28,29,30].
The Gulf of Cádiz is located on the Atlantic side of Andalusia, has a continental shelf of extremely variable width, is wide in the central zone (where the 100 m isobath is approximately 50 km from the coast) and it narrows when approaching Portugal and the Strait of Gibraltar. The continental slope conforms to the 200 m bathymetric curve. It is a stretched seabed with a gentle slope and mostly sandy sediments. The continental slope is more complex in relief and includes canyons and ravines corresponding to the mouth of the Guadiana River. In the Gulf of Cádiz, there are also three abyssal plains more than 4300 m deep, separated from each other by seamounts. There are also two particularities of interest: mud volcanoes located in the central sector of the middle slope at depths between 700–1100 m and carbonate deposits that form chimneys through which methane gas is expelled and that give rise to unique ecosystems due to their metabolism based mainly on this gas. For the purposes of marine water circulation, the Gulf of Cádiz is connected to the water inlet system from the Atlantic to the Mediterranean through the Strait of Gibraltar. Studies carried out in recent years [31,32,33,34,35] show that the biodiversity of the Gulf of Cádiz goes far beyond the simple presence of species of commercial interest and that there is an important information gap regarding species without commercial interest, especially when the focus moves away from the coast.

2.2. Indicators Selection and Data Sources

The time series of the indicators in this study covers three decades, spanning the period 1985–2019. Indicators were evaluated separately for each of the two study areas that are characterised by distinct environmental features, species composition and fishing pressure. The collected indicators were chosen following three main criteria: (1) indicators containing rigorous and contrasting information proceeding from official statistical databases and repositories; (2) indicators are temporally explicit, meaning that trends could be measured through a time frame (1985–2019); (3) indicators are quantifiable, and they could be easily compared.
Eleven of the indicators were related to biodiversity loss representing the “exploited marine biodiversity” (i.e., number of captured bony fish, cartilaginous fish, mollusc and crustacean species) and the “jeopardised marine biodiversity” (i.e., changes in Conservation IUCN threatened categories (NT, VU, EN, and CR, [36]) for captured species, seabirds, cetaceans and sea turtles, as well as the species included in the Spanish and Andalusian Catalogues of threatened species). Seven indicators were related to ESs: two of provisioning, extracted from biomass of all landed species data of the Andalusian Regional Government; and the number of fish producer organisations, fishermen associations, and business associations representative of the fisheries and aquaculture sector; three of cultural (i.e., variables summarising the development of artisanal fishing gear (number, Gross tonnage and Total power of artisanal fleet vessels), and two of Regulating ESs (i.e., proxies of ecosystem integrity: Trophic Marine Index and (MTI) and Primary Productivity Required (PPR)). In addition, five anthropogenic pressures, the direct drivers of change, were subdivided into three main groups: (1) overexploitation (i.e., variables summarising the development of industrial fishing gear, number, gross tonnage, and power of industrial fisheries fleet vessels), (2) demographic (i.e., human population density in the coastal area), and (3) land use change (i.e., the transformation of coastal ecosystems). Conservation responses derived from biodiversity loss were measured using 19 indicators (e.g., MPAs’ number and size and regulations). Finally, 14 indicators regarding management policies were also gathered at regional, national, and international scales. All compiled indicators gathered and/or estimated on a yearly basis, their assignment to the different blocks of the path analysis dimensions, and the data source used for obtaining the database are summarised in Table S1.
Additionally, we found a limited amount of information regarding the presence in the marine areas of cetaceans, seabirds, and marine turtles [37,38,39,40,41,42,43,44], and we included them in the analysis, when possible, i.e., when the amount of data was large enough to be comparable with the other indicators. It is important to state that all fish and shellfish (molluscs and crustaceans) data used in this work are landings of commercially exploited species and do not necessarily reflect the actual biomass removed from the ocean that can be higher due to illegal fishing and discards [33].

2.3. Temporal Trends of Indicators

For a better understanding of the overall models, the general trends of the indicators were examined (Figures S1 and S2). The main concern was the extreme decline of the state of biodiversity in the Gulf of Cádiz and in the Alborán Sea over the period of study. In both marine regions, the indicators related to exploited and jeopardised biodiversity loss have steadily increased since 1985. The delivery of ESs followed different trends in each studied area. In the Gulf of Cádiz, all the ESs had a decreasing trend with a breakpoint in 2000. In the Alborán Sea, the Provisioning ES showed a decreasing trend along the time series, but the rest of the ESs followed a less clear pattern. In addition, in both areas, indicators related to Conservation and Management policies reached another tipping point in 2009–2010, when the implementation of the new marine protected areas belonging to the Natura 2000 Network began, including their associated Sites of Community Importance (hereafter SCIs), Special Protection Areas (SPAs) and Special Areas of Conservation (SACs) as explained in WWF (2014) [45]. The overexploitation indicator declined over time, whereas the spatial transformation of the coast and population increased over time in both areas.

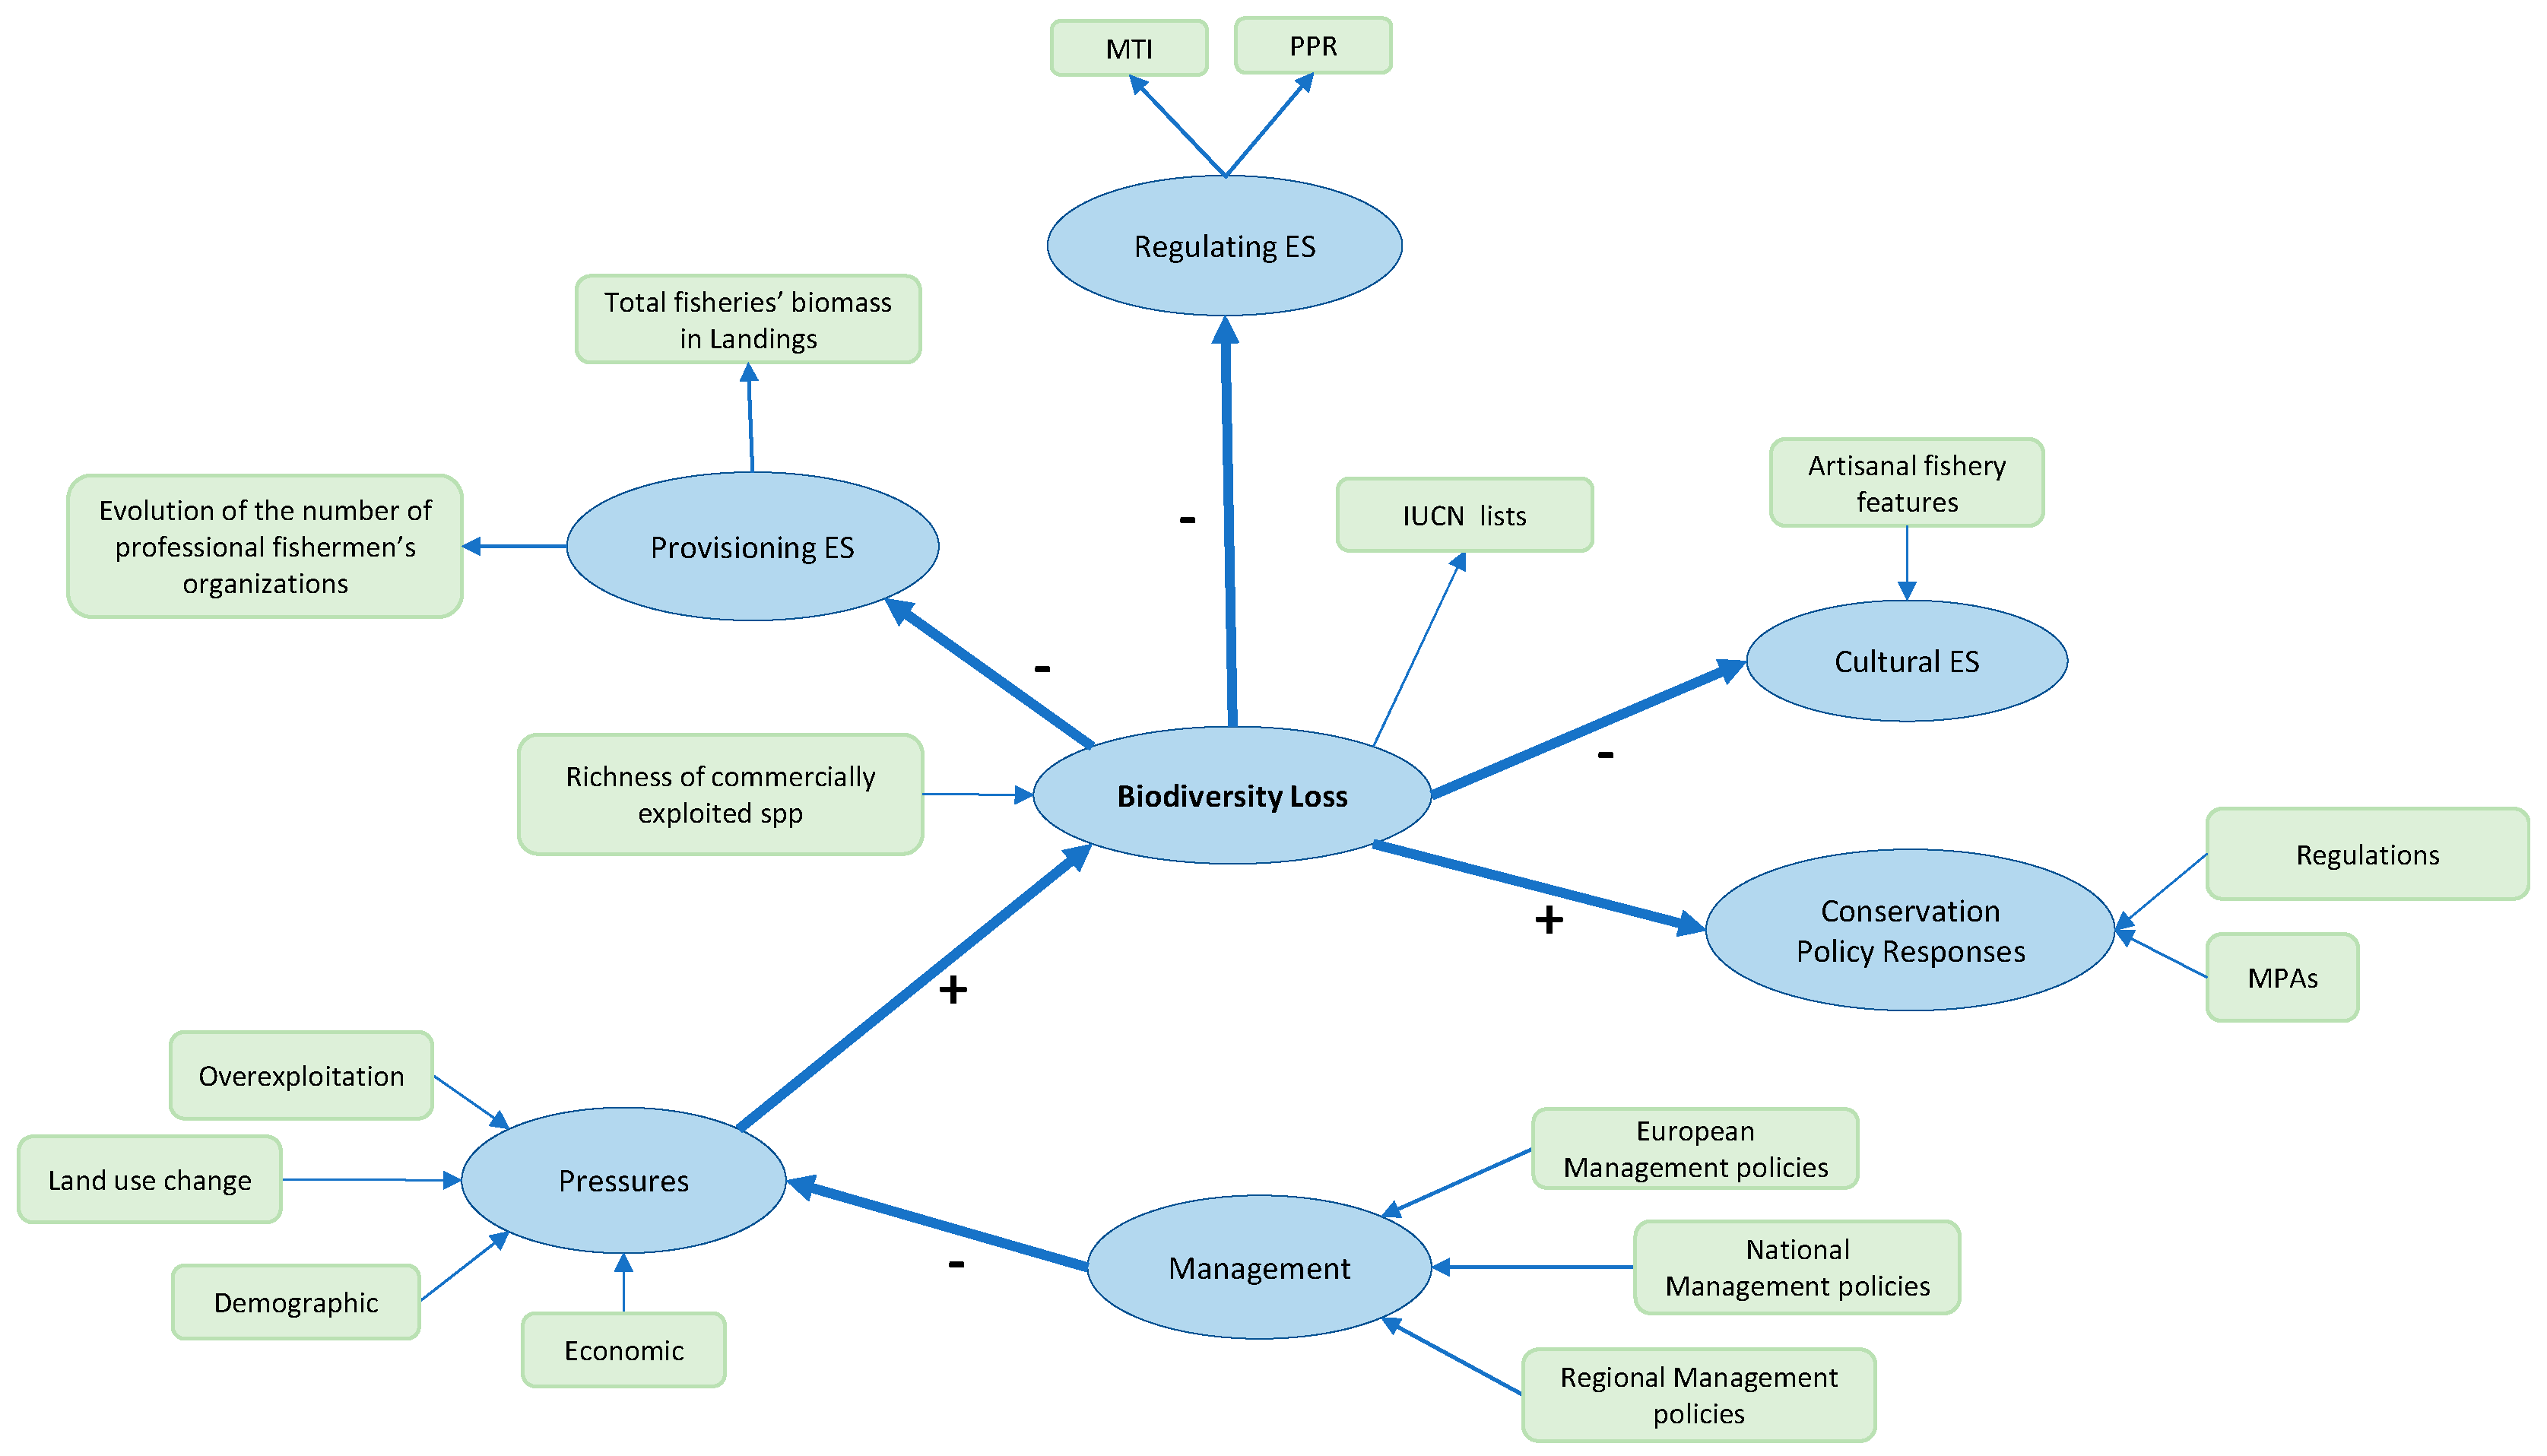
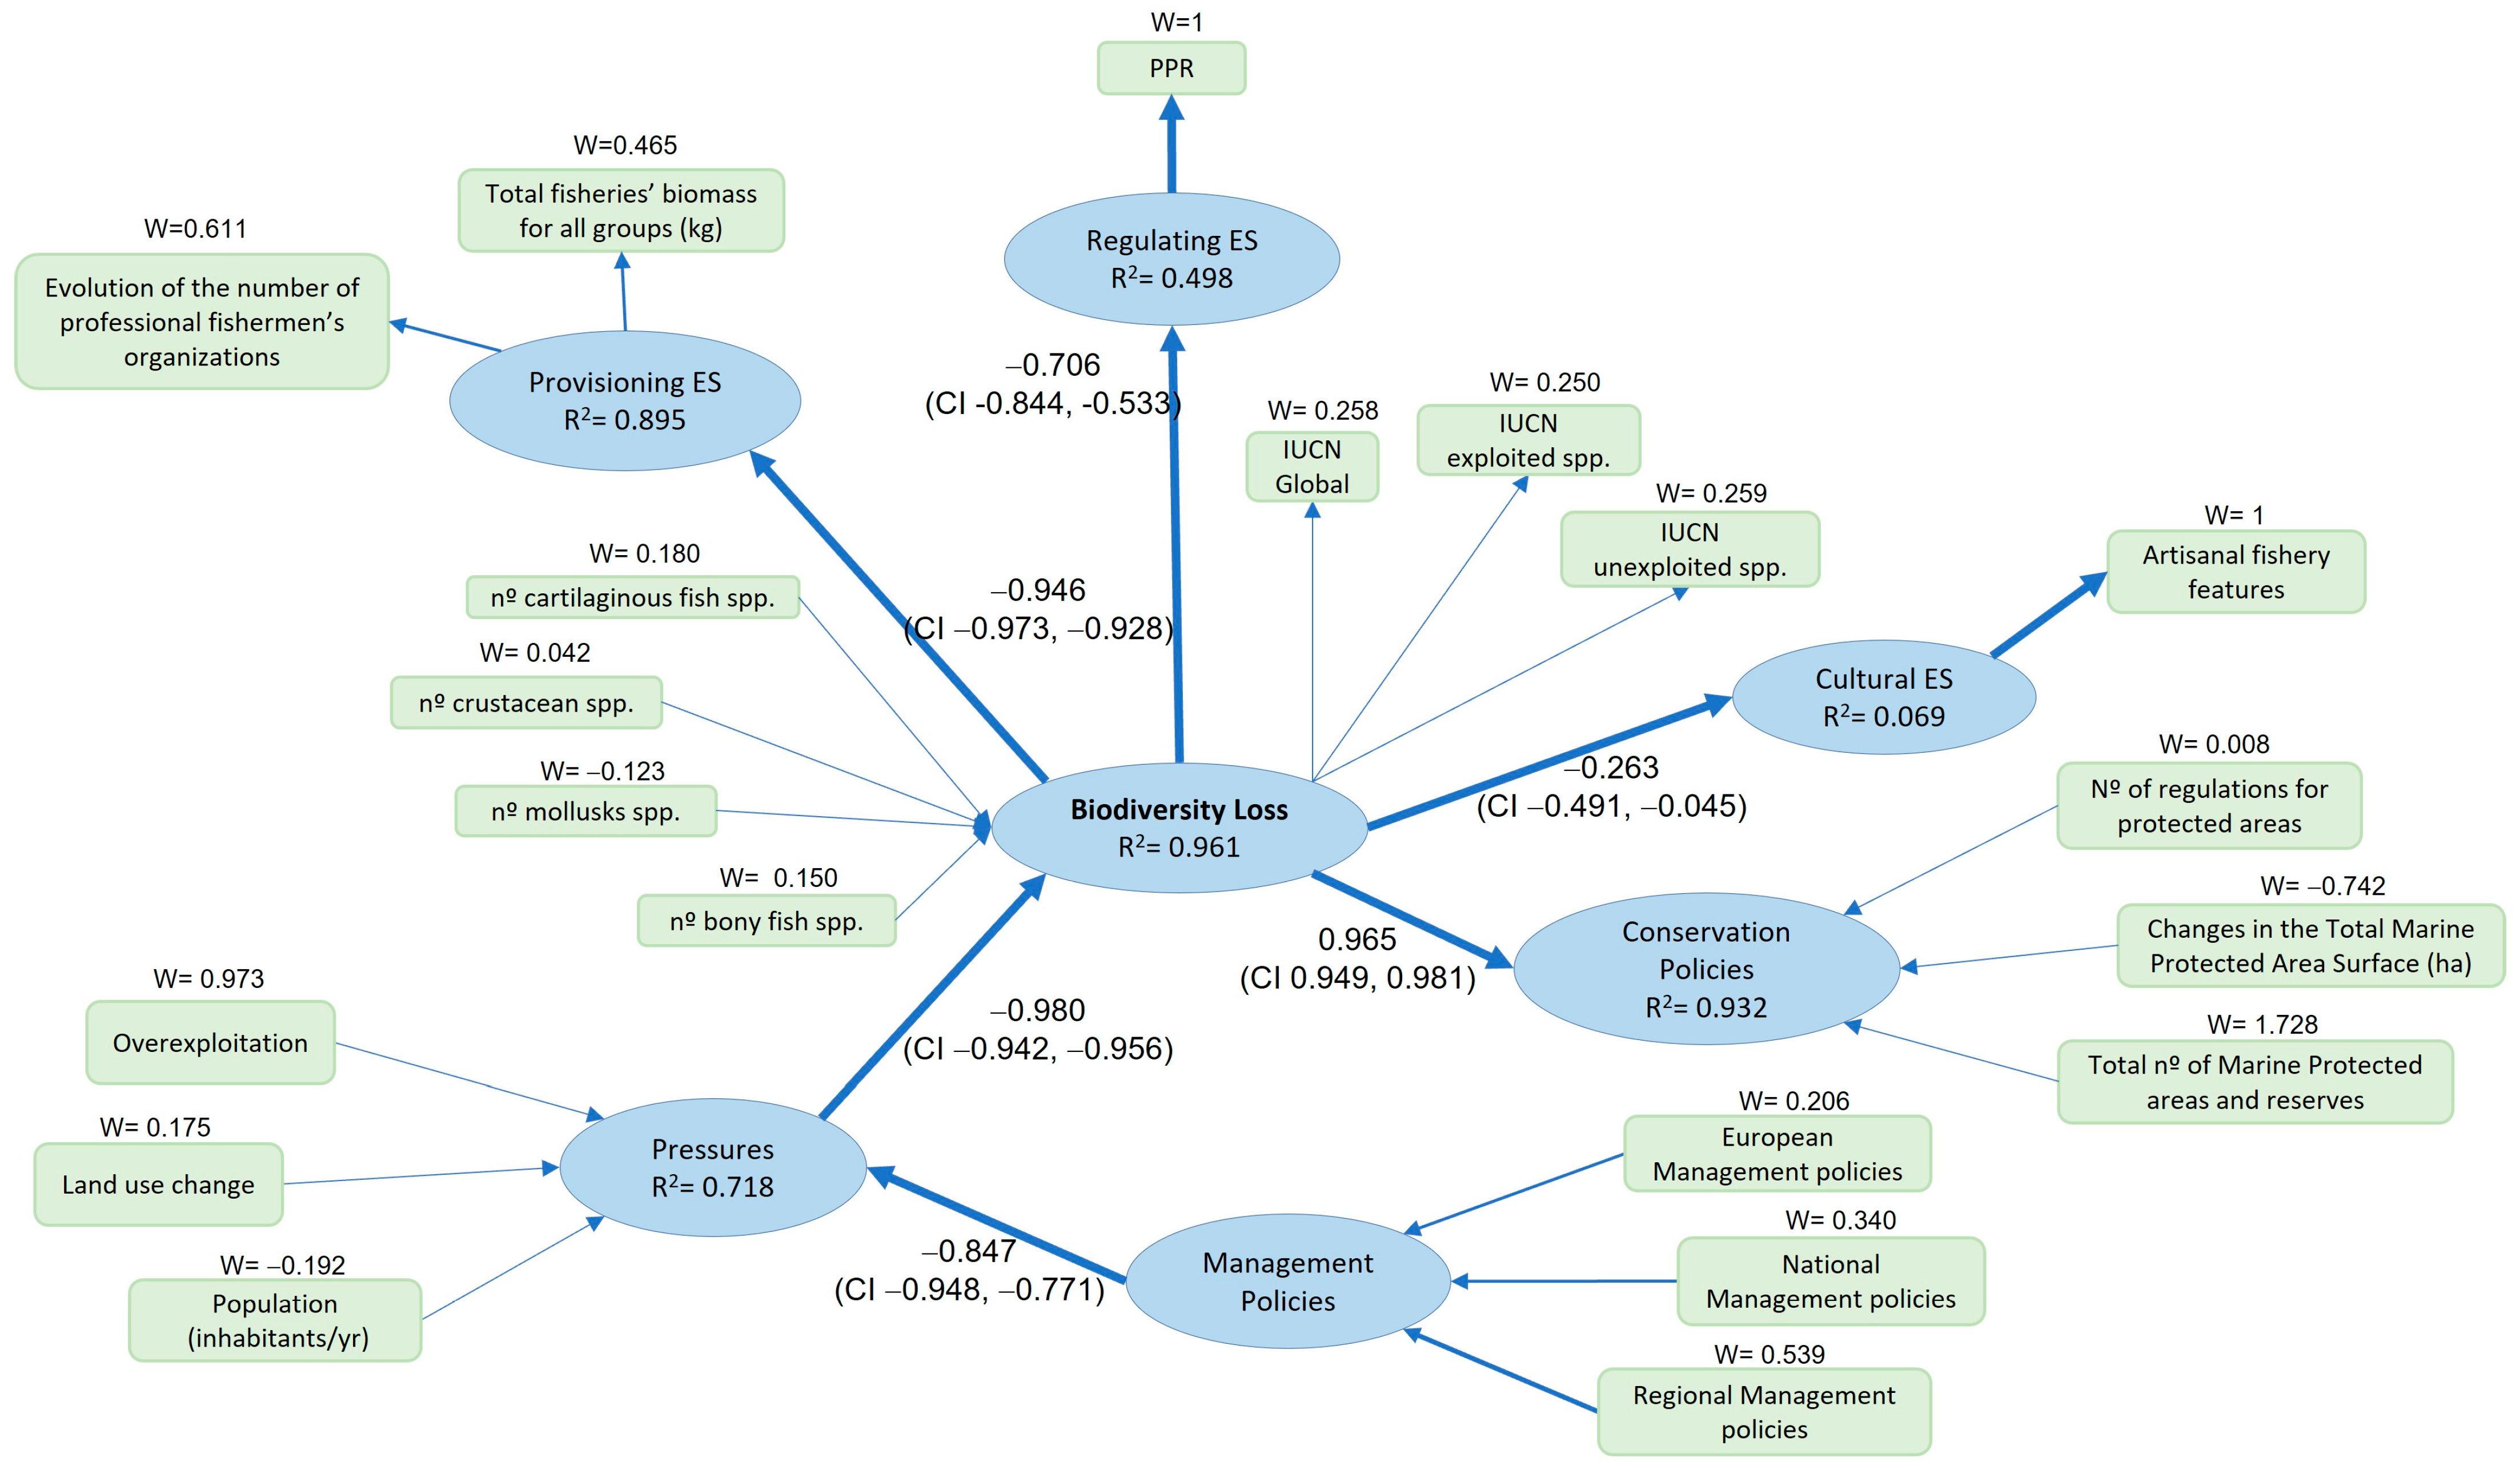
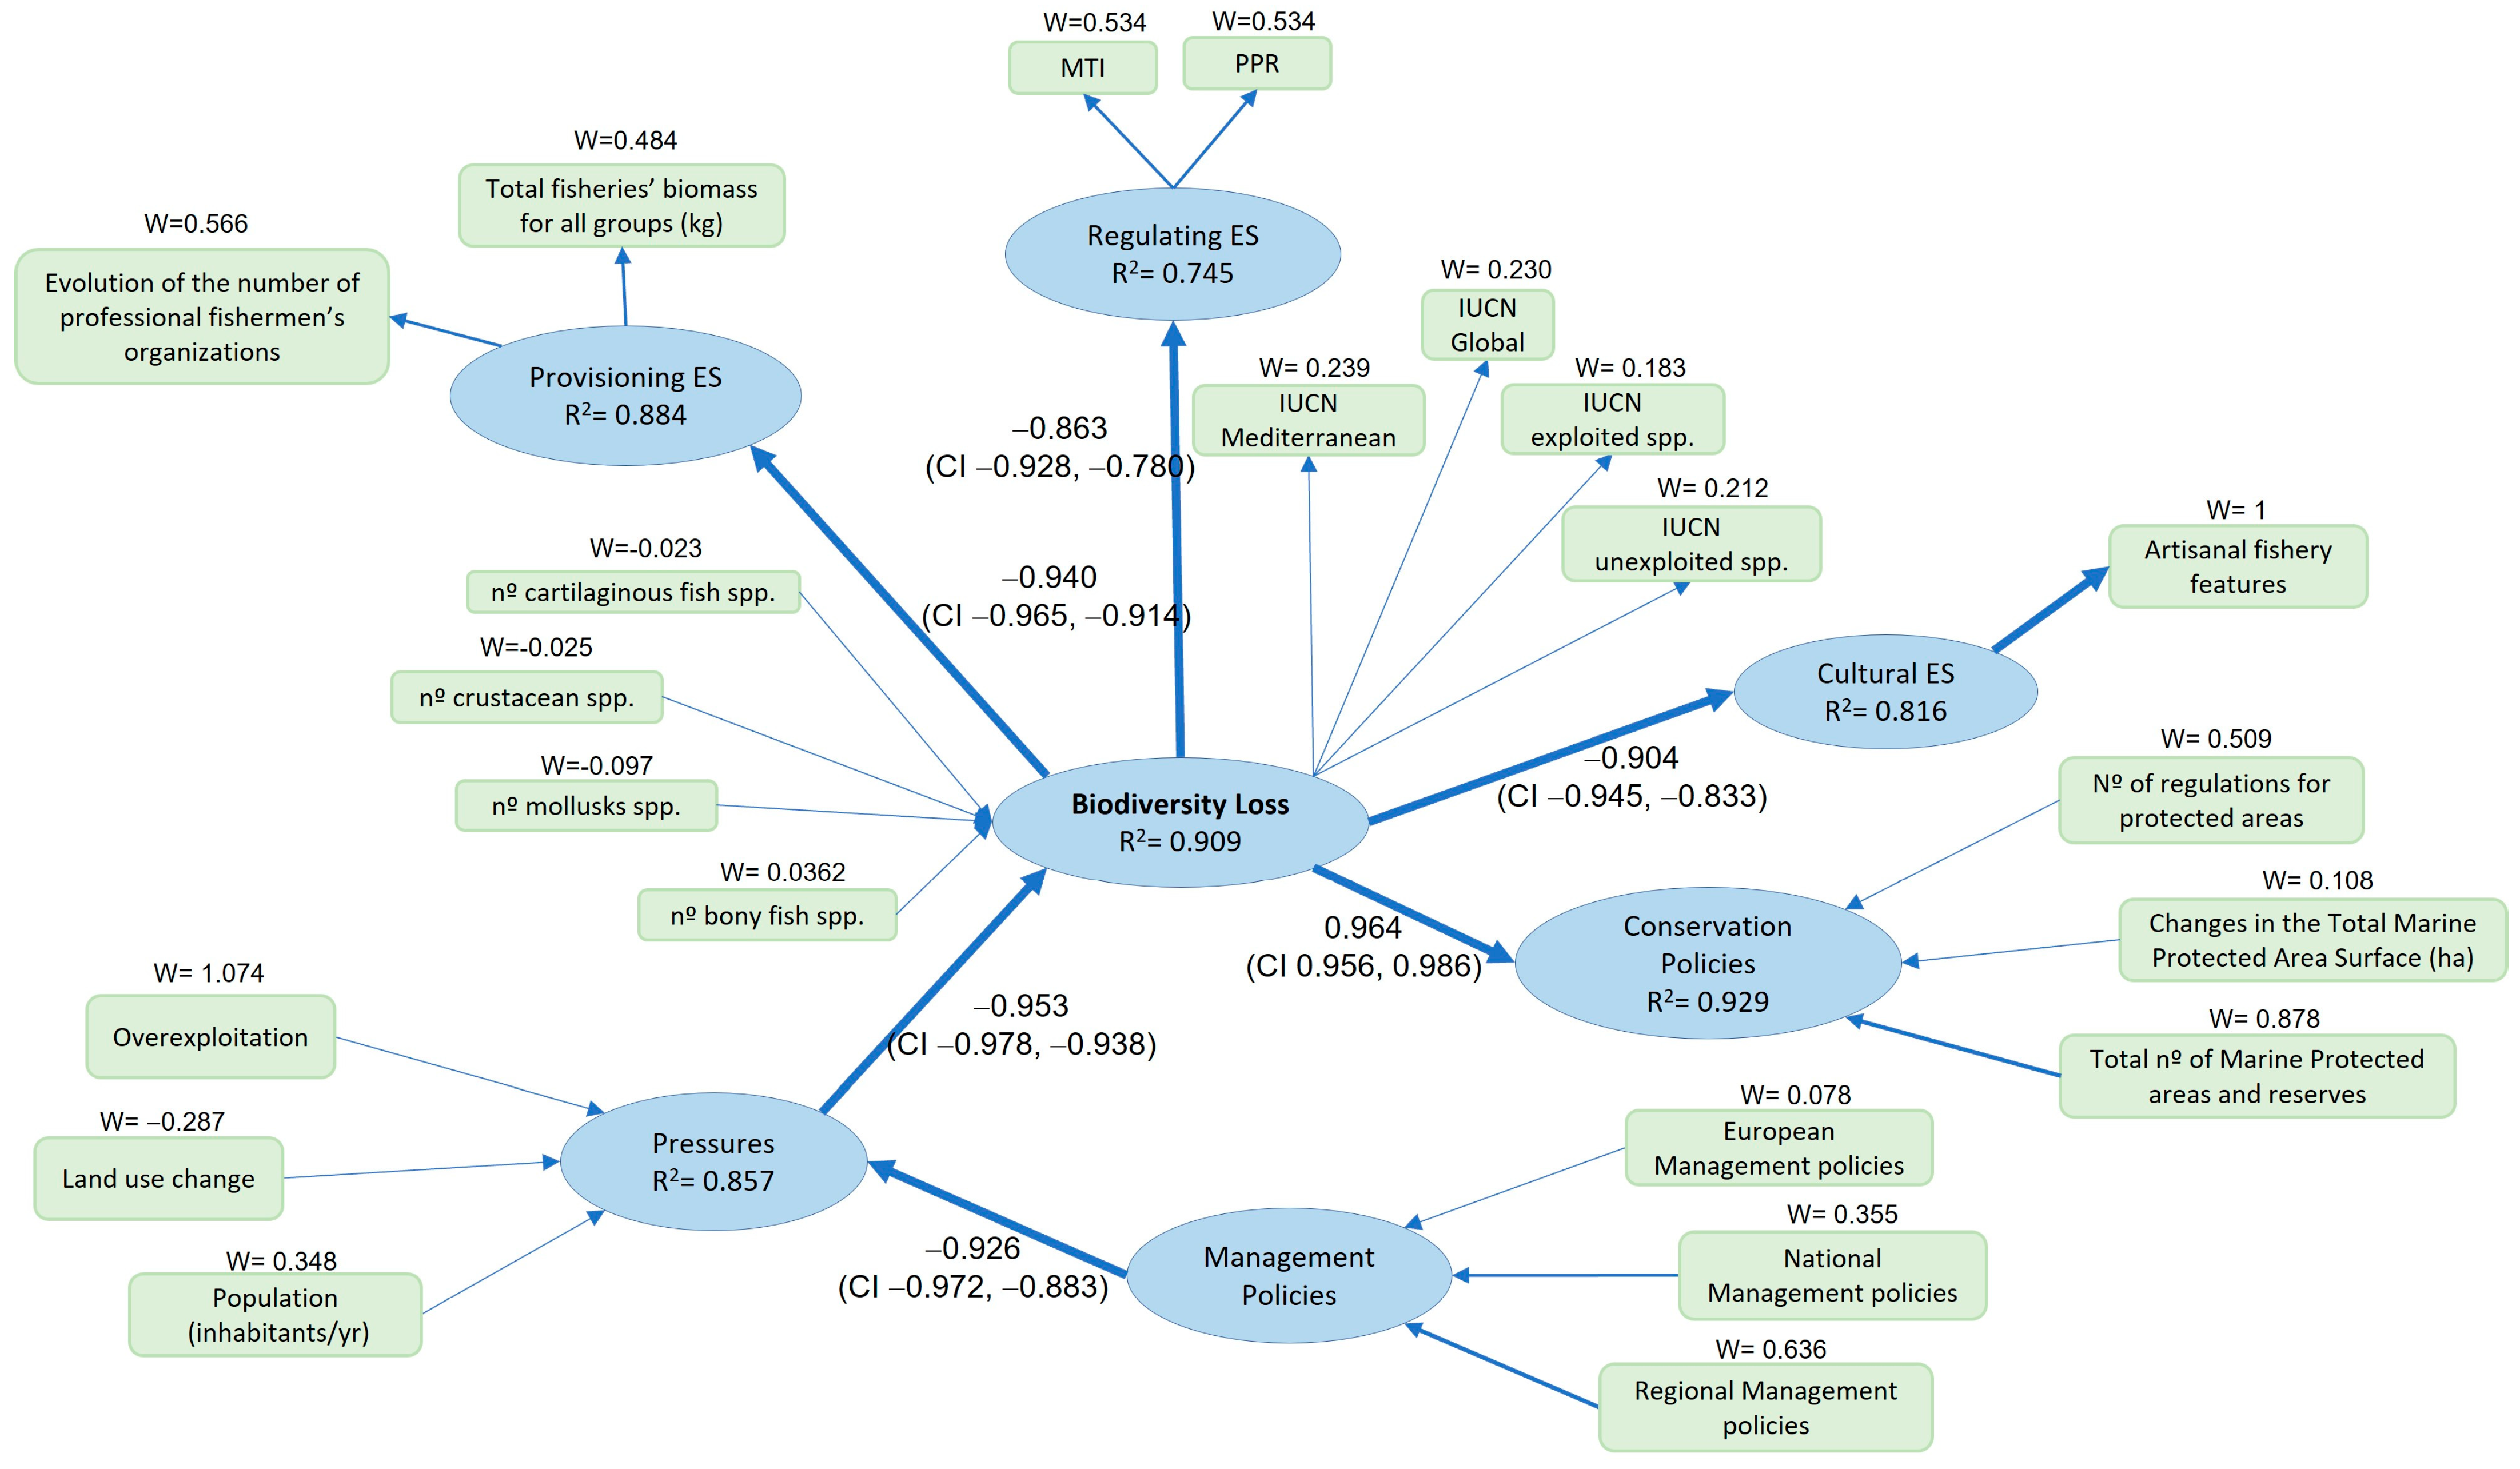
2.4. Conceptual Model and Statistical Analysis

We used Partial Least Square Path Modelling (PLS-PM) to explore the relationships and interconnections among biodiversity, marine ESs delivery, pressures, conservation responses and management strategies of the two marine areas described above (Figure 2). The PLS-PM framework allows us to analyse multiple relationships between blocks of manifest (observed) variables, hereafter MVs, in which each block plays the role of a theoretical concept (e.g., biodiversity loss or ecosystem services delivery) that appears in the form of a latent (unobserved) variable, hereafter LVs [46,47,48]. It has been previously used to investigate the causal relationship between drivers of change (climate and fishing effort) on marine ecosystem services [49] or among fisheries exploitation, environmental conditions, and ecological descriptors of communities [50].
Every PLS-PM model is composed of two submodels: the structural model and the measurement model. The structural model, also called the inner model, takes into account the relationships among the LVs. The measurement model, the outer model, considers the relationships between each LV and its corresponding MVs [48].
In our case, the inner model consists of seven latent variables (e.g., Biodiversity Loss, Provisioning, Regulating and Cultural ESs, Anthropogenic Pressures, Management Policies and Conservation Responses) that affect the endogenous variables through different pathways. Each LV is measured by its own block of manifest variables (indicators), which form the outer model (Figure 2, Table S1).
We hypothesise that biodiversity loss (LV) will be increased by anthropogenic pressures (LV) affecting marine ecosystems and, consequently, will have an impact on the delivery of ESs (LVs) and human wellbeing. Thus, conservation responses (LV) and management policies (LV) are the strategies and actions implemented to preserve the integrity of marine ecosystems and their biodiversity and to prevent or mitigate the effect of the pressures that trigger biodiversity loss (Figure 2).
Moreover, the formulation of the outer model depends on the direction of the relationships between LVs and MVs. There are three types of outer models: the reflective, the formative, and the MIMIC. In the reflective model, each MV is the effect of the corresponding LV and plays the role of an endogenous variable in the specific outer model of the block. In the formative model, each MV is the cause of the corresponding LV and each MV or each sub-block of MVs represents a different dimension of the underlying concept. The MIMIC model is a mixture of the reflective and formative models within the same block of MVs [47,48]. In our path model, indicators related to the LVs of ESs were constructed in a reflective mode (outwards directed model), whereas the ones related to the LVs of Pressures, and Conservation and Management responses, were built in a formative way (inwards directed model). For the LV Biodiversity Loss, we use the MIMIC approach to build the interactions among variables of the outer model (Table S1). In a reflective model, any change in the LV will produce the same directional change in the reflective indicators. Alternatively, in a formative model, each MV is an exogenous variable that could have a different effect on the underlying LV. Once the whole model is conceptualised (i.e., inner and outer models), the PLS-PM is implemented through an iterative algorithm that separately estimates the various measurement models and then, in a second step, estimates the path coefficients in the structural model. Before running the algorithm, all indicators were standardised by subtracting the mean of each value and dividing it by the standard deviation. Then, the general increasing or decreasing trends of the indicators were examined to ensure that they explained the ecological meaning of the assessed component.

2.5. Evaluation of the Path Regression Model

The validation of PLS-PM must consider the three parts of the model: (1) the assessment of the measurement or outer model, (2) the assessment of the structural or inner model, and (3) the validation of the whole model. The quality of the measurement model depends on whether the indicators’ nature is reflective or formative. The reflective indicators need to have a strong mutual association with its LV and not any other one; if an indicator is not loyal to its LV, it must be deleted [46]. In other words, the reflective indicators must follow unidimensionality, and there are two indices to check it: Cronbach’s alpha and the Dillon–Goldstein’s rho. Cronbach’s alpha is a coefficient that evaluates how well a block of indicators (MVs) measures their corresponding LV, whilst Dillon–Goldstein’s rho focuses on the variance of the sum of variables in the block of interest. As a rule of thumb, for both indices, a value alpha greater than 0.7 is considered acceptable [47,48]. The next things to examine are the loadings and the communalities that are contained in the outer model. The loadings are correlations between an LV and its MVs. In turn, communalities are squared correlations. Loadings greater than 0.7 are acceptable. Communality is calculated with the purpose of checking how much of the variability in MVs is explained by its LV scores and is calculated as the average of all squared correlations between each MV and its underlying LVs. MVs with low communality scores (i.e., <0.7) are those for which the model is not working, and the researcher may use this information to drop such variables from the analysis [48]. Then it is necessary to check the cross-loadings, which are the loadings of an indicator with the rest of the LVs, to verify that the shared variance between LV and its MVs is larger than the variance shared with other LVs by looking at the diagonal of the cross-loading matrix block by block.
In dealing with formative indicators (the ones considered as forming an LV), it is necessary to compare the outer weights of each indicator in order to determine which MVs contribute most effectively to the LV. The elimination of an indicator is recommended when high multicollinearity occurs [47].
The quality of the structural model is evaluated by examining three indices or quality metrics: the predictive power of the model R2, the redundancy index, and the Goodness-of-Fit (GoF). The R2 values explain the amount of variance in the endogenous LV explained by its independent LVs, R2 > 0.6 is considered “High” [48]. The redundancy measures the amount of variance of MVs in an endogenous LV that is predicted from the independent latent variables associated with the endogenous LV. High redundancy means a high ability to predict. Overall model predictive performance is measured by the goodness of fit, GoF, which is calculated as the geometric mean of the average communality and the average R2 value. Since it takes into account communality, this index is more applicable to reflective indicators than to formative indicators. Acceptable values of GoF are those greater than 0.7 [48]. Additionally, path coefficients are used to estimate the strength and direction of the relationships between exogenous LV (e.g., Pressures and Management policies) and endogenous LV (e.g., Biodiversity Loss).
Finally, bootstrapping analysis was used as a final check of the quality of the model pathways and results, using the 95 % bootstrap confidence interval to evaluate whether the parameters were significantly different from zero. All statistical analyses were performed with XLSTAT 2020.4.1.

2.6. Final Indicators Selection

The construction of the PSL-PM models presented below has been designed with an iterative process of review and refinement of the indicators included with a posterior validation of the models obtained. In this way, we started from an initial set of 63 indicators (Table S1) submitted to a first path analysis iteration model. After checking the validation, the delivered models were not acceptable. Those indicators that showed low communalities and cross-loadings (<0.7) or high multicollinearity were eliminated from the model (i.e., they are marked with asterisks in Table S1). Indeed, the rest of the indicators were reassigned to different integrated indices after summing up the gross value of each indicator of the same category and then standardising them (e.g., “Overexploitation” summarised the effect of the pressure done by industrial fisheries effort and integers the time series data for nº industrial vessels, Gross tonnage of industrial vessels and Total Power of industrial vessels (kW), Table S1). Finally, we built our PLS-PM models with 21 indicators for the Gulf of Cádiz and 22 for Alborán.

3. Results

Model Evaluations

The overall PLS-PM for both studied areas had a high predictive power with an R2 = 0.961 for the Gulf of Cádiz and an R2 = 0.909 in Alborán (Table 1).
Indeed, the GoF of the overall, outer, and inner models were >0.7 in all the cases in both areas (Table 2), thus implying a good selection of the indicators used in the full-time series used.
The outer models were explained by the unidimensionality of the reflective MVs to their LVs (Biodiversity Loss, Regulating ES, and Provisioning ES) assessed by Cronbach’s α and the Dillon–Goldstein ρ always >0.7 (Table 3).
In our outer models, all the LVs were measured effectively by all their reflective MVs; they showed loadings and communalities bigger than 0.7, except for the IUCN (fisheries) in its LV Biodiversity Loss in Alborán (Table 4). Indeed, all these loadings and communalities scores were smaller in the Alborán area than in the Gulf of Cádiz.
Pressures and the indicators related to the exploited biodiversity were measured using their weights, and they showed different values at each marine area (Figure 3 and Figure 4) and, in both cases, differed from our hypothesised conceptual model in the negative sign of the Pressure MVs over Biodiversity Loss. The weights of the Alborán’s MVs of Conservation and Management Policies were always smaller than the ones found in the Gulf of Cádiz, while the Pressure’s weights showed the opposite trend as well as the number of exploited bony fish, which had bigger weights in Alborán.
In the Gulf of Cádiz, the formative MV with a high weight in the LV Biodiversity Loss was the number of exploited cartilaginous fish species (0.180 ± 0.047, Regional Management policies in the Management Policies LV (0.589 ± 0.215), the number of Marine Protected areas and reserves in the LV Conservation Policies (1.728 ± 0.420), and Overexploitation in Pressures (0.973 ± 0.141). In the Alborán Sea, the formative MV with a high weight in the LV Biodiversity Loss was the number of exploited bony fish species (0.362 ± 0.068) instead of elasmobranchs, and the same indicators of the Gulf of Cádiz in the rest, Regional management policies in the Management Policies LV (0.636 ± 0.199), the number of Marine protected areas and reserves in the LV Conservation Policies (0.878 ± 0.191), and Overexploitation in Pressures (1.074 ± 0.112) (Tables S2 and S3).
Most of the cross-loadings of the reflective MVs showed that the shared variance between LV and its MVs was larger than those shared with the other LV looking at the diagonal of the cross-loading matrix block by block in both outer models except for the evolution of the number of professional fishermen’s organisations that showed the highest value in Pressures instead of in Provisioning ES in the Gulf of Cádiz (Table S4) and IUCN (Mediterranean) which had a high cross-loading value in the Conservation Policies LV instead of Biodiversity Loss in Alborán (Table S5).
Evaluation quality indices of the inner models for both areas are summarised in Table 5. In the Gulf of Cádiz, the LV that had the highest predictive power is Biodiversity Loss (R2 = 0.961), and in Alborán, it is the block of Conservation Policies (R2 = 0.929). The observed interrelations between pairs of LVs (Figure 3 and Figure 4) matched the proposed conceptual model (Figure 2) except for the path coefficient direction between anthropogenic Pressures and Biodiversity Loss. In both areas, the sign was negative (Gulf of Cádiz = −0.980 (CL −0.992, −0.956); Alborán = −0.953 (CL −0.978, −0.938), meaning that the observed decrease in the intensity of anthropogenic Pressures is not translated in a lower rate of Biodiversity Loss as opposed to our initial hypothesis that stated that an increase in Pressures intensity would result in a higher rate of Biodiversity Loss.
Path coefficients between Biodiversity Loss and Regulating ESs are lower than [0.9] in both areas (Gulf of Cádiz = −0.706 (CL −0.844, −0.533) and Alborán = −0.863 (CL −0.928, −0.780)), in the Gulf of Cádiz the path coefficient between Biodiversity Loss and Cultural ESs is also lower than [0.9] (−0.263 (CL −0.491, −0.045)). The rest of the path coefficients in both models are higher than [0.9] (Figure 3 and Figure 4).

4. Discussion

Our results show an alarming biodiversity loss since 1985 in the two marine areas studied. These results are consistent with the global deterioration of the ecological condition of marine ecosystems and biodiversity loss due to multiple anthropogenic pressures documented in different studies performed on a global scale [8,51,52], European scale [53,54,55,56,57], Mediterranean scale [58,59,60,61,62,63] and local scale, similar to the study by Torres et al. (2013) [64] in the Gulf of Cádiz or Tudela et al. (2005) [65] in the Alborán Sea. Surprisingly, there was a continuous increase in the number of management regulations as well as in the development of conservation policies (marine protected areas on international, national, and regional scales). Many of them were launched to fulfil the requirements of the European Marine Framework Directive (MSFD), which requires EU member states to achieve good environmental status of their seas by 2020 [16,66]. Indeed, the creation of Marine Protected Areas (MPAs) responds to the requirements of the Convention on Biological Diversity (CBD) for protecting and effectively managing 10% of the sea in MPAs by 2020 [67] to restore and conserve species, fisheries, habitats, ecosystems and their ESs. Despite the 1062 MPAs existing in the Mediterranean Sea, one of the marine biodiversity hotspots currently only covers 6% of the basin, far from the 10% CBD Koichi target, as shown by Claudet et al. (2020) [63]. In the marine areas of this study, we might expect that the management policies implemented by the institutions would be able to mitigate the intensity of anthropogenic pressures that trigger biodiversity loss, but based on our results, they are not able to do so (Figure 3 and Figure 4). Indeed, the number of fishing regulations and the management plans for some species have not yet had the desired protection effect of guaranteeing a long-term recovery of the populations and sustainable fisheries.
The results of the inner models suggest that the pressures decrease as a result of the implementation of management measures (Table 4); however, the drop in the intensity of the pressures is mainly explained by the declining trend of overexploitation (Tables S4 and S5) that begins several years before the implementation of most of the measures (beginning of the 1990s in the Gulf of Cádiz, and at the beginning of the 2000s in the Alborán Sea) (Figures S1 and S2), when the European Maritime and Fisheries Fund (EMFF) started to support different financial lines to help fishers adapt their industrial fishing vessels and gear to a more sustainable fishing method. Moreover, these management policies increments and the decline in the anthropogenic pressures intensity were not able to slow down the biodiversity loss either for exploited species or for jeopardised ones in both areas, which could instead be a consequence of the overfishing of the ecosystem in the last decades [9,33,64,68]. Probably this behaviour in the interaction between anthropogenic pressures, biodiversity loss, and responses lies in the lack of efficiency of the given responses and /or the lack of time to probe their effects on an improvement of biodiversity state and ES delivery.
Another question arising from our results is whether the given conservation responses in these areas are inefficient and/or insufficient in protecting ecosystem integrity and biodiversity (Figure 3 and Figure 4, Tables S4 and S5) or if there are other explanatory factors involved in this decline. There have been recent field studies addressing the effectiveness of MPAs in the mitigation of biodiversity loss that have shown their failure because of their insufficient size and/or inefficient boundary design [69]. It should also be mentioned that policies are often inefficient due to a lack of knowledge, or this is too limited to sustain them and is often lost in political interests (resulting in the so-called “paper parks”). The protection and conservation of marine metapopulations should undertake the design of a system of MPAs networks sufficiently large to avoid the mortality of individuals crossing their borders and sufficiently close to each other to guarantee connectivity among populations and their propagule dispersal [70,71,72,73,74,75]. Additionally, other failures in regard to their governance way of management have been addressed in some western Mediterranean MPAs [76,77]. Moreover, the time since the beginning of protection due to the creation of the MPAs has been proven to be an important factor driving the ecological effectiveness of MPAs. Even this period of time has different effects depending on the taxa, which could be five years for some species targeted by fishing or decades for some top predators [78]. In some areas, such as the Cabo de Palos-Islas Hormigas MPA, Rojo et al. (2021) [79] analysed the recovery patterns after 23 years of protection and found that the biomass of piscivorous and macroinvertivore fish increased with time as their density decreased, suggesting top-down or consumer control of the food web. Thus, a similar delay in the effectiveness of regulations, actions and management plans could have occurred in the marine areas of this study. In Spain, the Natura 2000 network for MPAs began its implementation in 2009 for the Atlantic region and in 2010 for the Mediterranean region [45,80]. The total number of protected marine areas and reserves is the indicator with higher weight in the conservation policies enhancing the role of the different MPAs (Tables S6 and S7) in the conservation, but a decade is probably too short a period of time to reach good environmental status (Figures S1 and S2). The role of regional regulations is stressed as the MV with higher weight in the LV management policies (Figure 3 and Figure 4, Tables S4 and S5), and thus the coordination between regional and national governments is paramount to achieve better governance of the MPAs since some of them have shared authority, while others only have national (e.g., marine reserves of Isla de Alborán and Cabo de Gata Níjar, all in the Alborán Sea area) or regional governance (e.g., marine reserve of Reserva de Pesca de la Desembocadura del Guadalquivir in the Gulf of Cádiz) (Tables S6 and S7). Moreover, the support of long-term management plans in MPAs, the improvement of the level of enforcement and the need to design a global network of MPAs have been suggested as key features to achieve global conservation of marine biodiversity [12,13,73,81,82]. In Europe, Katsanevakis et al. (2020) [57] proposed twelve measures for improving MPA management, including implementing adaptive management plans at all sites in the Natura 2000 Network, improving mechanisms for public participation in MPA planning and management, and prioritising conservation goals in full collaboration with stakeholders. In fact, the social effectiveness of large marine protected areas was demonstrated in the study by Ban et al. (2017) [83] of 16 MPAs located around the world, and they found that low levels of participation by resource users and limited external recognition were related to declines in wellbeing, whereas high participation in zoning, social monitoring, siting, rulemaking, and environmental monitoring were associated with improvements in wellbeing.
The Provisioning ES declined during the study period in both marine areas, showing a great decreasing trend in the Alborán Sea. In both areas, the threshold was found in 1999–2000, when the Agreement on Cooperation in the sea fisheries sector between the European Community and the Kingdom of Morocco [84], approved in 1995, was not renewed, and a significant decrease in the total captured biomass occurred and showed a contrasting tipping point in the Gulf of Cádiz because of this reason [85]. In both areas, this decline has had a negative correlation with the land-use change pressures that enhanced the deterioration of littoral ecosystem integrity due to the construction of harbours and coastal development. Known habitats of nurseries for fish and shellfish [86] and the destruction and alteration of these habitats could trigger a decline in the population density of fish and shellfish. Additionally, in both areas, the Provisioning ES has a negative coefficient path with the LV Biodiversity Loss, implying that the higher the loss of biodiversity, the lower the delivery of Provisioning ES (Figure 3 and Figure 4). The Provisioning ES decline in the studied time series responds to two processes occurring at the same time; (1) the decrease in the overall biomass of the captures (mostly large-bodied commercially targeted species, predators with a high trophic level, and carnivorous fish), and (2) an increase in the number of small-bodied fish species (i.e., herbivores with a low trophic level) captured and/or included in the Red List IUCN catalogue; thus, the mean trophic levels of consumers would be lower in an overfished food web than in an undisturbed web [87]. Indeed, other stressors contributing to biodiversity loss that are not officially quantified are the effects of poaching and recreational fisheries that cause an underestimation of the real extracted biomass. There is an important illegal trade of fish that is very difficult to identify and quantify; however, Coll et al. (2012) [88] estimated that up to 43% of the real captures can be illegal in the area. Most nondeclared captures are discards and by-catch species on the Spanish Mediterranean coast, and depending on the fishing gear and habitat, they represent between 13% and 67% of the total biomass intake [89,90]. It is also important to consider extraction by sport-fishing boats, fish trade in the black market, subsistence fishing, nonregistered artisanal fishing, and poaching [91]. Unfortunately, since they provide data for a single time and not for the entire time series, the existing estimates are not applicable to our study. There is a lack of official fisheries reports related to them, and there is an urgent need to include them in our current regulations, as stated by Giménez-Casalduero (2021) [92]. This author reviewed the economic importance of recreational fisheries known for some areas, such as Málaga (Alborán Sea), where recreational fisheries contribute four more times to the markup by professional fisheries. In addition, this author also sounded the alarm about other environmental impacts of recreational fisheries, such as anchoring, which has a negative impact on the seagrass beds of the protected species Posidonia oceanica and has also been recorded in other Mediterranean marine areas [93].
Concerning Regulating ES, some differences were found between areas; although PPR (primary production required to sustain the fishery [94]) was selected as an important MV in both areas, MTI (Marine Trophic Index [95]) was only considered in the Alborán Sea (Figure 3 and Figure 4, Figures S1 and S2). The MTI is designed to assess the mean trophic level of the catch, assuming that it will decline as a result of the overexploitation of the higher trophic levels corresponding to large and long-lived predators with high commercial value and is expected to follow the same trend as the PPR index. In this study, however, the MTI steadily increases in the Alborán Sea and shows a recovery pattern since the beginning of the 2000s. These patterns are consistent with those observed in the Gulf of Cádiz by Torres et al. in 2013 [64] and Baeta et al. in Portugal in 2009 [96] and, as they point out, probably related to the collapse of the small pelagic fish stocks and not to the recovery of species with higher trophic level. In both cases, the path coefficients connecting biodiversity loss and Regulating ES had a negative sign, meaning that the degradation of ecosystem integrity and biodiversity loss will negatively affect the ability of the system to provide this type of ESs.
Moreover, this loss of biodiversity is also connected with the delivery of Cultural ES in the Gulf of Cádiz as well as in the Alborán Sea (Figure 3 and Figure 4). However, the coefficient path patterns (Figure 3 and Figure 4) and general trends (Figures S1 and S2) are different in both areas. In the Alborán Sea, the delivery of Cultural ES declined slightly during the study period as a result of the development and protection of artisanal fishing fleets and the creation of fish producer organisations, fishermen associations, and business associations representative of the fisheries and aquaculture sectors; a move which led to a trend of improvement from the 1990s to 2004, reflecting the EMFF effects mentioned above. In the Gulf of Cádiz, however, the artisanal fishery was declining for the first half of the analysed time series and shows an upward trend since the beginning of the 2000s as a result of the general fleet management measures implemented at national and international levels, but especially as a result of regional regulations and initiatives that consider and impulse a stronger connexion between local fishermen and the ecosystems on which they fish [97,98,99,100,101,102] and a better knowledge of the interactions between industrial and artisanal fisheries in the area [103].
Overall, the complex interactions among the biodiversity, marine ESs delivery, pressures, conservation responses and management strategies of the studied marine areas are easily visualised through the PLS-PM models as addressed in the North Sea [49] and 12 marine areas of different regions of the world [50]. Both models had the same structure of the interactions but different coefficient paths in the inner model (i.e., relationships among LVs) and weights of the outer model (i.e., the contribution of the MVs to LVs) due to different physiographic seascapes and different social organisations. In both areas, the responses given by the society to protect marine biodiversity through management plans and conservation actions are not enough and/or need more time to exert their effects.
We can reinterpret these results using the socioecosystem scale of analysis. The relevance of the different integrated indicators of the social dimension is clear. It seems clear that there is a need to rethink and rebuild anthropogenic pressures and management and conservation policies to ensure the long-term protection and conservation of marine biodiversity through three main axes of action. First, actions have focused on changing and reducing the biodiversity that humans consume. This should be achieved by promoting the development of artisanal fisheries fleets and NGOs of fishers concerned about obtaining sustainable and healthy capture of fish and shellfish together with the reinforcement of environmental education promoting the creation and maintenance of museums and centres focused on these topics in the long term. The lack of interest of the regional governments in cultural and environmental education is regrettable; there were six centres in the late 1990s and early 2000s in Andalucía, and currently, only one remains open (Table 5).
Second, actions related to the improvement of MPA governance and regulations to improve current practices may compromise the effectiveness of conservation actions and plans. Third, we reinforce the need for the collection of high-quality, open-access data from the different institutions implied in the monitoring of the environmental status and the need to promote actions for better coordination among them.

Supplementary Materials

The following supporting information can be downloaded at: https://www.mdpi.com/article/10.3390/su15086544/s1, Figure S1: Time series of the indicator set used for the Gulf of Cádiz area; Figure S2: Time series of the indicator set used for the Alborán area; Table S1: Summary of the variables included in each block of indicators latent variables (inner model) and manifest variables (outer model) of the conceptual path model for the study area; Table S2: Weights of the MVs of the outer model of the Gulf of Cádiz. The weights of the formative indicators are used to determine which MV contribute most effectively to its forming LV (marked in bold); Table S3: Weights of the MVs of the outer model of Alborán. The weights of the formative indicators are used to determine which MV contribute most effectively to its forming LV (marked in bold); Table S4: Cross-loading matrix of the outer model of Gulf of Cádiz. Loadings of a MV with the rest of LVs. The shared variance between LV and its MVs must be larger than the shared with other LV looking at the diagonal of the cross-loading matrix block by block; Table S5: Cross-loading matrix of the outer model of Alborán. Loadings of a MV with the rest of LVs. The shared variance between LV and its MVs must be larger than the shared with other LV looking at the diagonal of the cross-loading matrix block by block; Table S6: Summary of the Marine Protected Areas (MPAs) of the marine areas of the Gulf of Cádiz; Table S7: Summary of the Marine Protected Areas (MPAs) of the marine areas of the Alborán Sea.

Author Contributions

Conceptualisation, P.A., S.G.-T., M.R.V.-A., M.L.S.-A. and F.S.-M.; methodology, P.A., S.G.-T. and M.R.V.-A.; data analysis and software, P.A. and S.G.-T.; investigation, resources and data curation P.A., S.G.-T., M.R.V.-A. and M.L.S.-A.; writing—original draft preparation, P.A. and S.G.-T.; writing—review and editing, P.A., S.G.-T., M.R.V.-A. and F.S.-M.; supervision, P.A.; project administration, P.A.; funding acquisition, P.A. All authors have read and agreed to the published version of the manuscript.

Funding

This work was supported by the Biodiversity Foundation (http://www.fundacion-biodiversidad.es/) of the Spanish Ministry Ecological Transition (Projects: “Evaluación y valoración de los servicios de los ecosistemas marinos de la Red Natura 2000 de España—LIFE15 IP ES012—INTEMARES (FB2017APLI006)” and “Evaluación del impacto de la pesca sobre la biodiversidad marina: un análisis de la dinámica de sus redes tróficas en la Red Natura 2000 de España (CA_BM_2019)”.

Institutional Review Board Statement

Not applicable.

Informed Consent Statement

Not applicable.

Data Availability Statement

All data or models generated or used during the study area available from the corresponding author by request.

Acknowledgments

Authors would like to thank to the three anonymous reviewers that contribute to improve the paper with their comments and suggestions. We would also like to thank Jonathan Walker for kindly reviewing the English grammar and spelling.

Conflicts of Interest

The authors declare no conflict of interest.

References

  1. O’Connor, S.; Ono, R.; Clarkson, C. Pelagic Fishing at 42,000 Years Before the Present and the Maritime Skills of Modern Humans. Science 2011, 334, 1117–1121. [Google Scholar] [CrossRef]
  2. Stringer, C.B.; Finlayson, J.C.; Barton, R.N.E.; Fernández-Jalvo, Y.; Cáceres, I.; Sabin, R.C.; Rhodes, E.J.; Currant, A.P.; Rodríguez-Vidal, J.; Giles-Pacheco, F.; et al. Neanderthal exploitation of marine mammals in Gibraltar. Proc. Natl. Acad. Sci. USA 2008, 105, 14319–14324. [Google Scholar] [CrossRef] [Green Version]
  3. Liu, J.; Dietz, T.; Carpenter, S.R.; Folke, C.; Alberti, M.; Redman, C.L.; Schneider, S.H.; Ostrom, E.; Pell, A.N.; Lubchenco, J.; et al. Coupled Human and Natural Systems. AMBIO 2007, 36, 639–649. [Google Scholar] [CrossRef]
  4. Pope, K.L.; Pegg, M.A.; Cole, N.W.; Siddons, S.F.; Fedele, A.D.; Harmon, B.S.; Ruskamp, R.L.; Turner, D.R.; Uerling, C.C. Fishing for ecosystem services. J. Environ. Manag. 2016, 183, 408–417. [Google Scholar] [CrossRef] [PubMed] [Green Version]
  5. Buonocore, E.; Grande, U.; Franzese, P.; Russo, G. Trends and Evolution in the Concept of Marine Ecosystem Services: An Overview. Water 2021, 13, 2060. [Google Scholar] [CrossRef]
  6. FAO. The State of World Fisheries and Aquaculture 2020. In Sustainability in Action; FAO: Rome, Italy, 2020; 244p. [Google Scholar] [CrossRef]
  7. Myers, R.A.; Worm, B. Rapid worldwide depletion of predatory fish communities. Nature 2003, 423, 280–283. [Google Scholar] [CrossRef] [PubMed]
  8. Luypaert, T.; Hagan, J.G.; McCarthy, M.L.; Poti, M. Status of Marine Biodiversity in the Anthropocene. In YOUMARES 9—The Oceans: Our Research, Our Future; Jungblut, S., Liebich, V., Bode-Dalby, M., Eds.; Springer: Cham, Germany, 2020; pp. 57–82. [Google Scholar] [CrossRef] [Green Version]
  9. Scientific, Technical and Economic Committee for Fisheries (STECF 2021). Monitoring the Performance of the Common Fisheries Policy (STECF-Adhoc-21-01); EUR 28359 EN; Publications Office of the European Union: Luxembourg, 2021; ISBN 978-92-76-36155-8. [CrossRef]
  10. Agardy, T.S. Marine Protected Areas and Ocean Conservation; R.G. Landes Company and Academic Press, Inc.: Austin, TX, USA, 1997; 244p, ISBN 1-57059-423-6. [Google Scholar]
  11. McCAY, B.J.; Jones, P.J.S. Marine Protected Areas and the Governance of Marine Ecosystems and Fisheries. Conserv. Biol. 2011, 25, 1130–1133. [Google Scholar] [CrossRef] [Green Version]
  12. Edgar, G.J.; Russ, G.R.; Babcock, R.C. Marine protected areas. In Marine Ecology; Connell, S.D., Gillanders, B.M., Eds.; Oxford University Press: Oxford, UK, 2007; pp. 534–565. ISBN 0195553020. [Google Scholar]
  13. Edgar, G.J.; Stuart-Smith, R.D.; Willis, T.J.; Kininmonth, S.; Baker, S.C.; Banks, S.; Barrett, N.S.; Becerro, M.A.; Bernard, A.T.F.; Berkhout, J.; et al. Global conservation outcomes depend on marine protected areas with five key features. Nature 2014, 506, 216–220. [Google Scholar] [CrossRef] [Green Version]
  14. Convention on Biological Diversity 2004. Decision adopted by the Conference of the Parties to the convention n biological diversity. VII/5. Marine and coastal biodiversity. In Proceedings of the Conference of the Parties to the Convention on Biological Diversity, Seventh Meeting, Kuala Lumpur, Malaysia, 9–20, 27 February 2004. Available online: https://www.cbd.int/doc/decisions/cop-07/cop-07-dec-05-en.pdf (accessed on 1 November 2022).
  15. UN Environment. Enabling Effective and Equitable Marine Protected Areas—Guidance on Combining Governance Approaches; Jones, P.J.S., Murray, R.H., Vestergaard, O., Eds.; Regional Seas Reports and Studies: Nairobi, Kenya, 2019; Volume 203, 52p, Available online: https://wedocs.unep.org/bitstream/handle/20.500.11822/27790/MPA.pdf?sequence=1&isAllowed=y (accessed on 2 November 2022).
  16. European Union. Directive 2008/56/EC of the european parliament and of the council of 17 June 2008 establishing a framework for community action in the field of marine environmental policy (Marine Strategy Framework Directive). Off. J. Eur. Union. 2008, 164, 19–40. Available online: https://eur-lex.europa.eu/legal-content/EN/TXT/?uri=celex%3A32008L0056 (accessed on 1 November 2022).
  17. BOE-A-2010-20050. Ley 41/2010, de 29 de Diciembre, de Protección Del Medio Marino. «BOE» Núm. 317, de 30 de Diciembre de 2010, pp 108464–108488. Available online: https://www.boe.es/eli/es/l/2010/12/29/41 (accessed on 7 November 2022).
  18. Mace, P. A new role for MSY in single-species and ecosystem approaches to fisheries stock assessment and management. Fish Fish. 2001, 2, 2–32. [Google Scholar] [CrossRef]
  19. Arcos, J.M.; Louzao, M.; Oro, D. Fishery Ecosystem Impacts and Management in the Mediterranean: Seabirds Point of View. In Proceedings of the Reconciling Fisheries with Conservation: Proceedings of the Fourth World Fisheries Congress, Vancouver, BC, Canada, 2–6 May 2004; Nielsen, J.L., Dodson, J.J., Friedland, K., Hamon, T.R., Musick, J., Verspoor, E., Eds.; American Fisheries Society, Symposium 49: Bethesda, MD, USA, 2008; pp. 587–595. [Google Scholar]
  20. Hilborn, R. Future directions in ecosystem based fisheries management: A personal perspective. Fish. Res. 2011, 108, 235–239. [Google Scholar] [CrossRef]
  21. Berg, T.; Fürhaupter, K.; Teixeira, H.; Uusitalo, L.; Zampoukas, N. The Marine Strategy Framework Directive and the ecosystem-based approach—Pitfalls and solutions. Mar. Pollut. Bull. 2015, 96, 18–28. [Google Scholar] [CrossRef] [PubMed]
  22. Hilborn, R.; Amoroso, R.O.; Anderson, C.M.; Baum, J.K.; Branch, T.A.; Costello, C.; de Moor, C.L.; Faraj, A.; Hively, D.; Jensen, O.P.; et al. Effective fisheries management instrumental in improving fish stock status. Proc. Natl. Acad. Sci. USA 2020, 117, 2218–2224. [Google Scholar] [CrossRef] [Green Version]
  23. Coll, M.; Piroddi, C.; Steenbeek, J.; Kaschner, K.; Ben Rais Lasram, F.; Aguzzi, J.; Ballesteros, E.; Bianchi, C.N.; Corbera, J.; Dailianis, T.; et al. The Biodiversity of the Mediterranean Sea: Estimates, Patterns, and Threats. PLoS ONE 2010, 5, e11842. [Google Scholar] [CrossRef] [Green Version]
  24. UNEP-MAP RAC/SPA. The Mediterranean Sea Biodiversity: State of the Ecosystems, Pressures, Impacts and Future Priorities; Bazairi, H., Ben Ha, S., Boer, F., Cebria, D., De Jua, S., Lima, A., Lleonart, J., Torchi, G., Rais, C., Eds.; RAC/SPA: Tunis, Tunisia, 2010; 100p, Available online: https://www.rac-spa.org/sites/default/files/doc_cop/biodiversity.pdf (accessed on 31 October 2022).
  25. Abdul-Malak, D.; Livingstone, S.R.; Pollard, D.; Polidoro, B.-A.; Cuttelod, A.; Bariche, M.; Bilecenoglu, M.; Carpenter, K.E.; Collette, B.B.; Francour, P.; et al. Overview of the Conservation Status of the Marine Fishes of the Mediterranean Sea; IUCN: Gland, Switzerland; Malaga, Spain, 2011. [Google Scholar]
  26. Rodríguez, J. Oceanografía del Mar Mediterráneo; Pirámide: Madrid, Spain, 1982; 174p. [Google Scholar]
  27. Tintoré, J.; La Violette, P.E.; Blade, I.; Cruzado, A. A Study of an Intense Density Front in the Eastern Alboran Sea: The Almeria–Oran Front. J. Phys. Oceanogr. 1988, 18, 1384–1397. [Google Scholar] [CrossRef]
  28. Rubin, J.P.; Gil, J.; Ruiz, J.; Cortes, M.D.; Jiménez-Gómez, F.; Parada, M.; Rodríguez, J. La distribución ictioplanctónica y su relación con parámetros físicos, químicos y biológicos en el sector norte del Mar de Alboran. Inf. Tec. Inst. Esp. Oceanogr. 1992, 139, 49. [Google Scholar]
  29. Gil de Sola, L. Las pesquerías demersales del mar de Alborán, Submediterráneo ibérico: Evolución en los últimos decenios. Inf. Técnico Inst. Español Oceanogr. 1993, 142, 1–179. Available online: http://www.ieo.es/es/informes-tecnicos (accessed on 11 November 2022).
  30. Rodríguez, J. Las Reservas Marinas en el Marco Ecológico y Oceanográfico del Mediterráneo Occidental, in La Gestión de los Espacios Marinos del Mediterráneo Occidental; Guirado, J., Ed.; Instituto de Estudios Almerienses (Diputación de Almería): Almería, Spain, 1995; pp. 13–28. [Google Scholar]
  31. Cunha, M.R.; Rodrigues, C.F.; Génio, L.; Hilário, A.; Ravara, A.; Pfannkuche, O. Macrofaunal assemblages from mud volcanoes in the Gulf of Cadiz: Abundance, biodiversity and diversity partitioning across spatial scales. Biogeosciences 2013, 10, 2553–2568. [Google Scholar] [CrossRef] [Green Version]
  32. Díaz del Río, V.; Bruque, G.; Fernández-Salas, L.M.; Rueda, J.L.; González, E.; López, N.; Palomino, D.; López, F.J.; Farias, C.; Sánchez, R.; et al. Volcanes de Fango del Golfo de Cádiz, Proyecto LIFE+ INDEMARES; Fundación Biodiversidad: Madrid, Spain; Ministerio de Agricultura, Alimentación y Medio Ambiente: Madrid, Spain, 2014; pp. 1–128. [Google Scholar]
  33. Coll, M.; Carreras, M.; Ciércoles, C.; Cornax, M.-J.; Gorelli, G.; Morote, E.; Sáez, R. Assessing Fishing and Marine Biodiversity Changes Using Fishers’ Perceptions: The Spanish Mediterranean and Gulf of Cadiz Case Study. PLoS ONE 2014, 9, e85670. [Google Scholar] [CrossRef] [Green Version]
  34. Reyes-Martínez, M.J.; Ruiz-Delgado, M.C.; Sánchez-Moyano, J.E.; García-García, F.J. Biodiversity and distribution of macroinfauna assemblages on sandy beaches along the Gulf of Cadiz (SW Spain). Sci. Mar. 2015, 79, 367–377. [Google Scholar] [CrossRef] [Green Version]
  35. Grinyó, J.; Francescangeli, M.; Santín, A.; Ercilla, G.; Estrada, F.; Mecho, A.; Fanelli, E.; Costa, C.; Danovaro, R.; Company, J.B.; et al. Megafaunal assemblages in deep-sea ecosystems of the Gulf of Cádiz, northeast Atlantic ocean. Deep-Sea Res. 2022, 183 (Pt I), 103738. [Google Scholar] [CrossRef]
  36. Baillie, J.E.M.; Hilton-Taylor, C.; Stuart, S.N. 2004 IUCN Red List of Threatened Species. A Global Species Assessment; IUCN Press: Cambridge, MA, USA, 2004; Available online: https://www.iucn.org/es/node/23917 (accessed on 23 August 2021).
  37. Bearzi, G.; Reeves, R.R.; di Sciara, G.N.; Politi, E.; Canadas, A.; Frantzis, A.; Mussi, B. Ecology, status and conservation of short-beaked common dolphins Delphinus delphis in the Mediterranean Sea. Mammal. Rev. 2003, 33, 224–252. [Google Scholar] [CrossRef] [Green Version]
  38. Báez, J.C.; Real, R.; Camiñas, J.A. Differential distribution within longline transects of loggerhead and swordfish captured by the Spanish Mediterranean surface longline fishery. J. Mar. Biol. Assoc. 2007, 87, 801–803. [Google Scholar] [CrossRef]
  39. Báez, J.; Real, R.; García-Soto, C.; De La Serna, J.; Macias, D.; Camiñas, J. Loggerhead turtle by-catch depends on distance to the coast, independent of fishing effort: Implications for conservation and fisheries management. Mar. Ecol. Prog. Ser. 2007, 338, 249–256. [Google Scholar] [CrossRef]
  40. Báez, J.C.; Camiñas, J.A.; Sagarminaga, R.; Torreblanca, D.; Real, R. Capturas no dirigidas de tortuga boba (Caretta caretta Linnaeus, 1758) en aguas de Andalucía y Murcia durante 2004. Munibe 2007, 25, 196–201. [Google Scholar]
  41. Arcos, J.M.; Bécares, J.; Rodríguez, B.; Ruiz, A. Important Areas for the Conservation of Seabirds in Spain; LIFE04NAT/ES/000049-Sociedad Española de Ornitología (SEO/BirdLife): Madrid, Spain, 2009; pp. 198–224. Available online: https://www.researchgate.net/publication/229067402_Areas_Importantes_para_la_Conservacion_de_las_Aves_Marinas_en_Espana (accessed on 12 November 2022).
  42. Camiñas, J.A. Estatus y conservación de las Tortugas Marinas en España. In Libro Rojo de los Vertebrados Amenazados; de Andalucía Franco, A., Rodríguez, M., Eds.; Consejería de Medio Ambiente de la Junta de Andalucía: Sevilla, Spain, 2012; pp. 347–380. [Google Scholar]
  43. Croxall, J.P.; Butchart, S.H.M.; Lascelles, B.; Stattersfield, A.J.; Sullivan, B.; Symes, A.; Taylor, P. Seabird conservation status, threats and priority actions: A global assessment. Bird Conserv. Int. 2012, 22, 1–34. [Google Scholar] [CrossRef] [Green Version]
  44. de Stephanis, R.; García-Tíscar, S.; Verborgh, P.; Esteban-Pavo, R.; Pérez, S.; Minvielle-Sebastia, L.; Guinet, C. Diet of the social groups of long-finned pilot whales (Globicephala melas) in the Strait of Gibraltar. Mar. Biol. 2008, 154, 603–612. [Google Scholar] [CrossRef]
  45. WWF. Red Natura 2000 Marina en España. 2014. 151 p. Available online: https://wwfes.awsassets.panda.org/downloads/libro_red_natura_200_marina_en_espana_c.pdf?_ga=2.233157275.483627554.1580121547–1583122700.1572448035 (accessed on 9 November 2022).
  46. Wold, H. Model construction and evaluation when theoretical knowledge is scarce. In Evaluation of Econometric Models; Kmenta, J., Ramsey, J.B., Eds.; Academic Press: Cambridge, MA, USA, 1980; pp. 47–74. Available online: http://www.nber.org/chapters/c11693 (accessed on 15 February 2023).
  47. Esposito-Vinzi, V.; Trinchera, L.; Amato, S. PLS Path Modeling: From Foundations to Recent Developments and Open Issues for Model Assessment and Improvement. In Handbook of Partial Least Squares, Concepts, Methods and Applications; Esposito-Vinzi, V., Chin, W.W., Henseler, J., Wang, H., Eds.; Springer Handbooks of Computational Statistics, Springer-Verlag: Berlin/Heidelberg, Germany, 2010; pp. 47–82. [Google Scholar]
  48. Sánchez, G. PLS Path Modeling with R; Trowchez Editions; University of California: Berkeley, CA, USA, 2013; 235p, Available online: http://www.gastonsanchez.com/PLSPathModelingwithR.pdf (accessed on 16 September 2022).
  49. Selim, S.A.; Blanchard, J.L.; Bedford, J.; Webb, T.J. Direct and indirect effects of climate and fishing on changes in coastal ecosystem services: A historical perspective from the North Sea. Reg. Environ. Chang. 2014, 16, 341–351. [Google Scholar] [CrossRef] [Green Version]
  50. Fu, C.; Large, S.; Knight, B.; Richardson, A.J.; Bundy, A.; Reygondeau, G.; Boldt, J.; van der Meeren, G.I.; Torres, M.A.; Sobrino, I.; et al. Relationships among fisheries exploitation, environmental conditions, and ecological indicators across a series of marine ecosystems. J. Mar. Syst. 2015, 148, 101–111. [Google Scholar] [CrossRef] [Green Version]
  51. Coll, M.; Shannon, L.; Kleisner, K.; Juan-Jordá, M.; Bundy, A.; Akoglu, A.; Banaru, D.; Boldt, J.; Borges, M.; Cook, A.; et al. Ecological indicators to capture the effects of fishing on biodiversity and conservation status of marine ecosystems. Ecol. Indic. 2016, 60, 947–962. [Google Scholar] [CrossRef] [Green Version]
  52. Jouffray, J.B.; Blasiak, R.; Norström, A.V.; Österblom, H.; Nyström, M. The Blue Acceleration: The Trajectory of Human Expansion into the Ocean. One Earth 2020, 2, 43–54. [Google Scholar] [CrossRef] [Green Version]
  53. Abdulla, A.; Gomei, M.; Maison, E.; Piante, C. Status of Marine Protected Areas in the Mediterranean Sea; IUCN: Málaga, Spain; WWF: Gland, Switzerland, 2008; 152p. [Google Scholar]
  54. Borja, A.; Elliott, M.; Andersen, J.H.; Berg, T.; Carstensen, J.; Halpern, B.S.; Heiskanen, A.-S.; Korpinen, S.; Lowndes, J.S.S.; Martin, G.; et al. Overview of Integrative Assessment of Marine Systems: The Ecosystem Approach in Practice. Front. Mar. Sci. 2016, 3, 20. [Google Scholar] [CrossRef] [Green Version]
  55. Cochrane, S.K.J.; Andersen, J.H.; Berg, T.; Blanchet, H.; Borja, A.; Carstensen, J.; Elliott, M.; Hummel, H.; Niquil, N.; Renaud, P.E. What Is Marine Biodiversity? Towards Common Concepts and Their Implications for Assessing Biodiversity Status. Front. Mar. Sci. 2016, 3, 248. [Google Scholar] [CrossRef] [Green Version]
  56. Uusitalo, L.; Blanchet, H.; Andersen, J.H.; Beauchard, O.; Berg, T.; Bianchelli, S.; Cantafaro, A.; Carstensen, J.; Carugati, L.; Cochrane, S.; et al. Indicator-Based Assessment of Marine Biological Diversity–Lessons from 10 Case Studies across the European Seas. Front. Mar. Sci. 2016, 3, 159. [Google Scholar] [CrossRef]
  57. Katsanevakis, S.; Coll, M.; Fraschetti, S.; Giakoumi, S.; Goldsborough, D.; Mačić, V.; Mackelworth, P.; Rilov, G.; Stelzenmüller, V.; Albano, P.G.; et al. Twelve Recommendations for Advancing Marine Conservation in European and Contiguous Seas. Front. Mar. Sci. 2020, 7, 565968. [Google Scholar] [CrossRef]
  58. Vasilakopoulos, P.; Maravelias, C.D.; Tserpes, G. The Alarming Decline of Mediterranean Fish Stocks. Curr. Biol. 2014, 24, 1643–1648. [Google Scholar] [CrossRef] [Green Version]
  59. Piroddi, C.; Coll, M.; Steenbeek, J.; Moy, D.M.; Christensen, V. Modelling the Mediterranean marine ecosystem as a whole: Addressing the challenge of complexity. Mar. Ecol. Prog. Ser. 2015, 533, 47–65. [Google Scholar] [CrossRef] [Green Version]
  60. Piroddi, C.; Coll, M.; Liquete, C.; Macias, D.; Greer, K.; Buszowski, J.; Steenbeek, J.; Danovaro, R.; Christensen, V. Historical changes of the Mediterranean Sea ecosystem: Modelling the role and impact of primary productivity and fisheries changes over time. Sci. Rep. 2017, 7, srep44491. [Google Scholar] [CrossRef] [Green Version]
  61. Guidetti, P.; Di Franco, A.; Calò, A.; Belharet, M.; Claudet, J.; Carbonara, P.; Coll, M.; Corrales, X.; Font, T.; Ligas, A.; et al. Marine Protected Areas: Network(s) for Enhancement of Sustainable Fisheries in EU Mediterranean Waters Safe Net: Sustainable Fisheries in EU Mediterranean Waters through Network of MPAs; Publications Office of the EU: Luxembourg, 2019. Available online: https://op.europa.eu/fr/publication-detail/-/publication/d6a7167b-f17a-11ea-991b-01aa75ed71a1/language-en/format-PDF/source-153083541 (accessed on 16 November 2022).
  62. Bevilacqua, S.; Katsanevakis, S.; Micheli, F.; Sala, E.; Rilov, G.; Sarà, G.; Malak, D.A.; Abdulla, A.; Gerovasileiou, V.; Gissi, E.; et al. The Status of Coastal Benthic Ecosystems in the Mediterranean Sea: Evidence from Ecological Indicators. Front. Mar. Sci. 2020, 7, 475. [Google Scholar] [CrossRef]
  63. Claudet, J.; Loiseau, C.; Sostres, M.; Zupan, M. Underprotected Marine Protected Areas in a Global Biodiversity Hotspot. One Earth 2020, 2, 380–384. [Google Scholar] [CrossRef]
  64. Torres, M.; Coll, M.; Heymans, J.J.; Christensen, V.; Sobrino, I. Food-web structure of and fishing impacts on the Gulf of Cadiz ecosystem (South-western Spain). Ecol. Model. 2013, 265, 26–44. [Google Scholar] [CrossRef]
  65. Tudela, S.; Kai, A.K.; Maynou, F.; El Andalossi, M.; Guglielmi, P. Driftnet fishing and biodiversity conservation: The case study of the large-scale Moroccan driftnet fleet operating in the Alboran Sea (SW Mediterranean). Biol. Conserv. 2005, 121, 65–78. [Google Scholar] [CrossRef]
  66. Commission Decision (EU). 2017/848 of 17 May 2017 laying down criteria and methodological standards on good environmental status of marine waters and specifications and standardised methods for monitoring and assessment, and repealing Decision 2010/477/EU (Text with EEA relevance). C/2017/2901. Off. J. Eur. Union L 2017, 125, 43–74. Available online: https://eur-lex.europa.eu/legal-content/EN/TXT/?uri=CELEX%3A32017D0848 (accessed on 3 November 2022).
  67. Convention on Biological Diversity 2010. Decision Adopted by The Conference Of The Parties To The Convention On Biological Diversity at its Tenth Meeting X/2. In Proceedings of the Strategic Plan for Biodiversity 2011–2020 and the Aichi Biodiversity Targets, Nagoya, Japan, 18–29 October 2010; Agenda Item 4.4. Available online: https://www.cbd.int/doc/decisions/cop-10/cop-10-dec-02-en.pdf (accessed on 3 November 2022).
  68. Acosta, J.J.; Ámez, M.A.; Araujo, H.; Castro, B.; Castro, J.A.; Cebrián, J.L.; Gancedo, R.; García, J.M.; Marín, M.; Morlán, R.; et al. Análisis de la Actividad Pesquera de la Flota Española de Aguas Ibéricas Atlánticas y su Uso en la Gestión de Stocks (2017-2019). Proyecto SAP: Seguimiento y Análisis de la Actividad Pesquera en el Área ICES. SAP: Seguimiento y Análisis de la Actividad Pesquera en el Área ICES; 2019; 84p. Available online: http://www.ieo.es/documents/2796493/5496504/SAP-Analisis_actividad_pesquera_espa%C3%B1ola_aguas_atlanticas_2017-19/36310d6f-0487-4208-9393-8a8436b7416b (accessed on 5 September 2022). [CrossRef]
  69. Mora, C.; Sale, P. Ongoing global biodiversity loss and the need to move beyond protected areas: A review of the technical and practical shortcomings of protected areas on land and sea. Mar. Ecol. Prog. Ser. 2011, 434, 251–266. [Google Scholar] [CrossRef] [Green Version]
  70. Shanks, A.L.; Grantham, B.A.; Carr, M.H. Propagule dispersal distance and the size and spacing of marine reserves. Ecol. Appl. 2003, 13, 159–169. [Google Scholar] [CrossRef]
  71. Palumbi, S.R. Marine reserves and ocean neighborhoods: The Spatial Scale of Marine Populations and Their Management. Annu. Rev. Environ. Resour. 2004, 29, 31–68. [Google Scholar] [CrossRef]
  72. García-Charton, J.A.; Pérez-Ruzafa, A.; Sánchez-Jerez, P.; Bayle-Sempere, J.T.; Reñones, O.; Moreno, D. Multi-scale spatial heterogeneity, habitat structure, and the effect of marine reserves on Western Mediterranean rocky reef fish assemblages. Mar. Biol. 2004, 144, 161–182. [Google Scholar] [CrossRef]
  73. García-Charton, J.; Pérez-Ruzafa, A.; Marcos, C.; Claudet, J.; Badalamenti, F.; Benedetti-Cecchi, L.; Falcón, J.; Milazzo, M.; Schembri, P.J.; Stobart, B.; et al. Effectiveness of European Atlanto-Mediterranean MPAs: Do they accomplish the expected effects on populations, communities and ecosystems? J. Nat. Conserv. 2008, 16, 193–221. [Google Scholar] [CrossRef] [Green Version]
  74. Pérez-Ruzafa, A.; González-Wangüemert, M.; Lenfant, P.; Marcos, C.; García-Charton, J.A. Effects of fishing protection on the genetic structure of fish populations. Biol. Conserv. 2006, 129, 244–255. [Google Scholar] [CrossRef]
  75. Pérez-Ruzafa, A.; García-Charton, J.A.; Marcos, C. North East Atlantic vs. Mediterranean Marine Protected Areas as Fisheries Management Tool. Front. Mar. Sci. 2017, 4, 245. [Google Scholar] [CrossRef] [Green Version]
  76. Hogg, K.; Noguera-Méndez, P.; Semitiel-García, M.; Gray, T.; Young, S. Controversies over stakeholder participation in marine protected area (MPA) management: A case study of the Cabo de Palos-Islas Hormigas MPA. Ocean Coast. Manag. 2017, 144, 120–128. [Google Scholar] [CrossRef] [Green Version]
  77. Hogg, K.; Semitiel-García, M.; Noguera-Méndez, P.; García-Charton, J.A. A governance analysis of Cabo de Palos-Islas Hormigas and Cabo de Gata-Níjar Marine Protected Areas, Spain. Mar. Policy 2021, 127, 102944. [Google Scholar] [CrossRef]
  78. Fox, H.E.; Mascia, M.B.; Basurto, X.; Costa, A.; Glew, L.; Heinemann, D.; Karrer, L.B.; Lester, S.E.; Lombana, A.V.; Pomeroy, R.S.; et al. Reexamining the science of marine protected areas: Linking knowledge to action. Conserv. Lett. 2011, 5, 1–10. [Google Scholar] [CrossRef] [Green Version]
  79. Rojo, I.; Anadón, J.D.; García-Charton, J.A. Exceptionally high but still growing predatory reef fish biomass after 23 years of protection in a Marine Protected Area. PLoS ONE 2021, 16, e0246335. [Google Scholar] [CrossRef] [PubMed]
  80. Alonso, J.; García-Bellido, E.; Prados, S. La Red Natura 2000 marina. Ambienta 2017, 119, 82–95. Available online: https://www.miteco.gob.es/ministerio/pags/Biblioteca/Revistas/pdf_AM%2FPDF_AM_Ambienta_2017_119_82_95.pdf (accessed on 4 October 2021).
  81. Cabral, R.B.; Bradley, D.; Mayorga, J.; Goodell, W.; Friedlander, A.M.; Sala, E.; Costello, C.; Gaines, S.D. A global network of marine protected areas for food. Proc. Natl. Acad. Sci. USA 2020, 117, 28134–28139. [Google Scholar] [CrossRef]
  82. Vilas, D.; Coll, M.; Corrales, X.; Steenbeek, J.; Piroddi, C.; Calò, A.; Di Franco, A.; Font, T.; Guidetti, P.; Ligas, A.; et al. The effects of marine protected areas on ecosystem recovery and fisheries using a comparative modelling approach. Aquat. Conserv. Mar. Freshw. Ecosyst. 2020, 30, 1885–1901. [Google Scholar] [CrossRef]
  83. Ban, N.C.; Davies, T.E.; Aguilera, S.E.; Brooks, C.; Cox, M.; Epstein, G.; Evans, L.S.; Maxwell, S.M.; Nenadovic, M. Social and ecological effectiveness of large marine protected areas. Glob. Environ. Chang. 2017, 43, 82–91. [Google Scholar] [CrossRef]
  84. EC (1995) 95/540/EC: Council Decision of 7 December 1995 on the Conclusion of an Agreement in the Form of An Exchange of Letters Concerning the Provisional Application of the Agreement on Cooperation in the Sea Fisheries Sector between the European Community and the Kingdom of Morocco Initialled in Brussels on 13 November 1995. Available online: https://eur-lex.europa.eu/legal-content/EN/TXT/?uri=CELEX:31995D0540 (accessed on 3 November 2022).
  85. de Carvalho-Souza, G.F.; Torres, M.; Farias, C.; Acosta, J.J.; Tornero, J.; Sobrino, I.; Ramos, F.; Llope, M. International politics must be considered together with climate and fisheries regulation as a driver of marine ecosystems. Glob. Environ. Chang. 2021, 69, 102288. [Google Scholar] [CrossRef]
  86. Airoldi, L.; Beck, M.W. Loss, Status and Trends for Coastal Marine Habitats of Europe. In Oceanography and Marine Biology: An Annual Review 45; Gibson, R.N., Atkinson, R.J.A., Gordon, J.D.M., Eds.; CRC Press: Boca Raton, FL, USA, 2007; Chapter 7; pp. 345–405. [Google Scholar] [CrossRef]
  87. Pauly, D.; Christensen, V.; Dalsgaard, J.; Froese, R.; Torres, F., Jr. Fishing Down Marine Food Webs. Science 1998, 279, 860–863. [Google Scholar] [CrossRef]
  88. Coll, M.; Piroddi, C.; Albouy, C.; Ben Rais Lasram, F.; Cheung, W.W.L.; Christensen, V.; Karpouzi, V.S.; Guilhaumon, F.; Mouillot, D.; Paleczny, M.; et al. The Mediterranean Sea under siege: Spatial overlap between marine biodiversity, cumulative threats and marine reserves. Glob. Ecol. Biogeogr. 2012, 21, 465–480. [Google Scholar] [CrossRef]
  89. Carbonell, A.; Martín, P.; De Ranieri, S.; WEDIS team. Discards of the Western Mediterranean Trawl Fleets. Rapports et Procès-Verbaux des Réunions. Commission Internationale pour L’Exploration Scientifique de la Mer Méditerranée, 35. 1998, pp. 392–393. Available online: http://hdl.handle.net/10508/6895 (accessed on 22 June 2022).
  90. Pauly, D.; Ulman, A.; Piroddi, C.; Bultel, E.; Coll, M. ‘Reported’ versus ‘likely’ fisheries catches of four Mediterranean countries. Sci. Mar. 2014, 78, 11–17. [Google Scholar] [CrossRef]
  91. Lloret, J.; Biton-Porsmoguer, S.; Carreño, A.; Di Franco, A.; Sahyoun, R.; Melià, P.; Claudet, J.; Sève, C.; Ligas, A.; Belharet, M.; et al. Recreational and small-scale fisheries may pose a threat to vulnerable species in coastal and offshore waters of the western Mediterranean. ICES J. Mar. Sci. 2019, 77, 2255–2264. [Google Scholar] [CrossRef]
  92. Casalduero, M.G. La pesca marítima recreativa: En el marco de la política pesquera común. Rev. Catalan-Dret Ambient. 2021, 12, 1–36. [Google Scholar] [CrossRef]
  93. Francour, P.; Ganteaume, A.; Poulain, M. Effects of boat anchoring in Posidonia oceanica seagrass beds in the Port-Cros National Park (NW Mediterranean Sea). Aquat. Conserv. 1999, 9, 391–400. [Google Scholar] [CrossRef]
  94. Pauly, D.; Christensen, V. Primary production required to sustain global fisheries. Nature 1995, 374, 255–257. [Google Scholar] [CrossRef]
  95. Pauly, D.; Watson, R. Background and interpretation of the ‘Marine Trophic Index’ as a measure of biodiversity. Philos. Trans. R. Soc. B Biol. Sci. 2005, 360, 415–423. [Google Scholar] [CrossRef] [Green Version]
  96. Baeta, F.; Costa, M.J.; Cabral, H. Changes in the trophic level of Portuguese landings and fish market price variation in the last decades. Fish. Res. 2009, 97, 216–222. [Google Scholar] [CrossRef]
  97. Muñoz, J.L.; Cárdenas, S. La pesca artesanal en el caladero de Conil (Golfo de Cádiz). In Acuicultura, Pesca y Marisqueo en el Golfo de Cádiz; Morales, J.L., Mata, A.J., Rodríguez, A., Revilla, C.J., Eds.; Dirección General de Pesca y Acuicultura de la Junta de Andalucía: Sevilla, Spain, 2005; pp. 204–223. Available online: https://www.researchgate.net/publication/258158121_Acuicultura_Pesca_y_Marisqueo_en_el_Golfo_de_Cadiz (accessed on 23 September 2022).
  98. Camiñas, J.A. Pesquerías Artesanales Mediterráneas. El caso Andaluz. Revista de Estudios Agrosociales. MAPA 1990, 155 (Enero-Marzo) pp. 83–117. Available online: https://www.miteco.gob.es/ministerio/pags/Biblioteca/Revistas/pdf%5Freas%2Fr151%5F04%2Epdf (accessed on 23 September 2022).
  99. Castilla-Espino, D.; García del Hoyo, J.J.; Domínguez, J.M.; Suárez, A. Un modelo de gestión para las pesquerías de boquerón y voraz basado en la dinámica de sistemas que toma en consideración las condiciones medioambientales. In Cultura, Mercados y Gestión de la Pesca Artesanal en el Golfo de Cádiz García; del Hoyo, J.J., Ed.; Universidad de Huelva, Servicio de Publicaciones: Huelva, Spain, 2014; pp. 45–70. [Google Scholar]
  100. García del Hoyo, J.J. (Ed.) Cultura, Mercados y Gestión de la Pesca Artesanal en el Golfo de Cádiz; Universidad de Huelva, Servicio de Publicaciones: Huelva, Spain, 2014; 133p. [Google Scholar]
  101. García del Hoyo, J.J.; Toribio, R.J.; Ordaz, F.G. Análisis de las interrelaciones entre la evolución de la flota atunera española y el sector conservero. Stud. Appl. Econ. 2019, 37, 81–100. [Google Scholar] [CrossRef]
  102. de Madariaga, C.J.; del Hoyo, J.J.G. Enhancing of the cultural fishing heritage and the development of tourism: A case study in Isla Cristina (Spain). Ocean Coast. Manag. 2018, 168, 1–11. [Google Scholar] [CrossRef]
  103. Vila, Y.; Silva, L.; Millán, M.; Ramos, F.; Gil, J.; Jiménez, M.P. Los Recursos Pesqueros del Golfo de Cádiz: Estado Actual de Explotación; Informe Técnico; Instituto Español de Oceanografía; 2004; 200p. Available online: http://www.repositorio.ieo.es (accessed on 15 February 2023).
Figure 1. Bathymetric map of the marine areas included in the study elaborated from the EMODnet Bathymetry Viewing and Download portal service available at https://portal.emodnet-bathymetry.eu, accessed on 30 October 2022.
Sustainability 15 06544 g001
Figure 2. Conceptual path model linking anthropogenic pressures, biodiversity loss, marine ESs, and conservation and management strategies of the two marine areas described above. The inner model consists of seven latent variables (LVs, blue ovals) that affect the endogenous variables through different pathways. Each LV is measured by its own block of manifest variables, which form the outer model (MVs, green boxes). We hypothesise that anthropogenic pressures increase marine biodiversity loss and decrease their associated ecosystem services, thus, decreasing the delivery of ecosystem services. Indeed, biodiversity loss positively impacts conservation policy responses through the launching of regulations and MPAs.
Sustainability 15 06544 g002
Figure 3. Representation of the PLS-PM of the full time series of the Gulf of Cádiz showing the weights of the MVs of the outer model; each value is positioned over the green boxes of each MV. The strength and direction of all the different pathways of the inner model were validated by bootstrapping, and the 95 % confidence interval (CI) is given below each path coefficient.
Sustainability 15 06544 g003
Figure 4. Representation of the PLS-PM of the full time series of the Alborán Sea showing the weights of the MVs of the outer model; each value is positioned over the green boxes of each MV. The strength and direction of all the different pathways of the inner model were validated by bootstrapping, and the 95 % confidence interval (CI) is given below each path coefficient.
Sustainability 15 06544 g004
Table 1. Values of R2 representing the predictive power of the overall model of each studied area.
Marine AreaR2FR2 (Bootstrap)S.E.Lower Confidence Limit (95%)Upper Confidence Limit (95%)
Gulf of Cádiz0.961804.4090.9570.0140.9140.984
Alborán 0.909330.0680.9220.0190.8790.959
Table 2. Goodness of fit for the models of the two studied areas; values are acceptable when they are larger than 0.7.
ModelGoFGoF (Bootstrap)S.E.Lower Confidence Limit (95%)Upper Confidence Limit (95%)
Gulf of Cádiz
Overall model0.7290.7190.0510.6020.836
Outer model0.9660.9410.0570.8041.000
Inner model0.8760.8720.0140.8290.898
Alborán
Overall model0.8040.7970.0690.6540.921
Outer model0.9660.9420.0690.8031.000
Inner model0.9560.9520.0130.9150.972
Table 3. Check of the unidimensionality of the reflective indicators (MVs) of each block (LVs) in the outer model when Cronbach’s a and Dillon–Goldstein are >0.7 for the Gulf of Cádiz (GC) and Alborán (A) marine areas.
Cronbach’s αDillon–Goldstein ρ
Latent VariableGCAGCA
Biodiversity loss0.9710.9450.9770.956
Regulating ES 0.859 0.934
Provisioning ES0.8390.9180.9250.961
Table 4. Summary of the Loadings and Communalities contained in the outer model of each studied area. Acceptable values for reflective blocks should be >0.7 (marked in bold).
Latent VariablesManifest VariablesLoadingsCommunalitiesLoadingsCommunalities
Gulf of CádizAlborán
Management policies
(formative)
European Management policies0.6350.4030.6550.428
National Management policies0.9150.8370.9240.853
Regional Management policies0.9460.8960.9770.954
Pressures
(formative)
Population (inhabitants/yr)−0.9110.829−0.9010.813
Overexploitation0.9970.9950.9940.988
Land use change−0.8360.699−0.8580.736
Biodiversity Loss
(Mixed)
nº bony fish spp.
(formative)
0.9620.9250.9130.834
nº cartilaginous fish spp. (formative)0.9150.8380.8470.717
nº molluscs spp.
(formative)
0.6420.4120.4360.190
nº crustacean spp. (formative)0.9280.8610.8030.645
UICN (fisheries)
(reflective)
0.9630.9280.7850.616
IUCN (unexploited) (reflective)0.9190.8450.8660.750
IUCN (Global)
(reflective)
0.9800.9600.9560.913
IUCN (Mediterranean)
(reflective)
0.8560.733
Cultural ES
(reflective)
Artisanal fishery features1.000 1.000
Regulating ES
(reflective)
PPR1.000 0.9360.876
ITM 0.9360.877
Provisioning ES
(reflective)
Total fisheries’ biomass for all groups (kg)0.9060.8220.9560.913
Fishermen0.9470.8960.9660.934
Conservation Policies
(formative)
Number of regulations for protected areas0.1860.0350.3310.110
Total Number of Marine Protected areas and reserves0.9950.9900.9980.996
Changes in the Total Marine Protected Area Surface (ha)0.9710.9430.9810.963
Table 5. Summary of the evolution of marine environmental education centres in Andalucía.
Marine AreaCentreOpenedClosed
Gulf CádizMarina El Terrón19962008
Museo Marítimo Matalascañas20022011
Centro de Interpretación del Atún de Almadraba 20082011
Alborán SeaAula del mar de Benalmádena19892011
Aula del Mar de Málaga1989-
Aula del Mar “El Corralete” Cabo de Gata20002007
Disclaimer/Publisher’s Note: The statements, opinions and data contained in all publications are solely those of the individual author(s) and contributor(s) and not of MDPI and/or the editor(s). MDPI and/or the editor(s) disclaim responsibility for any injury to people or property resulting from any ideas, methods, instructions or products referred to in the content.

