Article

Rainfall Influences the Patterns of Diversity and Species Distribution in Sandy Beaches of the Amazon Coast

1
Departamento de Biologia Animal, Instituto de Biologia, Universidade Estadual de Campinas, São Paulo 13083-970, SP, Brazil
2
Departamento de Ciências Biológicas e da Saúde, Universidade Federal do Amapá, Macapá 68903-419, AP, Brazil
3
College of Science and Mathematics, University of the Virgin Islands, St. Thomas, VI 00802, USA
4
Instituto Estadual de Pesquisa do Amapá, Macapá 68906-440, AP, Brazil
5
Instituto Chico Mendes de Conservação da Biodiversidade, Macapá 68901-625, AP, Brazil
*
Author to whom correspondence should be addressed.
Sustainability 2023, 15(6), 5417; https://doi.org/10.3390/su15065417
Submission received: 16 February 2023 / Revised: 15 March 2023 / Accepted: 17 March 2023 / Published: 18 March 2023

Abstract

:
The Amazon region is one of the Earth’s hotspots of biodiversity and has a pivotal role in climate regulation. Yet, little is known about its coastal biodiversity. Here, we performed the first assessment of macrobenthic diversity and ecological patterns of sandy beaches north of the Amazon River delta, the world’s largest freshwater input into the oceans. By assessing spatial and temporal changes in the soft-bottom biodiversity and environmental variables of three beaches (Goiabal, Nazaré, and Sumaúma) in the northernmost stretch of the Brazilian coast, we found low richness (14 taxa, overall; Goiabal: 3.27 ± 1.78; Nazaré: 2.34 ± 1.29; Sumaúma: 2 ± 0.67) and diversity (Goiabal: 0.72 ± 0.52; Nazaré: 0.62 ± 0.46; Sumaúma: 0.55 ± 0.39) across 2949 individuals with great dominance of estuarine species (notably Nephthys fluviatis and Sphaeromopsis mourei). Abundance was higher during rainy periods, and the same pattern was observed for richness and diversity in comparison to transitional periods, at least on Nazaré Beach. Environmental heterogeneity was reduced during rainy periods, resulting in a higher abundance of dominant species and lower beta diversity. Most species presented aggregated distribution at the upper intertidal zone, and changes in macrobenthic assemblages were linked to variations in rainfall and organic matter content in the sediment. Given the ecological uniqueness and the severe erosional process affecting the northern coast of the Amazon region, our results provide essential baseline knowledge to better understand the patterns and processes influencing its understudied biodiversity. We advocate that further studies expand our findings to support the conservation of this region.

1. Introduction

Most likely, no other region in the world draws more global attention to environmental issues than the Amazon basin. This region is a potential tipping element in the Earth’s climate system and is home to an incredible diversity of organisms from all biological groups [1,2]. Accordingly, the global scientific community, non-government organizations, and stakeholders have put considerable effort into recognizing the local biodiversity and understanding key patterns and processes that regulate Amazon’s ecosystems. These efforts have achieved remarkable advances, such as establishing a protected area network and providing financial and marketing incentives, to reduce deforestation and forest degradation [3]. However, they are mainly focused on continental environments, leaving behind the vast and essential coastal ecosystems and their biodiversity [3].
The Amazon coastal zone (ACZ) presents unique environmental conditions likely to be correlated to unique biological patterns [4,5]. First, it is influenced by a macrotidal regime that reaches the highest range (12 m) along the Brazilian coast and is associated with strong tidal currents and wide intertidal areas [6,7,8]. Second, the ACZ is subject to strong seasonal rainfall variation, which is expected to be a primary driver of Amazon terrestrial [9] and aquatic ecosystems [10,11]. Moreover, the ACZ is crossed by the Amazon River mouth, the largest river plume in the world, which extends up to hundreds of kilometers and discharges a massive amount of freshwater and fine sediment into the ocean. This great sediment and freshwater input can strongly change the environmental features and reduce the salinity of coastal waters [10,11], thereby constituting a significant barrier to the establishment and dispersal of organisms, especially those with low tolerances to reduced salinity and low dispersal capacity [12,13,14]. Following the influence of the Amazon River mouth, the ACZ is usually divided into three great sectors with very distinct physiognomies: the Amazon gulf itself and its southern and northern zones.
Despite the ecological importance and uniqueness of Amazonian coastal ecosystems, only a minimal number of studies have investigated their biodiversity [15,16]. This knowledge gap is mainly related to the challenges of reaching most of the region’s coastal ecosystems, which can often only be accessed after long boat trips. Consequently, a few biodiversity studies in the region have been performed on sites close to urban centers harboring universities or research centers. For instance, the macrobenthic diversity (i.e., organisms > 0.5 mm that live associated with the bottom of aquatic environments) of ACZ sedimentary shores have been studied only on a few sites located south of the Amazon River delta [17,18,19]. These studies found a considerable number of species (>40) and substantial seasonal variation in the diversity and structure of macrobenthic assemblages, with lower species richness during the rainy season.
Here, we performed the first assessment of the macrobenthic diversity and ecological patterns of sandy beaches from the northernmost part of the Brazilian Amazon coastal zone (ACZ), an area known as the Amapá coast (in reference to the federal unit). As a consequence of the Amazon River plume, which flows northward via the North Brazil Current (NBC), the Amapá coast shows unique environmental characteristics, such as the presence of the world’s largest mud banks [7,20,21]. Additionally, the Amapá state possesses very low rates of original vegetation loss, has the second lowest population density (4.3/km²) for any Brazilian state, and has no major urban center on its coast. This configuration assures that the coastal sandy beaches of Amapá are essentially unaltered by direct anthropogenic disturbances and are mainly driven by natural features. However, the Amapá coast experiences the highest erosion rates along the whole Brazilian coast with ~65% of its coastline currently retreating [22]. Investigations on the biodiversity and spatial and temporal patterns of Amapá sandy shores are, therefore, critical to understanding and preserving these unique ecosystems.
To investigate the diversity and distribution of coastal macrobenthic assemblages of the Amapá coast, we sampled the across-shore gradient of three remotely located sandy shores. Additionally, as seasonal rainfall variation is expected to be a primary driver of Amazon aquatic ecosystems [10,11,19], we replicated our sampling on two beaches during three different seasons (dry, transition, and rainy) to investigate the temporal patterns of species richness, abundance, and beta diversity of macrobenthic organisms as well as to assess how they are influenced by local environmental variables (e.g., habitat heterogeneity, sediment, salinity, and nutrients). We tested the hypothesis that rainfall rate is a significant driver of Amazon coastal species and that the considerable input of freshwater during the rainy season reduces the number of species, abundance, and diversity (Shannon index) of Amazon’s beaches, as demonstrated for other sandy beaches in South America, e.g., [23,24]. In addition, since floods and strong hydro dynamism tend to homogenize the environmental characteristics and reduce the spatial variability of biological assemblages (i.e., beta diversity) [25,26,27], we expected lower habitat heterogeneity and beta diversity of macrobenthic assemblages during the rainy season—an expectation further reinforced by the possible lower number of species and individuals.

2. Materials and Methods

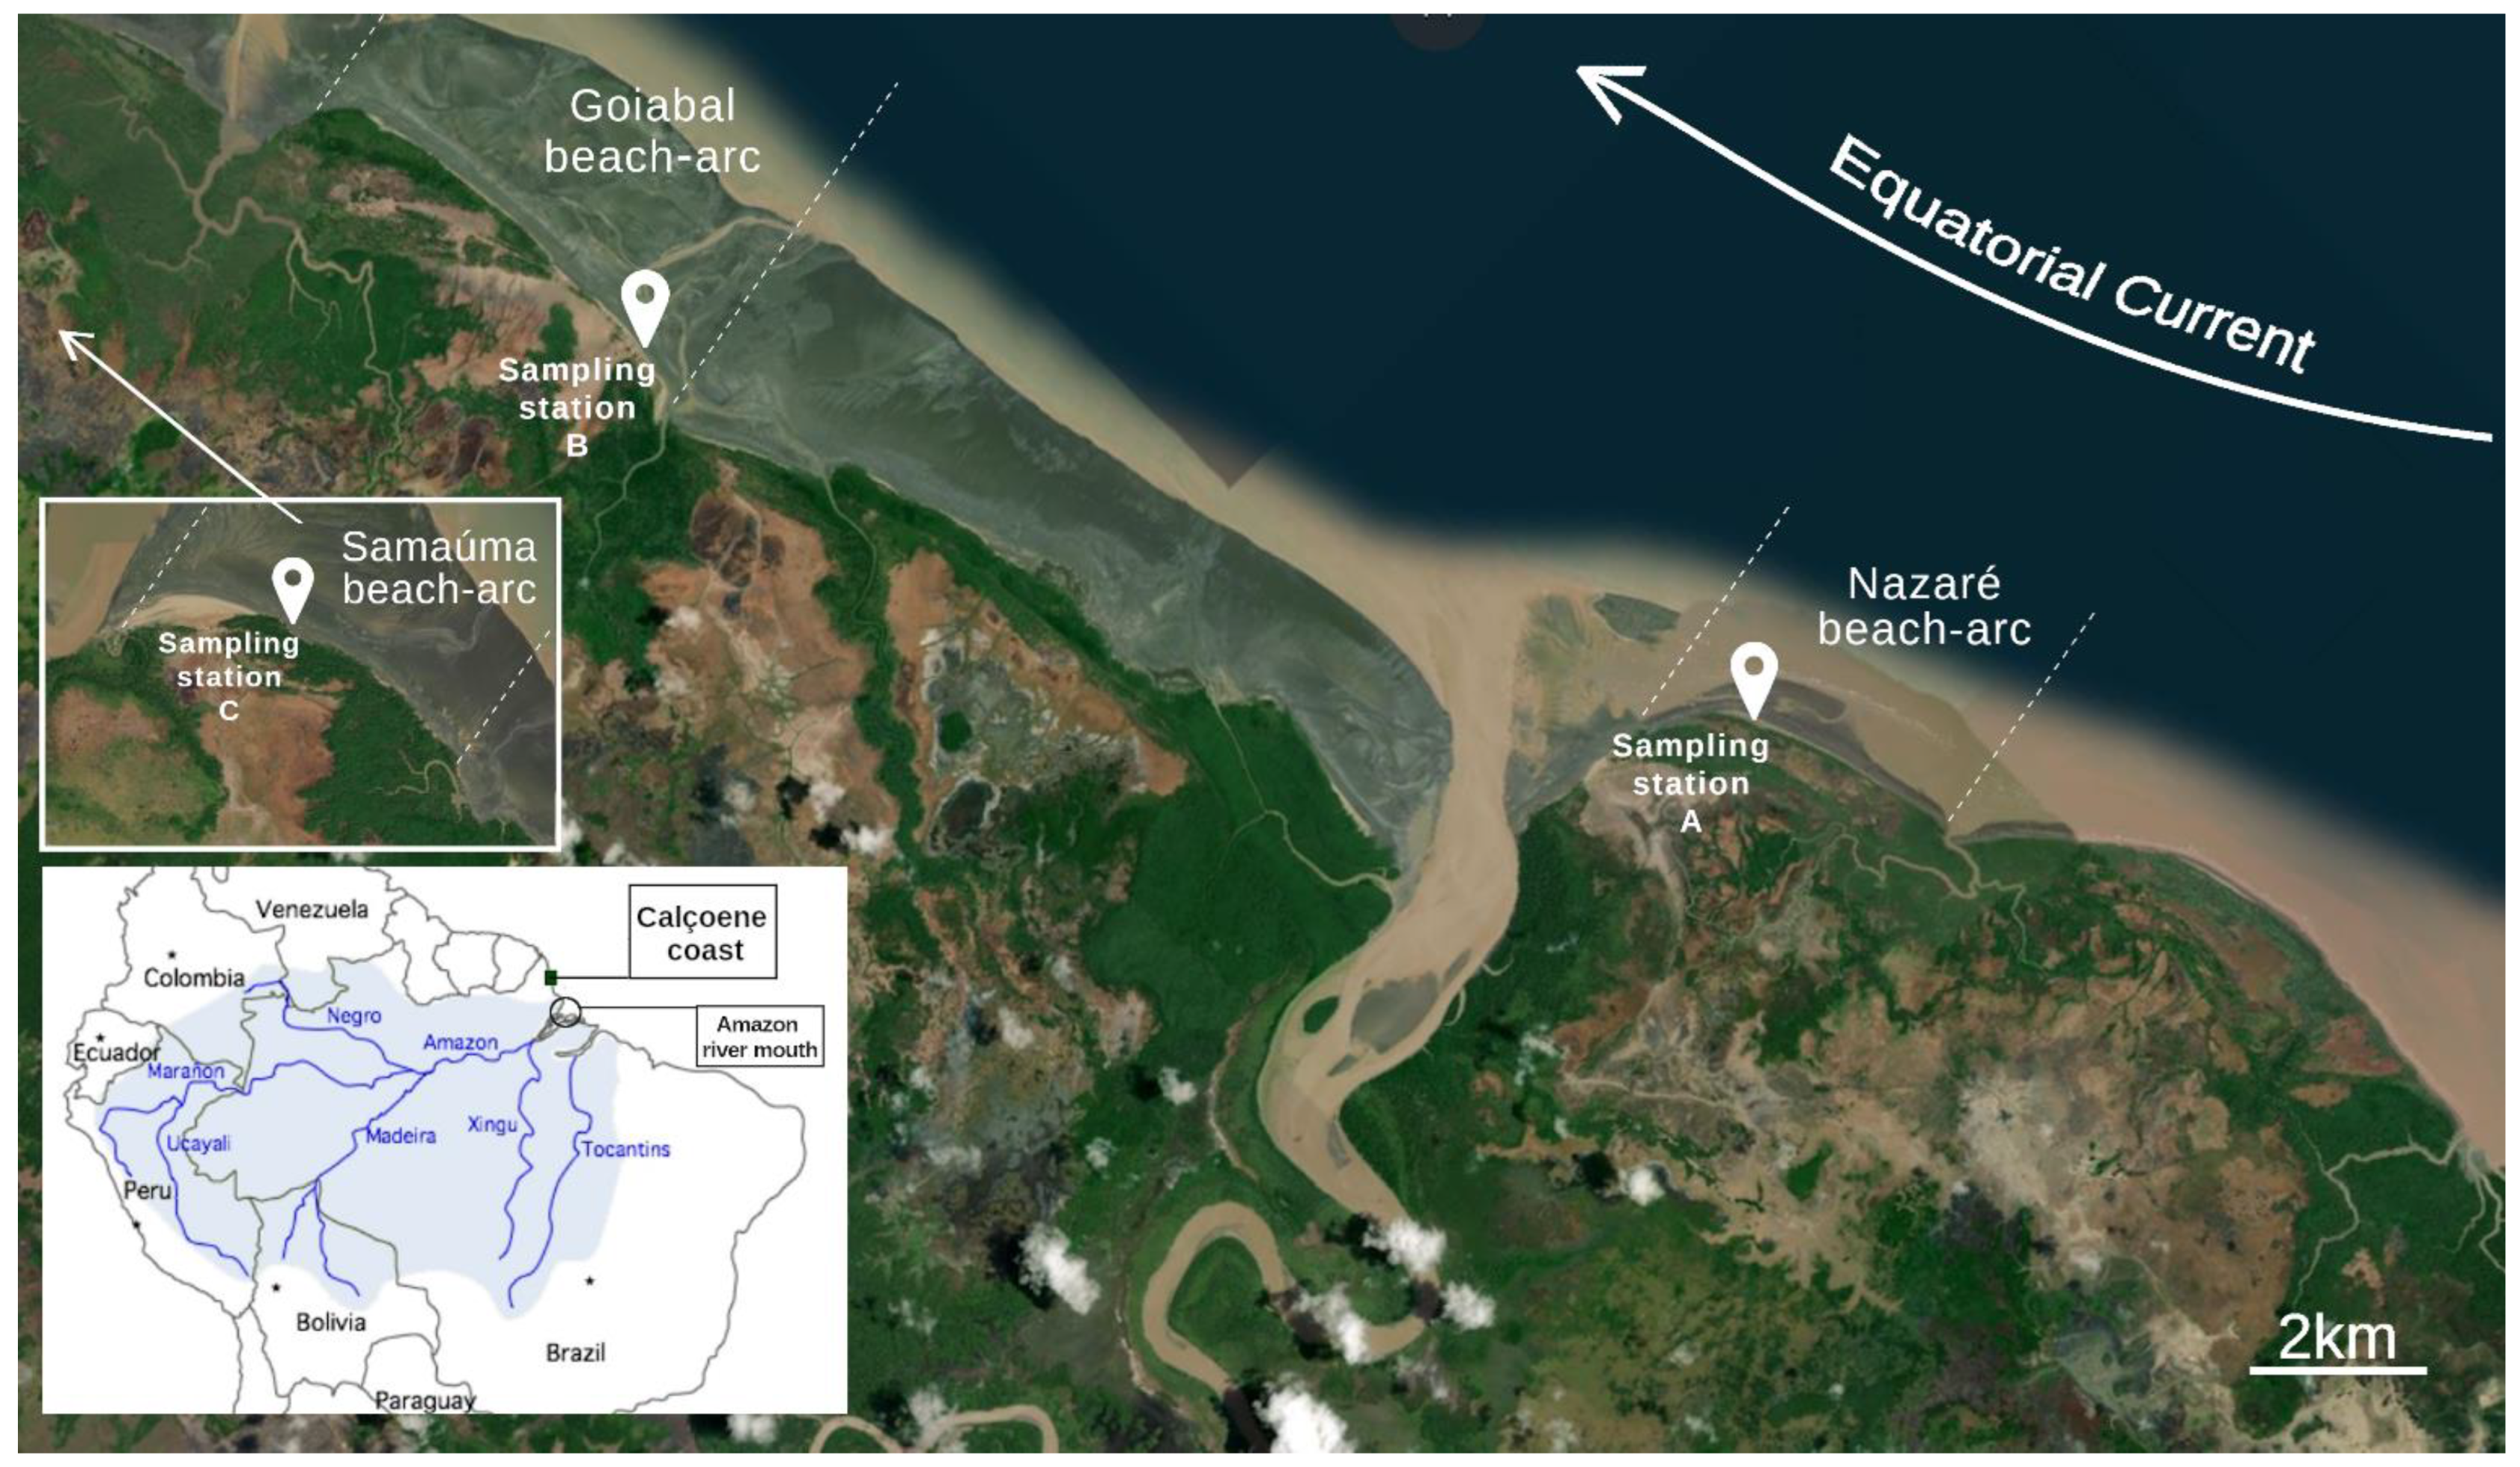
2.1. Study Area and Sampling Procedures

The Amapá coast has a hot and humid climate with mean temperatures ranging from 25 °C to 27 °C and humidity ~80% the entire year. Mean annual precipitation ranges from 2600 to 3750 mm, mainly concentrated between January and May [7]. Beaches in the region are arc-shaped, each delimited by freshwater streams. Because water discharges in this coast are driven westwards by the main currents, the eastern section of the beaches is more directly impacted by the stream flows (Figure 1).
Sampling was performed during spring tides at the eastern section of Goiabal Beach (2°31′02.2″ N; 50°49′33.8″ W), and the western section of Nazaré (2°29′32.3″ N; 50°47′23.2″ W) and Samaúma Beaches (2°48′23.0″ N; 50°55′40.9″ W) (Figure 1). The three sites are tide-dominated flats with a predominance of very fine sands [28]. The width of the sandy intertidal zone changes across the arc, shorter eastwards, where the stream sediment is responsible for muddy lower levels. Therefore, the across-shore length of the sampling area in Goiabal was about 450 m large and up to 1400 m in Samaúma and 1850 m in Nazaré. For temporal replicates, the study areas in Goiabal and Nazaré were chosen due to accessibility as Sumaúma is farther from roads and is difficult to access during rainy periods.
Figure 1. Location of the three sampled beaches (Goiabal, Nazaré, and Sumaúma) along the northernmost Brazilian coast. Left-bottom image: Location of the sampling areas (Calçoene city coast; modified from https://ambientes.ambientebrasil.com.br/amazonia, accessed on 8 February 2023). Satellite images highlight the arc-shaped beaches of the ACZ northernmost coats; adapted from Bing maps, Maxar 2002, Earthstar Geographic SIO). Sampling stations correspond to the following coordinates: (A) 2°31′02.2″ N; 50°49′33.8″ W, (B) 2°29′32.3″ N; 50°47′23.2″ W, (C) 2°48′23.0″ N; 50°55′40.9″ W.
Sustainability 15 05417 g001
We sampled Goiabal and Nazaré three times: in September and November 2018, respectively (each with cumulative precipitation ≤ 50 mm, considered the sampling dry period), July and December 2017, respectively (each with cumulative precipitation between 50 and 150 mm, considered the sampling transition period), and June 2018 (cumulative precipitation was ≥150 mm, considered the sampling rainy period). Sumaúma was only sampled during the dry periods as the seasonal flooding of the lower ecosystems in the region prevented us from reaching the area during the rainy season. To compute these precipitation values, daily values of this parameter were gathered from the National Institute of Meteorology (INMET) database; we then computed the cumulative measures for the 30 days immediately preceding each campaign date.
At each beach, we delimited a sector with an alongshore length of 100 m and a width the size of the intertidal region (i.e., from the drift line to the low-tide water level). These sectors were divided into along shore transects equally spaced by 50 m (Figure S1). Therefore, there were about nine transects at Goiabal, twenty-eight at Sumaúma, and thirty-seven at Nazaré. At each transect, we randomly collected three samples for macrobenthic diversity analysis (i.e., three points randomly selected from 100 possibilities, i.e., 100 m divided into 1 m intervals) with a 20 cm diameter cylindrical core up to 25 cm deep (area = 0.03 m²) and one sample for environmental analyses (i.e., sediment size, organic carbon, phosphorus, and nitrogen content) with a corer of 3 cm diameter and 20 cm depth. Macrobenthic samples were sieved into 0.3 mm mesh size, and the remaining material was inspected under a stereomicroscope to separate individuals from the sediment. We used this mesh size to avoid the loss of juvenile individuals [29]. The sampled organisms were fixed in 70% alcohol and identified to the lowest taxonomic level. Sediment was dry sieved into twelve granulometric fractions, which were individually weighed and used to obtain mean grain size and the sorting coefficient according to Folk and Ward [30].
Sediment analysis was carried out in the Laboratory of Soils of the Brazilian Agricultural Research Corporation (Embrapa) in Amapá using the following protocols: Walkley–Black method for organic content [31]; Kjeldahl methods for nitrogen determination [32]; and Mehlich methods for available soil phosphorus (P) [33].
The environmental characterization was not carried out at Sumaúma Beach due to logistic constraints. Thus, data from this beach were used only to assess the general pattern of across-shore macrofauna distribution. The environmental data from Goiabal Beach during the rainy period was not carried out due to logistic problems that caused the degradation of the samples during the COVID-19 pandemic.

2.2. Data Analysis

We performed a principal component analysis (PCA) on standardized environmental data (i.e., mean grain size, sorting coefficient, organic matter, nitrogen, phosphorus, and rainfall) of each beach individually to assess and characterize the variability of environmental conditions during each sampling period (i.e., dry, rainy, and transition).
To investigate changes in the abundance, species richness, and diversity (Shannon’s diversity index, H’) of macrobenthic assemblages of each beach among sampling periods, we ran generalized linear models (GLM) with negative binomial distribution for abundance data [34]; Poisson distribution for richness data (i.e., count data); and normal distribution for diversity. We pooled all samples from one transect and considered each transect as a replicate. Then, we used pairwise comparisons of estimated marginal means (EMM) to evaluate statistical differences among periods at each study site. Since Sumaúma was sampled only once, it was not included in the analyses of temporal variations.
To examine the zonation patterns along the tidal levels, we plotted the mean values of abundance, species richness, and H’ for each level (transect) of each beach. We also plotted the abundance values of the most common species and tested for the existence of intraspecific aggregation by calculating the Morisita index of dispersion (I) [35]. The final value was standardized following Smith-Gill [36] to range from −1 (uniform distribution) to 1 (aggregated distribution) with values close to 0 indicating random distribution. Finally, we tested the null hypothesis of random distribution by comparing the observed values with the critical values from a chi-squared distribution. These analyses were carried out individually for each beach and period to avoid confounding spatial and temporal distributions.
We tested for differences in habitat heterogeneity and beta-diversity of each beach amongst sampling periods with permutational analysis of multivariate dispersion (PERMDISP) [37]. In this analysis, higher multivariate dispersion indicates higher habitat heterogeneity and beta-diversity. We based the test on Euclidean distances from normalized environmental data for habitat heterogeneity and on Bray–Curtis transformation of abundance data for beta-diversity [5]. Samples with no individuals were not included in the analyses. We also used the framework developed by Baselga [38] to separate the total dissimilarity between assemblages (β bray) into two components accounting for the (i) balanced variation in abundance (β bal) and (ii) abundance gradients (β gra). The balanced variation in abundance accounts for substituting individuals of some species in one site with individuals of different species in another (hence, related to species turnover). Abundance gradients, in turn, show some individuals are lost from one site to another, but the species pool remains similar (i.e., one assemblage is a subset of another). We computed ordination plots (nMDS) to illustrate differences in habitat heterogeneity and beta-diversity between sampling events.
Finally, we evaluated the relationship between macrobenthic assemblages and the environmental variables using redundancy analysis (RDA). We simplified each model by removing variables with strong autocorrelation based on the variance inflation factor (VIF) for each variable, establishing a cut-off value of 3 for their removal. The assemblage dataset was transformed using the Hellinger function before the analysis [39]. Statistical significance of the model and individual variables was assessed under permutation (n = 999). For this analysis, we grouped data from Goiabal and Nazaré as the lack of environmental data from the rainy period at Goiabal could compromise an individual evaluation at this beach.
All analyses were made using the R Software v. 4.1.0 [40] with the additional packages vegan [41] for multivariate analysis, MASS [42] for negative binomial regression, emmeans [43] for pairwise posthoc comparisons, betapart [44] for partitioning beta diversity, and ggplot2 [45] for data visualization.

3. Results

3.1. Environmental Characterization and Habitat Heterogeneity

Monthly precipitation ranged from 20 to 200 mm at Goiabal and 50 to 400 mm at Nazaré. The sediments of both beaches were characterized by fine-to-very-fine sands and was predominantly well-sorted. However, sediment size was smaller during the dry season at Goiabal and bigger at Nazaré. Organic matter was higher at Nazaré and during the dry season in both areas. On the other hand, nitrogen content was higher at Goiabal and lower at Nazaré during the transition season. Phosphorus content was higher at Nazaré and during the transition period at both sites (Table 1, Figure 2).
As expected, habitat heterogeneity (i.e., multivariate dispersion of sampling stations) decreased from the dry to the rainy season at Nazaré (PERMDISP: F(2, 78) = 6.13, p < 0.01; rainy = transition < dry). Conversely, habitat heterogeneity was lower in the dry season than in the transition season at Goiabal (PERMDISP: F(1, 17) = 3.41, p = 0.08; dry < transition) (Figure 2 and Figure S2).
Figure 2. Distribution of the environmental characteristics across the three sampling periods at (A) Goiabal and (B) Nazaré Beaches. Variables are coded as: MGS: mean grain size; OM = organic matter; P = phosphorus; N = nitrogen; sorting = sorting coefficient; and rain = precipitation.
Sustainability 15 05417 g002

3.2. Macrobenthic Diversity

We found 2949 individuals from 14 taxa on the three beaches throughout the study. At Samaúma, we registered 388 individuals from seven taxa across the twenty-eight intertidal levels. The polychaete, Nephthys fluvitalis, and the isopod, Sphaeromopsis mourei, largely dominated the assemblages with 264 and 89 individuals, respectively. At Nazaré, we recorded 1282 individuals from 12 taxa. Similar as observed at Sumaúma, N. fluvitalis (n = 783) and S. mourei (n = 134) had high abundances at Nazaré as well as cumaceans (n = 236). Despite having a smaller intertidal area, Goiabal had the largest number of individuals and species (1329 individuals from 13 taxa). S. mourei (n = 213) and the dipteran Culicoides sp. (n = 212) were the most abundant taxa. Other species, such as the polychaetes N. fluvitialis (n = 197) and Laeonereis acuta (n = 197), the coleopteran Bledius sp. (n = 163), and larvae of Staphylinidae (n = 137) and Cumacea (n = 161) also contributed significantly to the overall abundance at Goiabal Beach.

3.3. Zonation Patterns

The across-shore patterns of assemblage descriptors varied among beaches. At Sumaúma Beach, patterns were the most erratic, with high oscillations at very small scales (i.e., between neighboring levels, Figure S3). At Goiabal, richness and diversity were higher in upper zones in the rainy period and in lower zones during the dry and transition periods (Figure 3). This temporal pattern was the opposite of what was found in Nazaré Beach where abundance and richness increased toward lower intertidal zones (Figure 3).
All taxa present some degree of aggregated distribution (Table 2). The polychaete, N. fluviatilis, and the isopod, S. mourei, had consistent values of dispersion throughout the different periods and beaches, showing a relatively even distribution with peaks in abundance in a few sites. However, N. fluviatilis was found mostly at mid and lower intertidal zones with increasing abundance towards lower areas in rainy and transitional periods, whereas S. mourei showed peaks of abundance at upper intertidal during rainy periods and at the mid and lower intertidal during dry periods. Conversely, the coleopteran, Bledius sp., the dipteran Culicoides sp., and the polychaete, L. acuta, had much stronger clumped distributions with values of the standardized Morisita index of dispersion higher than 0.7 in most periods and beaches. All these taxa were mostly restricted to the upper intertidal, although L. acuta peaked at mid intertidal during the transition period at Goiabal Beach. Cumacea were found mostly at lower intertidal zones in Goiabal and Nazaré during rainy periods; at Nazaré beach, this taxon was found at the mid intertidal during dry periods (Figures S4–S6).

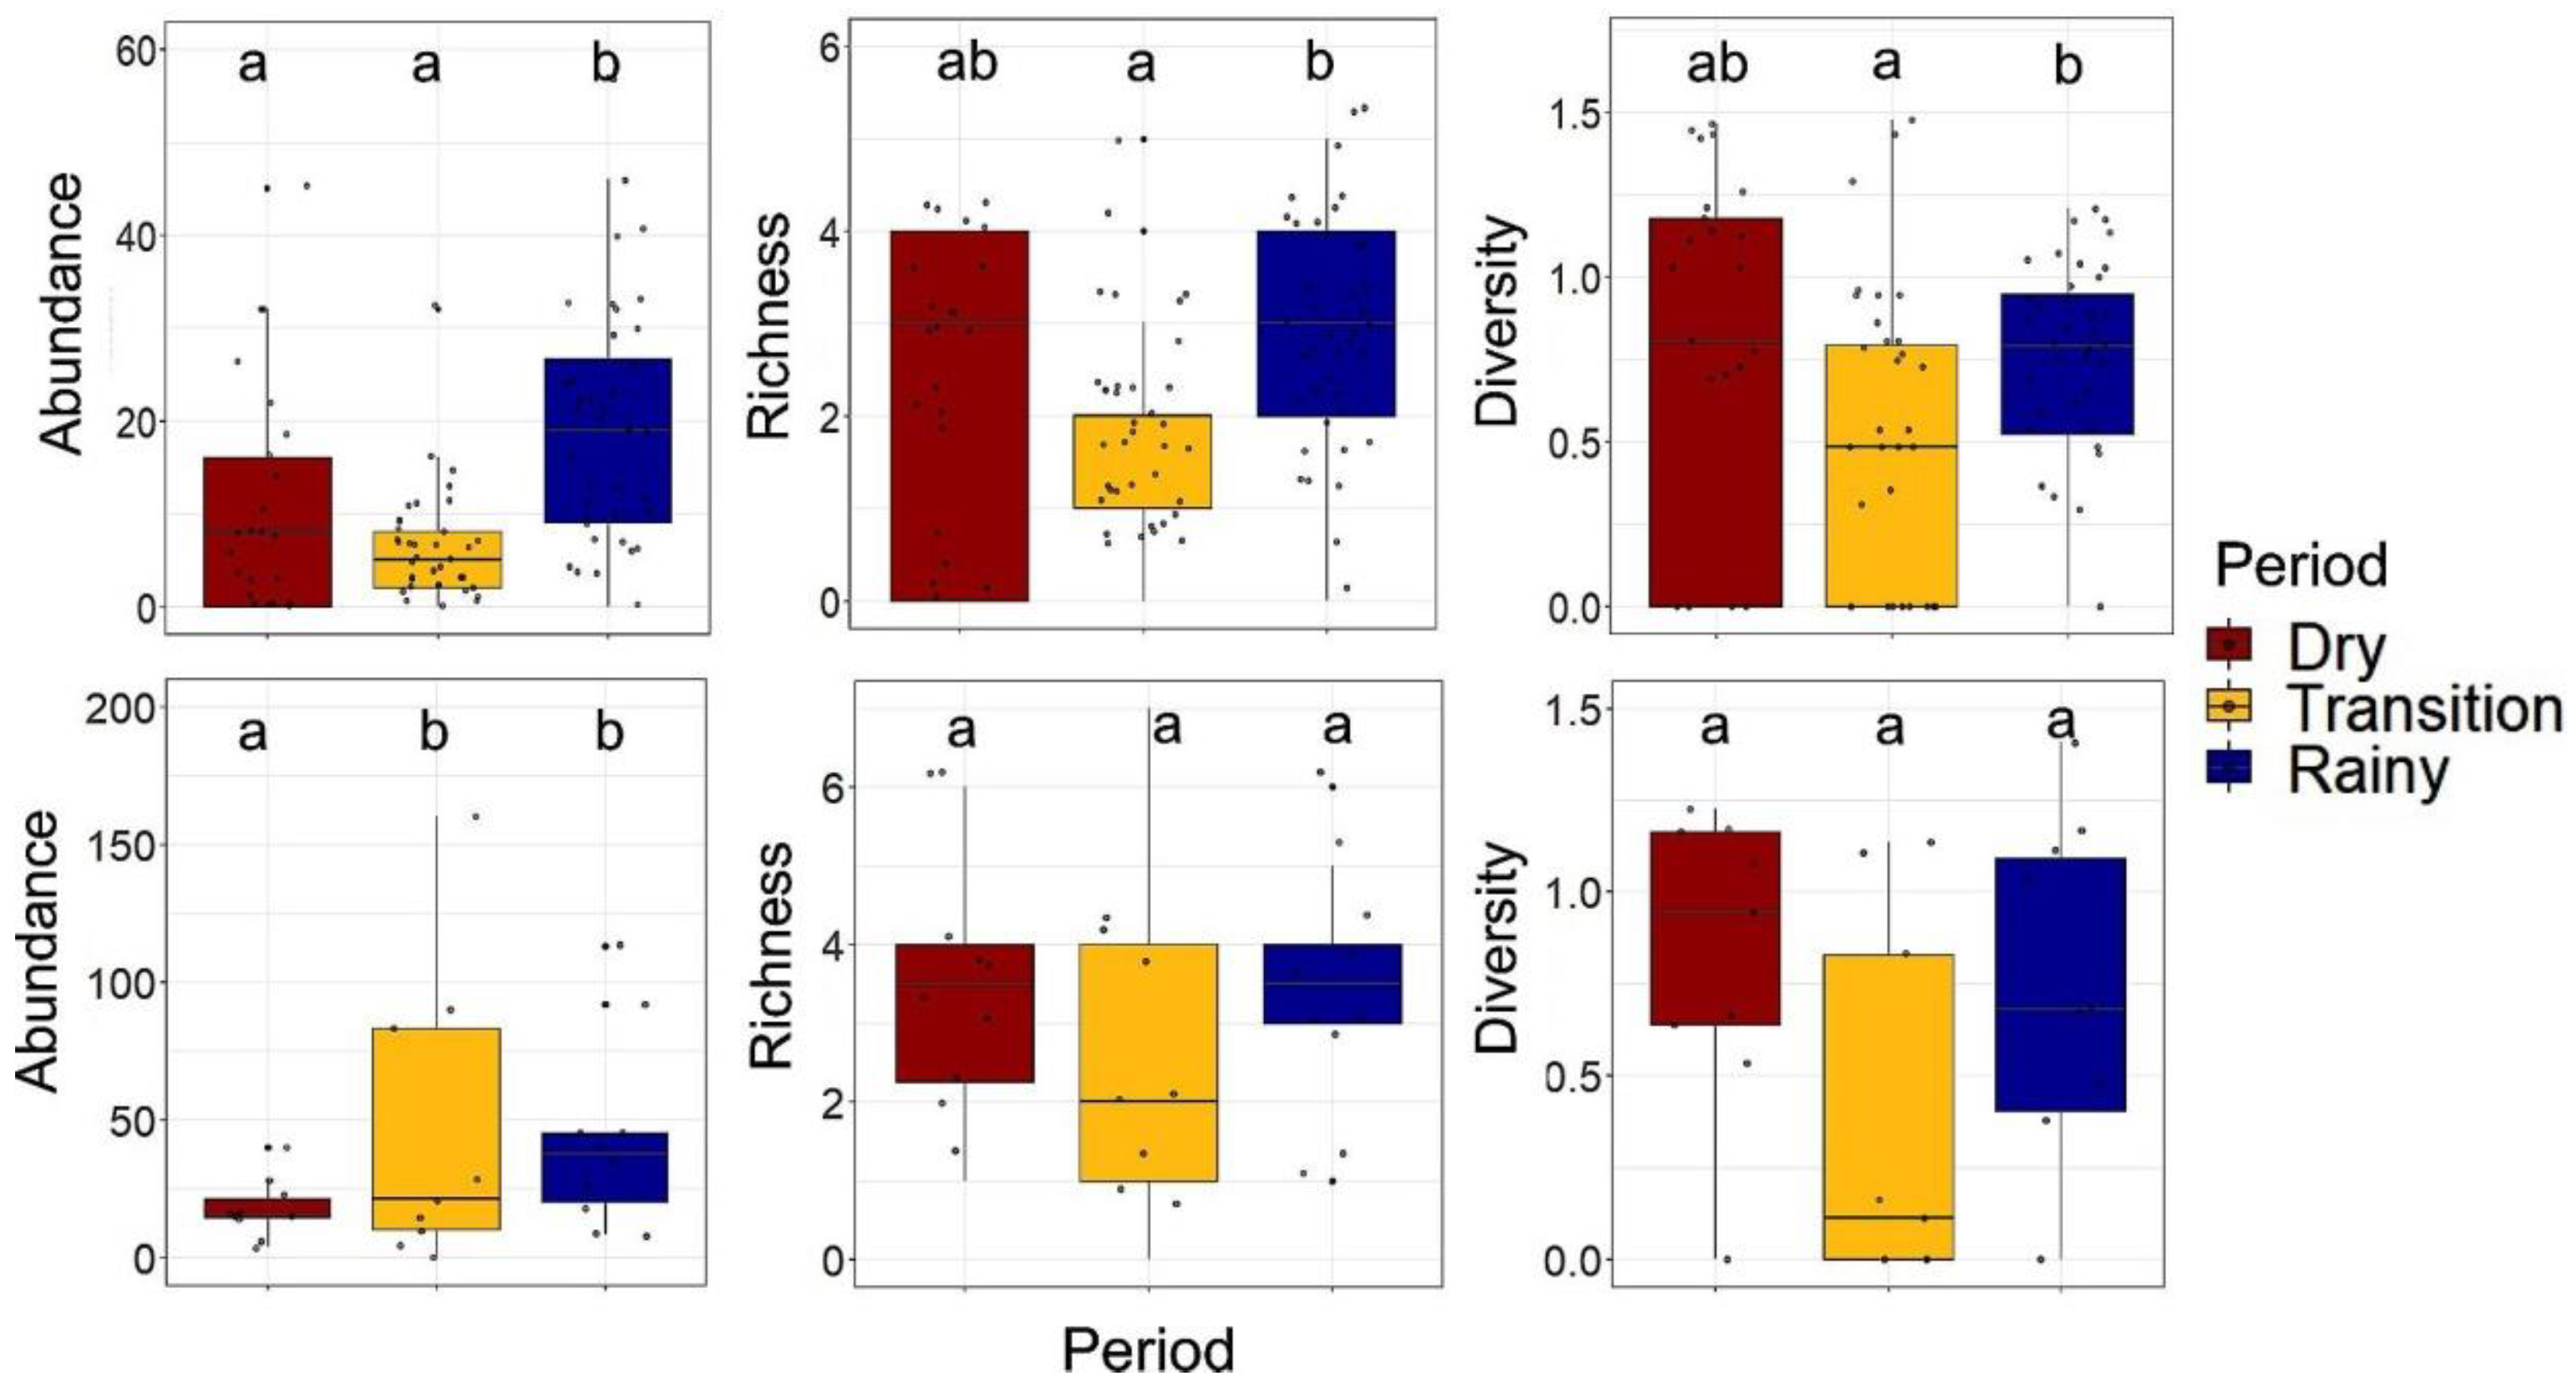
3.4. Temporal Variation in Abundance, Species Richness, and Diversity

Overall, we found lower abundance, species richness, and diversity of macrobenthos during the transition period at Nazaré Beach. At Goiabal, we only recorded significant differences in the abundance of macrobenthos, which was lower in the dry season (Table 3, Figure 4).

3.5. Beta Diversity

Beta diversity followed the same temporal pattern of habitat heterogeneity at both sites. It was higher during the dry season at Nazaré (PERMDISP: F(2, 91) = 3.74, p = 0.03; rainy = transition < dry) and during the transition season at Goiabal (PERMDISP: F(2, 26) = 5.7, p < 0.01; rainy = dry < transition) (Figure 5).
Pairwise comparisons of beta diversity among seasons within Nazaré Beach showed the largest differences between the rainy season and the dry and transition periods with most of these differences related to abundance gradients (β gra, mainly related to differences in the number of individuals). The importance of the balanced variation in abundance (β bal, mainly related to species turnover) at Nazaré was higher when the dry season was included in the comparisons, demonstrating a more distinct assemblage during this season. At Goiabal, the largest variation in macrobenthic assemblages in the intertidal zone was observed in the transition season and was mainly related to species turnover (β bal). Conversely, most of the difference in macrobenthic assemblages from Goiabal between the dry and rainy seasons was explained by abundance gradients. Differences in the macrobenthic assemblages from Nazaré and Goiabal were higher during the transition season and lower during the rainy season. Changes in macrobenthos between sites were mostly related to differences in species composition (β bal) in all seasons (Table 4).
Figure 5. β-diversity (multivariate dispersion of sampling stations on the Bray–Curtis dissimilarity in community composition) among sampling periods at Nazaré and Goiabal Beaches. The label of each period corresponds to the position of the centroid. Different colored lines and shapes correspond to different sampling periods: blue/circle = rainy; red/square = dry; yellow/triangle = transition.
Sustainability 15 05417 g005

3.6. Influence of Environmental Variables on Macrobenthic Assemblages

The environmental variables explained only 15.78% of the total variance in the distribution of the species, although the general model was significant (F(6,78) = 2.443, p < 0.001). Monthly precipitation, mean grain size, and organic matter content were significantly correlated with the species distribution. Most species were little correlated with the environmental gradients represented by axes of the ordination. The only exceptions were Nephthys fluviatilis and, to a lesser degree, Cumacea, which were positively associated with higher precipitation and finer grains and negatively associated with nitrogen content (Figure 6).

4. Discussion

The Amazon coast, a region with unique environmental characteristics and high erosion rates, remains largely overlooked in the scientific literature. In this study, we performed the first characterization of the biodiversity of Brazilian beaches northwards of the Amazon River delta, providing results that can support local conservation and management practices as well as serve as a baseline for further investigations.
Overall, we found low richness and high dominance of a few species on the beaches studied. The total number of macrobenthic species found in this study (n = 14 in the three beaches evaluated) was much lower than the values reported for macrotidal beaches located south of the Amazon River delta. For example, Rosa-Filho et al. [17] registered 43 taxa in the intertidal zone of Ajuruteua Beach on the coast of the state of Pará, south of the Amazon delta. Similarly, Santos et al. [19] recorded a total of 46 species in the intertidal area of Atalaia, Farol-Velho, and Corvina Beaches, all sites also located on the Pará coast. Given that (i) macrotidal dissipative beaches are expected to host a larger number of species and individuals among beach types [46,47] and (ii) that the study area is not subject to a high degree of anthropic influence, such as urbanization, tourism, or trace element contamination [7,28], factors often associated with decreased macrobenthic diversity [48,49,50,51], our results are unexpected and suggest this overall low diversity is not a regional but rather an intrinsic feature of local beaches. Similarly, Jourde et al. [52] found low macrobenthic diversity (H’ means ranging from 0.17 to 1.74) on mudflats of Guiana.
One explanation for the low diversity on the northernmost coast of the Amazon region is the massive freshwater discharge this area receives from the Amazon River delta. Freshwater input reduces water salinity and may significantly reduce diversity in sandy beaches [24,50,53]. Therefore, the Amazon delta may exert a filtering effect and prevent the settlement of marine species from southern sandy beaches [12,13,14]. Furthermore, the North Brazil Current (NBC), which flows northward, is likely to hinder the dispersion of organisms from northern sandy beaches (e.g., Caribbean) with higher species diversity. The comparison among the pools of species found in this study and those recorded by Rosa-Filho [17] and Santos [19] reinforces this hypothesis since typical sandy beach species, recorded in areas south of the Amazon delta and along the Brazilian coast, such as the surf clam, Donax striatus, the isopod, Excirolana braziliensis, and the polychaete, Scolelepis squamata, were absent on the study area. These species, albeit with varying degrees of tolerance to salinity fluctuations, were previously found to be negatively affected by freshwater input [23,24,54].
The influence of the Amazon River discharge as well as its tributaries that flow into the coast on the studied beaches can also be seen in the dominant species. For one, Laeonereis acuta is an euryhaline species commonly associated with low salinity beaches or estuarine environments [55,56]. The other dominant polychaete, Nephtys fluviatilis, is also usually found in low salinity areas, being common in estuaries and river mouths [56]. Indeed, this species is a dominant taxa in the benthic assemblages of estuarine systems of the Amazon [18,57]. Similarly, other dominant species on Nazaré, Goiabal, and Samaúma Beaches, such as the isopod, Sphaeromopsis mourei, and larvae of midges, Culicoides sp., are also associated with estuarine areas and freshwater environments [58,59,60].
Overall, we found a similar pool of species on the beaches studied. In fact, beta diversity analyses showed variations in macrobenthic assemblages of Goiabal and Nazaré were more related to temporal changes within each beach than to differences between beaches. As expected, we found that beta diversity of macrobenthic assemblages was strongly related to changes in habitat heterogeneity, a major determinant for ecological assemblages as it provides new niches where some species are favored over others [26,61,62]. Additionally, as expected, we found lower habitat heterogeneity and beta diversity during the rainy season, showing considerable input of freshwater during the rainy season may homogenize environmental characteristics and biological assemblages.
Besides reducing habitat heterogeneity, the considerable input of freshwater during the rainy season may decline beta diversity by increasing dispersal rates of macrobenthic communities. Higher dispersal rates associated with a higher number of individuals and species, as observed during the rainy season, may generate a mass effect in marine coastal systems and homogenize local assemblages [63,64]. Accordingly, Corte et al. [29] found the relative importance of dispersal processes on macrobenthic assemblages increased after strong rains in a tidal flat in southeast Brazil. Increased abundances of typical estuarine species, such as N. fluviatilis and S. mourei, during the rainy season may also explain reductions in beta diversity in this period, especially considering most differences were related to abundance gradients.
Temporal variations in macrobenthic distribution were also recorded in the species’ zonation patterns. This is especially true for the coleopteran, Bledius bonaeriensis, and the biting midge, Culicoides sp., which were mostly restricted to the upper areas, a common pattern for insects in beaches [65], and were absent in the rainy period. The fact that Bledius, one of the most common insects on the supralittoral of sandy beaches, was found only in Goiabal and may be a consequence of the higher erosion rate on the eastern side of beach arcs, which reduces available space at this zone. The hydrological season pattern of abundance corroborates other findings: Gandara-Martins et al. [66] and Vieira et al. [67] reported clear seasonal abundance patterns for Bledius bonaeriensis with lower abundance associated with more intense rainfall.
Regarding Culicoides, its presence across a larger area across this high-energy shore is notable since immatures usually inhabit low energy environments, such as tidal pools [68,69,70]. Most of the macrobenthic species recorded in this study are commonly found in other areas of the Brazilian coast [16,60,71]. However, the prevalence of larvae of Culicoides sp. have not been reported elsewhere along the Brazilian coast beaches, highlighting some of the singularities of this remote area with unique conditions. Jourde [52] also found high densities of larvae and adults of dipterans inhabiting the benthic environment of the Guiana coast, which may be an effect of the well-preserved vegetation of the region, a condition that favors the occurrence of dipteran taxa [69]. The limited occurrence during rainy periods was also found by Ray and Choudhury [72] for Culicoides.
Temporal variation was also seen in the relationship between environmental variables and biological assemblages. Rainfall, organic matter, and mean grain size were the variables that better explained macrobenthic assemblages distribution. However, at a species level, only N. fluviatilis was clearly related to the environmental gradient created by these variables, benefiting from the increased riverine input in rainy periods. As for organic matter, the negative relationship with N. fluviatilis may be explained by this organism being sensitive to organic enrichment disturbances [73]; however, no true opportunistic species was found in the area, which would be expected in organically enriched bottoms [74]. Thus, further studies are needed to assess the dynamics of the benthic fauna and the role of the high organic matter in the biodiversity patterns on the Amazon coast. Population studies comparing distinct areas across the ACZ may be very elucidative to understand and predict the effect of environmental changes on these species in other coastal areas.
By performing the first characterization of the biodiversity of beaches in the northernmost region of Brazil, we provided baseline information on the spatial and temporal patterns of local biodiversity. We found environmental changes related to rainfall patterns in the region are major drivers of sandy beach assemblages with higher numbers of individuals and species but lower habitat heterogeneity and beta diversity during rainy periods. Given the lack of study on the ecology of northern Amazonian beaches, we expect our results may provide an essential step to better knowing and preserving these unique ecosystems. This is especially important considering two-thirds of the Amapá coast is currently retreating due to erosion [22], one of the most pressing problems worldwide affecting coastal areas and sandy beach biodiversity [48,75,76].

Supplementary Materials

The following supporting information can be downloaded at: https://www.mdpi.com/article/10.3390/su15065417/s1, Figure S1: Schematic representation of the sampling design for macrobenthic assemblages at each beach. Random samples were taken using a 20 cm diameter core up to 25 cm deep. * the total number of sampling levels varied among beaches: 10 at Goiabal, 28 at Sumaúma, and 40 at Nazaré; Figure S2: Habitat heterogeneity (multivariate dispersion of sampling stations on the Euclidean distance in environmental composition) among sampling periods at Nazaré and Goiabal Beaches. The label of each period corresponds to the position of the centroid; Figure S3: Distribution of assemblage descriptors along the intertidal levels at Sumaúma Beach, sampled only during dry period; Figure S4: Distribution the abundance of the polychaetes, Nephtys fluviatilis and Laeonereis acuta, along the intertidal levels at Goiabal and Nazaré Beaches during the three different sampling periods (dry, rainy, transition). Shaded areas represent smoothness curves (0.75 degrees of smoothing—α), estimated using the LOESS (locally estimated scatterplot smoothing) method; Figure S5: Distribution of the abundance of the crustacean taxa, Sphaeromopsis mourei, and Cumacea along the intertidal levels at Goiabal and Nazaré Beaches during the three different sampling periods (dry, rainy, transition). Shaded areas represent smoothness curves (0.75 degrees of smoothing—α), estimated using the LOESS (locally estimated scatterplot smoothing) method; Figure S6: Distribution of the abundance of the insects taxa, Culicoides sp. and Bledius sp., along the intertidal levels at Goiabal and Nazaré Beaches during the three different sampling periods (dry, rainy, transition) Shaded areas represent smoothness curves (0.75 degrees of smoothing—α), estimated using the LOESS (locally estimated scatterplot smoothing) method.

Author Contributions

Conceptualization, M.P.; methodology, M.P. and F.M.S.; validation, M.P., F.M.S. and H.H.R.C.; formal analysis, H.H.C. and G.N.C.; investigation, M.P., F.M.S. and H.H.R.C.; resources, M.P.; writing—original draft, H.H.R.C., H.H.C. and G.N.C.; writing—review and editing, H.H.C., G.N.C. and M.P.; supervision, M.P. and F.M.S.; project administration, M.P.; funding acquisition, M.P. All authors have read and agreed to the published version of the manuscript.

Funding

This research has benefited from a scholarship to H.H.R.C., provided by CAPES (Coordination for the Improvement of Higher Education Personnel).

Institutional Review Board Statement

Not applicable.

Informed Consent Statement

Not applicable.

Data Availability Statement

We declare these data will be available upon an eventual acceptance of the article.

Acknowledgments

The authors would like to thank the support of local residents, especially “Zeca” and Elita in Goiabal and João in Samaúma; without their support this study would be impracticable. We are also grateful for the microbiology and immunology laboratory (UNIFAP) staff, Emerson A. C. Martins, Jemima C. Messiasand Diego Q. Ferreira.

Conflicts of Interest

The authors declare no conflict of interest. The funders had no role in the design of the study; in the collection, analyses, or interpretation of data; in the writing of the manuscript; or in the decision to publish the results.

References

  1. Nobre, C.A.; Sampaio, G.; Borma, L.S.; Castilla-Rubio, J.C.; Silva, J.S.; Cardoso, M. Land-use and climate change risks in the Amazon and the need of a novel sustainable development program. Proc. Natl. Acad. Sci. USA 2016, 113, 10759–10768. [Google Scholar] [CrossRef] [Green Version]
  2. Boulton, C.A.; Lenton, T.M.; Boers, N. Pronounced loss of Amazon rainforest resilience since the early 2000s. Nat. Clim. Chang. 2022, 12, 271–278. [Google Scholar] [CrossRef]
  3. Castello, L.; McGrath, D.G.; Hess, L.L.; Coe, M.T.; Lefebvre, P.A.; Petry, P.; Macedo, M.N.; Renó, V.F.; Arantes, C.C. The vulnerability of Amazon freshwater ecosystems. Conserv. Lett. 2013, 6, 217–229. [Google Scholar] [CrossRef]
  4. Heino, J.; Gronroos, M. Exploring species and site contributions to beta diversity in stream insect assemblages. Oecologia 2017, 183, 151–160. [Google Scholar] [CrossRef] [Green Version]
  5. Legendre, P.; De Cáceres, M. Beta diversity as the variance of community data: Dissimilarity coefficients and partitioning. Ecol. Lett. 2013, 16, 951–963. [Google Scholar] [CrossRef]
  6. Muehe, D. Brazilian Coast vulnerability to climate change. Pan-Am. J. Aquat. Sci. 2010, 5, 173–183. [Google Scholar]
  7. Santos, V.F.; Short, A.D.; Mendes, A.C. Beaches of the Amazon Coast: Amapá and West Pará. In Brazilian Beach Systems; Short, A.D., Klein, A.H.F., Eds.; Springer: Berlin/Heidelberg, Germany, 2016; pp. 67–93. [Google Scholar]
  8. Marinelli-Filho, J.E.; Monteiro, R.C.P. Widespread microplastics distribution at an Amazon macrotidal sandy beach. Mar. Pollut. Bull. 2019, 145, 219–223. [Google Scholar] [CrossRef]
  9. Myneni, R.B.; Yang, W.; Nemani, R.R.; Huete, A.R.; Dickinson, R.E.; Knyazikhin, Y.; Didan, K.; Fu, R.; Juárez, R.I.N.; Saatchi, S.S.; et al. Large seasonal swings in leaf area of Amazon rainforests. Proc. Natl. Acad. Sci. USA 2007, 104, 4820–4823. [Google Scholar] [CrossRef] [PubMed] [Green Version]
  10. Sousa, R.C.; Pereira, L.C.C.; Costa, R.M.; Jiménez, J.A. Management of estuarine beaches on the Amazon coast through the application of recreational carrying capacity indices. Tour. Manag. 2017, 59, 216–225. [Google Scholar] [CrossRef] [Green Version]
  11. Baia, R.; Rollnic, M.; Venekey, V. Seasonality of pluviosity and saline intrusion drive meiofauna and nematodes on an Amazon freshwater-oligohaline beach. J. Sea Res. 2021, 170, 102022. [Google Scholar] [CrossRef]
  12. Nunes, F.L.D.; Norris, R.D.; Knowlton, N. Long distance dispersal and connectivity in amphi-Atlantic corals at regional and basin scales. PLoS ONE 2011, 6, e22289. [Google Scholar] [CrossRef] [Green Version]
  13. Barroso, C.X.; Lotufo, T.M.; Matthews-Cascon, H. Biogeography of Brazilian prosobranch gastropods and their Atlantic relationships. J. Biogeogr. 2016, 43, 2477–2488. [Google Scholar] [CrossRef]
  14. Tosetto, E.G.; Bertrand, A.; Neumann-Leitão, S.; Nogueira Júnior, M. The Amazon river plume, a barrier to animal dispersal in the Western Tropical Atlantic. Sci. Rep. 2022, 12, 523. [Google Scholar]
  15. Amaral, A.C.Z.; Jablonski, S. Conservation of marine and coastal biodiversity in Brazil. Conserv. Biol. 2005, 19, 625–631. [Google Scholar] [CrossRef]
  16. Amaral, A.C.Z.; Corte, G.N.; Rosa Filho, J.S.; Denadai, M.R.; Colling, L.A.; Borzone, C.A.; Omena, E.P.; Zalmon, I.R.; Rocha-Barreira, C.A.; Rosa, L.C.; et al. Brazilian sandy beaches: Characteristics, ecosystem services, impacts, knowledge and priorities. Braz. J. Oceanogr. 2016, 64, 5–16. [Google Scholar] [CrossRef] [Green Version]
  17. Rosa-Filho, J.S.; Almeida, M.F.; Aviz, D.E. Spatial and temporal changes in the benthic fauna of a macrotidal Amazon sandy beach, Ajuruteua, Brazil. J. Coast. Res. 2009, 56, 1796. [Google Scholar]
  18. Rosa-Filho, J.S.; Gomes, T.P.; Almeida, M.F.; Silva, R.F. Benthic fauna of macrotidal sandy beaches along a small-scale morphodynamic gradient on the Amazon coast (Algodoal Island, Brazil). J. Coast. Res. 2012, 64, 435–439. [Google Scholar]
  19. Santos, T.M.T.; Almeida, M.F.; Aviz, D.; Rosa-Filho, J.S. Patterns of spatial and temporal distribution of the macrobenthic fauna on an estuarine macrotidal sandy beach on the Amazon coast (Brazil). Mar. Ecol. 2021, 42, e12675. [Google Scholar] [CrossRef]
  20. Muller-Karger, F.E.; McClain, C.R.; Richardson, P.L. The dispersal of the Amazon River. Nature 1988, 333, 56–59. [Google Scholar] [CrossRef]
  21. Bernardino, A.; Mazzuco, A.C.; Souza, F.M.; Santos, T.M.T.; Sanders, C.J.; Massone, C.G.; Costa, R.F.; Silva, A.E.B.; Ferreira, T.O.; Nóbrega, G.N.; et al. The novel mangrove environment and composition of Amazon Delta. Curr. Biol. 2022, 32, 3636–3640. [Google Scholar] [CrossRef]
  22. BRASIL. Panorama da Erosão Costeira no Brasil; Ministério do Meio Ambiente: Brasília, Brazil, 2018.
  23. Lercari, D.; Defeo, O.; Celentano, E. Consequences of a freshwater canal discharge on the benthic community and its habitat on an exposed sandy beach. Mar. Pollut. Bull. 2002, 44, 1397–1404. [Google Scholar] [CrossRef]
  24. Laurino, I.A.; Turra, A. The threat of freshwater input on sandy beaches: A small-scale approach to assess macrofaunal changes related to salinity reduction. Mar. Environ. Res. 2021, 171, 105459. [Google Scholar] [CrossRef]
  25. Thomaz, S.M.; Bini, L.M.; Bozelli, R.L. Floods increase similarity among aquatic habitats in river-floodplain systems. Hydrobiologia 2006, 579, 1–13. [Google Scholar] [CrossRef]
  26. Corte, G.N.; Schlacher, T.A.; Checon, H.H.; Barboza, C.A.M.; Siegle, E.; Coleman, R.A.; Amaral, A.C.Z. Storm effects on intertidal invertebrates: Increased beta diversity of few individuals and species. PeerJ 2017, 5, e3360. [Google Scholar] [CrossRef] [Green Version]
  27. Lansac-Tôha, F.M.; Heino, J.; Bini, L.M.; Peláez, O.; Baumgartner, M.T.; Quirino, B.A.; Pineda, A.; Meira, B.R.; Florêncio, F.M.; Oliveira, F.R.; et al. Cross-Taxon Congruence of Taxonomic and Functional Beta-Diversity Facets Across Spatial and Temporal Scales. Front. Environ. Sci. 2022, 10, 903074. [Google Scholar] [CrossRef]
  28. Vilhena, J.C.E.; Amorim, A.; Ribeiro, L.; Duarte, B.; Pombo, M. Baseline study of trace metal contaminations in the sediment of the intertidal zone of Amazonian Oceanic Beaches. Front. Mar. Sci. 2021, 8, 671390. [Google Scholar] [CrossRef]
  29. Corte, G.N.; Gonçalves-Souza, T.; Checon, H.H.; Siegle, E.; Coleman, R.A.; Amaral, A.C.Z. When time affects space: Dispersal ability and extreme weather events determine metacommunity organization in marine sediments. Mar. Environ. Res. 2018, 136, 139–152. [Google Scholar] [CrossRef]
  30. Folk, R.L.; Ward, W.C. Brazos River Bar: A study in the significance of grain size parameters. J. Sediment. Petrol. 1957, 27, 3–26. [Google Scholar] [CrossRef]
  31. Nelson, D.W.; Sommers, L.E. Total carbon, organic carbon, and organic matter. In Methods of Soil Analysis—Chemical and Microbiological Properties; Page, A.L., Miller, R.H., Keeney, D.R., Eds.; American Society of Agronomy e Soil Science Society of America, cap. 29: Madison, WI, USA, 1982; pp. 539–579. [Google Scholar]
  32. Kjeldahl, J. A new method for the determination of nitrogen in organic matter. Z. Anal. Chem. 1883, 22, 366–382. [Google Scholar] [CrossRef] [Green Version]
  33. Mehlich, A. Determination of P, Ca, Mg, K, Na and NH4; Soil Test Division, Department of Agriculture: Raleigh, NC, USA, 1953.
  34. O’Hara, R.B.; Kotze, D.J. Do not log-transform data count. Methods Ecol. Evol. 2010, 1, 118–122. [Google Scholar] [CrossRef] [Green Version]
  35. Morisita, M. Iσ-Index, a measure of dispersion of individuals. Pop. Ecol. 1962, 4, 1–7. [Google Scholar] [CrossRef]
  36. Smith-Gill, S.J. Cytophysiological basis of disruptive pigmentary patterns in the leopard frog Rana pipiens. J. Morphol. 1975, 146, 35–54. [Google Scholar] [CrossRef]
  37. Anderson, M.J.; Ellingsen, K.E.; McArdle, B.H. Multivariate dispersion as a measure of beta diversity. Ecol. Lett. 2016, 9, 683–693. [Google Scholar] [CrossRef] [PubMed]
  38. Baselga, A. Partitioning abundance-based multiple-site dissimilarity into components: Balanced variation in abundance and abundance gradients. Methods Ecol. Evol. 2017, 8, 799–808. [Google Scholar] [CrossRef] [Green Version]
  39. Legendre, P.; Gallagher, E.D. Ecologically meaningful transformations for ordination of species data. Oecologia 2001, 129, 271–280. [Google Scholar] [CrossRef] [PubMed]
  40. R Core Team. R—A Language and Environment for Statistical Computing; R Foundation for Statistical Computing: Vienna, Austria, 2021. [Google Scholar]
  41. Oksanen, J.; Blanchet, F.G.; Friendly, M.; Kindt, R.; Legendre, P.; McGlinn, D.; Minchin, P.R.; O’Hara, R.B.; Simpson, G.L.; Solymos, P.; et al. Vegan: Community Ecology Package. 2020. Available online: https://CRAN.R-project.org/package=vegan (accessed on 4 March 2022).
  42. Venables, W.N.; Ripley, B.D. Modern Applied Statistics with S, 4th ed.; Springer: New York, NY, USA, 2002. [Google Scholar]
  43. Lenth, R.V. Emmeans: Estimated Marginal Means, Aka Least-Squares Means. 2022. Available online: https://CRAN.R-project.org/package=emmeans (accessed on 4 March 2022).
  44. Baselga, A.; Orme, C.D.L. betapart: An R package for the study of beta diversity. Methods Ecol. Evol. 2012, 3, 808–812. [Google Scholar] [CrossRef]
  45. Wickham, H. ggplot2: Elegant Graphics for Data Analysis; Springer Verlag: New York, NY, USA, 2016. [Google Scholar]
  46. Defeo, O.; McLachlan, A. Patterns, processes and regulatory mechanisms in sandy beach macrofauna: A multi-scale analysis. Mar. Ecol. Prog. Ser. 2005, 295, 1–20. [Google Scholar] [CrossRef] [Green Version]
  47. Barboza, F.R.; Defeo, O. Global diversity patterns in sandy beach macrofauna: A biogeographical analysis. Sci. Rep. 2015, 5, 14515. [Google Scholar] [CrossRef] [Green Version]
  48. Defeo, O.; McLachlan, A.; Schoeman, D.S.; Schlacher, T.A.; Dugan, J.; Jones, A.; Lastra, M.; Scapini, F. Threats to sandy beach ecosystems: A review. Estuar. Coast. Shelf Sci. 2009, 81, 1–12. [Google Scholar] [CrossRef]
  49. Kowalewski, M.; Domènech, R.; Martinelli, J. Vanishing Clams on an Iberian Beach: Local Consequences and Global Implications of Accelerating Loss of Shells to Tourism. PLoS ONE 2014, 9, e83615. [Google Scholar] [CrossRef] [Green Version]
  50. Orlando, L.; Ortega, L.; Defeo, O. Urbanization effects on sandy beach macrofauna along an estuarine gradient. Ecol. Indic. 2020, 111, 106036. [Google Scholar] [CrossRef]
  51. Corte, G.N.; Checon, H.H.; Shah Esmaeili, Y.; Defeo, O.; Turra, A. Evaluation of the effects of urbanization and environmental features on sandy beach macrobenthos highlights the importance of submerged zones. Mar. Pollut. Bull. 2022, 182, 113962. [Google Scholar] [CrossRef]
  52. Jourde, J.; Dupuy, C.; Nguyen, H.T.; Mizrahi, D.; de Pracontal, N.; Bocher, P. Low benthic macrofauna diversity in dynamic, tropical tidal mudflats: Migrating banks on Guiana’s Coast, South America. Estuaries Coast. 2017, 40, 1159–1170. [Google Scholar] [CrossRef]
  53. Jorge-Romero, G.; Lercari, D.; Ortega, L.; Defeo, O. Long-term ecological footprints of a man-made freshwater discharge onto a sandy beach ecosystem. Ecol. Indic. 2019, 96, 412–420. [Google Scholar] [CrossRef]
  54. Medeiros, E.L.; Fernandes, G.V.; Henry-Silva, G.G. Distribution and density of the mollusk Donax striatus (Linnaeus, 1767) in a tropical estuarine region in the Brazilian semi-arid. Braz. J. Biol. 2015, 75, 914–922. [Google Scholar] [CrossRef] [Green Version]
  55. Checon, H.H.; Vieira, D.C.; Corte, G.N.; Sousa, E.C.P.M.; Fonseca, G.; Amaral, A.C.Z. Defining soft bottom habitats and potential indicator species as tools for monitoring coastal systems: A case study in a subtropical bay. Ocean Coast. Manag. 2018, 164, 68–78. [Google Scholar] [CrossRef]
  56. Mucciolo, S.; Desiderato, A.; Leal, S.M.; Mastrodonato, M.; Lana, P.C.; Freire, C.A. Variability in the degree of euryhalinity of neotropical estuarine annelids. J. Exp. Mar. Biol. Ecol. 2021, 544, 151617. [Google Scholar] [CrossRef]
  57. Rosa-Filho, J.S.; Aviz, D. Macrobenthic communities of an Amazonian estuary (Guajará Bay, Brazil): Temporal and spatial changes. J. Coast. Res. 2013, 65, 123–128. [Google Scholar] [CrossRef]
  58. Holdrich, D.M.; Harrison, K. The sphaeromatid isopod genus Sphaeromopsis Holdrich & Jones in African, Australian and South American waters. Crustaceana 1981, 41, 286–300. [Google Scholar]
  59. Flynn, M.N.; Wakabara, Y.; Tararam, A.S. Macrobenthic associations of the lower and upper marshes of a tidal flat colonized by Spartina alterniflora in Cananeia Lagoon Estuarine Region (Southeastern Brazil). Bull. Mar. Sci. 1998, 63, 427–442. [Google Scholar]
  60. Lana, P.C.; Christofoletti, R.; Gusmão, J.B., Jr.; Barros, T.L.; Spier, D.; Costa, T.M.; Soares-Gomes, A.; Santos, C.S.G. Benthic Estuarine Assemblages of the Southeastern Brazil Marine Ecoregion (SBME). In Brazilian Estuaries; Lana, P.C., Bernardino, A., Eds.; Springer: Cham, Switzerland, 2018. [Google Scholar]
  61. Thrush, S.F.; Hewitt, J.E.; Cummings, V.J.; Norkko, A.; Chiantore, M. β-Diversity and Species Accumulation in Antarctic Coastal Benthos: Influence of Habitat, Distance and Productivity on Ecological Connectivity. PLoS ONE 2010, 5, e11899. [Google Scholar] [CrossRef] [PubMed]
  62. Astorga, A.; Death, R.; Death, F.; Paavola, R.; Chakraborty, M.; Muotka, T. Habitat heterogeneity drives the geographical distribution of beta diversity: The case of New Zealand stream invertebrates. Ecol. Evol. 2014, 4, 2693–2702. [Google Scholar] [CrossRef]
  63. Moritz, C.; Meynard, C.N.; Devictor, V.; Guizien, K.; Labrune, C.; Guarini, J.-M.; Mouquet, N. Disentangling the role of connectivity, environmental filtering, and spatial structure on metacommunity dynamics. Oikos 2013, 122, 1401–1410. [Google Scholar] [CrossRef]
  64. Heino, J.; Melo, A.S.; Siqueira, T.; Soininen, J.; Valanko, S.; Bini, L.M. Metacommunity organisation, spatial extent and dispersal in aquatic systems: Patterns, processes and prospects. Freshw. Biol. 2015, 60, 845–869. [Google Scholar] [CrossRef]
  65. McLachlan, A.; Defeo, O. The Ecology of Sandy Beaches; Academic Press: Waltham, MA, USA; Elsevier: Waltham, MA, USA, 2017. [Google Scholar]
  66. Gandara-Martins, A.L.; Borzone, C.A.; Rosa, L.C.; Caron, E. Ocorrência de três espécies do gênero Bledius (Coleoptera, Staphylinidae, Oxytelinae) nas praias arenosas expostas do Paraná, Brasil. Braz. J. Aquat. Sci. Technol. 2010, 14, 23–30. [Google Scholar] [CrossRef]
  67. Vieira, J.V.; Borzone, C.A.; Lorenzi, L.; Carvalho, F.G. Human impact on the benthic macrofauna of two beach environments with different morphodynamic characteristics in Southern Brazil. Braz. J. Oceanogr. 2012, 60, 135–148. [Google Scholar] [CrossRef] [Green Version]
  68. Linley, J.R.; Evans, H.T.; Evans, F.D.S. A qualitative study of autogeny in a naturally occurring population of Culicoides furens (Diptera: Ceratopogonnidae). J. Anim. Ecol. 1970, 39, 169–183. [Google Scholar] [CrossRef]
  69. Hagan, C.E.; Kettle, D.S. Habitats of Culicoides spp. in an intertidal zone of southeast Queensland, Australia. Med. Vet. Entomol. 1990, 4, 105–115. [Google Scholar] [CrossRef]
  70. Brei, B.; Cribb, B.W.; Merritt, D.J. Effects of seawater components on immature Culicoides molestus (Skuse) (Diptera: Ceratopogonidae). Aust. J. Entomol. 2003, 42, 119–123. [Google Scholar] [CrossRef]
  71. Cardoso, R.S.; Mattos, G.; Caetano, C.H.S.; Cabrini, T.M.B.; Galhardo, L.B.; Meireis, F. Effects of environmental gradients on sandy beach macrofauna of a semi-enclosed bay. Mar. Ecol. 2012, 33, 106–116. [Google Scholar] [CrossRef]
  72. Ray, S.; Choudhury, A. Population Ecology of Culicoides peliliouensis Tok. in the Hooghly Estuary, Sagar Island, India. Int. J. Trop. Insect Sci. 1988, 9, 17–25. [Google Scholar] [CrossRef]
  73. Pagliosa, P.R.; Barboza, F.A.R. Assessing the environment-benthic fauna coupling in protected and urban areas of southern Brazil. Biol. Conserv. 2006, 129, 408–417. [Google Scholar] [CrossRef]
  74. Pearson, T.H.; Rosenberg, R. Macrobenthic succession in relation to organic enrichment and pollution in the benthic environment. Oceanogr. Mar. Biol. Ann. Rev. 1976, 16, 229–311. [Google Scholar]
  75. Schooler, N.K.; Dugan, J.E.; Hubbard, D.M.; Straughan, D. Local scale processes drive long-term change in biodiversity of sandy beach ecosystems. Ecol. Evol. 2017, 7, 4822–4834. [Google Scholar] [CrossRef] [PubMed]
  76. Luijendijk, A.; Hagenaars, G.; Ranasinghe, R.; Baart, F.; Donchtys, G.; Aarninkhof, S. The state of the world’s beaches. Sci. Rep. 2018, 8, 6641. [Google Scholar] [CrossRef] [PubMed]
Figure 3. Distribution of assemblage descriptors (abundance and species richness) along the intertidal levels at Goiabal and Nazaré Beaches during the three different period (dry, rainy, transition). Shaded areas represent smoothness curves (0.75 degrees of smoothing—α), estimated using the LOESS (locally estimated scatterplot smoothing) method.
Sustainability 15 05417 g003
Figure 4. Boxplots for the data distribution of community descriptors for Nazaré (upper panel) and Goiabal (lower panel) Beaches. Different letters (a, b) above the boxes indicate statistical differences in pairwise comparisons among periods.
Sustainability 15 05417 g004
Figure 6. Multivariate relationships between species and environmental variables across Goiabal and Nazaré Beaches. Yellow points represent sampling sites, and red points/labels represent species. Environmental variables coded as: OM = organic matter, P = phosphorus; N = nitrogen, sorting = sorting coefficient; MGS = mean grain size; prec. = monthly precipitation. Species coded as (only non-overlapping ones): sp. 3 = Capitellidae; sp. 4 = Culicoides sp.; sp. 5 = Cumacea; sp. 6 = Sphaeromopis mourei; sp. 8 = Laeonereis acuta; sp. 10 = Nepythys fluviatilis.
Sustainability 15 05417 g006
Table 1. Mean (±SD) of the environmental variables sampled at Nazaré and Goiabal beaches during each sampling period.
VariablesGoiabalNazaré
DryTransitionRainyDryTransitionRainy
Precipitation (mm)207020050120400
Mean grain size (phi)3.19 ± 0.12.72 ± 0.3-2.9 ± 0.43.29 ± 0.13.23 ± 0.2
Sorting (phi)1.3 ± 0.11.29 ± 0.1-1.26 ± 0.11.31 ± 0.11.31 ± 0.1
Organic matter (%)5.35 ± 0.75.08 ± 0.6-9.75 ± 2.37.15 ± 0.45.13 ± 0.7
Nitrogen (%)0.13 ± 0.10.11 ± 0.1-0.07 ± 0.10.1 ± 0.10.09 ± 0.1
Phosphorus (mg/cm³)38.3 ± 5.248.2 ± 9.0-52.3 ± 8.070.3 ± 10.240.5 ± 13.5
Table 2. Standardized Morisita dispersion index (I) calculated for the most representative taxa. Values range from −1 (uniform distribution) to 1 (aggregated distribution), with values close to 0 indicating random distribution. (*) indicates statistical significance.
TaxaGoiabalNazaréSamaúma
DryTransitionRainyDryTransitionRainy
Bledius sp.-1.000 *----1.000 *
Culicoides sp.0.826 *0.884 *1.000 *----
Cumacea−0.079-0.656 *0.569 *−0.0320.512 *0.835 *
Laeonereis acuta−0.2380.712 *0.708 *0.899 *1.000 *-1.000 *
Nephtys fluviatis0.511 *0.618 *0.509 *0.524 *0.5040.505 *0.508 *
Sphaeromopsis mourei0.549 *0.534 *0.674 *0.530 *0.4140.527 *0.513 *
Table 3. Results from the generalized linear models (GLM) for the differences in abundance (quasi-Poisson adjusted model), richness (Poisson distribution model), and diversity (normal distribution model) among the sampling periods.
GoiabalNazaré
d.f.Deviancep-Valued.f.Deviancep-Value
Abundance
Period29.7670.008226.991<0.001
Residual2744.213 103122.82
Richness
Period21.5870.452210.6270.005
Residual27 103142.18
Diversity (H’)
Period 21.6180.21724.6910.011
Residual27 103
Table 4. B-diversity and β-diversity partitioning among sampling periods within each site and between sites within each period. Higher values of β-diversity denote greater differences in the species composition and number of individuals between seasons or sites. Percentages indicate the variation between periods attributable to differences related to abundance gradients (β gra) or balanced variation in abundance (β bal). Names in bold highlight the sites used in each analysis.
β Brayβ Balβ Gra
Nazaré
Dry vs. Trans0.4198%2%
Dry vs. Rainy0.6341%59%
Trans vs. Rainy0.5725%75%
Goiabal
Dry vs. Trans0.8267%33%
Dry vs. Rainy0.4615%85%
Trans vs. Rainy0.8493%7%
Nazaré vs. Goiabal
Dry0.463%37%
Transition0.8280%20%
Rainy0.4957%43%
Disclaimer/Publisher’s Note: The statements, opinions and data contained in all publications are solely those of the individual author(s) and contributor(s) and not of MDPI and/or the editor(s). MDPI and/or the editor(s) disclaim responsibility for any injury to people or property resulting from any ideas, methods, instructions or products referred to in the content.

