Abstract
Accurate forecasting of the power structure and sales volume of the automobile industry is crucial for corporate decision making and national planning. Based on the auto sales data from 2011 to 2022 compiled from the official website of the China Association of Automobile Manufacturers (CAAM), the total auto sales in China from 2023 to 2030 were firstly predicted using a combined GM (1,1), and quadratic exponential smoothing forecast model optimized by particle swarm algorithm. Subsequently, the vehicles were classified into the following four categories by power: traditional fuel vehicles, pure electric vehicles, plug-in hybrid vehicles, and hydrogen fuel cell vehicles. Then, based on vehicle sales data from 2015 to 2022, The Markovian model and the component data model based on hyperspherical transformation are used to predict the vehicle power structure from 2023 to 2030 under the natural evolution scenario and the consumer purchase intention dominant scenario, respectively. The results show that total vehicle sales in China are expected to reach 32.529 million units by 2030. Under the natural evolution scenario and the consumer purchase intention dominant scenario, China will achieve the planned target of 40% of the new car market in the sales of new energy vehicles in 2028 and 2026, respectively. By 2030, under the natural evolution scenario, the sales volume of traditional fuel vehicles in the new car market will be 54.83%, the proportion of pure electric vehicles will be 35.92%, the proportion of plug-in hybrid vehicles will be 9.23%, and the proportion of hydrogen fuel cell vehicles will be 0.02%. Under the consumer purchase intention dominant scenario, the proportions of the four power types are 36.51%, 48.11%, 15.28%, and 0.10%, respectively.
1. Introduction
1.1. Background and Motivation
In 2021, the total output value of China’s automobile industry exceeds 10 trillion, accounting for nearly 10% of the country’s total GDP. The 1994 version of the “Industrial Policy of the Automobile Industry” first made it clear that the automobile industry is a pillar industry of China’s national economy. In 2021, China’s total automobile production reaches 26.082 million units, and exports exceed 2 million units for the first time, reaching 2.015 million units, becoming the third largest exporter of automobiles in the world after Japan and Germany. Germany is the third largest auto exporter in the world. The robust development of the auto industry is not only a manifestation of economic growth but also an important driving force for economic growth, industrial optimization. As well as the development [1,2,3].
As a technology-driven emerging strategic industry, the new energy vehicle industry is the main direction for the future transformation, upgrading, and sustainable development of the automotive industry [4,5]. In 2020, the State Council issued the New Energy Vehicle Industry Development Plan (2021–2035), pointing out that the development of new energy vehicles is a necessary path for China to move from a large automotive country to a strong automotive country, and is also a strategic initiative to address climate change and promote green development. In 2001, China’s National High Technology Research and Development Plan, for the first time, clarified the layout of hybrid vehicles, pure electric vehicles, and fuel cells [6]. In 2017, the Medium and Long-term Development Plan for the Automotive Industry pointed out the general goal of striving to move into the ranks of automotive power after 10 years of effort. In 2021, the State Council issued the “Carbon Peak Action Plan by 2030” to vigorously promote new energy vehicles and gradually reduce the proportion of traditional fuel vehicles in new car production and sales and car ownership. This shows that the vehicle industry is facing a big change, entering the era of multiple power of traditional energy vehicles and various new energy vehicles co-existing.
Accurate prediction of the share and sales trend of each power type in the current market can provide an important reference for enterprises to make production decisions and also provide a basis for the government to formulate and adjust industrial development plans, thus ensuring the sustainable development of the auto industry [7,8], It can also provide a basis for the government to formulate and adjust the industrial development plan, thus ensuring the sustainable development of the automotive industry, which is of great significance for the optimization and adjustment of the power structure of the automotive industry as well as the smooth realization of the transformation and upgrading goals.
1.2. Literature Review
Prediction methods mainly include statistical methods and machine learning methods. There have been many studies that have applied these forecasting methods to forecasting related products in the automotive industry.
Regarding the forecast of energy demand for vehicles, Piotrowski, et al. [9] forecast the daily load curves of the power system in winter and summer of the Polish power system from 2019 to 2025 in three variants based on three variants of the predicted number of electric vehicles and the predicted relative daily load curves. The results indicate that electricity energy demand from e-mobility will increase by less than 1% by 2025. Mao, et al. [10] used the fuzzy clustering method and an adaptive optimization algorithm to predict the energy demand of new energy vehicles and achieved good results.
Regarding the forecasts of components in the automotive industry, Akbar, et al. [11] combined big data, artificial intelligence, and Internet of Things technologies to predict the health of electric vehicle batteries. Gibson, et al. [12] showed that the current expected progress in electric vehicle battery performance will not be sufficient to meet the US Department of Energy’s expected targets for the range that electric vehicles can travel before running out of power, so a new battery technology must be developed. The results of Sato and Nakata [13] show that the number of scrapped electric vehicle batteries (EVBs) will increase by 55 times from 2018 to 2050.
Regarding advanced driver assistance systems (ADAS) prediction research, accurate vehicle acceleration prediction methods can promote the development of advanced driver assistance systems and effectively improve traffic safety [14]. In order to predict the vehicle state, Liu, et al. [15] created a fast and reliable decision tree applicable to all road segments and proposed a new method for vehicle state prediction based on this decision tree. Tang, et al. [16] proposed an advanced prediction method based on multi-LSTM (long short-term memory) to effectively predict lane change intentions.
Regarding the forecast of the overall automotive market. Wu, et al. [1] predicted car ownership in each province of China based on the Gompertz model, and the results showed that with the increase in demand in underdeveloped provinces, car ownership in each province of the country will be balanced in the future. Hsieh, et al. [17] used a Monte Carlo approach based on historical data to forecast the Chinese automobile market, showing that trade-in purchases will become the dominant approach in the sales market starting in 2025. Lian, et al. [18], based on a signed regression, indicated that Chinese passenger car ownership has the potential to grow beyond 2060 in the Japanese and Australian models; it will grow until about 2057 in the US model. Some studies combine Internet data to predict the number of cars. Pai and Liu [19] showed that mixed data, including social media and stock market value sentiment analysis, can improve the accuracy of car sales forecasting. Ou-Yang, et al. [20] showed that online sentiment data and CNN-LSTM models can significantly improve the prediction of new performance for car sales trends in Taiwan. The promotion of new energy vehicles as an important step in the low-carbon transportation transition to reduce carbon intensity [21] has also received wide attention in its prediction. Pei and Li [22], based on data grouping approach-based nonlinear grey Bernoulli model, indicated that the quarterly sales of new energy vehicles in China will exceed the 13th Five-Year Plan target in 2020. As a representative of new energy vehicles, electric vehicles are seen by many countries as an effective way to reduce air pollution from road vehicles and to reduce dependence on fossil fuels. Zhang, et al. [23] used univariate time series forecasting models and multivariate world series forecasting models to forecast electric vehicle sales in China, pointing out that pure electric and plug-in hybrid vehicles have positive prospects in China in the future. Wang, et al. [24] used a principal component analysis PCA-logistic regression model to predict conventional vehicle demand, and the results indicated that by 2050, the electric vehicle stock would reach 384.4 million, 360.3 million, and 336.3 million under the aggressive, reference, and negative scenarios, respectively. Wu and W, based on a combined PCA-GRNN approach, indicate that the next eight years will see continued growth in electric vehicle sales, both globally and in China, with a slowdown in growth rates [25]. Rietmann, et al. [26] used a logistic growth model to make long-term forecasts of electric vehicle inventories in 26 countries and showed that 32% of global passenger cars will be electric in 2032. Bitencourt, et al. [27] considered the impact of public policy on electric vehicle sales and showed that the price of electric vehicles significantly affects the diffusion of electric vehicles. Guo, et al. [28] divided the passenger car market into four categories by power type and considered the competition between conventional energy vehicles and new energy vehicles as a competition of populations and used the Lotka–Volterra model to forecast passenger car sales, stating that the share of new energy vehicle passenger cars is expected to exceed that of conventional passenger cars in 2040.
There are many methods and studies about the forecasting of each segmented car category; however, there are still some shortcomings: most of the existing studies only forecast the number of cars of a single power type, and fewer studies focus on the changes of the development trend of the sales structure of the car market after the division by power type. To address the above shortcomings, this paper first uses a combined forecasting model to forecast total vehicle sales and then uses the Markov model and linear programming model to forecast vehicle power structure to obtain the sales of four power types of vehicles under different scenarios.
1.3. Contribution and Organization
Compared with existing studies, the innovations and contributions of this paper are reflected in the following two aspects:
Firstly, this paper uses a model combining gray forecasting and quadratic exponential smoothing forecasting to forecast total vehicle sales through the improvement of the particle swarm algorithm, which is more accurate than most of the literature compared with the traditional gray forecasting and quadratic exponential smoothing forecasting models.
Secondly, the automotive market is divided into four categories by power type: traditional fuel vehicles, pure electric vehicles, plug-in hybrid vehicles, and hydrogen fuel cell vehicles, and the evolution of the power structure of the automotive market is analyzed in two scenarios. Under the scenario dominated by consumer purchase intention, the composite index of consumer purchase intention is first calculated by the analytical hierarchy process (AHP), and then the composite index is innovatively added into the compositional data prediction model to predict the future dynamic structure of the automobile market. It provides more comprehensive forecast data for the automobile market and enriches the existing automobile industry research.
2. Methodology
Figure 1 shows the framework of this study.
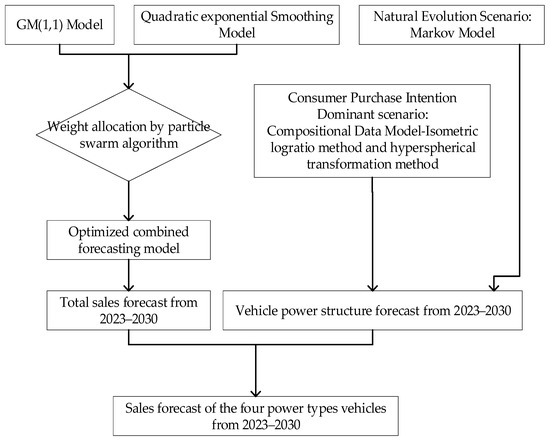
Figure 1.
The study framework.
The development time of new energy vehicles is relatively short, the referable data are small, and the cyclical trend is not very obvious. The gray prediction model has obvious advantages in dealing with small sample data, and the exponential smoothing model can make a better judgment of the data change trend by fitting the historical data. Therefore, the GM (1,1) model and the quadratic exponential smoothing model are firstly used to predict China’s auto sales, respectively, and then the two models are combined, and the optimal combination weights are solved by particle swarm algorithm to obtain the prediction results of the combined model.
In addition, Markov models are able to determine the probability of the system being in various states on the outside more accurately by predicting the probability of various events and are widely used in studies such as industrial structural changes. The compositional data prediction model has high trend analysis and prediction ability and is often used to study the law of structural change of the system. Therefore, vehicles are divided into traditional fuel vehicles, pure electric vehicles, plug-in hybrid vehicles, and hydrogen fuel cell vehicles by power type, and two scenarios are set: the natural evolution scenario and the consumer purchase intention dominant scenario. Firstly, the Markov model is used to predict the dynamic structure change of the automobile market under the natural evolution scenario. Then by adding a composite index of consumer purchase intention to the original component data model, we predict the changes in the dynamic structure of the automobile market under the consumer purchase intention dominant scenario. On this basis, the likely sales volume of each powered vehicle from 2023 to 2030 is calculated.
2.1. Forecast Models for Total Car Sales in China
2.1.1. Grey Model
The gray prediction model GM (1,1) is one of the central models of gray system theory [29,30,31] and has been widely used in many fields, such as energy, transportation, and economy, in recent years [32,33]. The modeling steps of the gray prediction model are as follows:
Step 1: Pre-process the original data. Suppose is the original data series of total vehicle sales from 2011 to 2022.
Construct cumulative generating sequences and immediately adjacent mean generating sequences.
Let be the sequence of immediately adjacent mean generation of :
The gray differential equation model of GM (1,1) is as follows:
Step 2: Construct the data matrix B and the data vector as follows:
Step 3: Determine the parameters.
Let be the parameter vector to be estimated,, and according to the least squares estimation method, we can find that .
Step 4: Take , and obtain the time response sequence equation as follows:
Step 5: Forecast total vehicle sales for 2023–2030 based on Equation (9).
2.1.2. Quadratic Exponential Smoothing Model
Exponential smoothing models are one of the classical time series forecasting methods [34], capable of achieving robust forecasting objectives [35], and widely popular for their simplicity, transparency, and accuracy [36]. Among them, the quadratic exponential smoothing (QETS) method is applicable to time series data with linear trends and not very pronounced periodic performance [37], and its formula is as follows:
where and are the primary and secondary exponential smoothing values in period is the smoothing coefficient, and after repeated comparisons, is optimal when the value of 0.95 is taken here.
Total vehicle sales for 2023–2030 are projected according to Equation (12), where represents the forecast value in period , and are the parameters of the forecast model.
2.1.3. Combinatorial Prediction Model Optimized by Particle Swarm Algorithm
In 1995, Eberhart and Kennedy proposed the particle swarm algorithm. Particle swarm algorithm (PSO) is an efficient and heuristic optimization algorithm [38,39] known for its ease of use, fast convergence, and good global optimization [40]. On the basis of forecasting China’s total automobile sales in 2023–2030 using the gray forecasting model and the quadratic exponential smoothing model, respectively, a combined forecasting model is constructed based on minimizing the mean absolute percentage error (MAPE) and applying the particle swarm algorithm to assign weights to the two models.
Assume that there are particles in -dimensional space, and each particle corresponds to a position where a solution is possible.
The change in position and velocity of the particle can be expressed as follows:
where , is the inertia factor and is the learning factor.
The combined grey forecasting model and quadratic exponential smoothing forecasting model constructed based on the particle swarm algorithm can be expressed as follows:
where is the optimal weight of the combined model, and the steps for solving the optimal weight using the particle swarm algorithm are as follows.
Set , , , particle swarm size , number of iterations , maximum particle velocity , and minimum velocity . Then the steps of the optimal weights based on the particle swarm algorithm solution are as follows.
Step 1: Initialize the particle swarm: set the initial velocity and initial position of each particle as and , and limit and .
Step 2: The position vector of each particle is substituted into Equation (16), and the fitness of the individual particle is positioned as Equation (18) with the minimum mean absolute percentage error as the target.
Step 3: Compare the current best value with the historical best value, if , then ; if , then .
Step 4: Update the position and velocity of the particle according to Equations (15) and (16).
Step 5: Stop the program when the number of iterations reaches 500.
2.1.4. Model Evaluation
The mean absolute percentage error (MAPE) was used to test the reliability of the proposed prediction model and was calculated as follows:
where is the actual value and is the predicted value.
2.2. Forecast Models for China’s Vehicle Power Structure
2.2.1. Markov Model
Markov processes are stochastic processes with no posteriority [41]. denotes the probability distribution of the state the system is in at the moment , where , .
With , denoting the proportion of traditional fuel vehicles, pure electric vehicles, plug-in hybrid electric vehicles, and hydrogen fuel cell vehicles in total vehicle sales at moment, respectively, the primary shift probability matrix of vehicle power structure from moment to moment can be expressed as follows:
where the elements on the main diagonal represent the retention probability of the four power type car shares, and the column elements represent the probability from other power type cars. The transfer probability matrix is solved according to the following four steps.
Step 1: Calculate the retention probability. If the share of a certain power type car in the new car sales market in year t + 1 is higher than its share in year t, its retention probability is considered equal to 1. If the share of a power car in the new car sales market in year t + 1 is lower than that in year t, its retention probability is equal to the ratio of its share in year t + 1 to its share in year t.
Step 2: If the retention probability of a given power type vehicle is equal to 1, it is assumed that the share of that power type vehicle will not shift to other power type vehicles, and the rest of the transfer probabilities in the row where this retention probability is located are 0.
Step 3: If the retention probability of a given power type vehicle is less than 1, it is assumed that the share of other power type vehicles will not shift to that power type vehicle. The rest of the transfer probabilities in the column with this retention probability are 0.
Step 4: If the retention probability of a particular powerhouse vehicle is less than 1, it means that the share of that powerhouse vehicle is shifted to other powerhouses.
An example is given to illustrate the above rule. Suppose the share of traditional fuel vehicles declines in year t + 1 compared to year t, and the share of all other three power types increases in year t + 1 compared to year t. Then the retention probability of traditional fuel car is his share in year t + 1 divided by his share in year t. Subtracting his retention probability from 1 is the residual probability of his shifting to the other three types of vehicles. Calculate the growth share of each of the other three power type cars from year t to year t + 1 and sum them.
Divide the growth share of a given power type vehicle by the sum of the growth shares calculated earlier and multiply by the residual probability of a traditional fuel vehicle to be the probability of transferring a traditional fuel vehicle to this power type vehicle. The calculation formula is shown as follows:
According to the above rules, using the data from 2015 to 2022, we can obtain seven transition probability matrices. Then, the following equation is used to solve the average transition probability matrix from 2015 to 2022.
The relationship between and is shown as follows:
The data on hydrogen vehicle sales start in 2015, so the collated national vehicle sales data from 2015 to 2022 divided by the four power types mentioned above are substituted into the optimized Markov model described above, and the primary transfer probability matrix can be calculated. The future vehicle power structure is predicted according to Equation (23).
2.2.2. Compositional Data Model
The compositional data model can predict the trend of each share in the compositional data more accurately [42] and is widely used to predict changes in industrial structure, consumption structure, etc. [43,44].
The compositional data concerning the structure of the automobile industry for 2015–2022 are represented as follows:
where denotes the share of vehicles of the power type, in the year .
We will construct compositional data prediction models using the following two classical approaches.
(1) Isometric log-ratio (ILR) transformation method
Step 1: Transform the original compositional data into the following intermediate variable:
Step 2: Predict the value of the intermediate variable
Step 3: Set , Calculate the variable based on the predicted values of the intermediate variables as follows:
Step 4: Calculate the predicted values of the compositional data as follows:
(2) Dimension reduction through hyperspherical transformation (DRHT) method
Step 1: Transform the original compositional data into the intermediate variable as follows:
Step 2: Map the transformed compositional data from the Cartesian coordinate system to an n-dimensional hypersphere of radius 1 as follows:
where , .
Step 3: Solve according to Equation (30) using recursive algorithm as follows:
Step 4: Construct prediction models based on the solved
Step 5: Predict the angle value in period according to Equation (33) as follows:
Step 6: Based on the angle values predicted by Equation (33), use Equation (30) to calculate the predicted values for period .
Step 7: Calculate the predicted values of the compositional data in period :
We will use the following traditional prediction models for the intermediate variables, respectively.
(1) Gray prediction model
Considering the limited sales data of new energy vehicles, we will use three typical gray forecasting models, GM (1,1), discrete gray prediction model DGM (1,1) and GM (1,1) power model to predict the values of intermediate variables. The power index value of the GM (1,1) power model in this study is set to 0.02.
(2) Quadratic exponential smoothing model
The modeling process of the quadratic exponential smoothing model is described in Section 2.1.3. After repeated debugging, the smoothing coefficient is set to 0.2 for the prediction of the intermediate variables of the isometric log-ratio transformation and 0.32 for the prediction of the intermediate variables of the hyperspherical transformation.
2.2.3. Model Evaluation
In the model evaluation section, two indicators are used to evaluate the model prediction errors. The first is the MAPE method, and the second is the compositional data average percentage error (CMAPE) with reference to the method of Wei, et al. [36].
2.3. Scenario Analysis
2.3.1. Natural Evolution Scenario
Markov models have memory lessness. A natural evolution scenario is set as a reference, and factors such as product cost, technological progress, and national policies are not considered. Therefore, the prediction results based on the Markov model are taken as the results of the vehicle power structure under the natural evolution scenario.
2.3.2. Consumer Purchase Intention Dominant scenario
After selecting the component data model with good prediction effect in Section 2.2, the automobile market changes under the optimization scenario of automobile power structure considering the changes of consumers’ purchase intention are analyzed by adding the composite index of consumers’ purchase intention to the intermediate variables.
According to Equations (28) and (30), it can be seen that the percentages of traditional fuel vehicles, pure electric vehicles, plug-in hybrid vehicles, and hydrogen fuel cell vehicles can be expressed as follows:
The optimization of the power structure of the automotive industry is focused on increasing the share of sales of all types of new energy vehicles in the total sales of the new vehicle market. The sales of new energy vehicles greatly depend on the behavior of consumers [45]. So as consumers’ purchase intention increases, the values of , and will rise under the ILR transformation; the cosine function decreases at , so the values of , and will fall faster under the DRHT transformation.
It is assumed that consumer purchase intention α (0 < α < 1) is a comprehensive indicator, which is influenced by price, technology, infrastructure, government policies, and other factors. Considering that new energy vehicles in China are mainly electric vehicles and hydrogen energy vehicles are in the initial stage, the degree of influence of the change in consumer’s willingness to purchase the three new energy vehicles is as follows: pure electric vehicles > plug-in hybrid vehicles > hydrogen fuel cell vehicles. At this point, the proportions of vehicles of the four power types under the ILR transformation method and the DRHT transformation method can be expressed as follows, respectively.
In order to study the changes in consumer purchase intention, the weighting of each factor on consumer purchase intention was first determined using the analytical hierarchy process (AHP). On this basis, consumer purchase intentions are scored for the short-term (2023) and medium-term (2030). The main steps of the hierarchical analysis method are as follows.
Step 1: Establishing a hierarchical model.
Consumers’ purchase intention for new energy vehicles is affected by many factors. Firstly, both price and usage cost are important factors affecting consumers’ purchase intention. Secondly, the driving range, charging time, and safety of new energy vehicles are the key concerns of consumers. Moreover, as the battery is greatly affected by temperature, there are regional sensitive problems in the sales of new energy vehicles. In addition, the construction of supporting facilities for new energy vehicles such as charging stations and hydrogen refueling stations, as well as the improvement of after-sales services, are key factors affecting consumers’ purchase intentions. Finally, government subsidies and license issuance have a significant impact on the purchase intention.
At present, many consumers have a wait-and-see attitude toward new energy vehicles. In terms of cost, compared with traditional fuel vehicles, the price of new energy vehicles is higher, and consumers are also more sensitive to the price of new energy vehicles. In terms of technology, due to the fact that battery technology is not very mature, the performance of new energy vehicles is not good, such as driving range, charging time, and safety. Moreover, the battery is greatly affected by temperature, and the purchase intention of consumers in northern China is lower than that of consumers in southern China. In terms of infrastructure, China’s supporting facilities for new energy vehicles, such as charging stations and hydrogen refueling stations, are weak, and the after-sales service system is not perfect. In terms of policy, at present China’s new energy vehicles are still policy-oriented.
According to the technology life cycle theory, the battery technology of China’s new energy vehicles will be more and more mature in the future. With the maturity of technology, the production cost of new energy vehicles will further decline. In addition, more electric vehicle enterprises will enter the new energy vehicle industry in the future, and the market supply will increase substantially. Therefore, driven by technology and market, the price of new energy vehicles will gradually decline in the future, and consumers’ price sensitivity to new energy vehicles will gradually decline, and the utility brought by the price decline of new energy vehicles will exceed the effect of the price decline of traditional fuel vehicles. With the popularization of new energy vehicles, supporting infrastructure and after-sales service will usher in stable development. With the strong support of the state and the maturity of technology, the demand for new energy vehicles in less developed areas will gradually increase [1]. After the withdrawal of national subsidies, the user experience of new energy vehicles will be further highlighted. The new energy vehicle industry will gradually change from policy-oriented to market-oriented.
Based on the above analysis, this paper constructs the evaluation index system of consumers’ purchase intention from the four aspects of the cost factor, technology factor, infrastructure factor, and policy factor, as shown in Table 1.

Table 1.
Consumer purchase intention evaluation index system.
Step 2: Construct a judgment matrix. A two-by-two comparison is made between indicators in the same tier, generally through the 1–9 scale method, and a judgment matrix is constructed by assigning values to the relative importance of the indicators. The comparison criteria are shown in Table 2.
Table 2.
Comparison criteria table.
Step 3: Calculation of indicator weights and consistency test.
In order to calculate the relative weights of the lower-level indicators in the judgment matrix compared to the upper-level indicators, the maximum characteristic root of each judgment matrix and the corresponding characteristic vector should be calculated, and the characteristic vector after passing the consistency test and normalization is the requested indicator weight vector. The consistency of the judgment matrix needs to meet certain conditions, when CR < 0.1, the judgment matrix is considered to pass the consistency test.
According to the expert opinions, the judgment matrix, weights, and consistency test results of the first-level indicators are shown in Table 3. The judgment matrix, weights and consistency test results of the first-level indicators are shown in Table 3.
Table 3.
Weights of primary indicators and results of consistency tests.
Following the same method, the weights of the secondary indicators were calculated, and the results of the consistency test are shown in Table 4.
Table 4.
Weights of secondary indicators and results of consistency tests.
Step 4: Calculate the overall score.
Based on the scores in Table 5 and the weighting values for each factor, the combined consumer purchase intention scores for 2023 and 2030 are 0.18654 and 0.29397, respectively.
Table 5.
Weighting of indicators at each level and scoring results.
We can then derive the linear equation for the change in consumer purchase intention scores from 2023 to 2030 as follows:
where l represents the prediction step.
3. Results and Discussion
3.1. Total Vehicle Sales Forecast Results
In this section, the auto sales data from 2011 to 2022 are collected from the website of the China Association of Automobile Manufacturers (CAAM) to forecast the total vehicle sales in China from 2023 to 2030.
In order to verify the effectiveness of the combined forecasting model, this paper uses Matlab2017b programming to implement the GM (1,1) model, quadratic exponential smoothing model, and particle swarm algorithm optimized combined forecasting model, respectively, and compares the fitting results of the three models for China’s vehicle sales from 2011 to 2020 and uses the actual sales in 2021 and 2022 as a test of the forecasting results. The prediction results of the three models are shown in Figure 2.
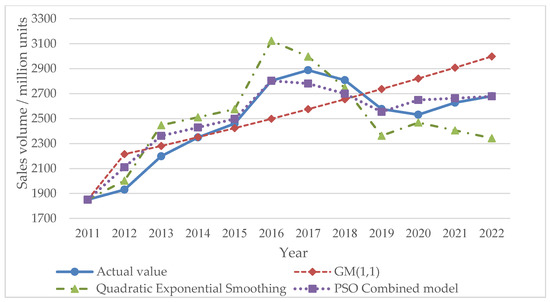
Figure 2.
Comparison of the prediction results of the three models.
Table 6 shows that the fitting error of the GM (1,1) model is 0.0647, the fitting MAPE of quadratic exponential smoothing is 0.0548, and the optimal weight of this prediction is obtained as 0.5125 by using the particle swarm algorithm to calculate the weights of the combined model. The fitted MAPE of the combined prediction model is calculated as 0.03467.
Table 6.
Fitting and prediction results of the three model predictions.
The predicting MAPE of the GM (1,1) model is 0.11269, the predicting MAPE of quadratic exponential smoothing is 0.10523, and the predicting MAPE of the combined prediction model based on particle swarm algorithm optimization is only 0.00705.
It can be seen that the combined forecasting model has significantly higher forecasting accuracy. Therefore, the combined forecasting model optimized by the particle swarm algorithm is used to forecast the automobile sales volume in China from 2023 to 2030.
Based on the combined forecasting model optimized by the particle swarm algorithm, and the total car sales data from 2011 to 2022, the optimal weight at this time is obtained as 0.4935, and then the total sales volume of automobiles in China from 2023 to 2030 is predicted, as shown in Figure 3. The forecast results show that in the next few years, although the growth rate of China’s vehicle sales has slowed down, the overall total vehicle sales will continue to rise and are expected to reach 32.529 million units in 2030.
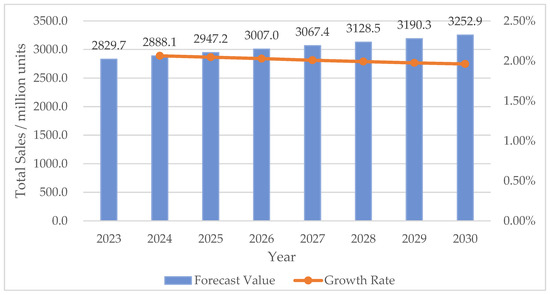
Figure 3.
Total vehicle sales forecast results of the optimal combination model.
The forecast results are in line with national policy planning. In order to mitigate the impact of the epidemic on the vehicle industry supply chain, etc., the country has introduced a series of policies to stabilize the economy and promote expenses, such as halving the purchase tax. In May 2022, the State Council issued the Notice on the Issuance of Solidly Stabilizing the Economy—Package of Policy Measures, which clearly proposed to steadily increase the bulk consumption of automobiles and other vehicles. In addition, as the form of the epidemic improves, the acceleration of the resumption of work and production will further promote the recovery of the vehicle market.
3.2. Vehicle Power Structure Prediction Results
3.2.1. Calculation Result of Transition Probability Matrix
Considering the sales data of hydrogen energy vehicles from 2015, this paper uses the vehicle sales data from 2015 to 2022 as historical data for the forecast. Figure 4 shows the sales of vehicles by power type for 2015–2022 (The 2022 sales figures for each power type are extrapolated from projections published by the China Association of Automobile Manufacturers in December 2022.). It can be intuitively seen from the figure that the sales of traditional fuel vehicles are decreasing while the sales of pure electric vehicles, plug-in hybrid electric vehicles, and hydrogen fuel cell vehicles are increasing.
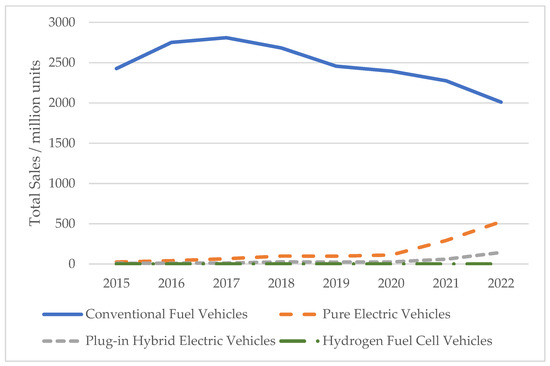
Figure 4.
Vehicle sales in China over the years (million units).
Substituting the data in Figure 4 into the Markov model above and solving to obtain the average transfer probability matrix shown in Figure 5.
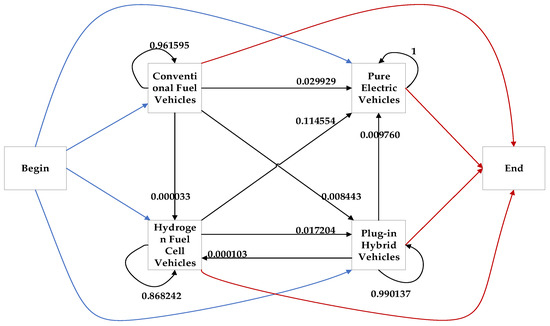
Figure 5.
Transfer probabilities for Markov model.
Figure 5 shows that under the natural evolution scenario, there are two trends in China’s vehicle power structure as follows: first, in the competition between traditional energy and new energy vehicles, traditional fuel vehicles will be gradually replaced by various types of new energy vehicles.
Second, in the competition between new energy vehicles, some shares between plug-in hybrid vehicles and hydrogen fuel cell vehicles are transformed into each other, and some shares of both are transformed into pure electric vehicles.
The vehicle power structure in 2022 was calculated based on the sales data of the four power types of vehicles in 2022, shown in Figure 4. Using the transfer probability, the shares of the four power types of vehicles can be calculated based on Equation (22).
3.2.2. Comparison of Models
Considering the small amount of historical data available for reference, this study uses the vehicle sales data from 2015 to 2021 on the website of the China Association of Automobile Manufacturers as the training set and the data from 2022 as the prediction set. The best-performing vehicle power structure prediction model is selected by comparing the MAPE and CMAPE values.
The MAPE and CMAPE values of the Markov model are 29.546% and 7.768%, respectively. The MAPE and CMAPE values of compositional data models are shown in Table 7.
Table 7.
CMAPE comparisons of alternative compositional data models (%).
By comparing the above errors, it was found that the Markov model, as well as the hyperspherical transformation method of the compositional data, had better prediction results. The quadratic exponential smoothing model has better results in terms of the prediction model of the hyperspherical transformation method. Therefore, the Markov model and DRHT-QETS model are selected to predict the vehicle power structure for 2023–2030.
3.2.3. Prediction Results of Vehicle Power Structure
According to the transfer probability matrix and angle value prediction results, the prediction results of car structure change for the Markov model and compositional data model are obtained, as shown in Figure 6.
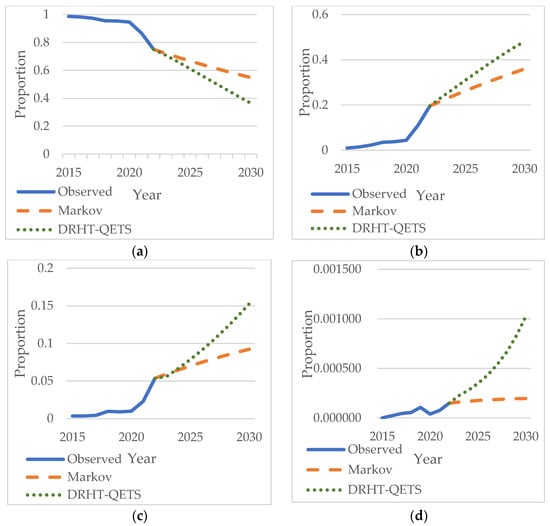
Figure 6.
The forecast results for the proportion of vehicles of each power type. (a) Traditional fuel vehicles; (b) pure electric vehicles; (c) plug-in hybrid vehicles; (d) hydrogen fuel cell vehicles.
Based on the forecast results of Markov and GHRT-QETS models, combined with the results of the total vehicle sales forecast in Figure 3, the sales forecasts for traditional fuel vehicles, pure electric vehicles, plug-in hybrid vehicles, and hydrogen fuel cell vehicles for 2023–2030 are shown in Figure 7.
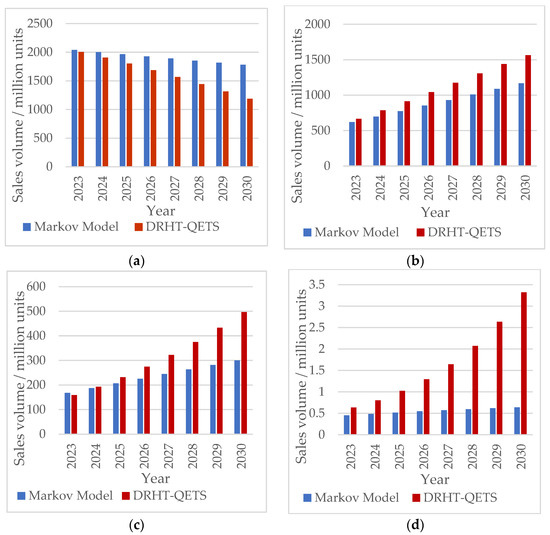
Figure 7.
The forecast results for the sales of vehicles of each power type. (a) Traditional fuel vehicles; (b) pure electric vehicles; (c) plug-in hybrid vehicles; (d) hydrogen fuel cell vehicles.
According to the forecast results shown in Figure 6 and Figure 7, it can be found that the Markov model and DRHT-QETS model have the same forecast trend for the sales of the four power types of vehicles.
The Energy Conservation and New Energy Vehicle Technology Roadmap 2.0 released in 2020 and the Implementation Plan for Carbon Dumping in Industry released in 2022 set China’s new energy vehicle sales target at 40% of the new vehicle market in 2030. According to the forecast results, China will achieve this goal in 2028 and 2026, respectively, under the natural evolution scenario and the consumer purchase intention dominant scenario. By 2030, under the natural evolution scenario, the proportion of new energy vehicles in China will reach 45.17%. Under the consumer purchase intention dominant scenario, the proportion reaches 63.49%.
At the same time, with the continuous optimization of the power structure of the automobile industry, the proportion of traditional fuel vehicles in the new car market will continue to decline. By 2030, under the natural evolution scenario and the consumer purchase intention dominant scenario, the proportion of traditional fuel vehicles will decrease to 54.83% and 36.51%, respectively. According to the New Energy Vehicle Industry Development Plan (2021–2035), after about 15 years, pure electric vehicles will become the mainstream in China. This is consistent with the prediction in this paper that the proportion of purely electric vehicles is expected to continue to rise. By 2030, pure electric vehicle sales will reach 35.92% and 48.11% of the total new car market sales under the natural evolution scenario and the consumer purchase intention dominant scenario, respectively.
Currently, many Chinese autonomous vehicle brands such as BYD, Great Wall, Chang’an, and Geely are actively developing plug-in hybrid technology. As one of the technical routes of new energy vehicles, with the maturity of plug-in hybrid technology and policy improvement, plug-in hybrid vehicles in China will usher in a new round of development. It is estimated that by 2030, plug-in hybrid vehicle sales will account for 9.23% of China’s new car market under the natural evolution scenario. With the maturity of technology and the improvement of policies, consumers’ purchase intention will further increase, and under this scenario, plug-in hybrid vehicle sales will account for 15.28% of China’s new car market.
In 2021, hydrogen energy was officially written into the 14th Five-Year Plan, and in the same year, the Ministry of Finance, the Ministry of Industry and Information Technology, the Ministry of Science and Technology, the National Development and Reform Commission, and the National Energy Administration jointly issued the Notice on Starting the Demonstration and Application of Fuel Cell Vehicles and the Notice on Starting a New Batch of Demonstration and Application of Fuel Cell Vehicles, which initially formed five major demonstration city groups for fuel cell vehicle, including Beijing-Tianjin-Hebei, Shanghai, Guangdong, Hebei, and Henan. The absolute number of hydrogen fuel cell vehicles in China is relatively small, but it is expected that with the support of national policies, hydrogen fuel cell vehicles will usher in significant development opportunities. It is expected that by 2030, under the natural evolution scenario, the sales of new energy vehicles will account for 0.02% of the new car sales market. However, under the consumer purchase intention dominant scenario, this proportion will reach 0.10%. The proportion of new vehicle sales of traditional fuel cell vehicles in China is expected to continue to decline in the future but will not die out in the short term. New vehicle sales of pure electric vehicles and plug-in hybrids are gaining momentum, and the share of hydrogen fuel cell vehicles will also grow rapidly. The layout of new energy vehicles, mainly electric energy and supplemented by hydrogen energy, will gradually take shape and will fully catch up with traditional energy vehicles in the future.
From a worldwide perspective, countries and regions such as China, Europe, and the U.S. are the main development forces of the global new energy vehicle industry. In 2022, 27 countries in the European Union and the U.S. state of California announced a complete ban on the sale of fuel cars in 2035. Both domestically and internationally, the new energy vehicle industry is seen as a priority for optimizing the energy mix, which presents both opportunities and challenges for all countries.
To capture the global new energy vehicle market, getting rid of technology import dependence is the key. At present, China’s new energy vehicles are still facing some urgent technical problems that need to be solved. The shortage of chips seriously restricts the production of new energy vehicles in China. China’s power battery still needs to increase its research and development, key technologies such as high-efficiency and high-density drive motors still have defects, and key components such as high-power and high-speed bearings still have gaps with the world’s advanced level. In the future, the government should further increase the deployment of key technologies and other efforts, strengthen talent and financial support, create an industrial cluster based on new energy vehicles and auto parts, provide a guarantee for the optimization of the structure of the automotive industry, and inject new momentum into the sustainable development of China’s economy.
4. Conclusions
Based on a combined gray and quadratic exponential smoothing forecasting model with particle swarm optimization, this paper forecasts the total automobile sales from 2023 to 2030. Total vehicle sales in China are expected to continue to rise from 2023 to 2030. in 2030, total vehicle sales will reach 32.529 million units, which is in line with the government’s strategic plan. The share of traditional fuel-fired vehicle sales in the new vehicle market is expected to continue to decline from 2023 to 2030, and the share of new energy vehicles, led by electric vehicles, will continue to rise.
Under the natural evolution scenario, China is expected to achieve the target of 40% of the new car market in 2028 for new energy vehicle sales. By 2030, the proportion of traditional fuel vehicles, pure electric vehicles, plug-in hybrid vehicles, and hydrogen fuel cell vehicles will be 54.83%, 35.92%, 9.23%, and 0.02%, respectively. Under the consumer purchase intention dominant scenario, the growth rate of the proportion of new energy vehicles will increase significantly, and it is expected that China will achieve the goal of 40% of the new car market in the sales of new energy vehicles by 2026. Under this scenario, the proportions of the four types of vehicles are 36.51%, 48.11%, 15.28%, and 0.10%, respectively. The forecast results are consistent with the national goal of optimizing the structure of the automotive industry and seizing the dominant position of global new energy vehicles.
Based on the above conclusions, the following recommendations are made: (1) Improve the policy system of new energy vehicles, refine the preferential policies for each power type of new energy vehicles, provide a good policy environment for the optimization and upgrading of the power structure of the auto industry, and promote the high-quality and sustainable development of the auto industry. (2) Strengthen support for new energy vehicle technology innovation and enhance the core competitiveness of the industry. (3) Improve the construction of charging stations, hydrogen refueling stations, and other basic supporting facilities.
Although total vehicle sales and the share of each vehicle type are forecasted, there are some limitations in forecasting using only limited historical sales data, and the AHP method is subjective. Multivariate forecasting based on more objective data on vehicle sales is considered in the future.
Author Contributions
Conceptualization, Y.F.; methodology, M.Z. and Y.F.; project administration, D.D.; writing—original l draft preparation, M.Z., Y.F. and D.D.; writing—review and editing, D.D., Y.F. and M.Z. All authors have read and agreed to the published version of the manuscript.
Funding
The Humanities and Social Science Research Planning Fund of the Ministry of Education (Grant No. 17YJA880014).
Institutional Review Board Statement
Not applicable.
Informed Consent Statement
Not applicable.
Data Availability Statement
Not applicable.
Conflicts of Interest
The authors declare no conflict of interest.
References
- Ma, L.; Wu, M.H.; Tian, X.J.; Zheng, G.H.; Du, Q.C.; Wu, T. China’s provincial vehicle ownership forecast and analysis of the causes influencing the trend. Sustainability 2019, 11, 3928. [Google Scholar] [CrossRef]
- Pichler, M.; Krenmayr, N.; Maneka, D.; Brand, U.; Hogelsberger, H.; Wissen, M. Beyond the jobs-versus-environment dilemma? Contested social-ecological transformations in the automotive industry. Energy Res. Soc. Sci. 2021, 79, 11. [Google Scholar] [CrossRef]
- Zhao, M.; Sun, T.; Feng, Q. A study on evaluation and influencing factors of carbon emission performance in china’s new energy vehicle enterprises. Environ. Sci. Pollut. Res. 2021, 28, 57334–57347. [Google Scholar] [CrossRef]
- Du, Z.L.; Lin, B.Q.; Guan, C.X. Development path of electric vehicles in china under environmental and energy security constraints. Resour. Conserv. Recycl. 2019, 143, 17–26. [Google Scholar]
- Chen, W.W.; Xu, M.Z.; Xing, Q.S.; Cui, L.G.; Jiao, L.D. A fuzzy demand-profit model for the sustainable development of electric vehicles in china from the perspective of three-level service chain. Sustainability 2020, 12, 6389. [Google Scholar] [CrossRef]
- Wang, X.L.; Huang, L.C.; Daim, T.; Li, X.; Li, Z.Q. Evaluation of China’s new energy vehicle policy texts with quantitative and qualitative analysis. Technol. Soc. 2021, 67, 11. [Google Scholar] [CrossRef]
- Zhang, M.Y.; Xu, H.Y.; Ma, N.; Pan, X.L. Intelligent vehicle sales prediction based on online public opinion and online search index. Sustainability 2022, 14, 344. [Google Scholar] [CrossRef]
- Yuan, X.D.; Cai, Y.C. Forecasting the development trend of low emission vehicle technologies: Based on patent data. Technol. Forecast. Soc. Chang. 2021, 166, 9. [Google Scholar] [CrossRef]
- Piotrowski, P.; Baczynski, D.; Robak, S.; Kopyt, M.; Piekarz, M.; Polewaczyk, M. Comprehensive forecast of electromobility mid-term development in poland and its impacts on power system demand. Bull. Pol. Acad. Sci.-Tech. Sci. 2020, 68, 697–709. [Google Scholar]
- Mao, J.; Hong, D.; Ren, R.W.; Li, X.Y. The effect of marine power generation technology on the evolution of energy demand for new energy vehicles. J. Coast. Res. 2020, 103, 1006–1009. [Google Scholar] [CrossRef]
- Akbar, K.; Zou, Y.; Awais, Q.; Baig, M.J.A.; Jamil, M. A machine learning-based robust state of health (soh) prediction model for electric vehicle batteries. Electronics 2022, 11, 1216. [Google Scholar] [CrossRef]
- Gibson, E.; van Blommestein, K.; Kim, J.; Daim, T.; Garces, E. Forecasting the electric transformation in transportation: The role of battery technology performance. Technol. Anal. Strateg. Manag. 2017, 29, 1103–1120. [Google Scholar] [CrossRef]
- Sato, F.E.K.; Nakata, T. Recoverability analysis of critical materials from electric vehicle lithium-ion batteries through a dynamic fleet-based approach for japan. Sustainability 2020, 12, 147. [Google Scholar] [CrossRef]
- Zou, Y.J.; Ding, L.S.; Zhang, H.; Zhu, T.; Wu, L.T. Vehicle acceleration prediction based on machine learning models and driving behavior analysis. Appl. Sci.-Basel 2022, 12, 5259. [Google Scholar] [CrossRef]
- Liu, Y.T.; Cheng, D.; Wang, Y.R.; Cheng, J.J.; Gao, S.C. A novel method for predicting vehicle state in internet of vehicles. Mob. Inf. Syst. 2018, 2018, 9728328. [Google Scholar] [CrossRef]
- Tang, L.; Wang, H.Y.; Zhang, W.H.; Mei, Z.Y.; Li, L. Driver lane change intention recognition of intelligent vehicle based on long short-term memory network. IEEE Access 2020, 8, 136898–136905. [Google Scholar] [CrossRef]
- Hsieh, I.Y.L.; Kishimoto, P.N.; Green, W.H. Incorporating multiple uncertainties into projections of chinese private car sales and stock. Transp. Res. Record 2018, 2672, 182–193. [Google Scholar] [CrossRef]
- Lian, L.; Tian, W.; Xu, H.F.; Zheng, M.L. Modeling and forecasting passenger car ownership based on symbolic regression. Sustainability 2018, 10, 2275. [Google Scholar] [CrossRef]
- Pai, P.F.; Liu, C.H. Predicting vehicle sales by sentiment analysis of twitter data and stock market values. IEEE Access 2018, 6, 57655–57662. [Google Scholar] [CrossRef]
- Ou-Yang, C.; Chou, S.C.; Juan, Y.C. Improving the forecasting performance of taiwan car sales movement direction using online sentiment data and cnn-lstm model. Appl. Sci.-Basel 2022, 12, 1550. [Google Scholar] [CrossRef]
- Wang, K.L.; Zheng, L.J.; Zhang, J.Z.; Yao, H.J. The impact of promoting new energy vehicles on carbon intensity: Causal evidence from china. Energy Econ. 2022, 114, 12. [Google Scholar] [CrossRef]
- Pei, L.L.; Li, Q. Forecasting quarterly sales volume of the new energy vehicles industry in china using a data grouping approach-based nonlinear grey bernoulli model. Sustainability 2019, 11, 1247. [Google Scholar] [CrossRef]
- Zhang, Y.; Zhong, M.; Geng, N.N.; Jiang, Y.J. Forecasting electric vehicles sales with univariate and multivariate time series models: The case of china. PLoS ONE 2017, 12, 15. [Google Scholar] [CrossRef]
- Wang, M.X.; Wang, Y.J.; Chen, L.; Yang, Y.Q.; Li, X. Carbon emission of energy consumption of the electric vehicle development scenario. Environ. Sci. Pollut. Res. 2021, 28, 42401–42413. [Google Scholar] [CrossRef]
- Wu, M.F.; Chen, W. Forecast of electric vehicle sales in the world and china based on pca-grnn. Sustainability 2022, 14, 2206. [Google Scholar] [CrossRef]
- Rietmann, N.; Hugler, B.; Lieven, T. Forecasting the trajectory of electric vehicle sales and the consequences for worldwide co2 emissions. J. Clean Prod. 2020, 261, 16. [Google Scholar] [CrossRef]
- Bitencourt, L.; Abud, T.; Santos, R.; Borba, B. Bass diffusion model adaptation considering public policies to improve electric vehicle sales-a brazilian case study. Energies 2021, 14, 5435. [Google Scholar] [CrossRef]
- Guo, D.; Yan, W.; Gao, X.B.; Hao, Y.J.; Xu, Y.; Wenjuan, E.; Tan, X.C.; Zhang, T.Q. Forecast of passenger car market structure and environmental impact analysis in china. Sci. Total Environ. 2021, 772, 17. [Google Scholar] [CrossRef]
- Islam, M.R.; Ali, S.M.; Fathollahi-Fard, A.M.; Kabir, G. A novel particle swarm optimization-based grey model for the prediction of warehouse performance. J. Comput. Des. Eng. 2021, 8, 705–727. [Google Scholar] [CrossRef]
- Chen, Y.Y.; Liu, H.T.; Hsieh, H.L. Time series interval forecast using gm(1,1) and ngbm(1,1) models. Soft Comput. 2019, 23, 1541–1555. [Google Scholar] [CrossRef]
- Yao, T.X.; Wang, Z.H. Crude oil price prediction based on lstm network and gm (1,1) model. Grey Syst. 2021, 11, 80–94. [Google Scholar] [CrossRef]
- Qian, W.Y.; Wang, J. An improved seasonal gm(1,1) model based on the hp filter for forecasting wind power generation in china. Energy 2020, 209, 15. [Google Scholar] [CrossRef]
- Zor, C.; Cebi, F. Demand prediction in health sector using fuzzy grey forecasting. J. Enterp. Inf. Manag. 2018, 31, 937–949. [Google Scholar] [CrossRef]
- Li, C.; Yang, Y.J.; Liu, S.F. A new method to mitigate data fluctuations for time series prediction. Appl. Math. Model. 2019, 65, 390–407. [Google Scholar] [CrossRef]
- Barrow, D.; Kourentzes, N.; Sandberg, R.; Niklewski, J. Automatic robust estimation for exponential smoothing: Perspectives from statistics and machine learning. Expert Syst. Appl. 2020, 160, 14. [Google Scholar] [CrossRef]
- Sbrana, G.; Silvestrini, A. Random switching exponential smoothing: A new estimation approach. Int. J. Prod. Econ. 2019, 211, 211–220. [Google Scholar] [CrossRef]
- Liu, Z.; Wang, X.H.; Zhang, Q.; Huang, C.Y. Empirical mode decomposition based hybrid ensemble model for electrical energy consumption forecasting of the cement grinding process. Measurement 2019, 138, 314–324. [Google Scholar] [CrossRef]
- Lin, L.; Handley, J.C.; Gu, Y.M.; Zhu, L.; Wen, X.J.; Sadek, A.W. Quantifying uncertainty in short-term traffic prediction and its application to optimal staffing plan development. Transp. Res. Pt. C-Emerg. Technol. 2018, 92, 323–348. [Google Scholar] [CrossRef]
- Miao, K.; Mao, X.L.; Li, C. Individualism of particles in particle swarm optimization. Appl. Soft. Comput. 2019, 83, 13. [Google Scholar] [CrossRef]
- Liu, E.C.; Li, J.; Zheng, A.N.; Liu, H.R.; Jiang, T. Research on the prediction model of the used car price in view of the pso-gra-bp neural network. Sustainability 2022, 14, 8993. [Google Scholar] [CrossRef]
- Sun, L.Q.; Yang, Y.L.; Ning, T.; Zhu, J.D. A novel grey power-markov model for the prediction of china’s electricity consumption. Environ. Sci. Pollut. Res. 2022, 29, 21717–21738. [Google Scholar] [CrossRef]
- Zhu, B.Z.; Wang, K.F.; Chevallier, J.; Wang, P.; Wei, Y.M. Can china achieve its carbon intensity target by 2020 while sustaining economic growth? Ecol. Econ. 2015, 119, 209–216. [Google Scholar] [CrossRef]
- Wei, Y.G.; Wang, Z.C.; Wang, H.W.; Li, Y.; Jiang, Z.Y. Predicting population age structures of china, india, and vietnam by 2030 based on compositional data. PLoS ONE 2019, 14, 42. [Google Scholar] [CrossRef]
- Wei, Y.G.; Wang, Z.C.; Wang, H.W.; Yao, T.; Li, Y. Promoting inclusive water governance and forecasting the structure of water consumption based on compositional data: A case study of beijing. Sci. Total Environ. 2018, 634, 407–416. [Google Scholar] [CrossRef]
- Lin, B.Q.; Shi, L. Do environmental quality and policy changes affect the evolution of consumers’ intentions to buy new energy vehicles. Appl. Energy 2022, 310, 9. [Google Scholar] [CrossRef]
Disclaimer/Publisher’s Note: The statements, opinions and data contained in all publications are solely those of the individual author(s) and contributor(s) and not of MDPI and/or the editor(s). MDPI and/or the editor(s) disclaim responsibility for any injury to people or property resulting from any ideas, methods, instructions or products referred to in the content. |
© 2023 by the authors. Licensee MDPI, Basel, Switzerland. This article is an open access article distributed under the terms and conditions of the Creative Commons Attribution (CC BY) license (https://creativecommons.org/licenses/by/4.0/).