Abstract
Wine by-products, generated in large quantities and wasted with serious environmental and economic consequences, are an exceptional alternative to conventional and non-sustainable food sources. The aim of the study was to understand if these by-products could be reused in feed for broiler chickens, improving certain blood parameters important in immune responses, by testing different concentrations and administration times. The effects of the grape-seed and pomace flour of red-wine waste were evaluated. Three different diets were tested containing pomace (0%, 3%, and 6%), grape seeds (0%, 3%, and 6%), and a mix of pomace and grape seeds (0 and 3%) for 7, 21, and 42 days. Esterase, alkaline phosphatase, and peroxidase activity, along with glucose, reactive oxygen species, and glutathione levels, were evaluated in blood samples. The results showed significant changes in the parameters analyzed, especially after 21 and 42 days of administration. All diets administered showed significant effects based on exposure time and by-product concentration used. The greatest effects seem to have come from grape-seed flour. All the by-products of wine production analyzed in this study showed important antioxidant activities and can be included in the food context of farm animals in different growth phases at different concentrations.
1. Introduction
Recently, there has been considerable interest in the possibility of reusing agricultural by-products to extract bioactive molecules with anticancer, antimicrobial, antioxidant, and nutraceutical properties. Among the most productive economic sectors at the international level, wine production has played an important role. The best-known and most-used species of vine (almost 70%) is Vitis vinifera L., among which Cabernet Sauvignon is the most cultivated variety [1].
At the end of wine production, a series of waste products are produced in large volumes including pomace, grape seeds, and stems for which disposal has an economic cost for the companies and, if carried out inappropriately, risk damage to the environment [2]. For this reason, it is important find new solutions for reusing these wastes which are rich in unsaturated fatty acids, monosaccharides, polysaccharides, proteins, fiber, minerals, polyphenols, and phenols [3,4,5,6], and which may have antioxidant properties, as well as antibacterial and antiviral activities, thus constituting a breakthrough in their applications for various sectors (e.g., biomedical, agri-food, and cosmetics) in complete coherence with the principles of sustainability and eco-compatibility [3,7,8,9,10,11,12].
Several studies have evaluated the possibility of reusing these by-products in various sectors, including the production of energy, cosmetics, fertilizers, beverages, and animal-feed supplements [12,13,14]. Focusing on animal nutrition and on broiler chickens in particular, it is known that antioxidants are important elements for preventing the loss of redox homeostasis and its negative effects on growth performance, immune responses, and meat quality; to meet these needs, synthetic antioxidants such as butylated hydroxyanisole, butylated hydroxytoluene, and ethoxyquin are currently used.
However, it is important to think of replacing synthetic molecules with natural antioxidants, reducing the risks of toxicity and ensuring the greater safety of food products, as well as a better state for farmed animals [15,16]. It is also important to note that the antioxidant potential of the polyphenols contained in wine-production waste appears to be higher than that of vitamin E (20 times) and vitamin C (50 times) [17,18]. In addition, several studies have recently worked at identifying potential substitutes for the use of antibiotics (now banned in several countries) in breeding and, in this context, grape seeds, which have been shown to have important anti-inflammatory, antimicrobial, anticancer, cardioprotective, and neuroprotective activities, have become excellent study candidates [19,20,21,22,23]. Moreover, several authors have studied the optimum level of grape seed or pome fruit to maximize growth performance and health [24,25], showing that the optimum dosage of grape-seed extract (useful as a natural antioxidant and immunostimulant agent in broiler-chicken diets) could be 125 to 250 ppm. Other authors have evaluated the applications of these wastes in animal nutrition, but there is scarce information regarding the correct percentages to be administered in the various life stages and which of the wastes produced during wine production could potentially be the most efficacious [26,27].
Moreover, it is obviously important to consider that even though the by-products of wine production are fibrous foods that have a high potential for use in animal diets they could have various limitations. Modern broilers are very high-performing animals; to achieve a high rate of weight gain, they need to be fed with nutrient-rich diets, so by-products in general are usually included at very low rates in broiler feed. Grape by-products are rich in Neutral Detergent Fiber (NDF) and low in nutritional value, so their inclusion may dilute the energy density of the diets and thus negatively affect the growth of animals. In addition, grape by-products are also rich in tannins that are known to have potential antinutritional effects in monogastric animals because they can decrease feed intake, nutrient digestibility, and growth performance of chicken [28].
One method for evaluating the possible beneficial effects of integrating these diets is to evaluate different biomarkers at the plasma level, such as esterase, alkaline phosphatase, glucose, peroxidase, reactive oxygen species (ROS), and glutathione (GSH). Esterase is one of the biomarkers that has been used in the literature in different types of organisms to understand the effects of stressful conditions [29,30]; it performs the hydrolysis of the ester bond and is present in different forms for different substrates [31]. Alkaline phosphatase is a metalloenzyme that catalyzes the non-specific hydrolysis of phosphate monoesters [32] and, together with other enzymes, participates in the degradation of carbohydrates, proteins, and lipids and helps protect individuals from infections caused by pathogens [33,34]. Together, these two enzymes play a very important role in the evaluation of possible hepatic impairments of the organisms [35]. The mobilization or production of glucose is often made necessary to ensure an energy supply to the body to maintain homeostasis in the presence of stressful conditions [36,37]. This leads to an increase in glucose levels due to incorrect insulin signaling due to oxidative stress [38,39]. Its evaluation in circulation can be an important parameter as polyphenols can inhibit their absorption [18]. Peroxidases are parts of antioxidant enzymes and play a crucial role in the reduction of oxidative stress, as they are involved in the lowering of ROS levels in circulation, thus restoring redox homeostasis [40]. Measuring ROS levels is a useful parameter since these radical species increase under stress conditions and can create considerable oxidative damage by attacking cells and damaging lipids, proteins, and enzymes [41]. Finally, GSH levels are closely related to circulating peroxidase activity. High levels of GSH in the circulation may be indicative of an improvement in antioxidant defenses.
The aim of this study was to evaluate the effects of dietary supplementation using wine by-products on broiler chickens at different stages of growth (7, 21, and 42 days), fed with different percentages of grape pomace, grape seeds, and mixtures of the two through the evaluation of plasma levels of the biomarkers described above.
2. Materials and Methods
2.1. Grape-Seed and Pomace Flour Preparation
The pomace- and grape-seed-flour samples were obtained from red-wine-production waste obtained from the harvests carried out in September 2020. The wine variety was the “Sangiovese” grown in western Sicily (Italy) in organic and sunny conditions, with mild temperatures and moderate ventilation. The grape-seed and -pomace flour preparation was performed according to [6].
In the first phase, the obtained waste consisted of pomace, grape seeds, and stems which were sieved for separation. To reduce humidity levels, the grape seeds were dried at 24 °C for four days and then cold pressed (Cgoldenwall CAN-684) to remove any oil they contained. The defatted grape seeds were then ground to produce grape-seed flour. As for the pomace, this was instead dried at 55 °C for two days and ground to become a fine flour.
2.2. Experimental Plan
The pomace and grape-seed flours obtained were analyzed according to AOAC (2005) methods to define dry matter (DM) (AOAC method 934.01), crude protein (CP) (AOAC method 2001.11), ether extract (AOAC method 920.39), ash (AOAC method 942.05), and structural carbohydrates as aNDFom (neutral detergent fiber using heat-stable amylase and exclusive of residual ash) (AOAC method 2002.04). The non-structural carbohydrate (NSC, %) amount was calculated as [100 − (CP % + EE % + ash % + aNDFom %)] (Table 1).

Table 1.
Chemical composition (% DM) of pomace and grape-seed flour.
To investigate the effects of grape by-products in broilers, the experimental plan was extended from 0 to 42 days of age of the animals. Groups of 30,000 one-day-old chicks (Ross 308 strain) obtained from a commercial hatchery were transported to the Leocata Mangimi S.p.A. facilities to be housed for the growing phase. The animals, divided by sex, were placed on wheat-straw bedding and kept under constantly controlled light, temperature, and humidity conditions for the entire growing period. Access to water and food was ad libitum [42]. During the experiment, three different trials were applied to test nutritional programs from 0 to 42 days; in particular, standard diets were compared to diets including the grape by-products of pomace flour, grape-seed flour, and mixtures of pomace and grape-seed flours.
Animals were fed according to the nutrition specifications suggested by the genetic company [43]. According to these suggestions, each group received four different diets (formulated to meet the requirements for their stage of growth) during the growing phase: Pre-starter diets (1 to 11 days), Starter diets (11 to 24 days), Grower diets (25 to 39 days), and Finisher diets (40 to slaughter).
To investigate the effects of including grape pomace and grape seed in the diets, grape by-products were introduced at different percentages and combinations to the experimental groups in partial substitution of common dietary ingredients (corn, soybean meal, etc.). To obtain comparable diets among the groups, each feed period was formulated and optimized to obtain the same nutritional profile with respect to the standard diet (zero grape-by-product inclusion). Diets were formulated to be comparable in terms of energy, amino acids, and vitamins (Table 2, Table 3 and Table 4). Feed was formulated and produced at the Leocata Mangimi S.p.A. feed mill plant. According to this procedure, we defined three phases of experimentation.
Table 2.
Composition of diet supplemented using grape-pomace flour. All nutrients are expressed as % feed except selenium in ppm, vitamins in International Units (IU), and Amen in kcal/kg.
Table 3.
Composition of diet supplemented using grape-seed flour. All nutrients are expressed as % feed except selenium in ppm, vitamins in International Units (IU), and Amen in kcal/kg.
Table 4.
Composition of diet supplemented using grape-pomace and grape-seed flours. All nutrients are expressed as % feed except selenium in ppm, vitamins in International Units (IU), and Amen in kcal/kg.
In the first phase, grape-pomace evaluation, chickens were fed at three levels of grape-pomace inclusion:
- P0: 0% Pomace (control diet);
- P3: 3% Pomace (experimental diet);
- P6: 6% Pomace (experimental diet).
In the second phase, grape-seed evaluation, chickens were fed at three levels of grape seed inclusion:
- G0: 0% Grape seed (control diet);
- G3: 3% Grape seed (experimental diet);
- G6: 6% Grape seed (experimental diet).
In the third phase, simultaneous grape-pomace and grape-seed evaluation, chickens were fed at two levels of inclusion:
- P0G0: Pomace 0% + Grape seed 0% (control diet);
- P3G3: Pomace 3% + Grape seed 3% (experimental diet).
For each treatment, individuals were randomly selected and divided to achieve the desired stocking density using standard-sized fenced areas of standard dimensions inside the pen. Attention was paid not to exceed, until the slaughter of birds, the maximum stocking density established by European legislation.
In order to avoid variability due to the sex of the animals, all experimental measurements were carried out exclusively on male subjects. In detail, for pomace treatments 90 animals in total were used, 30 for P0, 30 for P3, and 30 for P6. For grape-seed treatment, 90 animals in total were also used, 30 for G0, 30 for G3, and 30 for G6. In the end, for the simultaneous treatment with grape-seed and pomace flour, two fenced areas were used with 60 animals in totals of 30 individuals for P0G0 and 30 for P3G3.
To evaluate animal growth, for each group (at 7, 21, 42 days), animals were weighed individually to record body weight. Average daily gain (ADG) was calculated using the difference between the final weight and the initial weight (at placement), divided by the number of days of life.
For each group, at 7, 21, and 42 days a random sample (10 for each age and for each treatment) of chickens were chosen for blood sampling. Blood sampling was performed using specific sampling tubes, using Ethylenediaminetetraacetic acid (EDTA) as an anticoagulant. Some drops of blood were collected from the base of the wing after disinfecting the sampling area. Subsequently, the samples were centrifuged at 1000× g for 10 min at 4 °C, and the supernatant was recovered for biochemical analyses.
2.3. Biochemical Assay
Six different biochemical evaluations were performed on the plasma supernatant obtained, specifically esterase, alkaline phosphatase, and peroxidase activity, glucose level, ROS level, and GSH content. Each assay was performed in three replicas. Esterase and alkaline phosphatase activities were evaluated according to the method in Ross et al. [44]. In detail, 50 μL of the sample was incubated with 50 μL of buffer (0.4 mM p-nitrophenyl-myristate substrate in 100 mM ammonium bicarbonate buffer containing 0.5% Triton X-100, pH 7.8, 30 °C for esterase, and 4 mM p-nitrophenyl liquid phosphate in 100 mM ammonium bicarbonate containing 1 mM MgCl2, pH 7.8, 30 °C for alkaline phosphatase) and Abs was evaluated for 1 h every five minutes at 405 nm.
Esterase and alkaline phosphatase activity were calculated according to the following formula:
with Eb =16.4 for esterase activity and Eb = 18.4 for alkaline phosphatase activity. The results were expressed in U/µg.
{(Abs/min) × (1000/Eb) × (Vf/Vi)},
Peroxidase activity was measured by modifying the Quade and Roth [45] method. In detail, 50 μL of each sample was incubated with 100 μL of TMB (3.3’, 5.5’ tetramethylbenzidine) (Sigma, Darmstadt, Germany), and the reaction was stopped after 30 min using an equal volume of sulfuric acid (2M). Then, the Abs was measured at 450 nm, and the results were expressed as unit U/μg. One unit of activity was defined as the amount of enzyme required to release 1 μmol of substrate produced in 1 min.
Glucose levels were evaluated in all samples in three replicas using Pic Gluco Test and test strips. One drop (approximately 0.3 µL) was used for each sample. The results were expressed in mg/dL.
ROS and GSH were measured with fluorescent dyes following the protocol of Bjedov et al. [46], previously developed for avian plasma with the contribution of minor methodological variations described below. Analysis was conducted using the Promega™ GloMax® Plate Reader (Milan, Italy) set at 485 nm excitation and 530 nm emission wavelengths. Each sample was measured in parallel and in triplicate by normalizing the samples on blank and autofluorescence controls. GSH content was evaluated with the use of CellTracker Green CMFDA dye (Thermo Fisher Scientific, Waltham, MA, USA, Cat. No. c2925). Briefly, 2 µL of the plasma sample was mixed with 93 µL phosphate buffer (0.1 M pH 7.2) and 5 µL of CellTracker Green CMFDA (10 µM in DMSO) working solution. The blank control was without plasma, while the autofluorescence control was without dye. Fluorescence was measured after an incubation of 30 min at room temperature in the dark, subtracting blank and autofluorescence controls from measured values. The ROS level was evaluated using CM-H2DCFDA dye (Thermo Fisher Scientific, Waltham, MA, USA, Cat. No. c6827). In short, 5 µL of the plasma sample was mixed with 85 µL phosphate buffer (0.1 M pH 7.2) and 10 µL of CM-H2DCFDA (10 µM in DMSO) working solution. The preparation of the blank control, autofluorescence sample, and incubation conditions were the same as those described above.
2.4. Statistical Analysis
Results were expressed as mean ± SD of n separate experiments conducted in triplicate. Statistical comparisons were performed using one-way analysis of variance (ANOVA), followed by Tukey’s correction for multiple comparisons using Prism 9.5.0 (GraphPad Software, San Diego, CA, USA). In all cases, significance was accepted if the null hypothesis was rejected at the p < 0.05 level.
3. Results
The results for esterase activity (Figure 1) evaluated in plasma showed a significant decrease only in animals fed for 21 and 42 days compared to the control. In detail, after 21 days (Figure 1B) the levels of enzymatic activity decreased significantly in animals fed with pomace only (P3, p < 0.05 and P6, p < 0.001) and with only grape seeds (G3, p < 0.05 and G6, p < 0.01), with more evident effects in animals fed with 6% of pomace (P6). In the animals fed with the mix of pomace and grape seeds, the levels of enzymatic activity decreased compared to the controls, although the results were not significant. In animals fed for 42 days (Figure 1C), enzyme levels decreased in all types of treatment compared to controls at the highest rates of administration. In detail, in the treatment with pomace significant decrease was observed at the highest percentages (P6, p < 0.001), while in the treatment with grape seed the results were significant at all treatment percentages (G3, p < 0.01 and G6, p < 0.001), with a greater effect at the highest percentages (G6). In the end, in the animals fed with the mix of pomace and grape seeds significant decrease were observed in the levels of enzymatic activity at highest percentages of treatment (P3G3, p < 0.001). No significant differences were found in any case when comparing the treatments with each other.
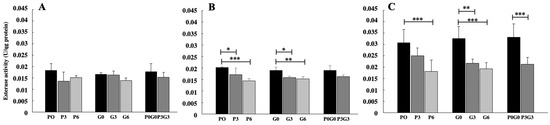
Figure 1.
Esterase activity evaluated in broiler-chicken plasma fed with pomace at different percentages (P0, P3, and P6), grape seed at different percentages (G0, G3, and G6), and a mix of pomace and grape seed at different percentages (P0G0 and P3G3) at three different experimental times: 7 days (A), 21 days (B), and 42 days (C). The data are expressed as mean ± SD. (*** p < 0.001, ** p < 0.01, * p < 0.05).
The different feeds administered to broiler chickens showed similar and greater effects than esterase on alkaline phosphatase activity levels (Figure 2). In fact, significant results were observed only after 21 and 42 days of treatment, with decreasing enzyme levels with respect to the control. However, in this case, after 21 days (Figure 2B) significant decreases were observed for all experimental feeds, in particular at highest percentages of treatment (P6, G6 and P3G3 p < 0.001). At 42 days (Figure 2C), the effects were minor with respect to the esterase activity; although, also in this case, enzymatic levels decreased with respect to the control for all types of diets administered and at the highest percentages of administration (P6, G6 an P3G3 p < 0.01). No significant differences were found in any case when comparing the treatments with each other.
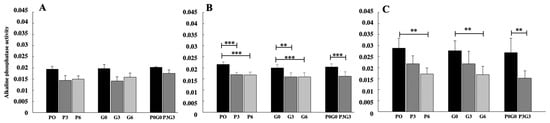
Figure 2.
Alkaline phosphate activity evaluated in broiler-chicken plasma fed with pomace at different percentages (P0, P3, and P6), grape seed at different percentages (G0, G3, and G6), and a mix of pomace and grape seed at different percentages (P0G0 and P3G3) at three different experimental times: 7 days (A), 21 days (B), and 42 days (C). The data are expressed as mean ± SD. (*** p < 0.001, ** p < 0.01).
Glucose levels (Figure 3) significantly decreased only after 42 days (Figure 3C) of feeding for all treatments in respect of the control (p < 0.001). In grape-seed treatment, significant differences were observed when comparing the two feed percentages (G3/G6, p < 0.01). Moreover, significant differences were observed when also comparing the highest percentages of treatment with grape seed and the mixture of pomace and grape seed (G6 and P3G3, p < 0.001). No significant differences were found in any case when comparing the treatments with each other.
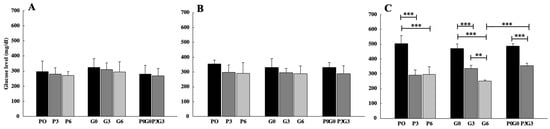
Figure 3.
Glucose levels evaluated in broiler-chicken plasma fed with pomace at different percentages (P0, P3, and P6), grape seed at different percentages (G0, G3, and G6), and a mix of pomace and grape seed at different percentages (P0G0 and P3G3) at three different experimental times: 7 days (A), 21 days (B), and 42 days (C). The data are expressed as mean ± SD. (*** p < 0.001, ** p < 0.01).
Peroxidase activity (Figure 4) showed a significant decrease with respect to the control only after 42 days (Figure 4C). The pomace flour significantly decreased peroxidase activity only at the highest percentage (P6, p < 0.01), while grape-seed flour significantly decreased enzymatic activity at all treatments percentages (G3, p < 0.05 and G6, p < 0.001). Significant decrease was observed, also, at the highest percentages of treatment with the mix of pomace and grape seed (P3G3, p < 0.01) In detail, the highest effect was observed when animals were fed using grape-seed flour at the higher percentage (P6). No significant differences were found in any case when comparing the treatments with each other.
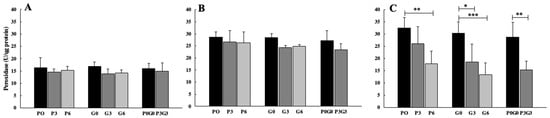
Figure 4.
Peroxidase activity evaluated in broiler-chicken plasma fed with pomace at different percentages (P0, P3, and P6), grape seed at different percentages (G0, G3, and G6), and a mix of pomace and grape seed at different percentages (P0G0 and P3G3) at three different experimental times: 7 days (A), 21 days (B), and 42 days (C). The data are expressed as mean ± SD. (*** p < 0.001, ** p < 0.01, * p < 0.05).
ROS level decreased for all treatments and at all experimental times, observing significant results only after 21 and 42 days of feeding (Figure 5). In particular, after 21 days (Figure 5B), ROS levels significantly decreased for all experimental feeds only at the highest percentage, in respect of the control (P6 and P3G3, p < 0.05; G6, p < 0.01). In detail, higher effects were observed in animals fed with the highest percentages of grape-seed flour (G6). After 42 days (Figure 5C), on the other hand, greater effects were observed in animals fed with pomace; in fact, ROS significantly decreased at both percentages of flour administered (P3, p < 0.05 and P6, p < 0.001) compared to the control. Regarding grape seed and mixed treatment, the ROS values decreased significantly only at the highest percentage compared to the control (G6, p < 0.01 and P3G3, p < 0.05). No significant differences were found in any case when comparing the treatments with each other.
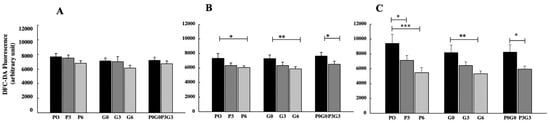
Figure 5.
ROS production measured in broiler-chicken plasma fed with pomace at different percentages (P0, P3, and P6), grape seed at different percentages (G0, G3, and G6), and a mix of pomace and grape seed at different percentages (P0G0 and P3G3) at three different experimental times: 7 days (A), 21 days (B), and 42 days (C). The data are expressed as mean ± SD. (*** p < 0.001, ** p < 0.01, * p < 0.05).
GSH content (Figure 6) increased at all experimental times and for all experimental feedings with respect to the control. In particular, we observed a significant increase of GSH after 7 days (Figure 6A) in animals fed with grape-seed flour at highest percentages of administration (G6, p < 0.01). Moreover, significant increase was observed when comparing the grape-seed treatment (G3 and G6, p< 0.05). After 21 days (Figure 6B), on the other hand, GSH production increased for all experimental feeds but only at the higher percentages of administration (P6 and P3G3, p < 0.05; G6, p < 0.01), with more obvious effects in animals fed using grape-seed flour (G6). In the end, after 42 days (Figure 6C), GSH levels increased more than at all previous experimental feedings and only at the higher percentages of administration (P6, G6, and P3G3, p < 0.01).
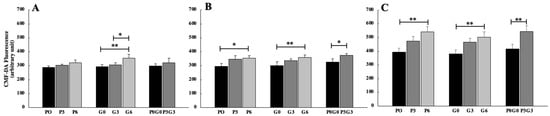
Figure 6.
Evaluation of GSH in broiler-chicken plasma fed with pomace at different percentages (P0, P3, and P6), grape seed at different percentages (G0, G3, and G6), and a mix of pomace and grape seed at different percentages (P0G0 and P3G3) at three different experimental times: 7 days (A), 21 days (B), and 42 days (C). The data are expressed as mean ± SD (** p < 0.01, * p < 0.05).
No difference was observed in this case between different experimental feeds. No significant differences were found in any case when comparing the treatments with each other.
The weight trend in all three experiments and among the treatments were evaluated (Table 5) and was very similar. Although some differences were recorded during the growth phase (p < 0.05) and at 42-day weights, in phase 3, no differences were found, and, in phases 1 and 2, there were some differences between treatments but no effect on dose/response of the by-products included for weight.
Table 5.
Weight trend in all experiments and treatments.
4. Discussion
The results obtained in this study demonstrate that wine-production by-products have the potential to improve certain blood parameters of farmed broiler chickens. In particular, improvements depend on the type of by-products considered, the combination of different types, the percentage administered, and the growth phase of the animals. Thus, in agreement with Cao et al. [39], phenolic feed supplements have the potential to improve blood parameters of these animals without affecting their production performance, which has been evaluated over all life phases. In fact, weight trends in all three experiments and among the treatments were very similar. This leads to the conclusion that animal performance was not affected by the inclusion of grape by-products. The decrease of both enzymes of the hydrolase class analyzed in plasma samples in this study highlights that the flours obtained from wine-production waste can improve the liver function of the organisms examined [35]. In fact, elevated levels of these enzymes could normally be used as indicators of liver damage [39]. These results are in agreement, for example, with Hossein-Vashan et al. [35] who demonstrated that in conditions of heat stress liver enzyme levels can increase but, at the same time, decrease in conditions of reduced hepatic stress also due to dietary supplementation. In addition, El-Kelawy et al. [47] showed a decrease in enzyme levels in grape-seed-fed broiler chickens, confirming that this could be directly attributed to the presence of polyphenols and their known antioxidant properties [17,18]. Furthermore, the different results obtained at the different life stages indicate and highlight how the nutritional intake of these organisms must be different according to their growth stage, and how the intake of these additional elements must be calibrated depending on the latter.
Plasma glucose levels decreased in treated individuals compared with controls after 42 days and especially in individuals fed grape-seed flour. This finding is in agreement with Hajati et al. [18] and Maghrani et al. [48], who observed that plant extracts with a high flavonoid content inhibit the renal reabsorption of glucose through the inhibition of sodium–glucose sympathizers located in the proximal renal tubule. This could confirm a beneficial effect exerted by flavonoids on hypoglycemic and hepatic action of liver glucokinase. In conditions of stress, blood glucose levels could, in fact, increase due to the production of glucose used to supply the energy necessary to maintain or restore homeostasis [36,37]. Indeed, insulin response is, for example, impaired under conditions of oxidative stress, but polyphenols have the potential to reverse this type of alteration by restoring the signaling mechanisms of insulin production [38,49,50,51]. Furthermore, the reduction in plasma glucose levels may depend on the ability of flavonoids to reduce intestinal absorption through the inhibitory action on the transporters involved [52,53,54,55,56]. It cannot be excluded that any proanthocyanidin content may increase insulin levels, contributing to blood glucose regulation [57], or that polyphenolic compounds, by inhibiting carbohydrate digestion and glucose absorption in the intestine, may stimulate insulin secretion from pancreatic β-cells, modulating glucose release from the liver [58]. Finally, if we focus on antioxidant parameters, our results showed a decrease of peroxidase enzyme activity, lowered ROS levels, and a reduction of GSH depletion with an increase in fed animals compared to the control, with greater effects after 42 days.
The flours evaluated influenced different parameters in different ways; in fact, peroxidase levels were influenced more by grape-seed flour, while ROS levels were more impacted by pomace flour. On the other hand, all feeds influenced GSH content in the same way. The reduction in ROS levels was probably due to the biological function of the phenolic compounds contained in the flours which show natural antioxidant activity and have the ability to protect the intestinal mucosa from oxidative damage and pathogens [59]. This confirms that polyphenols were absorbed at levels sufficient to modulate antioxidant activity in the tested animals [8,60,61].
Moreover, it has been observed that wine-production by-products contain catechin, epicatechin, gallic acid, and proanthocyanidins which have strong radical-scavenging activity [8,62]. In confirmation of this, decreases in the levels of unstimulated peroxidase enzyme activity were in fact observed given the reduction in ROS levels caused by the action of the natural antioxidants present in the supplemented feed. However, it cannot be excluded that the decrease in the levels of enzymes of the peroxidase class may also depend on the concentration of the by-products administered and, consequently, on the polyphenol content. In fact, in other studies, no significant changes in antioxidant capacity were found nor were there observed decreases in plasma enzyme levels [2,63]. The enzymatic responses are, therefore, strictly dependent and conditioned by the type of by-product, the concentration administered, and the method of preparation and treatment of the by-product before administration [16,64,65,66].
In the end, the observed increases in GSH levels could be due to the action of both polyphenols and flavonoids, which are active compounds that act as effective antioxidants and increase resistance against oxidative stress by activating the antioxidant enzyme system [15,67,68]. The variations observed in GSH levels are in agreement with several authors who tested the effects of by-products at different concentrations on broilers [16,61,69]. In light of our results, it is evident that the flours obtained from wine by-products have considerable potential to improve certain blood parameters of farmed chickens, both individually and in combination, at different percentages, and based on the time of absorption. Furthermore, it cannot be excluded that animals kept in intensive farms may be subject to minimal stress conditions, which are further reduced by feed supplemented with pomace and grape-seed flours. This could be demonstrated with future studies by analyzing animals which are not kept in breeding conditions and are fed with flour obtained from wine by-products.
5. Conclusions
The results of this study highlight how the by-products of wine production can be reused in the context of feeding broiler chickens, contributing to the reduction of the economic and environmental damage that they can cause. All the by-products evaluated in this study showed evident antioxidant potentiality, depending on the concentration of administration, the growth phase in which they were administered, and whether they were administered alone or in a mixture. The most prevalent effects were determined as those from grape-seed flour after 42 days of administration. From our results, we can conclude that all the by-products of wine production are very important resources and can be reused in formulating different diets, at different percentages, based on the growth stage of the animal.
Author Contributions
Conceptualization, M.M., M.V., E.G., A.F. and V.A.; methodology, M.M., I.R., A.A., R.B., E.C., S.S., S.R., D.D., C.G., G.B., A.D.G., P.B. and V.D.S.; software, M.M., M.V. and A.A.; validation, M.M., M.V., A.V., L.T. and A.D.G.; formal analysis M.M., M.V., A.A. and I.R.; investigation, M.M., M.V., A.A. and I.R.; resources, V.A.; data curation, M.M., M.V., A.A., I.R. and A.D.G.; writing—original draft preparation, M.M., M.V., A.A. and A.D.G.; writing—review and editing, M.V., A.F., L.T. and V.A.; visualization, V.A.; supervision, M.V., A.A. and V.A.; project administration, A.F. and V.A.; funding acquisition, V.A. All authors have read and agreed to the published version of the manuscript.
Funding
This research was funded by Project 2017-NAZ-0246 CUP: G18I17000160007: “CoSMetici dalla fILiera vitIviNicola bioloGica—SMILING” PO FESR Action 1.1.5 “Sostegno all’avanzamento tecnologico delle imprese attraverso il finanziamento di linee pilota e azioni di validazione precoce dei prodotti e di dimostrazione su larga scala”—Department of Productive Activities, Region of Sicily and funded with the “Programma operativo del fondo europeo sviluppo regionale 2014–2020 della Regione Siciliana”. Moreover, this publication was created thanks to co-financing from the European Union—FESR o FSE, PON Research and Innovation 2014–2020—DM 1062/2021.
Institutional Review Board Statement
Not applicable.
Informed Consent Statement
Not applicable.
Data Availability Statement
Data not shared for privacy, contact the authors.
Acknowledgments
Leocata Mangimi S.p.A., C.da Pennino Catanzaro Van 162 n. 2/A 97015 Modica, Italy, is acknowledged for their support provided.
Conflicts of Interest
The authors declare no conflict of interest.
References
- Hübner, A.A.; Demarque, D.P.; Lourenço, F.R.; Rosado, C.; Baby, A.R.; Kikuchi, I.S.; Bacchi, E.M. Phytocompounds Recovered from the Waste of Cabernet Sauvignon (Vitis vinifera L.) Vinification: Cytotoxicity (in Normal and Stressful Conditions) and In Vitro Photoprotection Efficacy in a Sunscreen System. Cosmetics 2023, 10, 2. [Google Scholar] [CrossRef]
- Pascariu, S.; Pop, I.; Simeanu, D.; Pavel, G.; Solcan, C. Effects of wine by-products on growth performance, complete blood count and total antioxidant status in broilers. Rev. Bras. Ciênc. Avíc. 2017, 19, 191–202. [Google Scholar] [CrossRef]
- Makris, D.P.; Boskou, G.; Andrikopoulos, N.K. Polyphenolic Content and in vitro Antioxidant Characteristics of Wine Industry and Other Agri-Food Solid Waste Extracts. J. Food Compos. Anal. 2007, 20, 125–132. [Google Scholar] [CrossRef]
- Iqbal, A.; Schulz, P.; Rizvi, S.S.H. Valorization of Bioactive Compounds in Fruit Pomace from Agro-Fruit Industries: Present Insights and Future Challenges. Food Biosci. 2021, 44, 101384. [Google Scholar] [CrossRef]
- Di Stefano, V.; Bongiorno, D.; Buzzanca, C.; Indelicato, S.; Santini, A.; Lucarini, M.; Durazzo, A. Fatty acids and triacylglycerols profiles from sicilian (cold pressed vs. soxhlet) grape seed oils. Sustainability 2021, 13, 13038. [Google Scholar] [CrossRef]
- Di Stefano, V.; Buzzanca, C.; Melilli, M.G.; Indelicato, S.; Mauro, M.; Vazzana, M.; Bongiorno, D. Polyphenol characterization and antioxidant activity of grape seeds and skins from sicily: A preliminary study. Sustainability 2022, 14, 6702. [Google Scholar] [CrossRef]
- Nichols, J.A.; Katiyar, S.K. Skin Photoprotection by Natural Polyphenols: Anti-Inflammatory, Antioxidant and DNA Repair Mechanisms. Arch. Dermatol. Res. 2010, 302, 71–83. [Google Scholar] [CrossRef] [PubMed]
- Adámez, J.D.; Samino, E.G.; Sánchez, E.V.; González-Gómez, D. In vitro estimation of the antibacterial activity and antioxidant capacity of aqueous extracts from grape- seeds (Vitis vinifera L.). Food Control 2012, 24, 136–141. [Google Scholar] [CrossRef]
- Gasparrini, M.; Forbes-Hernandez, T.Y.; Afrin, S.; Reboredo-Rodriguez, P.; Cianciosi, D.; Mezzetti, B.; Quiles, J.L.; Bompadre, S.; Battino, M.; Giampieri, F. Strawberry-Based Cosmetic Formulations Protect Human Dermal Fibroblasts against UVA-Induced Damage. Nutrients 2017, 9, 605. [Google Scholar] [CrossRef]
- Hübner, A.; Sobreira, F.; Neto, A.V.; de Oliviera Pinto, C.A.S.; Dario, M.F.; Díaz, I.E.C.; Lourenço, F.R.; Rosado, C.; Baby, A.R.; Bacchi, E.M. The synergistic behavior of antioxidant phenolic compounds obtained from winemaking waste’s valorization, increased the efficacy of a sunscreen system. Antioxidants 2019, 8, 530. [Google Scholar] [CrossRef]
- Hübner, A.A.; Sarruf, F.D.; Oliveira, C.A.; Neto, A.V.; Fischer, D.C.H.; Kato, E.T.M.; Lourenço, F.R.; Baby, A.R.; Bacchi, E.M. Safety and photoprotective efficacy of a sunscreen system based on grape pomace (Vitis vinifera L.) Phenolics from Winemaking. Pharmaceutics 2020, 12, 1148. [Google Scholar] [CrossRef] [PubMed]
- Abbasi-Parizad, P.; de Nisi, P.; Scaglia, B.; Scarafoni, A.; Pilu, S.; Adani, F. Recovery of phenolic compounds from agro-industrial by-products: Evaluating antiradical activities and immunomodulatory properties. Food Bioprod. Process. 2021, 127, 338–348. [Google Scholar] [CrossRef]
- Venkitasamy, C.; Zhao, L.; Zhang, R.; Pan, Z. Grapes. In Integrated Processing Technologies for Food and Agricultural by-Products; Pan, Z., Zhang, R., Zicari, S., Eds.; Elsevier: Amsterdam, The Netherlands, 2019; Volume 2, pp. 133–163. [Google Scholar]
- Gaglio, R.; Barbaccia, P.; Barbera, M.; Restivo, I.; Attanzio, A.; Maniaci, G.; Di Grigoli, A.; Francesca, N.; Tesoriere, L.; Bonanno, A.; et al. The use of winery by-products to enhance the functional aspects of the fresh ovine “primosale” cheese. Foods 2021, 10, 461. [Google Scholar] [CrossRef] [PubMed]
- Abu Hafsa, S.H.; Ibrahim, S.A. Effect of dietary polyphenol-rich grape seed on growth performance, antioxidant capacity and ileal microflora in broiler chicks. J. Anim. Physiol. Anim. Nutr. 2018, 102, 268–275. [Google Scholar] [CrossRef] [PubMed]
- Gungor, E.; Altop, A.; Erener, G. Effect of raw and fermented grape seed on growth performance, antioxidant capacity, and cecal microflora in broiler chickens. Animal 2021, 15, 100194. [Google Scholar] [CrossRef] [PubMed]
- Carpenter, R.; O’Grady, M.N.; O’Callaghan, Y.C.; O’Brien, N.M.; Kerry, J.P. Evaluation of the antioxidant potential of grape seed and bearberry extracts in raw and cooked pork. Meat Sci. 2007, 76, 604–610. [Google Scholar] [CrossRef] [PubMed]
- Hajati, H.; Hassanabadi, A.; Golian, A.; Nassiri-Moghaddam, H.; Nassiri, M.R. The effect of grape seed extract and vitamin C feed supplementation on some blood parameters and HSP70 gene expression of broiler chickens suffering from chronic heat stress. Ital. J. Anim. Sci. 2015, 14, 3273. [Google Scholar] [CrossRef]
- Demirkaya, E.; Avci, A.; Kesik, V.; Karslioglu, Y.; Oztas, E.; Kismet, E.; Gokcay, E.; Durak, I.; Koseoglu, V. Cardioprotective roles of aged garlic extract, grape seed proanthocyanidin, and hazelnut on doxorubicin-induced cardiotoxicity. Can. J. Physiol. Pharmacol. 2009, 87, 633–640. [Google Scholar] [CrossRef]
- Ahn, S.H.; Kim, H.J.; Jeong, I.; Hong, Y.J.; Kim, M.J.; Rhie, D.J.; Jo, Y.H.; Hahn, S.J.; Yoon, S.H. Grape seed proanthocyanidin extract inhibits glutamate-induced cell death through inhibition of calcium signals and nitric oxide formation in cultured rat hippocampal neurons. BMC Neurosci. 2011, 12, 78. [Google Scholar] [CrossRef]
- Ouédraogo, M.; Charles, C.; Ouédraogo, M.; Guissou, I.P.; Stévigny, C.; Duez, P. An overview of cancer chemopreventive potential and safety of proanthocyanidins. Nutr. Cancer 2011, 73, 63–1163. [Google Scholar] [CrossRef]
- Sayin, V.I.; Ibrahim, M.X.; Larsson, E.; Nilsson, J.A.; Lindahl, P.; Bergo, M.O. Antioxidants accelerate lung cancer progression in mice. Sci. Transl. Med. 2014, 6, 221ra15. [Google Scholar] [CrossRef] [PubMed]
- Mauro, M.; Arizza, V.; Arculeo, M.; Attanzio, A.; Pinto, P.; Chirco, P.; Badalamenti, G.; Tesoriere, L.; Vazzana, M. Haemolymphatic Parameters in Two Aquaculture Crustacean Species Cherax destructor (Clark, 1836) and Cherax quadricarinatus (Von Martens, 1868). Animals 2022, 12, 543. [Google Scholar] [CrossRef] [PubMed]
- Farahat, M.H.; Abdallah, F.M.; Ali, H.A.; Hernandez-Santana, A. Effect of dietary supplementation of grape seed extract on the growth performance, lipid profile, antioxidant status and immune response of broiler chickens. Animal 2017, 11, 771–777. [Google Scholar] [CrossRef] [PubMed]
- Erinle, T.J.; Oladokun, S.; MacIsaac, J.; Rathgeber, B.; Adewole, D. Dietary grape pomace–effects on growth performance, intestinal health, blood parameters, and breast muscle myopathies of broiler chickens. Poult. Sci. 2022, 101, 101519. [Google Scholar] [CrossRef]
- Brenes, A.; Viveros, A.; Chamorroa, S.; Arija, I. Use of polyphenol-rich grape by- products in monogastric nutrition. Anim. Feed Sci. Technol. 2016, 211, 1–17. [Google Scholar] [CrossRef]
- Muñoz-González, I.; Chamorro, S.; Pérez-Jiménez, J.; López-Andrés, P.; Álvarez-Acero, I.; Herrero, A.M.; Ruiz-Capillas, C. Phenolic metabolites in plasma and thigh meat of chickens supplemented with grape byproducts. J. Agric. Food Chem. 2019, 67, 4463–4471. [Google Scholar] [CrossRef] [PubMed]
- Choi, J.; Kim, W.K. Dietary application of tannins as a potential mitigation strategy for current challenges in poultry production: A review. Animals 2020, 10, 2389. [Google Scholar] [CrossRef]
- Vazzana, M.; Ceraulo, M.; Mauro, M.; Papale, E.; Dioguardi, M.; Mazzola, S.; Arizza, V.; Chiaramonte, M.; Buscaino, G. Effects of acoustic stimulation on biochemical parameters in the digestive gland of Mediterranean mussel Mytilus galloprovincialis (Lamark, 1819). J. Acoust. Soc. Am. 2020, 147, 2414–2422. [Google Scholar] [CrossRef]
- Mauro, M.; Pinto, P.; Settanni, L.; Puccio, V.; Vazzana, M.; Hornsby, B.L.; Arizza, V. Chitosan film functionalized with grape seed oil—Preliminary evaluation of antimicrobial activity. Sustainability 2022, 14, 5410. [Google Scholar] [CrossRef]
- Hannam, M.L.; Hagger, J.A.; Jones, M.B.; Galloway, T.S. Characterisation of esterases as potential biomarkers of pesticide exposure in the lugworm Arenicola marina (Annelida: Polychaeta). Environ. Pollut. 2008, 152, 342–350. [Google Scholar] [CrossRef]
- Zhang, M.; Wang, L.; Guo, Z.Y.; Wang, B.J. Effect of lipopolysaccharide and Vibrio anguillarum on the activities of phosphatase, superoxide dismutase and the content of hemocyanin in the serum of Fenneropenaeus chinensis. Mar. Sci. 2004, 28, 22–25. [Google Scholar]
- Ottaviani, E. Composition of the serum haemolymph of Planorbis corneus (Gastropoda, Pulmonata). Comp. Biochem. Physiol. 1984, 78, 227–239. [Google Scholar] [CrossRef]
- Xue, Q.; Renault, T. Enzymatic activities in European flat oyster, Ostrea edulis, and Pacific oyster, Crassostrea gigas, haemolymph. J. Invertebr. Pathol. 2000, 76, 155–163. [Google Scholar] [CrossRef] [PubMed]
- Hosseini-Vashan, S.J.; Golian, A.; Yaghobfar, A.; Zarban, A.; Afzali, N.; Esmaeilinasab, P. Antioxidant status, immune system, blood metabolites and carcass characteristic of broiler chickens fed turmeric rhizome powder under heat stress. Afr. J. Biotechnol. 2012, 11, 16118–16125. [Google Scholar]
- Puvadolpirod, S.; Thaxton, J.P. Model of physiological stress in chickens. Response parameters. Poult. Sci. 2000, 79, 363–369. [Google Scholar] [CrossRef]
- Virden, W.S.; Kidd, M.T. Physiological stress in broilers: Ramifications on nutrient digestibility and responses. J. Appl. Poult. Res. 2009, 18, 338–347. [Google Scholar] [CrossRef]
- Rudich, A.; Tirosh, A.; Potashnik, R.; Hemi, R.; Kanety, H.; Bashan, N. Prolonged oxidative stress impairs insulin-induced GLUT4 translocation in 3T3-L1 adipocytes. Diabetes 1998, 47, 1562–1569. [Google Scholar] [CrossRef]
- Cao, G.; Zeng, X.; Liu, J.; Yan, F.; Xiang, Z.; Wang, Y.; Tao F and Yang, C. Change of serum metabolome and cecal microflora in broiler chickens supplemented with grape seed extracts. Front. Immunol. 2020, 11, 610934. [Google Scholar] [CrossRef]
- Livingstone, D.R. Oxidative stress in aquatic organisms in relation to pollution and aquaculture. Rev. Med. Vet. 2003, 154, 427–430. [Google Scholar]
- Satyam, S.M.; Bairy, L.K.; Pirasanthan, R.; Vaihnav, R.L. Grape seed extract and zinc containing nutritional food supplement decreases the oxidative stress induced by carbon tetrachloride in rats. Int. J. Pharmacol. Pharm. Sci. 2013, 5, 626–631. [Google Scholar]
- Broiler, R. Management Handbook; Aviagen: Huntsville, AL, USA, 2018. [Google Scholar]
- Broiler, R. Nutrition Specifications; Aviagen: Huntsville, AL, USA, 2019. [Google Scholar]
- Ross, N.W.; Firth, K.J.; Wang, A.; Burka, J.F.; Johnson, S.C. Changes in hydrolytic enzyme activities of naïve Atlantic salmon Salmo salar skin mucus due to infection with the salmon louse Lepeophtheirus salmonis and cortisol implantation. Dis. Aquat. Org. 2000, 41, 43–51. [Google Scholar] [CrossRef] [PubMed]
- Quade, M.J.; Roth, J.A. A rapid, direct assay to measure degranulation of bovine neutrophil primary granules. Vet. Immunol. Immunopathol. 1997, 58, 239–248. [Google Scholar] [CrossRef] [PubMed]
- Bjedov, D.; Mikuška, A.; Lackmann, C.; Begović, L.; Mikuška, T.; Velki, M. Application of Non-Destructive Methods: Biomarker Assays in Blood of White Stork (Ciconia ciconia) Nestlings. Animals 2021, 11, 2341. [Google Scholar] [CrossRef] [PubMed]
- El-Kelawy, M.I.; ELnaggar, A.S.; Abdelkhalek, E. Productive performance, blood parameters and immune response of broiler chickens supplemented with grape seed and medicago sativa as natural sources of polyphenols. Egypt. Poult. Sci. J. 2018, 38, 269–288. [Google Scholar]
- Maghrani, M.; Michel, J.B.; Eddouks, M. Hypoglycaemic activity of Retama raetam in rats. Phytother. Res. 2005, 19, 125–128. [Google Scholar] [CrossRef] [PubMed]
- Werner, E.D.; Lee, J.; Hansen, L.; Yuan, M.; Shoelson, S.E. Insulin resistance due to phosphorylation of insulin receptor substrate-1 at serine 302. J. Biol. Chem. 2004, 279, 35298–35305. [Google Scholar] [CrossRef]
- Tanti, J.F.; Gual, P.; Gremeaux, T.; Gonzalez, T.; Barres, R.; Le Marchand-Brustel, Y. Alteration in insulin action: Role of IRS-1 serine phosphorylation in the retroregulation of insulin signalling. Ann. Endocrinol. Paris 2004, 65, 43–48. [Google Scholar] [CrossRef]
- Hininger-Favier, I.; Benaraba, R.; Coves, S.; Anderson, R.A.; Roussel, A.M. Green tea extract decreases oxidative stress and improves insulin sensitivity in an animal model of insulin resistance, the fructose-fed rat. J. Am. Coll. Nutr. 2009, 28, 355–361. [Google Scholar] [CrossRef]
- Drozdowski, L.A.; Thomson, A.B.R. Intestinal sugar transport. World J. Gastroenterol. 2006, 12, 1657–1670. [Google Scholar] [CrossRef]
- Hossain, S.J.; Kato, H.; Aoshima, H.; Yokoyama, T.; Yamada, M.; Hara, Y. Polyphenol-induced inhibition of the response of Na+/glucose cotransporter expressed in Xenopus oocytes. J. Agric. Food Chem. 2002, 50, 5215–5219. [Google Scholar] [CrossRef]
- Cermak, R.; Landgraf, S.; Wolffram, S. Quercetin glucosides inhibit glucose uptake into brush-border-membrane vesicles of porcine jejunum. Br. J. Nutr. 2004, 91, 849–855. [Google Scholar] [CrossRef] [PubMed]
- Aoshima, H.; Okita, Y.; Hossain, S.J.; Fukue, K.; Mito, M.; Orihara, Y.; Yokoyama, T.; Yamada, M.; Kumagai, A.; Nagaoka, Y.; et al. Effect of 3-O-octanoyl-(+)-catechin on the responses of GABA (A) receptors and Na+/glucose cotransporters expressed in xenopus oocytes and on the oocyte membrane potential. J. Agric. Food Chem. 2005, 53, 1955–1959. [Google Scholar] [CrossRef] [PubMed]
- Kwon, O.; Eck, P.; Chen, S.; Corpe, C.P.; Lee, J.H.; Kruhlak, M.; Levine, M. Inhibition of the intestinal glucose trans- porter GLUT2 by flavonoids. FASEB J. 2007, 21, 366–377. [Google Scholar] [CrossRef]
- Ding, Y.; Zhang, Z.; Dai, X.; Jiang, Y.; Bao, L.; Li, Y.; Li, Y. Grape seed proanthocyani- dins ameliorate pancreatic beta-cell dysfunction and death in low-dose strepto- zotocin- and high-carbohydrate/high-fat diet-induced diabetic rats partially by regulating endoplasmic reticulum stress. Nutr. Metab. 2013, 10, 51. [Google Scholar] [CrossRef] [PubMed]
- Hanhineva, K.; Torronen, R.; Bondia-Pons, I.; Pekkinen, J.; Kolehmainen, M.; Mykkanen, H.; Poutanen, K. Impact of dietary polyphenols on carbohydrate metabolism. Int. J. Mol. Sci. 2010, 11, 1365–1402. [Google Scholar] [CrossRef]
- Kermauner, A.; Laurenčič, A. Supplementation of rabbit diet with chestnut wood extract: Effect on in vitro gas production from two sources of protein. In Proceedings of the 9th World Rabbit Congress, Verona, Italy, 10–13 June 2008; pp. 689–693. [Google Scholar]
- Goñi, I.; Brenes, A.; Centeno, C.; Viveros, A.; Sauracalixto, F.; Rebolé, A.; Estévez, R. Effect of dietary grape pomace and vitamin E on growth performance, nutrient digestibility and susceptibility to meat lipid oxidation in chickens. Poult. Sci. 2007, 47, 581–591. [Google Scholar]
- Brenes, A.; Viveros, A.; Goñi, I.; Centeno, C.; Sáyago-Ayerdi, S.G.; Arija, I.; Saura-Calixto, F. Effect of grape pomace concentrate and vitamin E on digestibility of polyphenols and antioxidant activity in chickens. Poult. Sci. 2008, 87, 307–316. [Google Scholar] [CrossRef]
- Hajati, H.; Hassanabadi, A.; Golian, A.; Nassiri-Moghaddam, H.; Nassiri, M. The effect of grape seed extract supplementation on performance, antioxidant enzyme activity, and immune responses in broiler chickens exposed to chronic heat stress. Iran. J. Appl. Anim. Sci. 2018, 8, 109–117. [Google Scholar]
- Rodríguez-Ortega, T.; Bernués, A.; Olaizola, A.M.; Brown, M.T. Does intensification result in higher efficiency and sustainability? An emergy analysis of Mediterranean sheep-crop farming systems. J. Clean. Prod. 2017, 144, 171–179. [Google Scholar] [CrossRef]
- García, I.G.; Peña, P.J.; Venceslada, J.B.; Martín, A.M.; Santos, M.M.; Gómez, E.R. Removal of phenol compounds from olive mill wastewater using Phanerochaete chrysosporium, Aspergillus niger, Aspergillus terreus and Geotrichum candidum. Process Biochem. 2000, 35, 751–758. [Google Scholar] [CrossRef]
- Yilmaz, Y.; Toledo, R.T. Major flavonoids in grape seeds and skins: Antioxidant capacity of catechin, epicatechin, and gallic acid. J. Agric. Food Chem. 2004, 52, 255–260. [Google Scholar] [CrossRef] [PubMed]
- Zhang, X.; Sun, Z.; Cao, F.; Ahmad, H.; Yang, X.; Zhao, L.; Wang, T. Effects of dietary supplementation with fermented ginkgo leaves on antioxidant capacity, intestinal morphology and microbial ecology in broiler chicks. Br. Poult. Sci. 2015, 56, 370–380. [Google Scholar] [CrossRef]
- Alía, M.; Horcajo, C.; Bravo, L.; Goya, L. Effect of grape antioxidant dietary fiber on the total antioxidant capacity and the activity of liver antioxidant enzymes in rats. Nutr. Res. 2003, 23, 1251–1267. [Google Scholar] [CrossRef]
- Fawzia, A.H.; Khalid, M.; Basyony, M.M. Influence of grape seeds powder as a natural Antioxidant on growth performance, an- tioxidant Status and carcass characteristics of rabbits under hot conditions. In Proceedings of the International Conference on Rabbit Production in Hot Climate, Marsa Alam, Egypt, 8–12 September 2014; pp. 395–412. [Google Scholar]
- Yang, J.; Zhang, H.; Wang, J.; Wu, S.; Yue, H.; Jiang, X.; Qi, G. Effects of dietary grape proanthocyanidins on the growth performance, jejunum morphology and plasma biochemical indices of broiler chicks. Animal 2021, 11, 762–770. [Google Scholar] [CrossRef] [PubMed]
Disclaimer/Publisher’s Note: The statements, opinions and data contained in all publications are solely those of the individual author(s) and contributor(s) and not of MDPI and/or the editor(s). MDPI and/or the editor(s) disclaim responsibility for any injury to people or property resulting from any ideas, methods, instructions or products referred to in the content. |
© 2023 by the authors. Licensee MDPI, Basel, Switzerland. This article is an open access article distributed under the terms and conditions of the Creative Commons Attribution (CC BY) license (https://creativecommons.org/licenses/by/4.0/).