Abstract
Since the beginning of the 21st Century, Europe has been affected by destructive floods. European Union Member States have an obligation to develop flood hazard and flood risk maps as support to the Flood Risk Management Plan (FRMP). The main objective of this study is to propose a methodological framework for hazard and risk assessment of pluvial flash floods in Croatia at the catchment level, which can be integrated into the FRMP. Therefore, a methodology based on the source–pathway–consequence approach for flood risk assessment is presented, which complies with the EU Floods Directive. This integrated and comprehensive methodology is based on high-resolution open data available for EU Member States. Three scenarios are defined for a low, medium, and high probability, defined by design storms of different durations. The proposed methodology consists of flood hazard analysis, vulnerability assessment, and risk analysis. Pluvial flash flood hazards are analyzed using a 2D hydrologic–hydraulic model. The flood vulnerability assessment consists of a GIS analysis to identify receptors potentially at risk of flooding and an assessment of susceptibility to potential flood damage using depth–damage curves. Flood risk is assessed both qualitatively in terms of risk levels and quantitatively in terms of direct damages expressed in monetary terms. The developed methodology was applied and tested in a case study in the Gospić catchment in Croatia, which surrounds a small rural town frequently affected by pluvial flash floods.
1. Introduction
Between 1995 and 2015, floods accounted for 43% of all documented natural disasters, affecting 2.3 billion people worldwide and causing USD billions in damage [1]. Total economic damages caused by weather- and climate-related extremes in the European Economic Area (EEA) amounted to more than EUR 433 billion in the period 1980–2015, with the largest share of economic impacts (38%) caused by floods [2,3]. Furthermore, extreme flooding in Europe between 1998 and 2009 caused more than 1100 deaths and the displacement of about one million people [4].
The most catastrophic flood events are caused by extreme rainfall, but the consequences of flooding are also exacerbated by inefficient river regulation measures, deforestation, and (unplanned) urbanization in floodplain areas [5]. Over the years, many communities in the EU have been affected by some form of flooding. Recognizing that flood impacts and damages are likely to increase in the near future due to climate variability and change, increased urbanization, and migration trends [6,7,8,9], awareness of the importance of flood risk management plans (FRMP) to mitigate the consequences of flooding has increased [10,11,12].
The best-known example of an international document that refers to flood risk management plans is the EU Floods Directive (FD) (2007/60/EC, 2007) [13,14]. The main objective of the FD is to assess, reduce, and manage the risks that floods pose to human health and life, the environment, cultural heritage, and economic activities in the European Union (EU). The FD requires all EU Member States to undertake a preliminary flood risk assessment (PFRA) of their river basins and coastal areas to identify areas where there is a potentially significant flood risk [13,14]. They must also prepare and develop flood hazard maps, flood risk maps, and flood risk management plans (FRMPs) for these areas. These steps must be reviewed every six years in a cycle that is coordinated and synchronized with the Water Framework Directive (2000/60/EC, 2000) implementation cycle. Lessons from implementing the FD in EU countries have been reported over the last ten years [15,16,17,18,19,20].
This study focused on pluvial flash flooding (PFF), which can be broadly defined as rapid flooding caused by heavy rainfall [21,22]. These floods have fundamentally different characteristics than fluvial floods because they can occur away from large rivers and develop over a short period of time, usually less than six hours [21,22,23]. More specifically, PFF results from rainfall-generated overland flow before runoff enters a watercourse, drainage system, or sewer system or cannot enter because the network is overloaded [24,25,26]. Pluvial flash floods are among the most-common and -destructive natural hazards, causing significant direct losses (e.g., personal injury and property damage) and increasing indirect impacts (e.g., disruption of public services and economic activities) [8,27]. In addition, the lack of anticipation of flood events, such as the unavailability of short-term forecasts and warnings, combined with inadequate adaptation measures, largely limit the efficiency of flood risk management, leading to the increased consequences of these events [21,22].
Recent research related to flash floods has made progress in several areas. In the context of flood hazards, several authors have developed and improved GIS-based approaches to mapping flash flood hazards as an alternative to hydrodynamic modeling [28,29]. There are also studies investigating the best modeling approach for flash floods [23,30,31] and improving available numerical models [32,33,34]. Better understanding of flash floods and their consequences is also the focus of several recent studies that examine the response to heavy rainfall events using historical information and measured data [25], conduct post-flood analyses using a combination of numerical modeling and field investigation [35], and reconstruct flash flood events using hydrodynamic models [36]. In addition, new indicators of flash flood severity have recently been proposed [37]. In the context of flood vulnerability, many studies focus on assessing flash flood susceptibility using various machine learning and hybrid approaches (e.g., [38,39,40,41,42,43]). Some authors have improved the integration of social data and perceptions in flood risk assessment [44,45]. Special attention is also given to the impact of flash floods on the road network and transport infrastructure [21,22,46], as well as to uncertainties in flood damage estimation and their impact on investment decisions [47]. In addition to flash flood risk assessment, significant progress has been made in flash flood forecasting models that use machine learning techniques [48,49,50] or remote sensing weather radar data [51,52]. A comprehensive review of recent advances in pluvial flash flood forecasting has been published by Zanchetta and Coulibaly [53]. However, despite recent progress, there are still no consistent and integrated methods or guidelines for flash flood risk analysis that support and integrate all phases of the FRMP, from data collection and processing, to modeling and flood hazard mapping, to data availability and vulnerability assessment, to flood risk and damage estimation. This is especially true in light of recent advances in numerical modeling and public data availability.
The main objective of this study was to outline a methodological framework for the risk assessment of pluvial flash floods at the catchment scale as a support to the flood risk management in EU. The Gospić catchment (Croatia) was selected as a case study to test the proposed methodology and to illustrate how the new flood hazard and risk maps could improve the efficiency of flood risk management. The developed methodology follows recent advances in the field of flood risk assessment and improves existing approaches by providing a more detailed and comprehensive analysis. This was achieved through the use of hydrologic–hydraulic modeling, the use of higher-resolution open data available in the EU, and the assessment of flood risk at both qualitative and quantitative levels. In addition, special attention is given to the exposure and risk level of the population, road network, and buildings to pluvial flash floods.
This study is organized as follows. In the next section, the proposed methodology for flood hazard and flood risk assessment is explained in more detail. Then, the results—flood hazard maps, flood exposure maps, and flood risk maps—for the Gospić catchment are presented. Finally, we discuss the methodology and results by comparing them with the current maps of Croatia and give some recommendations for further improvements.
2. Materials and Methods
2.1. Flood Risk Management in Croatia
The EU Floods Directive states that FRMPs should cover all stages of flood risk management, with particular emphasis on prevention, protection, and preparedness. Flood risk maps should provide information to stakeholders and policy makers and assist them in selecting appropriate flood protection measures and actions. However, decisions about flood protection measures and actions are complex, and assistance is often needed to support them. End users and policy makers need information that is easy to interpret and properly contextualized, and therefore tailored specifically to their needs [46,54]. The FD provides general guidance on the content of flood hazard and risk maps, but unfortunately does not provide details on the methods or approaches that can be used to achieve these goals.
Despite the detailed legal framework and strict deadlines, analysis of the first FRMP implementation cycle, which was completed at the end of 2015, shows a rather inconsistent situation among the EU Member States, with significant differences in scope, area, or methodology and with an apparent lack of consistency and coordination among and even within Member States [15,16,18,19,55]. Therefore, it is crucial to exchange experiences and good practices in flood risk mapping between EU Member States at all levels.
In Croatia, the second FRMP (2022–2027) has completed the public consultation phase and will soon be submitted to the European Commission. The flood hazard and flood risk maps for the second FRMP were completed in 2019 [56]. These maps include fluvial flooding (from rivers and torrential streams), coastal flooding, flooding from underground water in karst areas, flooding from reservoir overflow and artificial channels, and flooding from the loss of flood control system function in major rivers, as well as in large lowland and mountain retention basins.
The analysis of potentially significant flood risk at the national level showed that 9049 km2 (16.0%) of the territory is at risk of flooding at a low probability of occurrence, 4259 km2 (7.5%) at a medium probability of occurrence, and 3249 km2 (5.7%) at a high probability of occurrence [56]. Flood hazard maps in Croatia provide a spatial overview of the extent of flooding and water depths for three different scenarios in relation to the probability of flood occurrence. Flood risk maps provide a spatial overview of the potential negative consequences of the flood scenarios depicted in the flood hazard maps. They are primarily intended for the public and a wide range of stakeholders to help them participate in and be better informed about flood risk management.
The flood risk maps for the 2022–2027 planning cycle have been improved compared to the previous cycle by using higher-quality, more-comprehensive, and detailed input data [56]. The greatest improvements have come from more reliable identification of potentially vulnerable populations and new receptors related to cultural assets, power grids, and social facilities. Unfortunately, the second cycle of Croatian flood risk maps still does not include pluvial flooding, and although flash floods are officially listed as a source of the flooding, they refer only to major torrential channels and streams. Croatia will soon start preparing the next generation of flood hazard and flood risk maps to support the third FRMP cycle.
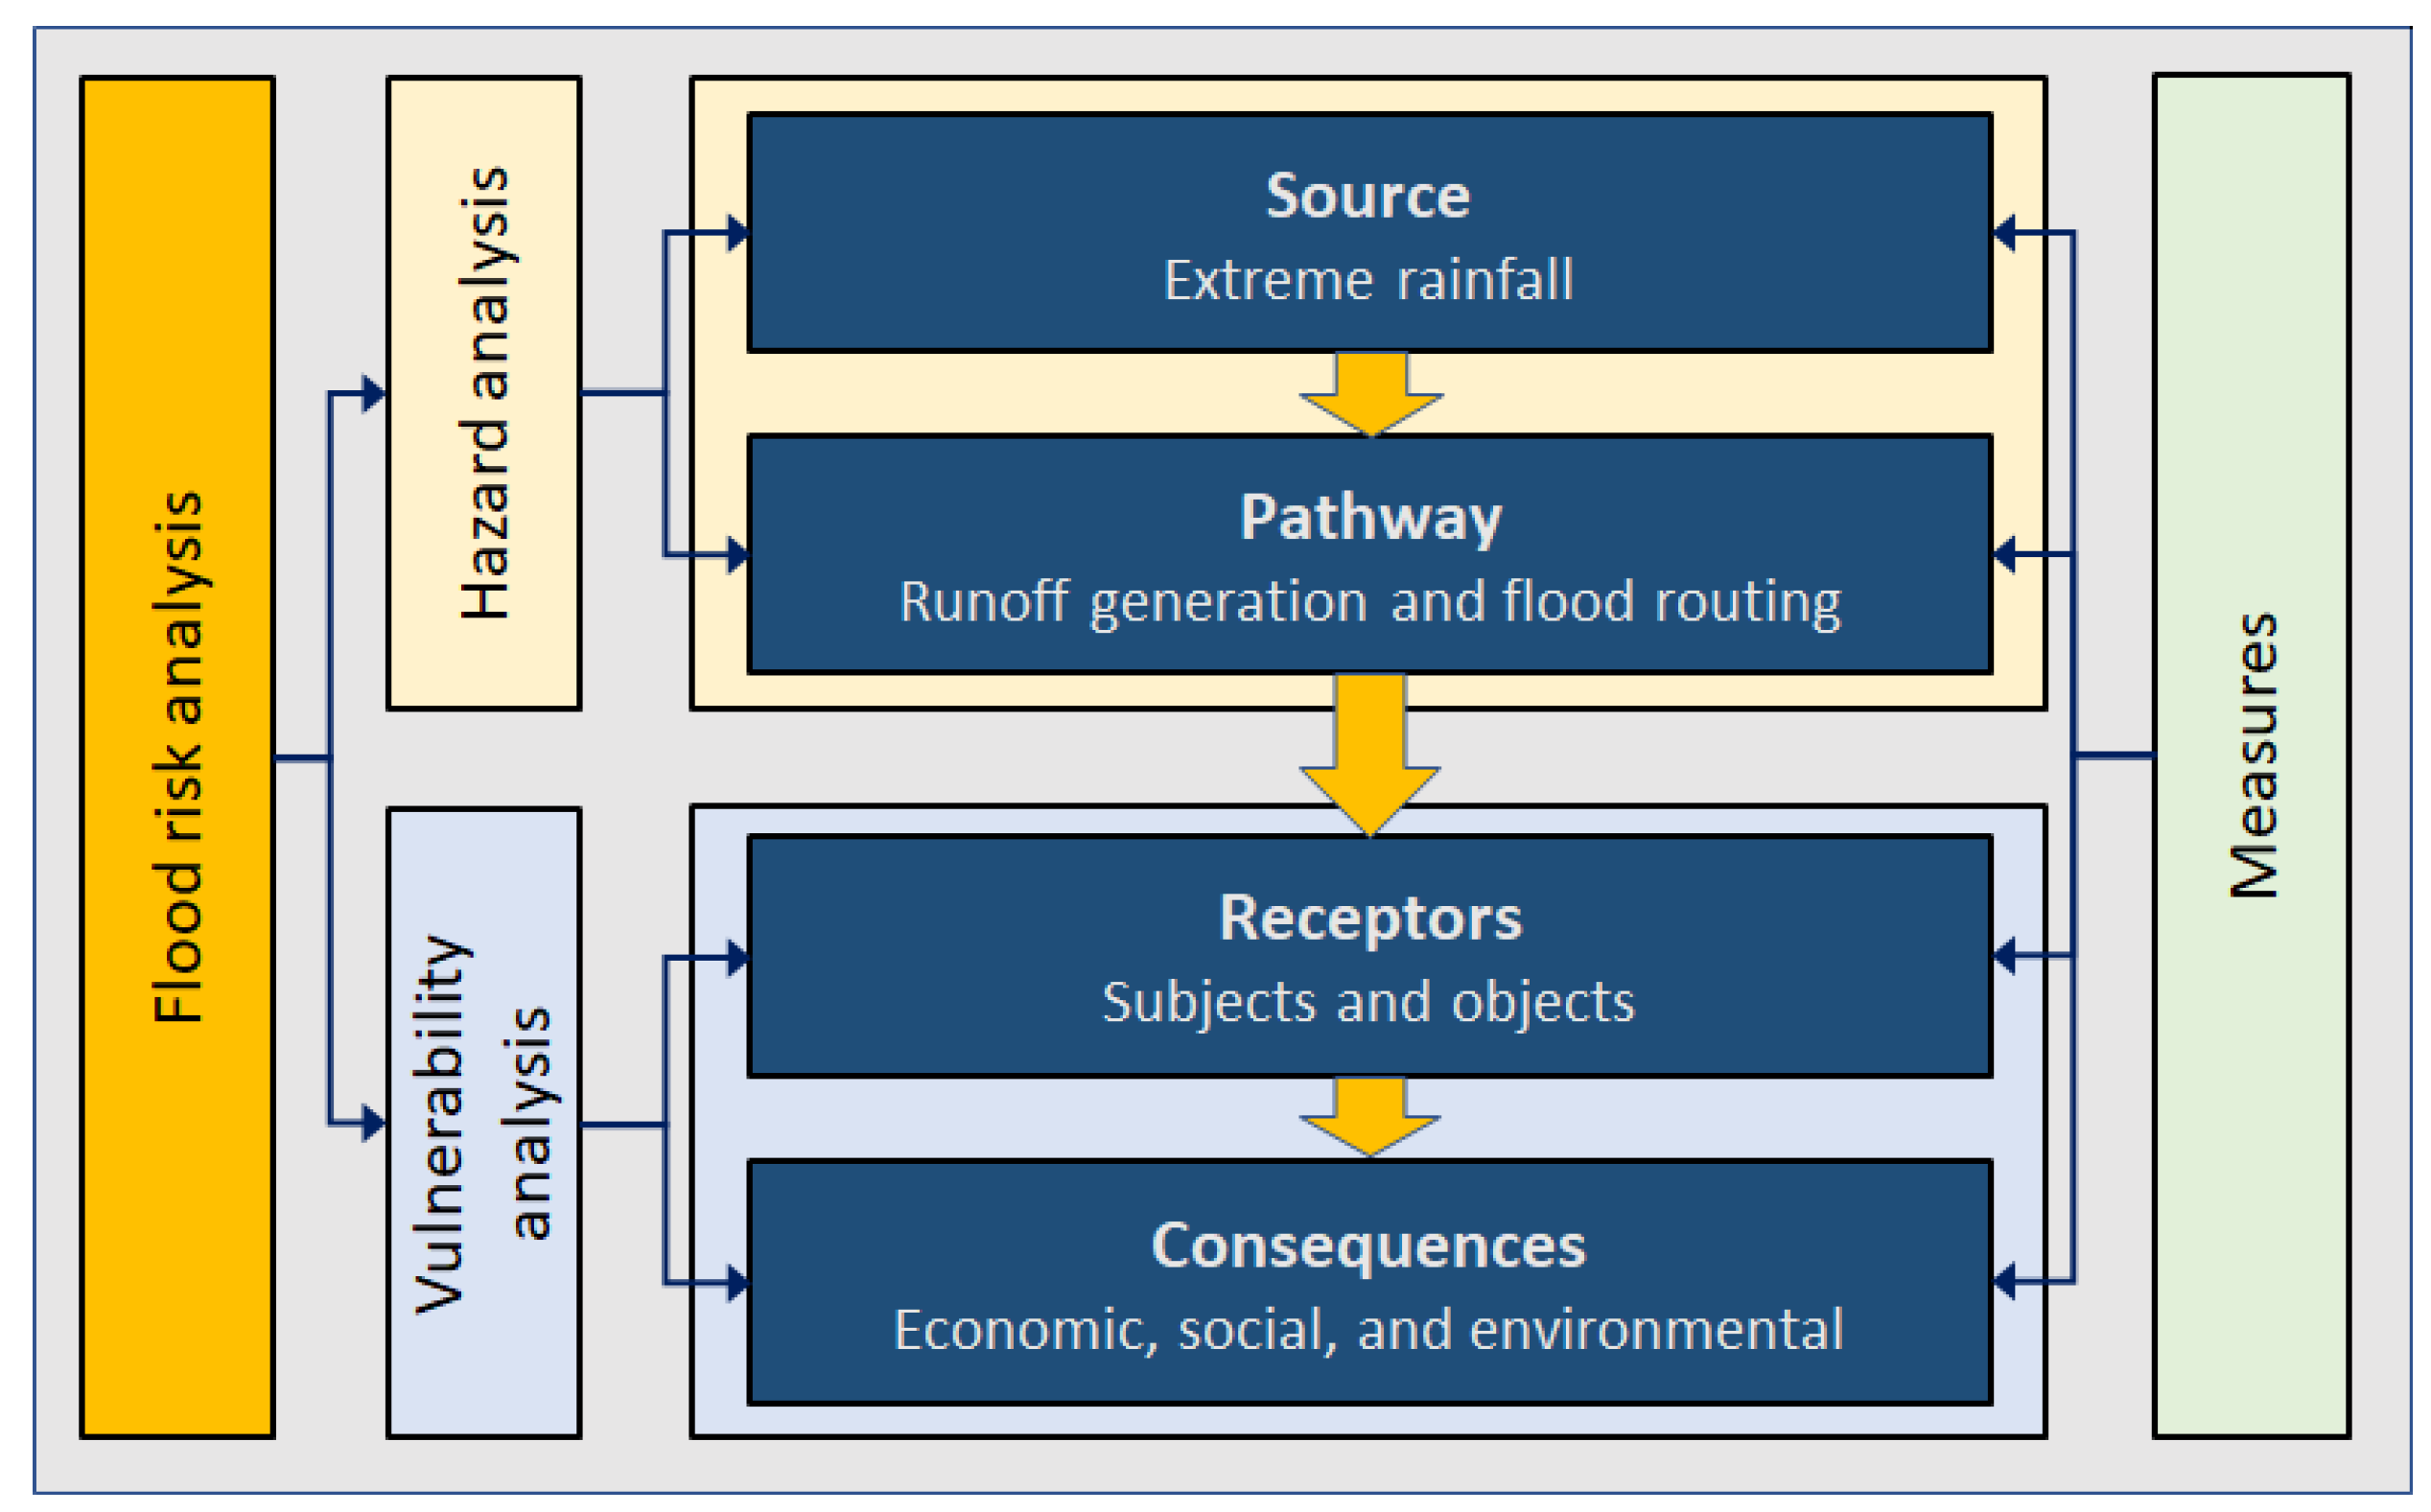
2.2. Methodological Framework for Flood Hazard and Risk Assessment
Here, we propose a methodology for assessing flood hazards and risks based on the requirements of the EU Floods Directive (EC 2007/60/EZ). According to the Floods Directive, flood risk is a combination of the probability of a flood event and the potential adverse consequences for human health, the environment, cultural heritage, and economic activities. Flood risk assessment should be based on three scenarios related to a low, medium, and high probability of occurrence. In addition, flood hazard maps should cover the geographic areas that could be flooded and show the extent of the flood, water depths or levels, and flow velocity (if applicable). Flood risk maps, on the other hand, should show the adverse consequences associated with flood scenarios and should be expressed in terms of the number of inhabitants potentially affected, economic activities in the potentially affected area, and facilities that could cause accidental pollution in the event of a flood.
The proposed framework also uses the source–pathway–receptor–consequence (SPRC) approach to identify flood risk [44,57]. The SPRC is a conceptual model commonly used in flood risk assessment to provide a better understanding of each element of the risk analysis (see Figure 1). The SPRC concept describes the relationship between hazard, vulnerability, and risk as a functional chain of source, pathway, receptor, and (adverse) consequences.
Figure 1.
Source–pathway–receptors–consequences framework for the pluvial flash floods.
The source can be defined as the cause or origin of a hazard. In the context of pluvial flash floods, the source is a heavy rainfall event that typically occurs within a short period of time and results in high runoff (hydrological analysis). The pathway describes the dynamics of surface water flow toward a receptor (hydraulic analysis), which is related to the topographic characteristics of the flooded area, soil properties (infiltration), and imperviousness. Receptors are the objects and subjects (population, buildings, road network, land, etc.) that are exposed to a hazard and are potentially susceptible to negative consequences (vulnerability analysis). It should be noted that a pathway must exist between the source and a receptor for a risk to occur. The term consequences includes negative impacts such as economic (e.g., property damage, crop destruction, loss of livestock), social (e.g., loss of life, injury, loss of cultural property), or environmental (e.g., soil and/or water contamination, public health degradation) that may result from a receptor’s exposure to a hazard [44,58].
The proposed methodology follows [12,59] and consists of hazard, vulnerability, and risk assessment. The main elements of the proposed methodology are shown in Table 1 and Figure 2, with specific details for each step described in the following subsections. In this way, flood risk maps can be useful to various end users and decision support systems. First, the risk levels are more easily understood by the public, facilitating their participation in the flood management process, and second, the risk of damage expressed in monetary terms supports the cost–benefit analysis of mitigation measures [12].
Table 1.
Main elements of the pluvial flash flood risk analysis.
Figure 2.
Schematic overview of the proposed methodology for the pluvial flash flood risk assessment.
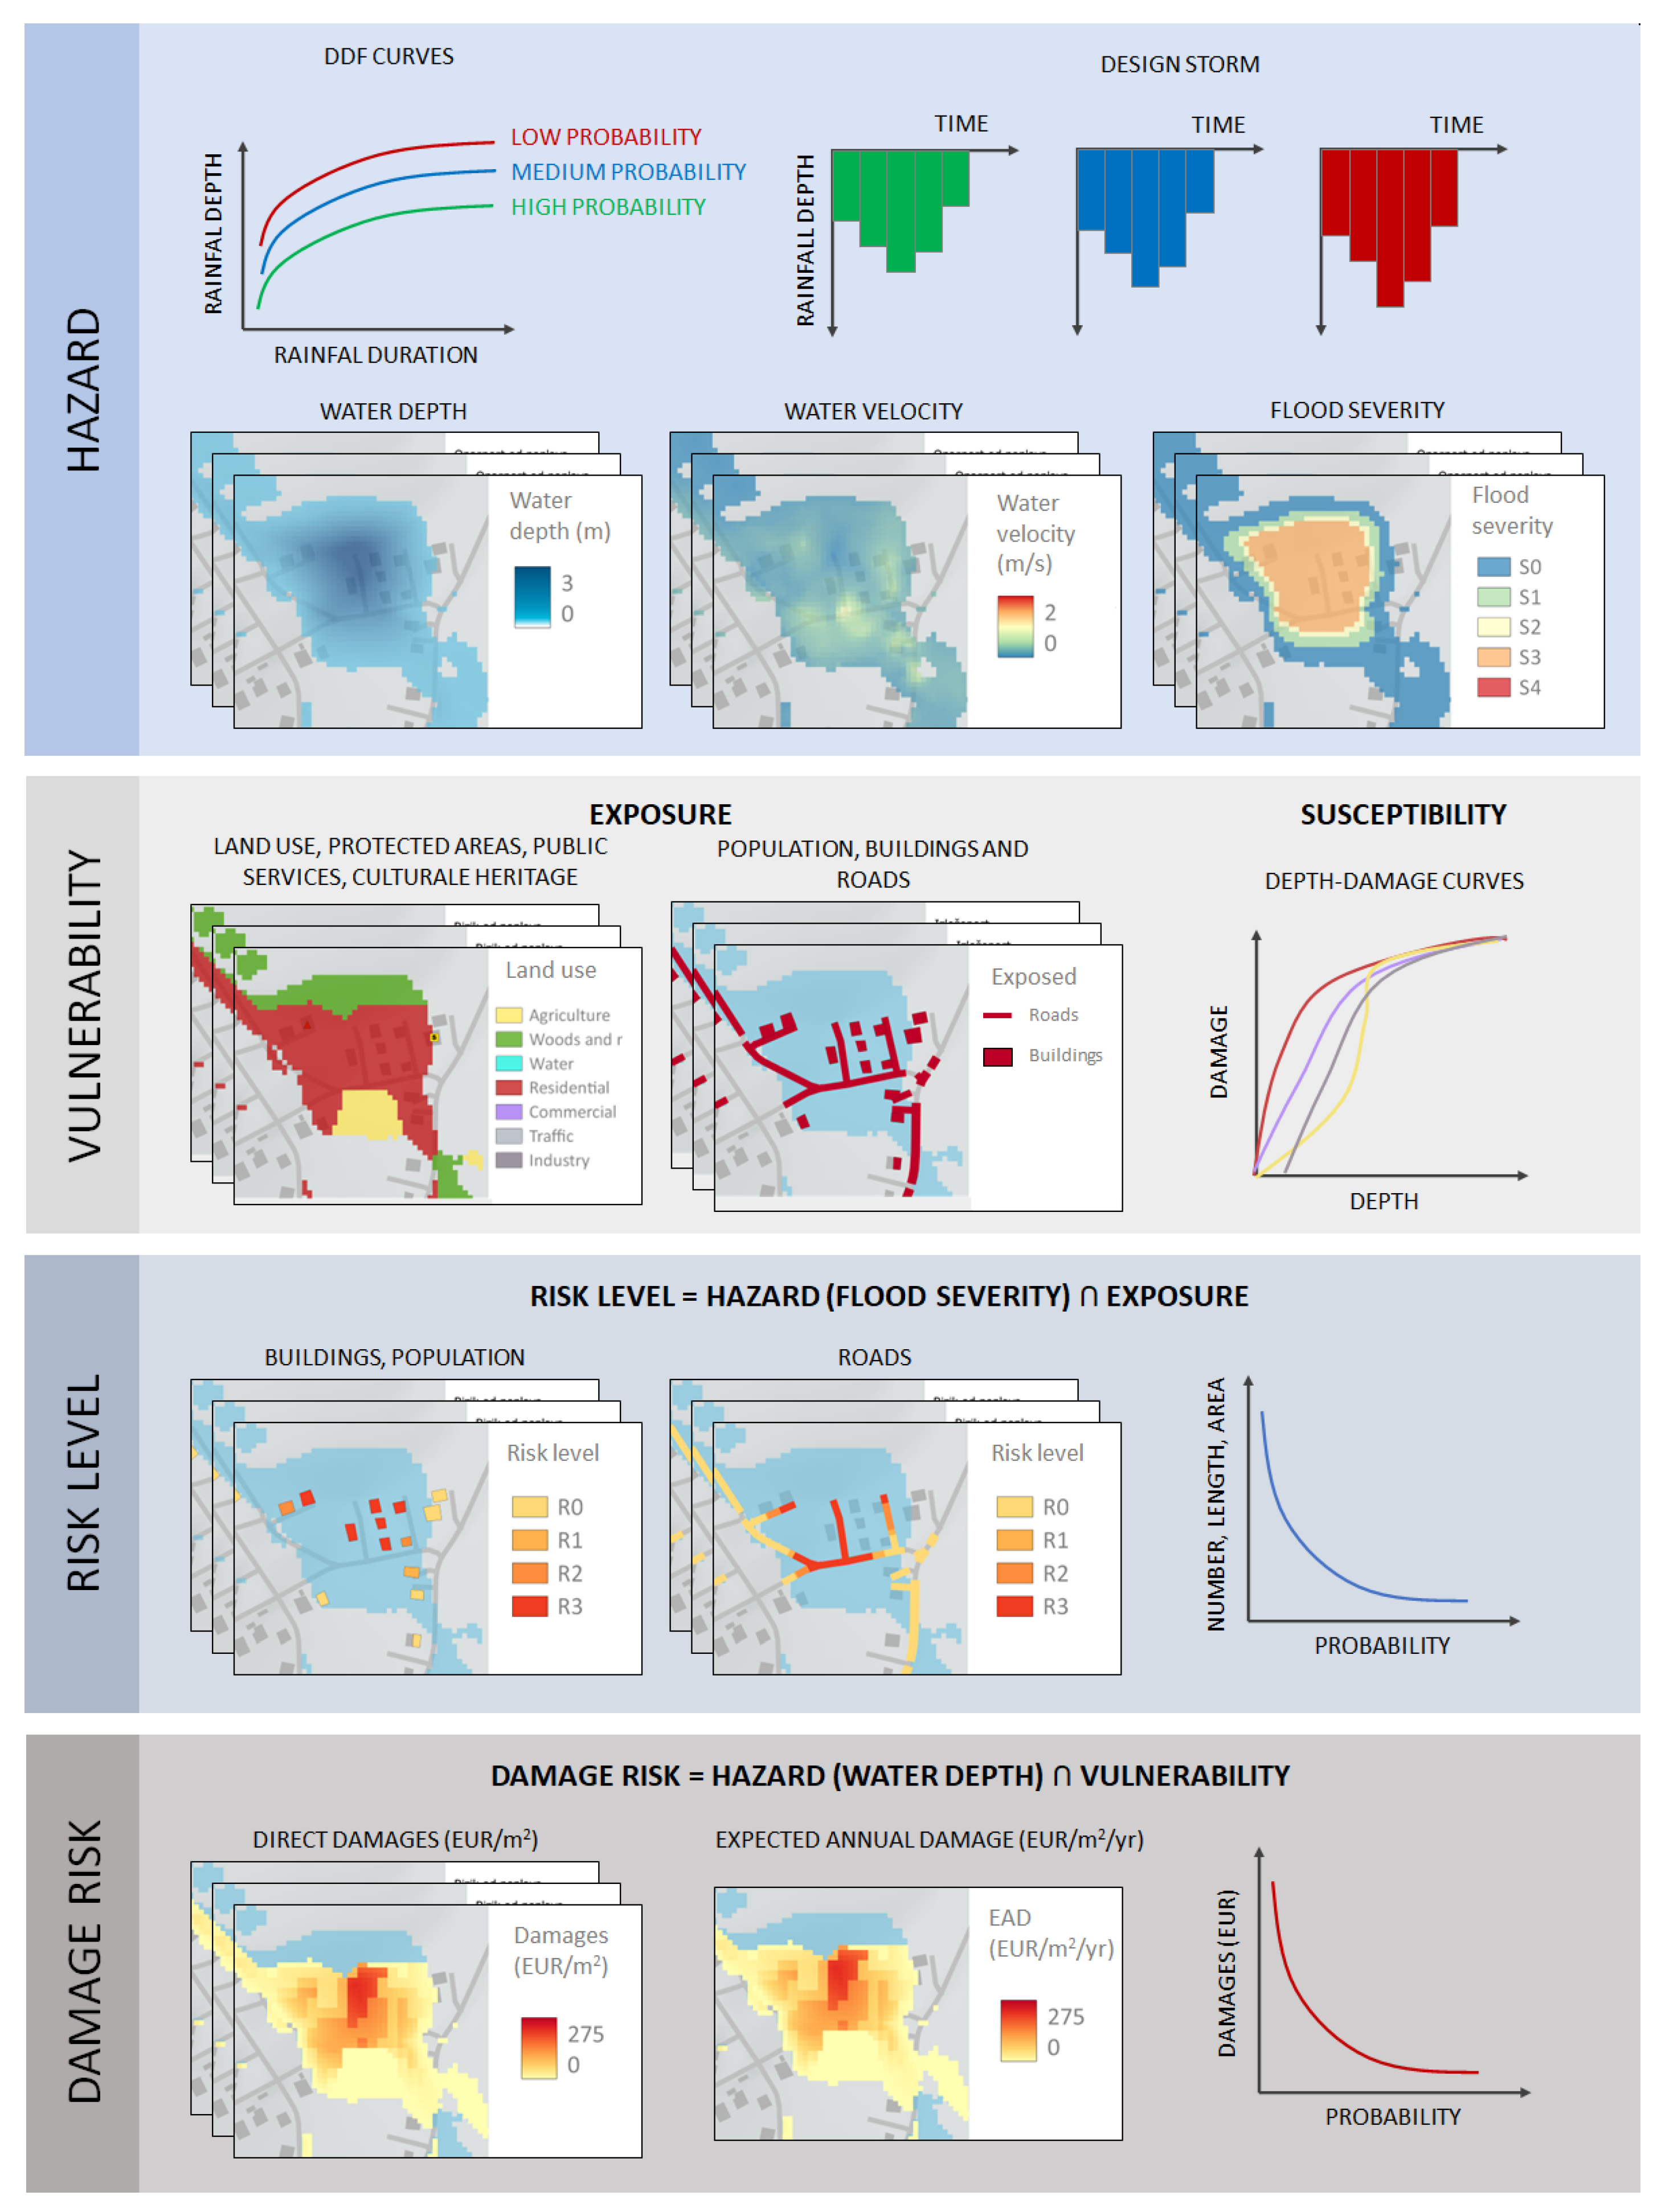
2.3. Flood Hazard Analysis
2.3.1. Scenarios
According to the report on flood hazard and flood risk maps in the EU [55], only 50% of Member States mapped pluvial floods in the first FRMP cycle, and 28% of them mapped pluvial floods in combination with fluvial floods. Those that mapped pluvial floods used a wide range of return periods corresponding to low probability (100–1000 years), medium probability (25–200 years), and high probability (10–50 years). Considering the fact that rain gauges in Croatia have a relatively short observation period, we decided to stay at the lower end of these ranges for the purposes of this study. Therefore, we propose three scenarios defined by corresponding return periods or annual exceedance probabilities (AEPs):
- Scenario H—high probability: describes a high probability of flooding, characterized by lower extreme rainfall intensity, corresponding to a return period of 5 years or 20% AEP.
- Scenario M—medium probability: describes a medium probability of flooding, characterized by a medium extreme rainfall intensity, corresponding to a return period of 25 years or 4% AEP.
- Scenario L—low probability: describes a low probability of flooding, characterized by a higher extreme rainfall intensity, corresponding to a return period of 100 years or 1% AEP.
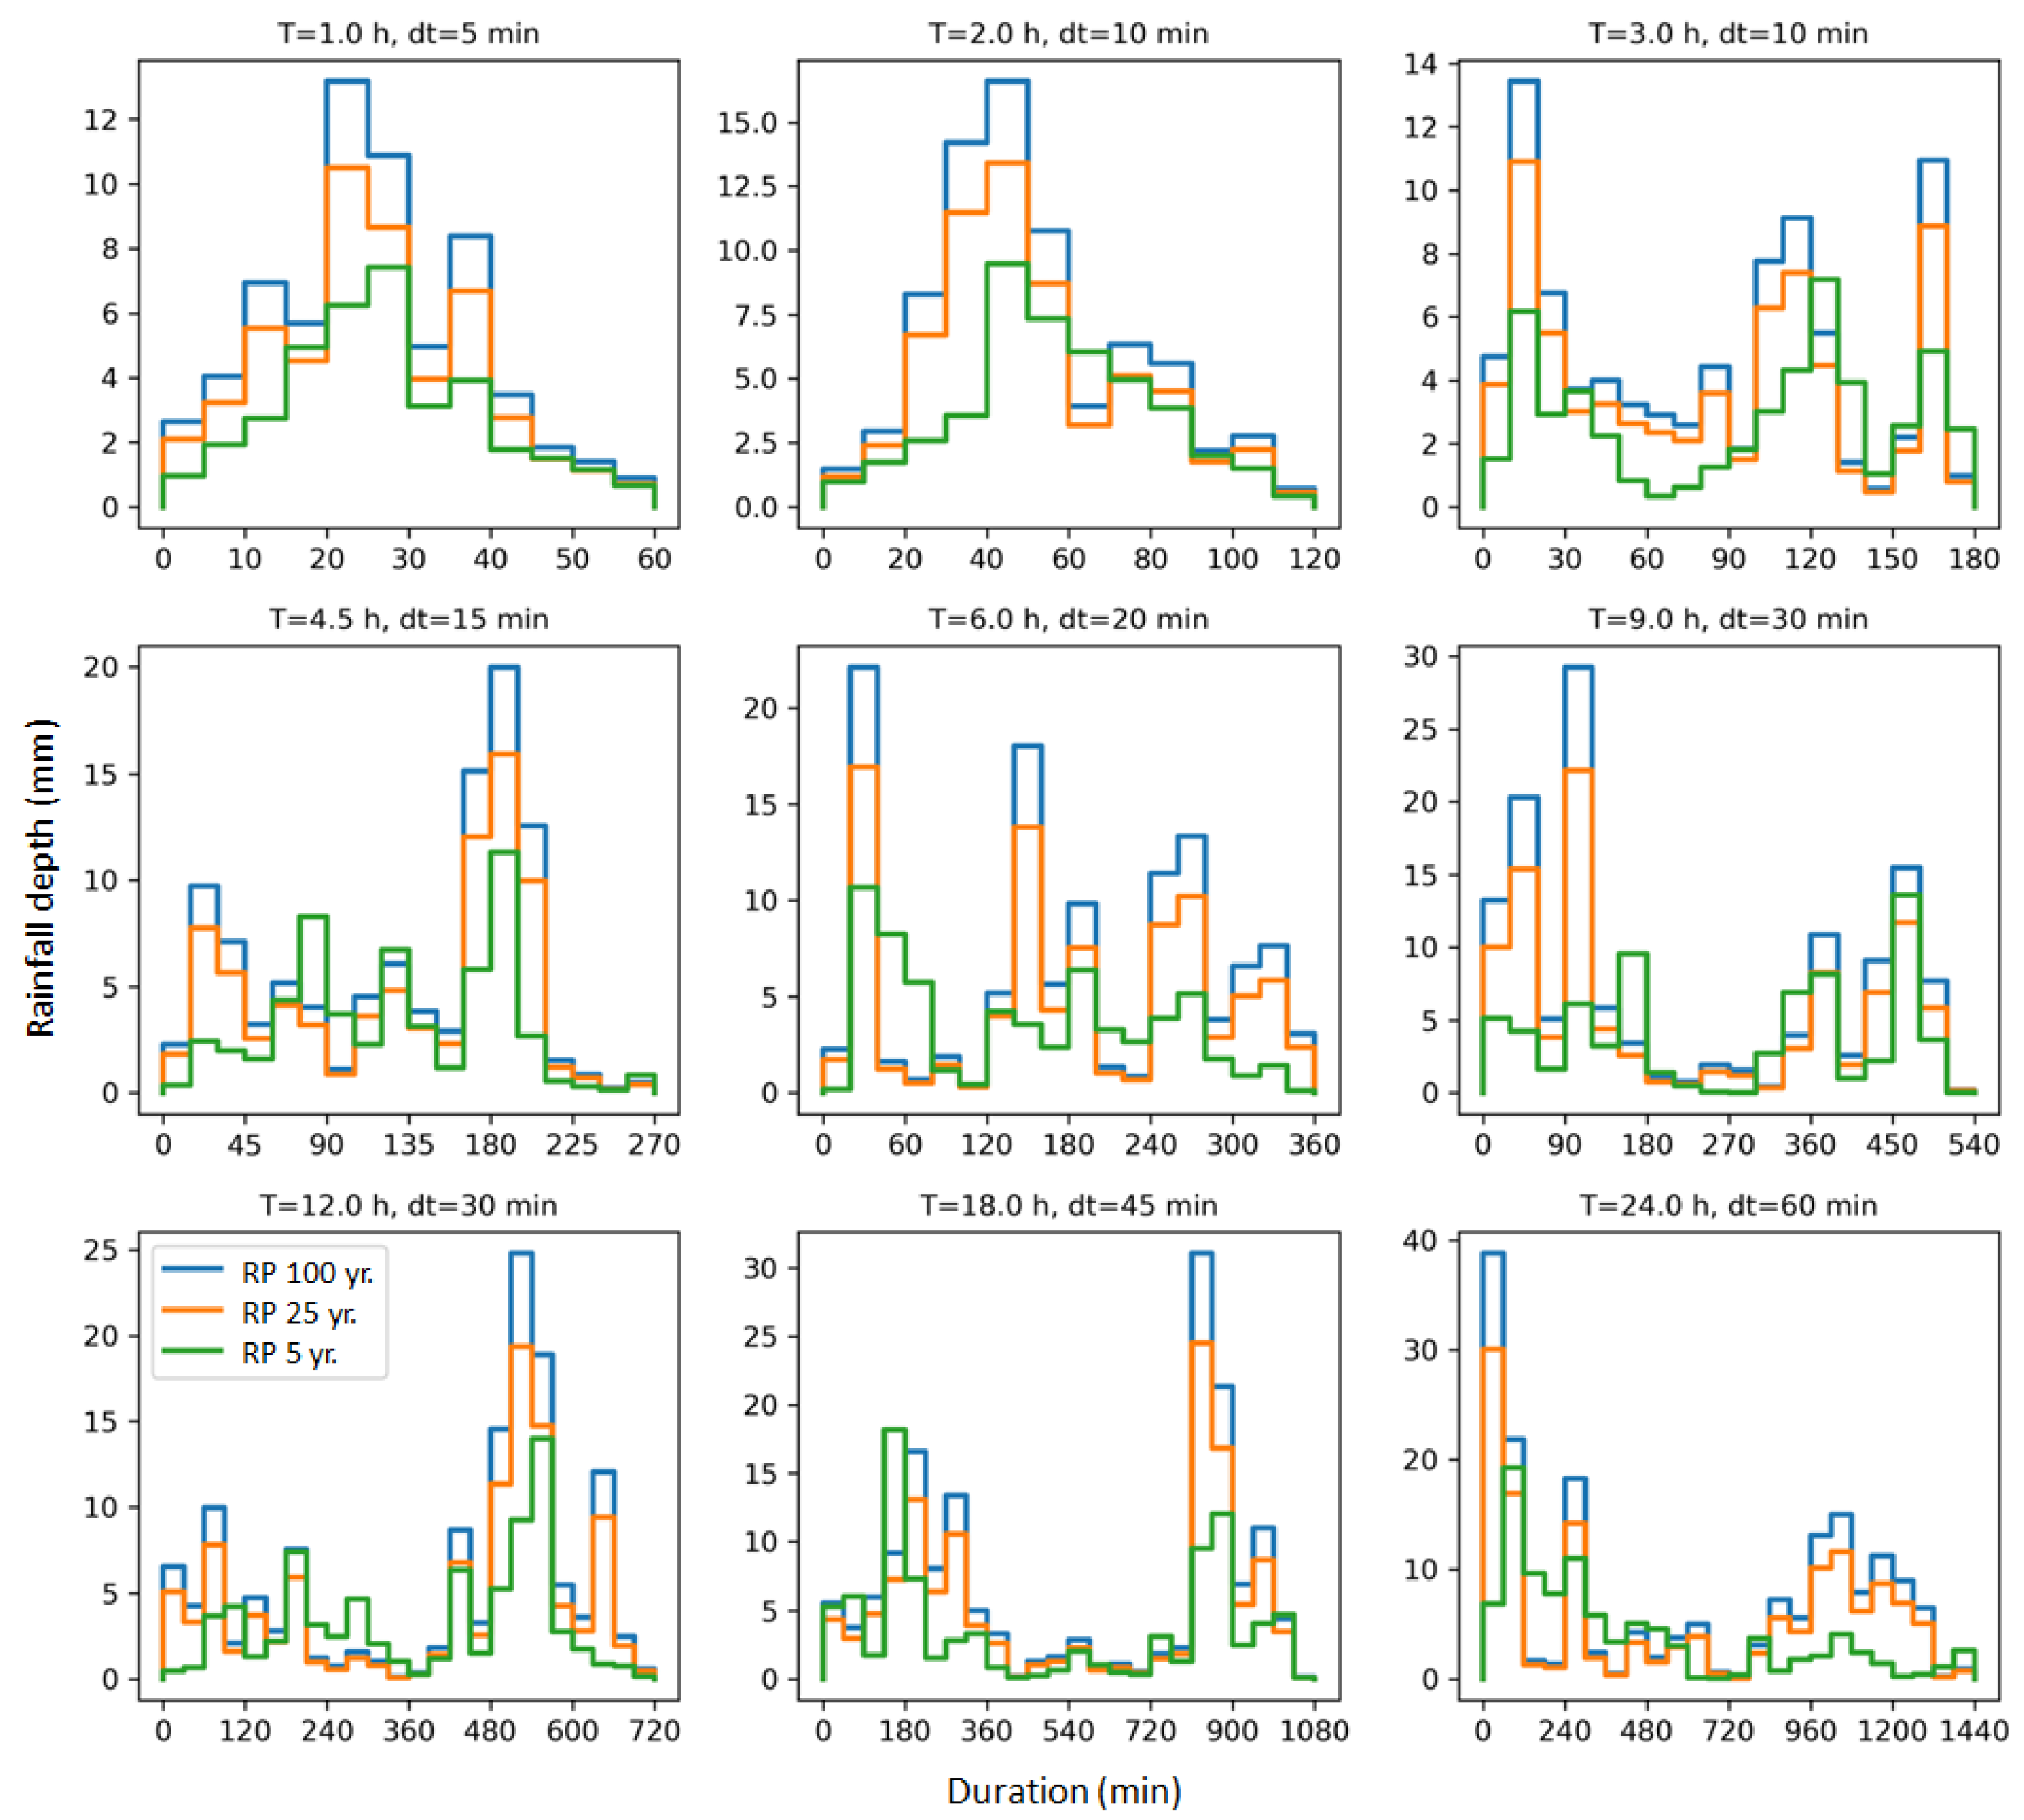
2.3.2. Rainfall Data
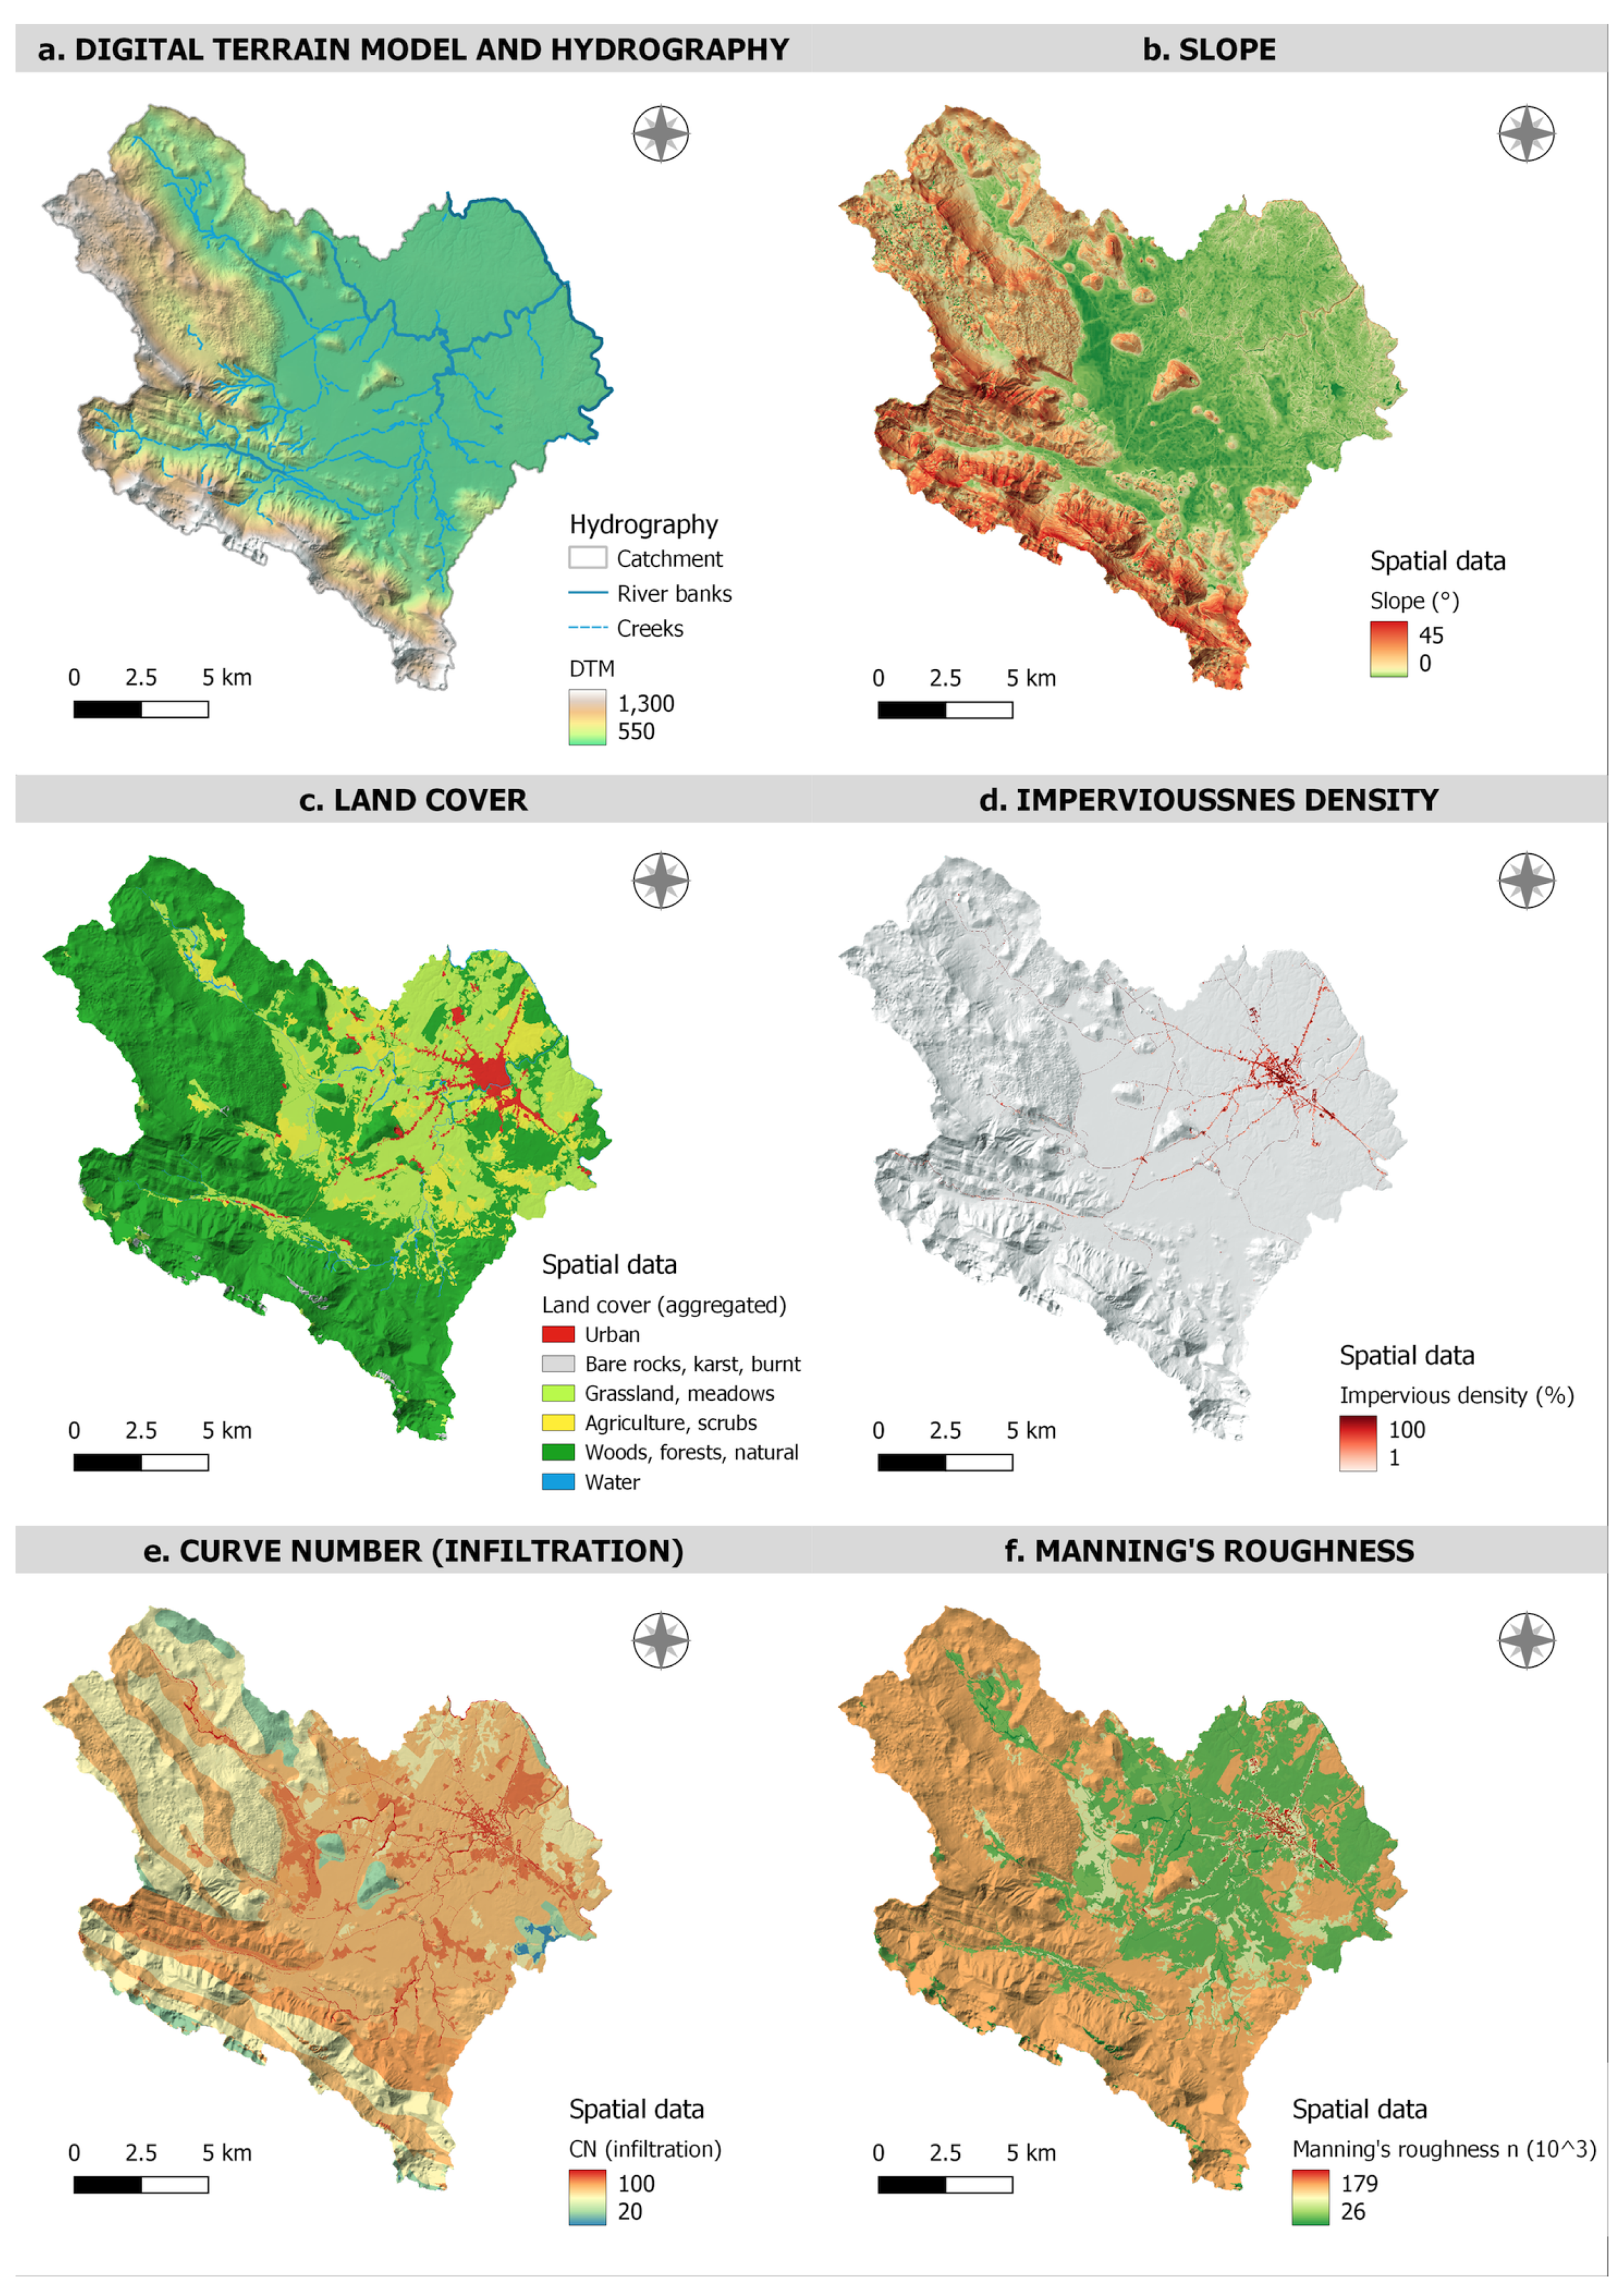
The key input to the PFF hazard analysis and hydrologic–hydraulic model is the amount of rainfall defined by design storms of different durations for three different probabilities. Following the recommendations of a previous study [60], which investigated different approaches to design storms and evaluated their suitability for Croatian coastal catchments, we use the average variability method (AVM) [61]. First, non-dimensional design storms (cumulative curves) were created based on high-resolution 60-year precipitation data (1961–2020) for a duration of 1, 2, 3, 4.5, 6, 9, 12, 18, and 24 h, obtained from the Gospić meteorological station. Design storms were then derived for 5-, 25-, and 100-year return periods by combining dimensionless cumulative curves and depth–duration-probability (DDF) curves (see Figure 3).
Figure 3.
Design storms for the Gospić catchment for different rainfall durations and probabilities.
2.3.3. Spatial Data
Key spatial data for the PFF hazard analysis are listed in Table 2. The digital terrain model (DTM) was created from vectorized elevation data by spatial interpolation at a 5 m resolution. The vectorized elevation data were obtained from the Croatian State Geodetic Administration. The DTM was analyzed using a GIS flow accumulation model to derive the boundaries of the catchment and identify the main flow paths. The DTM was also validated by high-resolution satellite imagery and processed at bridges, underpasses, overpasses, and culverts. The land-cover model (LCM) was created from satellite imagery (Sentinel 2) using the geographic-object-based image analysis (GEOBIA) method [62,63,64]. The segmentation parameters and optimal classifier were determined by evaluating the accuracy of the most commonly used classifiers [65,66]. A total of 21 cover classes were identified and mapped. Imperviousness density was taken from the Copernicus Land Monitoring Service for 2018 [67] and resampled to a 5 m resolution.
Table 2.
Spatial data used for the flood hazard assessment.
Two additional maps were created from the LCM. First, the Manning roughness coefficient map was created using average data from the literature [68,69,70]. Then, the curve number (CN) map was created to define the infiltration capacity of the catchment using literature data [70,71,72]. Table 3 shows the proposed values for the corresponding land-cover classes. Figure 4 shows the main spatial data and maps for the Gospić catchment. In particular, we derived the digital terrain model with the hydrographic network, the slope map, the land-cover map, the imperviousness density map, the curve number map, and the Manning roughness map.
Table 3.
Manning’s roughness coefficient and CN numbers for corresponding land-cover classes (compiled from [68,69,70,71,72]).
Figure 4.
Spatial data used for flood hazard analysis in the Gospić catchment: (a) digital terrain model and hydrographic network, (b) terrain slope, (c) aggregated land-cover, (d) imperviousness density, (e) curve number CN for infiltration, and (f) Manning’s roughness coefficient.
2.3.4. Hydrologic–Hydraulic Model
Rainfall-related (non-fluvial) flooding is modeled using the approach known as direct rainfall modeling or rain-on-grid (RoG). In this approach, the hydrologic and hydrodynamic flood processes are modeled entirely with the 2D hydrodynamic model, rather than in two different model systems. This approach is increasingly used to determine the rainfall–runoff processes of watersheds of different sizes (see, for example, [23,31,32,33,73]).
Flood simulations were performed using the Hydrologic Engineering Center-River Analysis System (HEC-RAS 6.1) [70]. The grid size of 20 m was chosen to represent the entire area, with breaklines of higher resolution (10 m) chosen along major river channels and roads to ensure more accurate results. Note that HEC-RAS computes the geometric and hydraulic features for each cell and each cell face to capture the sub-grid topography [31,70].
Three boundary conditions were defined for the flood simulations: (a) normal water depth along the land boundary, (b) uniform stage hydrograph along the Lika River (northeastern boundary), and (c) spatially uniform precipitation over the entire 2D domain defined by the design storm. The shallow water equation (SWE-ELM) with a variable time step was used to simulate the unsteady 2D flood propagation resulting from each design storm. The simulation time for each scenario lasted 1 h longer than the duration of the precipitation. Infiltration was calculated using the SCS method and the CN map; Manning roughness was calculated from the Manning roughness coefficient map; the percentage of impervious surfaces was calculated from the imperviousness density map.
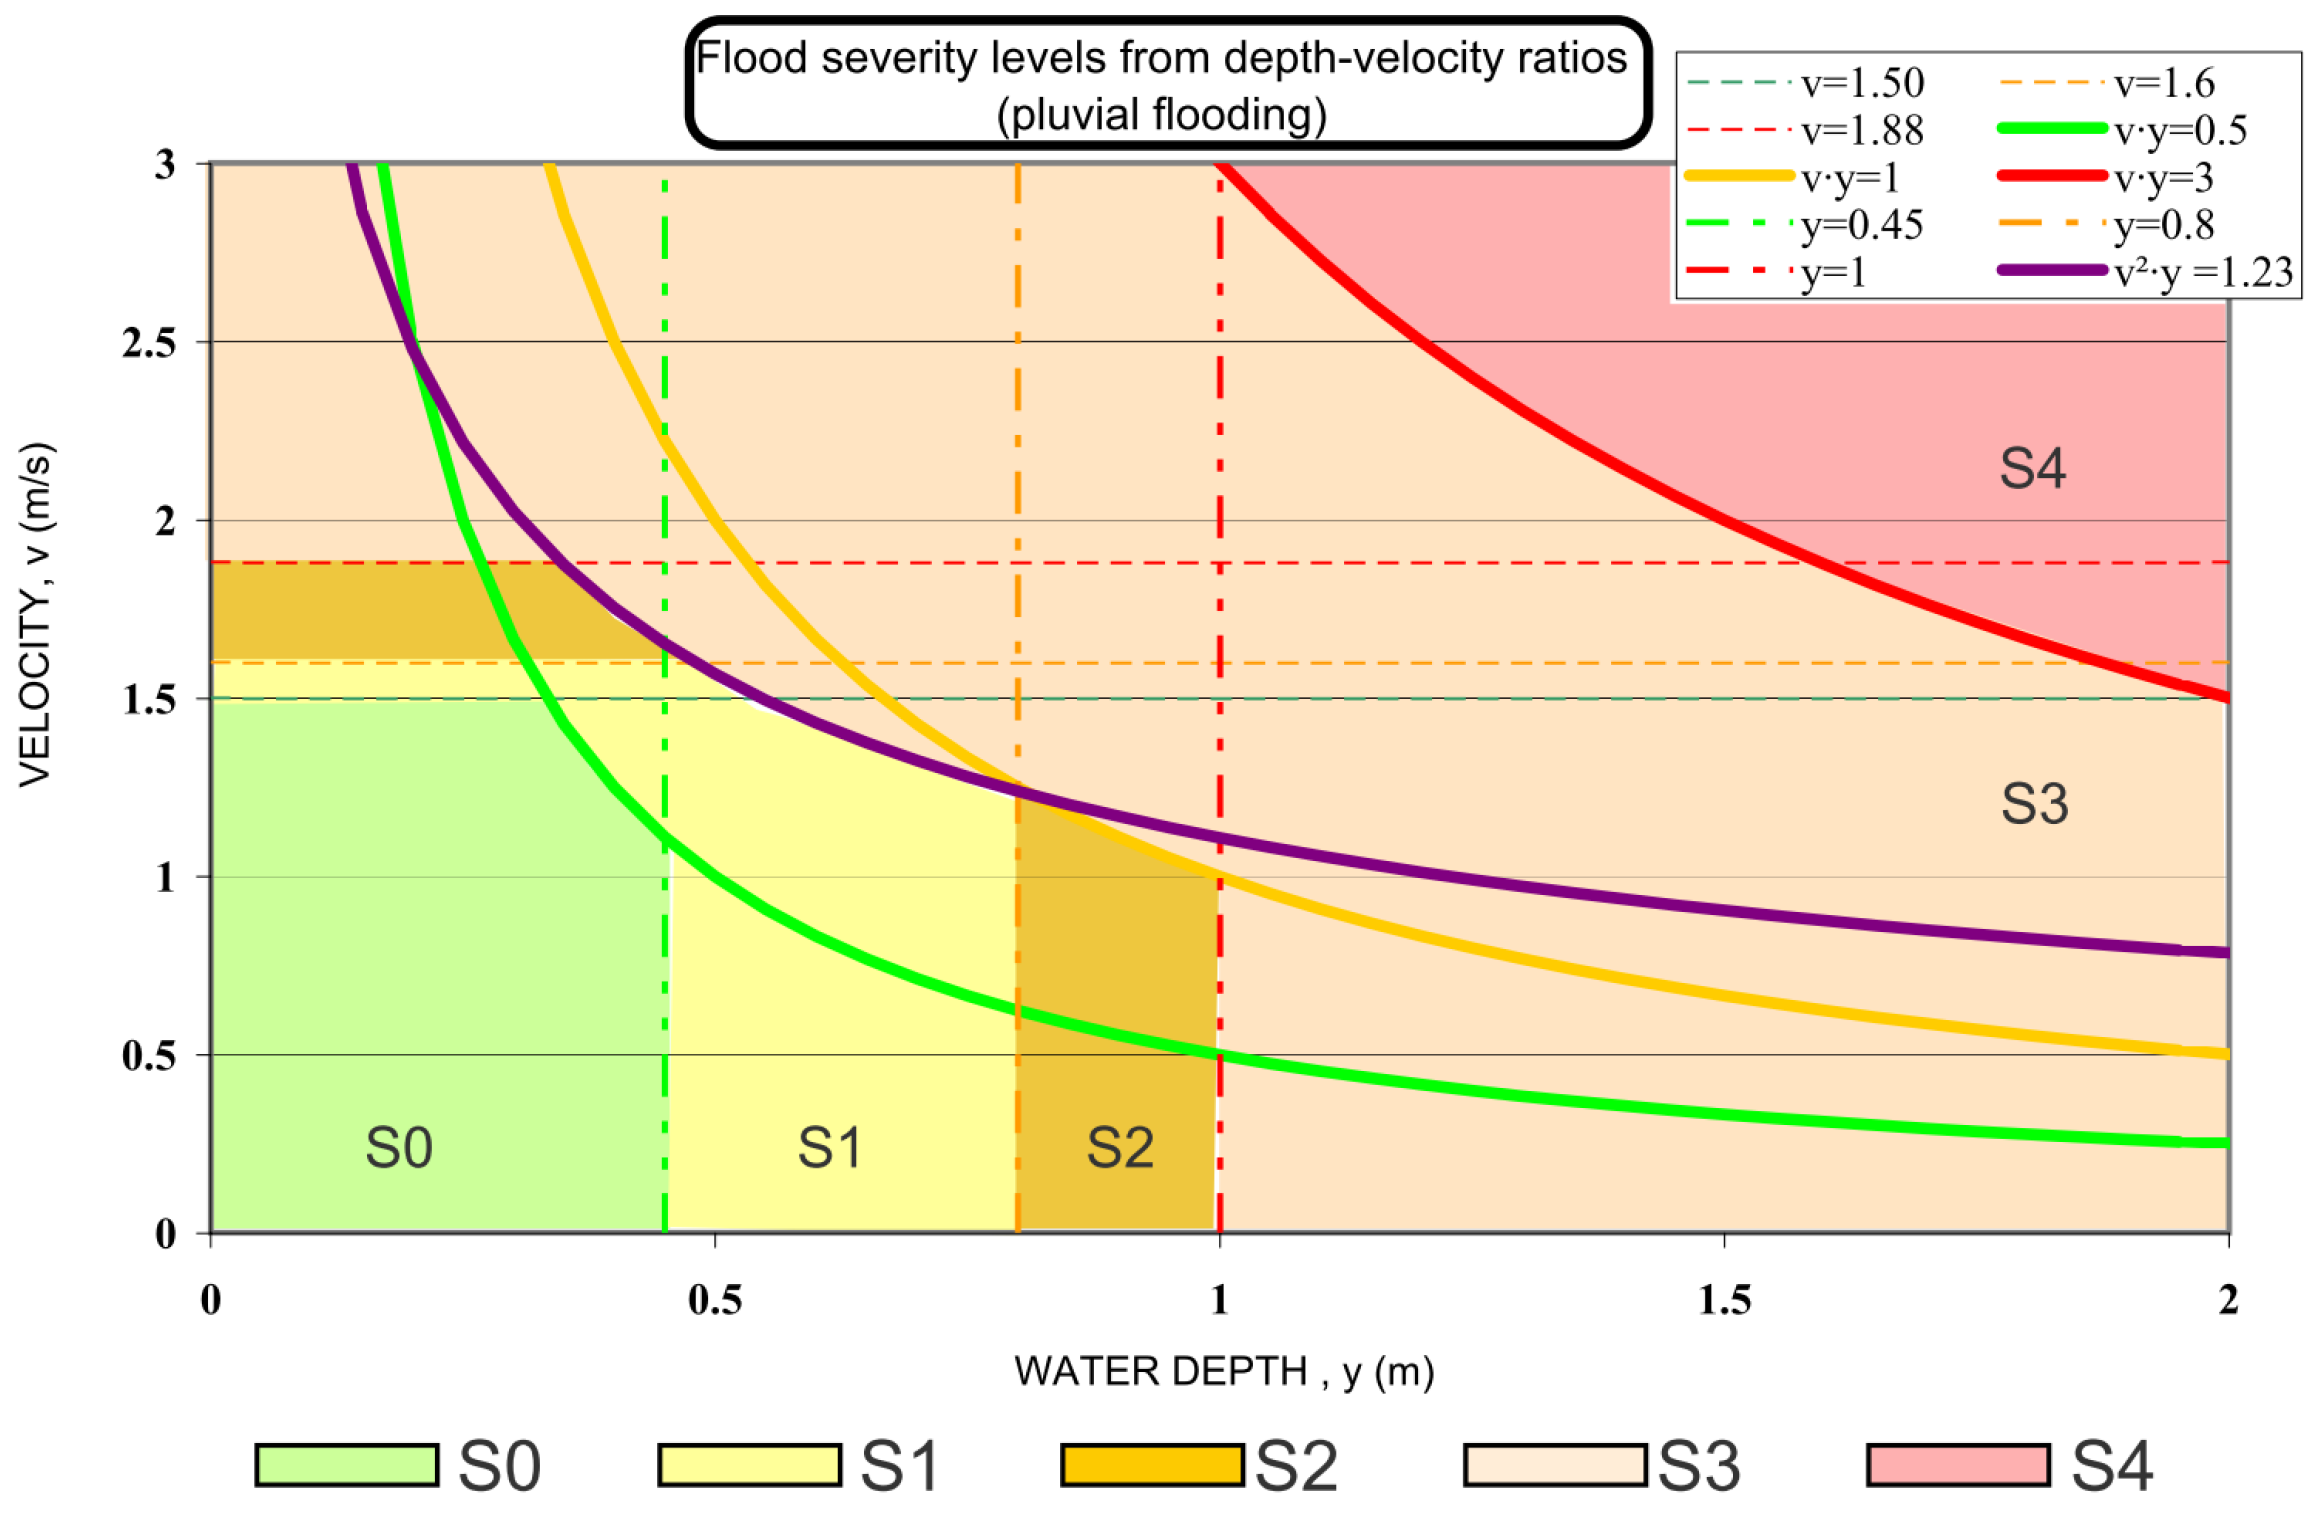
2.3.5. Flood Severity Analysis
The flood severity was determined using four hydraulic parameters based on the SUFRI method developed for pluvial floods [44]. The four hydraulic parameters are the water depth y, water velocity v, drag parameter , and sliding parameter . Based on a combination of these parameters, five severity levels are assigned (negligible, low, medium, high, and extreme severity). Each level describes the severity for people, vehicles, and buildings. Table 4 lists the parameters for each severity level, and Figure 5 shows each flood severity level in the hydraulic parameter space.
Table 4.
Flood severity levels and the corresponding hydraulic parameters as defined by the SUFRI methodology [44].
Figure 5.
Flood severity levels from depth–velocity rations for pluvial floods as defined by the SUFRI methodology [44].
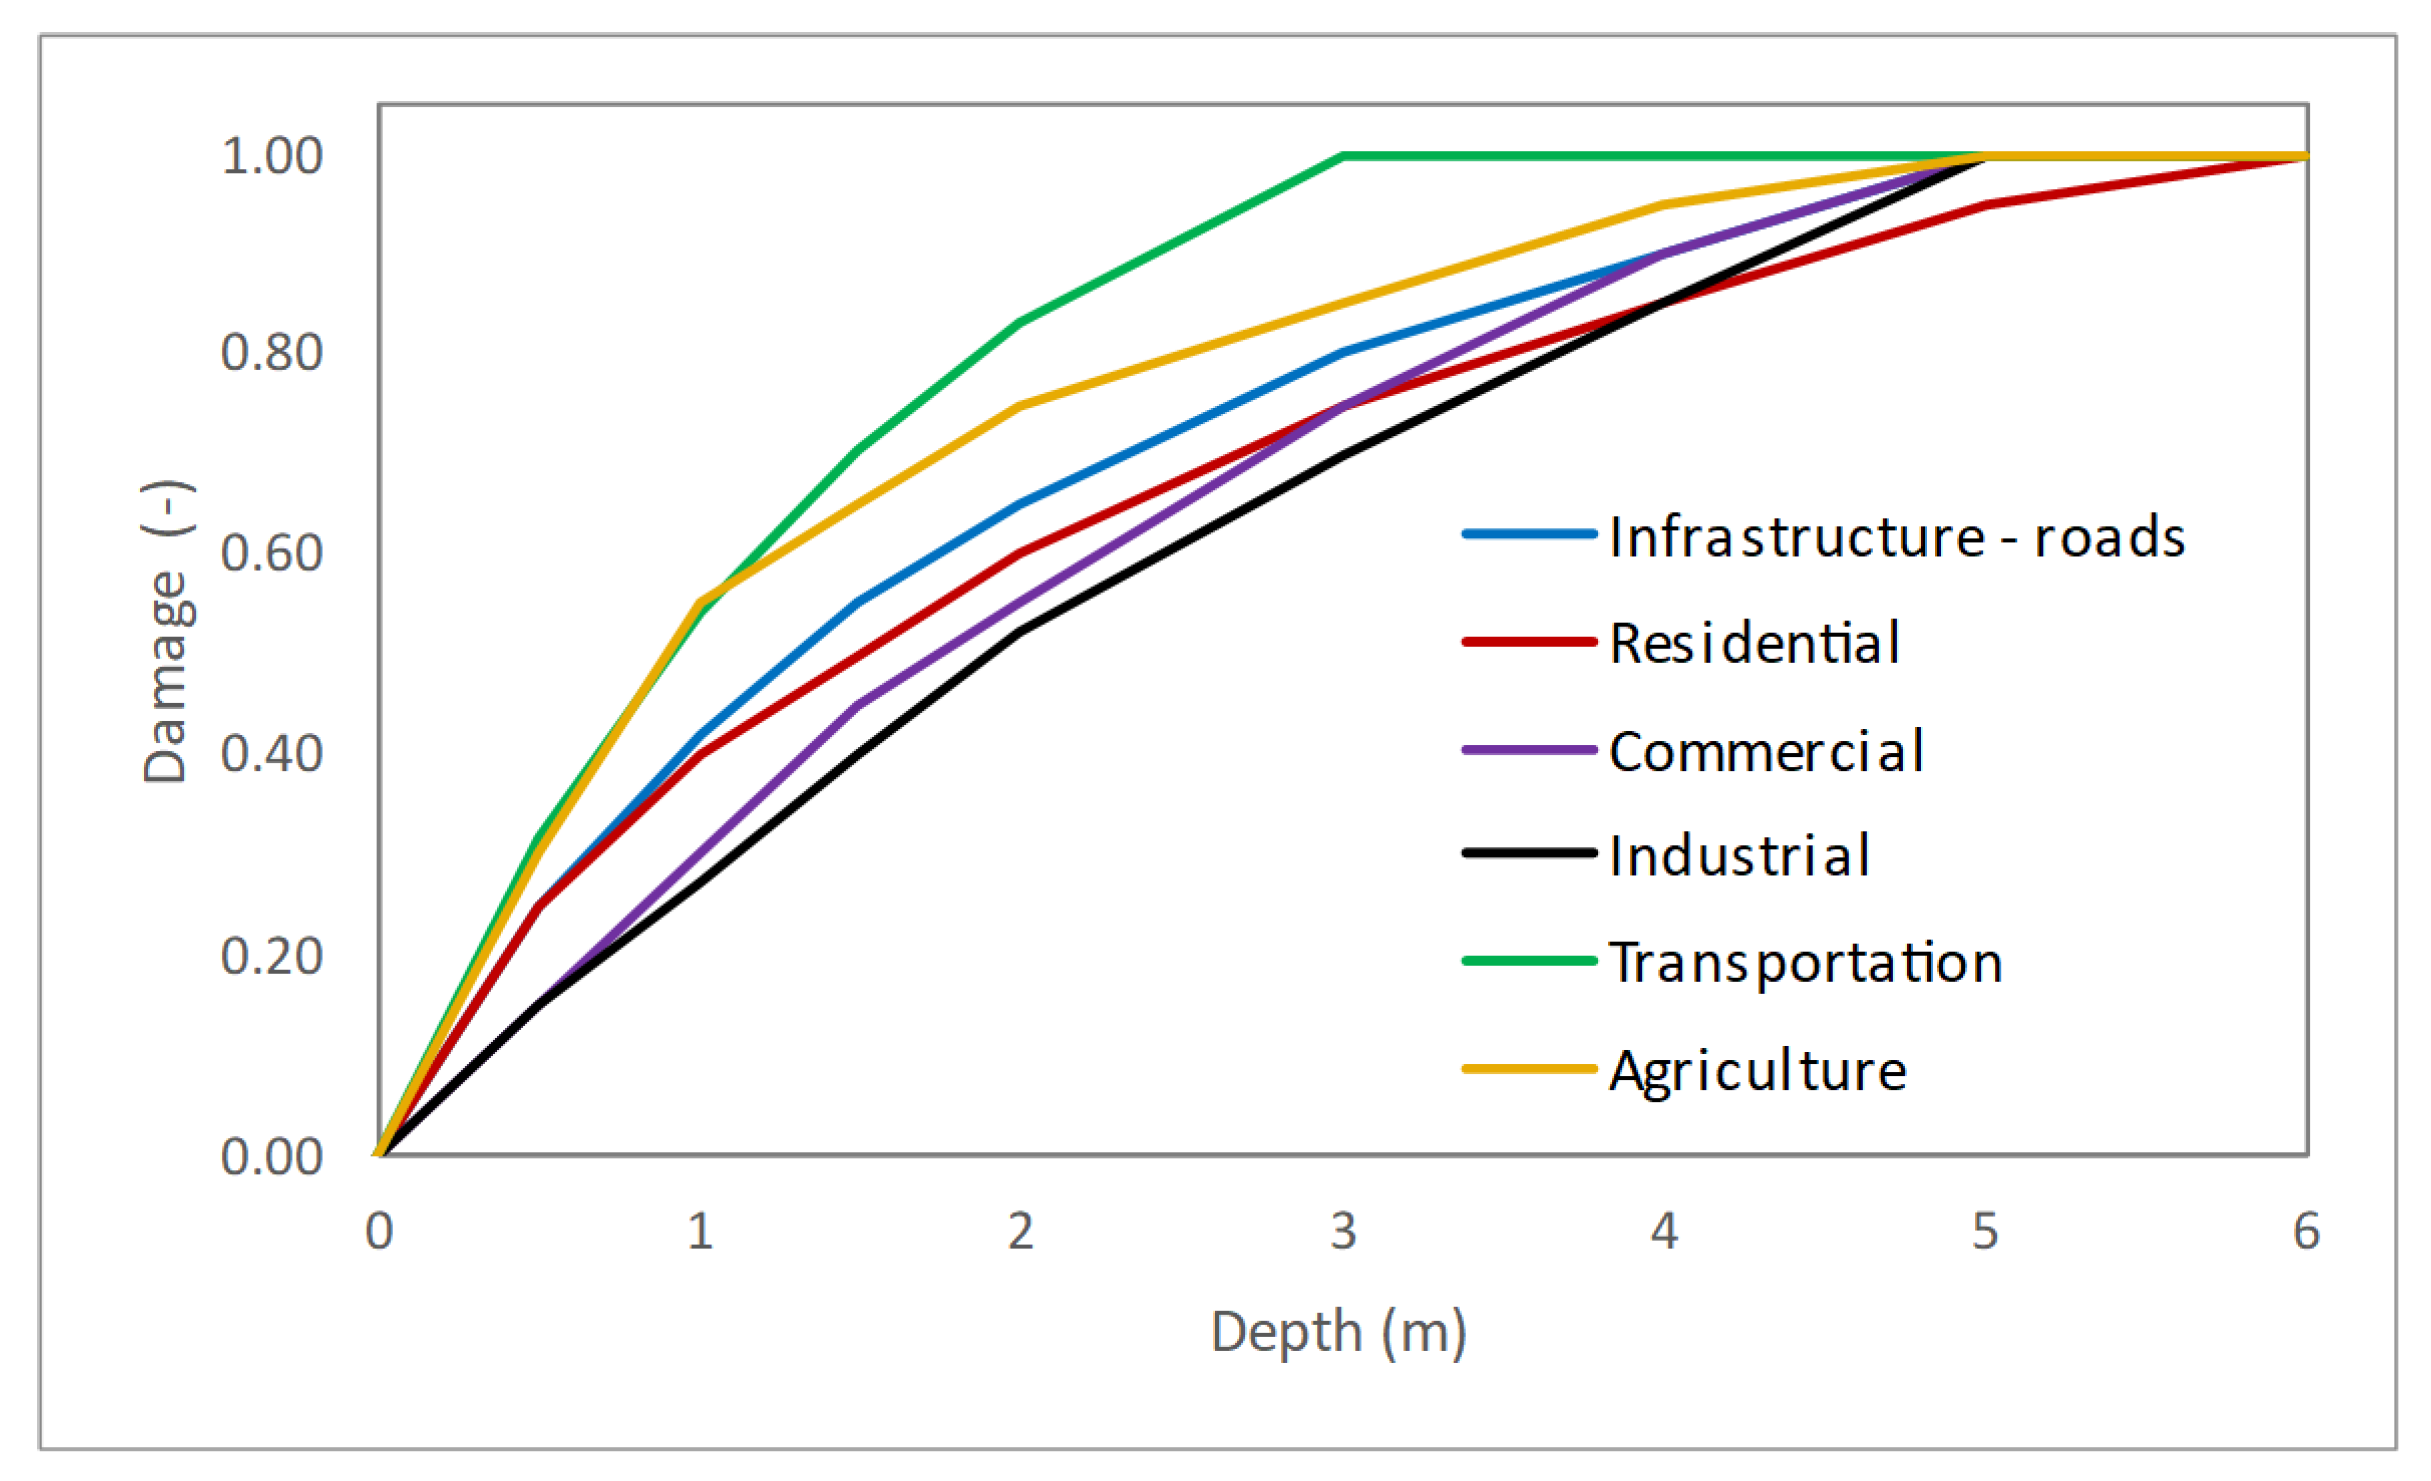
2.4. Vulnerability Analysis
Under the proposed methodology, we indirectly assessed three dimensions of vulnerability: (a) physical vulnerability related to physical damage to buildings, roads, and land; (b) social vulnerability related to injuries, unavailability of public services, and damage to cultural heritage; and (c) environmental vulnerability related to damage to protected areas and damage to facilities that may cause pollution. We adopted the definition of vulnerability that includes exposure analysis (receptors affected by a flood scenario with a certain probability) and susceptibility analysis (specific characteristics that make receptors prone to being harmed or damaged by a flood scenario associated with a certain probability) [12,74].
To this end, we collected and processed relevant spatial data, which are presented in Table 5. To obtain land-use data, we used the Natura 2000 (N2K) land-cover and land-use (LC/LU) product of the Copernicus Land Monitoring Service, which is more detailed than the Corine Land Cover. The N2K vector layers are based on satellite image classification and distinguish 55 thematic LC/LU classes specified by ecosystem type. The minimum mapping unit is 0.5 ha with a minimum mapping width of 10 m. Individual building footprints, as well as road and rail network were taken from OpenStreetMap (OSM). Population data (number of inhabitants in each settlement) was provided by the Croatian Bureau of Statistics (census from 2021) and evenly distributed over the building footprint.
Table 5.
Spatial data used for the flood risk analysis in the Gospić catchment.
Public facilities such as emergency services, educational facilities, transportation, cemeteries, etc., were taken from a previous project at the national level and from Google Maps (using Google Earth Engine) and corrected by manual digitization. Facilities potentially causing pollution, such as industrial plants (e-PRTR), SEVESO facilities, gas stations, and landfills, and protected areas (including Natura 2000 sites) were provided by the Ministry of Economy and Sustainable Development of the Republic of Croatia (these data are freely available through the WFS service). Cultural heritage sites were provided by the Ministry of Culture of the Republic of Croatia, also via the open WFS service.
Exposure to flooding, i.e., identification of receptors at risk, was assessed by overlaying subjects (population) and objects (buildings, roads, land-use data) with flood hazard maps (the extent of flooding for each probability scenario). In addition, we included exposure of protected areas, cultural heritage, public services, and facilities that could potentially cause pollution.
Susceptibility to flooding was assessed at the land-use level. For each land-use category, the commonly used depth–damage curves were used [74]. These curves express the relative economic damage of receptors (in this case, land-use categories) as a function of water depth [75,76]. Furthermore, these curves are typically related to specific regional characteristics, which limits their application in different economic contexts [12]. In this study, we used the later JRC model [76], which provides a comprehensive list of the values, damages, and depth–damage functions used in different countries, followed by recommendations for each continent and country. All damages and functions refer to six land-use categories: (a) residential (RES), (b) commercial (COM), (c) industrial (IND), (d) transportation (TRA), (e) infrastructure—roads (INF), and (f) agriculture (AGR). Figure 6 shows the depth–damage curves for the six major land-use categories.
Figure 6.
Depth–damage curves for different land-use categories [76].
For each category, 2010 construction costs are also provided in the JRC manual [76]. For some categories (RES, COM, IND, and AGR), values are available for Croatia, while for the others (TRA, INF), only EU-level values are available. When data for Croatia were not available, they were extrapolated from EU values based on the ratio of gross domestic product (GDP) per inhabitant between the EU and Croatia for 2010. All data were then extrapolated to 2020 using the consumer price index (CPI). Both economic indicators (GDP and CPI) were taken from the official World Bank database for the corresponding year.
2.5. Flood Risk Analysis
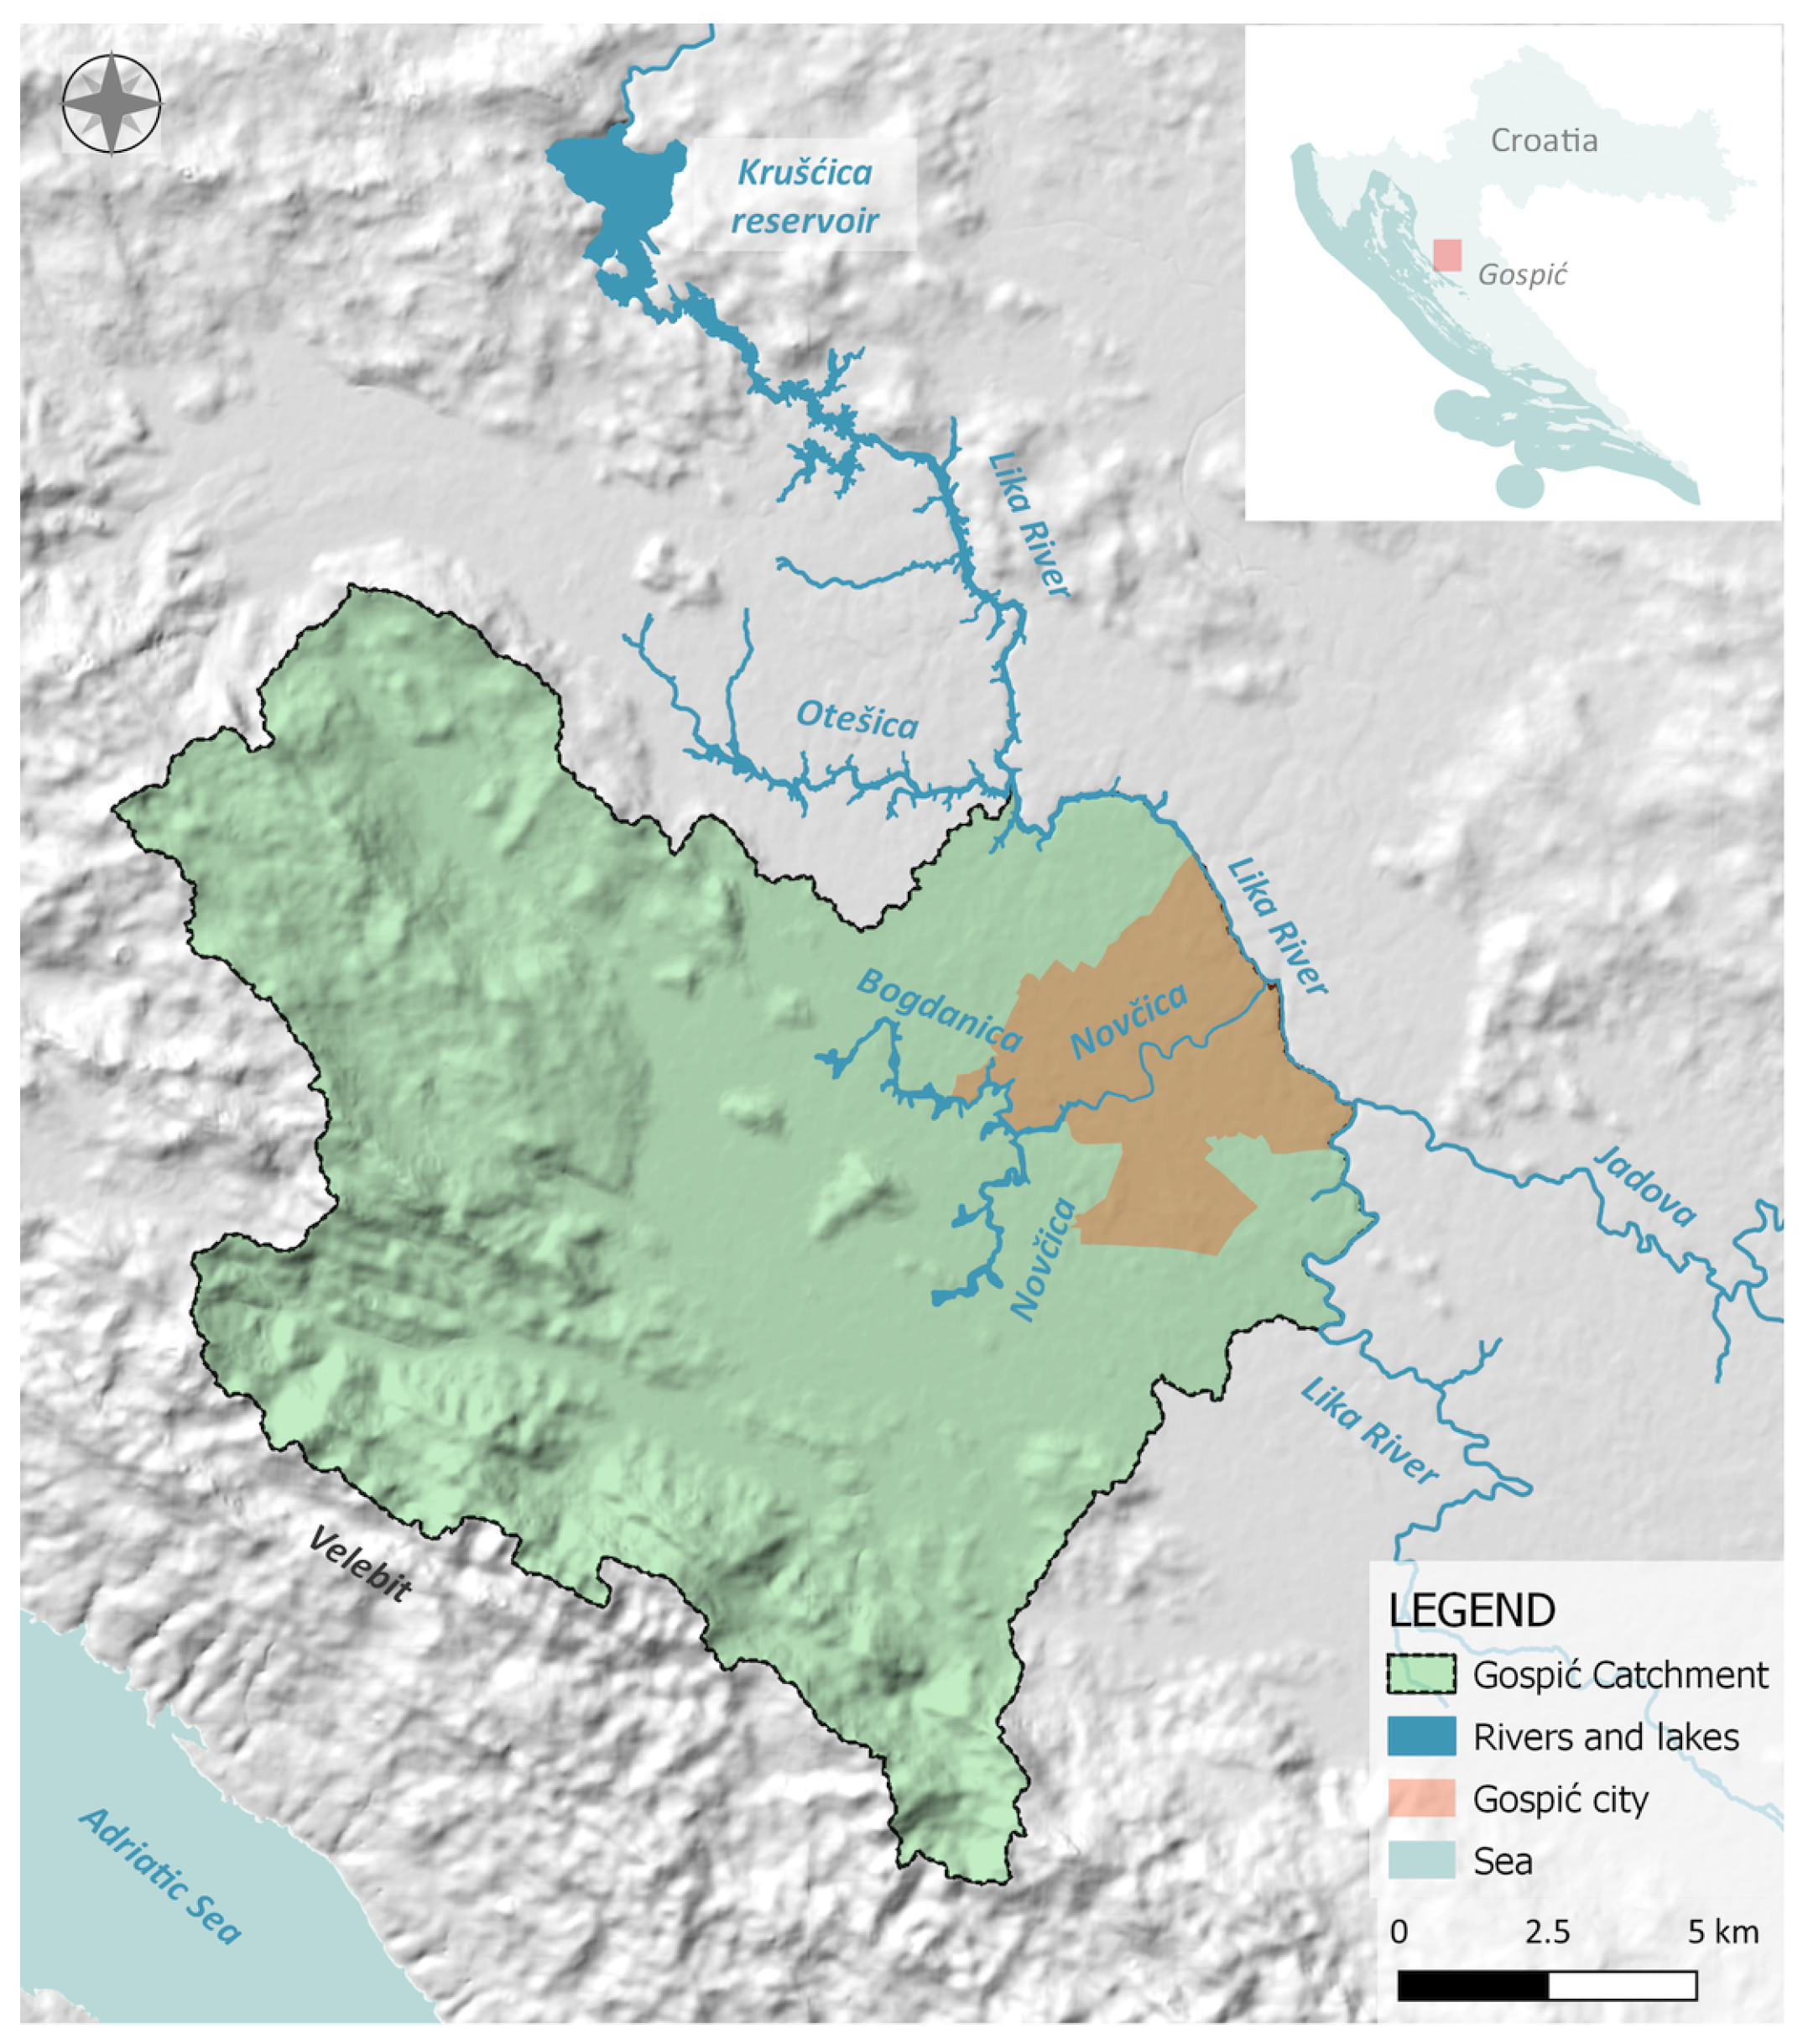
The qualitative risk was estimated by overlaying the exposure of selected receptors (people, buildings, and roads) with the flood severity map. Due to the lack of more detailed data, susceptibility was neglected at this stage and a risk level was assigned directly as a one-to-one function of flood severity, e.g., a receptor exposed to a flood severity of S1 was assigned a risk level of R1 for a given probability scenario (H, M, or L). This risk analysis focused on the social flood risk category by emphasizing flood severity (loss of stability, injuries, fatalities, traffic disruptions, etc.), rather than damage.
Quantitative risk assessment focuses on damages and was conducted in more detail. Direct damage D expresses the expected damage as a result of each flood probability scenario (H, M, or L). The damage was calculated by combining the water depth map (flood hazard) with the land-use exposure map [12]. For each exposed land-use category, maximum potential damage was corrected by a depth–damage curve based on that category and the water depth at that location. Because the analysis was conducted at the catchment scale, we used a pixel-based approach in which damages were calculated per area of each pixel (5 × 5 m). In this way, direct damages are expressed in EUR/m2. Finally, we integrated the maps of direct damages for each probability scenario using a weighted average to express the expected annual damages (EADs) in EUR/m2/year by using Equation (1):
where is the probability of the i-th scenario and is the damage in each j-th pixel for the i-th scenario.
Finally, all risk maps were spatially integrated to provide a quantitative measure of flood risk at the catchment level by calculating direct damages, population density, length of roads, and number of buildings at risk for a given range of flood probabilities.
2.6. Study Area
Gospić is a small rural town in the mountainous and sparsely populated Lika region of Croatia. Although it is the administrative center of Ličko-senjska County, it has only 11,464 inhabitants. It should be noted that small- and medium-sized towns, as well as rural settlements face the same risks associated with urbanization, unlike larger towns without well-developed non-structural measures (protection and preparedness) [77]. They often have fewer financial and human resources and infrastructures or less-specialized administrations [78]. Birkmann et al. [79] looked at city size in relation to vulnerability to flooding and showed that small and medium-sized cities have stronger barriers to dealing with heavy rainfall than large cities because they are particularly vulnerable and susceptible to natural hazards and climate change and often have limited capacity to build resilience.
The main topographic feature of Lika is the hilly mountainous area of Velebit in the western part and the flat area of the Lika valley in the eastern part. According to the Koppen climate classification, most of central Lika has the characteristic Cfsbx climate class (the temperate warm rainy climate) [80]. It is a moderately humid climate, where the average temperature in the coldest month is below −3 °C, while summers are relatively cool, and the monthly temperature in the hottest month is below 22 °C. The driest part of the year falls in the warm season, and there are two rainfall maxima: a primary one in late autumn and a secondary one at the beginning of the warm part of the year. The higher parts of the Velebit mountains above 1200 m a.s.l. have the characteristics of a D climate, i.e., a boreal or subarctic climate. The higher parts of the central and southern Velebit receive on average more than 2500 mm of precipitation per year, and the amount of precipitation decreases towards the central part. In the central Lika Valley, Gospić (564 m a.s.l.) receives an average of 1419 mm, while stations further away register only 1186 mm.
The town of Gospić is located in the central part of the Lika River basin. This is a 64.5 km-long perennial river that sinks into several smaller and larger sinkholes and flows underground [80]. Its catchment area is 1227 km2. High water levels occur in winter, while it nearly dries up in summer, so there are large seasonal variations. In this study, we focused on the Gospić catchment, which includes the river Novčica (which flows into the Lika River) with its tributary Bogdanica (see Figure 7). The total area of the Gospić catchment is 238 km2.
Figure 7.
Geographic location of the Gospić catchment with the main hydrographic elements (rivers and reservoirs).
In the city of Gospić, forests and agricultural land occupy 93% of the total area [80]. Therefore, these are very important resources for the development of the city. In the total structure of agricultural land, arable land, as the most-productive part, accounts for only 22%. The special quality of this area is the relatively large amounts of water and underground and surface streams, which are a very important resource for the water supply of a larger area and as a source of water energy within the Kruščica reservoir for the needs of the Senj Power Plant. In addition, the energy reservoir is partly a source of water for the regional water supply system of the Croatian coast. Unfortunately, the Kruščica reservoir has a negative backwater effect on the high water levels of the Lika and Novčica rivers (which extend upstream from Gospić), exacerbating flooding in the Gospić catchment area during heavy rainfall events.
3. Results
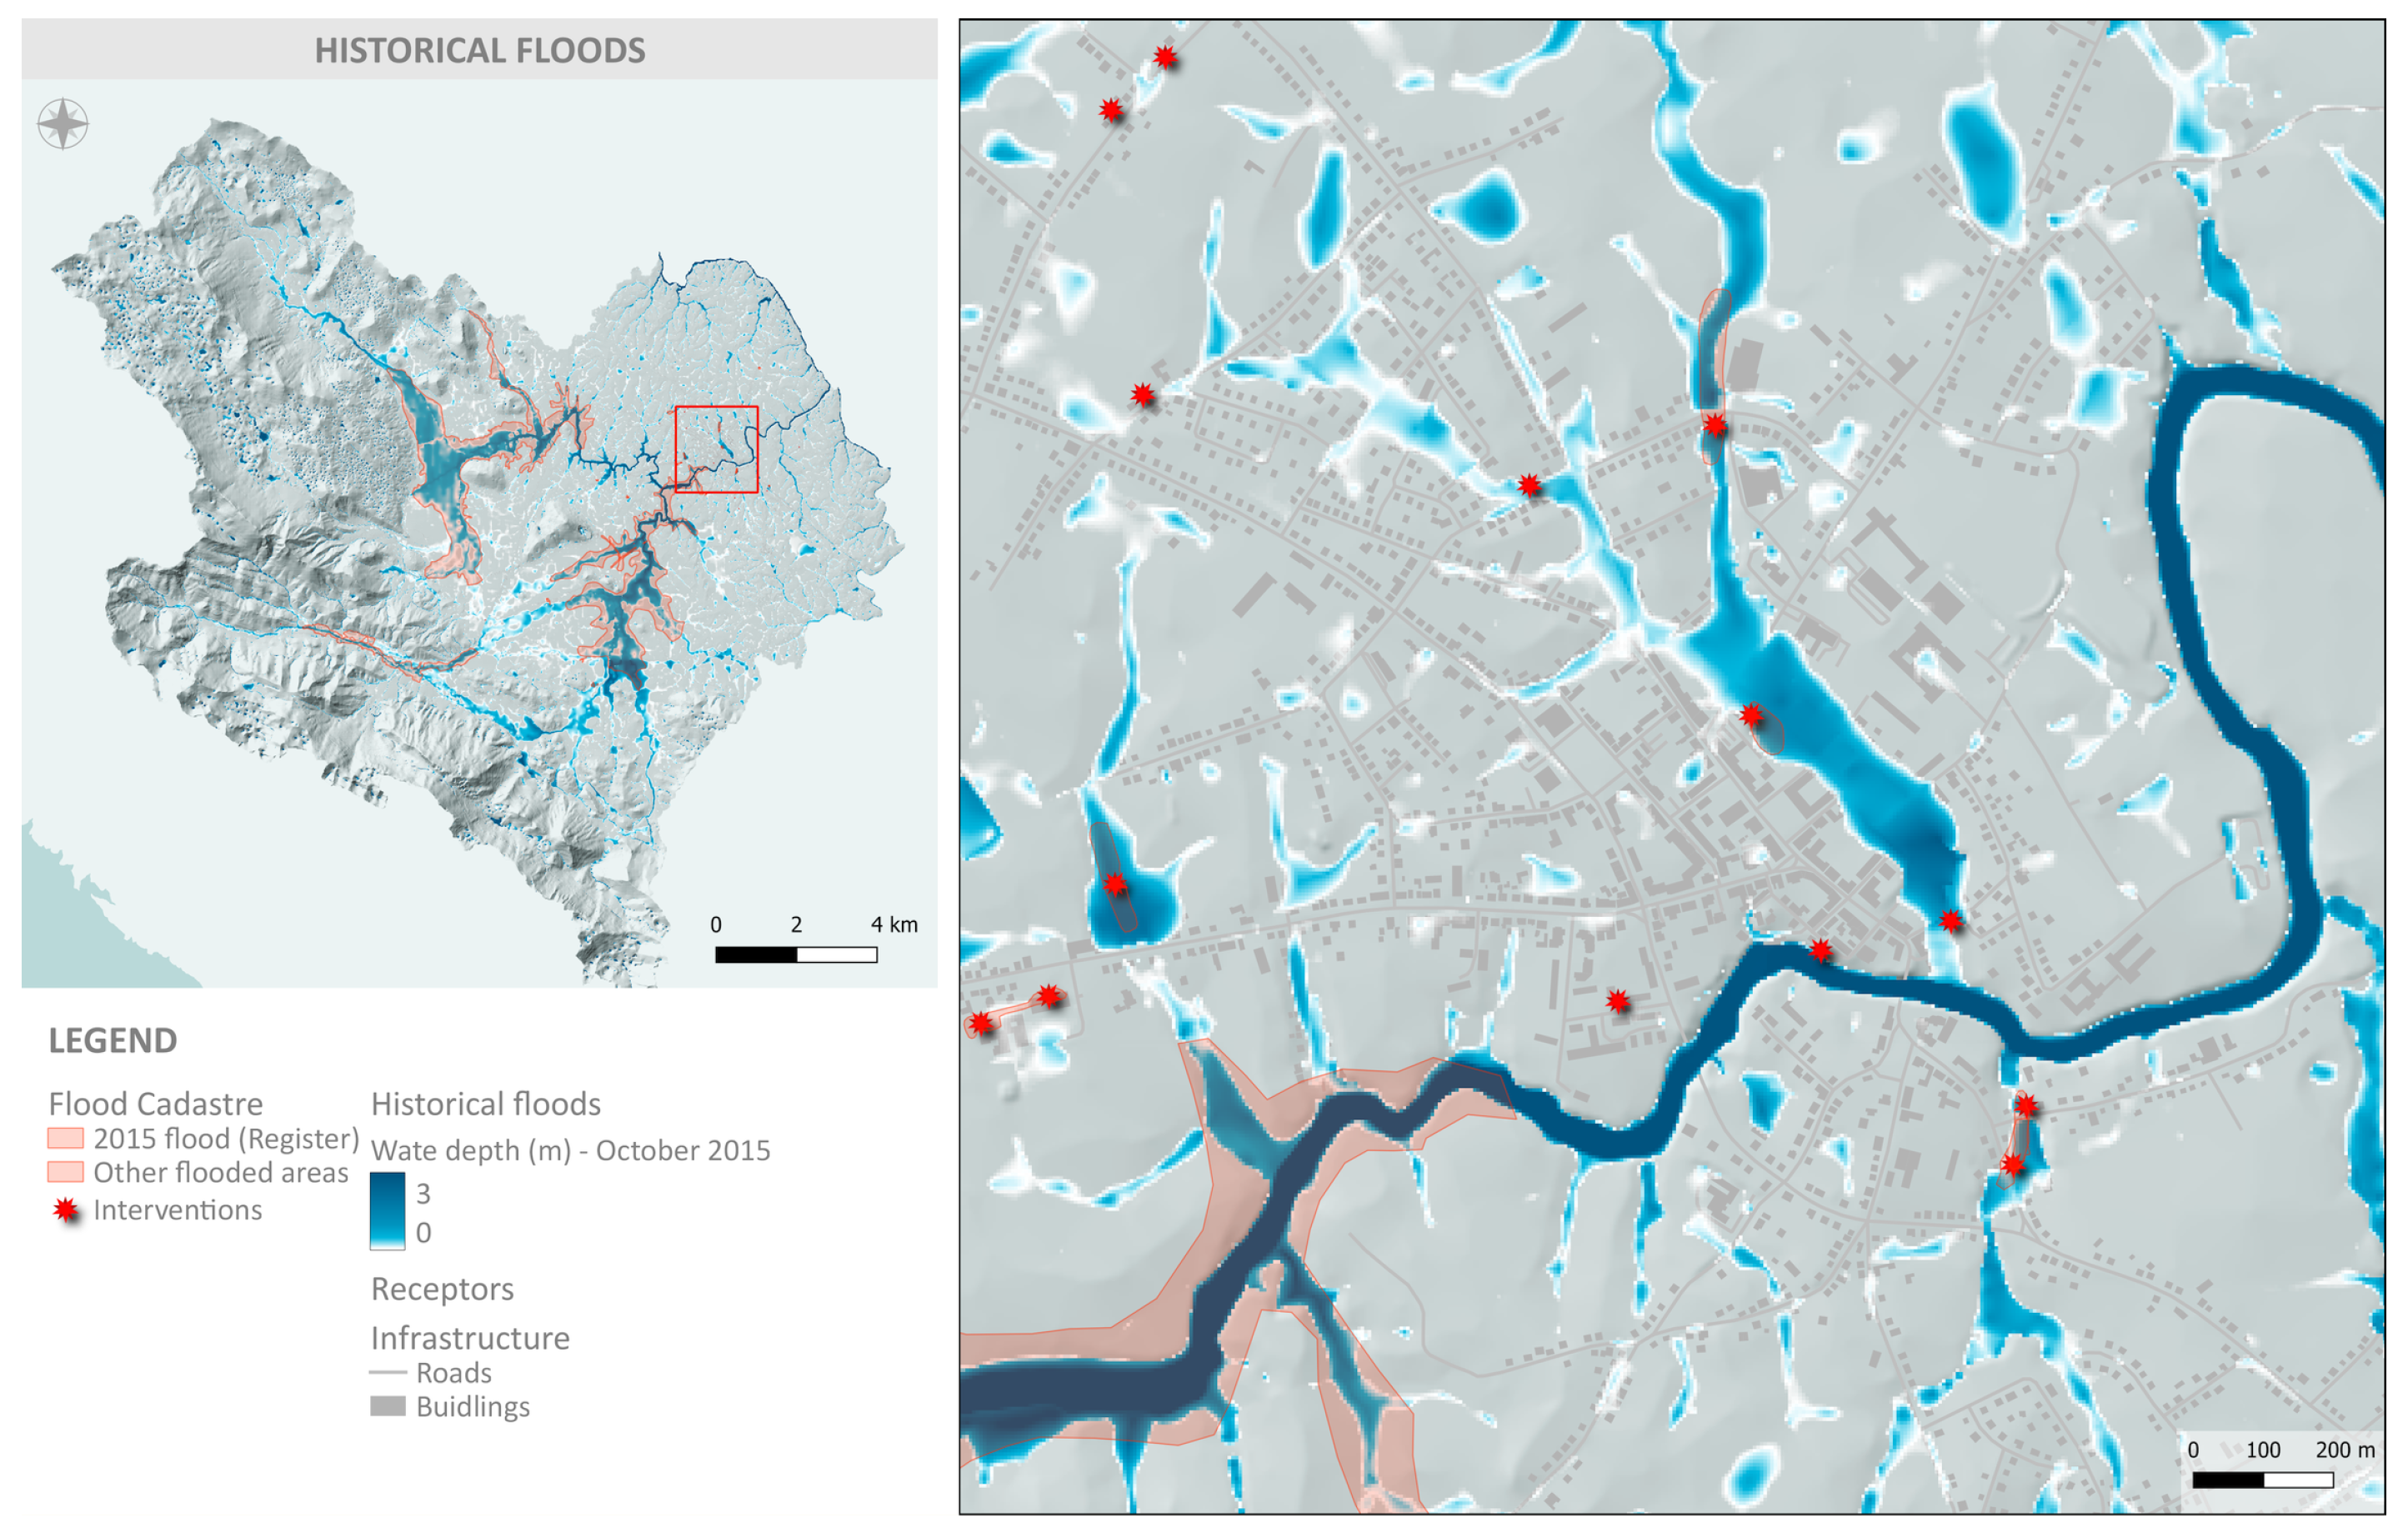
3.1. Historical Floods
A recent historical flood in the Gospić region was selected for calibration and validation of the hydrologic–hydraulic model. We focused on the flood event that occurred between 14 and 15 October 2015. Within 48 h, a total of 196 mm of rainfall was recorded at the Gospić meteorological station, including 151 mm in 24 h and 69 mm in 3 h. This rainfall has an occurrence probability of 2 to 4 % (depending on the duration).
According to local news reports, flooding occurred in the wider area of Gospić due to heavy rainfall and overflowing of the river channels of Novčica, Bogdanica, and Tisovac. As a result, Croatian Waters called for extraordinary flood protection measures. A number of residential and commercial buildings were flooded, traffic was disrupted, and several private vehicles and tractors were trapped underwater. In addition, water turbidity increased, making the water undrinkable in many settlements. The official extent of flooding was taken from Croatian Waters from the Flood Registry, and the specific locations of the flood interventions were recorded by the fire department and civil defense services.
After comparing the flood extent from the flood register and the locations of flood interventions, the infiltration (CN number) was corrected in several places. Figure 8 shows the modeled water depths for the 2015 flood and the flood extent from the Flood Registry, as well as the intervention locations. Overall, the agreement is satisfactory. The flood extent from the Flood Registry is based on field reports and analysis of GIS using a lower-resolution topographic map (1:25,000 scale). Therefore, the estimated flood extent (from the Flood Registry) is slightly larger (and less accurate) than the simulated flood extent.
Figure 8.
Simulated water depths for the 2015 flood compared to the flood extent from the Flood Registry and the intervention locations obtained from the firefighter and civil protection service.
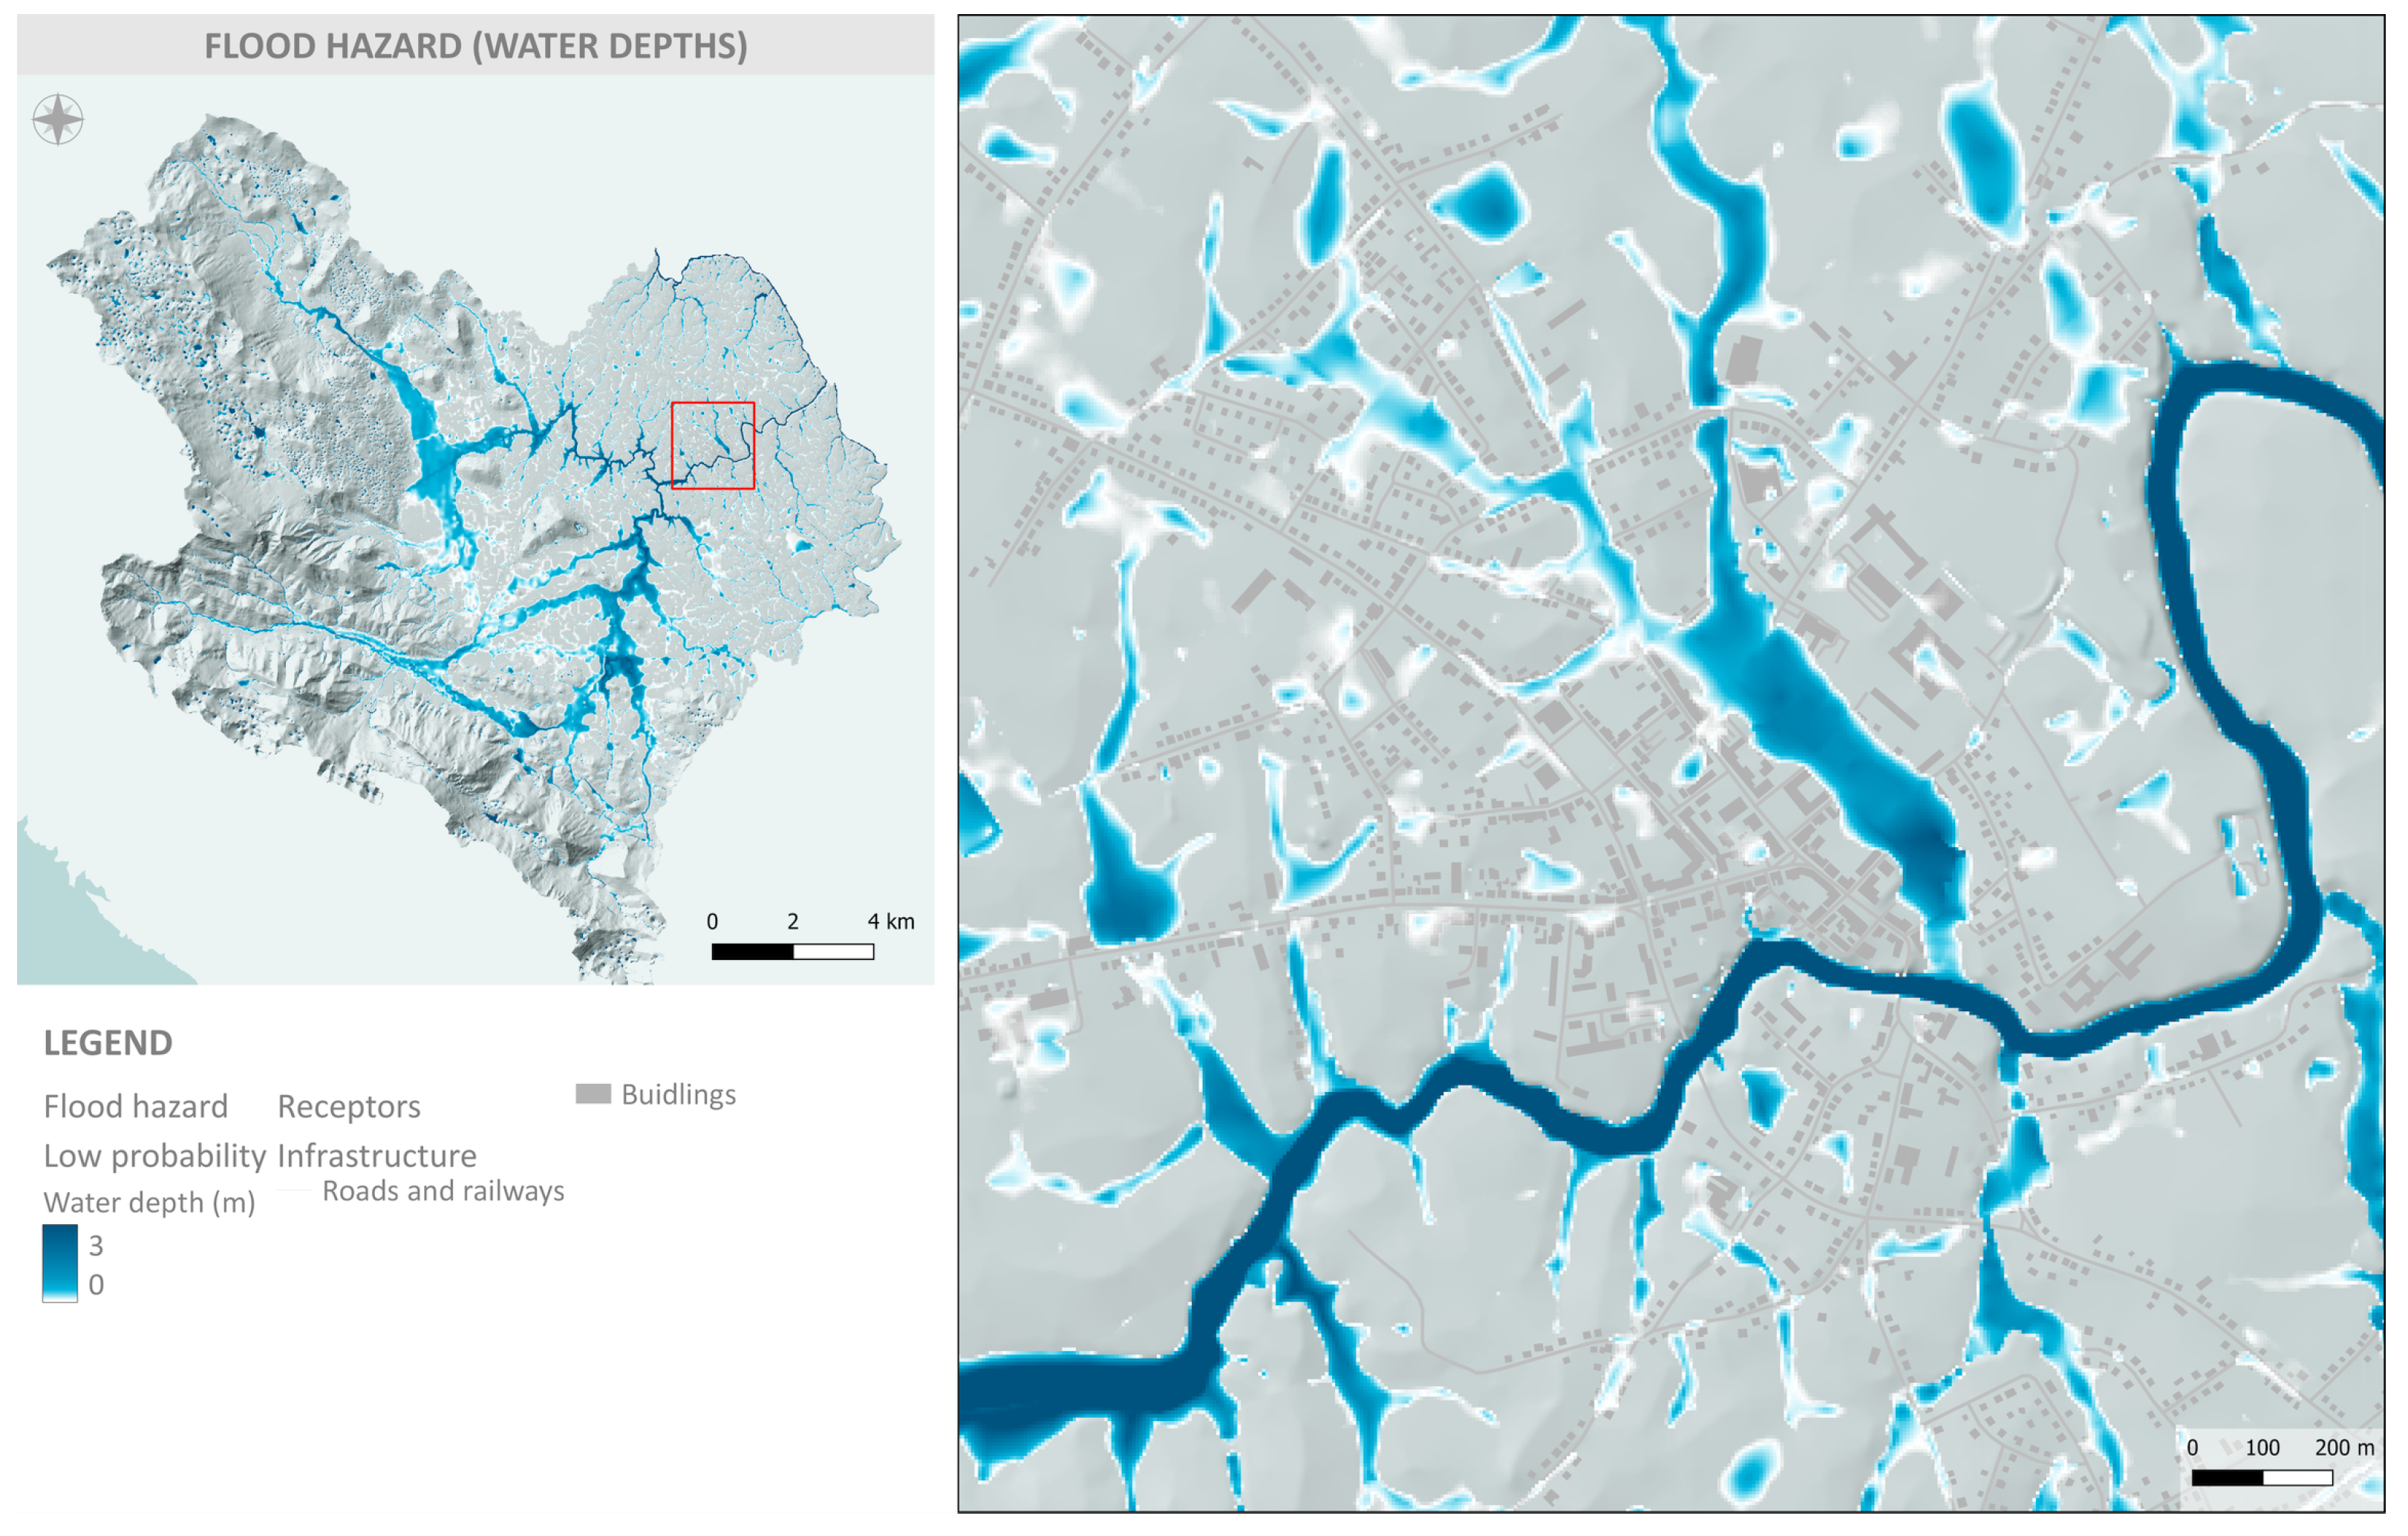
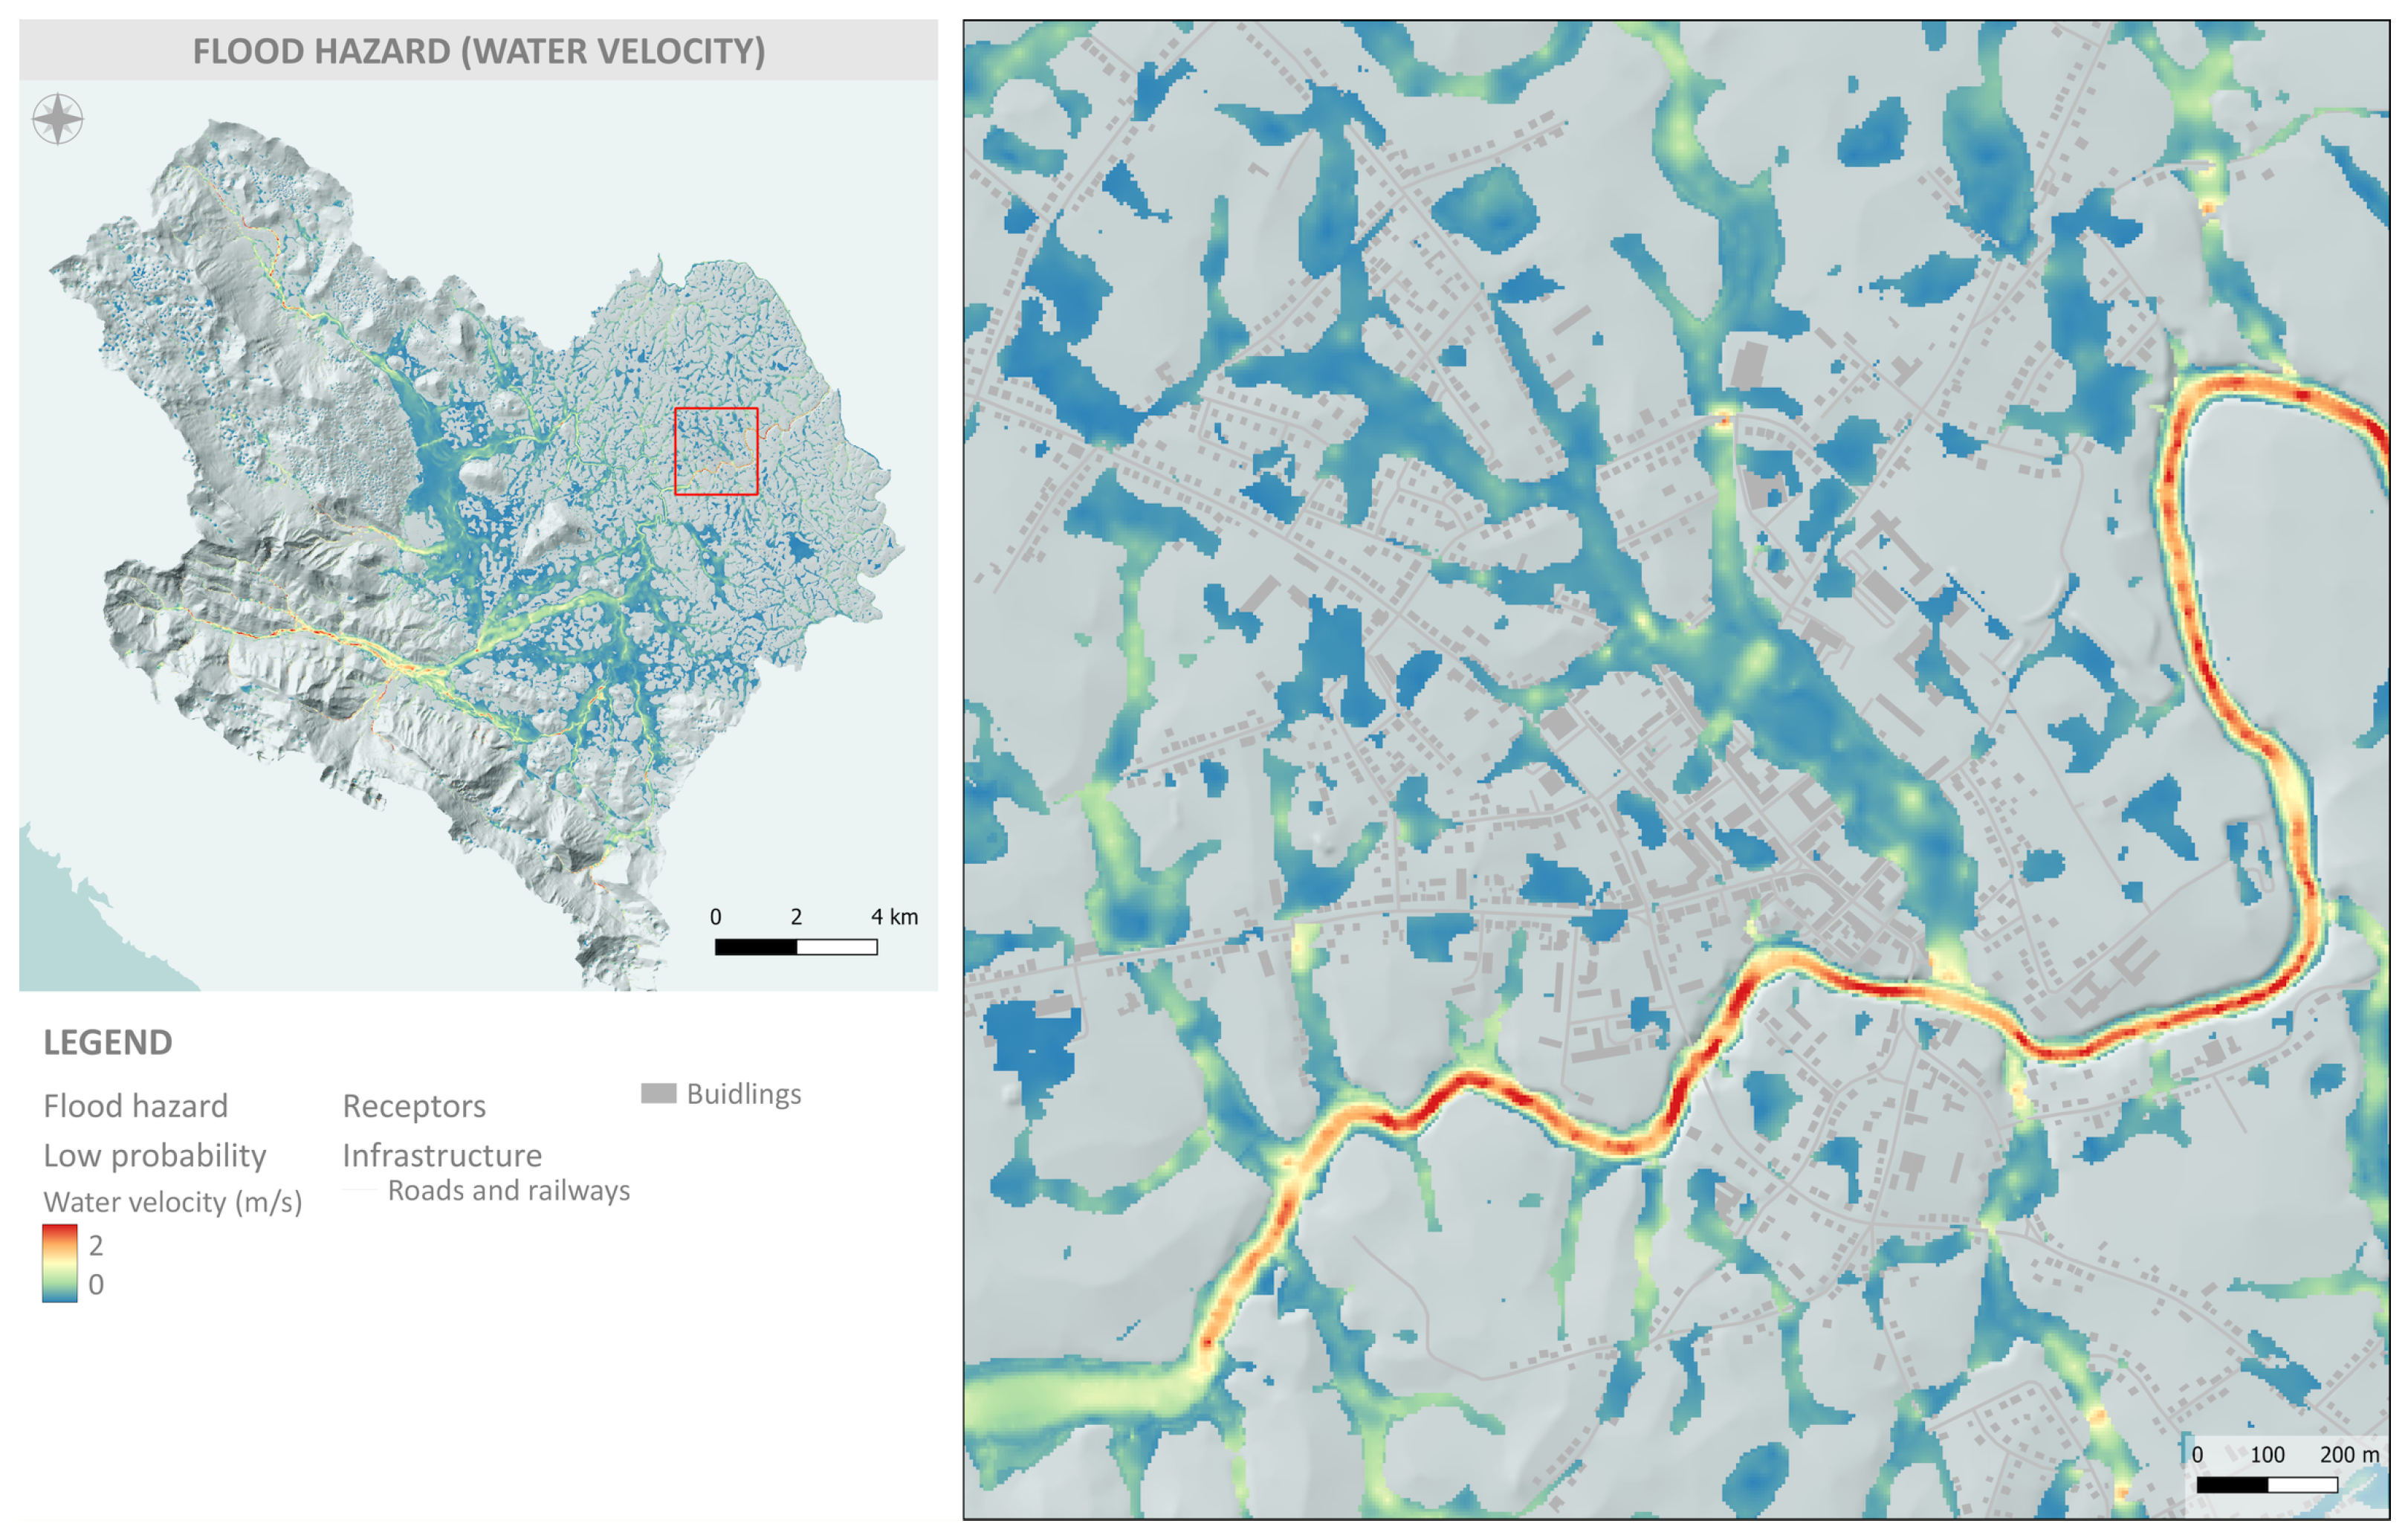
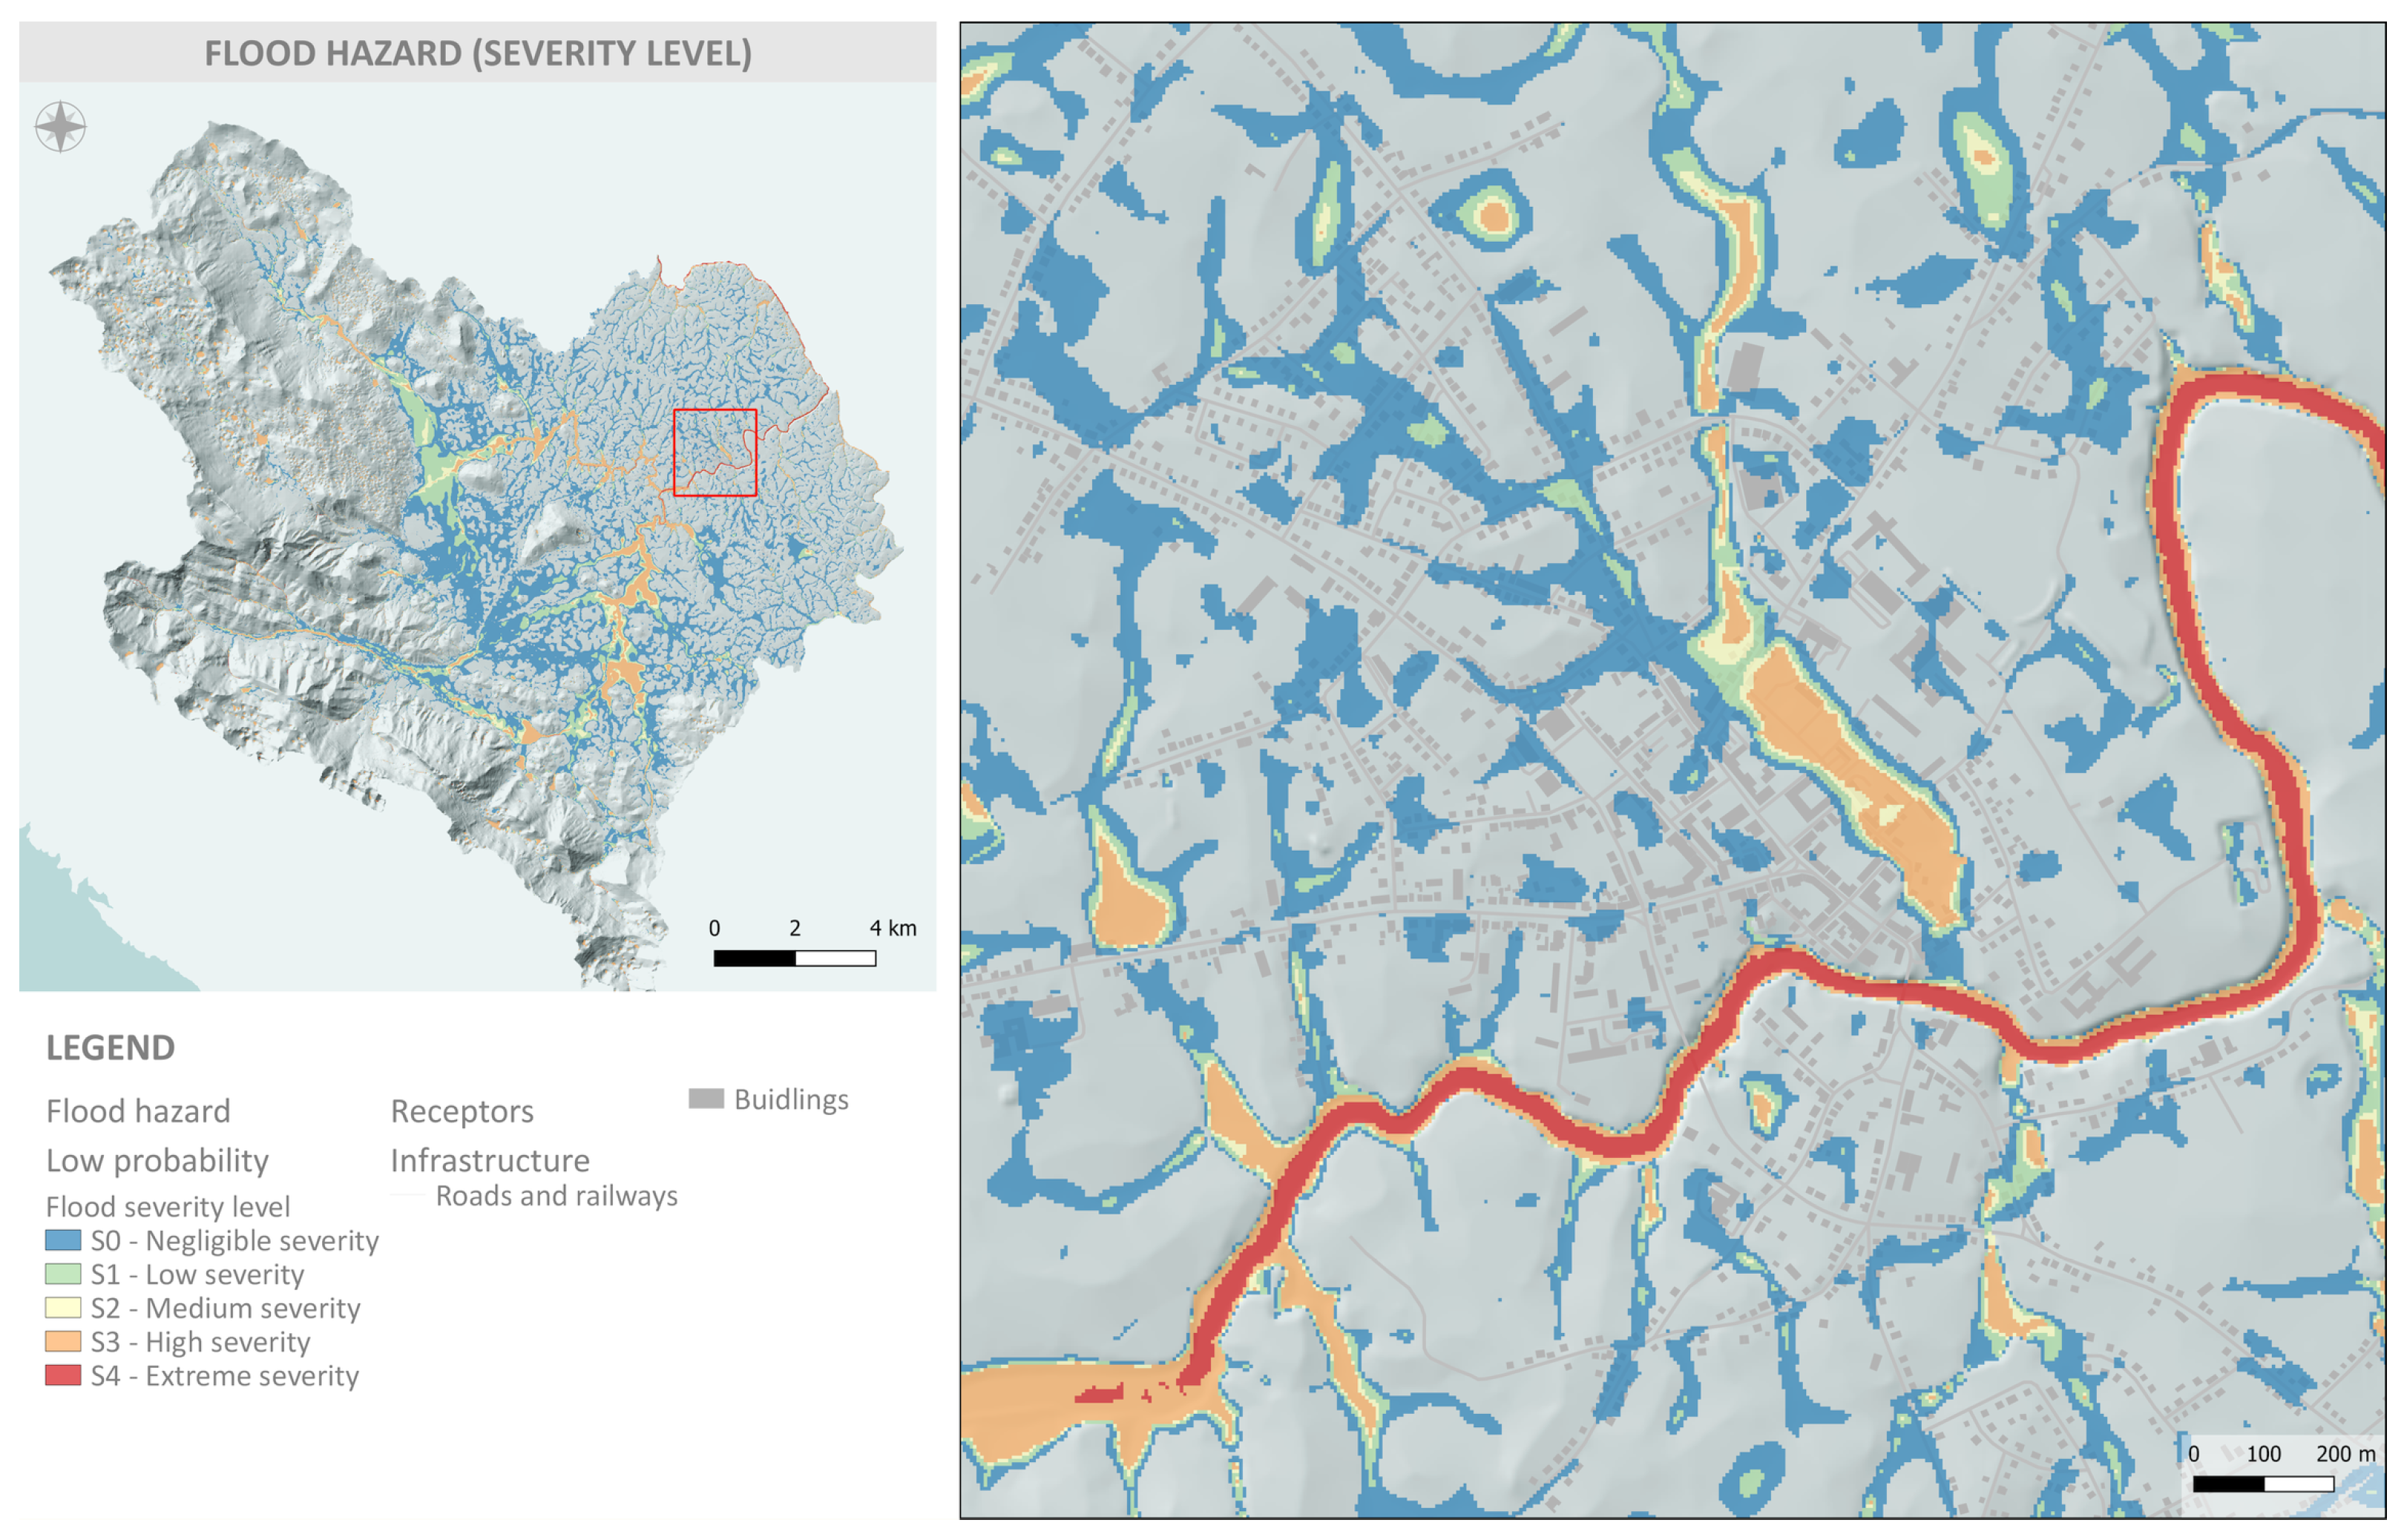
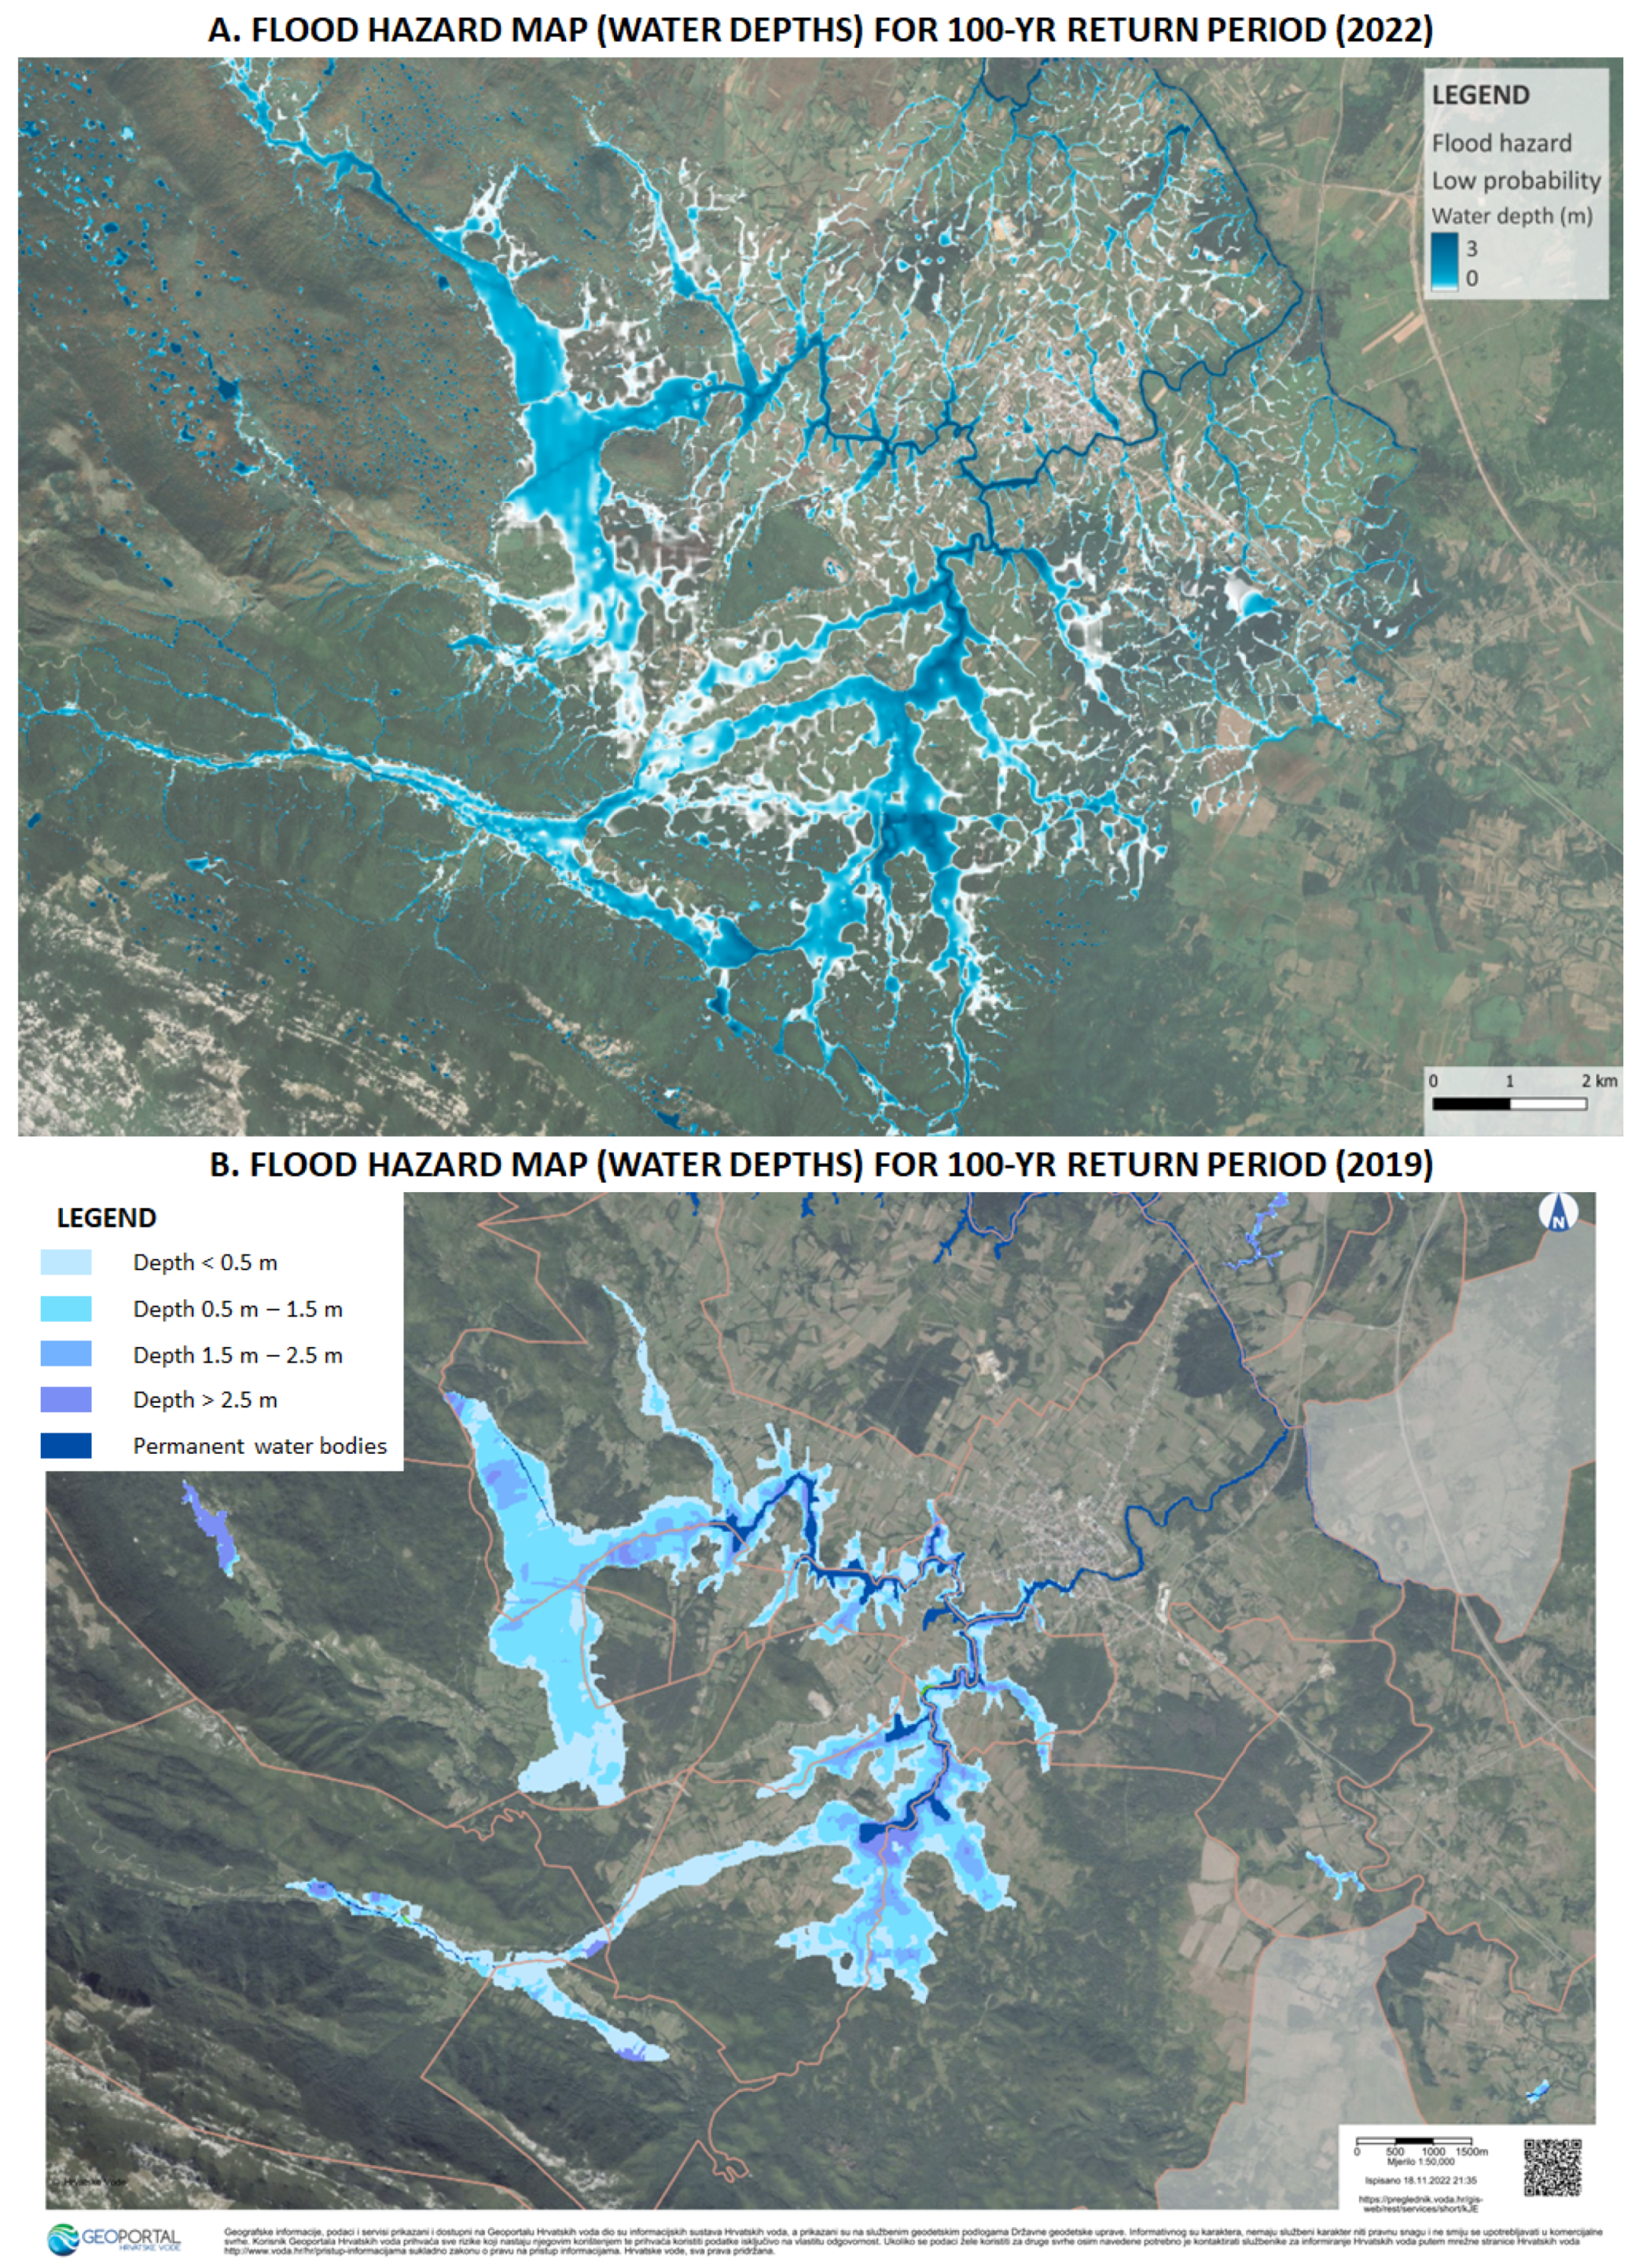
3.2. Pluvial Flash Flood Hazard
Pluvial flash flood hazard was analyzed for three probabilities: (a) low probability (100-year return period), (b) medium probability (25-year return period), and (c) high probability (5-year return period). For each probability, six simulations were run for different rainfall durations defined by a corresponding design storm (see Figure 3). Simulation results—water depth, water velocity, and flood severity—were mapped by calculating the envelope over the entire rainfall duration for each probability.
Figure 9, Figure 10 and Figure 11 show the PFF hazard maps—water depth, water velocity, and flood severity—for a low probability (100-year return period) in the Gospić catchment. The maps for pluvial flash floods provide detailed insight into flood generation processes. Floods in this catchment are primarily determined by torrential runoff from the mountainous area in the western part of the catchment to downstream lowlands and by hydrological processes in the Lika, Novčica, and Bogdanica rivers in the eastern part of the catchment. After the construction of the Sklope Dam and the formation of the Kruščica Reservoir, the natural course of the Lika River was altered, affecting the flow capacity in upstream channels and streams. The backwater effect caused by the high water level in the reservoir extends several kilometers upstream and negatively affects the water levels in the Novčica and Bogdanica rivers and their capacity to accept numerous smaller streams and surface runoff. In addition, the high water level of the Novčica negatively affects the water flow regime of numerous small torrents in the upstream Velebit Mountains. The problems in this catchment are well known and documented in the Croatian Flood Protection Plan.
Figure 9.
Flood hazard map—water depth—for a low probability in the Gospić catchment.
Figure 10.
Flood hazard map—water velocity—for a low probability in the Gospić catchment.
Figure 11.
Flood hazard map—flood severity level—for a low probability in the Gospić catchment.
However, the main problem during heavy short-term rainfall is not the overflow of water from rivers and streams. The local flooding processes are primarily characterized by a series of smaller torrents and the inability of surface water runoff to enter the main drainage channels and rivers due to their high water levels. In the urbanized part of the Gospić settlement, drainage channels are additionally stressed by the high imperviousness of the surface (i.e., built-up area, which prevents natural infiltration of water into the soil). The highest flow velocities are expected in the Novčica and Bogdanica watercourses and upstream streams and smaller tributaries. The highest severity is concentrated in flat areas around the main river channels and inside the urbanized area.
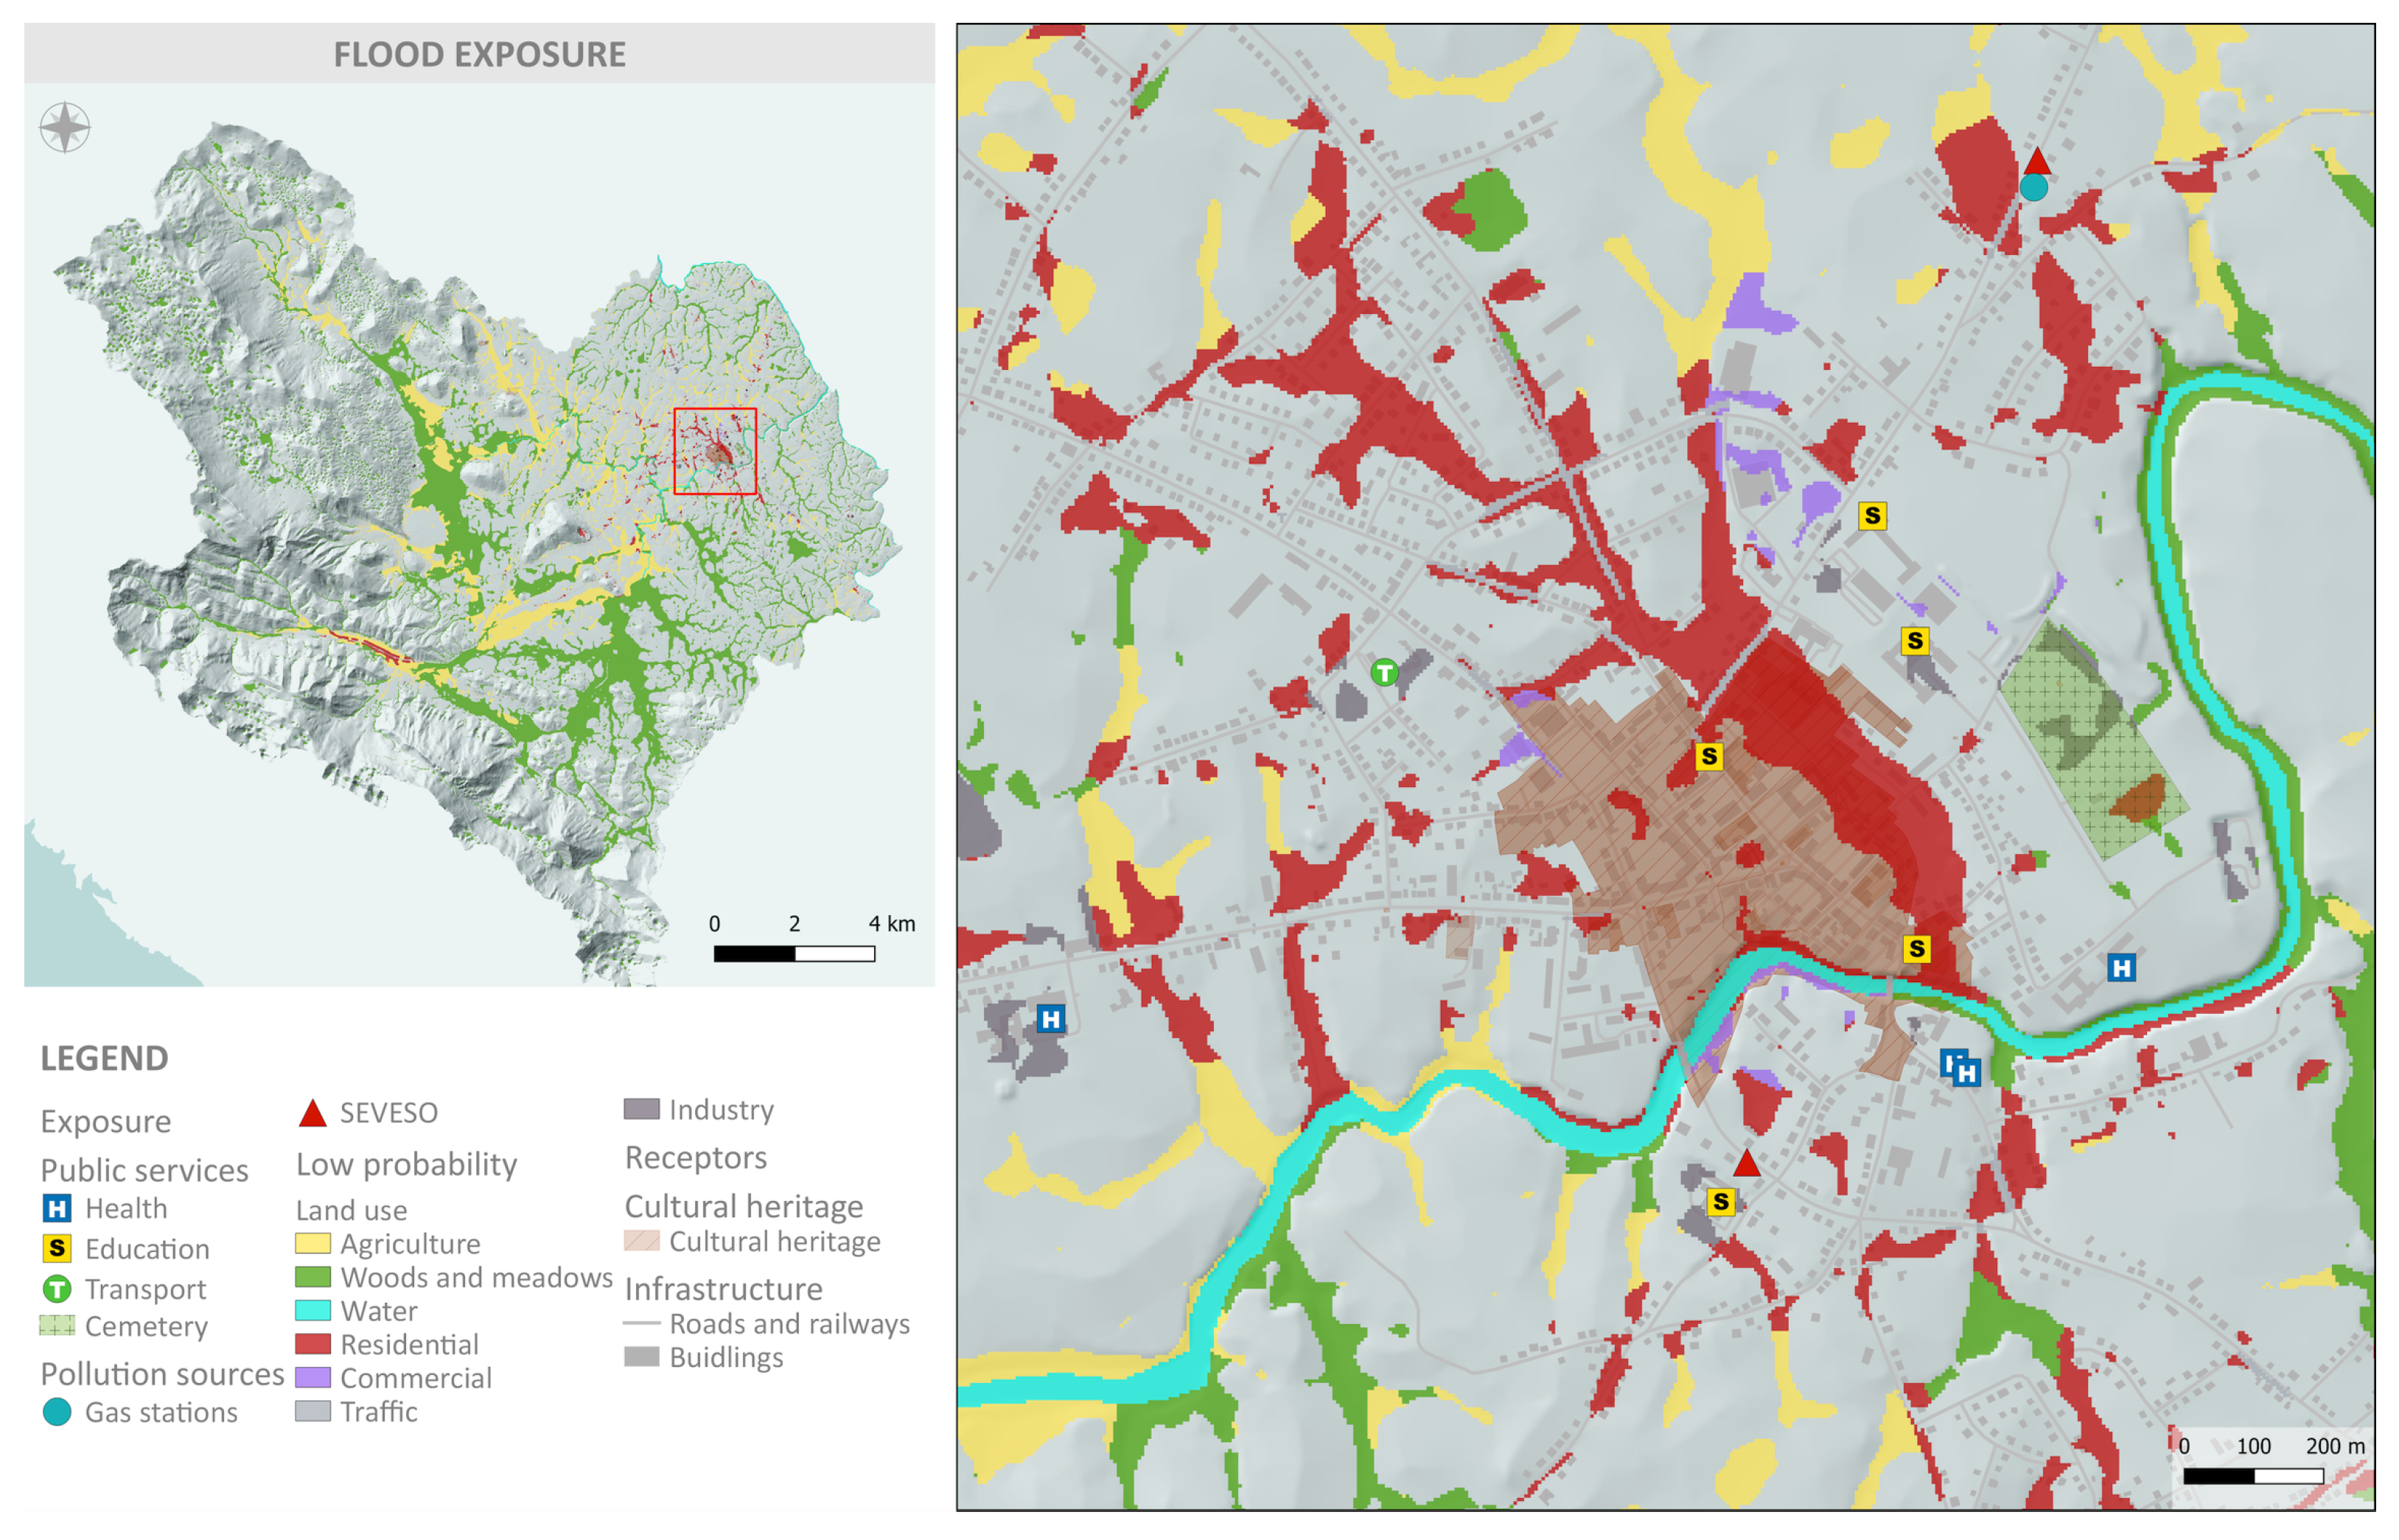
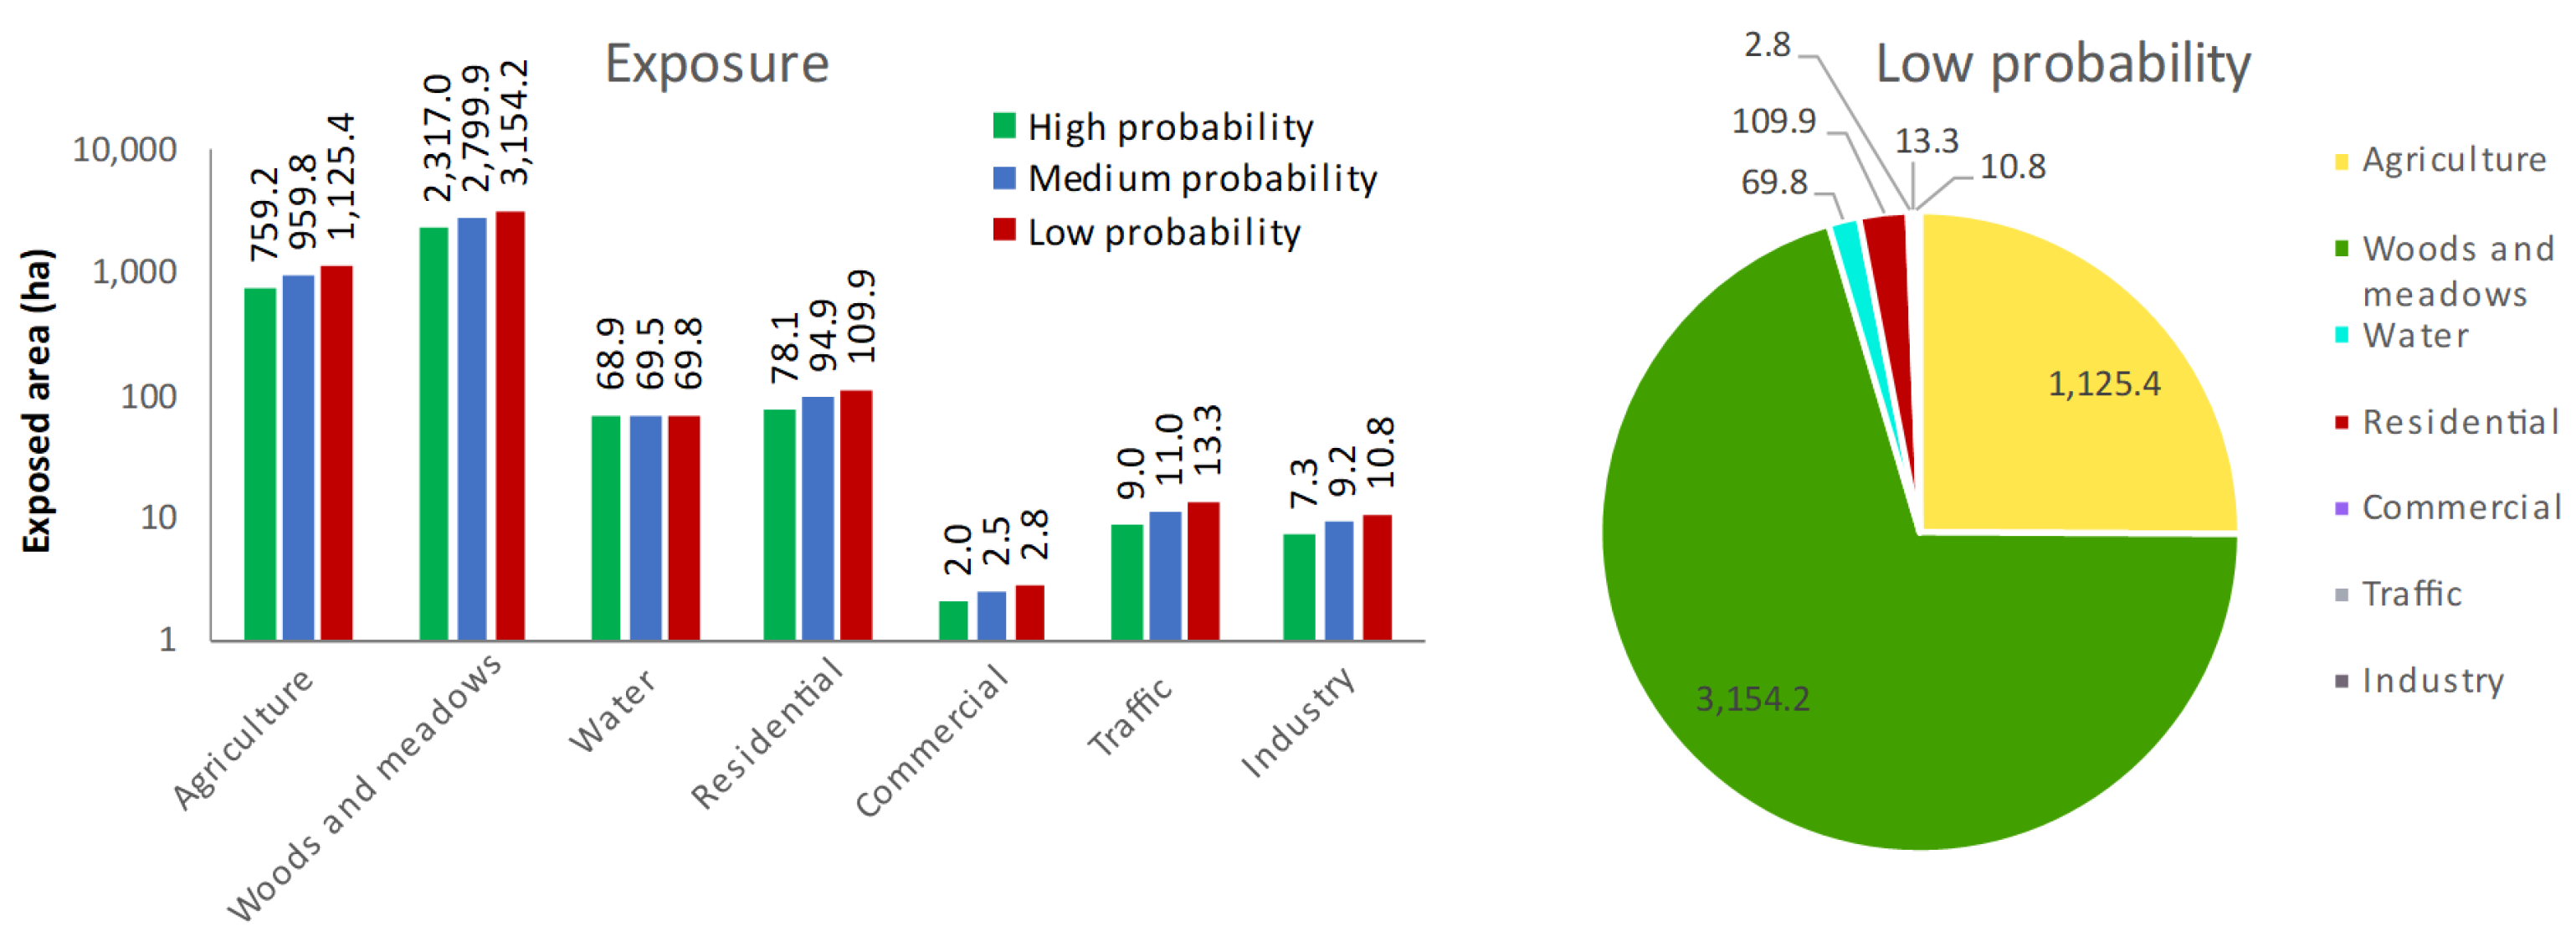
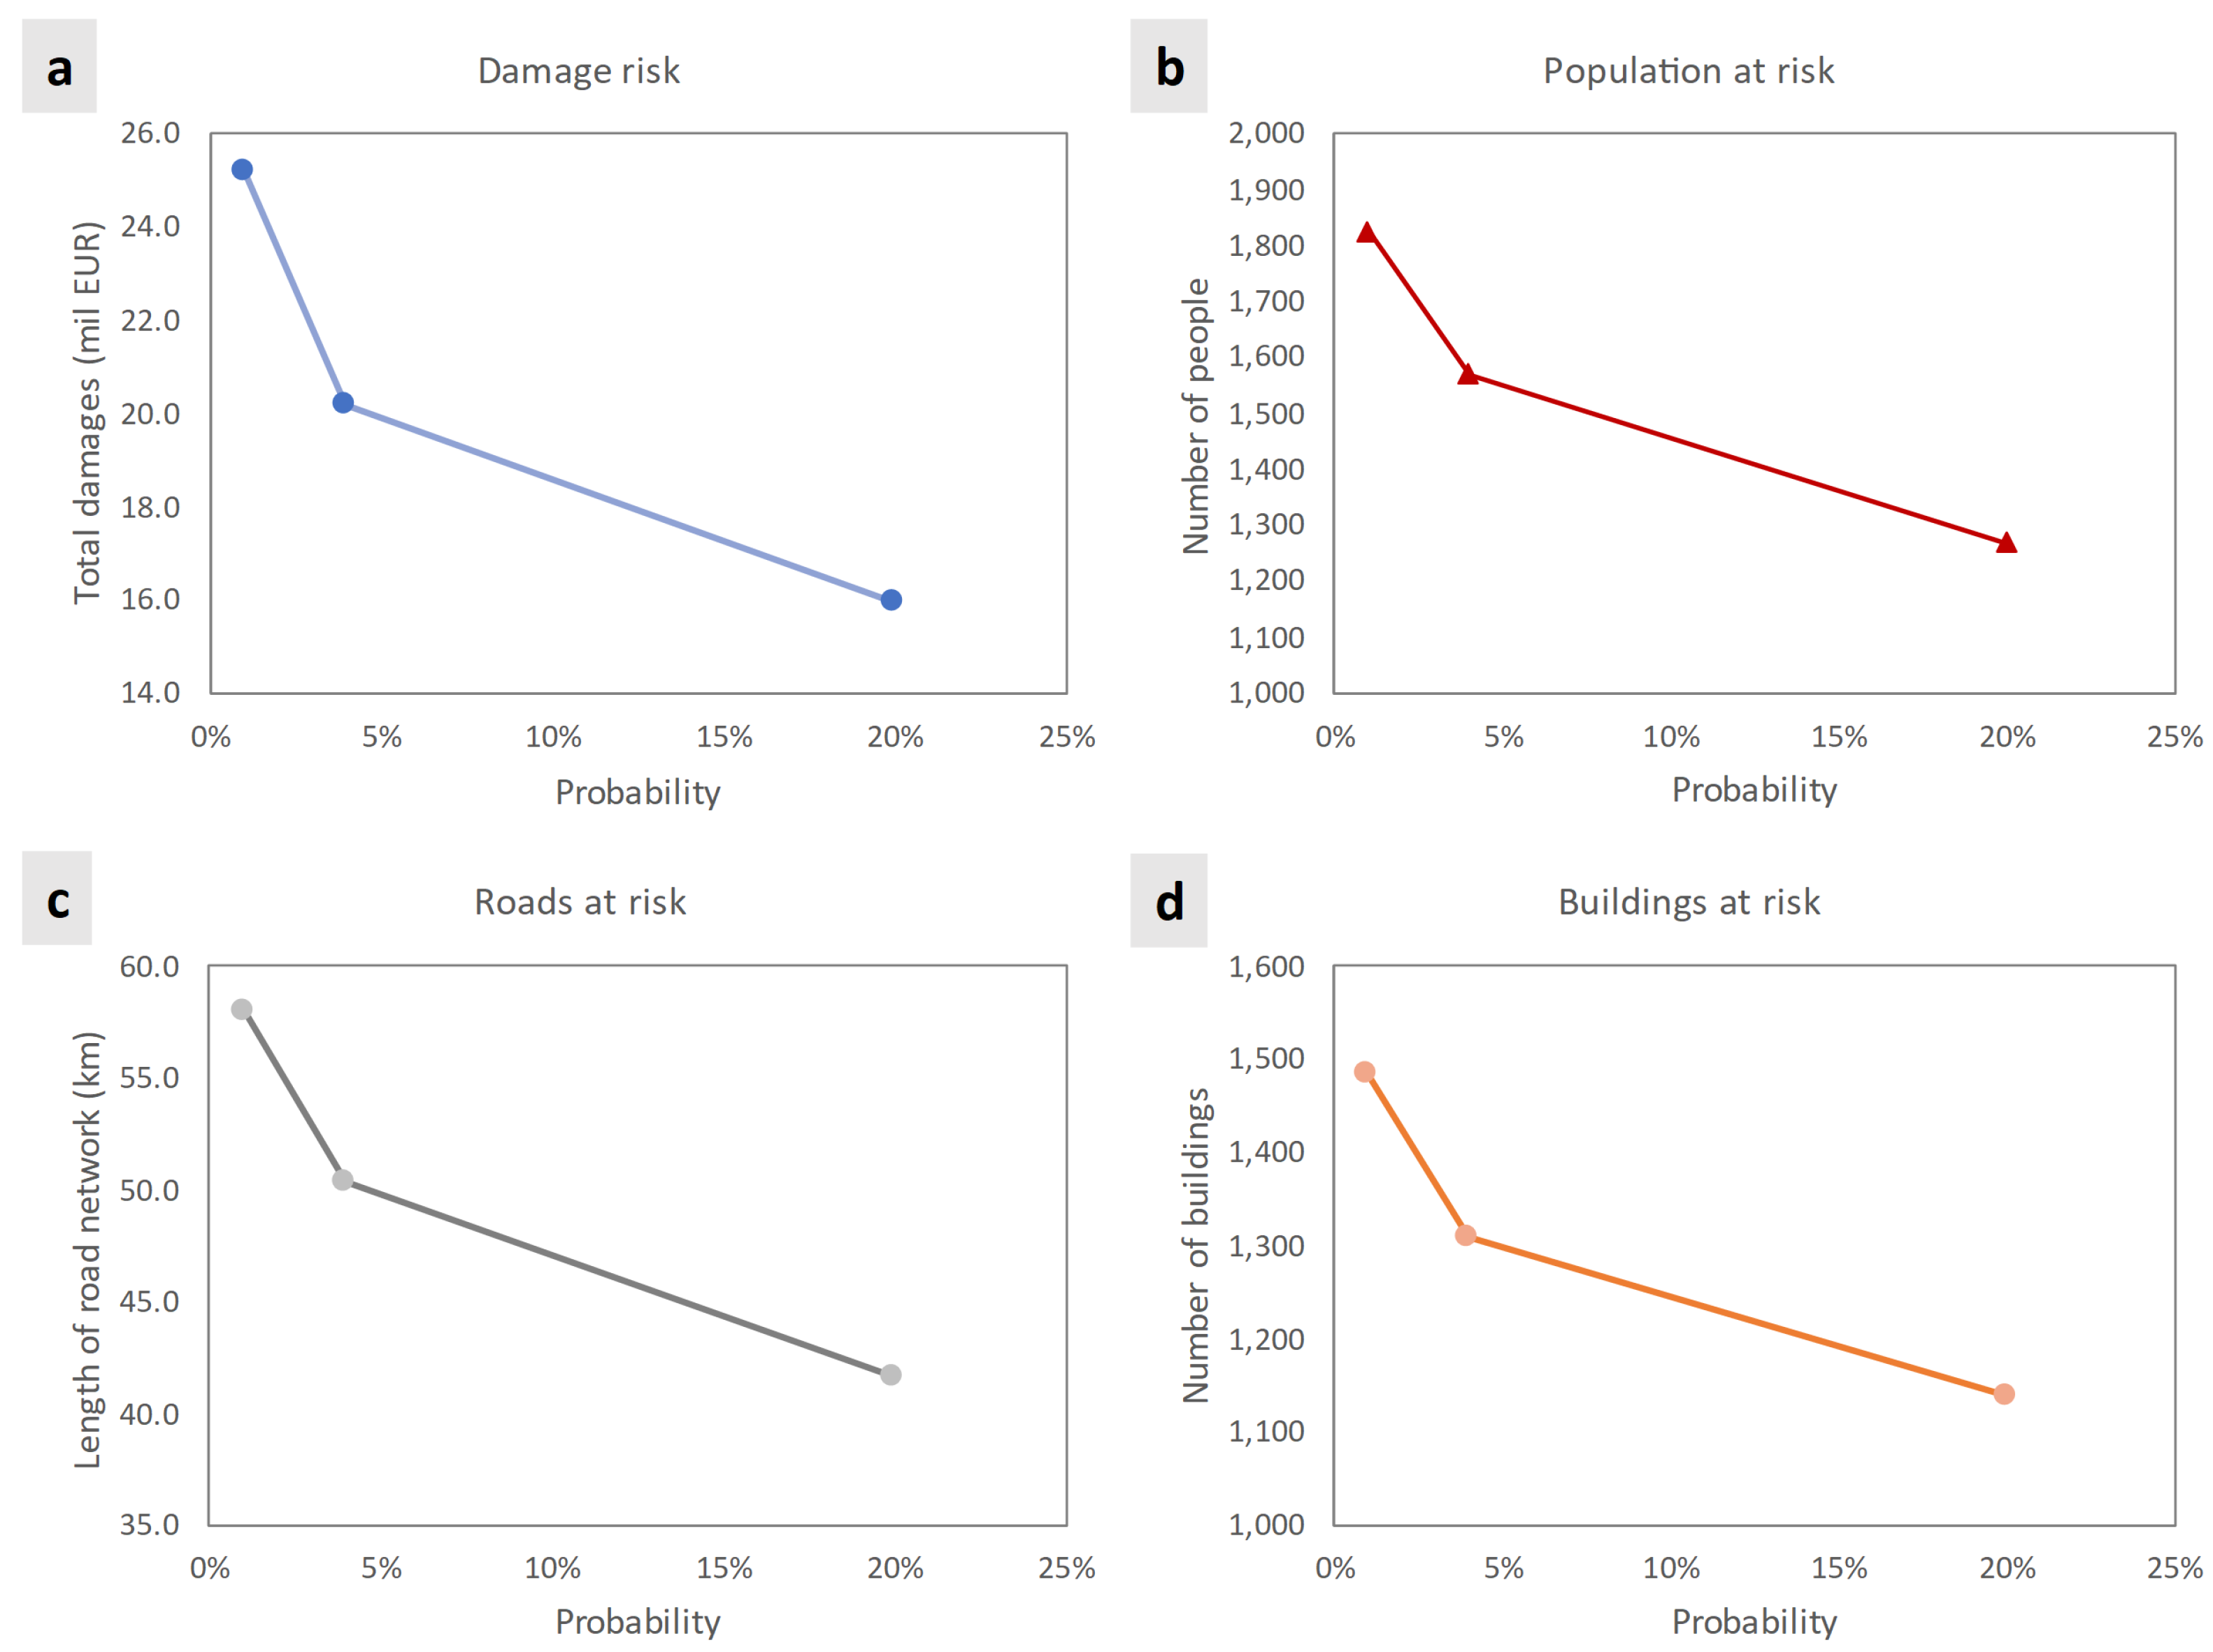
3.3. Exposure to Pluvial Flash Flooding
The vulnerability to pluvial flooding was conducted with the aim of determining the risk, which is presented in the next section. In this section, the results of the exposure analysis for pluvial flash floods are presented. Figure 12 shows an example of an exposure map for a low probability in the Gospić catchment. The exposure analysis identified land-uses (aggregated into six major classes) within the flood extent for a low probability and all identified receptors from the category of public services, potential pollution sources, protected areas, and cultural heritage.
Figure 12.
Flood exposure map for a low probability in the Gospić catchment.
Figure 13 shows the summary results extracted from the exposure map. It shows the total flooded area for each land-use class and all three probabilities (bar chart), as well as the proportion of land-use classes with a low probability of flooding (pie chart). The total observed Gospić catchment area is 238.5 km2, and the total flooded surface is 32.4 km2 (14%) at high probability, 39.5 km2 (17%) at medium probability, and 44.9 km2 (19%) at low probability. The figure shows that most of the flooded areas consist of forests and meadows. A significant portion of the inundated land is used for agriculture (about 24%), while residential, commercial, transportation, and industrial land combined account for less than 5%. During a high-probability flood event, 759 hectares of agricultural land use, 78 hectares of residential land use, and 7.3 hectares of industrial land use are expected to be flooded.
Figure 13.
Flood exposure results in terms of the flooded area for different land-use classes and all three probabilities (bar chart) and the proportion of land-use classes for a low probability (pie chart).
In terms of exposure of critical receptors in the public services and facilities group that may cause pollution, almost all of them are located outside the reach of the flood or in a location where the severity of the flood is negligible. Healthcare facilities are located outside the reach of the flood, with the exception of the general hospital, which may be affected by flooding, but its severity is low. Kindergartens and schools are also outside the reach of flooding, as is the central bus station. Industrial facilities are outside the reach of flooding; gas stations are either outside the reach of flooding or the flood severity is negligible; Seveso facilities are all outside the reach of flooding. Part of Velebit Nature Park is located in the Gospić catchment area; however, the protected area is located in the mountains, where there is no significant flooding, except for the settlement of Brušani, where pluvial flash floods are observed. Almost the entire Gospić settlement catchment area is part of the Natura 2000 ecological network (with the exception of the urbanized area of the Gospić settlement). Part of the cultural–historical complex of the Gospić settlement is partially exposed to floods.
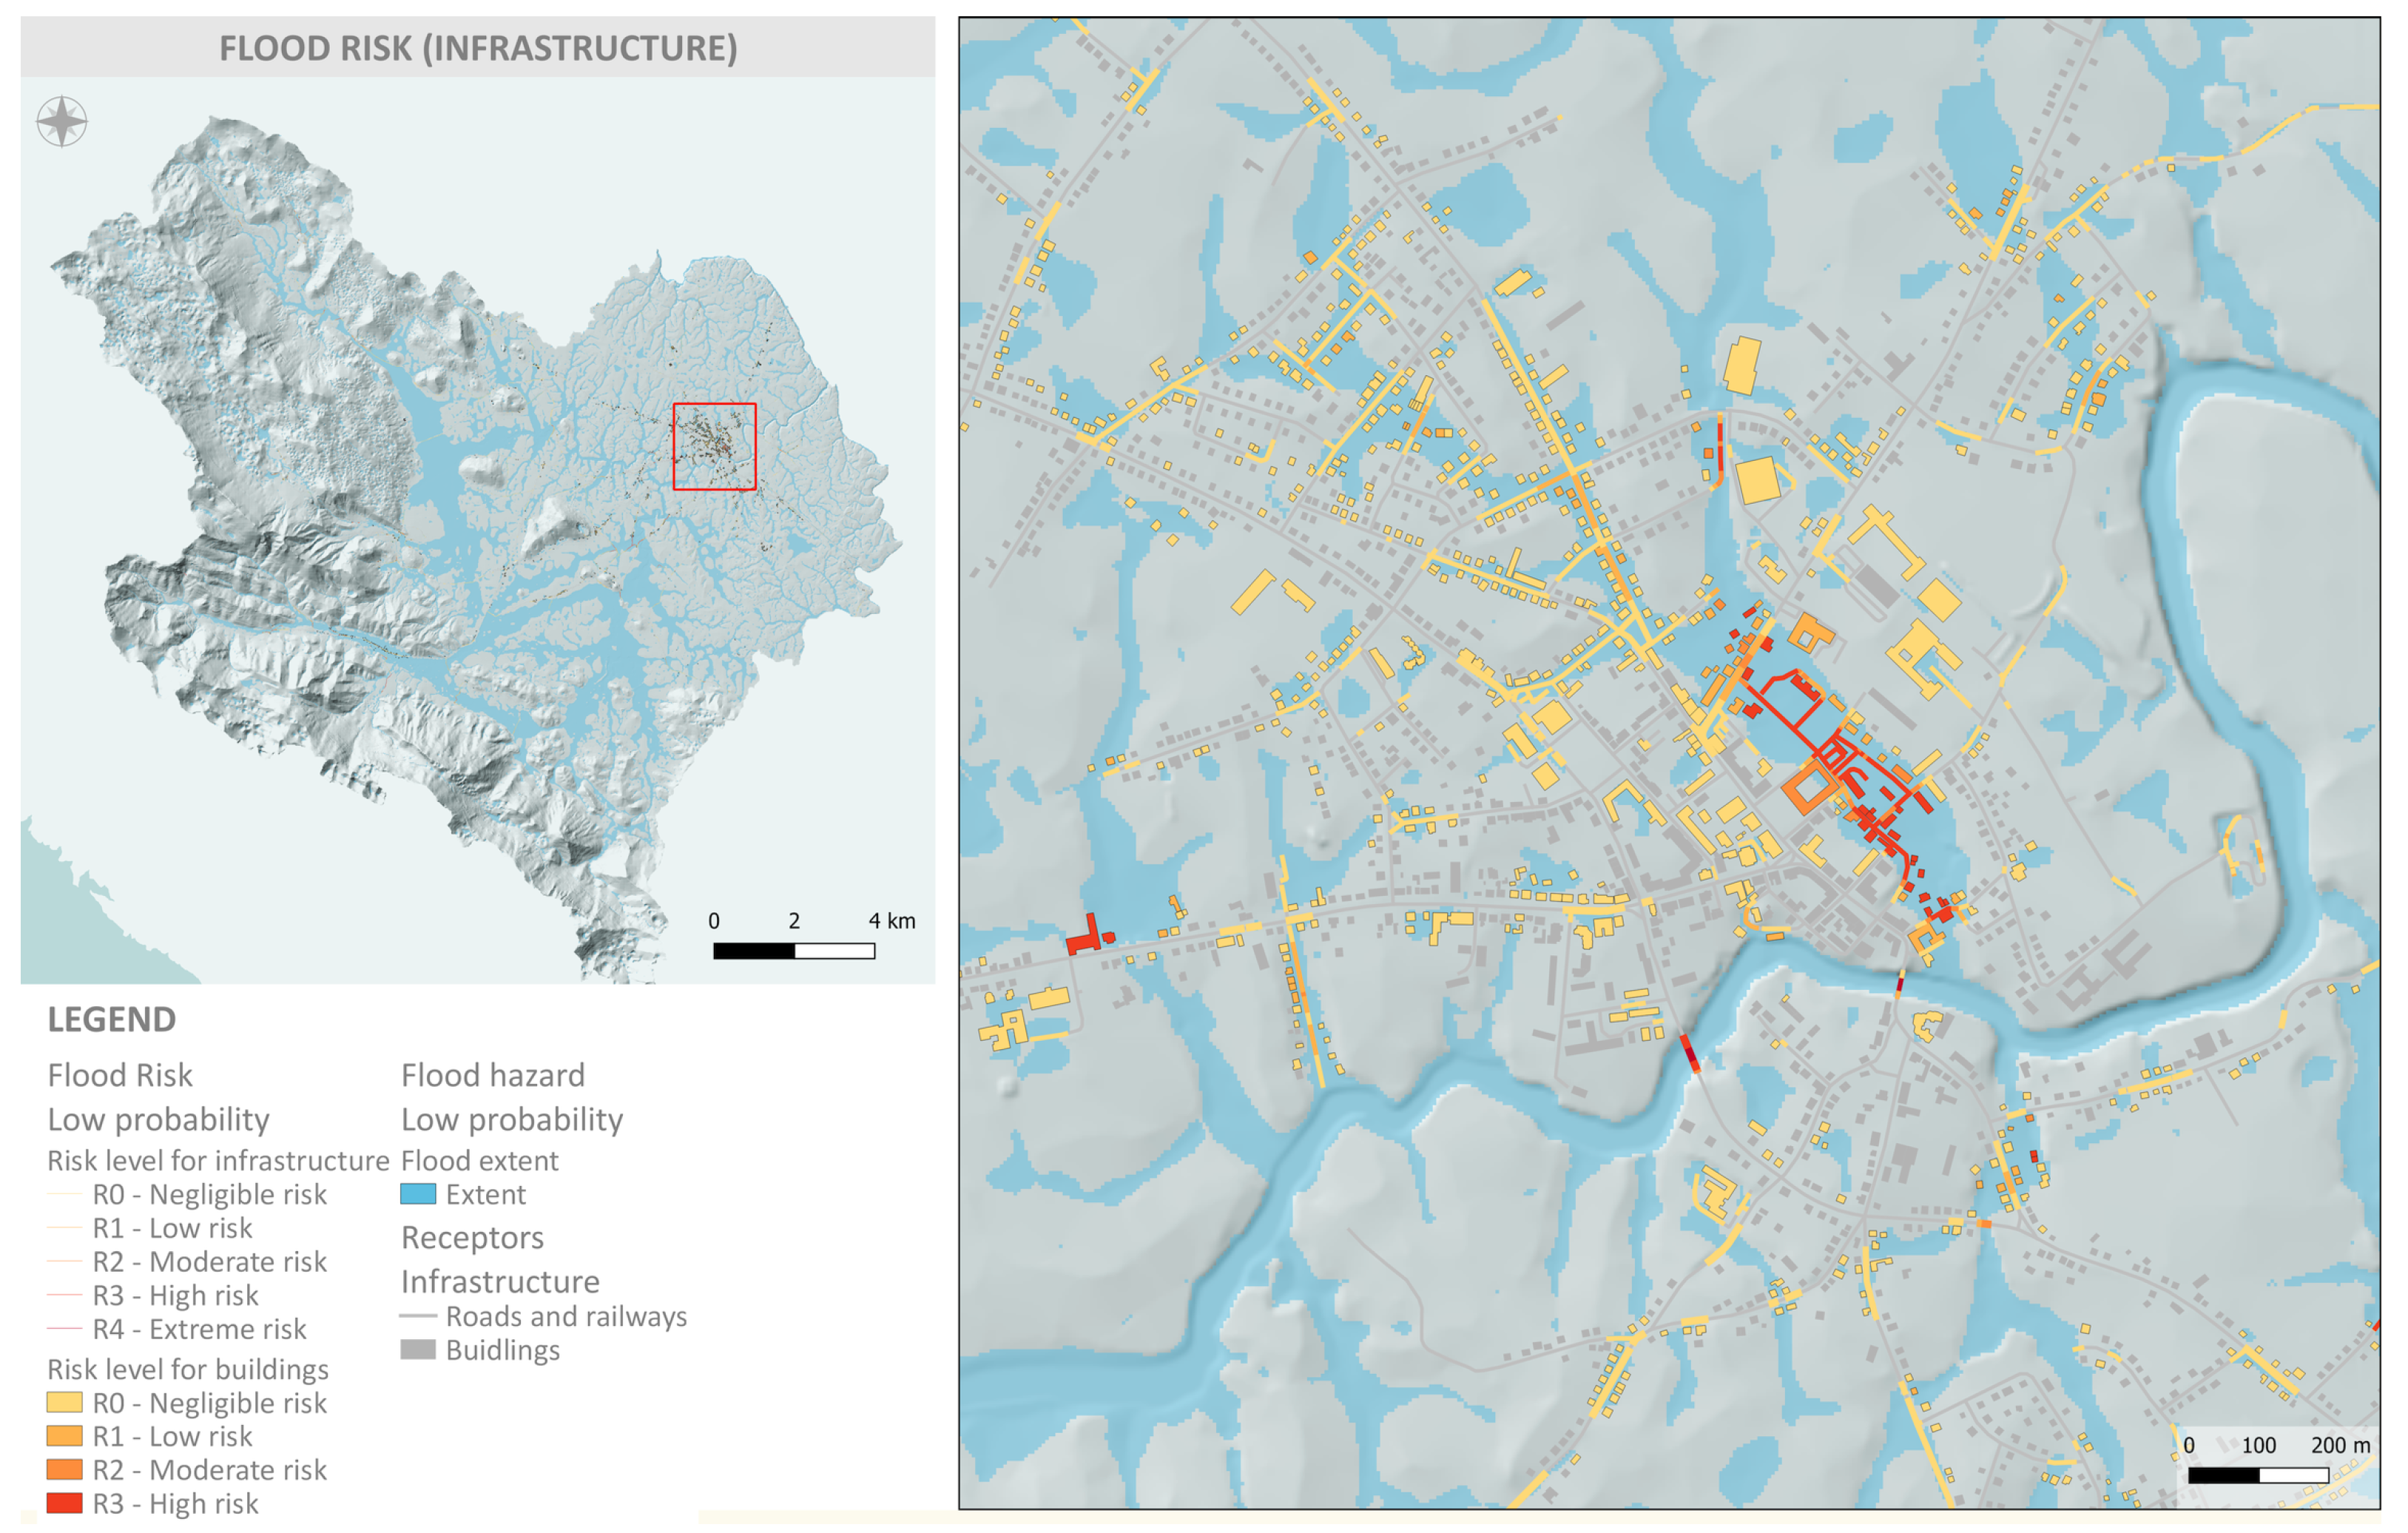
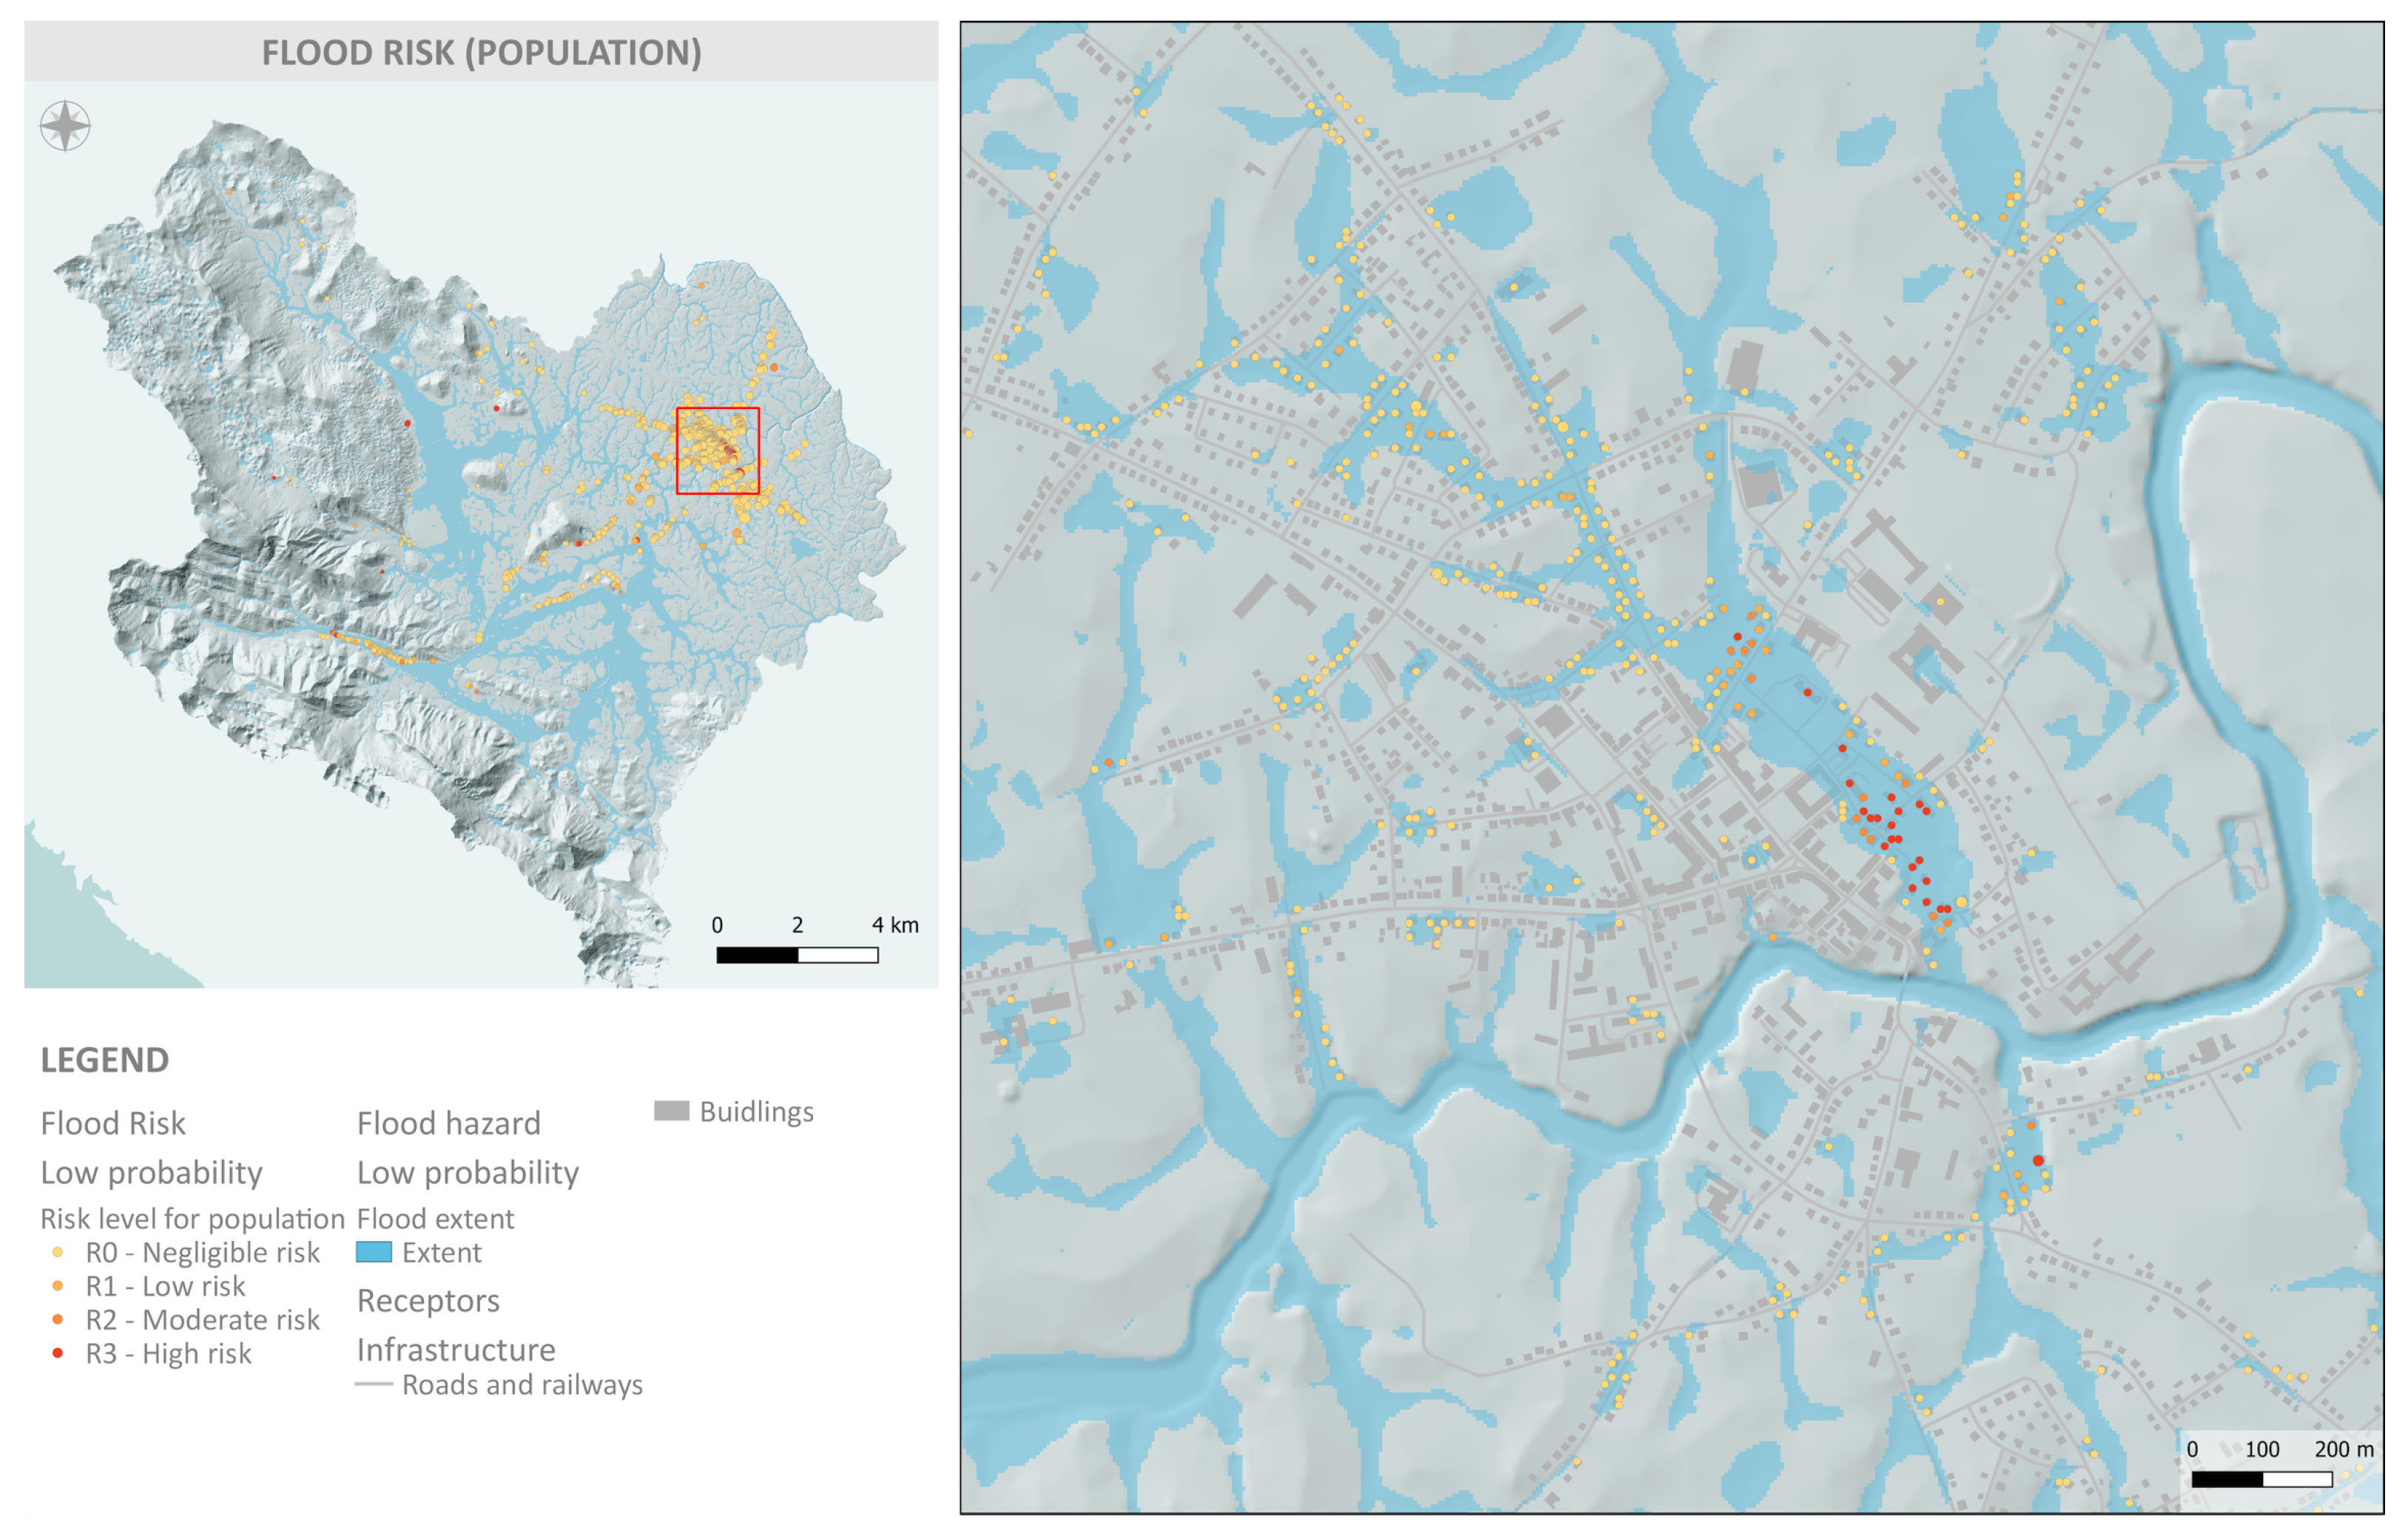
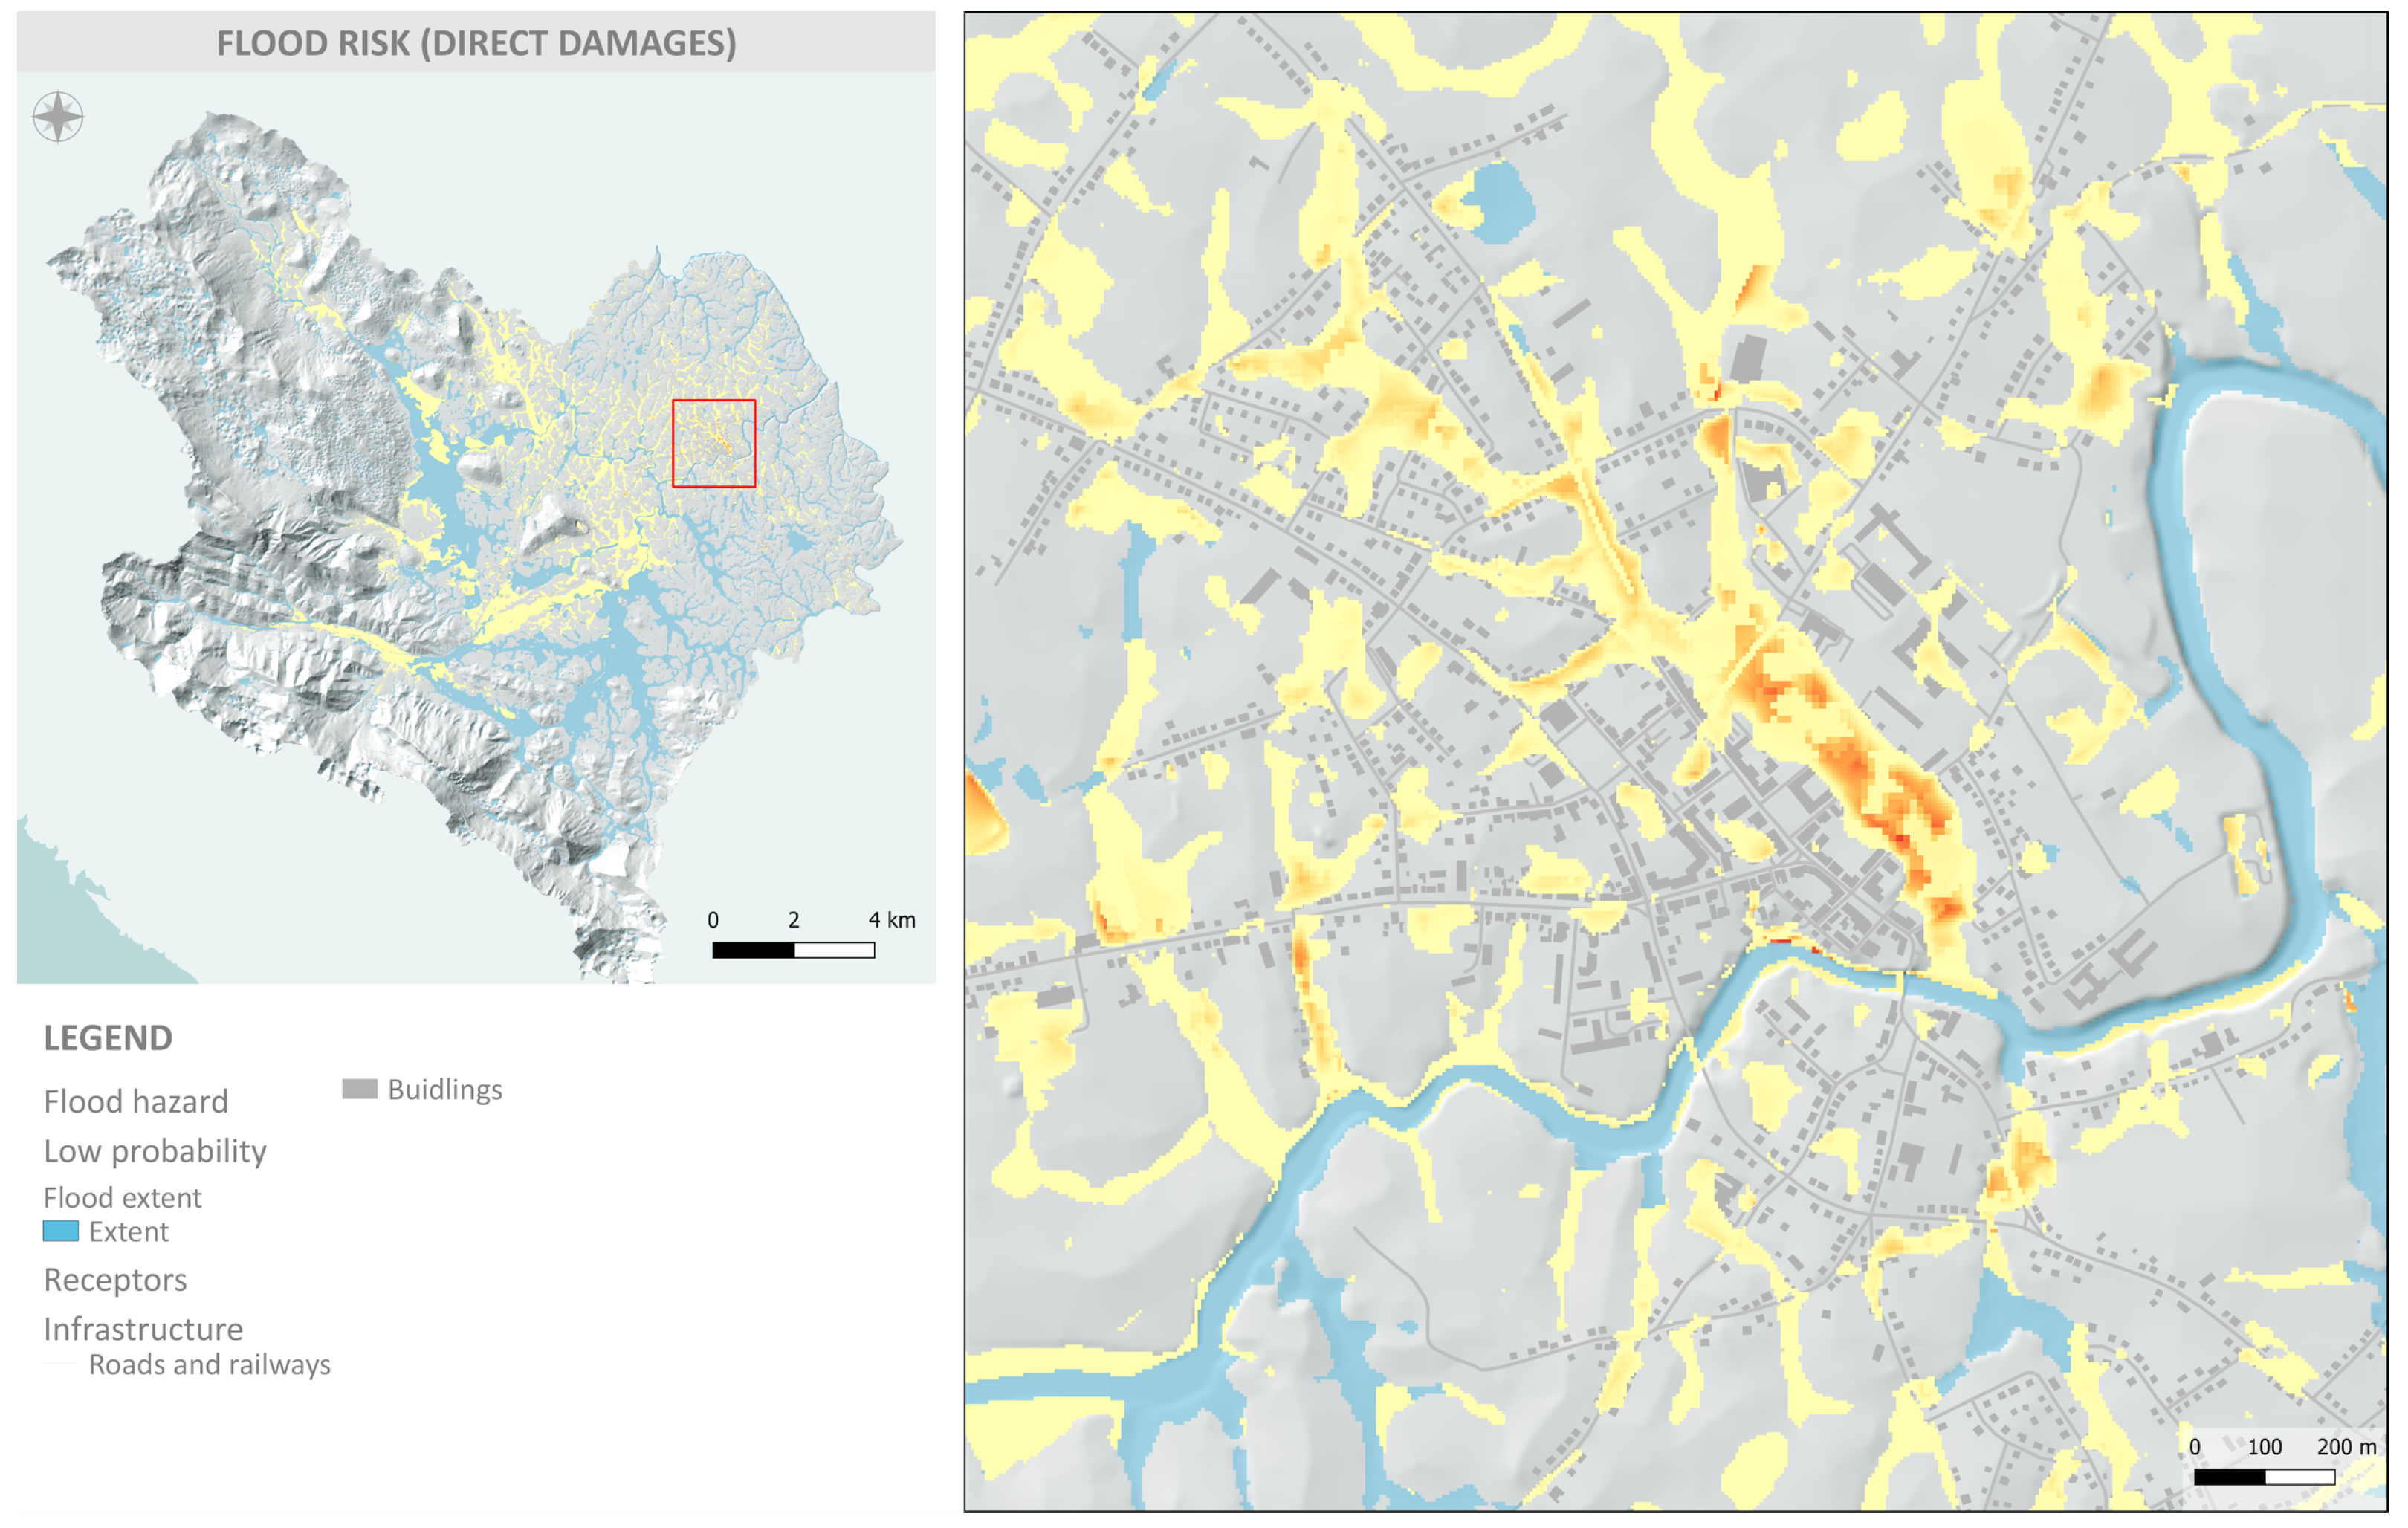
3.4. Pluvial Flash Flood Risk
Based on the hazard and vulnerability analyses, the PFF risk in the Gospić catchment was also identified. First, the results of the qualitative risk assessment are presented. Figure 14 shows the risk levels for buildings and roads, and Figure 15 shows the risk levels for the population, all for a low probability. Most buildings, roads, and inhabitants with moderate or high-risk levels are located in the urban part of Gospić. However, the proportion of flooded agricultural land and associated buildings upstream of Gospić in the Novčica and Bogdanica subcatchments is also significant. Damage risk was also calculated for each probability scenario and, then, combined to represent total damage risk, expressed as expected annual damage (EAD), shown in Figure 16. Again, the highest expected damages were found in the urban part of Gospić.
Figure 14.
Flood risk map—risk level for buildings and roads—for a low probability in the Gospić catchment.
Figure 15.
Flood risk map—risk level for people—for a low probability in the Gospić catchment.
Figure 16.
Flood risk map—expected annual damages—in the Gospić catchment.
In addition to the qualitative risk analysis that estimates the level of risk for different receptors and for each probability, a quantitative risk analysis is also presented that relates the total number of exposed receptors (population, buildings, road length, damage) to the probability of occurrence of pluvial flash floods The results of the risk analysis are shown in Figure 17, with an estimate of the probability of: (a) direct flood damage, (b) people at risk of flooding, (c) length of flooded roads, and (d) number of flooded buildings. The potential number of people affected by pluvial flooding was estimated to range from 1269 residents (high probability) to 1825 residents (low probability). The length of flooded transportation infrastructure (mainly paved roads) ranges from 41 km (high probability) to 58 km (low probability). The number of flooded buildings/properties ranges from 1138 (high probability) to 1486 (low probability). The amount of direct damage ranges from EUR 8.7 million (high probability) to EUR 14.5 million (low probability).
Figure 17.
Flood risk results. The probability of: (a) direct flood damages, (b) people exposed to floods, (c) flooded length of roads, and (d) flooded number of buildings.
4. Discussion
The proposed methodology for hazard and risk assessment of pluvial flash floods was based on the concepts and standards presented by Merz et al. [74] and on the recent improvements by Arrighi et al. [59] and Albano et al. [12] for Italy. However, the proposed methodology was specifically adapted for pluvial flash floods and takes advantage of recent advances and availability of hydrologic–hydraulic models (HEC-RAS 6+ with rain-on-grid and variable infiltration) and high-resolution open data in the EU (Copernicus Land Monitoring Service, OpenStreetMap, etc.)
Following the recommendations of Albano et al. [12], the proposed approach went beyond the expert-driven qualitative (EDQ) approach to risk assessment and adopted qualitative and quantitative risk analysis. Albano et al. [12] argued that the EDQ approach fails in supporting cost–benefit analyses because the vulnerability component is not properly assessed [12,17]. Therefore, flood risk should also be quantified to efficiently support flood risk management and the selection of suitable objectives and adequate mitigation measures [47]. However, in contrast to previous work [12], we proposed an alternative definition of qualitative risk assessment that refers to the severity of flooding and the risk to people, vehicles, facilities, etc., rather than a derivation of flood damages. In this way, two different aspects of flood risk are provided to end users.
Overall, the flood hazard and risk maps presented here are a significant improvement over the official flood maps in Croatia [56]. First, the official hazard maps from 2019 were compiled from various sources, fluvial floods were analyzed using 1D and 2D hydraulic models and simplified GIS analysis, flash floods were analyzed using expert judgment and GIS analyses, and pluvial floods were not analyzed at all. In addition, the hydraulic analyses were based on a DTM with a resolution of 25 m (except for a few individual smaller catchments), and the results are presented at a scale of 1:25,000. Figure 18 shows the new water depth map for the Gospić catchment and the official water depth map from 2019 for a return period of 100 years. The main differences are visible not only in the improved resolution and accuracy, but also in the type of flooding—pluvial flash floods—which include all surface flooding and encompasses the entire catchment, in contrast to flash floods concentrated only in the floodplain along the main river channels.
Figure 18.
Comparison of flood hazard map showing the water depths for 100 yr return period: (A) proposed methodology (2022); (B) map from the present Flood Risk Management Plan (2019) [56].
In addition, the 2019 official flood risk maps could be characterized as a combination of exposure and vulnerability maps—providing only the information about exposed populations, land-use, protected areas, and facilities that could cause pollution. This study shows a way to map flood risk both qualitatively and quantitatively by using open data available for the entirety of Croatia.
5. Conclusions
The new flood hazard and flood risk maps are a significant improvement over the current 2019 flood maps for Croatia. More accurate and detailed maps of higher quality provide more reliable information for flood risk management plans. The biggest advantage is the possibility to include pluvial flooding in the next FRMP cycle in Croatia. In addition, flood risk assessment at both qualitative and quantitative levels enables its use for a wide range of end users, as well as for prioritization and participation phases and for the cost–benefit analysis of mitigation measures.
The main limitation of the proposed approach is its sensitivity to input data, particularly for flood risk assessment. In general, data availability and quality should be improved to reduce uncertainties. Quantitative flood risk analysis relies on depth–damage curves and maximum possible damage estimates, which can lead to uncertainties in direct damage assessment. Improper selection of maximum potential damages could result in flood risk maps that are even more misleading than if there were no flood damage maps at all. Qualitative flood risk analysis ignores susceptibility aspects, which also leads to uncertainties in risk level assessment. More detailed information on the demographics, building characteristics (type of material, basements, etc.), road network, and pollution sources would allow for more accurate and comprehensive risk analysis.
The proposed approach could be further improved in several ways. The first aspect is the digital terrain model, which is the main input to the hydrologic–hydraulic model. Unfortunately, Croatia still does not have a nationwide LiDAR survey; however, this will soon become available for the entire Croatian territory within the project Multisensor Aerial Survey of the Republic of Croatia for disaster risk reduction assessment. Second, other processes could be integrated into the PFF hazard assessment, such as sediment and pollutant transport. Third, post-event analysis should be conducted during more extreme flood events to reduce uncertainty in the damage assessment. Fourth, the joint probability of extreme flood events could be analyzed by considering compound events related to the co-occurrence of flash floods and fluvial floods. Furthermore, for flash floods, a joint probability of soil moisture (related to antecedent rainfall conditions) and high-intensity rainfall should be quantified. Fifth, the flood propagation in urbanized parts of the catchment should be analyzed more accurately by considering dual drainage (surface and pipe flow).
Overall, the proposed methodology shows great potential for assessing the risk of pluvial flash floods by providing a better understanding and knowledge that decision-makers need to identify appropriate mitigation measures and activities and to involve citizens in the flood management process. Therefore, this approach could be suitable for the next cycle of flood risk maps and FRMPs, not only in Croatia, but also in other EU Member States.
Author Contributions
Conceptualization, N.K. and B.H.; methodology, N.K., B.H., L.P. and A.Š.; software, N.K., B.H., L.P. and A.Š.; validation, N.K.; formal analysis, N.K. and B.H.; investigation, N.K., L.P. and A.Š.; resources, N.K. and A.Š.; data curation, L.P. and A.Š.; writing—original draft preparation, N.K.; writing—review and editing, N.K., B.H., L.P. and A.Š.; visualization, N.K. and B.H.; supervision, N.K.; project administration, N.K.; funding acquisition, N.K. and A.Š. All authors have read and agreed to the published version of the manuscript.
Funding
This research was funded by the Italy-Croatia cross-border cooperation program 2014-20202 under Interreg project Strategic development of flood management (STREAM). This research was performed within the project UIP-2017-05-2694 financially supported by the Croatian Science Foundation. The research was also funded by the University of Rijeka Projects uniri-tehnic-18-54 and zip-uniri-1500-1-20.
Institutional Review Board Statement
Not applicable.
Informed Consent Statement
Not applicable.
Data Availability Statement
Natura 2000 land-cover and imperviousness density from Copernicus Land Monitoring Service at https://land.copernicus.eu/ (accessed on 1 July 2022), road network and buildings from OpenStreetMap data and Geofabrik at https://www.geofabrik.de/ (accessed on 1 July 2022), Sentinel 2 from Copernicus Open Access Hub at https://scihub.copernicus.eu/ (accessed on 1 July 2022), population census in Croatia from the Croatian Bureau of Statistics at https://dzs.gov.hr/ (accessed on 1 July 2022), Protected areas and pollution sources from the Ministry of Economy and Sustainable Development of the Republic of Croatia at https://envi.azo.hr/ (accessed on 1 July 2022), and cultural heritage from the Ministry of Culture of the Republic of Croatia at https://envi.azo.hr/ (accessed on 1 July 2022).
Conflicts of Interest
The authors declare no conflict of interest.
References
- UNDRR. Sendai Frameworkfor Disaster Risk Reduction 2015–2030; United Nations Office for Disaster Risk Reduction: Geneva, Switzerland, 2021. [Google Scholar]
- EEA. Climate Change, Impacts and Vulnerability in Europe 2016. An Indicator-Based Report (EEA Report No 1/2017); Technical Report; European Environment Agency Copenhagen: Copenhagen, Denmark, 2017. [Google Scholar]
- EEA. Climate Change Adaptation and Disaster Risk Reduction in Europe. Enhancing Coherence of the Knowledge Base, Policies and Practices (EEA Report No 15/2017); Technical Report; European Environment Agency Copenhagen: Copenhagen, Denmark, 2017. [Google Scholar]
- EEA. Flood Risks and Environmental Vulnerability—Exploring the Synergies between Floodplain Restoration, Water Policies and Thematic Policies (EEA Report No 1/2016); Technical Report; European Environment Agency Copenhagen: Copenhagen, Denmark, 2016. [Google Scholar]
- Tomar, P.; Singh, S.K.; Kanga, S.; Meraj, G.; Kranjčić, N.; Đurin, B.; Pattanaik, A. GIS-Based Urban Flood Risk Assessment and Management—A Case Study of Delhi National Capital Territory (NCT), India. Sustainability 2021, 13, 12850. [Google Scholar] [CrossRef]
- Di Baldassarre, G.; Kooy, M.; Kemerink, J.; Brandimarte, L. Towards understanding the dynamic behaviour of floodplains as human-water systems. Hydrol. Earth Syst. Sci. 2013, 17, 3235–3244. [Google Scholar] [CrossRef]
- Alfieri, L.; Burek, P.; Feyen, L.; Forzieri, G. Global warming increases the frequency of river floods in Europe. Hydrol. Earth Syst. Sci. 2015, 19, 2247–2260. [Google Scholar] [CrossRef]
- Yang, L.; Smith, J.A.; Wright, D.B.; Baeck, M.L.; Villarini, G.; Tian, F.; Hu, H. Urbanization and climate change: An examination of nonstationarities in urban flooding. J. Hydrometeorol. 2013, 14, 1791–1809. [Google Scholar] [CrossRef]
- Bednar-Friedl, B.; Biesbroek, R.; Schmidt, D.N. IPCC Sixth Assessment Report (AR6): Climate Change 2022-Impacts, Adaptation and Vulnerability: Regional Factsheet Europe; Technical Report; Intergovernmental Panel on Climate Change: Geneva, Switzerland, 2022. [Google Scholar]
- De Moel, H.d.; Van Alphen, J.; Aerts, J.C. Flood maps in Europe–methods, availability and use. Nat. Hazards Earth Syst. Sci. 2009, 9, 289–301. [Google Scholar] [CrossRef]
- Domeneghetti, A.; Carisi, F.; Castellarin, A.; Brath, A. Evolution of flood risk over large areas: Quantitative assessment for the Po river. J. Hydrol. 2015, 527, 809–823. [Google Scholar] [CrossRef]
- Albano, R.; Mancusi, L.; Abbate, A. Improving flood risk analysis for effectively supporting the implementation of flood risk management plans: The case study of “Serio” Valley. Environ. Sci. Policy 2017, 75, 158–172. [Google Scholar] [CrossRef]
- Heintz, M.D.; Hagemeier-Klose, M.; Wagner, K. Towards a risk governance culture in flood policy—Findings from the implementation of the “floods directive” in Germany. Water 2012, 4, 135–156. [Google Scholar] [CrossRef]
- Mysiak, J.; Testella, F.; Bonaiuto, M.; Carrus, G.; De Dominicis, S.; Ganucci Cancellieri, U.; Firus, K.; Grifoni, P. Flood risk management in Italy: Challenges and opportunities for the implementation of the EU Floods Directive (2007/60/EC). Nat. Hazards Earth Syst. Sci. 2013, 13, 2883–2890. [Google Scholar] [CrossRef]
- Müller, U. Implementation of the flood risk management directive in selected European countries. Int. J. Disaster Risk Sci. 2013, 4, 115–125. [Google Scholar] [CrossRef]
- Nones, M. Implementation of the floods directive in selected EU member states. Water Environ. J. 2015, 29, 412–418. [Google Scholar] [CrossRef]
- Molinari, D.; Minucci, G.; Mendoza, M.T.; Simonelli, T. Implementing the European “floods directive”: The case of the Po River Basin. Water Resour. Manag. 2016, 30, 1739–1756. [Google Scholar] [CrossRef]
- Nones, M.; Pescaroli, G. Implications of cascading effects for the EU Floods Directive. Int. J. River Basin Manag. 2016, 14, 195–204. [Google Scholar] [CrossRef]
- Priest, S.J.; Suykens, C.; Van Rijswick, H.F.; Schellenberger, T.; Goytia, S.; Kundzewicz, Z.W.; van Doorn-Hoekveld, W.J.; Beyers, J.C.; Homewood, S. The European Union approach to flood risk management and improving societal resilience: Lessons from the implementation of the Floods Directive in six European countries. Ecol. Soc. 2016, 21. [Google Scholar] [CrossRef]
- Mikša, K.; Kalinauskas, M.; Inácio, M.; Pereira, P. Implementation of the European Union Floods Directive—Requirements and national transposition and practical application: Lithuanian case-study. Land Use Policy 2021, 100, 104924. [Google Scholar] [CrossRef]
- Naulin, J.P.; Payrastre, O.; Gaume, E. Spatially distributed flood forecasting in flash flood prone areas: Application to road network supervision in Southern France. J. Hydrol. 2013, 486, 88–99. [Google Scholar] [CrossRef]
- Yin, J.; Yu, D.; Yin, Z.; Liu, M.; He, Q. Evaluating the impact and risk of pluvial flash flood on intra-urban road network: A case study in the city center of Shanghai, China. J. Hydrol. 2016, 537, 138–145. [Google Scholar] [CrossRef]
- David, A.; Schmalz, B. Flood hazard analysis in small catchments: Comparison of hydrological and hydrodynamic approaches by the use of direct rainfall. J. Flood Risk Manag. 2020, 13, e12639. [Google Scholar] [CrossRef]
- Falconer, R.H.; Cobby, D.; Smyth, P.; Astle, G.; Dent, J.; Golding, B. Pluvial flooding: New approaches in flood warning, mapping and risk management. J. Flood Risk Manag. 2009, 2, 198–208. [Google Scholar] [CrossRef]
- Archer, D.; Fowler, H. Characterising flash flood response to intense rainfall and impacts using historical information and gauged data in Britain. J. Flood Risk Manag. 2018, 11, S121–S133. [Google Scholar] [CrossRef]
- Hall, J.; Arheimer, B.; Borga, M.; Brázdil, R.; Claps, P.; Kiss, A.; Kjeldsen, T.; Kriaučiūnienė, J.; Kundzewicz, Z.W.; Lang, M.; et al. Understanding flood regime changes in Europe: A state-of-the-art assessment. Hydrol. Earth Syst. Sci. 2014, 18, 2735–2772. [Google Scholar]
- Mejía, A.I.; Moglen, G.E. Impact of the spatial distribution of imperviousness on the hydrologic response of an urbanizing basin. Hydrol. Process. 2010, 24, 3359–3373. [Google Scholar] [CrossRef]
- Popa, M.C.; Peptenatu, D.; Drăghici, C.C.; Diaconu, D.C. Flood hazard mapping using the flood and flash-flood potential index in the Buzău River catchment, Romania. Water 2019, 11, 2116. [Google Scholar] [CrossRef]
- Samela, C.; Persiano, S.; Bagli, S.; Luzzi, V.; Mazzoli, P.; Humer, G.; Reithofer, A.; Essenfelder, A.; Amadio, M.; Mysiak, J.; et al. Safer_RAIN: A DEM-based hierarchical filling-&-Spilling algorithm for pluvial flood hazard assessment and mapping across large urban areas. Water 2020, 12, 1514. [Google Scholar]
- Bout, v.B.; Jetten, V. The validity of flow approximations when simulating catchment-integrated flash floods. J. Hydrol. 2018, 556, 674–688. [Google Scholar] [CrossRef]
- Costabile, P.; Costanzo, C.; Ferraro, D.; Barca, P. Is HEC-RAS 2D accurate enough for storm-event hazard assessment? Lessons learnt from a benchmarking study based on rain-on-grid modeling. J. Hydrol. 2021, 603, 126962. [Google Scholar] [CrossRef]
- Cea, L.; Bladé, E. A simple and efficient unstructured finite volume scheme for solving the shallow water equations in overland flow applications. Water Resour. Res. 2015, 51, 5464–5486. [Google Scholar] [CrossRef]
- Fernández-Pato, J.; Caviedes-Voullième, D.; García-Navarro, P. Rainfall/runoff simulation with 2D full shallow water equations: Sensitivity analysis and calibration of infiltration parameters. J. Hydrol. 2016, 536, 496–513. [Google Scholar] [CrossRef]
- Mihu-Pintilie, A.; Cîmpianu, C.I.; Stoleriu, C.C.; Pérez, M.N.; Paveluc, L.E. Using high-density LiDAR data and 2D streamflow hydraulic modeling to improve urban flood hazard maps: A HEC-RAS multi-scenario approach. Water 2019, 11, 1832. [Google Scholar] [CrossRef]
- Kastridis, A.; Kirkenidis, C.; Sapountzis, M. An integrated approach of flash flood analysis in ungauged Mediterranean watersheds using post-flood surveys and unmanned aerial vehicles. Hydrol. Process. 2020, 34, 4920–4939. [Google Scholar] [CrossRef]
- Bellos, V.; Papageorgaki, I.; Kourtis, I.; Vangelis, H.; Kalogiros, I.; Tsakiris, G. Reconstruction of a flash flood event using a 2D hydrodynamic model under spatial and temporal variability of storm. Nat. Hazards 2020, 101, 711–726. [Google Scholar] [CrossRef]
- Diakakis, M.; Deligiannakis, G.; Antoniadis, Z.; Melaki, M.; Katsetsiadou, N.; Andreadakis, E.; Spyrou, N.; Gogou, M. Proposal of a flash flood impact severity scale for the classification and mapping of flash flood impacts. J. Hydrol. 2020, 590, 125452. [Google Scholar] [CrossRef]
- Costache, R.; Pham, Q.B.; Sharifi, E.; Linh, N.T.T.; Abba, S.I.; Vojtek, M.; Vojteková, J.; Nhi, P.T.T.; Khoi, D.N. Flash-flood susceptibility assessment using multi-criteria decision making and machine learning supported by remote sensing and GIS techniques. Remote Sens. 2019, 12, 106. [Google Scholar] [CrossRef]
- Janizadeh, S.; Avand, M.; Jaafari, A.; Phong, T.V.; Bayat, M.; Ahmadisharaf, E.; Prakash, I.; Pham, B.T.; Lee, S. Prediction success of machine learning methods for flash flood susceptibility mapping in the Tafresh watershed, Iran. Sustainability 2019, 11, 5426. [Google Scholar] [CrossRef]
- Arabameri, A.; Saha, S.; Chen, W.; Roy, J.; Pradhan, B.; Bui, D.T. Flash flood susceptibility modeling using functional tree and hybrid ensemble techniques. J. Hydrol. 2020, 587, 125007. [Google Scholar] [CrossRef]
- Band, S.S.; Janizadeh, S.; Chandra Pal, S.; Saha, A.; Chakrabortty, R.; Melesse, A.M.; Mosavi, A. Flash flood susceptibility modeling using new approaches of hybrid and ensemble tree-based machine learning algorithms. Remote Sens. 2020, 12, 3568. [Google Scholar] [CrossRef]
- Costache, R.; Ngo, P.T.T.; Bui, D.T. Novel ensembles of deep learning neural network and statistical learning for flash-flood susceptibility mapping. Water 2020, 12, 1549. [Google Scholar] [CrossRef]
- Pham, B.T.; Avand, M.; Janizadeh, S.; Phong, T.V.; Al-Ansari, N.; Ho, L.S.; Das, S.; Le, H.V.; Amini, A.; Bozchaloei, S.K.; et al. GIS based hybrid computational approaches for flash flood susceptibility assessment. Water 2020, 12, 683. [Google Scholar] [CrossRef]
- Escuder-Bueno, I.; Castillo-Rodríguez, J.T.; Zechner, S.; Jöbstl, C.; Perales-Momparler, S.; Petaccia, G. A quantitative flood risk analysis methodology for urban areas with integration of social research data. Nat. Hazards Earth Syst. Sci. 2012, 12, 2843–2863. [Google Scholar] [CrossRef]
- Bodoque, J.M.; Amérigo, M.; Díez-Herrero, A.; García, J.A.; Cortés, B.; Ballesteros-Cánovas, J.A.; Olcina, J. Improvement of resilience of urban areas by integrating social perception in flash-flood risk management. J. Hydrol. 2016, 541, 665–676. [Google Scholar] [CrossRef]
- Michielsen, A.; Kalantari, Z.; Lyon, S.W.; Liljegren, E. Predicting and communicating flood risk of transport infrastructure based on watershed characteristics. J. Environ. Manag. 2016, 182, 505–518. [Google Scholar] [CrossRef] [PubMed]
- Wagenaar, D.; De Bruijn, K.; Bouwer, L.; De Moel, H. Uncertainty in flood damage estimates and its potential effect on investment decisions. Nat. Hazards Earth Syst. Sci. 2016, 16, 1–14. [Google Scholar] [CrossRef]
- Muñoz, P.; Orellana-Alvear, J.; Willems, P.; Célleri, R. Flash-flood forecasting in an Andean mountain catchment—development of a step-wise methodology based on the random forest algorithm. Water 2018, 10, 1519. [Google Scholar] [CrossRef]
- Song, T.; Ding, W.; Wu, J.; Liu, H.; Zhou, H.; Chu, J. Flash flood forecasting based on long short-term memory networks. Water 2019, 12, 109. [Google Scholar] [CrossRef]
- Wu, J.; Liu, H.; Wei, G.; Song, T.; Zhang, C.; Zhou, H. Flash flood forecasting using support vector regression model in a small mountainous catchment. Water 2019, 11, 1327. [Google Scholar] [CrossRef]
- Spyrou, C.; Varlas, G.; Pappa, A.; Mentzafou, A.; Katsafados, P.; Papadopoulos, A.; Anagnostou, M.N.; Kalogiros, J. Implementation of a nowcasting hydrometeorological system for studying flash flood events: The Case of Mandra, Greece. Remote Sens. 2020, 12, 2784. [Google Scholar] [CrossRef]
- Rapant, P.; Kolejka, J. Dynamic pluvial flash flooding hazard forecast using weather radar data. Remote Sens. 2021, 13, 2943. [Google Scholar] [CrossRef]
- Zanchetta, A.D.; Coulibaly, P. Recent advances in real-time pluvial flash flood forecasting. Water 2020, 12, 570. [Google Scholar] [CrossRef]
- Albano, R.; Mancusi, L.; Sole, A.; Adamowski, J. Collaborative strategies for sustainable EU flood risk management: FOSS and geospatial tools—challenges and opportunities for operative risk analysis. ISPRS Int. J. -Geo-Inf. 2015, 4, 2704–2727. [Google Scholar] [CrossRef]
- EC. EU overview of methodologies used in preparation of flood hazard and flood risk maps. Final report. 2016. [Google Scholar]
- Barbalić, D.; Sanja, B.; Biondić, D.; Pavković, I.; Vukmanić, L. Upravljanje rizicima od poplava. Karte opasnosti od poplava i karte rizika od poplava—2019. 2019. (In Croatian). Available online: https://voda.hr/hr/karte-opasnosti-od-poplava-i-karte-rizika-od-poplava-2019 (accessed on 1 November 2022).
- Samuels, P.; Gouldby, B.; Klijn, F.; Messner, F.; van Os, A.; Sayers, P.; Schanze, J.; Udale-Clarke, H. Language of Risk—Project Definitions; Floodsite Project Report T32-04-01; HR: Wallingford, UK, 2009. [Google Scholar]
- Schanze, J. Pluvial flood risk management: An evolving and specific field. J. Flood Risk Manag. 2018, 11, 227–229. [Google Scholar] [CrossRef]
- Arrighi, C.; Brugioni, M.; Castelli, F.; Franceschini, S.; Mazzanti, B. Flood risk assessment in art cities: The exemplary case of Florence (Italy). J. Flood Risk Manag. 2018, 11, S616–S631. [Google Scholar] [CrossRef]
- Krvavica, N.; Rubinić, J. Evaluation of design storms and critical rainfall durations for flood prediction in partially urbanized catchments. Water 2020, 12, 2044. [Google Scholar] [CrossRef]
- Cordery, I.; Pilgrim, D.; Rowbottom, I. Time patterns of rainfall for estimating design floods on a frequency basis. Water Sci. Technol. 1984, 16, 155–165. [Google Scholar] [CrossRef]
- Hay, G.J.; Castilla, G. Geographic Object-Based Image Analysis (GEOBIA): A New Name for a New Discipline; Springer: Berlin/Heidelberg, Germany, 2008; pp. 75–89. [Google Scholar]
- Hay, G.J.; Blaschke, T. Geographic object-based image analysis (GEOBIA). Photogramm. Eng. Remote Sens. 2010, 76, 121. [Google Scholar]
- Maxwell, A.E.; Strager, M.P.; Warner, T.A.; Ramezan, C.A.; Morgan, A.N.; Pauley, C.E. Large-area, high spatial resolution land-cover mapping using random forests, GEOBIA, and NAIP orthophotography: Findings and recommendations. Remote Sens. 2019, 11, 1409. [Google Scholar] [CrossRef]
- Jozdani, S.E.; Johnson, B.A.; Chen, D. Comparing deep neural networks, ensemble classifiers, and support vector machine algorithms for object-based urban land-use/land-cover classification. Remote Sens. 2019, 11, 1713. [Google Scholar] [CrossRef]
- Šiljeg, A.; Panđa, L.; Domazetović, F.; Marić, I.; Gašparović, M.; Borisov, M.; Milošević, R. Comparative Assessment of Pixel and Object-Based Approaches for Mapping of Olive Tree Crowns Based on UAV Multispectral Imagery. Remote Sens. 2022, 14, 757. [Google Scholar] [CrossRef]
- Strand, G.H. Accuracy of the Copernicus High-Resolution Layer Imperviousness Density (HRL IMD) Assessed by Point Sampling within Pixels. Remote Sens. 2022, 14, 3589. [Google Scholar] [CrossRef]
- Burek, P.; Bianchi, A.; Gentile, A. A Pan-European Data Set for Hydrological Modelling; Joint Research Center: Ispra, Italy, 2014. [Google Scholar]
- Babister, M.; Barton, C. Australian Rainfall and Runoff Revision Project 15: Two Dimensional Modelling in Urban and Rural Floodplains. Technical Report, Australian Rainfall and Runoff Report; 2012. Available online: https://arr.ga.gov.au/__data/assets/pdf_file/0019/40573/ARR_Project15_TwoDimensional_Modelling_DraftReport.pdf (accessed on 1 July 2022).
- Brunner, G.W. HEC-RAS 2D User’s Manual; Technical Report; USACE Hydrologic Engineering Center: Davis, CA, USA, 2022.
- NRCS, U. National Engineering Handbook: Part 630—Hydrology; USDA Soil Conservation Service: Washington, DC, USA, 2004.
- Hong, Y.; Adler, R. Estimation of global SCS curve numbers using satellite remote sensing and geospatial data. Int. J. Remote Sens. 2008, 29, 471–477. [Google Scholar] [CrossRef]
- Grimaldi, S.; Petroselli, A.; Arcangeletti, E.; Nardi, F. Flood mapping in ungauged basins using fully continuous hydrologic–hydraulic modeling. J. Hydrol. 2013, 487, 39–47. [Google Scholar] [CrossRef]
- Merz, B.; Thieken, A.; Gocht, M. Flood risk mapping at the local scale: Concepts and challenges. In Flood risk management in Europe; Springer: Berlin/Heidelberg, Germany, 2007; pp. 231–251. [Google Scholar]
- Tsakiris, G. Flood risk assessment: Concepts, modeling, applications. Nat. Hazards Earth Syst. Sci. 2014, 14, 1361–1369. [Google Scholar] [CrossRef]
- Huizinga, J.; De Moel, H.; Szewczyk, W. Global Flood Depth-Damage Functions: Methodology and the Database with Guidelines; Technical Report; Joint Research Centre (Seville site): Ispra, Italy, 2017. [Google Scholar]
- Othmer, F.J.; Becker, D.; Schulte, L.M.; Greiving, S. A Methodological Approach to Municipal Pluvial Flood Risk Assessment Based on a Small City Case Study. Sustainability 2020, 12, 10487. [Google Scholar] [CrossRef]
- Rumbach, A. Disaster governance in small urban places: Issues, trends, and concerns. In Disaster Governance in Urbanising Asia; Springer: Berlin/Heidelberg, Germany, 2016; pp. 109–125. [Google Scholar]
- Birkmann, J.; Welle, T.; Solecki, W.; Lwasa, S.; Garschagen, M. Boost resilience of small and mid-sized cities. Nature 2016, 537, 605–608. [Google Scholar] [CrossRef] [PubMed]
- UIH. Prostorni Plan Uređenja Grada Gospića (In Croatian). 2005. Available online: https://www.gospic.hr/PPUGG/Prostorni%20plan/Prostorni_plan_uredenja_Grada_Gospica_11-2005.PDF (accessed on 1 July 2022).
Disclaimer/Publisher’s Note: The statements, opinions and data contained in all publications are solely those of the individual author(s) and contributor(s) and not of MDPI and/or the editor(s). MDPI and/or the editor(s) disclaim responsibility for any injury to people or property resulting from any ideas, methods, instructions or products referred to in the content. |
© 2023 by the authors. Licensee MDPI, Basel, Switzerland. This article is an open access article distributed under the terms and conditions of the Creative Commons Attribution (CC BY) license (https://creativecommons.org/licenses/by/4.0/).


