Article

Analysis of Coupling Relation between Urban Spatial Compactness and Degree of Land Use Mix Based on Compact City Theory: The Case of Downtown Shenyang, China

Jangho Architecture, Hunnan Campus, Northeastern University, Shenyang 110819, China
*
Author to whom correspondence should be addressed.
Sustainability 2023, 15(2), 1202; https://doi.org/10.3390/su15021202
Submission received: 24 November 2022 / Revised: 31 December 2022 / Accepted: 3 January 2023 / Published: 9 January 2023

Abstract

:
Rapid urbanization has resulted in a series of problems, such as single-type land use, low efficiency, traffic congestion, and environmental degradation. The compact city, a concept that advocates the intensive and efficient use of land, may be considered when planning urban stocks. Grounded in the evaluation of the coordination degree in the coupling between spatial compactness and mixed land use based on compact city theory, this study aimed to provide scientific guidance for sustainability measures to renew the compact urban form. To this end, it analysed an area of 3972 hectares on both sides of the Hunhe River in Shenyang City, identified spatial problems, and put forward governance suggestions through case study methods. In spatiotemporal terms, the distribution characteristics of the coordination between the northern (old district) and southern (new district) banks were significantly different, with the former being better than the latter. In terms of land use type, higher coordination may be implemented in small blocks with predominantly residential functions and central areas for mixed use. The identification results clearly revealed the patches that need to be treated, thereby facilitating the delineation of urban renewal units. Differentiated design and governance measures are needed to address the imbalanced patches.

1. Introduction

1.1. Research Background

Since the 1990s, China’s economy has maintained its rapid growth, and the country’s cities have pursued large-scale development and construction [1]. However, rapid urbanization has broken the inherent law of urban growth and thus given rise to a myriad of problems with low-quality spaces, such as single-purpose land use, low efficiency, and insufficient spatial vitality. Meanwhile, the concept of sprawling urban forms that cope with compact cities has received wide attention from researchers in China [2]. Compact city theory proposes a spatial pattern of zoning function mixing; the mixing of land functions in a city of neighbourhoods promotes social equity and reduces travel time, travel distance, and energy consumption through transportation [3]. Scholars have noted the interrelation between the mix of urban land functions and urban compactness. High-density and granular mixed land use are beneficial to reducing car travel and saving resources and energy [4]. High-density cities can save land, accommodate facility density, and promote mixed land use [5]. Additionally, research on the coupling coordination of the degree of land use mix and spatial compactness of existing urban land can help determine the future location of dense urban growth and promote controlled urban spatial compactness [6,7]. In China, as the country’s major cities enter the stage of urban stock development, higher standards for high-quality urban development and efficient land use have been put forward. To this end, based on the concept of the compact city and intensive development, it is of great importance to explore compact development goals and the possible opportunities for urban form governance, and to explore paths for scientific urban renewal and design governance, to achieve sustainable urban development and promote scientific planning and management.

1.2. Literature Review

In the 1960s, many large cities worldwide experienced urban sprawl, which is characterized by low density, disorder, discontinuities, and expansions along main traffic roads [8]. The idea of the compact city, first proposed by George B. Dantzig and T.L. Satty in 1973, came into being as a response to the many problems of the sprawling urban form that had not received much attention [9]. In the early 1990s, when the urban form and land use principles guiding future development gradually began to receive attention from Western governments, the concept of compact cities came to be widely discussed in Western planning circles [10]. In 1990, the Green Paper on the Urban Environment released by the European Commission defined a compact city as a ‘traditional European city that emphasises density, multi-functionality, social, and cultural diversity’ [11]. Compact cities began to be described as one or all of the following types of cities: high-density cities, mixed-use cities, and intensified cities [6].
At the beginning of the 21st century, compact city theory was introduced to China and received extensive attention from scholars. Qiu advocated for the mixed development and intensive utilization of urban land, elaborating on the importance of compactness and diversity for the healthy, stable, and sustainable development of cities, and put forward policy recommendations to achieve sustainable urban development [12]. Hong interpreted the theoretical essence of compact cities from three dimensions: scale, function, and form [13]. Lu et al. proposed an urban land development model with high density, high mixing, and public transportation in order to achieve sustainable and stable urban development [14]. Thus, compact cities are considered to have three representative characteristics: high density, mixed utilization, and convenient transportation [10,11,15]. With density and its spatial distribution being components of urban form, density distribution defines the compactness of urban form [16]. Densification and mixed-use development are strategies to achieve the ideal compact city [17]. Therefore, under the premise of relatively complete urban transportation construction, spatial compactness and mixed land use, as well as their differences, have become the most important potential factors for the development and construction of compact cities and the evaluation of urban form.
The research scope of compact cities is relatively wide, and related literature has paid attention to the introduction of the concept and its essence [18], spatial form changes [19,20,21], measurement of compactness [6,7,22,23], compactness and height of buildings [24], land use [25,26,27,28], building energy performance [29,30,31], urban transportation [32,33,34], and social justice [35,36,37]. As can be seen from the research objectives of existing research, an important purpose is to assess the degree of compactness of existing cities for making management decisions. In the assessment of spatial compactness, Burton used built-up area density (housing, building density, etc.), mixed land use (amenity accessibility and vertical mixed use), and social compactness (population increase and social development) to establish a complete compactness index system and applied it to a study of 25 English cities in the UK. The research results provided methodological tools and models for the debate on compact cities [6]. Abdullahi established a density and land mixed use index, including a density index and degree of land use mix index, and used this evaluation index to evaluate the compactness and urban sustainability of Kajang, Malaysia, to help local governments improve regions with poor compactness [19]. Koziatek developed a three-dimensional (3D) urban compactness index to assess the potential vertical growth of cities by calculating the parameters of vertical urban growth suitability analysis, land designation, and average building height [7]. Kotharkar developed a set of indicators, including density, transportation network, accessibility, shape, and mixed land use, to measure the compactness of the urban form of Nagpur, India, to reveal its compactness potential [16]. As such, no unified standard and method exist for the evaluation of the degree of urban compactness. Existing research has evaluated urban compactness by establishing an index system, identifying areas with potential for compactness or areas with poor compactness for improvement, and proposing policy recommendations to make cities more sustainable.
Land mixed use research has focused on areas such as the simulation of compact urban land use and measurement of land use mix. Land use mix refers to the mix of land use types and functional attributes in a specific urban block [38,39]. Hong asserted that the core concept of compact urban land use is to advocate for the moderate mixed use of land functions. In other words, the mixed layout of different types of activities (vertical or horizontal) can be realized by mixing different land use methods, different facilities, or land and facilities [13]. Burton argued that mixed land use includes horizontal and vertical mixed use, with horizontal mixed use referring to the mix of various uses within a street or community and vertical mixed use, to multi-storey mixed use within a single building [6].
Many scholars have discussed the measurement of land mixed use in compact cities based on different data and methods. Manaugh used the length of the interaction line between complementary uses to measure land use mixing [40], but this approach has limitations: an area is not considered to have mixed land use if it includes a network of streets between several different land uses (e.g., streets between residential, commercial, and/or industrial uses) [19]. Abdullahi performed proximity analysis on five land use types—residential, community facilities, open space, commercial, and industrial areas—and aggregated them according to equal weights to obtain the land mix characteristics of Kajang, Malaysia [19]. In studying the consistency of compact development and land use mixing in Shanghai, Zheng used the proximity method to study land use mixing [41]; however, this method only considers horizontal land use mixing. Guo et al. (2020) used various methods, such as kernel density method, location entropy index, information entropy, and equilibrium degree, for the analysis and processing of point of interest (POI) data, to explore the complex characteristics of urban functions at the community scale [42]. POI data can reflect multi-layer mixed use within a single building entity, which facilitates a precise identification of the mixed-use status of the land.
Hong conducted research on the correlation between spatial compactness and the degree of land mixing, and argued that high-density spatial compaction is the primary condition for realizing mixed land use, and mixed land use can promote the compactness of spatial forms, thereby achieving maximum land use efficiency [13]. The many advantages of compact cities, including reduced travel needs, low energy consumption, high accessibility, efficient use of public services, and renewal and regeneration of urban central areas, have been demonstrated [43]. However, compact cities do not blindly pursue high-density development. Simply increasing urban density cannot achieve urban sustainability, whereas the mixing of land does not mean chaos and congestion but rather paying more attention to the optimization, compatibility, and complementarity of land structure [10,40]. Jenks pointed out that the essence of a compact city includes both a high-density urban spatial structure and reasonable and effective urban spatial functions, emphasizing the importance of reasonable compactness suitable for the city [44]. Therefore, when formulating a compact city strategy, the suitable range of high density and mixed land use and the relation between the two are important issues. With many scholars carrying out research on this, Wei improved the Thünen–Alonso model by proposing a standard cross-section ideal model to study the relationhip between compact urban development and land use performance in the Yangtze River Delta region. The researcher then discussed ‘appropriate compactness’ in compact urban development when total urban density and land resources are constrained [45]. Shu quantified compact settlements according to their land use, functional structure, and spatial form compactness to measure the compactness of the sample Tianjin residential area and adjusted the linear relation between related variables and compactness to explore the suitable spatial capacity of compact settlements [46]. Zhang et al. further used space syntax theory to study the 75 km2 old urban area of Dalian City, China. They used the urban street network form and land function utilization at the street level as two fundamental research factors to explore their relations in land distribution, fractal dimension, and their interactions [47]. Ranka et al. used the fractal method to classify and analyse the relationship between urban form and land use in new Belgrade superblocks. They classified the new Belgrade residential superblock type and divided the relation between urban spatial form and land use into four types, finding that the type of building land has an important impact on land expansion [48].
Thus, compact cities align well with the trend of sustainable development and have become an ideal model for the orderly development of large cities. The coordinated relationship between urban spatial form and land use has a significant guiding effect on the internal structure and main functions of compact cities across both time and space dimensions. Therefore, the high density of urban form and suitable range of mixed land use and any imbalance between the two are issues worthy of attention. Meanwhile, discussing their ‘appropriate compactness’ is an effective way for compact cities to deal with renewal densification and propose reasonable spatial relations. This study asserts that spatial compactness and the mixed use of land in compact cities are mutual influences, which can optimize and complement each other. The study of compact cities should be based on a suitable relation with the built environment. However, a pure threshold value study lacks a realistic basis for urban morphogenesis.
1.3. Research Purposes

Given the above problems, in this study, we addressed the coordination between urban spatial compaction and mixed land use as the research focus. Additionally, we selected representative areas of the old area for renewal (northern bank) and a new area for growth (southern bank) on both sides of the Hunhe River in Shenyang City to evaluate the compactness characteristics of their urban forms. Based on the optimization of the compactness measurement, we analysed the coupled dysfunctional distribution of urban spatial compactness and mixed land use and its causes. Considering the intensive development of compact cities, we further proposed a basis for the identification of urban renewal governance units and provided scientific guidance for optimizing increasingly dense compact forms as well as policy measures for renewal governance.

2. Materials and Methods

2.1. Study Area

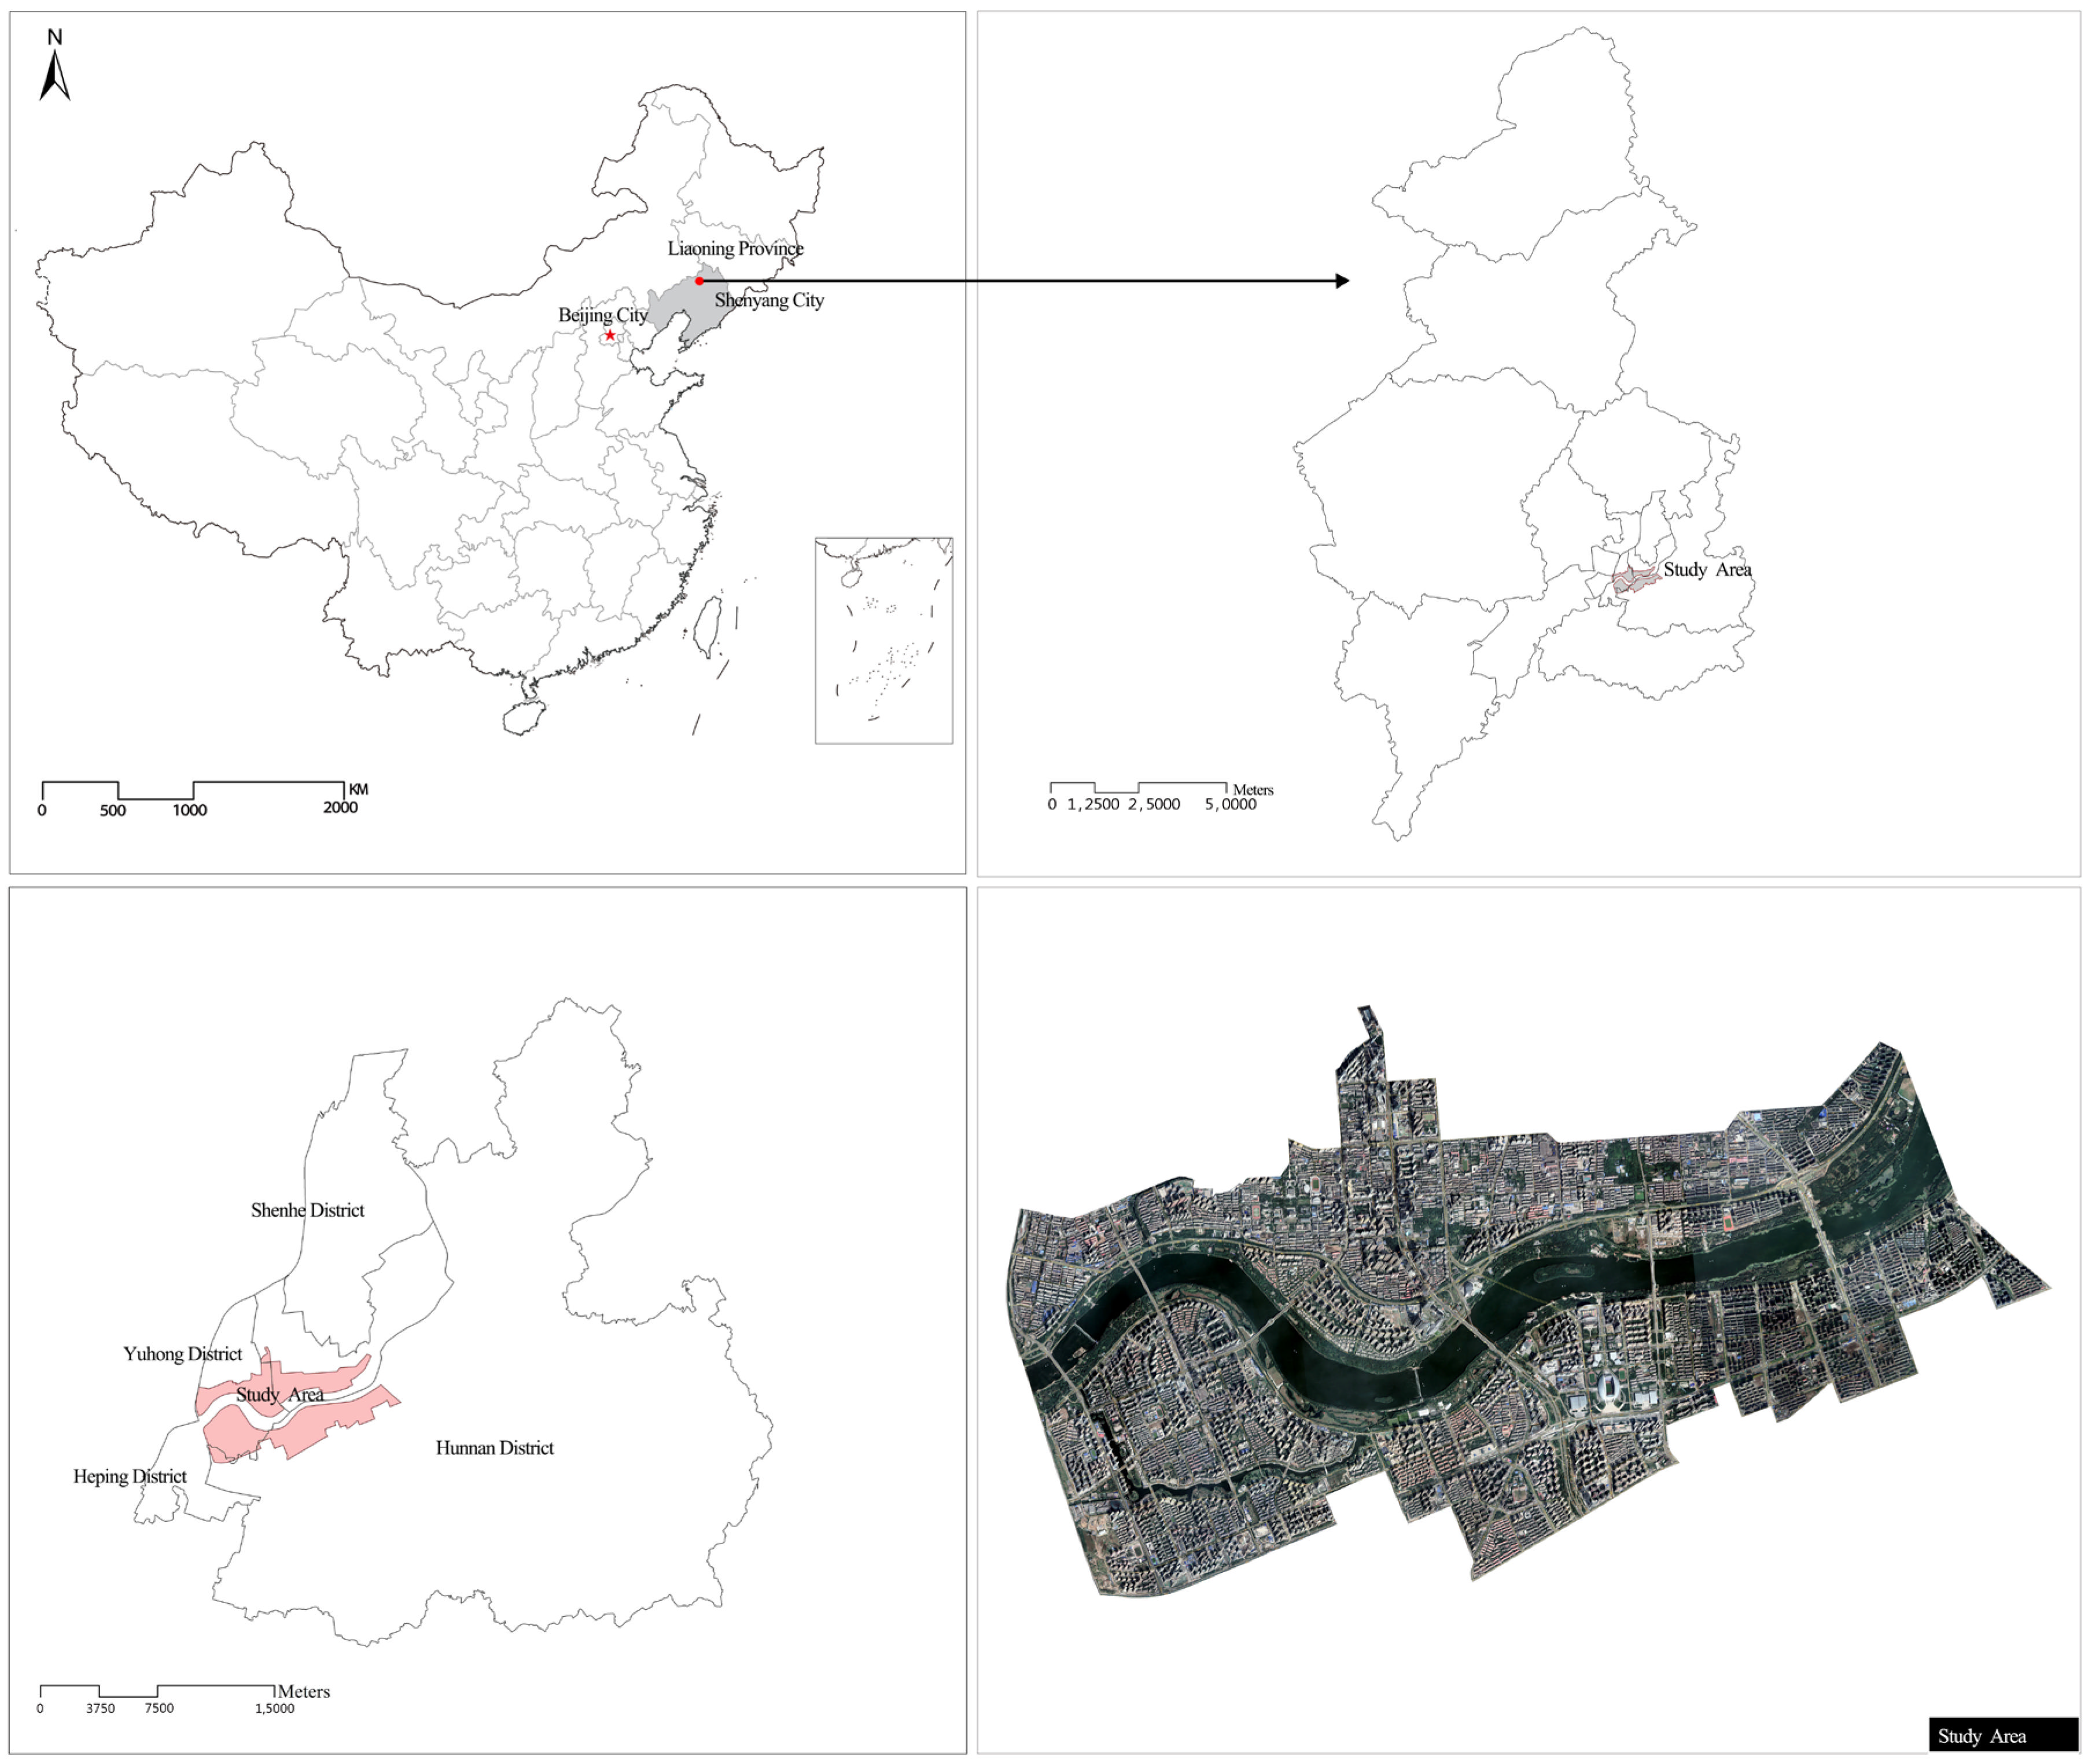
We selected the land with an area of approximately 3972 hectares on both sides of the Hunhe River in Shenyang City as the research area. The northern and southern banks of the Hunhe River reflect the before-and-after sequence of urban construction, displaying the representative morphological characteristics of the renewal of the old city and the development of the new area. The study area covered the spatial layout of various functional areas of the city, such as the city’s central business district, commercial centre, cultural centre, sports centre, and a large number of urban residential areas. The Hunhe landscape belt is an important urban landscape corridor in Shenyang. It combines many urban cultural and leisure functions. Meanwhile, the land use and morphological distribution of the waterfront space are the most representative urban skyline forms in Shenyang. The road structure of the study area is clear and transportation is convenient, with three subway lines passing through and 1302 bus stops (Figure 1). Additionally, compared with other areas in Shenyang, this study area demonstrated significant north–south differences in the time sequence of construction and development, and presented relatively complex but regular spatial morphological and land use characteristics.

2.2. Data and Pre-Processing

2.2.1. Data Sources

We measured spatial compactness using data on block land and buildings. The building data consisted of 7121 buildings in the district, sourced from Baidu Building Vector data 3.0. The data source of the degree of land use mix measurement in the study area was the point of interest (POI) data of Baidu Maps, a river map, with a total of 74,803 cases. POI types were divided into 147 service types, such as shopping, catering, life, industrial and commercial enterprise, scientific, educational, cultural, and sports and leisure services.

2.2.2. Data Pre-Processing

To ensure scientific accuracy, we conducted data pre-processing. First, we converted the POI data to projected coordinates. Second, we performed a series of operations on the data, such as unifying the POI function labels and deleting duplicate data. Finally, we corrected the data, retaining only data that fell within the scope of the study as valid data. According to the “Guidelines for the Classification of Land and Sea Use for Spatial Survey, Planning, and Use Control (trial)” (Natural Resources Office [2020] No.51), we reclassified the POI data to form POI classifications corresponding to the main land use types, generating 5 primary and 16 secondary categories for use as the classification system of POI types in this study (Table 1).

2.3. Methods

The basic grid unit was set at 100 m × 100 m, and the grid angle was adjusted according to the direction of the main roads in the city. The evaluation units could reflect the land use relation at the block scale as much as possible. The quantitative analysis was completed using IBM SPSS Statistics for Windows, Version 26 and ArcGIS10.8.
Our specific research methodology was as follows:
  • Construct an evaluation method of a multi-index system and assign weights to identify the spatial compactness of the study area;
  • Use POI data to identify the degree of mixed land use in the study area based on the entropy index measurement method;
  • Use the coupling coordination degree model to explore the coupling coordination between spatial compactness and degree of land use mix;
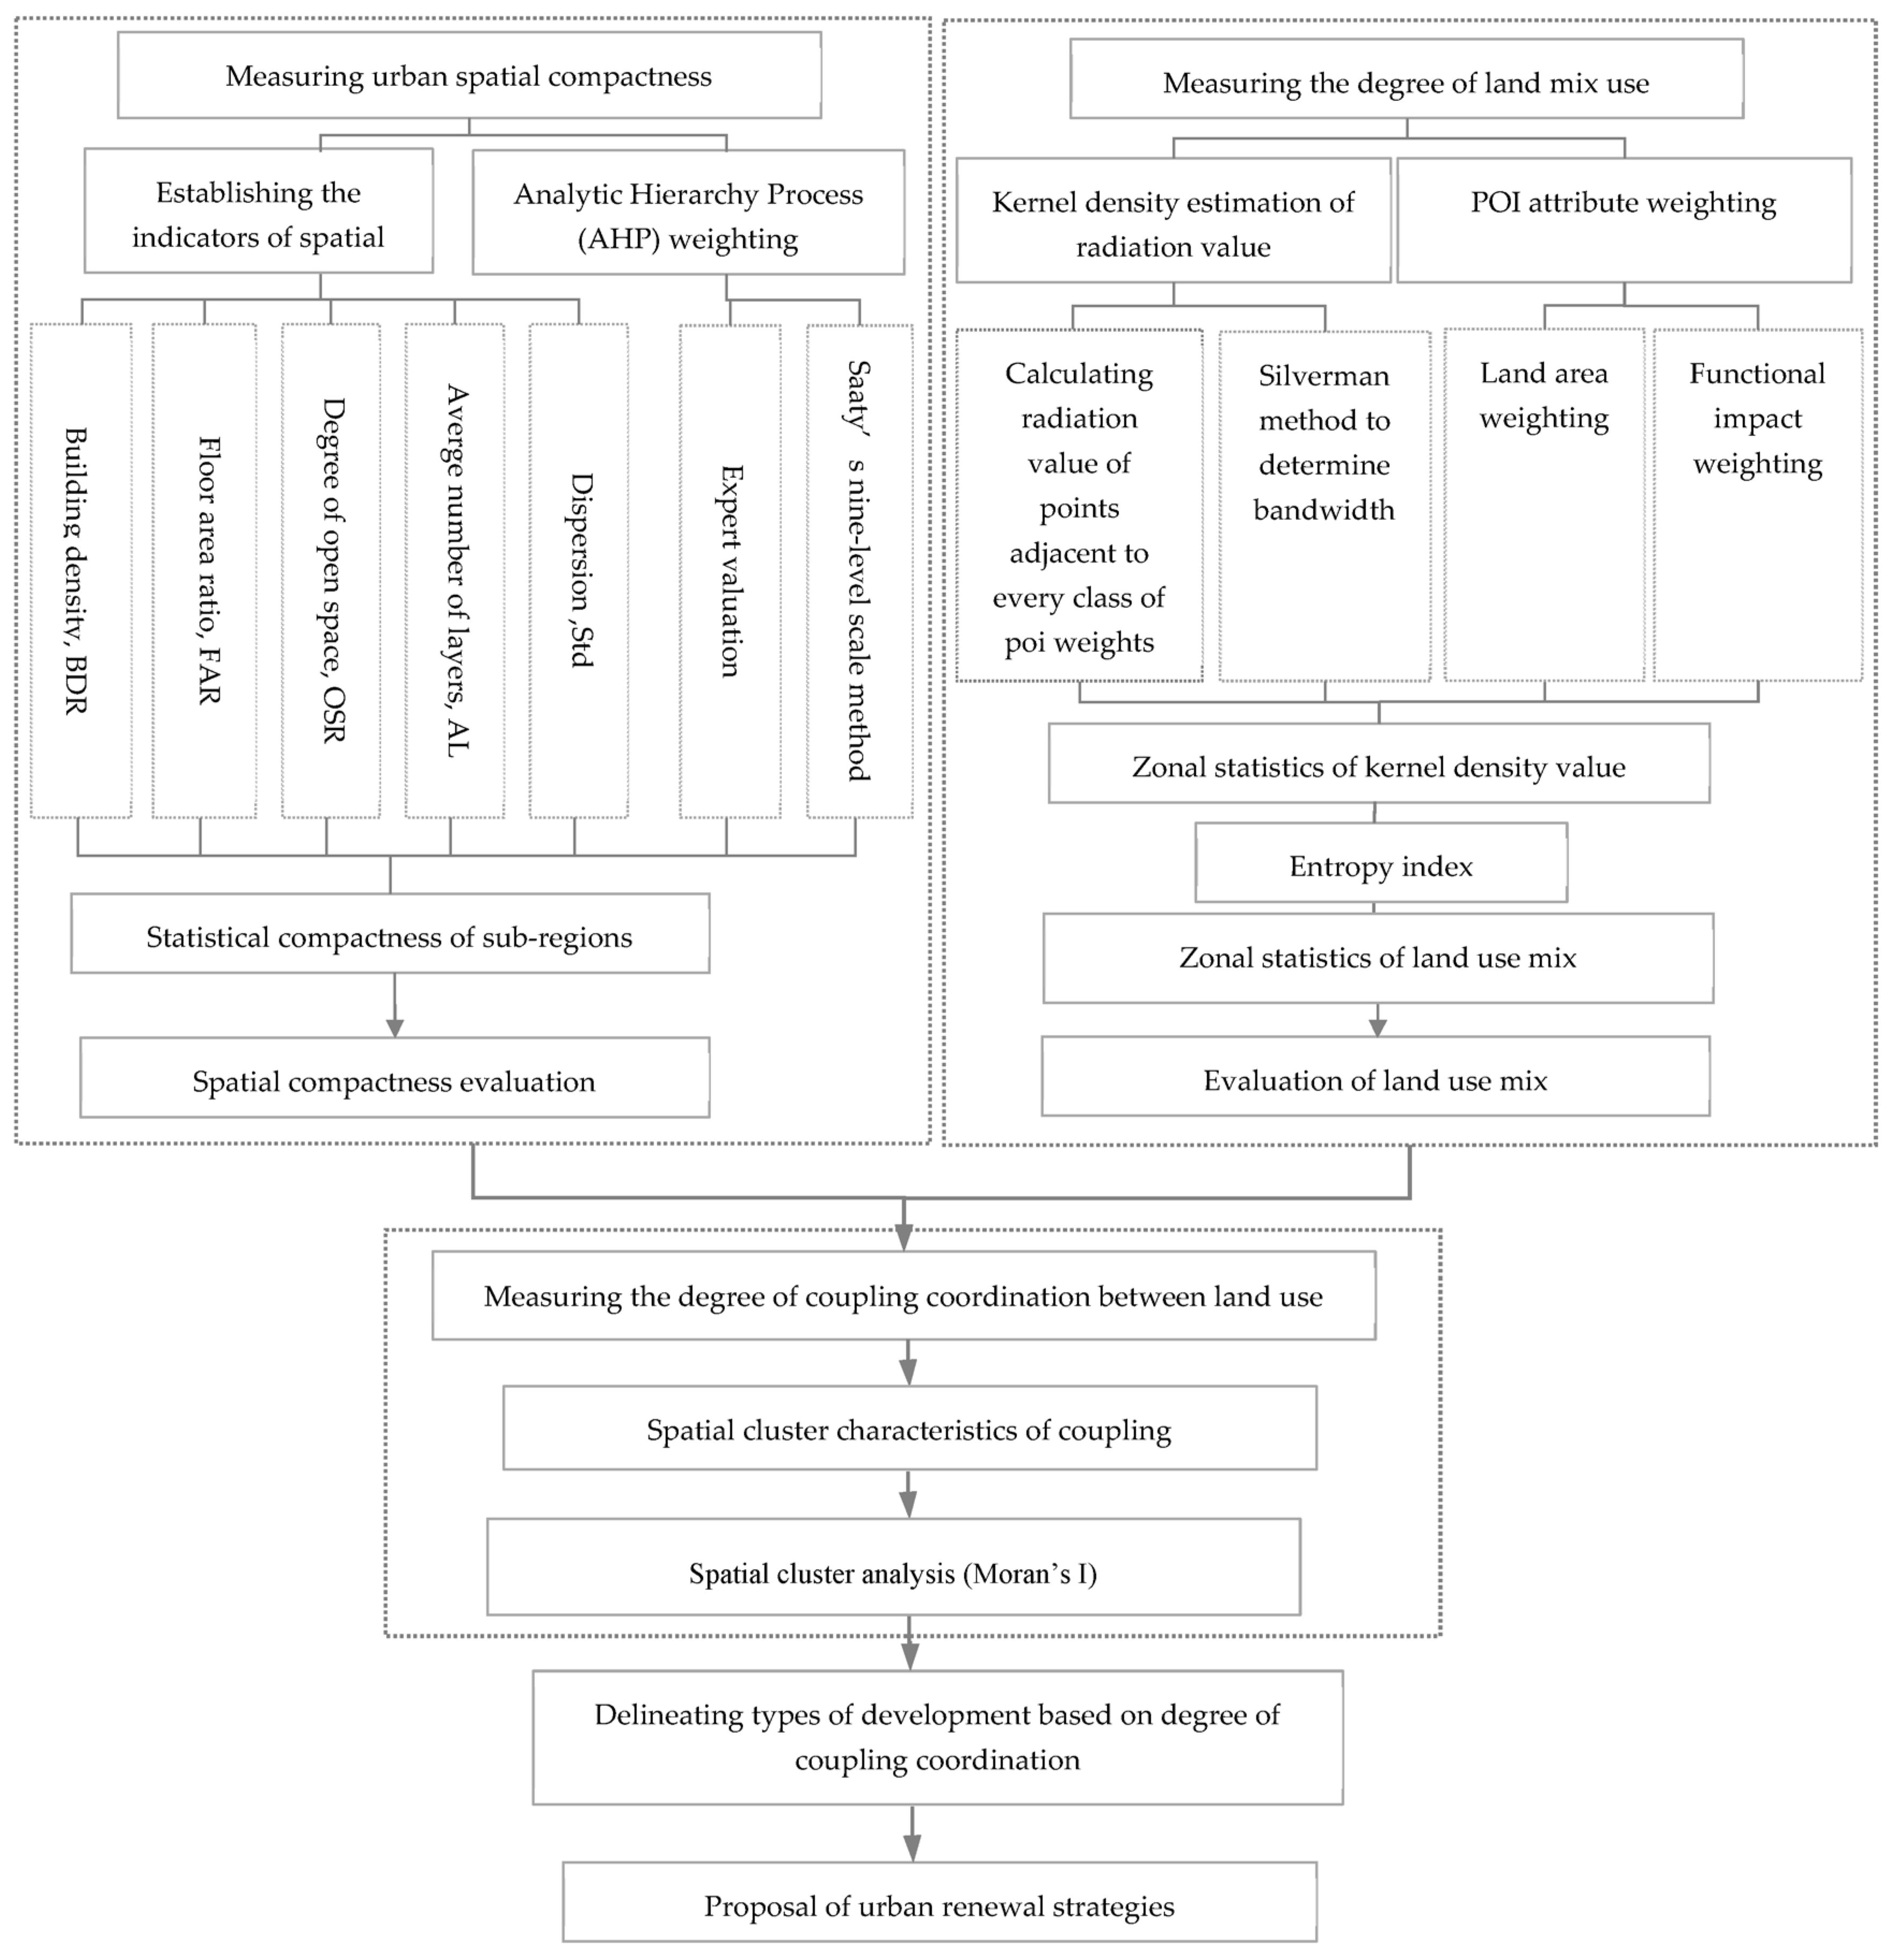
  • According to the coupling coordination results, analyse the distribution of coupling imbalance and its causes, identify the zoning characteristics of urban renewal units, and propose strategies and suggestions for renewal governance (Figure 2).
We expected to contribute the following improvements:
  • Based on the quantitative evaluation, we further discussed the coupling coordination between the compaction of urban space and mixed land use.
  • In the division of evaluation units, the evaluation criteria could not be unified in existing research owing to differences in plot shapes and land areas. Thus, we used the grid as the evaluation unit to eliminate the errors caused by the shape of the urban plot and land area. Our method could identify the POI data beyond the scope of the plot.
  • Our research method strengthens the focus on the comprehensive measurement of horizontal and vertical space for mixed land use, thus optimizing the measurement method for the scientific identification of the compact urban form.

2.3.1. Analysis of Spatial Compactness

We performed the control of urban land use in urban planning mainly through four indicators: the average number of layers, floor area ratio, building density, and the degree of open space. Additionally, considering that the different building layers in the three-dimensional space of the city had a certain impact on the spatial compactness of the city, we added the dispersion index. We constructed the index system comprehensively and allocated the weights [46], as shown in Table 2. We determined the weight of each index using the analytic hierarchy process. Finally, we measured the spatial compactness of the study area using ArcGIS 10.8.

2.3.2. Land Use Mix Analysis

We used the kernel density estimation method (Formula (1)) [49,50] to determine the radiation value of the POI point and the Silverman empirical method (Formula (2)) to determine the bandwidth h . Since each POI point represents a geographic entity, the environmental perceptions of urban residents can reflect the functional influence and the degree of significance of the geographic entity represented by each type of POI point in a certain period. This has an important impact on the functional nature of the unit. The functional impact [51] and reference land area served as the influence factors of the weight assignment in assigning the POI points of each grid (Table 3). We then used the weighted kernel density value to measure the land use mixing degree with the entropy index [52,53]. The degree of land use mix U 2 is shown in Formula (5) [54]:
f s = i = 1 n 1 h 2 φ s c i h  
h = 0.9 × m i n S D , 1 ln 2 D m × N 0.2  
S D = i = 1 N x i X ¯ 2 / N + i = 1 N y i Y ¯ 2 / N
P j = W j × d j i = 1 m W i × d i × 100 %
U 2 = j = 1 m P j ln P j
where f s is the kernel density estimation function located at position s ; h is the attenuation value, or the bandwidth; c i is the position of the i-th POI point; n is the number of POI points whose path distance from position s is not higher than h ; and φ is a preset kernel function. S D is the standard distance between the average centre of the point and all points; D m is the median distance between the average centre of the point and all points; x i and y i are the coordinates of feature I; ( X ¯ ,   Y ¯ ) represents the average centre of the input points; and N is the total number of POIs. P j is the ratio of the POI core density value to the total value of the POI core density of the functional area unit, W j is the weight, and d j is the core density sum of type j POI. m is the number of POI categories (note: if the density of a certain type of POI kernel in the unit is 0, it is calculated as 0.000001).
The above two weights of land area and functional impact are normalized using maximum value scaling (Equations (6) and (7)) to obtain the final weight values of various POIs:
W i j = W i j m a x W i j
W j 0 = W 1 j + W 2 j
where i represents two weight types, i = 1, 2; j denotes the POI’s secondary class; W i j is the weight of the j-th item of the i-th class; W i j is the new value normalized to its maximum value; and W j 0 is the final weight value of various POIs.

2.3.3. Coupling Relation Analysis

The concept of coupling comes from physics capacity coupling, which refers to the phenomenon in which two or more systems are linked to each other in the process of motion due to mutual influence and interaction. At present, the following coupling degree formula is commonly used in academia [55]:
C = i = 1 n U i 1 n i = 1 n U i n 1 n
where n is the number of subsystems; U i is the value of each subsystem, and its distribution interval is [0, 1]. Therefore, the coupling degree C value interval is [0, 1]. The larger the C value, the smaller the dispersion degree between subsystems and the higher the coupling degree and vice versa [55]. When n = 2, the coupling degree formula is:
C = 2 U 1 U 2 U 1 + U 2
where U 1 and U 2 represent the degrees of spatial compactness and land use mix, respectively; C is the coupling degree of the two.
T is the degree of coordination between the two, the formula is:
T = i = 1 n a i × U i
i = 1 n a i = 1
where U i is the value of each subsystem, a i is the weight of each subsystem. When n = 2 , the formula is:
T = a 1 U 1 + a 2 U 2
We posited that the weight of spatial compactness and land use mix would be the same, as the values of a 1 and a 2 are both 0.5, and D is the coupling coordination degree of the two [56,57]:
D = C × T  
The evaluation standard of the coupling coordination degree is shown in Table 4 [58].

3. Results

3.1. Analysis of Spatial Compactness

The distribution of spatial compactness on both sides of the Hunhe River was significantly different. Among them, the compactness of Qingnian Street in the central part of the North Bank was prominent, the overall spatial distribution of compactness in the South Bank was relatively balanced, and the central area of the Olympic Sports Centre was relatively significant. Specifically, the area of Qingnian Street was highly compact and concentrated along Qingnian Street, with dense high-rise clusters, whereas its east and west sides were low in compactness and evenly distributed. Contrarily, the distribution of spatial compactness on the South Bank was relatively balanced, generally reflecting the spatial morphological characteristics of high compactness in the north and low compactness in the south, with moderate density. The measured values (Table 5) showed that the spatial compactness value of the study area was in the range of 0.118763–0.771841, averaging 0.376932, with the grid area accounting for 59.55%. Areas of extremely low and high values accounted for a smaller percentage, and the overall compactness level was not high. From the spatial clustering distribution, Moran’s I index was 0.411257 on the north bank and 0.080874 on the south bank, with a p-value of 0, passing the test at the 1% significance level. The spatial compactness of both the north and south banks had spatial clustering characteristics, but the south bank had a more balanced distribution than the north bank (Table 6). Overall, the spatial gradient of the compact urban form on both sides of the Hunhe River was significantly different. The eastern and western sides of the northern bank were less compact, and the spatial forms were relatively gradual, whereas the spatial compactness on the south bank was relatively balanced (Figure 3).

3.2. Analysis of Degree of Land Use Mix

The differences between the north and south banks were more significant. The central part of the northern bank had evident cluster characteristics, whereas the distribution of the degrees of land use mix in the southern bank was more balanced. Specifically, the high-value areas on the northern bank were concentrated in the central area of Shenyang Golden Corridor, with Qingnian Street as the axis. This area brings together major functions, such as finance, commerce, business, culture, and sports. Additionally, we also observed small-scale high-value areas in the eastern and western parts of the northern bank, which showed alternating characteristics of multiple high and low regions from west to east. The distribution of the degree of land use mix in the southern bank was relatively balanced, and the mixing degree in the central area of the Olympic Sports Centre was relatively significant. From the perspective of proportions, the quantitative structure of the degree of land use mix by area reflected a spindle-shaped structure, with a larger proportion of moderate values and smaller proportions of extreme values at both ends, and the average value of the degree of land use mix was 0.994080 (Table 7). From the spatial clustering distribution, Moran’s I index was 0.893497 on the north bank and 0.867091 on the south bank, with a p-value of 0. The spatial compactness of the north and south banks showed spatial clustering characteristics, but the clustering of the north bank was higher than that of the south bank (Table 8). Overall, the level of land use mix in the study area was moderately high, and the spatial clustering and distribution characteristics of the northern and southern sides of the bank were significantly different. Patches of low-level mixed land use were mainly affected by large-scale single-use land properties, such as the Nanhu Community of Northeastern University, large residential land, and its internal patches. Among them, the riverside residential land patches were the most obvious (Figure 4).

3.3. Analysis of the Coupling Coordination Degree of Spatial Compactness and Land Use Mix

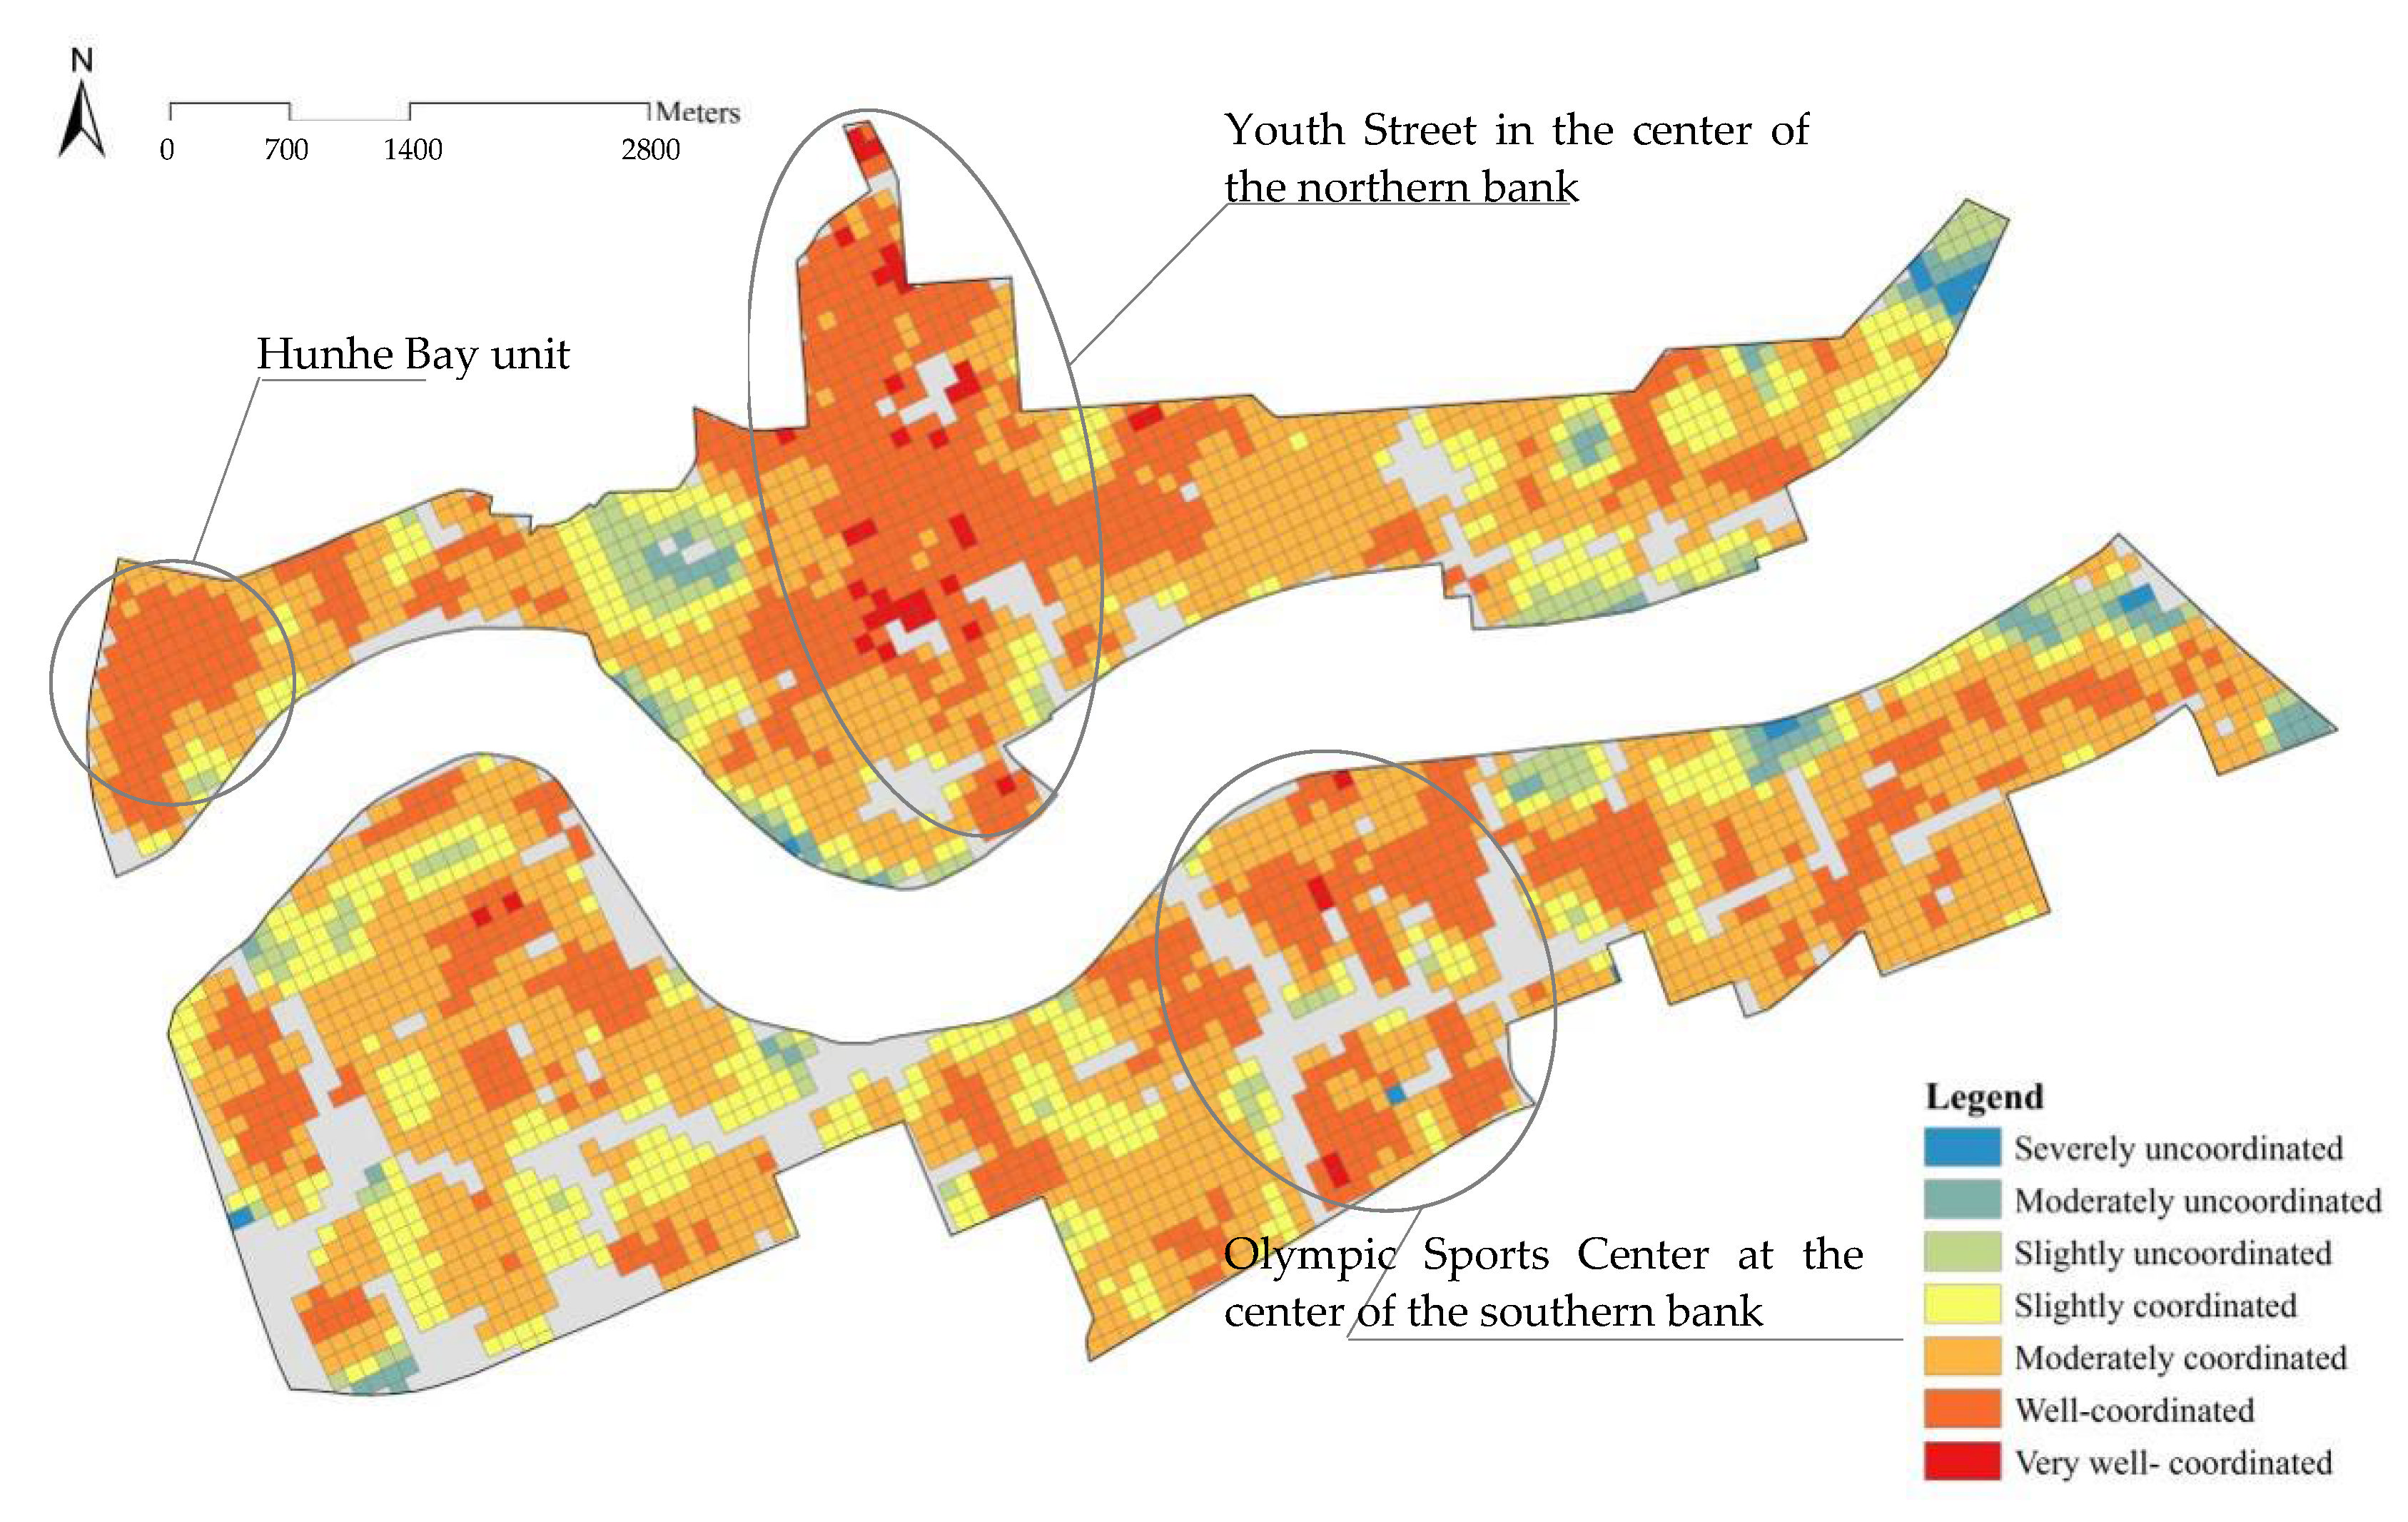
The distribution of the coupling coordination degree between spatial compactness and land use mix in the study area is shown in Figure 5. Among them, the high-value areas of the coupling coordination degree on the northern bank were concentrated in the Hunhewan unit in the east and the Qingnian Street area in the middle, with the former being a residential unit. The compactness of the space and mix of functions of residential, educational, and living facilities reflected good coordination. Central Youth Street, as the core area of the Golden Corridor, was highly mixed with complex and diverse functions, and high-rise buildings were densely distributed. However, the spatial clustering characteristics of the coupling coordination degree in the southern bank were not obvious. High-value areas were scattered in each area unit, and the central part of the Olympic Sports Centre had the highest degree of coupling coordination. This area is mainly used for sports functions and is equipped with commercial, park, square, medical, residential, and other facilities. Therefore, the degree of spatial compactness and land use mix also showed a high degree of consistency. The distribution of low-value areas on the southern bank was relatively scattered, which manifested as the incongruity between high spatial compactness and low land use mix, with this type of space mostly being large-scale residential land. Additionally, university campuses, such as Northeastern University’s Nanhu Campus and Shenhe Campus, had lower coupling coordination values owing to their lower floor area ratio. In terms of the overall area ratio based on the values, moderately coordinated areas accounted for the largest proportion at 46.63%, whereas well-coordinated and highly well-coordinated areas accounted for 28.79% and 1.18%, respectively. The total proportion of uncoordinated areas was 7.17% (Table 9). Finally, from the spatial clustering distribution, the Moran’s I index of the north bank of the Hunhe River was 0.865880 and that of the south bank was 0.714876. There was spatial positive autocorrelation in the spatial distribution of the coupling coordination degree between the north and south banks, showing clustering characteristics, but the north bank was more clustered (Table 10).

4. Discussion

4.1. Analysis of Causes of Coupling Misalignment

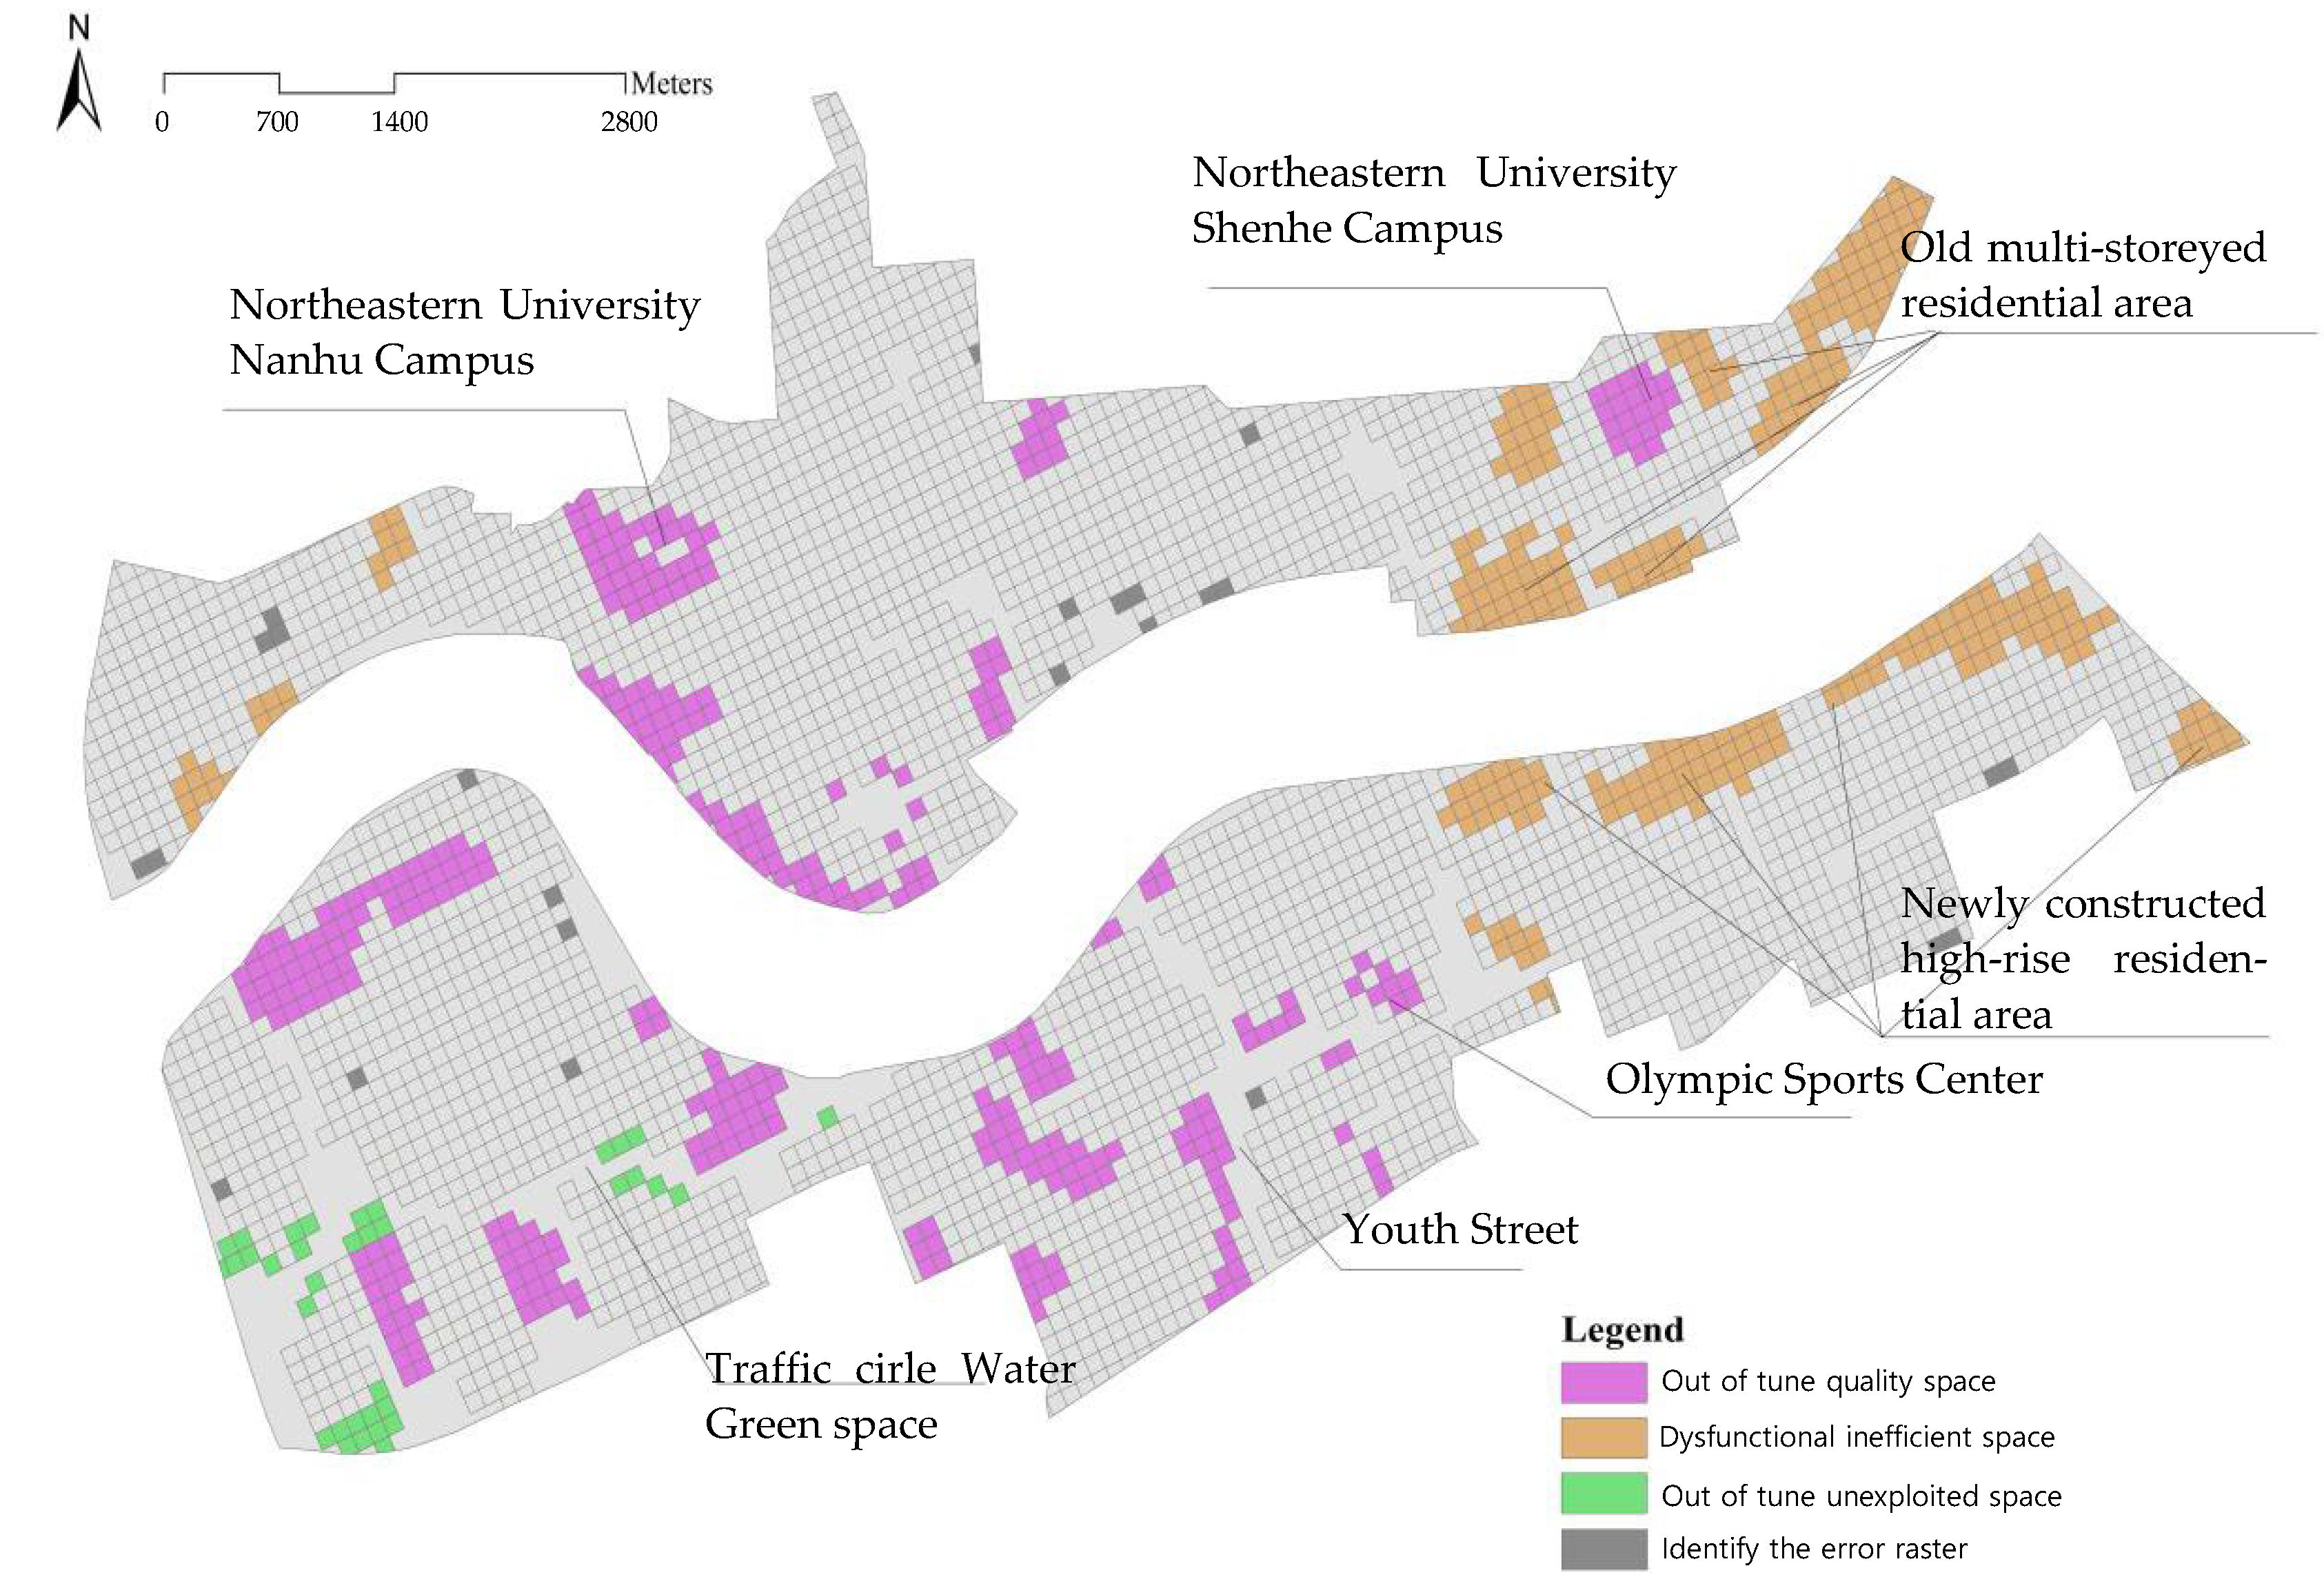
Based on the evaluation results of the coupling coordination degree, we conducted further spatial identification of the uncoordinated areas. We defined severely, moderately, slightly, and slightly coordinated areas as uncoordinated areas and identified the uncoordinated patches shown in Figure 6 in the study area. Furthermore, combined with the actual use of urban space, we further identified uncoordinated quality, uncoordinated inefficient, and uncoordinated undeveloped spaces. Uncoordinated quality spaces were those with poor coupling between compactness and land use mix but with relatively good quality space. Examples included the Nanhu Campus and Shenhe Campus of Northeastern University. The reasons for the misidentification were the low development intensity of the campus space and the singular purpose of the land (i.e., educational), which ran counter to the principles of intensiveness and compactness. Nonetheless, its functions were complete with a superior environment and could be considered a high-quality urban space. Additionally, the newly built areas on the southern bank also had more uncoordinated areas, mainly owing to the larger scale of the street profile of the residential land and high development intensity, which led to the uncoordinated coupling. Uncoordinated inefficient spaces comprised spaces that were evaluated to have uncoordinated or slightly coordinated coupling degrees and referred to the unreasonable state of inefficient use of land or facility resources, which manifested as incomplete infrastructure, poor quality housing, and low development intensity. For example, we identified some large multi-storey and old residential areas. We observed a greater need for the redevelopment or renewal of such spaces. Finally, uncoordinated undeveloped space consisted of vacant urban land (the green patch in the west of the southern bank). For instance, some inefficient urban storage land or unused unbuilt residential land showed great development potential.
Additionally, the analysis of the distribution of cold hot spots and the distribution of urban functions revealed that urban functions were mutually attractive. Through comparison, we found that the large riverside parks on both sides of the study area presented themselves as cold hotspots, whereas the surrounding urban spaces were all hotspots that showed aggregation in spatial distribution. Furthermore, special urban functions, such as parks and campuses, can be seen to have a positive influence on the surrounding commercial service facilities, residential spaces, settlement development, and public service facilities. Such urban functions can also stimulate the clustering of other urban functions.

4.2. Analysis of Differentiated Governance Strategy

Differentiated governance strategies should be implemented on the northern and southern banks of the Hunhe River. The development timings of both banks were different, and the manifestations and causes of the uncoordinated patches were also rather different. As shown in Figure 6, the uncoordinated areas in the north were mostly old blocks and could be easily connected, whereas those in the south were mostly new blocks, mainly large-scale and high-intensity residential land. Therefore, dividing the northern bank into renewal units would be suitable for the coordination of overall renewal management, whereas the southern bank would be suitable for targeted renewal or for promoting community revitalization.
The uncoordinated patch on the northern bank corresponded to a multi-storey old block, which was a single-purpose urban space that had a long construction age, a poor residential environment, and a continuously decreasing residential population. Therefore, in governance, consideration should be given to comprehensive consolidation, functional change, demolition, and reconstruction in the selection of renewal types to promote organic renewal. In other words, the revitalization and management of old blocks should be prioritized, with the premise of retaining the existing street patterns, including renovating and adding community services and recreational spaces. For urban redevelopment, the overall planning of the area should be actively formulated, its functional layout optimized, and its compactness capacity scientifically predicted. A scientific renewal logic should be established.
The urban space corresponding to the uncoordinated patch on the eastern bank of the Hunhe River was a new high-rise residential area with a relatively recent construction age and good internal design. The main cause of the incoordination stemmed from the excessive pursuit of high density in the waterfront space, and the single-purpose land use led to the lack of land use diversity in the uncoordinated area. Therefore, such established communities should scientifically assess their governance needs. Gradual, small-scale land use renewal should be encouraged in the governance process. More importantly, renewal should be performed with greater attention to the community development model of residents’ self-governance, emphasizing community activation.

4.3. Optimization of Research Methods

Our study provided a quantitative tool to measure urban spatial compactness and land use mix effectively. In terms of the measurement method of spatial compactness, relevant studies have been relatively macroscopic, targeting urban clusters and the overall scope of cities, and with macroscopic data as indicators, such as city size, built-up area density, and population density. As such, we based our work on the block level and used the control indicators of urban land to establish a spatial compactness evaluation method. We selected five indicators for the index system, namely the average number of floors, dispersion, building density, floor area ratio, and degree of open spaces. The establishment of this index has certain advantages for morphological identification at the urban block scale. In the measurement method of land use mix, the existing research is mainly based on two-dimensional measurement. Given this limitation, we selected POI data to measure the degree of land use mix, which could not only realistically and accurately reflect the status quo of mixed land use but also fully reflect the mixed degree of vertical forms.

4.4. Limitations

This study had certain limitations. First, we aimed to evaluate whether urban construction and development are intensive and efficient by quantitatively measuring urban spatial compactness, land use mixing, and their coupling relations; however, the evaluation results were subject to a certain degree of subjectivity owing to differences in the formulation of evaluation standards. Our results clearly located the distribution of uncoordinated areas in the study area, but our method could not directly determine problems in the actual site, which must be further determined based on the actual development context of the city.
Second, our study was a static study based on a single time node. It lacked the dynamic evolution of the regional spatial compactness and coordinated relation of land use mix. For uncoordinated patches, detailed investigation can be introduced in follow-up research, such as land plot properties, building functions, regional population, and economic characteristics. Future work may then propose accurate urban renewal governance strategies.
Third, different cultural or citizen characteristics may affect urbanization. Therefore, the results of this study can be used as a reference for stakeholders, but the data and results should be used as a reference or with caution due to the differences in social factors.

5. Conclusions and Recommendations

5.1. Conclusions

Through research on the spatial compactness, degree of land use mix, and coupling coordination between the two factors of the study area, we drew the following conclusions:
First, we found significant differences in the spatial distribution of urban spatial compactness, mixed land use, and their coupling coordination between the two banks of the Hunhe River, where the northern bank displayed stronger clustering and the southern bank was more balanced. Specifically, in terms of spatial compactness, the northern bank had a high concentration of youth-oriented streets in its central part and a gentler distribution in the east and west. Meanwhile, a large number of residential areas on the southern bank reflected a balanced state of density. In terms of the degree of land use mix, the low-value areas on the northern bank were concentrated in a specific area, whereas the southern bank showed a dispersed and balanced distribution. Finally, in terms of the coupling coordination degree between the degree of land use mix and spatial compactness, significant patches on the northern bank had strong central clusters and greater contiguity, whereas significant patches on the southern bank tended to be distributed.
Second, through the analysis of the coupling coordination in the study area, we found that the uncoordinated patches with residential functions were all distributed in large areas with high floor area ratios. Small blocks with residential functions as their main function had a higher degree of coupling coordination, whereas large blocks had more uncoordinated patches. The land in the central area on the northern and southern banks had the highest degree of coupling coordination and shared the following characteristics: higher functional mixing, higher building height and floor area ratio, and having various highly accessible facilities. Uncoordinated patches were mostly areas with high renewal potential.
Third, the logic and method of this study can be used as a design governance tool. Through the evaluation of the incoordination of existing land, our study can help guide and control the compact urban form and scientifically simulate the form incrementally through overall planning and renewal. Our results revealed the spatial logic and coupling contradiction (i.e., inconsistency in the spatial structure of both factors) in urban spatial forms and urban functional spaces (i.e., compactness of the spatial form and characterization of land use mix) [59]. For different types of uncoordinated areas, differentiated renewal governance measures should be reasonably selected, such as demolition and reconstruction, encouragement of targeted construction, comprehensive consolidation, and community development.

5.2. Recommendations

Based on the analysis of the causes of the uncoordinated areas, combined with the current space usage, we formulated area zoning and differential governance suggestions for the study area from the overall governance perspective.
Regarding the northern bank, we recommend, first, further identifying the current construction situation from the scale of land use, dividing urban renewal units, and proposing unit control guidelines. The control guidelines should be guided by the principle of retaining existing street patterns in optimizing compact urban renewal construction. This is mainly through comprehensive renovation to enhance the attractiveness of old neighbourhoods.
Second, the promotion of continuous renewal should be encouraged in the eastern part of the northern bank. Considering the large areas of coupling incoordination in the waterfront space on the southern and northern banks, skyline planning should be fully studied for a contiguous renewal area. Moreover, the formation of new uncoordinated coupling areas owing to continuous high-intensity waterfront construction should be avoided.
Third, suitable spatial increments must be comprehensively coordinated. Studies must be undertaken on the ‘moderately compact’ urban vital areas for planning. Moreover, the authorities should coordinate skyline planning, scientifically select sites and business clusters and effectively drive them, as well as propose appropriate capacity control requirements and organic spatial relations.
Regarding the southern bank, we recommend targeted construction for efficient and intensive construction. Most of the southern bank area is composed of newly built land, and the uncoupled areas that appear are also fragmented. The renewal strategy should encourage gradual and small-lot renewal, make full use of market resources, attract social capital, and activate the use of space. Moreover, authorities should combine community assets and promote revitalized construction. As most of the residential areas in the southern bank are closed communities, community construction measures should be proposed based on the context of each community.

Author Contributions

Conceptualization, S.L.; methodology, C.G. and S.L.; software, C.G.; validation, S.L.; formal analysis, S.L.; investigation, C.G. and Y.C.; resources, S.L.; data curation, C.G. and Y.C.; writing—original draft preparation, C.G. and Y.C.; writing—review and editing, S.L., C.G. and Y.C.; visualization, C.G. and Y.C.; Supervision, S.L.; project administration, S.L.; funding acquisition, S.L. All authors have read and agreed to the published version of the manuscript.

Funding

This work was supported by the Liaoning Planning Fund Project of Philosophy and Social Science, grant number: No. L20CGL004.

Institutional Review Board Statement

Not applicable.

Informed Consent Statement

Not applicable.

Data Availability Statement

The data presented in this study are available on request from the corresponding author. The data are not publicly available for privacy reasons.

Conflicts of Interest

The authors declare no conflict of interest.

References

  1. Li, P. Review and Prospect of China’s Economic Development Since the 1990s (Part I). World J. Manag. 1995, 5, 51–58. [Google Scholar]
  2. Ma, L.; Jin, F. Evaluation of Chinese Urban Compactness. Prog. Geogr. 2011, 30, 1014–1020. [Google Scholar]
  3. Wang, X.; Wan, F.; Li, Z. Development Studies on Compact City Theory into Urban Planning. Academics 2014, 12, 114–121+327. [Google Scholar]
  4. Newman, P.; Kenworthy, J. Gasoline consumption and cities revisited: What have we learnt? Curr. Urban Stud. 2021, 9, 532–553. [Google Scholar] [CrossRef]
  5. Force, U.T. Towards an Urban Renaissance; Section 14-Sustaining the Renaissance; E & FN Spon: London, UK, 1999. [Google Scholar]
  6. Burton, E. Measuring urban compactness in UK towns and cities. Environ. Plann. B Plann. Des. 2002, 29, 219–250. [Google Scholar] [CrossRef]
  7. Koziatek, O.; Dragićević, S. A local and regional spatial index for measuring three-dimensional urban compactness growth. Environ. Plann. B Urban Anal. City Sci. 2019, 46, 143–164. [Google Scholar] [CrossRef]
  8. Galster, G.; Hanson, R.; Ratcliffe, M.R.; Wolman, H.; Coleman, S.; Freihage, J. Wrestling sprawl to the ground: Defining and measuring an elusive concept. Hous. Policy Debate 2001, 12, 681–717. [Google Scholar] [CrossRef]
  9. Dantzing, G.; Saaty, T. Compact City: A Plan for a Liveable Urban Environment; Freeman and Company: San Francisco, CA, USA, 1973. [Google Scholar]
  10. Fang, C.; Qi, W. Research progress and thinking on the concept and measurement of compact cities. J. Urban Plan. 2007, 4, 65–73. [Google Scholar]
  11. Morrison, N. The compact city: Theory versus practice—The case of Cambridge. Neth. J. Hous. Built Environ. 1998, 13, 157–179. [Google Scholar] [CrossRef]
  12. Qiu, B. Compactness and diversity: The core concept of sustainable urban development in China. Urban Plan. 2006, 11, 18–24. [Google Scholar]
  13. Hong, M.; Jin, F. Analysis and insights of the compact urban land use concept. Chin. Land Sci. 2010, 24, 10–13, 29. [Google Scholar]
  14. Lv, B.; Sun, T. A study on the compactness of urban spatial form from the perspective of low carbon. Geogr. Res. 2013, 32, 1057–1067. [Google Scholar]
  15. Churchman, A. Disentangling the concept of density. J. Plan. Lit. 1999, 13, 389–411. [Google Scholar] [CrossRef]
  16. Kotharkar, R.; Bahadure, P.; Sarda, N. Measuring compact urban form: A case of Nagpur City, India. Sustainability 2014, 6, 4246–4272. [Google Scholar] [CrossRef] [Green Version]
  17. Hofstad, H. Compact city development: High ideals and emerging practices. Eur. J. Spat. Dev. 2012, 10, 1–23. [Google Scholar]
  18. Li, L.; Huang, X. Research on the measurement and evaluation of compactness based on the interpretation of the essence of ‘compactness’ -- construction of the concept system and index system of ‘compactness’. Int. Urban Plan. 2012, 27, 33–43. [Google Scholar]
  19. Abdullahi, S.; Pradhan, B.; Jebur, M.N. GIS-based sustainable city compactness assessment using integration of MCDM, Bayes theorem and RADAR technology. Geocarto Int. 2015, 30, 365–387. [Google Scholar] [CrossRef]
  20. Zagorskas, J.; Burinskienė, M.; Zavadskas, E.; Turskis, Z. Urbanistic assessment of city compactness on the basis of GIS applying the COPRAS method. Ekologija 2007, 53, 55–63. [Google Scholar]
  21. Tsai, Y.-H. Quantifying urban form: Compactness versus ‘sprawl’. Urban Stud. 2005, 42, 141–161. [Google Scholar] [CrossRef]
  22. Thinh, N.X.; Arlt, G.; Heber, B.; Hennersdorf, J.; Lehmann, I. Evaluation of urban land-use structures with a view to sustainable development. Environ. Impact Assess. Rev. 2002, 22, 475–492. [Google Scholar] [CrossRef]
  23. Hu, X.; Yan, H.; Wang, D.; Zhao, Z.; Zhang, G.; Lin, T.; Ye, H. A promotional construction approach for an urban three-dimensional compactness model—Law-of-gravitation-based. Sustainability 2020, 12, 6777. [Google Scholar] [CrossRef]
  24. Posada, H.M. Informal housing, spatial structure, and city compactness. J. Reg. Sci. 2018, 58, 822–836. [Google Scholar] [CrossRef]
  25. Abdullahi, S.; Pradhan, B. Land use change modeling and the effect of compact city paradigms: Integration of GIS-based cellular automata and weights-of-evidence techniques. Environ. Earth Sci. 2018, 77, 251. [Google Scholar] [CrossRef]
  26. Mubareka, S.; Koomen, E.; Estreguil, C.; Lavalle, C. Development of a composite index of urban compactness for land use modelling applications. Landsc. Urban Plan. 2011, 103, 303–317. [Google Scholar] [CrossRef]
  27. Min, H.; Fengjun, J.; Fath, B.D. Measurement and spatial distribution of urban land use compactness in Chaoyang District of Beijing, China. Chin. J. Popul. Resour. Environ. 2010, 8, 3–9. [Google Scholar] [CrossRef] [Green Version]
  28. Ritsema van Eck, J.; Koomen, E. Characterising urban concentration and land-use diversity in simulations of future land use. Ann. Reg. Sci. 2008, 42, 123–140. [Google Scholar] [CrossRef] [Green Version]
  29. Salvati, A.; Coch, H.; Morganti, M. Effects of urban compactness on the building energy performance in Mediterranean climate. Energy Procedia 2017, 122, 499–504. [Google Scholar] [CrossRef] [Green Version]
  30. Holden, E.; Norland, I.T. Three challenges for the compact city as a sustainable urban form: Household consumption of energy and transport in eight residential areas in the greater Oslo region. Urban Stud. 2005, 42, 2145–2166. [Google Scholar] [CrossRef]
  31. Mohajeri, N.; Upadhyay, G.; Gudmundsson, A.; Assouline, D.; Kämpf, J.; Scartezzini, J.-L. Effects of urban compactness on solar energy potential. Renew. Energy 2016, 93, 469–482. [Google Scholar] [CrossRef] [Green Version]
  32. Mahriyar, M.Z.; Rho, J.H. The compact city concept in creating resilient city and transportation system in Surabaya. Procedia Soc. Behav. Sci. 2014, 135, 41–49. [Google Scholar] [CrossRef]
  33. Cao, X.; Liang, F.; Chen, H. The influence of spatial form differences in megacities on the efficiency of transportation networks. Geogr. Sci. 2019, 39, 41–51. [Google Scholar]
  34. Breheny, M. The compact city and transport energy consumption. Trans. Inst. Br. Geogr. 1995, 20, 81–101. [Google Scholar] [CrossRef]
  35. Burton, E. Housing for an urban renaissance: Implications for social equity. Hous. Stud. 2003, 18, 537–562. [Google Scholar] [CrossRef]
  36. Burton, E. The potential of the compact city for promoting social equity. In Achieving Sustainable Urban Form; Routledge: London, UK, 2000; pp. 19–29. [Google Scholar]
  37. Mortezaei, G. Assessing social equity factors and dwellers’ desirability perception of compact city centre residing, In Proceedings of the 2012 IEEE Business, Engineering & Industrial Applications Colloquium (BEIAC), Kuala Lumpur, Malaysia, 7 April 2012; IEEE: Piscataway, NJ, USA, 2012.
  38. Jiao, J.; Fu, B. Quantitative analysis of Melbourne’s land use under mixed development and its insights. Planners 2021, 37, 82–88. [Google Scholar]
  39. Bao, Y. Research on the measurement of mixed urban land use-taking Shenzhen City as a case study. Hubei Nong Ye Ke Xue 2016, 55, 5794–5797, 5801. [Google Scholar]
  40. Manaugh, K.; Kreider, T. What is mixed use? Presenting an interaction method for measuring land use mix. J. Transp. Land Use 2013, 6, 63–72. [Google Scholar] [CrossRef] [Green Version]
  41. Zheng, H.; Wu, C.; Zheng, S.; Zhuo, Y.; Zhang, Q. Urban compact development and mixed land use from the perspective of spatial consistency-taking SHanghai as a case study. Chin. Land Sci. 2016, 30, 35–42. [Google Scholar]
  42. Guo, Z.; Liu, K.; Li, Y. Spatial recognition of urban functions based on POI data and composite calculation of central urban functions -- taking Dongguan as a case study. Urban Surv. 2020, 3, 40–46. [Google Scholar]
  43. Burton, E. The compact city: Just or just compact? A preliminary analysis. Urban Stud. 2000, 37, 1969–2006. [Google Scholar] [CrossRef]
  44. Jenks, M. The Compact City: A Sustainable Urban Form? China Construction Industry Press: Beijing, China, 2004; pp. 55–57. [Google Scholar]
  45. Wei, Y.; Zhao, M.; Wang, J. Measurement of compact urban development and land use performance: The extension and application of the “Thünen-Alonso” model. J. Urban Plan. 2008, 3, 32–40. [Google Scholar]
  46. Shu, P.; He, J.; Ren, D. Quantitative simulation study on suitable spatial capacity of compact residential areas in Tianjin. Chin. J. Archit. 2016, S1, 77–81. [Google Scholar]
  47. Zhang, H.; Sun, C.; Wang, L.; Liu, H. Research on the coupling relationship between urban street networks and land use structure. In Proceedings of the 2017 China Urban Planning Annual Conference, Dongguan, China, 18 November 2017; pp. 254–261. [Google Scholar]
  48. Gajić, R. Urban morphology as a tool for exploring the land use in residential areas: Example of New Belgrade. Spatium 2015, 33, 76–83. [Google Scholar] [CrossRef]
  49. Wang, J.; Ye, Y.; Fang, F. Urban functional zoning based on kernal density and integrated data. Geogr. Geo-Inf. Sci. 2019, 35, 66–71. [Google Scholar]
  50. Wang, Z.; Ma, D.; Sun, D.; Zhang, J. Identification and analysis of urban functional area in Hangzhou based on OSM and POI data. PLoS ONE 2021, 16, e0251988. [Google Scholar] [CrossRef] [PubMed]
  51. Zhao, W.; Li, Q.; Li, B. Extracting hierarchical landmarks from urban POI data. J. Remote Sens. 2011, 15, 973–988. [Google Scholar]
  52. Zheng, H.; Huang, J.; Zhuo, Y.; Xu, Z. Advances in the measurement of mixed land use. Chin. Land Sci. 2019, 33, 95–104. [Google Scholar]
  53. Song, Y.; Merlin, L.; Rodriguez, D. Comparing measures of urban land use mix. Comput. Environ. Urban Syst. 2013, 42, 1–13. [Google Scholar] [CrossRef]
  54. Miaoyi, L.; Yan, M.; Sun, X.; Wang, J.; Dang, A. Application of spatial and temporal entropy based on multi-source data for measuring the mix degree of urban functions. City Plann. Rev. 2018, 42, 97–103. [Google Scholar]
  55. Wang, S.; Kong, W.; Ren, L.; Zhi, D.; Dai, B. Misunderstanding and correction of domestic coupling coordination models. Chin. J. Nat. Resour. 2021, 36, 793–810. [Google Scholar]
  56. Ding, L.; Zhao, W.; Huang, Y.; Cheng, S.; Liu, C. Research on the coupling coordination relationship between urbanization and the air environment: A case study of the area of Wuhan. Atmosphere 2015, 6, 1539–1558. [Google Scholar] [CrossRef] [Green Version]
  57. Liao, K.-C.; Yue, M.-Y.; Sun, S.-W.; Xue, H.-B.; Liu, W.; Tsai, S.-B.; Wang, J.-T. An evaluation of coupling coordination between tourism and finance. Sustainability 2018, 10, 2320. [Google Scholar] [CrossRef]
  58. Gang, H.; Yuan, J.; Wang, Z.; Li, K. The coupling of urban scale, compactness and land intensification in the Harbin-Dalian corridor. Econ. Geogr. 2017, 37, 156–162. [Google Scholar]
  59. Yu, Y.; Nes, A.V. Quantitative tools in urban morphology: Combining space syntax, spacematrix and mixed-use index in a GIS framework. Urban Morphol. 2014, 18, 97–118. [Google Scholar]
Figure 1. Scope and location of the study area (Source: Standard Map Service System, Baidu Maps).
Sustainability 15 01202 g001
Figure 2. Flow chart of the research methodology.
Sustainability 15 01202 g002
Figure 3. Distribution map of spatial compactness of the study area.
Sustainability 15 01202 g003
Figure 4. Distribution map of degree of land use mix in the study area.
Sustainability 15 01202 g004
Figure 5. Distribution of coupling coordination degree in the study area.
Sustainability 15 01202 g005
Figure 6. Distribution of patches of uncoordinated areas.
Sustainability 15 01202 g006
Table 1. Classification system of point of interest (POI) types in the study area.
PrimarySecondaryPOI Examples
Residential functionsTownhousesResidential area, business residence
Urban community service facilitiesLife services, car repair, clinics, pharmacies
Public administration and public service functionsInstitutions and associationsGovernment agencies, public security agencies
Social groups, industry associations
ResearchResearch organizations
CultureArchives, scientific, education and cultural venues, exhibition centres, planetariums, libraries
Cultural palaces, media organizations
EducationTertiary institutions
Secondary schools
Primary schools
SportsKindergartens
Sports venues
Medicine and hygieneSports and leisure venues
Social welfareGeneral hospitals
Business service functionsBusinessSpecialist hospitals
Elderly activity centres, nursing homes
Food and beverage services
Commercial financeMalls
Recreation and fitnessSupermarket
Convenience stores
Other business servicesAccommodation services
Green spaces and open spacesParks and green spacesParks and green spaces
SquaresTown squares
Special land functionsReligionChurches, temples
Table 2. Spatial compactness index system.
Target LayerIndicator LayerWeight
Spatial compactness ( U 1 )Average number of layers0.2063
Dispersion 10.1093
Building density 0.1093
Floor area ratio0.3689
Degree of open space0.2063
1 Dispersion: Standard deviation of average number of building layers in the area.
Table 3. POI weight assignment method.
POI Category DetailsLand Area (hm2)Functional Impact Reference Value
Residential, commercial areas130.0000
Life services, car repairs, clinics, pharmacies0.30.0000
Government agencies, public security agencies0.80.3550
Social groups, industry associations0.10.3550
Research institutions0.20.6706
Archives, scientific, educational, and cultural venues, exhibition centres, planetariums, libraries10.6706
Cultural palaces, media organizations0.20.0000
Tertiary institutions100.7460
Secondary schools30.7460
Primary schools2 0.0000
Kindergartens 0.050.8245
Sports venues190.5010
Sports and leisure places0.150.5069
General hospitals60.5069
Specialist hospitals2 0.5069
Elderly activity centres, nursing homes10.5069
Food and beverages services0.050.0000
Malls50.8146
Supermarkets0.30.5562
Convenience stores0.010.0000
Accommodation services0.20.0000
Companies, industrial parks, financial insurance0.20.3057
Internet cafes, board and card games, karaoke, TV 0.050.0000
Movie theatres, playgrounds0.10.5010
Car sales, driving schools, training institutions0.10.0000
Parks50.6548
Town squares20.6548
Churches, temples10.8245
Table 4. Classification of coupling coordination degree.
Coupling CoordinationCoordination Level
0 D 0.3 Severely uncoordinated
0.3 < D 0.4 Moderately uncoordinated
0.4 < D 0.5 Slightly uncoordinated
0.5 < D 0.6 Slightly coordinated
0.6 < D 0.7 Moderately coordinated
0.7 < D 0.8 Well-coordinated
0.8 < D 1 Very well-coordinated
Table 5. Proportion of area for areas with different degrees of spatial compactness.
Range of Evaluation ValueProportion of Area
0.118763–0.34214411.90%
0.342145–0.36341824.34%
0.363419–0.38354729.60%
0.383548–0.40811119.86%
0.408112–0.44506910.08%
0.445070–0.5088013.30%
0.508802–0.7718410.92%
Table 6. Moran’s I index of spatial compactness in the study area.
Area of StudyMoran’s IZ Valuep Value
North Bank of Hunhe River0.41125722.0087060.000000
South Bank of Hunhe River0.08087428.4159360.000000
Table 7. Proportion of area for areas with different degrees of land use mix.
Range of Evaluation ValueProportion of Area
0.000207–0.3316837.28%
0.331684–0.60733810.93%
0.607339–0.85942617.26%
0.859427–1.09438919.90%
1.094390–1.32170020.77%
1.321701–1.55807615.50%
1.558077–2.0531948.36%
Table 8. Moran’s I index of land use mix degree in the study area.
Area of StudyMoran’s IZ Valuep Value
North Bank of Hunhe River0.89349747.5911790.000000
South Bank of Hunhe River0.86709151.1769920.000000
Table 9. Proportion of area for different degrees of coupling coordination.
Degree of CoordinationArea Ratio
Severely uncoordinated0.41%
Moderately uncoordinated1.94%
Slightly uncoordinated4.82%
Slightly coordinated16.24%
Moderately coordinated46.63%
Well-coordinated28.79%
Very well-coordinated1.18%
Table 10. Moran’s I index of the coupling coordination degree in the study area.
Area of StudyMoran’s IZ Valuep Value
North Bank of Hunhe River0.86588046.1536820.000000
South Bank of Hunhe River0.71487658.2612350.000000
Disclaimer/Publisher’s Note: The statements, opinions and data contained in all publications are solely those of the individual author(s) and contributor(s) and not of MDPI and/or the editor(s). MDPI and/or the editor(s) disclaim responsibility for any injury to people or property resulting from any ideas, methods, instructions or products referred to in the content.