Article

Linking Satellite, Land Capability, and Socio-Economic Data for Local-Level Climate-Change-Adaptive Capacity Assessments and Decision Support

by
Martin Munashe Chari
1,*,
Leocadia Zhou
1 and
Hamisai Hamandawana
2
1
Risk & Vulnerability Science Centre (RVSC), University of Fort Hare, 1 King William’s Town Road, Alice 5700, South Africa
2
Afromontane Research Unit (ARU) & Risk & Vulnerability Science Centre (RVSC), University of the Free State, Kestell Road, Phuthaditjhaba 9866, South Africa
*
Author to whom correspondence should be addressed.
Sustainability 2023, 15(17), 13120; https://doi.org/10.3390/su151713120
Submission received: 23 July 2023 / Revised: 14 August 2023 / Accepted: 21 August 2023 / Published: 31 August 2023

Abstract

:
Climate change is now one of the most formidable threats to the livelihoods of resource-poor communities in low-income developing countries world-wide. Addressing this challenge continues to be undermined by the conspicuous absence of actionable adaptation strategies that are potentially capable of enhancing our capacities to realize the Millennial Sustainable Development Goals that seek to securitize access to adequate food supplies for everybody. This paper attempts to address this limitation by providing an improvised geostatistical methodology that integrates multi-source data to map the adaptive capacities of vulnerable communities in a selected South African local municipality, whose livelihoods are largely dependent on rain-fed agriculture. The development of this methodology was based on the use scripts that were compiled in Python and used to test-try its usefulness through a case-study-based assessment of the climate-change-adaptive capacities of local communities in Raymond Mhlaba Local Municipality (RMLM), Eastern Cape Province, South Africa. A Bayesian maximum entropy framework-based technique was used to overcome the lack of missing soil moisture data, which we included because of its reliable usefulness as a surrogate indicator of climate-change-driven variations in this variable on the sustainability of rain-fed agriculture. Analysis of the results from a sampling universe of 124 communities revealed that 65 and 56 of them had high and medium adaptive capacities, respectively, with the remaining 3 having low adaptive capacities. This finding indicates that more than half of the communities in the municipality’s communities have limited capabilities to cope with climate change’s impacts on their livelihoods. Although our proposed methodology is premised on findings from a case-study-based investigation, it is still extremely useful because it demonstratively shows that there is tremendous scope for the scientific community to provide objectively informed insights that can be used to enhance the adaptive capacities of those in need of the badly needed but difficult-to-access information. Added to this is the fact that our proposed methodology is not only applicable for use under different environmental settings but also capable of allowing us to cost-effectively tap into the rich, wide-ranging, freely accessible datasets at our disposal. The aim of this submission is to show that although we have the information, we need to address these persevering challenges by exploring innovative approaches to translate the knowledge we have into actionable climate-change-adaptation strategies.

1. Introduction

The impacts of climate change pose formidable challenges to the local-level implementation of informed adaptation strategies due to lack of approaches that can be used to combine and spatialize different types of multisource data into adaptive capacity assessments (ACA) [1]. These ACA are useful because they enable us to (1) objectively identify community-level challenges that deserve priority attention during the formulation and implementation of climate change (CC) adaptation strategies and (2) equitably distribute resources and support to disadvantaged, resource-poor communities [2]. These observations are supported by Tran et al. [3], who reported that rice framers in Vietnam stood to be better-positioned to adapt to CC by being allocated support through different financial instruments, and by Islam et al.’s [4] longitudinal study of households’ food security in Bangladesh, which recommended robust budget allocations to crop farmers, with similar sentiments coming from findings by Babakholov et al. [5] in the Samarkand region of Uzbekistan, which indicated that the production of different crops that include wheat and cotton can be substantially increased by providing extension and financial support to rain-fed-dependent farmers. Although these reasonings have been repeatedly championed by many researchers, their translation into actionable adaptation strategies continues to be undermined by the lack of usable information on what is needed for farmers to adopt climate-friendly adaptation strategies. As argued by researchers such as Masuda et al. [6], there is an urgent need for adaptation and mitigation policies that are tailored to address the unique constraints of rural workers by incorporating extant adaptation strategies.
Accomplishing this requires organized compilation and structured utilization of data, which are lacking in most developing countries worldwide, where the livelihoods of rural communities are largely dependent on the natural resources in their localities. In Africa, for example, the pace of development in most countries has been slow due to the substantial dependence on climate-sensitive sectors such as agriculture and forestry, insufficient infrastructure, and the limited abilities of those least able to adjust to unfavorable climate change effects [7]. This constraint is intensified by the inability of these countries to provide usable information due to their limited capacities to conduct informative adaptative capacity assessments that can be used to guide the formulation of informed climate-change-adaptation strategies. Adaptation capacity assessments are crucial because they provide useful information and insights that serve as indicators of the potentials of specific coping strategies to be translated into concrete measures that can help to decrease vulnerability to the adverse impacts of CC [8,9]. Although the helpfulness of these assessments in guiding the planning and implementation of actionable interventions is well known, their use continues to be undermined by the lack of robust methodologies that can be used to provide in a cost-effective and timely way useful information by integrating different types of data from disparate sources [10].
This lack argues for the immediate need to formulate usable techniques by synergistically using the readily accessible data at our disposal for adaptive capacity evaluations through in situ trials that involve limited samples. Although geostatistical techniques have immense potentials to address these issues, more still needs to be done by exploring and providing innovative data integration techniques. One of the well-known techniques under this domain deserving exploration as a means of mapping of adaptive capacity for the purpose of facilitating informed decision making is multi-source data fusion, which has been applied by other researchers elsewhere in CC adaptation and risk assessments [11].
The usefulness of this technique in adaptive capacity assessments arises from the fact that it can reliably identify hotspot areas in a manner that intelligibly communicates information on climate change impacts in a visually compelling format in the form of maps that provide spatially comprehensible information instead of solely relying on textual information [12].
This paper aims to demonstrate how this can be done by providing an improvised approach that can be used to link multi-source datasets in assessing and spatially identifying and projecting local-level community adaptation capacities to the changing climate on a ranked scale using South Africa’s Raymond Mhlaba Local Municipality (RMLM) as a case study. The paper hypothesizes that geostatistical techniques offer a reliable means of linking disparate multi-source data for effective adaptive capacity assessments.

2. Materials and Methods

2.1. Study Area

The study area is Raymond Mhlaba Local Municipality (RMLM), which is situated in Amathole District Municipality, Eastern Cape Province, South Africa (Figure 1). This municipality consists of 23 wards that cover 6358 km2, in which the population density is ~24 people/km2 [13]. According to the [14], RMLM is the largest of the six municipalities in the Amathole District Municipality. The area has a dispersed settlement pattern that is largely determined by the patchy distribution of cultivable land. Most of the land surrounding these patches is marginally productive and not suitable for subsistence agriculture without the use of organic manure and chemical fertilizers. The area’s climate is characterized by average mid-day temperatures that range between 19.3 °C in winter and 28.3 °C in summer (www.statssa.gov.za, accessed on 6 May 2022). Most of the rainfall occurs in autumn, with annual amounts averaging 600 mm, with overall distribution ranging from 7 mm and 66 mm in July and March, respectively [15]. This distribution pattern poses significant challenges for the capacity of local communities to adjust to the increasing incidence of climate-change-driven rainfall failures and droughts.
The recurrent droughts and heavy dependence on natural resources and subsistence agriculture further erode the adaptive capabilities of these communities [16]. The effects of this situation are further aggravated by poverty-induced inabilities to respond under day-to-day living conditions in which unpredictable rainfall imposes a lot of uncertainties. Although the municipality has been trying address these challenges, the lack of sufficient funding for adaptation continues to make this extremely difficult [17]. One way of addressing these challenges is by providing information that can be used to guide policy formulation and implementation and empower local farmers by helping them to improve their adaptive capacities.

2.2. Data and Methods

The data that were used include the following:
  • Demographic data;
  • Land capability data;
  • In situ soil moisture data;
  • SPOT images of 2014, 2015, 2016, and 2017.
Table 1 shows the SPOT 6 coverages for 2014, 2015, 2016, and 2017 that were used in this study.
These images were acquired georeferenced from source and preferred partly because they were provided free of charge and also because of the recommended capability of their spatial resolution and spectral bands to support the detailed mapping of soil moisture [18].
The methods that were used include the following:
  • Space–time trend modelling;
  • Empirical covariance estimation;
  • Space–time dependence analysis;
  • BME-based spatiotemporal prediction and mapping;
  • Geostatistical-based land capability map compilation and adaptive capacity mapping.
Figure 2 shows the above-listed datasets and the sequence of steps that was followed based on an improvised technique that was purposefully designed to assess the adaptive capacities of local communities in RMLM.
Multi-step geostatistical techniques utilizing the remotely sensed inter-annual dry season variations in soil moisture, land capability, and other appropriately selected demographic indicators that could influence crop production were used to develop a methodology that can be employed in assessing the adaptive capabilities of communities in response to the impacts of climate change.

2.2.1. Soil Moisture

Spatial estimates of average intra-annual dry season soil moisture were computed from the Soil Moisture Monitoring Index [18] for years 2014, 2015, 2016, and 2017 by using the ArcMap 10.8 Raster calculator tool. A comparative analysis was conducted between the Soil Moisture Monitoring Index (SMMI) and 41 in situ soil moisture measurements in order to ascertain the credibility of the SMMI. The in situ soil moisture measurements for the year 2017 were determined through the application of gravimetric techniques as outlined by [19]. The findings of the study indicated a significant negative correlation (R2 = 0.4494; p < 0.001) between the SMMI and in situ soil moisture [20]. This suggests that the SMMI can be used as a reliable tool for estimating soil moisture levels. The significant negative correlation between the SMMI and soil moisture that emerged from our data is consistent with other researchers [18,21].
Missing soil moisture data in the 2014 image were predicted using the particle swam optimization (PSO) model of the space–time analysis rendering tool with Bayesian maximum entropy (STAR-BME) framework following the methods and model selection procedures provided in [22]. The PSO model’s prediction of the missing soil moisture data that were obtained from the 2014 image was satisfactorily accurate (RMSE = 0.45). This level of accuracy compares well with observations by other investigators in similar studies elsewhere [23,24,25], who also observed significant accuracies using the BME framework to predict soil moisture. The PSO model fit quality that we obtained (AIC value = −10,606.27) illustrates that this study’s theoretical covariance compared well with empirical estimates [22,26]. The predicted soil moisture map generated through implementation of the BME framework exhibits enhanced characteristics; however, it is susceptible to certain deficiencies that can be attributed to wide-ranging extraneous factors, examples of which are provided by [23,27].

2.2.2. Land Capability

Land capability was represented by active arable lands because it shows areas that are suitable for farming. The arable lands shapefile was constrained to the study area by clipping it in ArcMap 10.8, after which it was classified into arable, marginal, and non-arable land. Areas covered by non-arable land were removed because they were judged to be part of non-cultivated land the farmers are not interested in. Thereafter, the communities’ shapefile was also clipped to produce a constrained output, which reduced the number of communities from 134 to 124. The two constrained shapefiles were then overlaid to produce a composite shapefile that contained arable lands and communities.
The arable lands classes were further allocated indicator scores to allow for further geostatistical calculations with other indicators. The scores were deemed as arable land = 2 and marginal land = 1, meaning arable land was preferred to marginal land. Because of the large number of communities in the attribute table, manual allocation of scores would have been tedious and tiresome. This cumbersome route was evaded by automatically allocating the scores using minimal lines of Python code.

2.2.3. Socio-Economic Data Category

A hybrid methodology was employed to evaluate community-level adaptive capacities from a socio-economic perspective. This approach involved a multi-step process that utilized geospatial analysis and interpretation of aggregated indicators. This enabled the socio-economic adaptive capacity to be linked with land capability and soil moisture data in order to calculate the final adaptive capacity. The indicators for socio-economic adaptive capacity were deliberately chosen to ensure the inclusive representation of diverse communities as well as the unique geographical and socio-economic characteristics of their respective localities. The description, rationale, and ranking of demographic indicators (age profiles, income levels, literacy levels, and water source) that were used for assessing socio-economic adaptive capacity are provided by [15].
The assessment of socio-economic adaptive capacity involved all the 134 communities within the municipality based on the StatsSA datasets. However, for assessing the final adaptive capacity, only 124 communities that matched the intersection of processed arable lands and soil moisture datasets were included.
A Python script was utilized to automate the scoring of the levels of income attribute table and three indicators (namely, age profiles, levels of literacy, and water source) for the census years 2001 and 2011 (Supplementary Material—Python Scripts). The script underwent modifications to conform to the criteria outlined by [15] through the adjustment of table names, field names, and row numbers. The automated procedure entailed the generation of a new shapefile and attribute table, followed by the importation of the pre-calculated scores for each community that were derived from the four indicators, as illustrated in Table 2. Although the availability of indicator data was restricted, the assessment of adaptive capacity was rendered dependable by assigning equal weights to all indicators based on inputs by experts provided in the 2012–2017 Nkonkobe Integrated Development Plan [28]. The adaptive capacities for 2001 and 2011 censuses were computed by applying Formula 1 below to the attributes that are shown in Table 2.
S o c i o e c o n o m i c   A d a p t i v e     s c o r e = ( n = s 1 s 4 n )
where S1–S4 are the scores for each of the four indicators.
The above-captioned Python script was also used to merge the remaining indicator scores with their attribute table in which the community’s name was purposefully designated to serve as the linking field. Thereafter, the adaptive capacity scores were classified based on a three-tier categorization comprising low, medium, and high based on the maximum obtainable score of 15 by adding the four highest indicator scores, as illustrated in Table 2. In this summarization, scores ranging from 1 to 5 were classified as low, those ranging from 6 to 10 were classified as medium, and the scores ranging from 11 to 15 were classified as high. This analysis was further boosted by appending an additional attribute field to the table, which accommodated the adaptive capacity scores that were ranked following procedures suggested by [15].
A map of adaptive capacity was compiled in Arc Map software platform by utilizing the rankings derived from the data of 2001 and 2011 censuses. A Python script [15] was utilized to generate a new shapefile in order to record adaptive capacities that were derived from the indicator scores tables for the years 2001 and 2011 in a unified attribute table (Table 3). The following formula was utilized for computing the alterations in adaptive capacity scores between the census years 2001 and 2011, as illustrated in Table 3.
C h a n g e   i n   a d a p t i v e   c a p a c i t y = ( 2011 n = s 1 s 4 n ) ( 2001 n = s 1 s 4 n )
The scores for adaptive capacity were categorized into three groups, namely no change, decrease, and increase, through an automated process. The script utilized in [15] was executed through the Python execfile command to generate fields for differences and ratings of adaptive capacity scores for the two census years. A difference of 0 indicates no change, while a difference of ≤−1 denotes a decrease, and a difference of ≥1 signifies an increase. These values were automatically added to the attribute table.
A map depicting changes in adaptive capacities was interactively compiled in ArcMap utilizing the low adaptive capacities, utilizing the 2011 adaptive capacity attribute table. Another map was produced to display communities with low adaptive capacities, utilizing the 2011 adaptive capacity attribute table. Thereafter, the same attribute table and platform were used to produce an inventory of communities that exhibited reduced adaptive capabilities during the ten years between 2001 to 2011.
The final adaptive capacities for the communities were calculated in a created attribute table by summation of indicator scores for soil moisture, arable land, and socio-economic adaptive capacity (Table 4) by using the following formula:
F i n a l   A d a p t i v e   C a p a c i t y   s c o r e = ( n = a 1 a 3 n )
where a1, a2, and a3 are scores for each of the three indicators (arable lands, soil moisture information, and socio-economic adaptive capacity).
Given that the maximum achievable adaptive capacity score resulting from the summation of the three most elevated indicator scores was 8, the adaptive capacity scores were categorized into three levels, namely low, medium, and high. Scores ranging from 3 to 4 were classified as low, scores ranging from 5 to 6 were classified as medium, and scores ranging from 7 to 8 were classified as high. These findings are presented in Table 5. The minimum achievable final adaptive capacity score was 3. The Python algorithm (Algorithm 1) represents the script that was executed using the execfile command in Python, resulting in the automatic addition of a field for the ranked adaptive capacity scores attribute table.
Algorithm 1. Calculating final adaptive capacity using average soil moisture, arable lands, and socio-economic data
START
Verify availability of arcpy module
Input:
  • table: Path to the input shapefile containing indicator attribute tables (e.g., “C:/RM/RM.mdb/RM6_Intersect”)
  • fields: List of field names for the indicator scores (e.g., [“gridcode”, “AD_Score”, “ARL_Score”])
  • total: Field name for storing the total adaptive capacity score
  • rating: Field name for storing the final adaptive capacity rating
Import the necessary modules (arcpy, math)
Add fields to the input table for storing the total adaptive capacity score and the final adaptive capacity rating:
  • Use arcpy.AddField_management(table, total, “SHORT”) to add the total field
  • Use arcpy.AddField_management(table, rating, “TEXT”) to add the rating field
Create a new list, fields2, which is a copy of fields but also includes the total and rating fields
Iterate through each row in the table using an arcpy.da.UpdateCursor:
  • Retrieve the values for the indicator scores from the row using fields2
  • Calculate the adaptive capacity per community by adding indicator scores
  • Store the calculated adaptive capacity in the total field of the row
Allocate the final adaptive capacity rating based on the calculated total adaptive capacity:
  • If the total adaptive capacity is less than or equal to 4, set the rating to ‘LOW’
  • If the total adaptive capacity is greater than 4 and less than or equal to 6, set the rating to ‘MEDIUM’
  • Otherwise, set the rating to ‘HIGH’
Update the row with the assigned rating using cursor.updateRow(row)
Output:
  • The table will be updated with the total adaptive capacity score and the final adaptive capacity rating for each community
END
A map showing the final adaptive capacities based on soil moisture information, arable lands, and demographic data was produced in ArcMap software. Thereafter, the attribute table in ArcMap was used to generate a list of communities with lowest adaptive capacities.

3. Results

The findings are presented through the utilization of maps and tables that show the following:
(a)
Intra-annual dry season variations in soil moisture (Figure 3 and Figure 4);
(b)
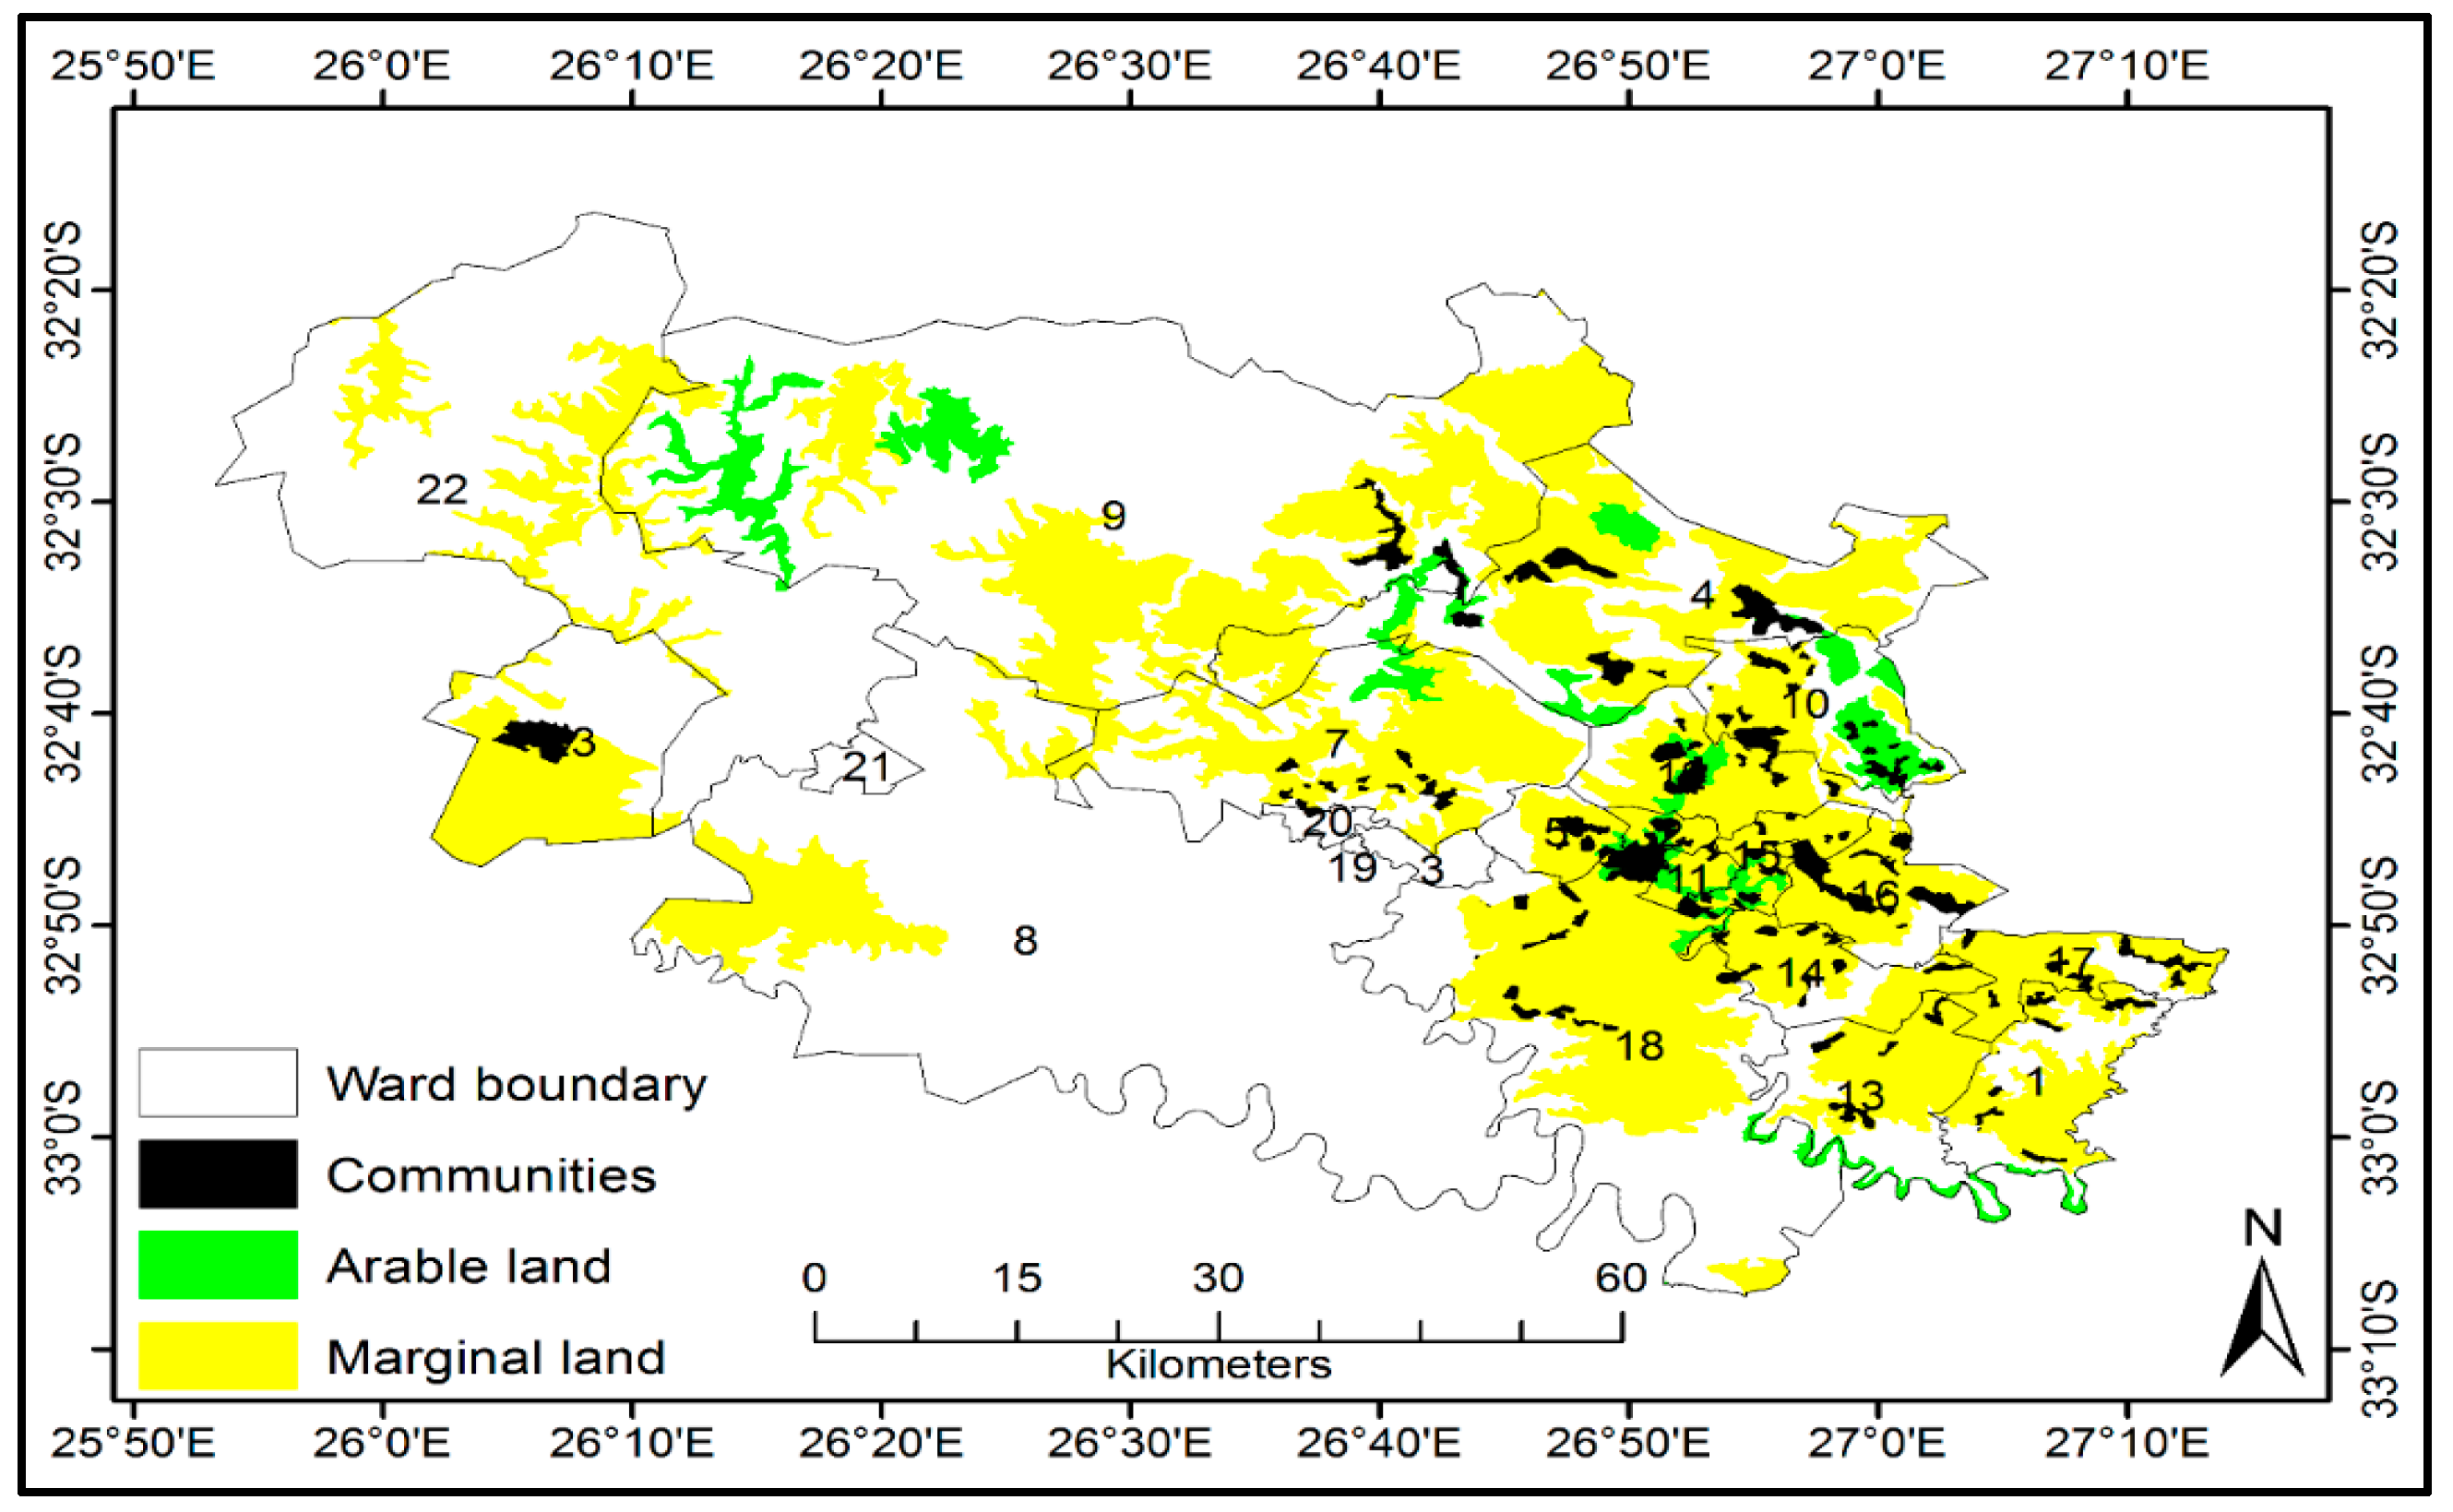
Spatial distributions of arable/marginal lands and locations of nearby communities (Figure 5);
(c)
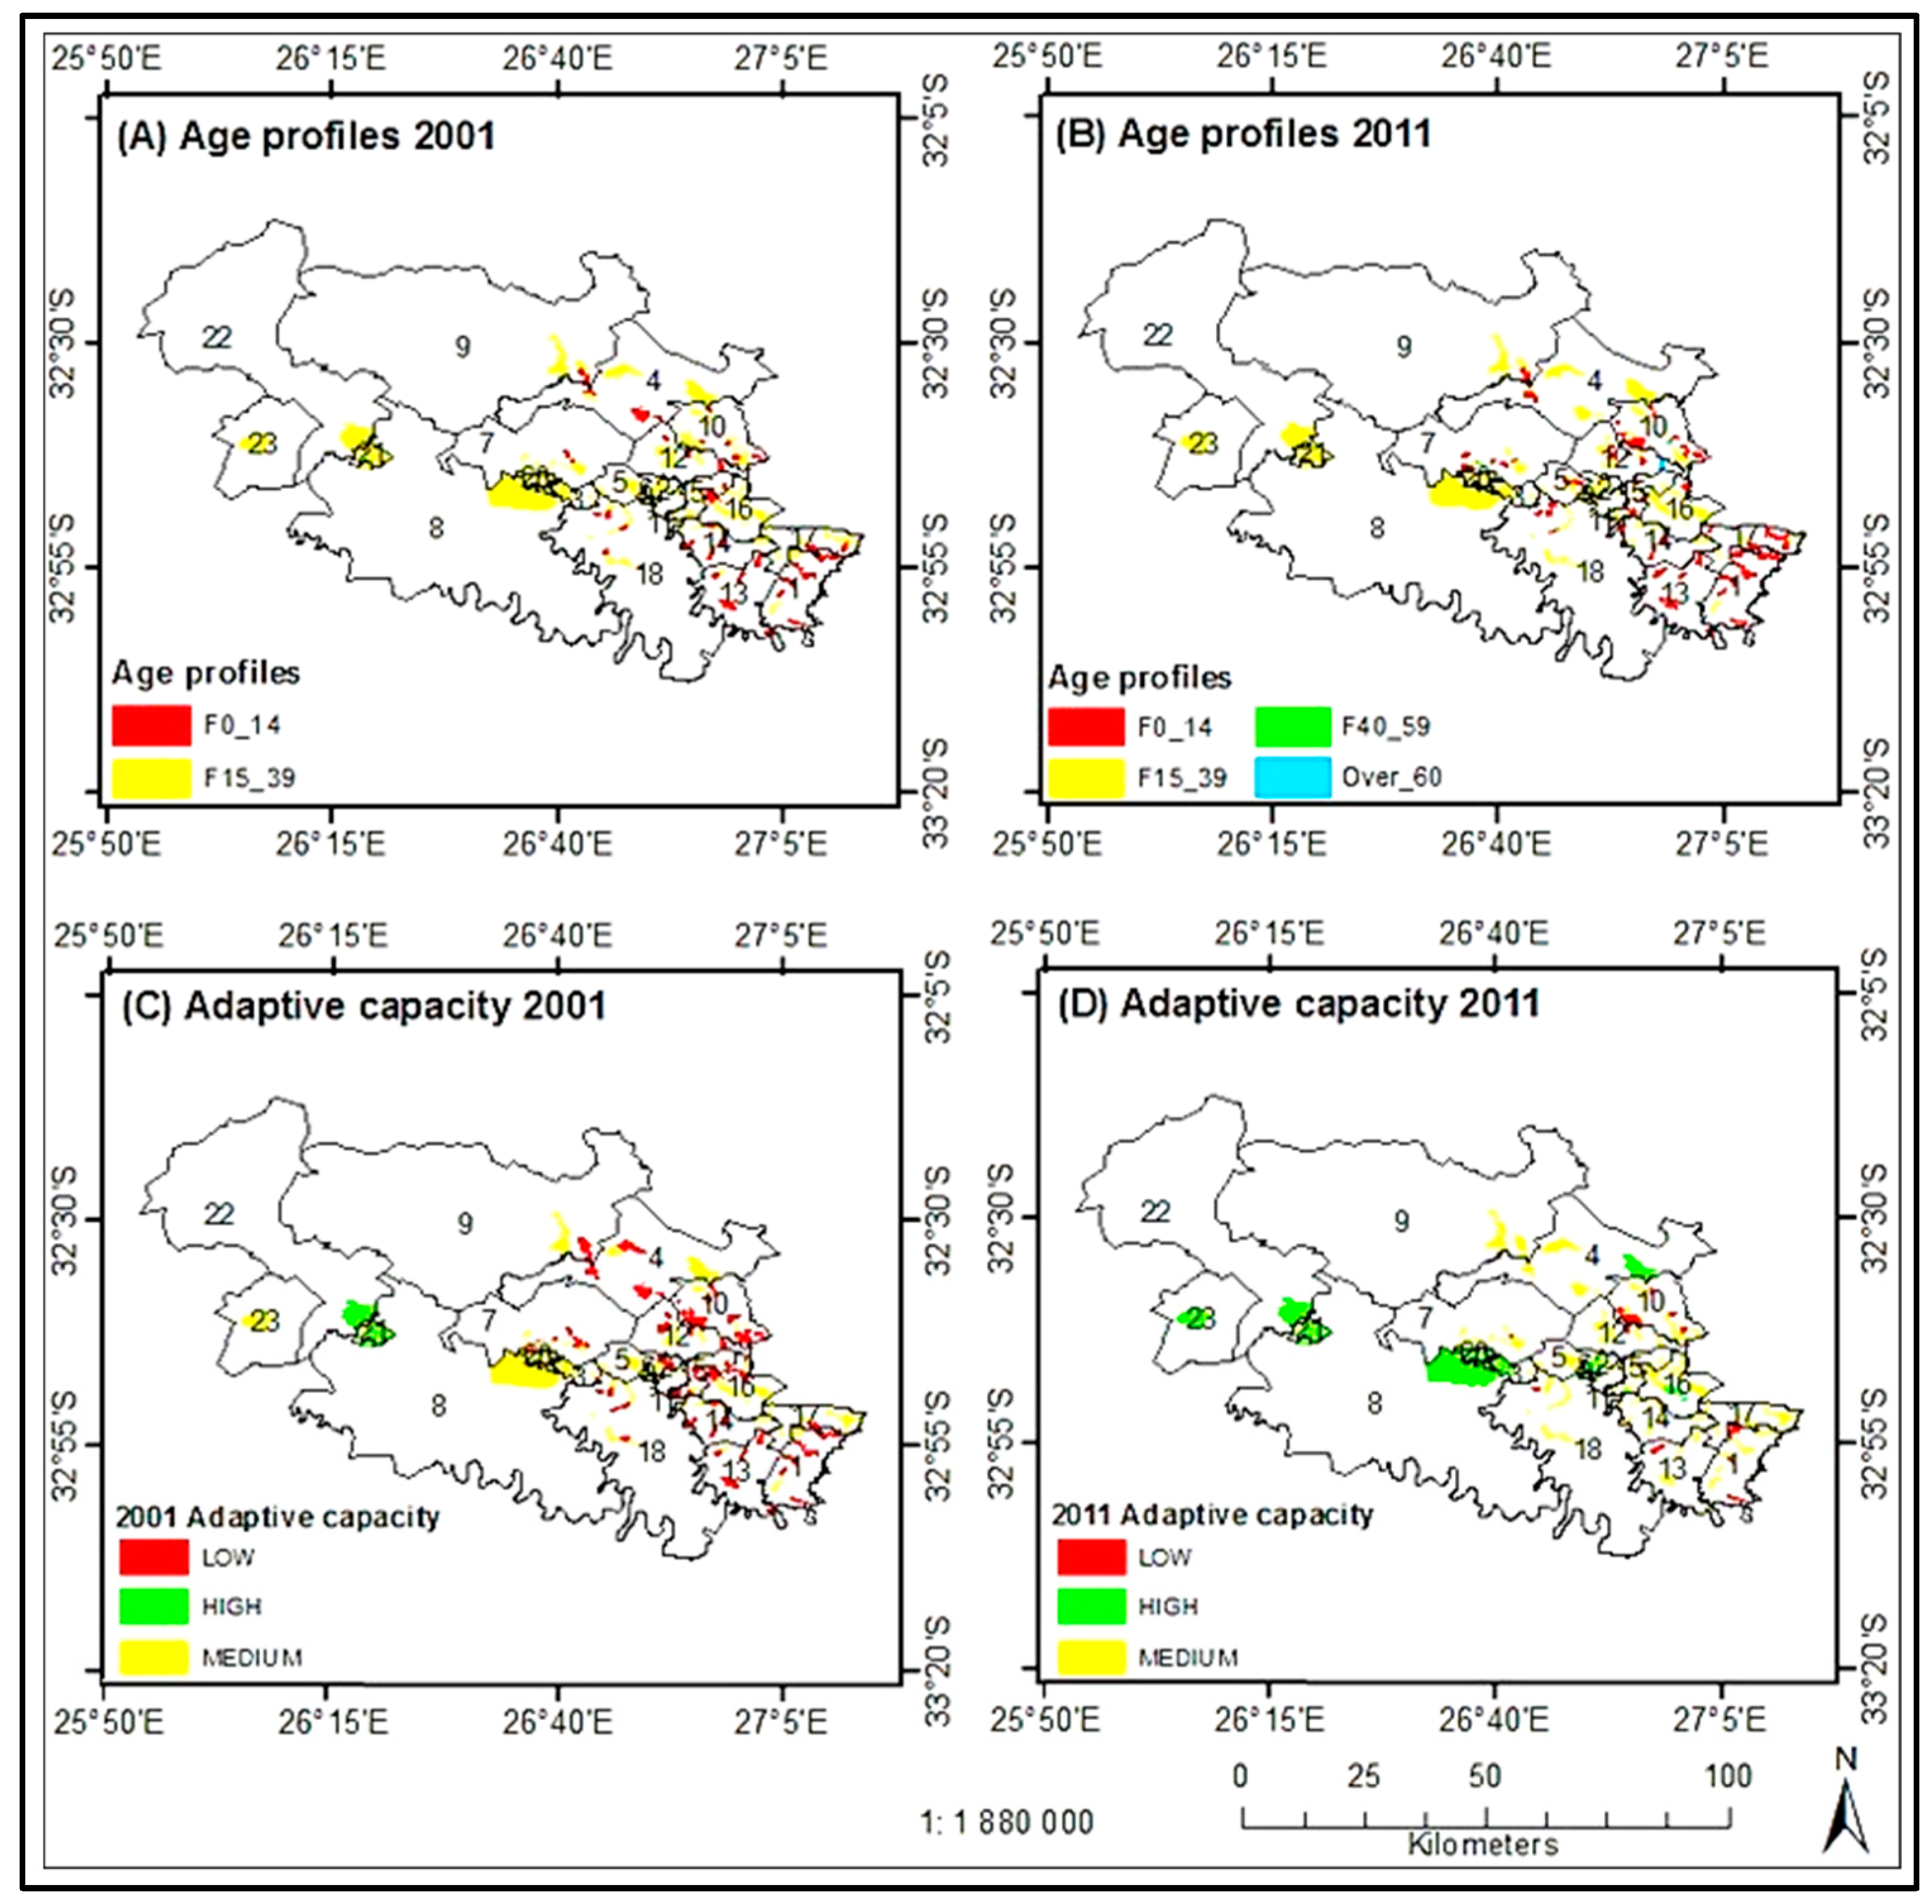
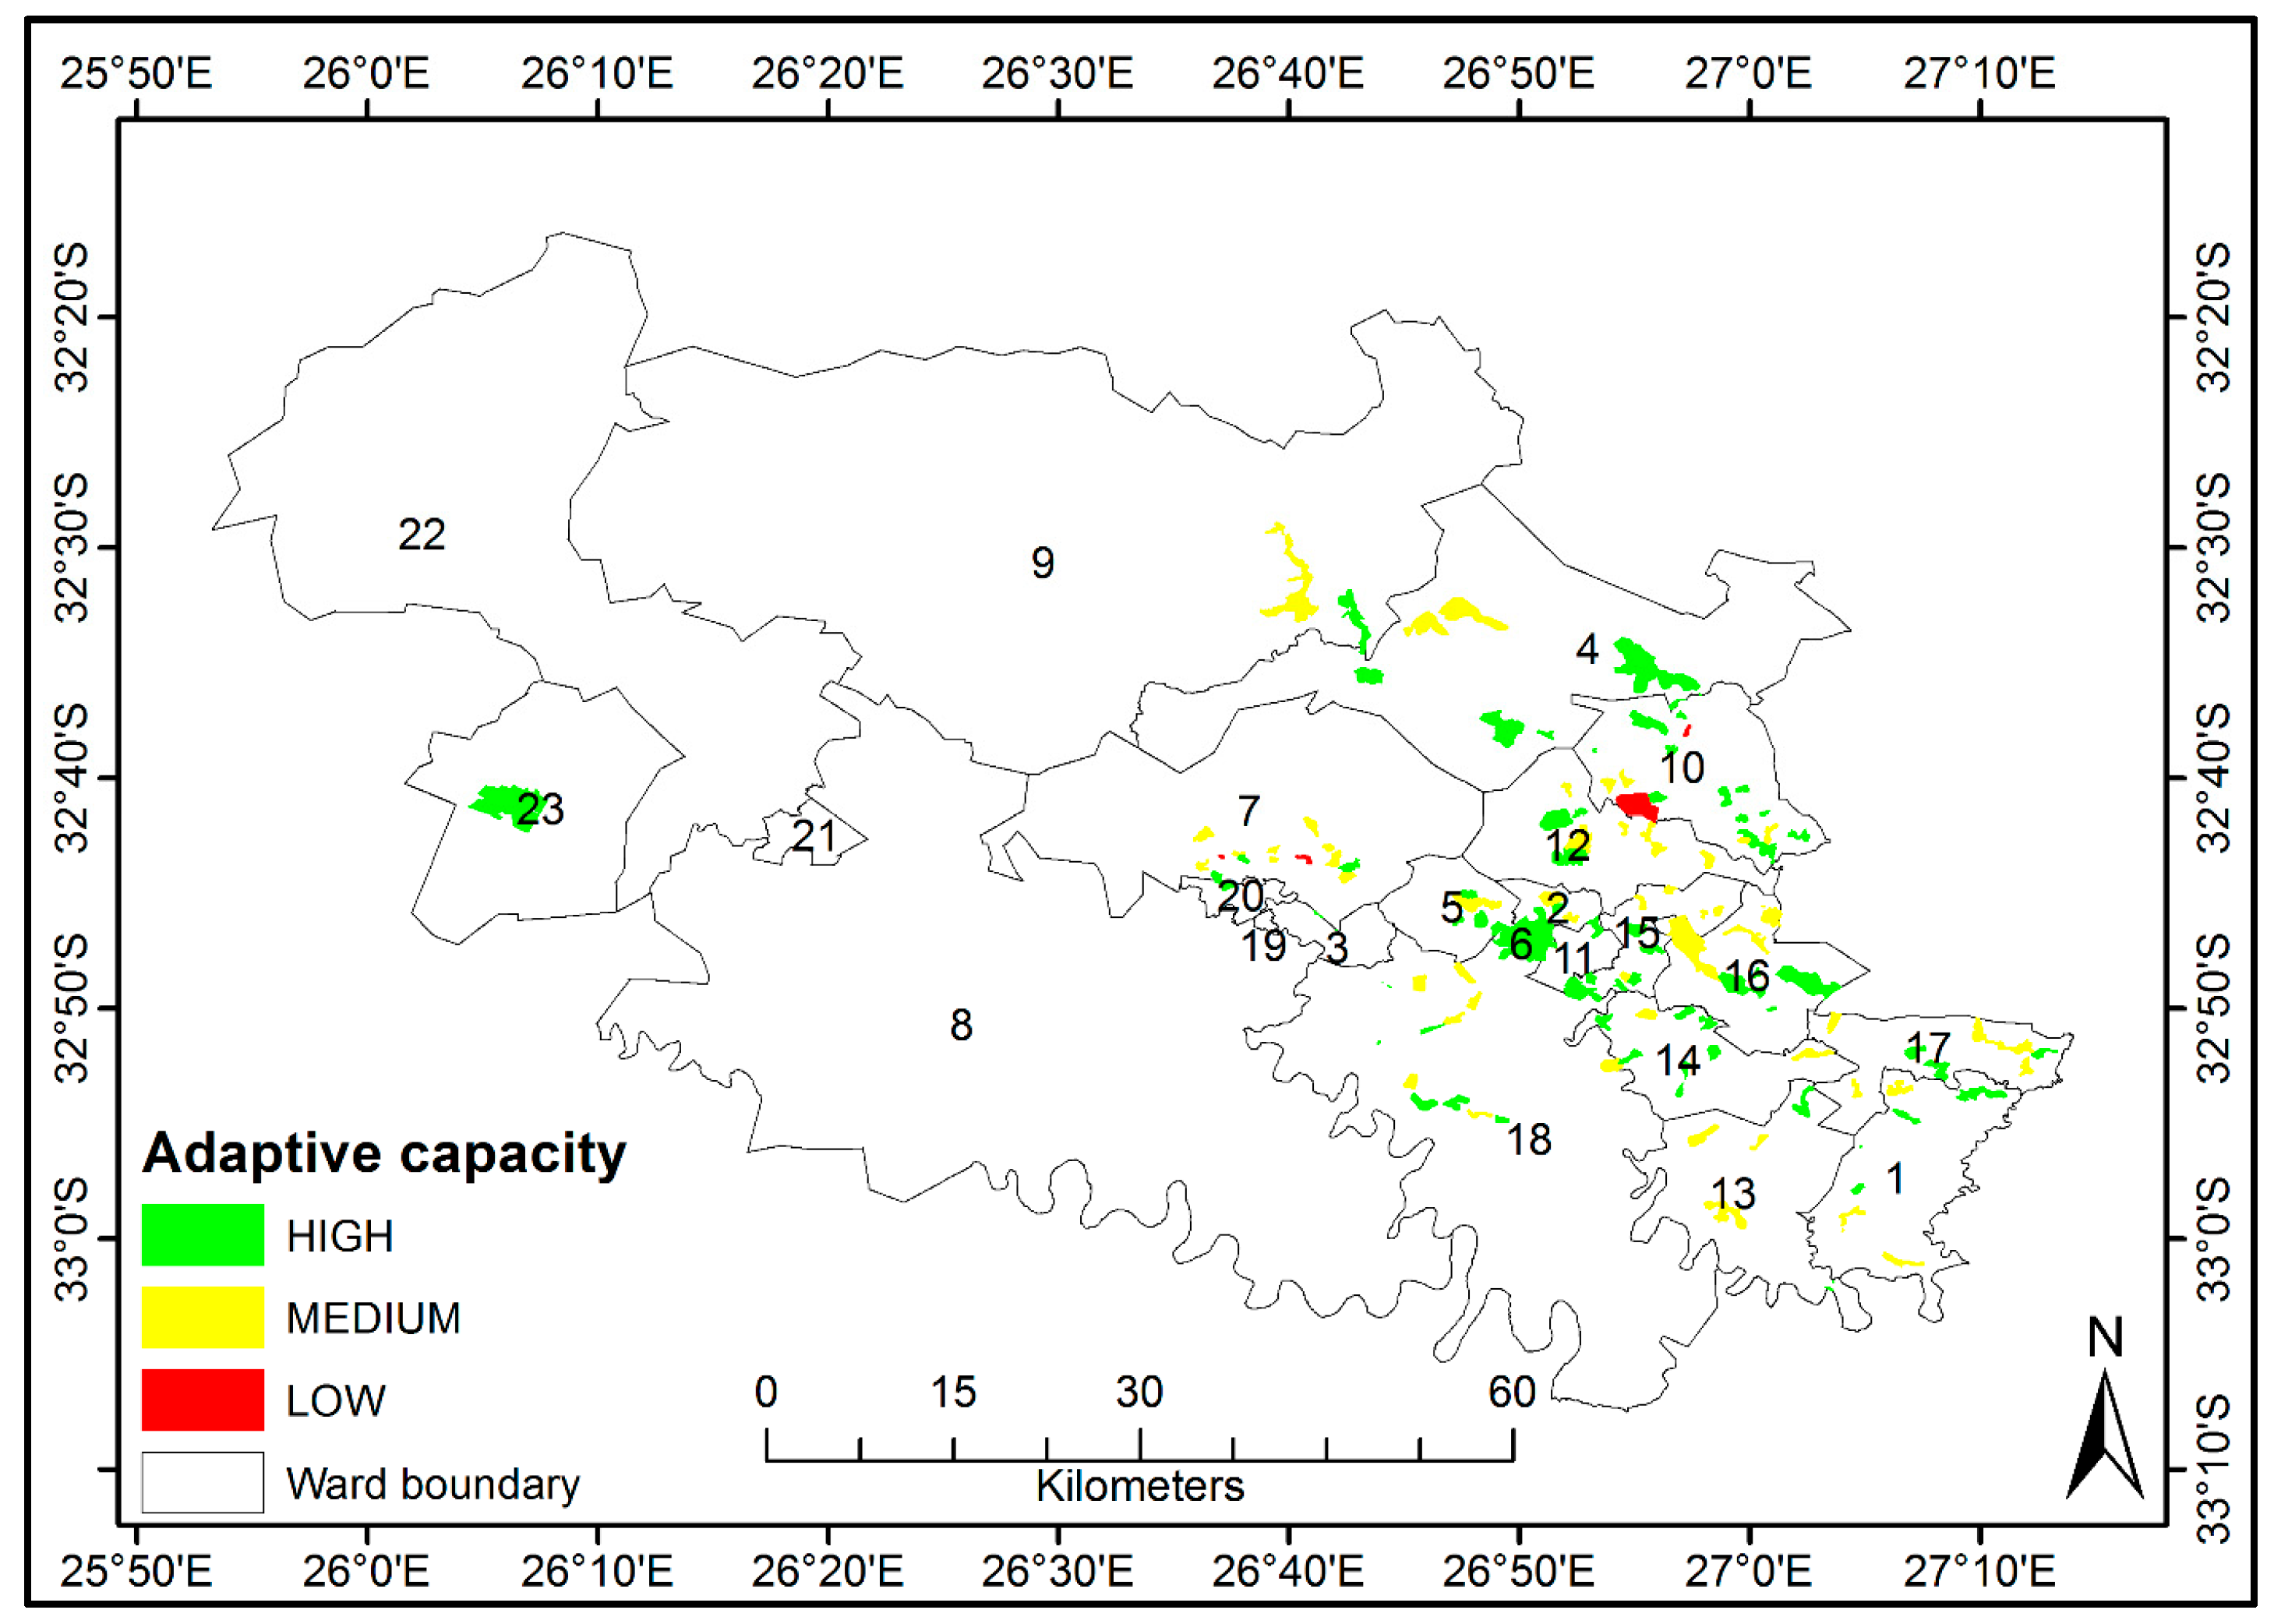
Access to water and literacy, income levels, age profiles and adaptive capacities, adaptive capacity changes between 2001 and 2011, and final adaptive capacities of communities based on arable lands, soil moisture information, and socio-economic indicators (Figure 6, Figure 7, Figure 8 and Figure 9);
(d)
Communities with declining or static adaptive capacities (Table 5, Table 6 and Table 7).

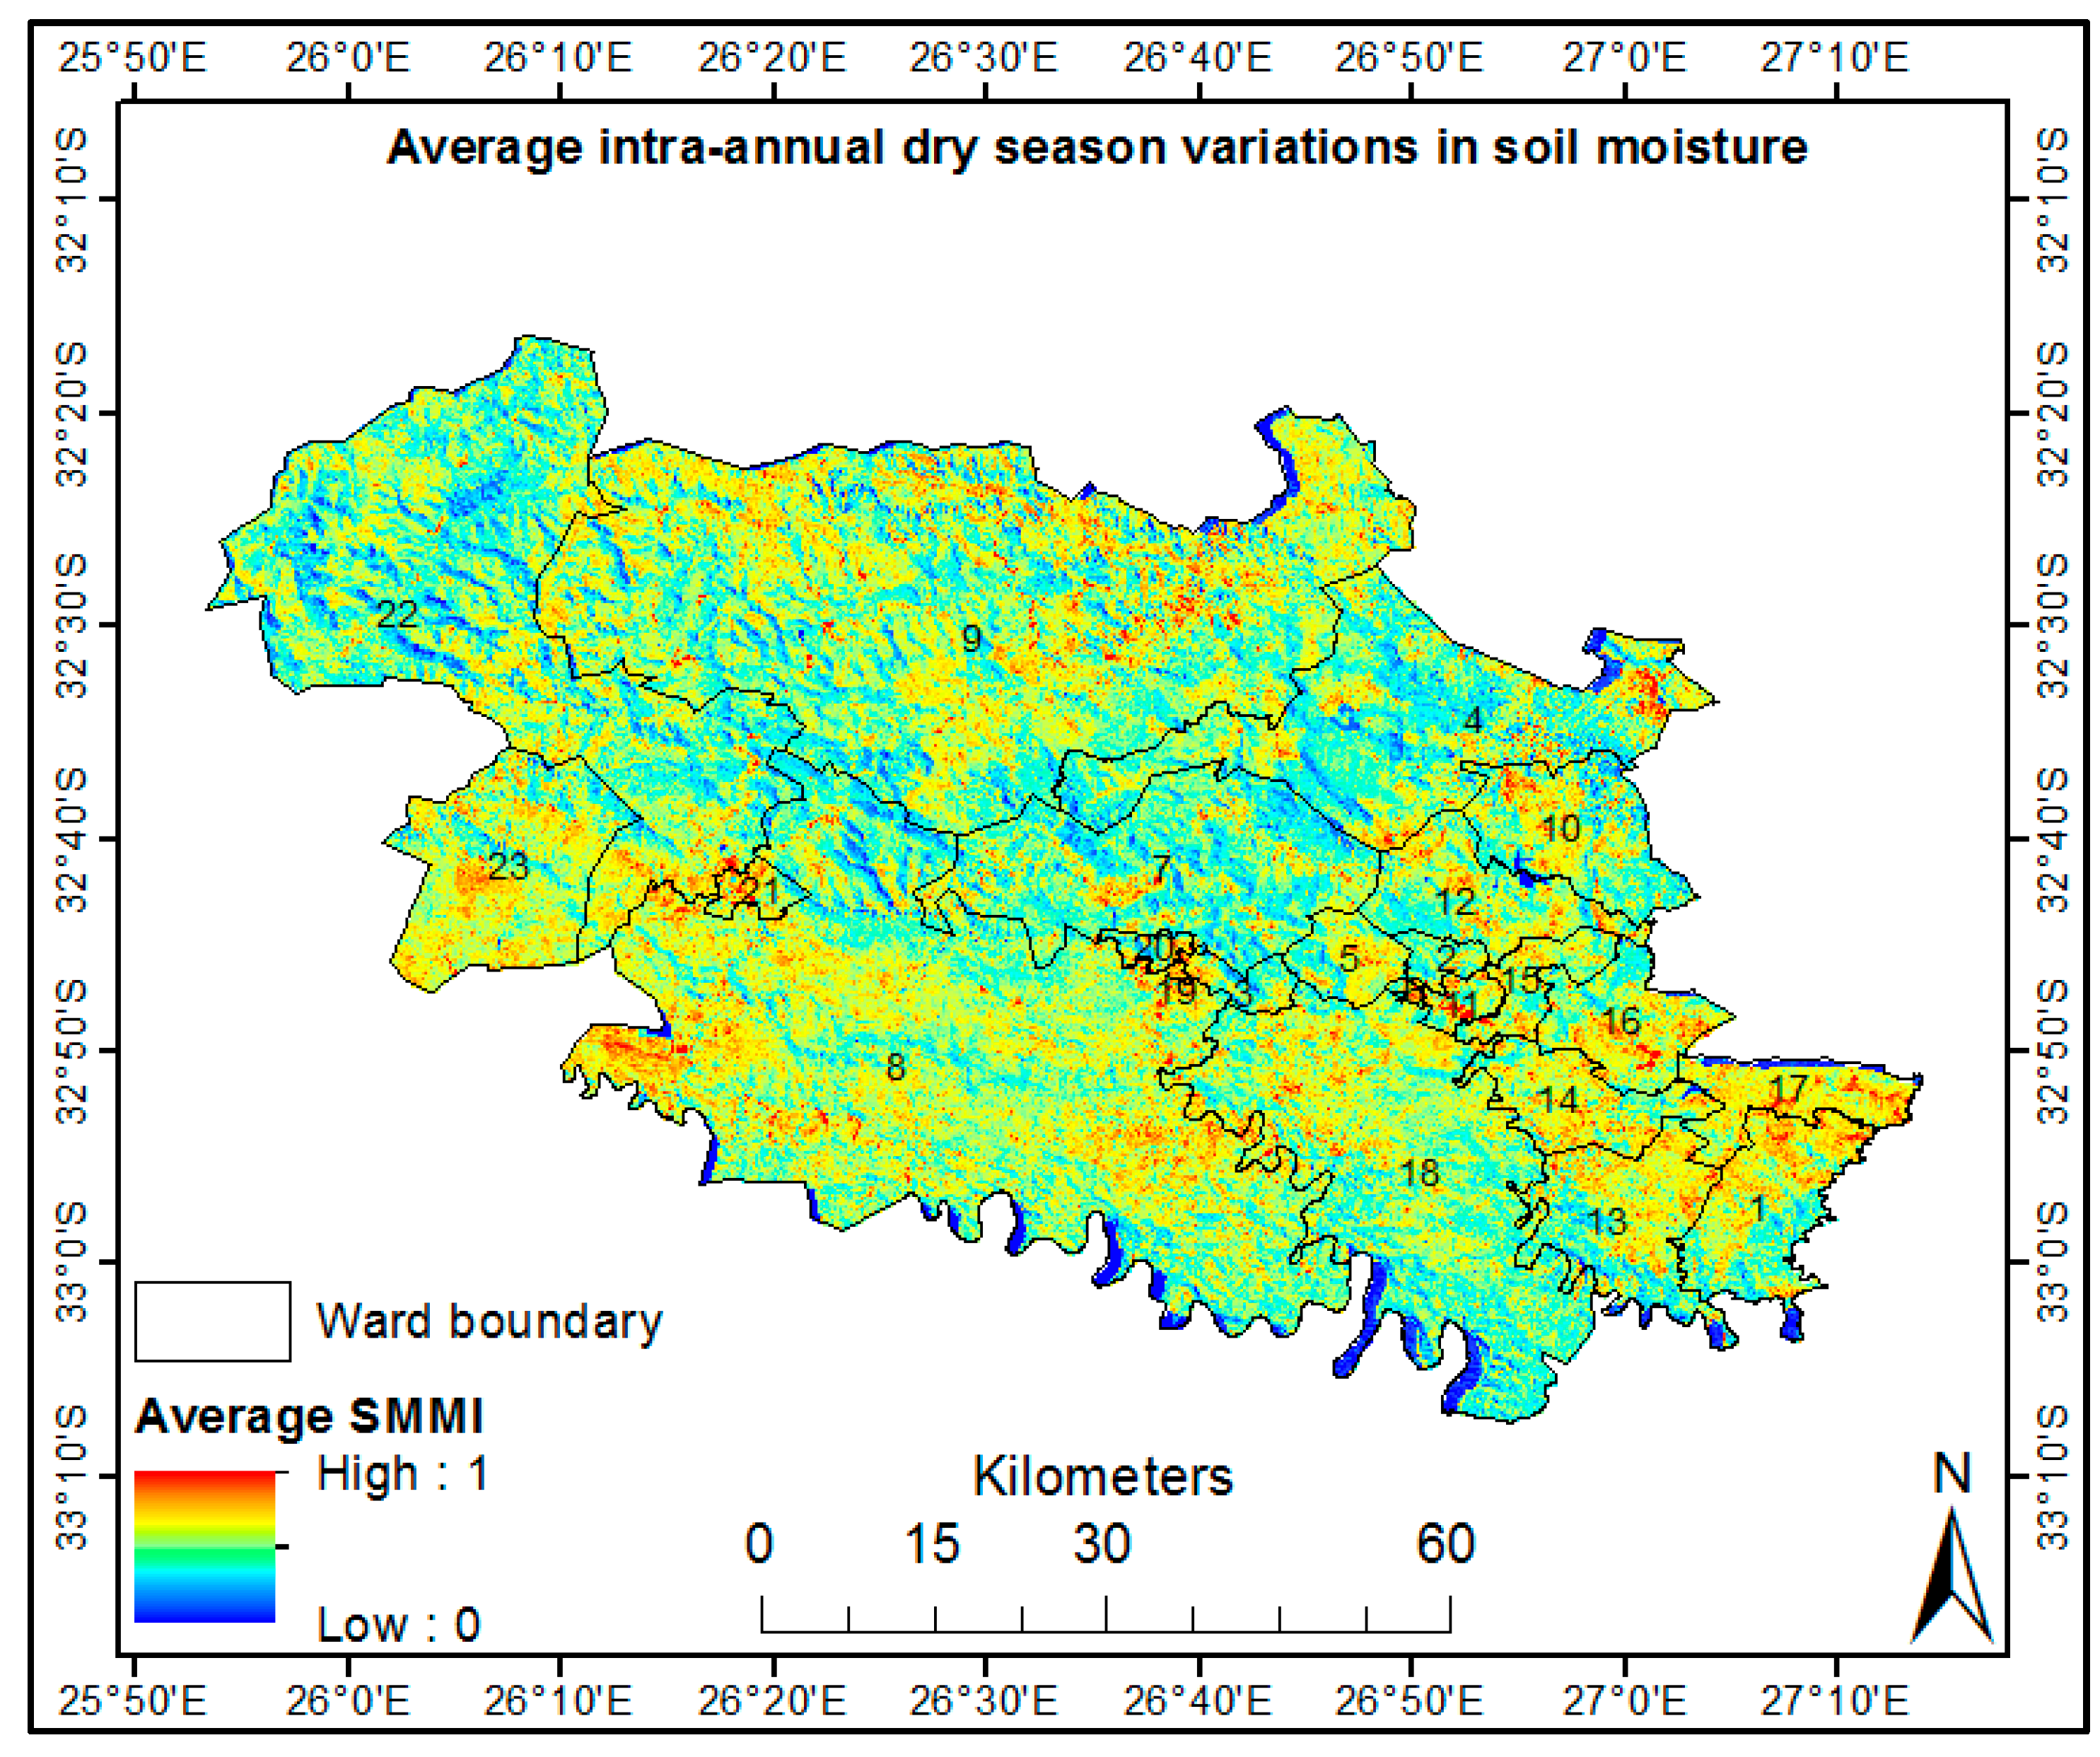
3.1. Intra-Annual Dry Season Variations in Soil Moisture

As shown in Figure 3, the average intra-annual dry season variation in soil moisture using the 2014–2017 images shows that majority of the municipality had low moisture distributions, as reflected by the high SMMI values. The driest parts were identified in wards 8, 14, 16, 17, 21, and 23. Low SMMI values in wards 4, 7, and 22 reflected high soil moisture content in the municipality’s middle parts. In order for the above map to be compatible for linkage with other datasets for assessing adaptive capacities of farming communities, soil moisture content was classified on a scale of low–medium–high (Figure 4), with average soil moisture being linked with other indicators for assessing adaptive capacity.
The above soil moisture distributions showed high soil moisture content in the middle parts of the municipality in wards 4, 7, 9, and 22. Medium soil moisture distributions had no specific spatial pattern. Low soil moisture distributions are generally reflected in the upper and lower halves of the municipality, as observed by most coverages in wards 4, 8, 9, 13, 14, 16, and 17. This classification allowed the allocation of scores to communities based on the average intra-annual dry season soil moisture content in order to calculate adaptive capacities by linking the map with arable lands and selected socio-economic datasets.

3.2. Spatial Distributions of Arable/Marginal Lands and Locations of Nearby Communities

Figure 5 shows the spatial distributions of communities and arable/marginal lands in in RMLM.
As shown in Figure 5, most of these communities are scattered in the right-half bottom of this municipality in the immediate vicinities of arable land, with the remaining others situated in marginal land. This implies that the availability of arable land could be one of the determinants of the locations of these communities. The only communities that are not surrounded by arable lands are in ward 9, possibly because this land is for commercial farming. Within the municipality, arable land is very scarce, with approximately half of the municipality deemed non-arable. This distribution demonstrates the need of appropriately informed soil moisture monitoring interventions that can be used to enhance the adaptive capacities of the farming communities in the municipality.

3.3. Access to Water and Literacy and Income Levels, Age Profiles, and Adaptive Capacities

Figure 6 shows the maps that were produced using demographic indicators consisting of literacy and income levels for years 2001 and 2011 and access to water.
The availability of water in wards 1–23 is influenced by the type of water sources, as depicted in Figure 6A,B. This, in turn, has an impact on community resilience. During the year 2001, the communities of Teba and KwaNgwevu located in ward 7 experienced significant water scarcity. As a result, they had to resort to utilizing two artificial sources of water, namely water vendors and water tankers, as depicted in Figure 6A. According to Figure 6B of 2011, it was observed that three communities, namely Allandale (ward 13), MnqabaJames (ward 1), and Msobomvu (ward 12), experienced severe water stress despite their dependence on non-natural water sources. The increase in regional water schemes shown in Figure 6B points to planned provisioning of water as it became scarcer.
Spatial variations in educational attainment are illustrated in Figure 6C,D. In the year 2001, as depicted in Figure 6C, two communities in ward 13, namely NgqolowaA and Dhlawu, along with six others, namely Calderwood (ward 18), Gqumashe (ward 2), KwaMemela (ward 3), Lower Hopefield (ward 10), Mavuvumezini (ward 14), and Ndindwa (ward 1), lacked access to formal education. In 2011, it was observed that only two communities, namely Lebanon (ward 13) and Mdeni B (ward 5), exhibited a predominant proportion of inhabitants who lacked formal education (Figure 6D). Figure 6E,F illustrate two distinct communities, one with income and the other without income. The community lacking income is expected to be highly vulnerable to climate change owing to restricted access to credit.
According to the data presented in Figure 6E, a total of 51 communities were found to be predominantly inhabited by individuals with no income in the year 2001. Among these communities, five were identified as the most impoverished in the municipality. These include KwaSawu (ward 15), Koloni (ward 17), Magxagxeni (ward 10), MdeniA (ward 7), and Seymour (ward 4) (Figure 6F). The rationale for categorizing communities into distinct levels of resilience based on age profiles (Figure 7A,B) is that individuals belonging to the younger and older age groups have limited abilities to comprehend and implement adaptation measures owing to their economic inactivity in contrast to those who fall under the intermediate-age, economically active group. From 2001, a total of 37 communities were recognized as having a predominant population of individuals aged 0 to 14 (Figure 7A). The adaptive capacity maps generated for the years 2001 and 2011 (Figure 7) were based on population age profiles.
In the year 2011, it was observed that 46 communities had a significant population of individuals aged between 0 to 14 years, out of which two communities had most of the individuals aged 60 years or above. On the other hand, in the year 2001, a total of 68 communities were identified as having low adaptive capacities. These findings are, respectively, shown in Figure 7B,C. By 2011, 54 communities had demonstrated an increase in their adaptive capacities from low to medium to high, as depicted in Figure 7D. However, this improvement is not sufficient because two of the communities, namely eMgwanisheni and MnqabaJames, experienced notable decreases in their adaptive capacities (AC). The observed decrease in these communities’ AC points to system failures to adequately address and alleviate the adverse consequences of CC-driven abnormalities and uncertainties. Evidence in support of this assertion comes from different parts of Africa [29,30,31], indicating that research and the implementation of informed CC policy continues to be undermined by the lack of information needed for us to meaningfully realize several of the Millennial Sustainable Development Goals.
The alterations in the adaptive capacities of communities from 2001 to 2011, ascertained from socio-economic data, are illustrated in Figure 8.
Overall, the majority of communities improved their adaptive capacities between 2001 and 2011. For instance, all communities in wards 9, 14, 16, and 23 improved adaptive capacities, while wards 1, 5, 7, 13–15, and 17 exhibited a decline in adaptive capacities based on the four indicators (age profiles, income levels, literacy levels, and water access) that were used in the assessment. Table 5 presents the communities that were rated as having medium-to-low declining adaptive capacities and low static adaptive capacities between the 2001 and 2011 censuses, respectively.

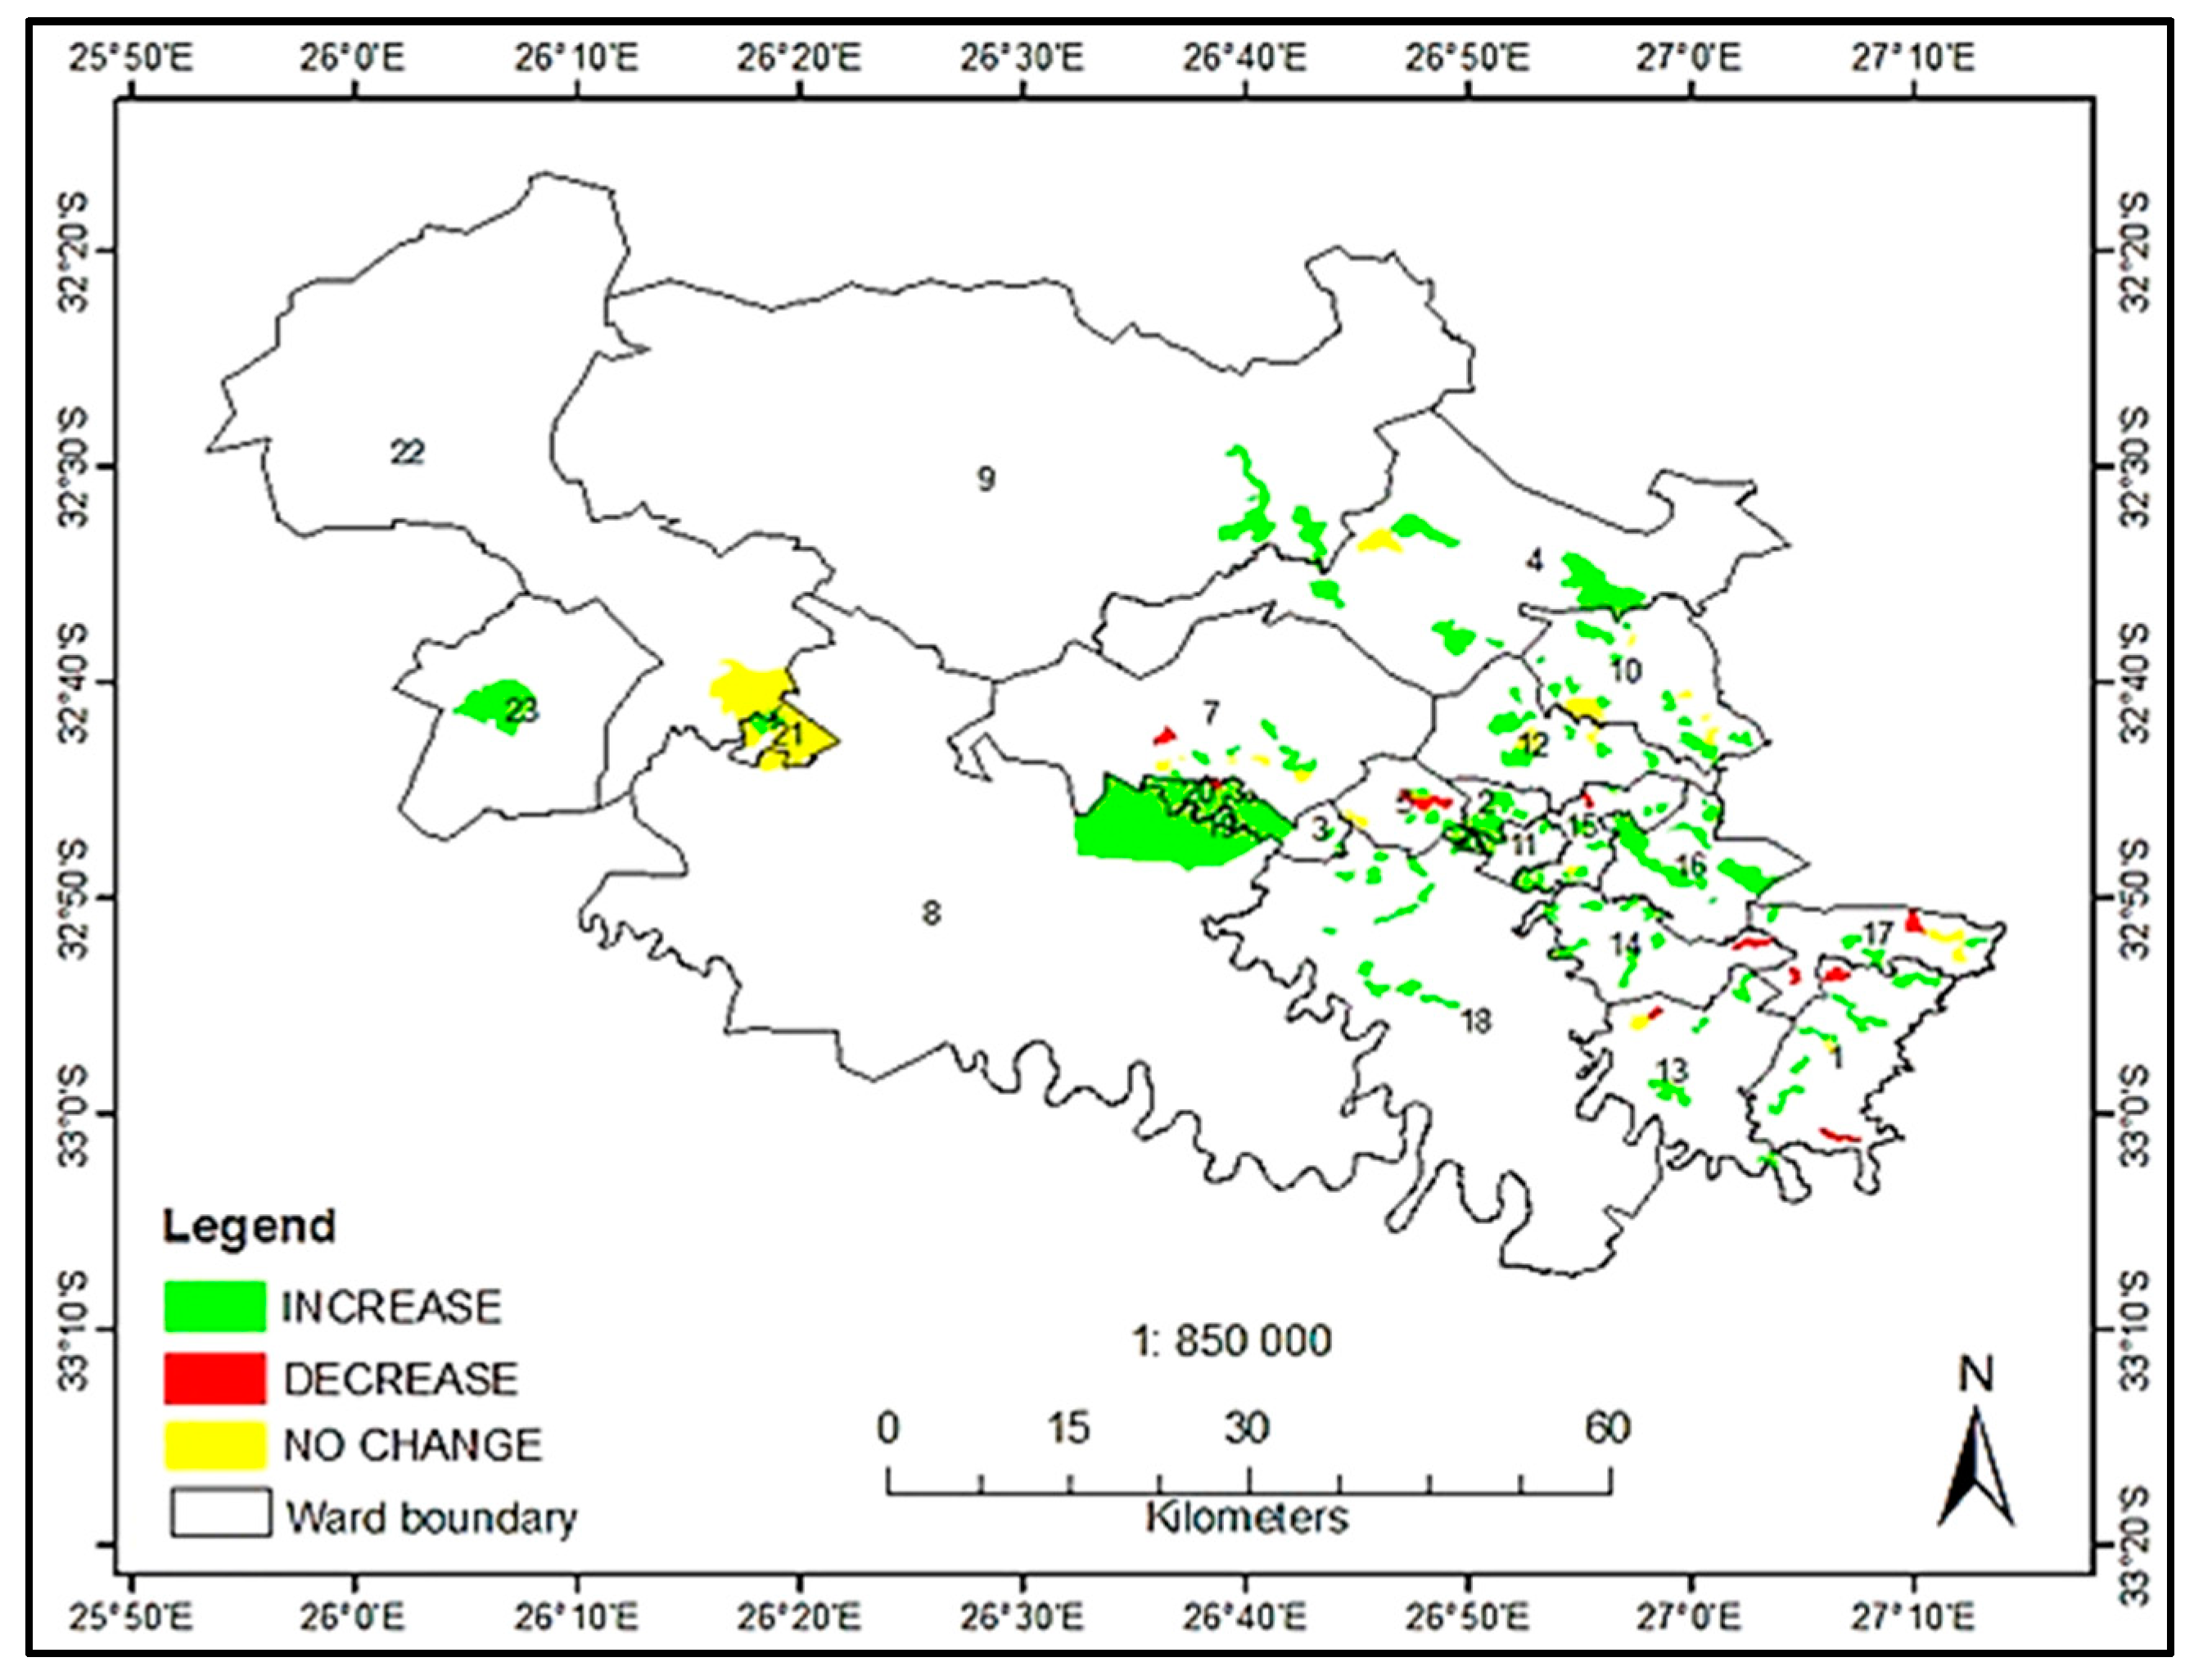
3.4. Communities with Declining and Static Adaptive Capacities

Table 6 also shows the locations that were rated as having long-term decreases in adaptive capacity between the 2001 and 2011 censuses.
From Table 5, two communities, namely MnqabaJames (ward 1) and eMgwanisheni (ward 13), had major declines in adaptive capacities from medium to low. The other ten communities already had low adaptive capacities in year 2001. Ward 10 had the highest number of communities with declining adaptive capacities, followed by wards 1 and 13. These wards were dominated by marginal lands (Figure 5) and generally low soil moisture content (Figure 4). Figure 9 shows the final adaptive capacities of communities based on arable lands, soil moisture information, and socio-economic indicators.
From the sample of 124 communities that was used to compile Figure 9, high, medium, and low adaptive capacities were observed in 65, 56, and 3 communities, respectively, which implies that more than half of the farming communities in the municipality have capabilities to adapt to climate-change-driven rainfall variabilities. Table 7 shows communities that were identified as having low adaptive capacities from the 124 villages that were included in the assessment.
Basing assessment on arable lands, average intra-annual soil moisture, and socio-economic datasets, three communities had the lowest adaptive capacities. According to the indicator scores illustrated in the attribute table (Table 4), these communities are situated in marginal lands with low soil moisture content. These observations are also confirmed by Figure 6 and Figure 8. Less than 3% of the number of sampled communities had low adaptive capacities.

4. Discussion

As shown in Figure 9 and Table 7, the results of this study validated the hypothesis that geostatistical methods provide a dependable approach to reliably assess adaptive capacity by merging different data types. The significance of this finding lies in its ability to showcase the applicability of this approach in providing valuable insights at levels of reliability that meet the needs of practitioners interested in implementing adaptation measures.
This section explains the initiative’s outcomes by placing the major findings in a broad context, with focus being directed on the ability of communities to respond to changing climatic conditions. This was determined by the extent to which communities were able to access the three indicators that were used and how age profiles impacted their preparedness. The approach’s shortcomings and its usefulness in measuring adaptive capacity using long-term socio-economic data are also discussed.

4.1. Soil Moisture

The results of this study show that SMMI can be used to provide useful soil moisture information at levels of detail and accuracy that are compatible with the needs of farmers and practitioners concerned with food security for successful adaptive capacity assessments. The investigation’s findings also confirm that the STAR-BME technique is reliably capable of predicting soil moisture at missing locations compared with the traditional geostatistical analysis. To predict soil moisture at locations and time instances without observations using STAR-BME, parameters for empirical covariance estimation and covariance model fitting must be carefully set.

4.2. Arable Lands

Without knowing where productive arable land is situated, information on soil moisture distributions in the whole municipality is not very useful. The arable lands map provided knowledge on which farmable areas (usable arable land) have how much soil moisture so that intervention strategies can be systematically targeted in line with the requirements of specific areas. This observation is in agreement with other researchers [32,33] who have reported that soil moisture information is useless without knowing where productive arable land is located.

4.3. Access to Water

The resilience of communities can be impacted by the availability of water, which is influenced by the sources of water categorized by type in wards 1–23, as depicted in Figure 6A,B. In the year 2001, as shown in Figure 6A, the communities of KwaNgwevu and Teba (both in ward 7) experienced acute water scarcities. Consequently, they had to rely on two non-natural sources of water, namely water vendors and water tankers. In 2011, three communities, namely Allandale (ward 13), MnqabaJames (ward 1), and Msobomvu (ward 12), experienced acute water scarcities (Figure 6B). However, it is noteworthy that these communities continued to rely on the same non-natural water sources as in 2001.
The increase in the number of communities relying on non-natural sources from two to three suggests that deteriorating climatic circumstances diminish the natural water supplies. This assertion is supported by the consecutive droughts that took place in the Eastern Cape Province in 1992, 2004, and 2009 [34,35,36]. The above-mentioned increase in the number of communities relying on non-natural sources and successive occurrence of drought strongly suggest that in this municipality, the issue of water scarcity is a persistent challenge that necessitates the investigation of alternative water sources and the implementation of a prudent combination of various water conservation methods to reduce reliance on expensive provisions from governmental and commercial vendors. The soil moisture maps produced by this study are useful in that they pinpoint near-real-time soil moisture deficiencies in specific wards. Knowledge of which wards do not have access to potable water together with soil moisture information allows extension officers and aid relief agencies to immediately identify hotspot areas that need attention. Interventions can then be timely targeted at those areas requiring immediate support. This synergistic use of different datasets provides timely, usable information that enables efforts to be directed at areas where assistance is badly needed.

4.4. Literacy Levels

Figure 6C,D show spatial disparities in educational attainment. In year 2001, the Dhlawu and NgqolowaA communities in ward 13 and Calderwood (ward 18), Gqumashe (ward 2), KwaMemela (ward 3), Lower Hopefield (ward 10), Mavuvumezini (ward 14), and Ndindwa (ward 1) lacked access to formal education, as depicted in Figure 6C. As of 2011, it was determined that only two communities, namely Lebanon in ward 13 and Mdeni B in ward 5, exhibited increased numbers of inhabitants without formal education (Figure 6D). The observation is interesting and intriguing, as it implies a positive correlation between the rise in formal education and the heightened awareness of climate change concerns.
Regrettably, however, the mere presence of knowledge does not imply increased adoption of implementable adaptation strategies in the absence of a supportive environment that enables the translation of suggested measures into concrete climate-conscious endeavors, as knowledge in isolation without motivation and capability to act is insufficient [37]. The desire to act requires access to resources, which are evidently inadequate in RMLM due to the prevalence of poverty. This assertion is supported by the census data of 2011 [38], which indicate that the percentage of unemployed individuals in Nkonkobe was 48.1%, while in Nxuba, it was 42%. Given these high unemployment figures and the well-documented poverty rates in the region, it is logical to propose that despite advancements in literacy, the successful execution of measures to increase the uptake of informed climate-change-adaptation strategies is still hindered by the absence of a comprehensive approach that encompasses various facilitating elements that determine the capacity of communities to effectively adopt eco-friendly interventions. The knowledge of which wards have low literacy levels is vital because this information can be combined with soil moisture information to identify localities where several unfavorable conditions converge. Going by the results of this study, it is possible these wards with low literacy levels are also the same wards with low soil moisture observations. If this is the case, these wards can then be targeted as priority areas that need purposefully structured extension services such as training on conservative soil moisture utilization techniques. Interventions like this are, however, presently difficult to implement due to the lack of information on how natural and human-related factors intersect. This can be addressed by combining information on soil moisture and literacy levels to spatially identify localities and communities that need external assistance.

4.5. Annual Income Levels

Figure 6E,F show how the spatial distributions of communities that did not have and those that had income by specific income brackets in 2001 and 2011. Because they have restricted access to finance, the second category (R1–R9600 annual income) can be expected to be particularly susceptible to the majority of climate-change-related shocks. In 2001, 51 communities were predominantly dominated by individuals with no source of income (Figure 6E). Additionally, Figure 6F highlights that the poorest communities in the municipality were kwaSawu (ward 15), Koloni (ward 17), Magxagxeni (ward 10), MdeniA (ward 7), and Seymour. These findings are consistent with the 2011 census statistics provided by [38], which indicated that the majority of people residing in these localities lack any means of generating income. This limitation has been widely reported and acknowledged by many researchers [39,40,41]. The researchers have documented that households in the communities of Lambani, Tshakhuma, Rabali, and Tshiombo, located in the Limpopo Province, view rain-fed crop production as a significantly uncertain undertaking. The reason for this phenomenon can be attributed to the communities’ inability to finance supplementary irrigation and their disqualification from obtaining agricultural insurance. This is predominantly due to the widespread absence of dependable sources of income in these areas.
Knowing which wards have low income levels is important because this information can be paired with soil moisture data to identify areas where numerous adverse conditions converge, i.e., wards with low income levels, may also have low soil moisture observations. These wards can then be identified as priority locations for financial assistance such as the purchase and implementation of drought-tolerant farming activities that can endure low soil moisture conditions. Due to a lack of knowledge about how natural and human-related elements interact, interventions like this are currently challenging to implement. Hence, combining data on soil moisture and income levels is beneficial because it allows for the spatially specific identification of areas that require outside assistance.

4.6. Impact of Age Distributions on Resilience

The categorization of communities into distinct levels of resilience, as depicted in Figure 7A,B, was predicated on the premise that individuals at the extremes of the age spectrum, namely children and the elderly, possess relatively constrained abilities to absorb and execute adaptation measures owing to their lack of economic activity in comparison to their intermediate-aged counterparts. In the year 2001 (Figure 7A), it was observed that 37 communities exhibited a higher concentration of individuals within the age range of 0 to 14 years.
For 2011, the study revealed that 46 distinct communities had a majority population between 0–14 years of age. Additionally, two of these communities were found to have the majority of people over the age of 60. Furthermore, in 2001, a total of 68 communities had low adaptive capacities. By 2011, 54 communities demonstrated an improvement in their adaptive capacities from low to medium and high (Figure 7D). However, this progress is not sufficient, as the capacities of two communities, namely eMgwanisheni and MnqabaJames, decreased over time. This suggests that the system was ineffective in mitigating the negative impacts of climate change. Furthermore, it is worth noting that approximately 7.5% of the communities in RMLM were identified as having low or decreasing adaptive capacities between 2001 and 2011, which supports the above-mentioned decrease in eMgwanisheni and MnqabaJames. The ability to identify locations where agricultural resources can be prioritized is dependent on knowing the age profiles of communities within wards. This information can be integrated with soil moisture information to identify localities where the provision of structured support services and resources to farmers in need of this assistance can be prioritized. For example, because elderly people are more engaged in farming than youngsters, wards with more of them may be the same as those with high soil moisture observations. These wards can then be identified as priority regions for planned implementation of structured development programs that include but are not limited to training on conservation of stochastically variable soil moisture resources. This proposed linkage of soil moisture information to age profiles and other socio-economic indicators is useful because it enhances the objective identification of communities that deservedly require external assistance.
The presented results are valuable because they demonstrate that empirically grounded geostatistical methods can be utilized to aid climate change management by providing reliable and timely depiction of groups that can be recipients of targeted interventions through aptly informed adaptation plans. In a broader perspective, our approach has the potentials to enhance adaptation tracking by effectively integrating and correlating multi-temporal demographic and remote sensing datasets, which are often accessible in disparate and non-uniform formats. The ability to connect multiple datasets enables the implementation of effective strategies to improve community-level climate-change-adaption capacities. Additionally, this capability endows it with the flexibility to cater to a wide range of interests and can be effectively used in assisting multiple stakeholders.

5. Recommendations and Conclusion

5.1. Recommendations

It is recommended that governmental bodies, civil society organizations, and research institutions undertake the task of mapping the adaptive capacities of farmers residing in rural areas of South Africa. This can be achieved by utilizing an approach that links various multi-source datasets that are more suitable and relevant for the purpose. The proposed methodology for assessing adaptive capacities can be applied effectively in the context of the Joe Gqabi District Municipality. This district, which has been officially designated as an area affected by drought [42,43], and others elsewhere can benefit by using this adaptive capacity assessment methodology. The findings of this research can offer useful insights that can be used for the formulation and implementation of disaster management strategies.
The approach delineated in this the paper is not a conventional resolution owing to the lack of data accessibility at appropriate spatiotemporal resolutions and the absence of a singular analytical unit that can be employed to assess or contrast adaptive capacities. However, demographic data are widely obtainable across most countries, rendering it a feasible substitute that merits contemplation, given that obtaining data at a finer level can be a costly and time-intensive endeavor.
Furthermore, the methodology’s capacity to present adaptive capacities in a spatially explicit manner provides supplementary benefits by allowing individuals interested in mapping and assessing adaptation to productively utilize the rich data types that are freely available. The primary finding of this endeavor is that while limited data availability is frequently identified as a significant obstacle in the context of adaptation mapping/assessment, the geostatistical technique outlined in this investigation offers an alternative strategy that can be leveraged to optimize the usefulness of diverse and easily obtainable datasets from various origins. The major usefulness of this methodology is that stakeholders such as policymakers and practitioners who are vested with the responsibilities to promote the adoption and implementation of CC adaptation strategies can routinely apply it to enhance the ability of resource-poor farmers to assimilate actionable CC adaptation strategies.

5.2. Conclusions

The presented methodology integrated soil moisture information, land capability, and demographic data for local-level adaptive capacity assessments through the use of Python scripts in the ArcGIS software environment. The results indicate that this methodology possesses the ability to identify different adaptive capacities at varying spatial levels spanning from lowest to the highest. This facilitates a thorough comprehension of the spatial allocation of adaptive capacities. This finding is helpful because this methodology can be extended by linking a broader range of different datasets to map multi-scale spatial variations in adaptive capacities. The methodology is also useful because, apart from using readily accessible datasets, it is simple, user-friendly, cost-effective, and adaptable. Therefore, interested stakeholders are invited to complement these efforts by test-trying the usability of this improvised technique in spatializing the adaptive capacities of different communities in those areas where action is needed to mitigate the adverse impacts of climate change. The technique provided here can be improved by including factors like access to markets and others that the present project did not include. These other factors were not included because the objective was not to provide an exhaustive inclusion of all factors but to provide a replicable methodology that demonstrates that it is possible to provide information that can be used to enhance the adaptive capacities of farmers by combining soil moisture information with different types of relevantly selected data. Future work can build on this methodology by incorporating different datasets available for specific areas because most of the data utilized in this study are already accessible for most localities.

Supplementary Materials

The following supporting information can be downloaded at: https://www.mdpi.com/article/10.3390/su151713120/s1, A supplementary document listing of all Python programming scripts used in the study is available together with their explanations.

Author Contributions

Conceptualization, M.M.C. and H.H.; methodology, M.M.C.; software, M.M.C.; validation, M.M.C., L.Z. and H.H.; formal analysis, M.M.C.; investigation, M.M.C.; resources, M.M.C. and L.Z.; data curation, M.M.C.; writing—original draft preparation, M.M.C.; writing—review and editing, M.M.C., L.Z. and H.H.; visualization, M.M.C.; supervision, L.Z. and H.H.; project administration, L.Z.; funding acquisition, L.Z. All authors have read and agreed to the published version of the manuscript.

Funding

This study received financial support from the South Africa/Flanders Climate Adaptation Research and Training Partnership (SAF-ADAPT) project.

Institutional Review Board Statement

Not applicable.

Informed Consent Statement

Not applicable.

Data Availability Statement

Research data can be obtained on request.

Acknowledgments

The authors thank the South Africa/Flanders Climate Adaptation Research and Training Partnership (SAF-ADAPT) for their research, which enabled us to write this paper. The following organizations are also thanked: South African National Space Agency (SANSA) for SPOT satellite imagery, Statistics South Africa (StatsSA) for providing census demographic data, and South Africa’s Agriculture Research Council (ARC-SA) for providing land capability data. We also thank the anonymous reviewers whose comments helped us to improve this paper.

Conflicts of Interest

The authors declare no conflict of interest.

References

  1. Naulleau, A.; Gary, C.; Prévot, L.; Hossard, L. Evaluating strategies for adaptation to climate change in grapevine production—A systematic review. Front. Plant Sci. 2021, 11, 2154. [Google Scholar] [CrossRef]
  2. Dasgupta, S.; Badola, R.; Ali, S.Z.; Jiju, J.S.; Tariyal, P. Adaptive capacity and vulnerability of the socio-ecological system of Indian Himalayan villages under present and predicted future scenarios. J. Environ. Manag. 2022, 302, 113946. [Google Scholar] [CrossRef]
  3. Tran, P.T.; Vu, B.T.; Son, T.; Ngo, S.T.; Tran, V.D.; Ho, T.D.N. North Central Region of Vietnam: A Case Study in Nghe an Province, Vietnam. Environ. Chall. 2022, 7, 100460. [Google Scholar] [CrossRef]
  4. Islam, M.S.; Samreth, S.; Hayat-Md, A.; Islam, S.; Sato, M. Climate Change, Climatic Extremes, and Households’ Food Consumption in Bangladesh: A Longitudinal Data Analysis. Environ. Chall. 2022, 7, 100495. [Google Scholar] [CrossRef]
  5. Babakholov, S.; Bobojonov, I.; Hasanov, S.; Glauben, T. An Empirical Assessment of the Interactive Impacts of Irrigation and Climate on Farm Productivity in Samarkand Region, Uzbekistan. Environ. Chall. 2022, 7, 100502. [Google Scholar] [CrossRef]
  6. Masuda, Y.J.; Castro, B.; Aggraeni, I.; Wolff, N.H.; Ebi, K.; Garg, T.; Game, E.T.; Krenz, J.; Spector, J. How Are Healthy, Working Populations Affected by Increasing Temperatures in the Tropics? Implications for Climate Change Adaptation Policies. Global Environ. Chang. 2019, 56, 29–40. [Google Scholar] [CrossRef]
  7. Ford, J.D.; Berrang-Ford, L.; Biesbroek, R.; Araos, M.; Austin, S.E.; Lesnikowski, A. Adaptation tracking for a post-2015 climate agreement. Nat. Clim. Chang. 2015, 5, 967–969. [Google Scholar] [CrossRef]
  8. Berrang-Ford, L.; Biesbroek, R.; Ford, J.D.; Lesnikowski, A.; Tanabe, A.; Wang, F.M.; Chen, C.; Hsu, A.; Hellmann, J.J.; Pringle, P.; et al. Tracking global climate change adaptation among governments. Nat. Clim. Chang. 2019, 9, 440–449. [Google Scholar] [CrossRef]
  9. Lesnikowski, A.; Ford, J.; Biesbroek, R.; Berrang-Ford, L.; Maillet, M.; Araos, M.; Austin, S.E. What does the Paris Agreement mean for adaptation? Clim. Policy 2017, 17, 825–831. [Google Scholar] [CrossRef]
  10. Ford, J.; Berrang-Ford, L.; Lesnikowski, A.; Barrera, M.; Heymann, S. How to track adaptation to climate change: A typology of approaches for national-level application. Ecol. Soc. 2013, 18, 40. [Google Scholar] [CrossRef]
  11. Orusa, T.; Viani, A.; Moyo, B.; Cammareri, D.; Borgogno-Mondino, E. Risk Assessment of Rising Temperatures Using Landsat 4–9 LST Time Series and Meta Population Dataset: An Application in Aosta Valley, NW Italy. Remote Sens. 2023, 15, 2348. [Google Scholar] [CrossRef]
  12. de Sherbinin, A. Climate change hotspots mapping: What have we learned? Clim. Chang. 2014, 123, 23–37. [Google Scholar] [CrossRef]
  13. ADM. Amathole District Municipality 2017–2020 Integrated Development Plan (IDP)-Eastern Cape Socio Economic Consultative Council (ECSECC). 2017. Available online: https://www.ecsecc.org/information-centre/item/amathole-2017-2020-integrated-development-plan-idp (accessed on 16 November 2022).
  14. Local Government Handbook. The Local Government Handbook: South Africa. 2016. Available online: http://www.localgovernment.co.za/locals/view/233/Raymond-Mhlaba-Local-Municipality (accessed on 27 February 2023).
  15. Chari, M.M.; Hamandawana, H.; Zhou, L. Socioeconomically informed use of geostatistics to track adaptation of resource-poor communities to climate change. In African Handbook of Climate Change Adaptation; Leal Filho, W., Oguge, N., Ayal, D., Adeleke, L., da Silva, I., Eds.; Springer International Publishing: Cham, Switzerland, 2021; pp. 1555–1581. [Google Scholar] [CrossRef]
  16. Ncube, M.; Madubula, N.; Ngwenya, H.; Zinyengere, N.; Zhou, L.; Francis, J.; Mthunzi, T.; Olivier, C.; Madzivhandila, T. Climate change, household vulnerability and smart agriculture: The case of two South African provinces. Jàmbá J. Disaster Risk Stud. 2016, 8, 6–8. [Google Scholar] [CrossRef]
  17. Available online: https://eos.com/spot-6-and-7/ (accessed on 12 September 2021).
  18. Liu, Y.; Yue, H.; Wang, H.R.; Zhang, W. Comparison of SMMI, PDI and its applications in Shendong mining area. IOP Conf. Ser. Earth Environ. Sci. 2017, 57, 012025. [Google Scholar] [CrossRef]
  19. Black, C.A. Methods of Soil Analysis. Part 1. Physical and Mineralogical Properties; American Society of Agronomy: Madison, WI, USA, 1965. [Google Scholar]
  20. Yue, H.; Liu, Y.; Qian, J. Soil moisture assessment through the SSMMI and GSSIM algorithm based on SPOT, WorldView-2, and Sentinel-2 images in the Daliuta Coal Mining Area, China. Environ. Monit. Assess. 2020, 192, 237. [Google Scholar] [CrossRef] [PubMed]
  21. Chari, M.M.; Hamandawana, H.; Zhou, L. A proposed methodology to map soil moisture in support of farm-level decision making under changing climatic conditions. In Sustainable Agriculture and Food Security; Leal Filho, W., Kovaleva, M., Popkova, E., Eds.; World Sustainability Series; Springer: Cham, Switzerland, 2022. [Google Scholar] [CrossRef]
  22. Available online: https://stemlab.bse.ntu.edu.tw/blog/2019-04-23-star-bme/ (accessed on 14 March 2022).
  23. Han, L.; Wang, C.; Liu, Q.; Wang, G.; Yu, T.; Gu, X.; Zhang, Y. Soil moisture mapping based on multi-source fusion of optical, near-infrared, thermal infrared, and digital elevation model data via the Bayesian Maximum Entropy framework. Remote Sens. 2020, 12, 3916. [Google Scholar] [CrossRef]
  24. Mouazen, A.M.; Shi, Z. Estimation and mapping of soil properties based on multi-source data fusion. Remote Sens. 2021, 13, 978. [Google Scholar] [CrossRef]
  25. Wang, C.; Xie, Q.; Gu, X.; Yu, T.; Meng, Q.; Zhou, X.; Han, L.; Zhan, Y. Soil moisture estimation using Bayesian Maximum Entropy algorithm from FY3-B, MODIS and ASTER GDEM remote-sensing data in a maize region of HeBei Province, China. Int. J. Remote Sens. 2020, 41, 7018–7041. [Google Scholar] [CrossRef]
  26. Jian, X.; Olea, R.A.; Yu, Y.S. Semi-variogram modeling by weighted least squares. Comput. Geosci. 1996, 22, 387–397. [Google Scholar] [CrossRef]
  27. Barber, M.; Grings, F.; Perna, P.; Piscitelli, M.; Maas, M.; Bruscantini, C.; Jacobo-Berlles, J.; Karszenbaum, H. Speckle noise and soil heterogeneities as error sources in a Bayesian soil moisture retrieval scheme for SAR data. IEEE J. Sel. Top. Appl. Earth Obs. Remote Sens. 2012, 5, 942–951. [Google Scholar] [CrossRef]
  28. Nkonkobe Local Municipality. Integrated Development Plan 2012–2017. 2012. Available online: http://nkonkobe.gov.za/?q=system/files/filedepot/2/FINAL/IDP/2012-2017.pdf (accessed on 15 February 2023).
  29. Darkoh, M.B.K. The Nature Causes and Consequences of Desertification in the Drylands of Africa. Land Degrad. Desertif. 1998, 9, 1–20. [Google Scholar] [CrossRef]
  30. Darkoh, M.B.K. Regional Perspectives on Agriculture and Biodiversity in the Drylands of Africa. J. Arid Environ. 2000, 54, 261–279. [Google Scholar] [CrossRef]
  31. Darkoh, M.B.K. Agriculture and Biodiversity in the Drylands of Africa. In Human Impact on Environment and Sustainable Development in Africa: Contemporary Perspectives on Developing Societies; Darkoh, M.B.K., Rowmire, P., Eds.; Ashgate Publishing Ltd.: Hampshire, UK, 2003; pp. 253–281. [Google Scholar]
  32. Ponkina, E.; Illiger, P.; Krotova, O.; Bondarovich, A. Do ARMA models provide better gap filling in time series of soil temperature and soil moisture? The case of arable land in the Kulunda Steppe, Russia. Land 2021, 10, 579. [Google Scholar] [CrossRef]
  33. Tiefenbacher, A.; Weigelhofer, G.; Klik, A.; Mabit, L.; Santner, J.; Wenzel, W.; Strauss, P. Antecedent soil moisture and rain intensity control pathways and quality of organic carbon exports from arable land. Catena 2021, 202, 105297. [Google Scholar] [CrossRef]
  34. ADM. Amathole District Municipality 2012–2017 Integrated Development Plan. 2012. Available online: http://www.amathole.gov.za/old/attachments/article/324/FINAL%20IDP%202012-2017.pdf (accessed on 23 November 2022).
  35. ADM. Amathole District Municipality State of the District Address. Amathole Community News 2010, 1–2. Available online: http://www.amathole.gov.za/old/attachments/article/70/English%Newsletter%2010%June.pdf (accessed on 16 November 2022).
  36. International Federation of Red Cross (IFRC). South Africa: Drought. Available online: http://www.ifrc.org/docs/appeals/rpts04/ZA040130.pdf (accessed on 10 February 2023).
  37. Adger, W.N.; Dessai, S.; Goulden, M.; Hulme, M.; Lorenzoni, I.; Nelson, D.R.; Naess, L.O.; Wolf, J.; Wreford, A. Are there social limits to adaptation to climate change? Clim. Chang. 2009, 93, 335–354. [Google Scholar] [CrossRef]
  38. Statistics South Africa. Census 2011 Provincial Profile: Eastern Cape. Report No. 03-01-71. Available online: http://www.statssa.gov.za/publications/Report-03-01-71/Report-03-01-712011.pdf (accessed on 20 November 2022).
  39. Mpandeli, N.S.; Maponya, P.I. Coping with climate variability in Limpopo Province, South Africa. Peak J. Agric. Sci. 2013, 1, 54–64. [Google Scholar]
  40. Rusere, F.; Mkuhlani, S.; Crespo, O.; Dicks, L.V. Developing pathways to improve smallholder agricultural productivity through ecological intensification technologies in semi-arid Limpopo, South Africa. Afr. J. Sci. Technol. Innov. Dev. 2019, 11, 543–553. Available online: https://hdl.handle.net/10520/EJC-17cdf5360f (accessed on 12 March 2023). [CrossRef]
  41. Mkuhlani, S.; Crespo, O.; Rusere, F.; Zhou, L.; Francis, J. Classification of small-scale farmers for improved rainfall variability management in South Africa. Agroecol. Sustain. Food Syst. 2020, 44, 7–29. [Google Scholar] [CrossRef]
  42. De Kock, R. Devastating Eastern Cape Drought is a Disaster. 2016. Available online: www.heraldlive.co.za/news/2016/01/11/dry-desperate-disaster/ (accessed on 16 March 2023).
  43. Etheridge, J. Eastern Cape to Declare Drought a Disaster. 2019. Available online: https://www.news24.com/news24/SouthAfrica/News/eastern-cape-to-declare-drought-a-disaster-20191023 (accessed on 25 January 2023).
Figure 1. Geographical location of Raymond Mhlaba Local Municipality (RMLM).
Sustainability 15 13120 g001
Figure 2. Datasets and steps that were used to assess the adaptive capacities.
Sustainability 15 13120 g002
Figure 3. Average intra-annual dry season variations in soil moisture that were deduced from soil moisture distribution maps for years 2014–2017.
Sustainability 15 13120 g003
Figure 4. Classified intra-annual dry season variations in soil moisture distributions.
Sustainability 15 13120 g004
Figure 5. Spatial distributions of communities and arable/marginal lands in in RMLM.
Sustainability 15 13120 g005
Figure 6. Access to water, levels of literacy, and income of communities in RMLM during the years 2001 and 2011.
Sustainability 15 13120 g006
Figure 7. Age profiles and adaptive capacities in RMLM in 2001 and 2011.
Sustainability 15 13120 g007
Figure 8. Changes in adaptive capacities between 2001 and 2011 based on socioeconomic data.
Sustainability 15 13120 g008
Figure 9. Final adaptive capacities of communities based on arable lands, soil moisture information, and socio-economic indicators.
Sustainability 15 13120 g009
Table 1. Dates of the image acquisition used in the study.
Acquisition DateSpatial ResolutionSpectral Bands
11 April 20146 mNIR, blue, green, red
5 September 20156 mNIR, blue, green, red
8 November 20166 mNIR, blue, green, red
18 October 20176 mNIR, blue, green, red
Source of images: South African National Space Agency (SANSA).
Table 2. Attribute table structure for assessing of adaptive capacities.
CommunityWard
Number
Access to WaterLiteracy LevelsIncome LevelsAge ProfileAdaptive ScoreSocio-Adaptive
Capacity
C1W1354315HIGH
C2W2S1S2S3S4..
........
........
C134W2333208MEDIUM
Note: C1 … C134 represent the community names; W represents ward numbers; S1, S2, S3, and S4 represent indicator scores. The adaptive scores range from 1 to 15. The “Socio-Adaptive Capacity” column indicates the assigned capacity level for each community.
Table 3. Comparison of adaptive capacity scores from the 2001 and 2011 censuses.
CommunityWardAdaptive ScoreDifferenceRating
20112001
C1W158−3DECREASE
C2W2A1A2..
......
......
C134W231284INCREASE
Note: C1 … C134, community names; W, ward numbers; A1, A2, adaptive capacity scores for 2011 and 2001, respectively.
Table 4. Attribute table evaluation of adaptive capacities across all census years.
CommunityWard NumberArable LandSoil MoistureSocio-Economic Adaptive CapacityFinal Adaptive Capacity
C1W1233High
C2W2S1S2S3.
......
......
C124W23111Low
Note: C1 … C124, community names; W, ward numbers; S1, S2, S3, S4, indicator scores. Adaptive scores ranged from 1–8.
Table 5. Communities with declining and static adaptive capacities in RMLM in 2001 and 2011.
Names of Communities and Respective Ward NumbersAdaptive Capacities
20012011
(1) eMgwanisheni13MediumLow
(2) Jomlo10LowLow
(3) KuDikidikana13LowLow
(4) KwaKulile1LowLow
(5) KwaNacelwane7LowLow
(6) Lebanon18LowLow
(7) Lower Hopefield10LowLow
(8) Machibini10LowLow
(9) Mazotshweni12LowLow
(10) Mdeni B10LowLow
(11) MnqabaJames1MediumLow
(12) Qamdobowa1LowLow
Table 6. Identification of communities with a sustained decline in adaptive capacities between 2001 and 2011.
Community Name Ward
(1) eMgwanisheni13
(2) Fernvilla7
(3) Koloni17
(4) KwaMlalandle20
(5) Mgquba5
(6) MnqabaJames1
(7) Ncera15
(8) Newtown14
(9) Qamdobowa1
(10) Zihlahleni17
Table 7. Communities with low adaptive capacities from the entire assessment.
Name of Community Ward Number
Jomlo10
Mdeni A7
KwaNobanda7
Disclaimer/Publisher’s Note: The statements, opinions and data contained in all publications are solely those of the individual author(s) and contributor(s) and not of MDPI and/or the editor(s). MDPI and/or the editor(s) disclaim responsibility for any injury to people or property resulting from any ideas, methods, instructions or products referred to in the content.

