Article

A Novel Mathematical Model for Repairing Rough Cracks Using the Microbially Induced Carbonate Precipitation (MICP)

School of Resources and Civil Engineering, Northeastern University, Shenyang 110819, China
*
Authors to whom correspondence should be addressed.
Sustainability 2023, 15(17), 13122; https://doi.org/10.3390/su151713122
Submission received: 27 July 2023 / Revised: 18 August 2023 / Accepted: 28 August 2023 / Published: 31 August 2023

Abstract

:
Concrete cracks have an adverse effect on the strength properties and durability of concrete structures. Therefore, repairing concrete cracks to recover the concrete’s strength parameters is an important task in the civil engineering field. For repairing concrete cracks, the MICP technique has been widely analyzed in recent times; however, no research has been conducted to deeply investigate the repair effects of MICP on concrete cracks with a rough surface using a theoretical model. In the current research, MICP with a novel mathematical model was conducted considering the precipitation of calcium carbonate (CaCO3), ureolysis, suspended biomass, geochemistry, transport of solutes, and biofilm growth. Furthermore, crack repair experiments were performed to assess the performance of the new mathematical model. The results revealed that the calculated concentrations of suspended biomass in cracks gradually decreased during the test. The comparison between the experimental results and calculated results verified the precision of the migration behavior of the suspended biomass. At the inlet, the solute concentrations and volume fractions of biofilm were higher, causing an increase in the productive rates of calcium carbonate. The consumed concentrations of solutes were higher for cracks with a smoother surface, eventually leading to smaller values of sonic time; the upper parts of the cracks also had smaller values of sonic time, showing good repair effects. The proposed mathematical model provides a better solution to control the repair time and microbial metabolism process, allowing for adjustive bioremediation and biomineralization of concrete, which could provide a firm basis for the remediation of materials in the civil engineering field.

1. Introduction

Cracks have an adverse effect on the strength of concrete, as the penetration of cracks can cause corrosion of steel bars. Generally, repair can be carried out through the carbonization of calcium hydroxide caused by carbon dioxide and water [1,2,3]; accordingly, self-healing helps concrete to resist microcracks [4,5]. Self-healing concrete can be produced using silica particles [6]. However, concrete self-healing is only effective for cracks less than 1 mm in size, and the repair influence is limited for large cracks. Many techniques have been reported to deal with larger cracks, including the use of sugar-coated concrete, microbial self-healing concrete, polypropylene macrofiber concrete, silicon-based polymers, polymeric and cementitious materials, epoxy grouting materials, and bacteria-based self-healing concrete [3,6,7,8,9,10,11].
Recently, MICP has been comprehensively researched for repairing concrete cracks. Microbiologically induced calcium carbonate precipitation (MICP) is a biogeochemical process that induces calcium carbonate precipitation via selected microorganisms within the material matrix through different pathways, considered as a potential plugging agent in many environmental and engineering applications [12]. The addition of selected microorganisms to cementitious materials is considered a cost-effective and eco-friendly method for microcrack repair. The most appropriate pathway for MICP is urea hydrolysis. Urease enzymes can be produced by microorganisms, and calcium CaCO3 can be produced with the help of calcium ions [11,13]. The healing process caused by bacteria normally consists of some materials and bacteria used for the reaction [14,15]. Several kinds of bacteria have been used, depending on the application situation, to repair cracks via MICP [16]. For example, the compressive strength of concrete repaired using Shewanella baltica increased after twenty-eight days of MICP repair, whereas the compressive strength of another sample did not change significantly [17]. Urine-soluble bacteria have also been commonly used in previous research to repair concrete cracks [16,18,19,20]. Microbially induced calcium carbonate precipitation can be used to seal cracks because it has cementation ability and can improve the strength of concrete [2,21,22]. The strength, toughness, and resistance of concrete can be improved using biocomposite metakaolin bacterial spores, the MICP method, and bio-inspired strategies under high fatigue loading [2,23,24]. As well, Sun et al. [25] considered glucose addition, microbial calcium carbonate, high urease activity, and Bacillus subtilis to enhance the strength parameters and bioremediation efficiency of repaired concrete samples [25,26,27].
More recently, many scholars have made a great effort to repair larger cracks through the MICP technique [16,28,29]. Based on the MICP method, the precipitation of CaCO3 can seal cracks without any addition. On the other hand, repairing cracks through the precipitation of CaCO3 is not beneficial for larger cracks, and this is why a few scholars have explored other chemicals to seal large cracks [30]. For example, Zhang et al. [31] and Sun et al. [32] suggested the use of polyvinyl alcohol (PVA) fibers and aluminum oxide to repair cracks 0.5 to 2.0 mm in size through microbially induced carbonate precipitation. Existing studies on crack repair did not consider the crack roughness. Furthermore, many studies on concrete crack repair only conducted qualitative examinations, which are not appropriate in practical engineering. In reality, theoretical quantification of rough crack repair with the MICP technique cannot be ignored, and it is of great importance to develop a new mathematical model for MICP rough crack repair. As well, control of the repair period and microbial metabolism using a mathematical model could allow for biomineralization, biofilm growth, on-demand adjustment, and successive bioremediation of building materials.
However, some scholars adopted a theoretical model approach to quantitively determine the repair effects of MICP. Most of prior investigations have selected theoretical methods about fine aggregate cementation based on the MICP technique. According to the MICP process, these methods can be categorized into four parts: the distribution and transport of biomass, biochemical reaction, MICP solidification, and CaCO3 precipitation [33,34,35,36,37,38,39]. These parts can affect the ultimate impact of biocementation. Bacteria would adhere to the crack surface during the repair by MICP. Biofilm is an extracellular polymeric substance, which is produced by attached bacteria [40,41,42]. Previously conducted laboratory-based experiments do not considered biofilm, but this does not mean that no biofilm exists in experiments. Therefore, researchers of this study think that the biofilm growth should be considered for rough crack repair in a mathematical model for deeper understanding.
To assess the repair effects using a new mathematical model, biofilm growth, the distribution of suspended biomass, the amounts of precipitated CaCO3, and the distribution of solutes were assessed using Python. Furthermore, crack repair experiments were performed to show the practicability and feasibility of the new model. Even if conventional precipitation of crystallization may have an influence on the repair effects, it is an inherent mechanism and the impact is negligible [43]. Thus, the repair effect was taken as the main outcome of MICP in the tests. In the experiments, the values of sonic time, productive rates of CaCO3, and absorbance of the leachate were obtained and matched with the calculated results. In the end, the results revealed the accuracy of the transport of suspended biomass, transport of solutes, CaCO3 precipitation, and biofilm growth in the developed mathematical model.

2. New Mathematical Model

2.1. Model Generation

In this study, a novel mathematical model was established for concrete crack (with a rough surface) repair based on the MICP technique. Several governing equations were modified for suspended biomass concentrations, solute concentrations, biofilm growth, and the precipitation of CaCO3. For this purpose, few assumptions are made: (1) attachment of biomass in biofilm and planktonic biomass in water are neglected; (2) flow of water is not affected by detached biomass; (3) flow of water is saturated; (4) biofilm develops smoothly on the cracks rough surface; and (5) flow of water from biofilm and biofilm permeability are neglected.
The entire control process consists of two simple steps. The first step is cementation of urea–calcium acetate and injection of bacterial suspension (for 30 min). The next step is the calcium carbonate precipitation, and this procedure is performed at static condition for 24 h. The crack repair time is 21 days. The calculation properties are presented in Appendix A.

2.2. Transport of Solutes

The bioreaction, dispersion, and horizontal movement of biofilm were chosen to investigate the transport of solutes in the new model. Monod-type kinetics have the ability to accurately model solute consumption in biofilms [44,45]. The biofilm of solutes in the cracks and conservations in water are changed to select the crack repair condition in Equation (1). In Equation (2), Aw (m2) is the area of the water phase, and Af (m2) is the area of biofilm in the concrete cracks.
V 0 1 ε c d C m d t = d x q C m + d x D w A w + D f A f C m x + V 0 R m ,
A w = d · w · ε w , A f = d · w · ε f .
The left-hand side of Equation (1) shows the variation in solutes over time in the water portion. V0 (m3) is the initial crack volume ignoring the biofilm and calcite. εc is the calcite volume fraction, εw is the volume fraction of water, and εf is the biofilm volume fraction. The sum of εc, εw, and εf is equal to 1, and Cm (kg/m3) is the average concentration of solutes. The first two expressions on the right-hand side of Equation (1) are dispersive and advective fluxes, respectively. q (m/s) is the Darcy rate of water flow. Dw (m2/s) is the water dispersion coefficient, and Df (m2/s) is the biofilm dispersion coefficient. Dw and Df are constants relating the slope of the average concentration to the fluctuating part of the flux. These constants depend on the dispersivity factor and flow rate, which can be determined by the texture and structure of the crack surface. V0Rm is the relative bioreaction, Rm (kg/m3.min) is the reaction rate of solutes in the bioreaction, w is the crack width, and d is the crack thickness (Figure 1). The model selected in this research is the crack repair method.

2.3. Biofilm Growth and Transport of Suspended Biomass

The growth of biofilm usually depends on the consumption of oxygen and nutrients. By using Equations (3) and (4), the actual consumption rates of oxygen (Ro, kg/m3) and nutrients (Rn, kg/m3) can be determined as
R n = μ Y ( ρ f ε f + ε w C b i o ) ,
R O = F × R n
where μ represents the growth rate constant, adopted from Sun et al. [2], Y is an empirical constant, ρf (kg/m3) denotes the density of biofilm, Cbio (kg/m3) shows the average concentration of suspended biomass in the concrete cracks, and F is the mass of oxygen. The growth rate constant (μ) can be calculated using Equation (5):
μ = k μ C n K n + C n C 0 K 0 + C 0
where kμ represents the substrate consumption rate coefficient, Co (kg/m3) is the concentration of oxygen, Cn (kg/m3) is the concentration of nutrients, Ko is the oxygen half-saturation coefficient, and Kn is the nutrient saturation coefficient. With the help of Equation (6), the possible transference of suspended biomass can be assessed easily. The source term for suspended biomass (Rbio) can be estimated using Equation (7), as stated by Ebigbo et al. [46].
V 0 ε w d C b i o d t = d x q C b i o + d x D w A w C b i o x + V 0 R b i o ,
R b i o = μ ε w C b i o k d e c , 1 1 + m H + 2 K p H ε w C b i o k a t t S b i o C b i o + ( k d e t , 1 + k d e t , 2 μ ) ρ f ε w ε f ε f + ε c Q K .
All expressions on the right-hand side of Equation (6) are similar to those of Equation (1). The first four terms on the right-hand side of Equation (7) show the development, attachment, detachment, and deterioration of biomass, respectively. KpH is the experimental coefficient, mH+ denotes the proton molality, katt is the attachment constant, and kdec,1 is the decay rate coefficient. Sbio is the area of biomass in the cracks, and Sbio = 0.5(width + depth)(1 − εw)2/3. l is the crack’s maximum length. kdet,1 and kdet,2 are the attachment coefficients due to the biofilm growth and water force, respectively. Q (m3/min) represents the volumetric water flow rate, and K denotes an empirical coefficient. The growth of the biofilm can be estimated using Equation (8) as
R f = μ ε f ε ρ f ( k d e c , 1 + k d e c , 2 ) max r p r e p , 0 M c ρ c 1 ε c ε w ρ f + k a t t S b i o C b i o ( k d e t , 1 + k d e t , 2 μ )   ρ f ε w ε f ε f + ε c Q K
where kdec,2 is the second decay rate coefficient [46], Mc is the molecular weight of calcite, pc (kg/m3) is the density of calcite, and rprec is the amount of calcite precipitation.

2.4. CaCO3 Precipitation and Ureolysis

The Michaelis–Menten kinetics technique has been used to study ureolysis kinetics [47]. Sun et al. [2] selected this method in a pore network model to study the ureolysis kinetics; therefore, the revised ureolysis kinetics were adopted in the current research with the help of Equation (9).
R u = k u r e a k u b ρ b ε f m u K u + m u .
In Equation (9), kurea is the activity of urease, mu represents the urea molality, and kub denotes the mass ratio of urease to biofilm. Ku is the half-saturation coefficient of urea. The comparative biogeochemical reactions are described in Equation (10) to Equation (17). The comparative reaction rates of elements (RH, RO, RC, RN, and RCa, kg/m3⋅min) are the comparative rates of a reaction at any particular location of a crack in time and are described in Sun et al.’s [2] study. They can be obtained using Equations (18)–(22).
C O ( N H 2 ) 2 + 2 H 2 O 2 N H 4 + + C O 3 2 ,
C a 2 + + C O 3 2 C a C O 3 ,
H 2 O O H + H + ,
H + + C O 3 2 H C O 3 ,
C O 2 + 2 H 2 O H + + H C O 3 ,
N H 4 + N H 3 + H + ,
C a 2 + + 2 H C O 3 C a ( H O 3 ) 2 ,
C a 2 + + O H C a O H + ,
H y d r o g e n : R H = 4 × R u ,
O x y g e n : R O = R u + 3 × r p r e c ,
C a r b o n : R C = R u + r p r e c ,
N i t r o g e n : R n = 2 × R u ,
C a l c i u m : R C a = r p r e c .
The numerous X-ray deflection observations about MICP shows that calcite is a collective mineral of calcium carbonate. Therefore, the precipitation of all calcium carbonate in the computational model was considered as calcite to decrease the quantity of estimation [2,48,49]. The equation of CaCO3 precipitation was modified considering the difficult nucleation impact on the precipitation rate (Rc, kg/m3⋅min) of calcite and the influences of solute transfer [50,51], as
R c = M c β ( k 1 a H + + k 2 a H 2 C O 3 + k 3 ) ( 1 a C a 2 + a C O 3 2 K s p ) n p S c .
In Equation (23), k1, k2, and k3 represent the coefficients of the reaction rate, a denotes the species activity, and np is an empirical property. Ksp is the calcite solubility and Sc is the specific area of calcite precipitation.

3. Crack Repair Experiments

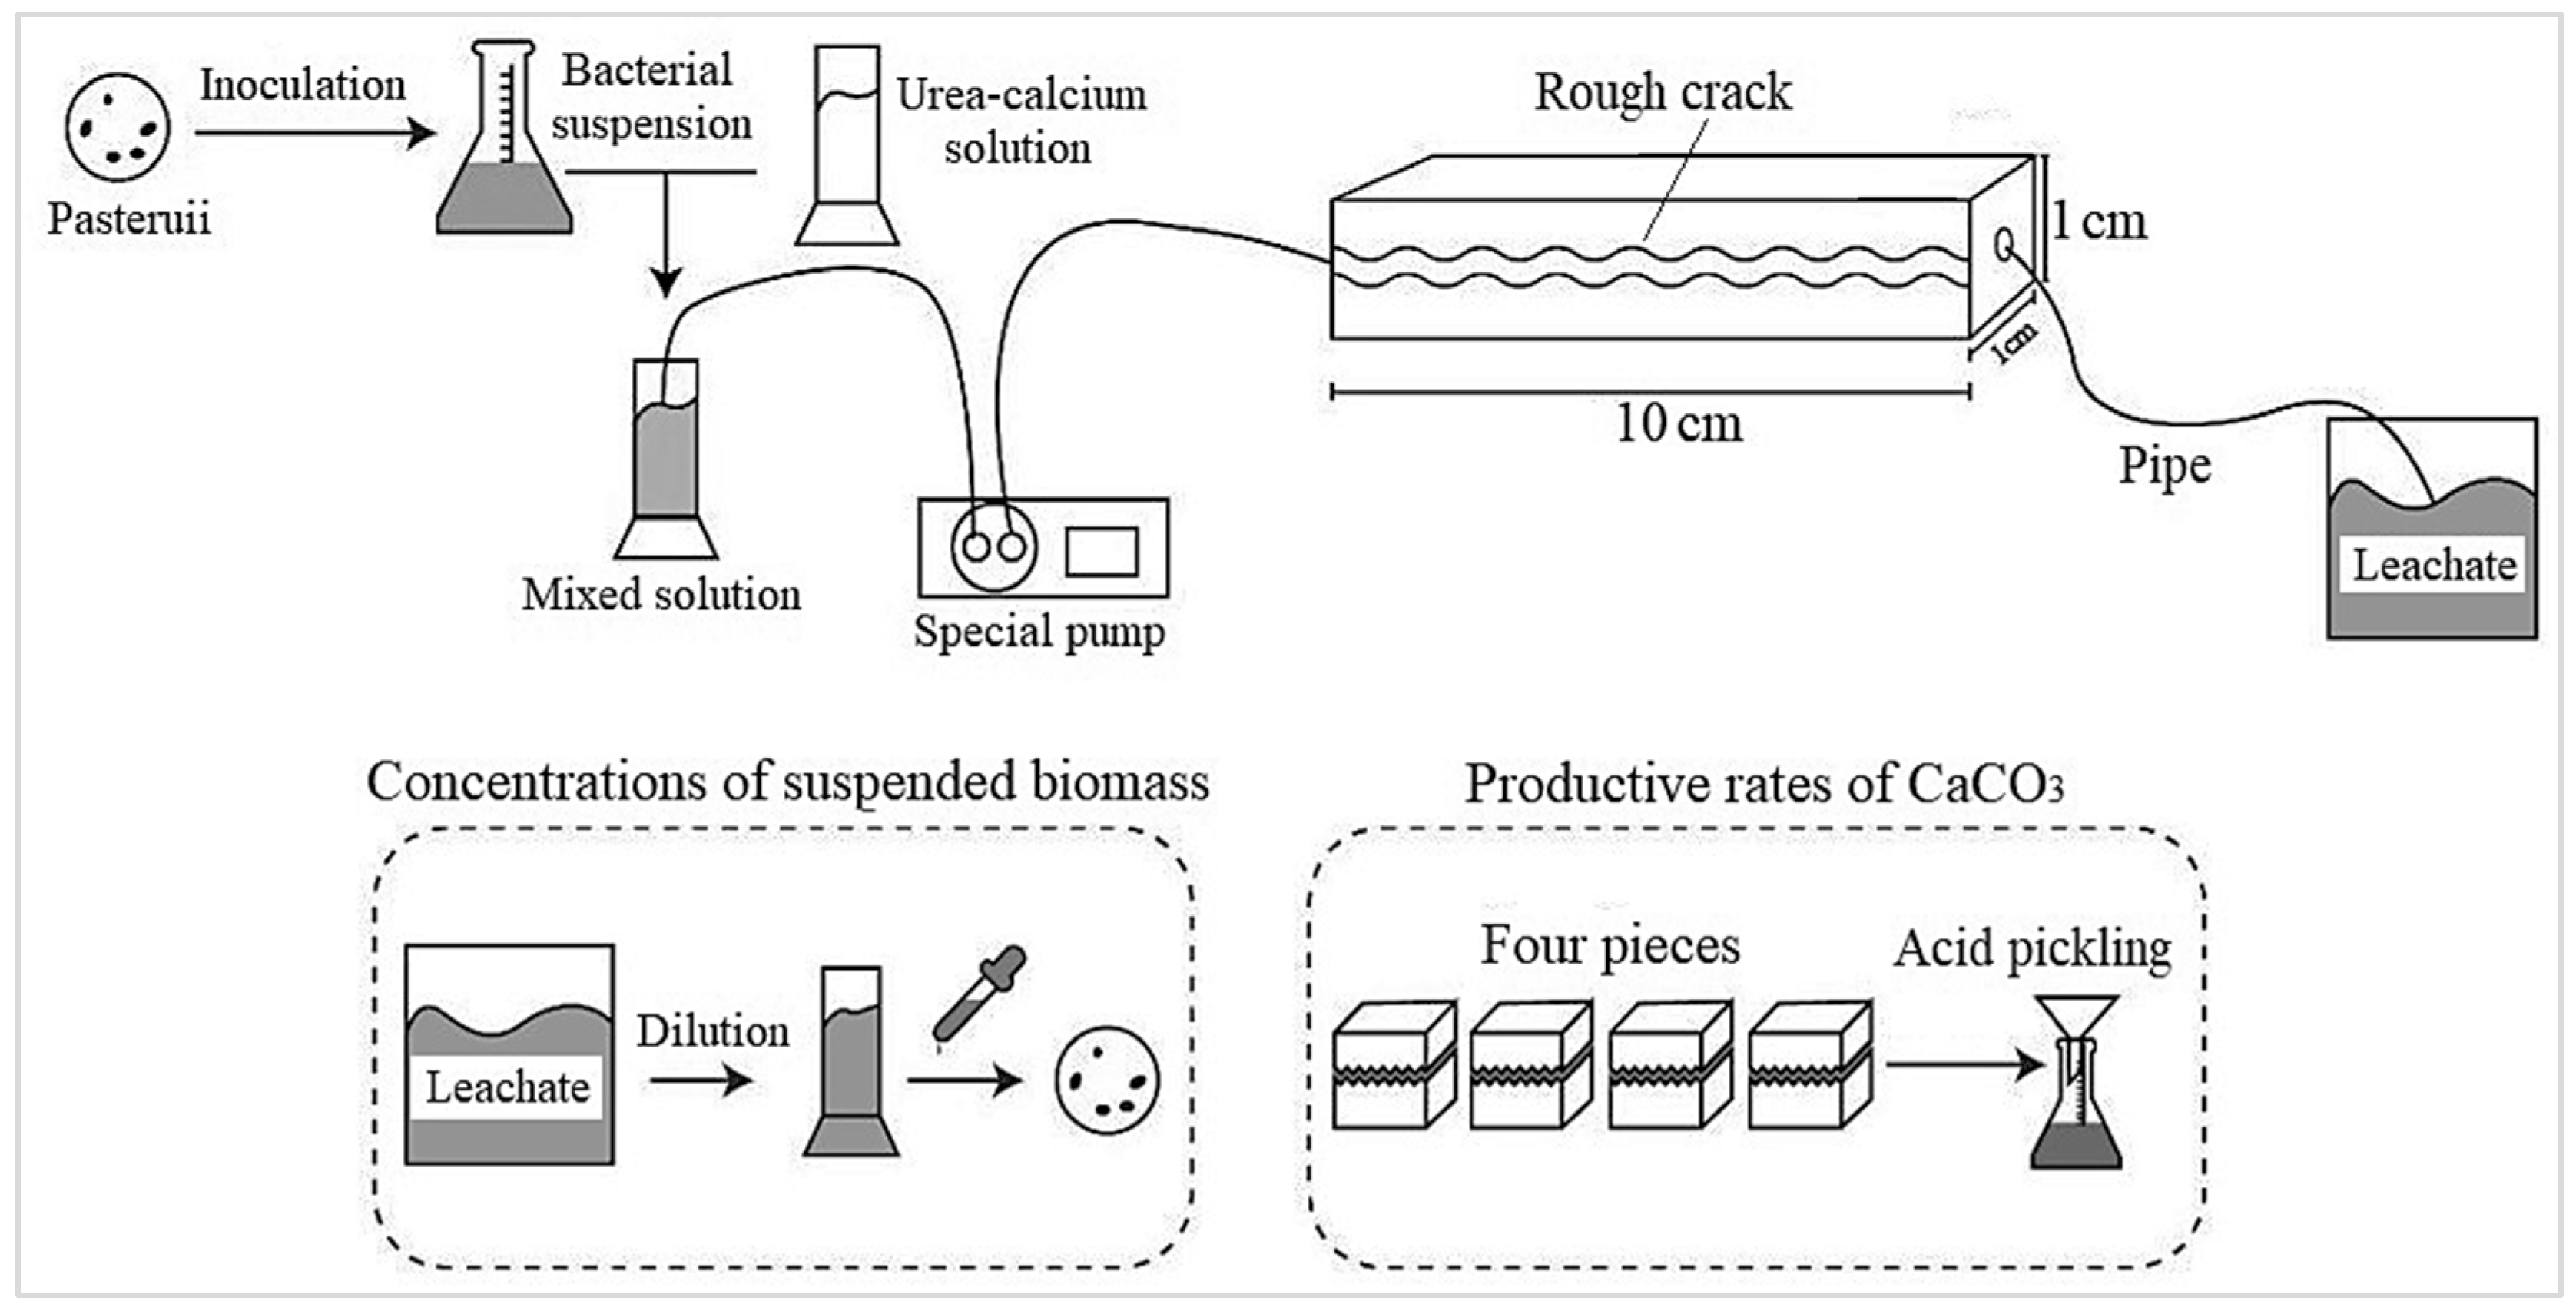
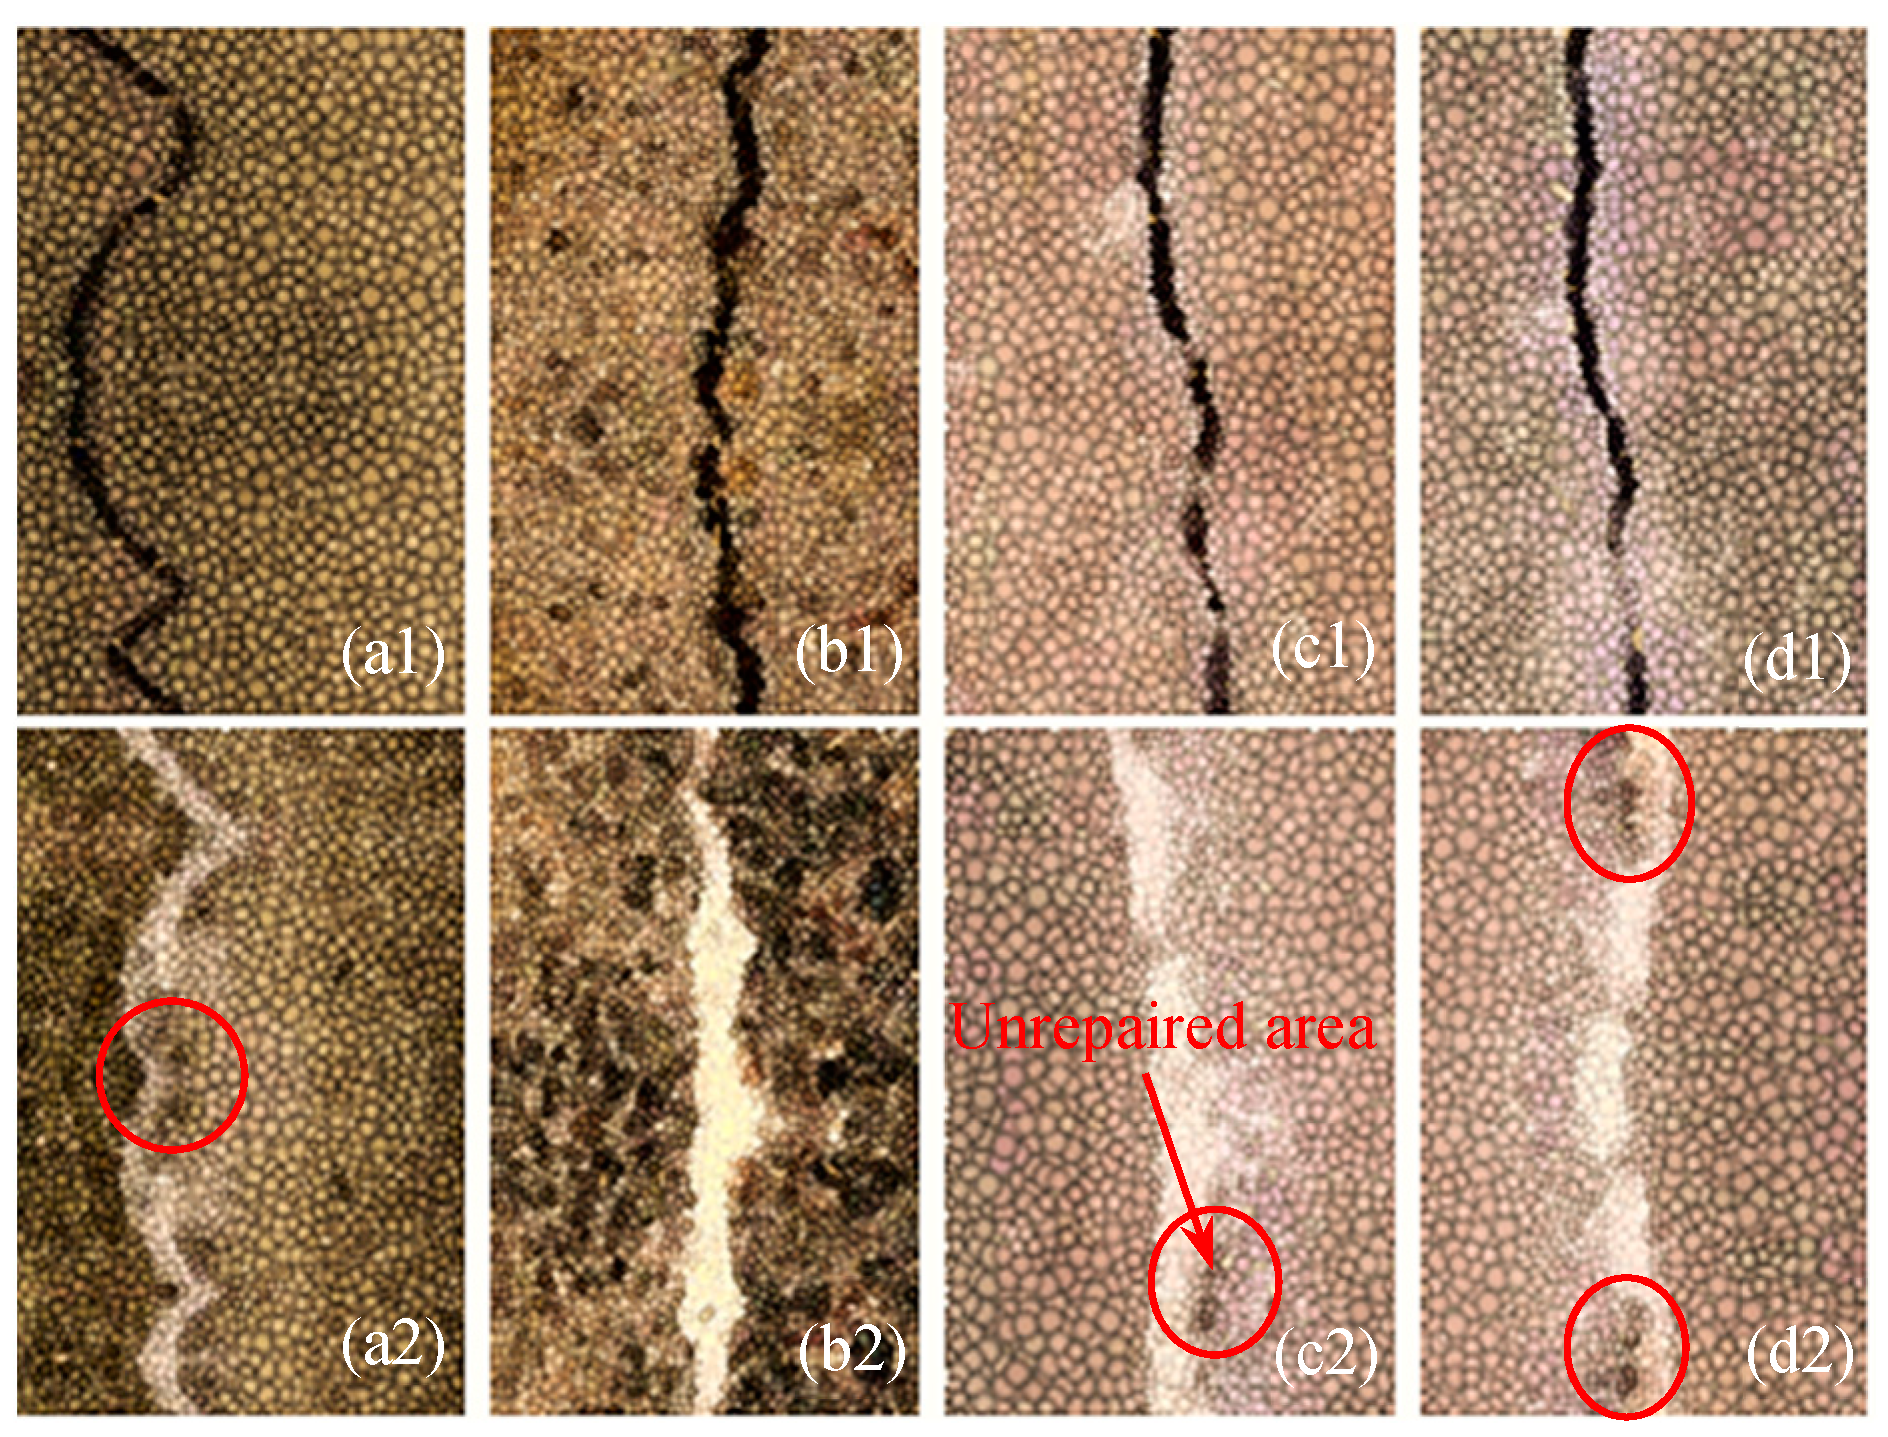
3.1. Crack Repair Using the MICP Techniques

Crack repair experiments were carried out to assess the viability and practicality of the proposed model based on the MICP technique. The calculated outcomes matched the anticipated results. The materials used to prepare concrete samples are presented in Table 1. Portland cement with P.O 43 was used. The fine aggregate was medium-sized, having a specific gravity of 2.64, modulus of fineness of 2.53, d50 of 0.45 mm, constant of uniformity Gu of 1.36, and constant of curvature Gc of 0.97. Basalt stone with a grain size (average) of 6–16 mm was selected. The dimensions (length, width, and height) of the concrete sample were 10 cm × 10 cm × 10 cm. The size and shape of all cracks were the same for easy comparison and quantification. Thus, the width (w) and length (l) of the cracks were 5 cm and 10 cm, respectively, as shown in Figure 1. The effects of these constants were ignored in this particular research because these properties are not directly related MICP technique.
Cracks were prepared using a rock joint panel and 3D printing technology. Three standard cracks with varying surface roughness were selected from the study of Barton and Choubey [52], as shown in Table 2. The crack thickness (d) was 1.0 mm. Three cracks with different roughness profiles were prepared to easily and precisely assess the repair effects. Hence, the breadth of the cracks in the developed calculated model was three times higher than the breadth of a single crack in the experiments.
The ureolytic bacterium Sporosarcina pasteurii is well known today for its capability of microbially induced calcite precipitation (MICP), representing a great potential in constructional engineering and material applications. As well, it produces the higher amount of CaCO3 than other bacteria [53]. Sporosarcina pasteurii (ATCC 11859) and ureolytic bacteria were used in the current research. These were produced on Luria Bertani medium with 10 g/L NaCl, 10 g/L polypeptone, and 16 g/L yeast extract. Initial total nitrogen (NT), initial total carbon (CT), oxygen concentration (CO), and boundary nutrient concentration (CN) were used to obtain the mathematical model. At 30 °C, cultures were incubated with vibration at 100 rpm for 48 h. After culturing, the concentration of biomass Cbio was 7.5 × 10⁻⁸ kg/m3. A carbonization process occurred as the cracks formed. Curing was applied for 28 days to complete the reaction process, and this process did not disturb the resultant repair with MICP. After curing, a special pump (hydraulically powered mortar mixer pump) was used to add the mixed cementation solution and bacterial suspension to the cracks (Figure 2). This is a multipurpose and capable pump that can mix, dump, and pump heavy and light bodied restoration mortars. It consists of a hydraulically powered 7 cubic foot horizontal shaft and a reversible rotor. Controls for the mixer, pump, and dump functions are located directly on the unit. A segregation free speed of 4 mL/min was chosen from the Association of State Highway and Transportation Officials (AASHTO) standard. The cementation solution and bacterial suspension were inserted into the cracks once a day, and the pH of the solution was maintained at 8.6. The concentrations of calcium acetate (Cca) and urea (Cu) were 20 kg/m3 and 30 kg/m3, respectively.
To prevent the sufficient retention and fast passing of the mixed solution in the concrete cracks, an instrument consisting of valves was placed underneath the concrete samples. By closing the valves, the samples were kept in contact for approximately 23.5 h. At the same time, three concrete cracks in one sample were repaired. The amounts of cementation solution and bacterial suspension were kept equal for each sample (e.g., 20 mL), which had different crack roughness profiles and similar widths (1 mm). The repair time for the concrete cracks was 21 days. The concrete samples were totally dried indoors after the tests for 48 h at a temperature of 25 °C for the subsequent experiments. Based on the experiments, appropriate values of the initial boundary conditions and final boundary conditions were selected for the suggested model.

3.2. Modified Cubic Law for Rough Cracks

In 1965, Snow [54] derived the cubic law of fluid flow in an ideal single fracture through the Navier–Stocks formula. Since then, the cubic law has become the basis for the study of fluid flow in rock mass fracture. It is shown as follows:
q = g b h 3 12 ν w J
where q is the volume of liquid passing through the smooth parallel plate; g is acceleration of gravity; bh is hydraulic width; J is hydraulic gradient in the direction of parallel plates; and vw is Kinematic viscosity coefficient of liquid.
Since ideal slab cracks do not exist in nature and all natural fracture surfaces are rough surfaces, Barton conducted a lot of tests in 1985 to consider the effect of rough fluctuation of fracture surfaces on fluid flow in rock cracks and proposed to describe fracture roughness with JRC (Joint Roughness Coefficient). Ten typical fracture contour curves are summarized, and the empirical relationship between equivalent hydraulic gap width, mechanical gap width, and JRC is proposed, and the influence of fracture roughness on flow passing capacity is considered from the perspective of JRC. The modified cubic principle has been widely applied to precisely forecast the seepage behavior and water flow in small cracks [55,56]. Considering the roughness of repaired cracks, the cubic law needs to be modified. Barton adopted an experimental method [52] and compared the relationship between a mechanical crack and an equivalent hydraulic crack to correct the joint roughness constant (JRC). In the Barton formula, the equivalent hydraulic crack is taken as the crack width:
q = 1 J R C 7.5 g b m 6 12 ν w J
where JRC is the crack roughness coefficient, and bm is Crack width, which is kept 1 mm in this paper. Equation (25) can be substituted into Equation (1) (solute transport) and Equation (6) (transport of suspended biomass).
Three particular rough cracks with the relevant roughness profiles were chosen to represent the specific JRC values as presented in Table 2. Table 2 also gives a description of the three surfaces and area of cracks (S0). The 4# crack has a rough and tectonic surface, and 6# crack has a rough and undulating surface, and 10# crack has a rough and irregular surface.

3.3. Determination of Suspended Biomass Concentrations

Monitoring of the absorbance of suspensions has been widely used to measure the concentrations and cell densities of bacterial suspensions [57,58]. In this study, the leachate was collected by opening the valve during the addition of the mixed solution. The plate colony counting technique was applied to measure the concentration (cell/mL) of viable cells in the leachate. The possible relationship between the absorbance values and viable cell count was analyzed, and the number of viable bacterial cells was assessed by considering the reliable effects of the absorbance measurement for each condition [59,60].
Equations (6)–(8) were used in the mathematical model to determine the growth of biofilm and the transport of biomass. The suspended biomass concentration significantly changed along the cracks due to biofilm growth. It is supposed that the concentrations in the leachate at the crack outlet are equal to the suspended biomass concentrations. At the crack outlet, the concentrations of biomass Cbio (kg/m3) were assessed using the developed mathematical model, which were shifted to absorbance using Equation (26). In the tests, the calculated results were compared with the estimated absorbance of the leachate to confirm the precision of the biofilm model and transport model of suspended biomass.
C b i o = m b i o × 8.59 × 10 7 × O D 600 1.3627 .
In Equation (26), mbio represents mass of the bacterial cell and it is equal to 10−15 kg.

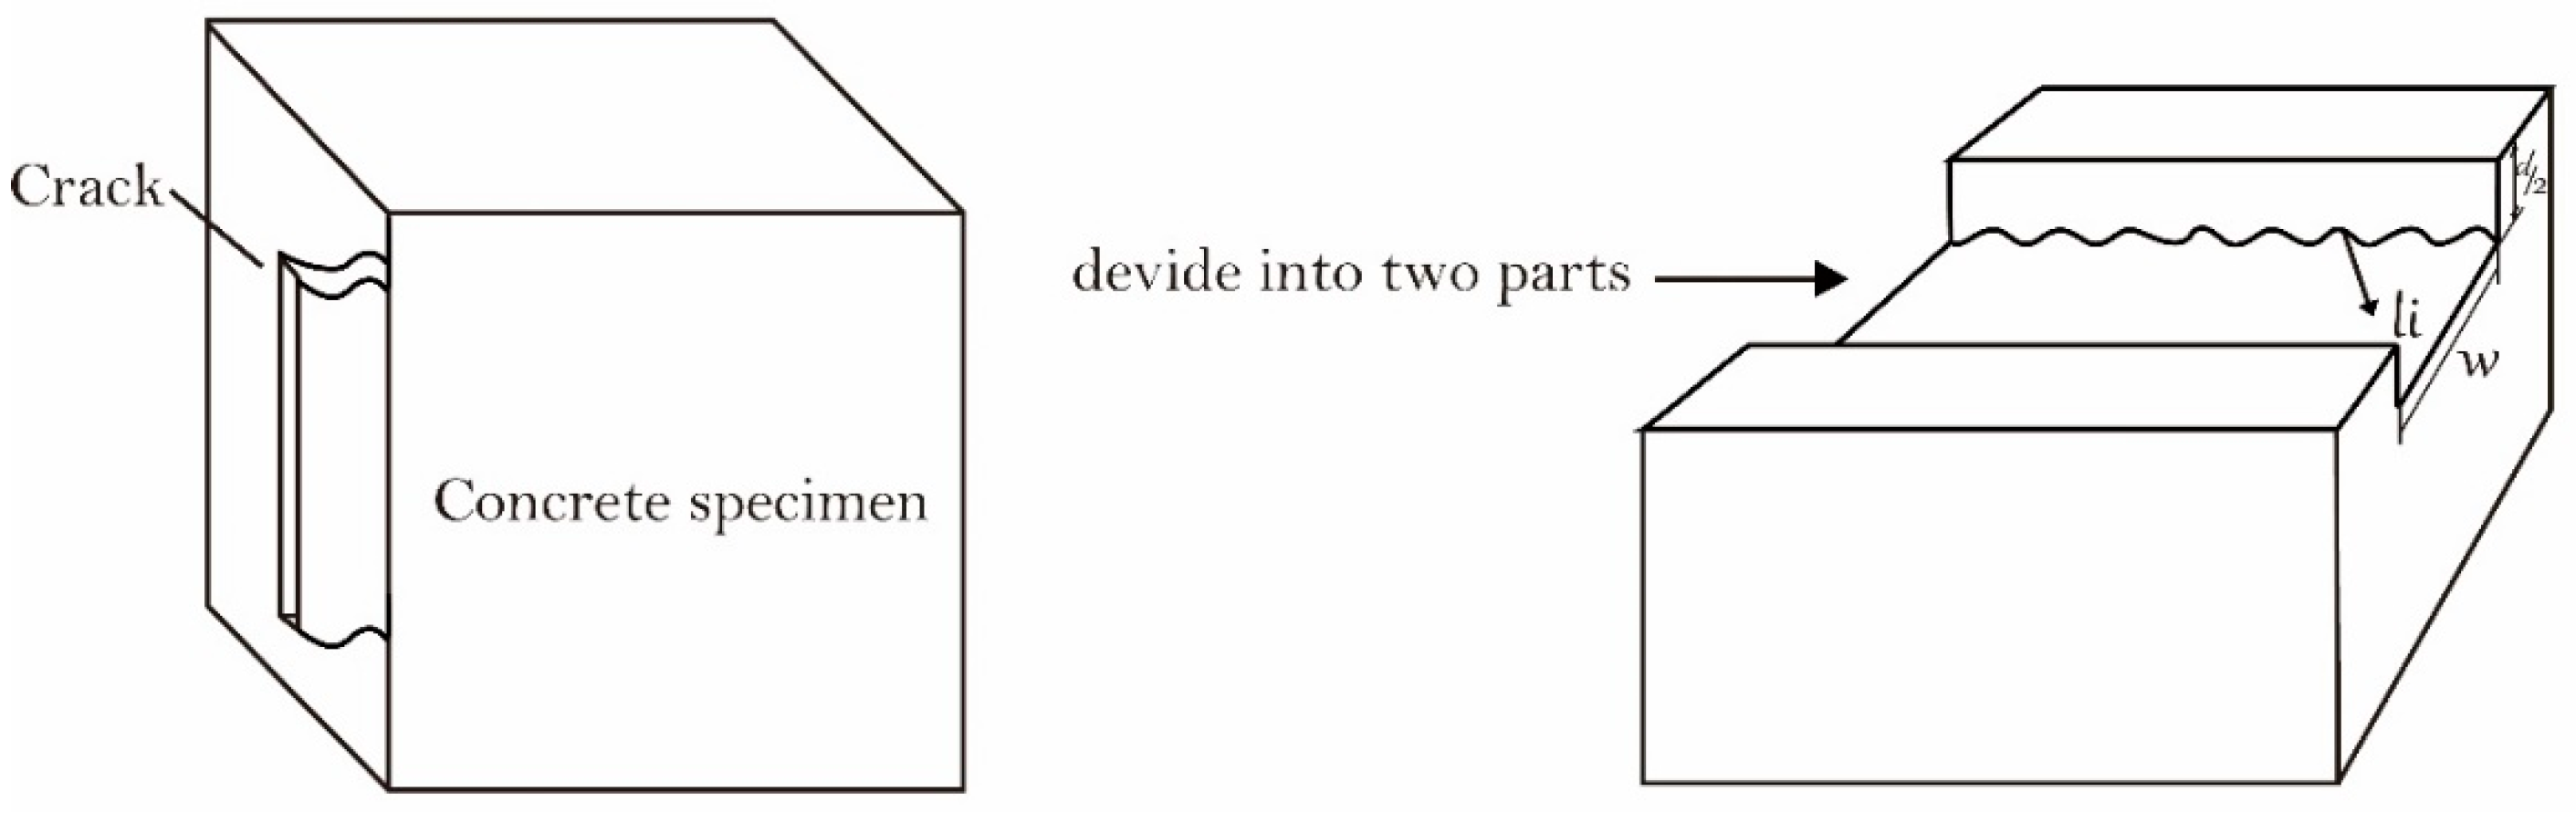
3.4. Productive Rates of CaCO3

The concrete sample was divided into four equal parts to obtain the productive rates of calcium carbonate at each measuring point. First of all, with tap water, the four pieces were washed, weighed, and desiccated. HCl (0.1 mol/L) was used to wash all samples, which were then weighed after drying. The decrease in the weight (dry weight) of the samples was used as the precipitated value of calcium carbonate. With the help of C × V × Mc, the mass of calcium carbonate was calculated, where C is the calcium ion concentration, V represents the volume of urea Ca(CH3COO)2 solution, and Mc is the molar mass of calcium carbonate (100.088 g/mol). The relation of the produced calcium carbonate to the mass of calcium carbonate shows the productive amounts of calcium carbonate.
In the mathematical model, the distribution of CaCO3 may be affected by the movement of the suspended biomass and the transport of solutes [2]. This new model was therefore used to calculate the distribution of calcium carbonate in the concrete cracks, in order to validate the practicability of the CaCO3 precipitation model, ureolysis, and solute transport model in the tests.

3.5. Sonic Time Values

A location perpendicular to the concrete cracks was adopted to determine the values of sonic time, as shown in Figure 2. Four different measuring points situated at heights of 12 mm, 36 mm, 60 mm, and 84 mm from the bottom of the samples were selected to measure sonic time. The values of sonic time (TS) can be obtained using the volume of CaCO3 (V0εc), as shown in Equation (27). The reason is that the variation in sonic speed between the unrepaired parts and repaired parts is large. The values of sonic time (TS) are given as
T S = l d v s + V 0 ε c l · v c + ( d V 0 ε c l ) / v a
where va is the sonic speed of air, vc is the sonic speed of CaCO3, and vs is the sonic speed of concrete. The value of va is equal to 340 m/s, vc is equal to 5500 m/s and vs is equal to 4800 m/s, and these values are taken from Sun et al. [2] study.

4. Results

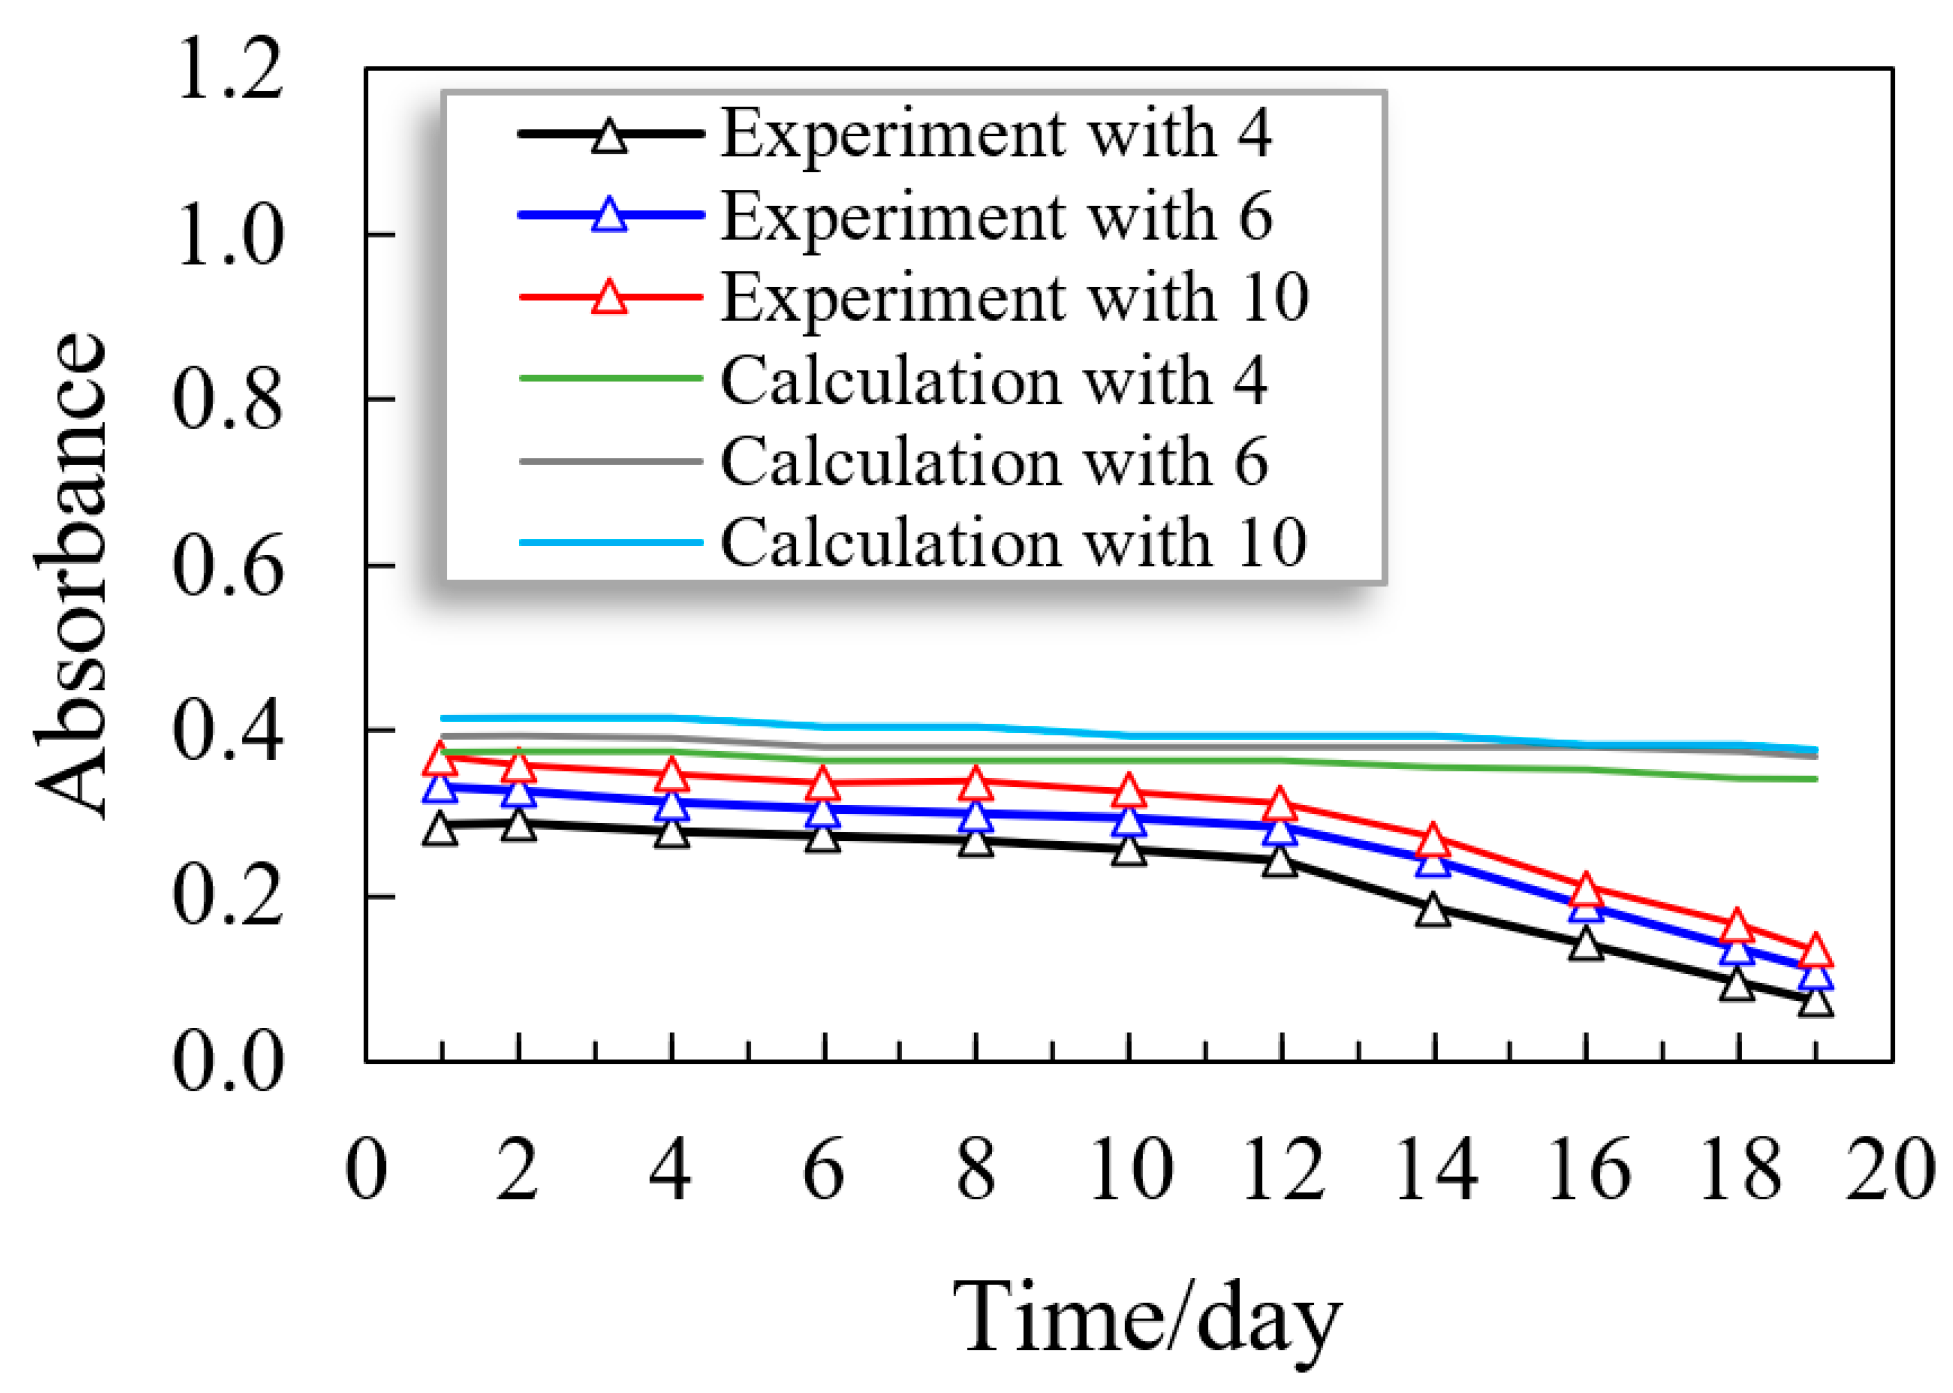
4.1. Concentrations of Suspended Biomass

The measured results and calculated values of the absorbance of the leachate are presented in Figure 3, which shows the concentrations of suspended biomass. In crack 4#, the suspended biomass concentration was always the lowest, with bacterial cells found on the surface of the crack. More bacterial cells were found in small cracks despite the nutritional contents, similar temperature, initial bacteria concentrations, and reactant concentrations.
In the tests, the suspended biomass concentration in crack 4# was about 0.285, and then after 12 days, it decreased suddenly to 0.073. The rapid drop was simply due to the rise in the efficiency of the microbial utilization of the bacterial suspension. Subsequently, the value of absorbance remained under 0.04, showing that the efficiency of microbial utilization was over 90%. This was due to the formation of a tiny film of CaCO3 inside of the crack, which further cemented the bacterial cells on the surface of the crack. In addition, a huge amount of calcium carbonate in the crack can diminish the pH of the water in the crack as well as its permeability. Sun et al. [25] reported that a reduction in pH is important for bacterial growth in concrete cracks and also leads to higher productivities of microbial utilization. The suspended biomass concentration did not show a unique decline with respect to the calculated results, which is not in agreement with the experimental results. The precipitation of calcium carbonate, biofilm growth, and attachment of biomass affect the suspended biomass concentrations in the proposed mathematical model.
For the sample with crack 6#, the suspended biomass concentration was very similar to that of the sample with crack 4#. Furthermore, the suspended biomass concentration reduced slowly from 0.333 to 0.109. The suspended biomass concentration also showed a rapid decline in the tests after 12 days, as shown in Figure 3. For the sample with crack 10#, the suspended biomass concentration was comparatively larger at the start (Figure 3). The efficiency of microbial utilization of crack 10# was lower compared to that of cracks 4# and 6#. This was due to it being a rougher crack, which is problematic for bacterial cells when attaching to the surface of a concrete crack. By increasing the repair time, the suspended biomass concentration decreased in the suggested mathematical model. Its decreasing trend curve was almost the same as that of cracks 4# and 6#, which show that the declining limits were smaller between the 1st day and 21st day (Figure 3). The initial experimental value of absorbance was 0.368 for the sample with crack 10#, which was lower than the calculated value (0.415), as can be observed in Figure 3. This was due to the greater roughness of the crack surface in the tests, which created problems for the bacteria when first adhering on the inner side of the cracks, and many bacteria also dispersed into the leachate. The precipitation of calcium carbonate would further strengthen bacterial cells on the surface of a concrete crack during repair, but this aspect was ignored in the theoretical model. For that reason, as compared to the calculated findings, the diminishing trend of the experimental outcomes was higher, as clearly presented in Figure 3. On the other hand, the final experimental results were very similar to the estimated values. The experimental values revealed that the transport behavior of the biomass is feasible and precise.

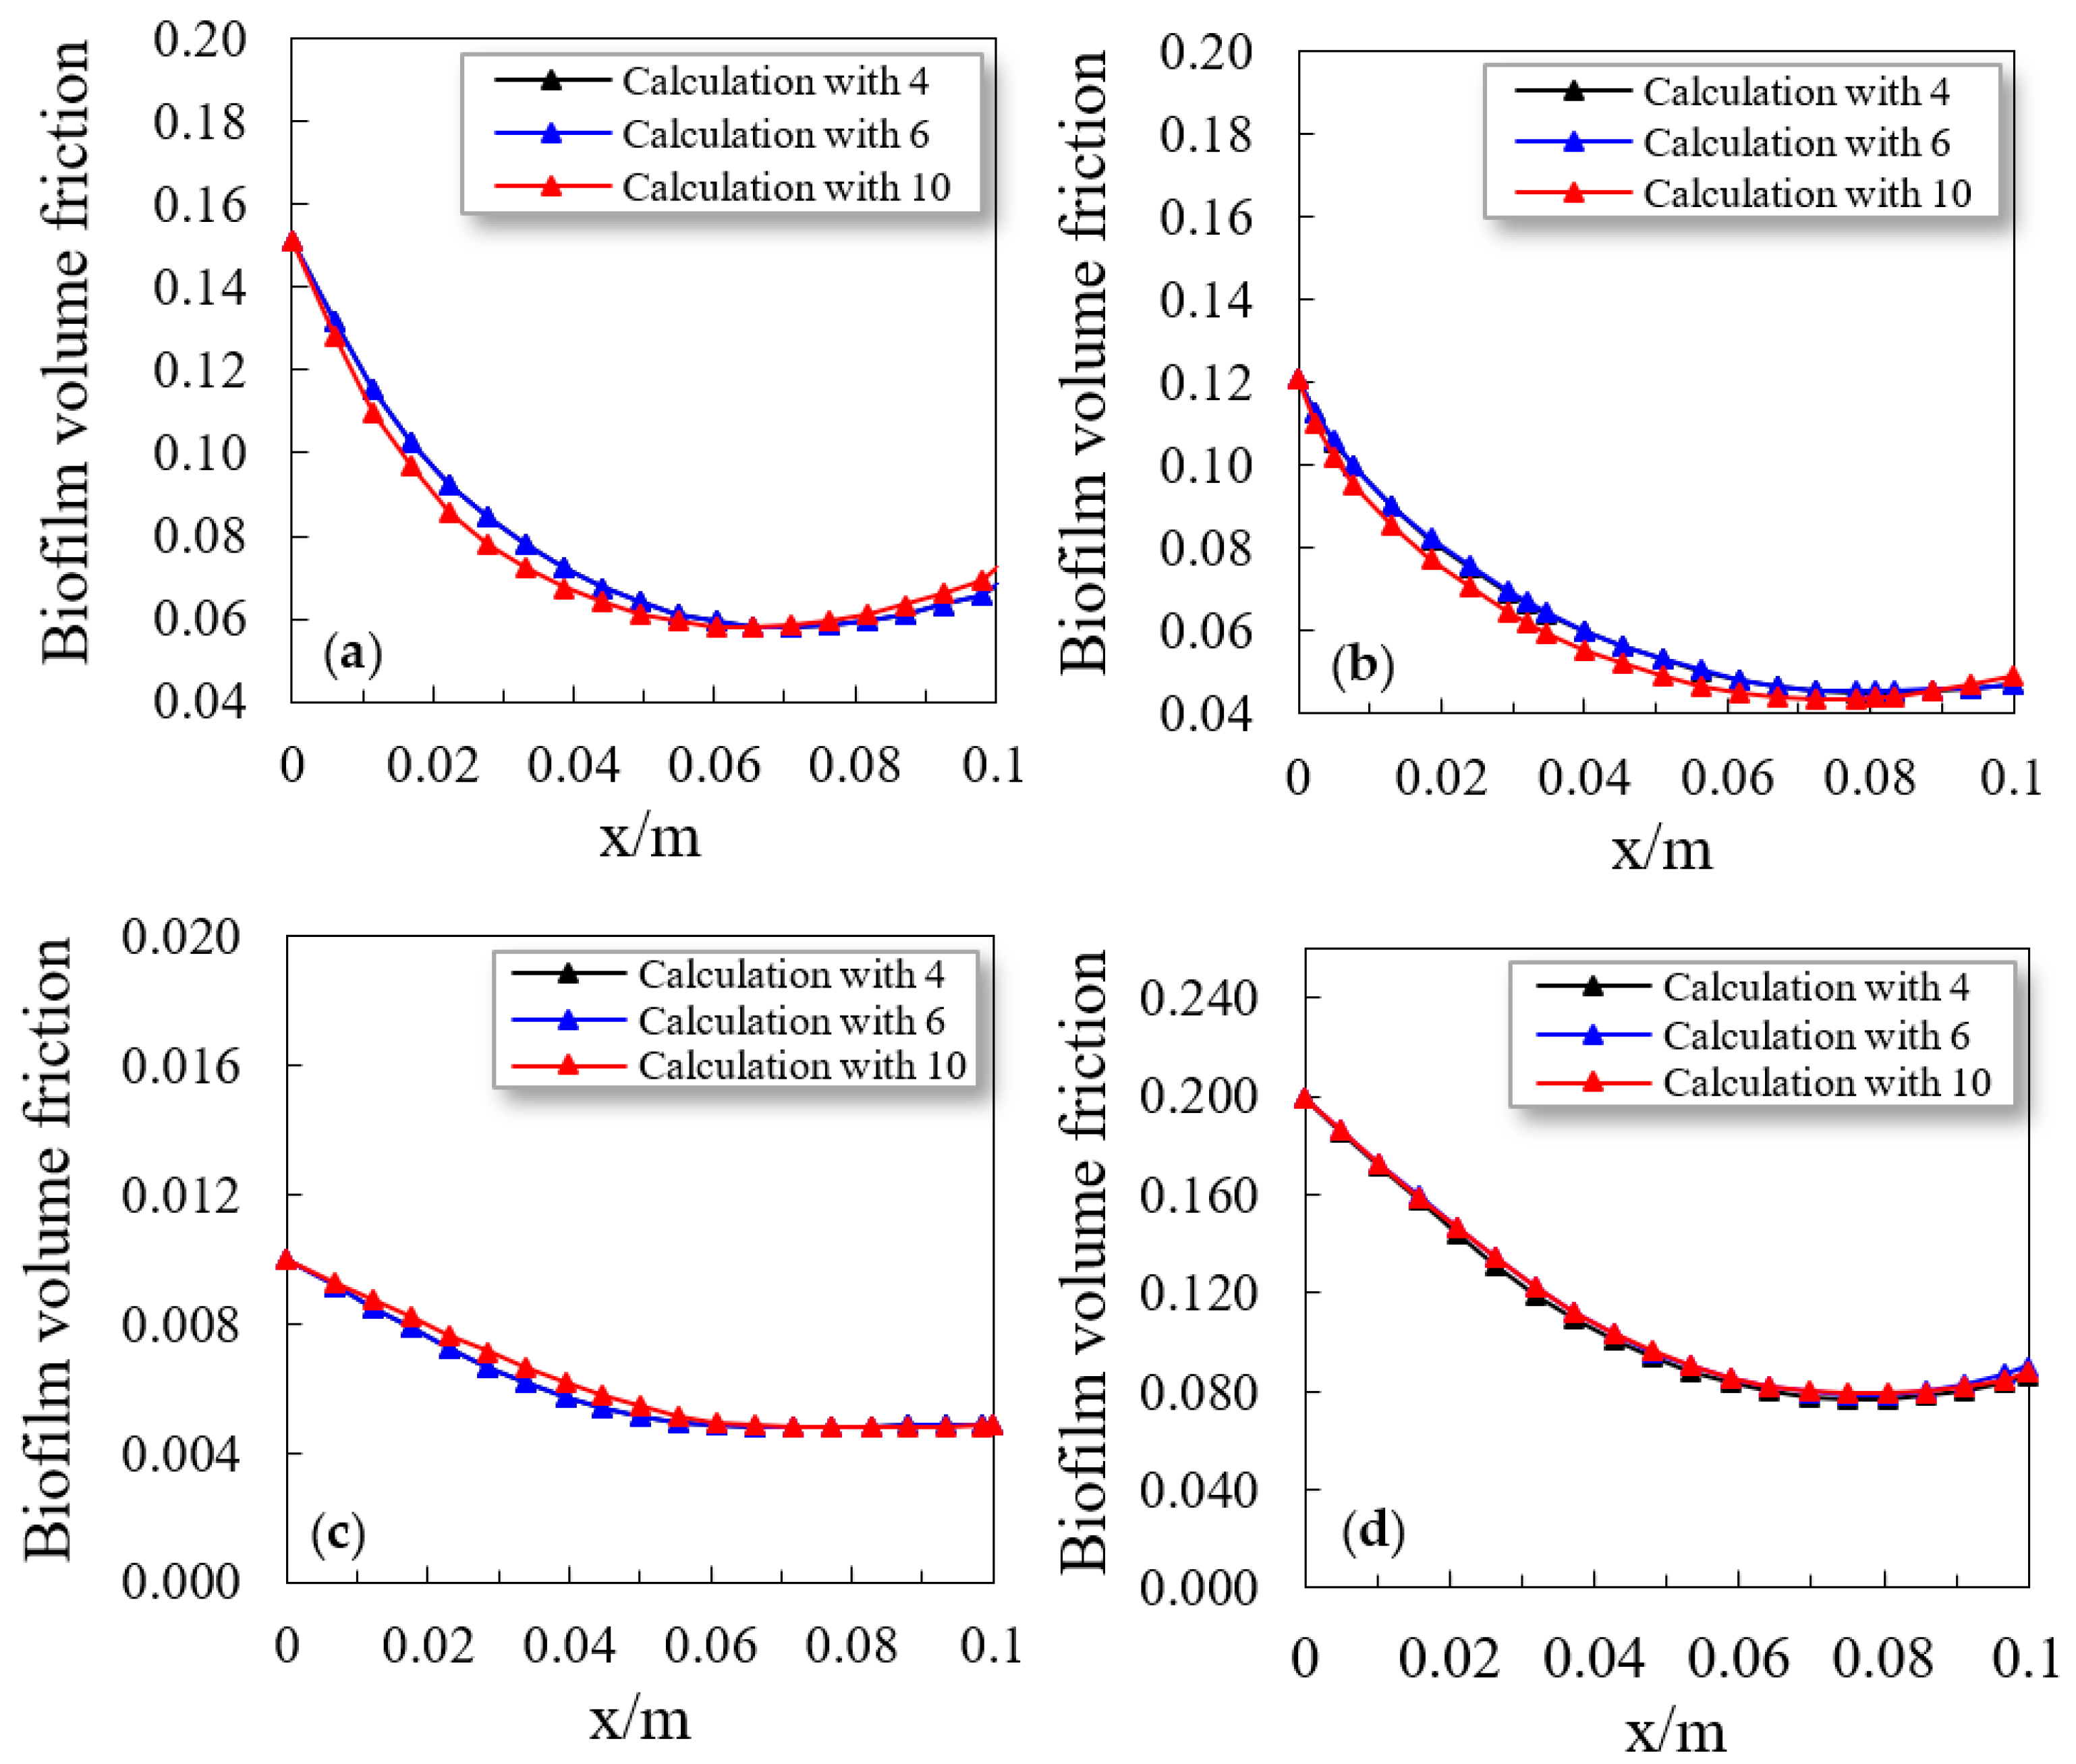
4.2. Biofilm Evolution

Biofilm produces CaCO3 and gradually grows with adequate oxygen and nutrients. Despite the different crack surface roughness profiles, the biofilm volume fractions increased during repair (Figure 4). Across the various crack roughness profiles, the biofilm volume fractions were smaller for all the samples after one day. The dissimilarity between them was very small, as presented in Figure 4a. Therefore, the detachment of the biofilm depends on the local velocity gradient and shear stress. A smaller gradient of local velocity causes a higher growth rate of biofilm, more bacterial cells, and a weaker influence of detachment on smaller cracks. Thus, the biofilm volume fractions in cracks 4# and 6# were slightly higher after seven days (Figure 4b). By decreasing the distance from the crack inlet, the biofilm volume fractions increased. This is merely due to the lower concentrations of biomass at the outlet of cracks as compared to the inlet, which is due to diffusion and convection. Additionally, the variation in the values of the biofilm volume fractions between samples with dissimilar crack roughness profiles was large. Figure 4c clearly shows that the decrease in the biofilm volume fractions in samples 4#, 6#, and 10# was smaller than that in the other three cases from seven to fourteen days. However, the decrease in the biofilm volume fractions for the smoother cracks (e.g., 4# and 6#) was more apparent after increasing the distance from the crack inlet.
After 21 days, the biofilm volume fractions were smaller in the samples with cracks 4# and 6#. Similarly, a clear increase in the volume of the biofilm fractions was observed after increasing the crack surface roughness and decreasing the distance from the inlet. Additionally, due to the boundary conditions, there was an obvious recovery at the crack outlet in the proposed mathematical model (Figure 4d). As compared to the 14th day and 7th day, the recovery was clearer on the 21st day.
The biofilm content cannot be measured straightforwardly, and there is a considerable shortage of harmony among the variety of methods adopted to study and grow biofilms [61,62]. The formation of biofilm was not investigated in the experiment. However, the growth of biofilm affected the precipitation of CaCO3 and suspended biomass concentrations in the proposed model. The comparison of the productive rates of CaCO3 and the suspended biomass concentrations between the experimental and calculated outcomes indirectly confirmed the accuracy of the biofilm model and the existence of a biofilm.

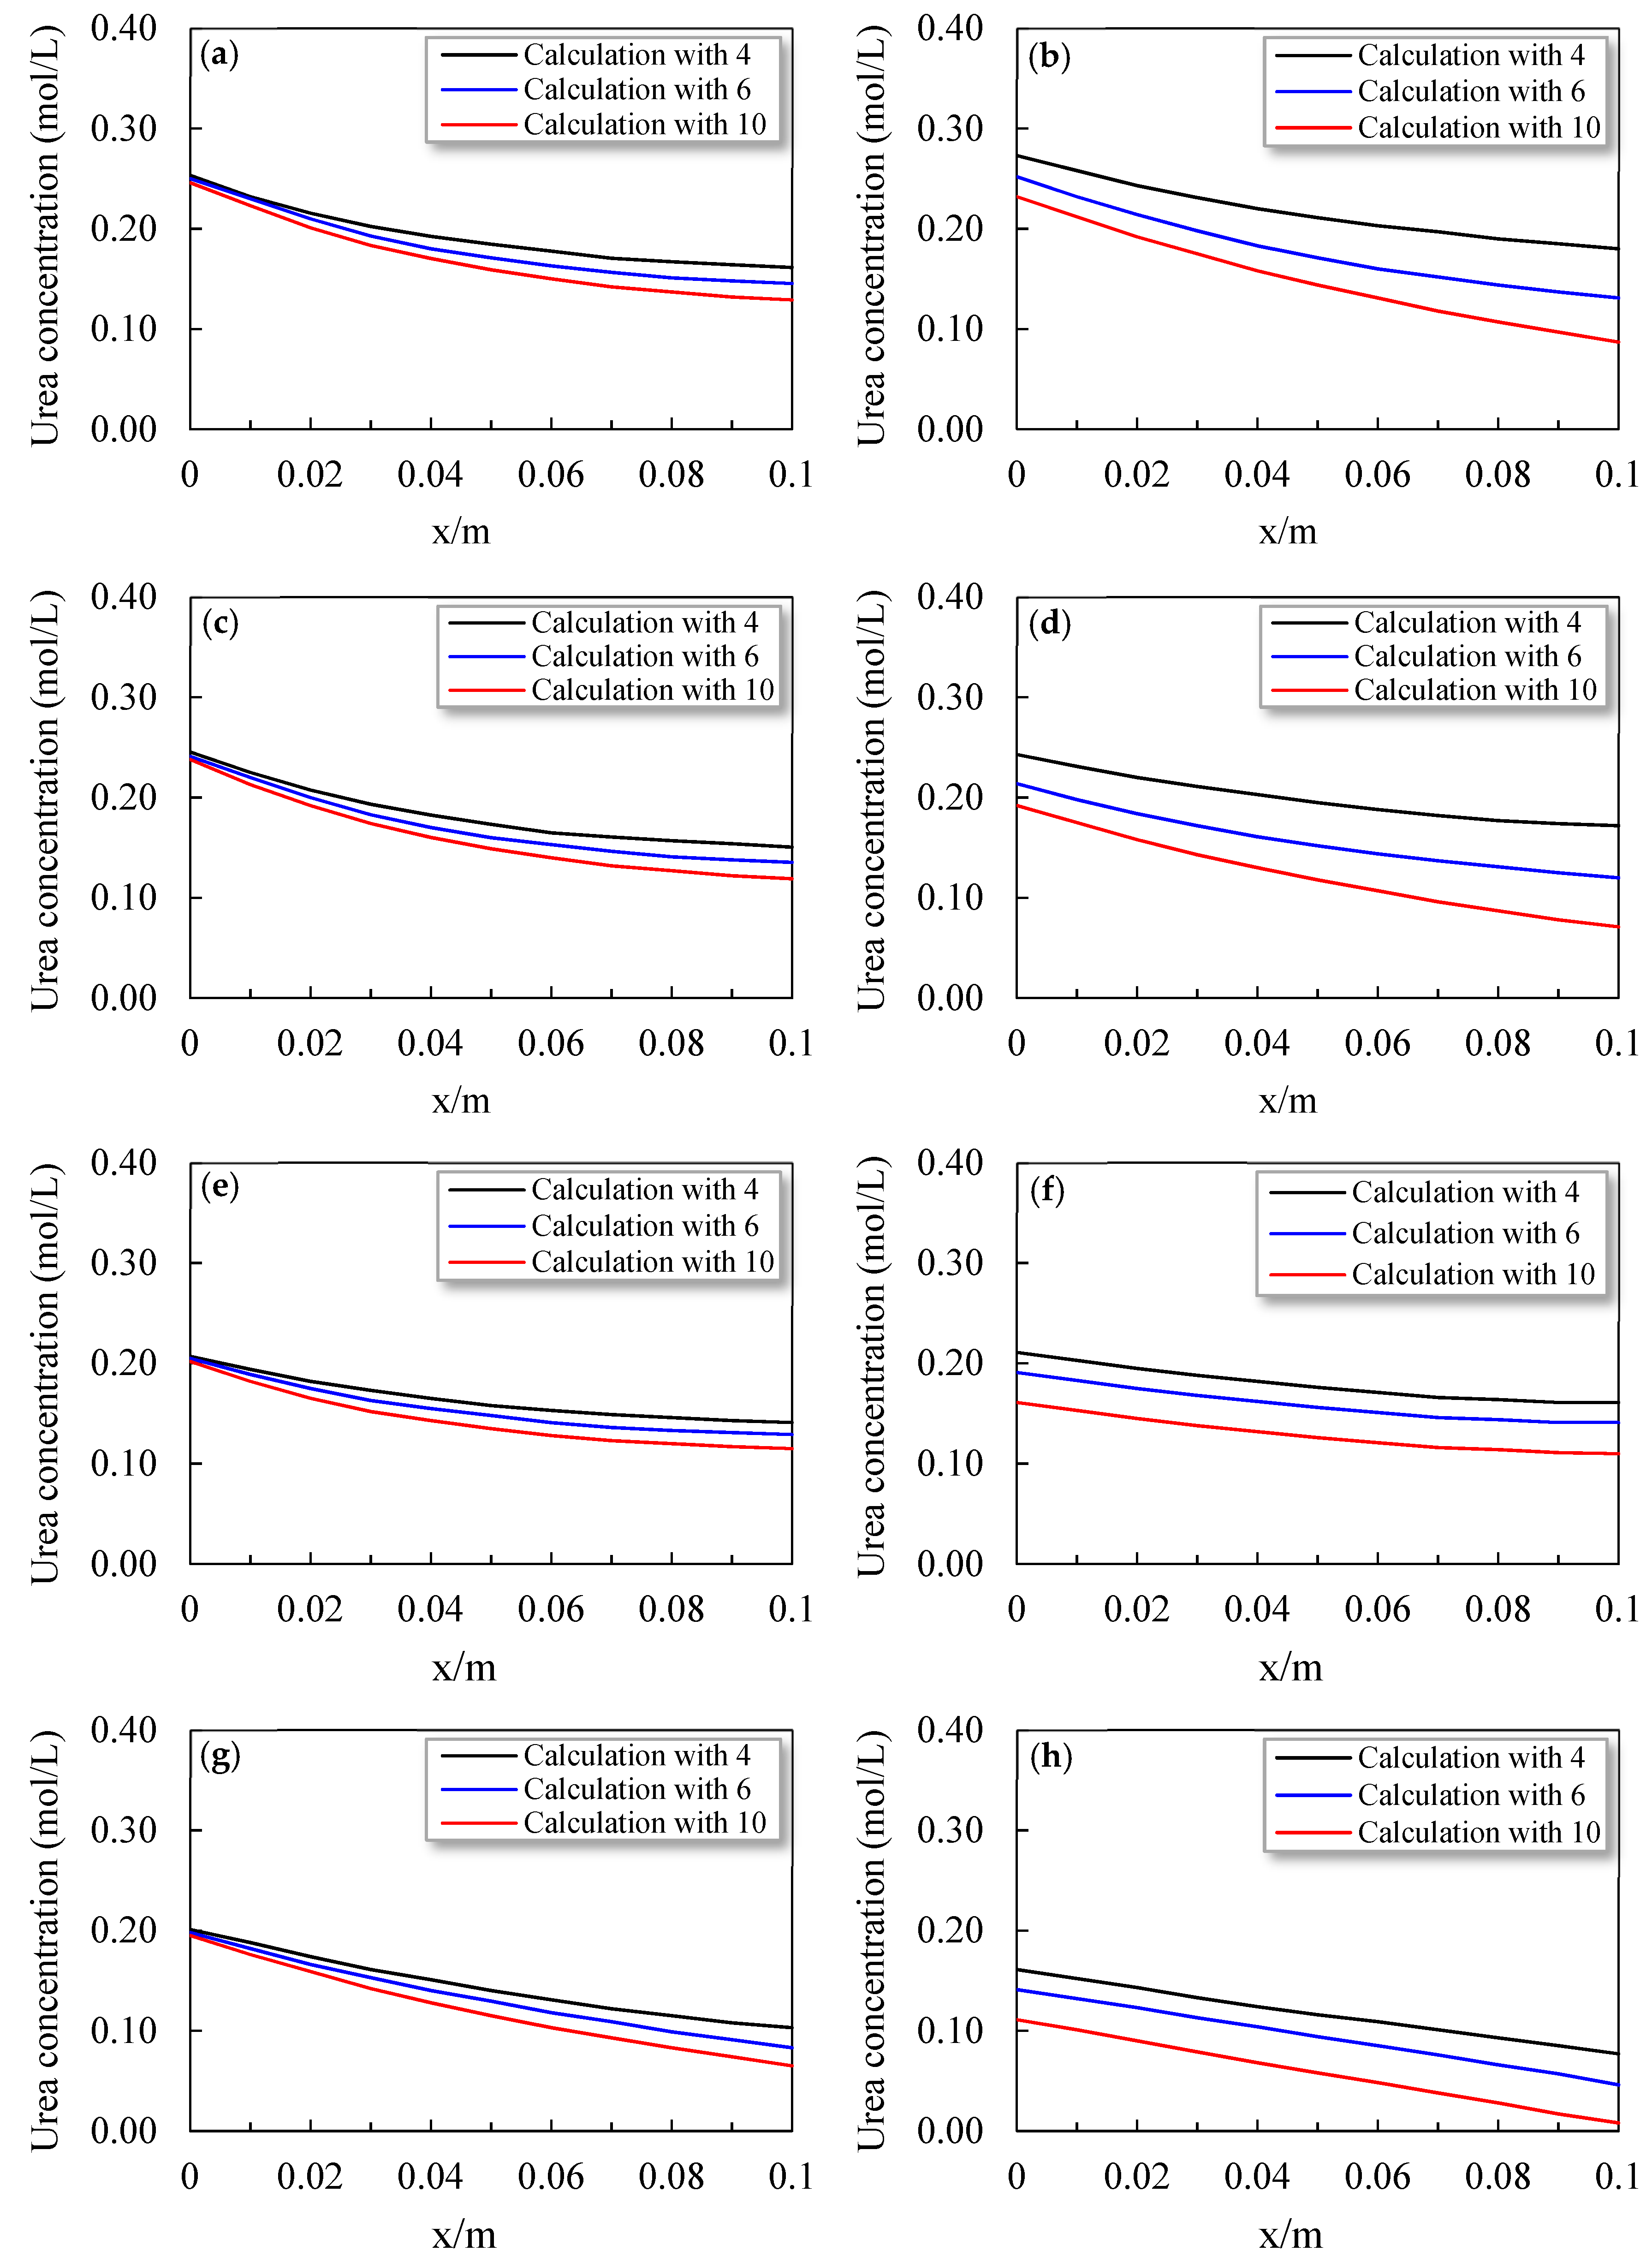
4.3. Concentrations of Solutes

The urea concentrations (kg/m3) and changes in initial concentrations were calculated with the crack location after the daily cycle, as shown in Figure 5. The distribution of the urea concentrations was the same as that of the calcium ion concentrations. According to Figure 5a, as the distance from the inlet increased, the initial concentrations of urea decreased after injection considering the dispersion of solutes and advection. In addition, the pressure change between the outlet and inlet was higher for cracks 4# and 6# due to the greater influences of the dispersive and advective fluxes.
Therefore, the initial concentrations of urea were low at the crack outlet. The concentrations of urea decreased remarkably after the 24 h of reaction due to the consumption for CaCO3 production (Figure 5b). The concentrations of urea continuously decreased with the increase in distance from the inlet. However, the decrease in the urea concentration was higher at the crack inlet as compared to the crack outlet. At the inlet, the consumed volume of urea was higher as compared to that at the crack outlet. This was due to the biomass concentrations being larger at the crack inlet, which utilized more urea to produce calcium carbonate, and the transportation of urea towards the location with a lower concentration because of the dispersive function. Due to the stronger dispersive function, the dissimilarity in urea concentrations for crack 10# between the crack outlet and inlet after the daily cycle was lower.
The initial concentrations of urea became smaller and smaller at the outlet (Figure 5c,e,g). This was merely because the precipitated CaCO3 and attached biomass blocked the movement of solutes, finally causing a reduction in urea concentrations at the crack outlet. At the outlet, the initial urea concentrations for the smoother concrete cracks were low. The consumed volume of urea increased after the daily cycle as the repair time increased. Hence, after the daily cycle, the concentrations of urea slowly decreased as compared to the first day (Figure 5d,f,h). Furthermore, the dissimilarity in urea concentrations for the rougher crack (10#) increased between the outlet and inlet. The reason is that the precipitated CaCO3 and attached biomass slowed down the solute dispersion process in the reaction stage. In the meantime, the consumed amounts of urea increased the volume of the biofilm fractions at the outlet. In addition, the increases in the biomass attached to crack 10# and urea caused a difference in the urea concentrations after the daily cycle. Figure 5h shows that the urea around the crack outlet was completely consumed for cracks with a smoother roughness profile (e.g., 4# and 6#) after the daily cycle, which was not the case for crack 10#. These results were due to the lower concentrations of urea and larger volume of the biofilm fractions at the outlet of concrete cracks 4# and 6#. These findings were in line with the outcomes from the analysis of the biofilm (Figure 4d).

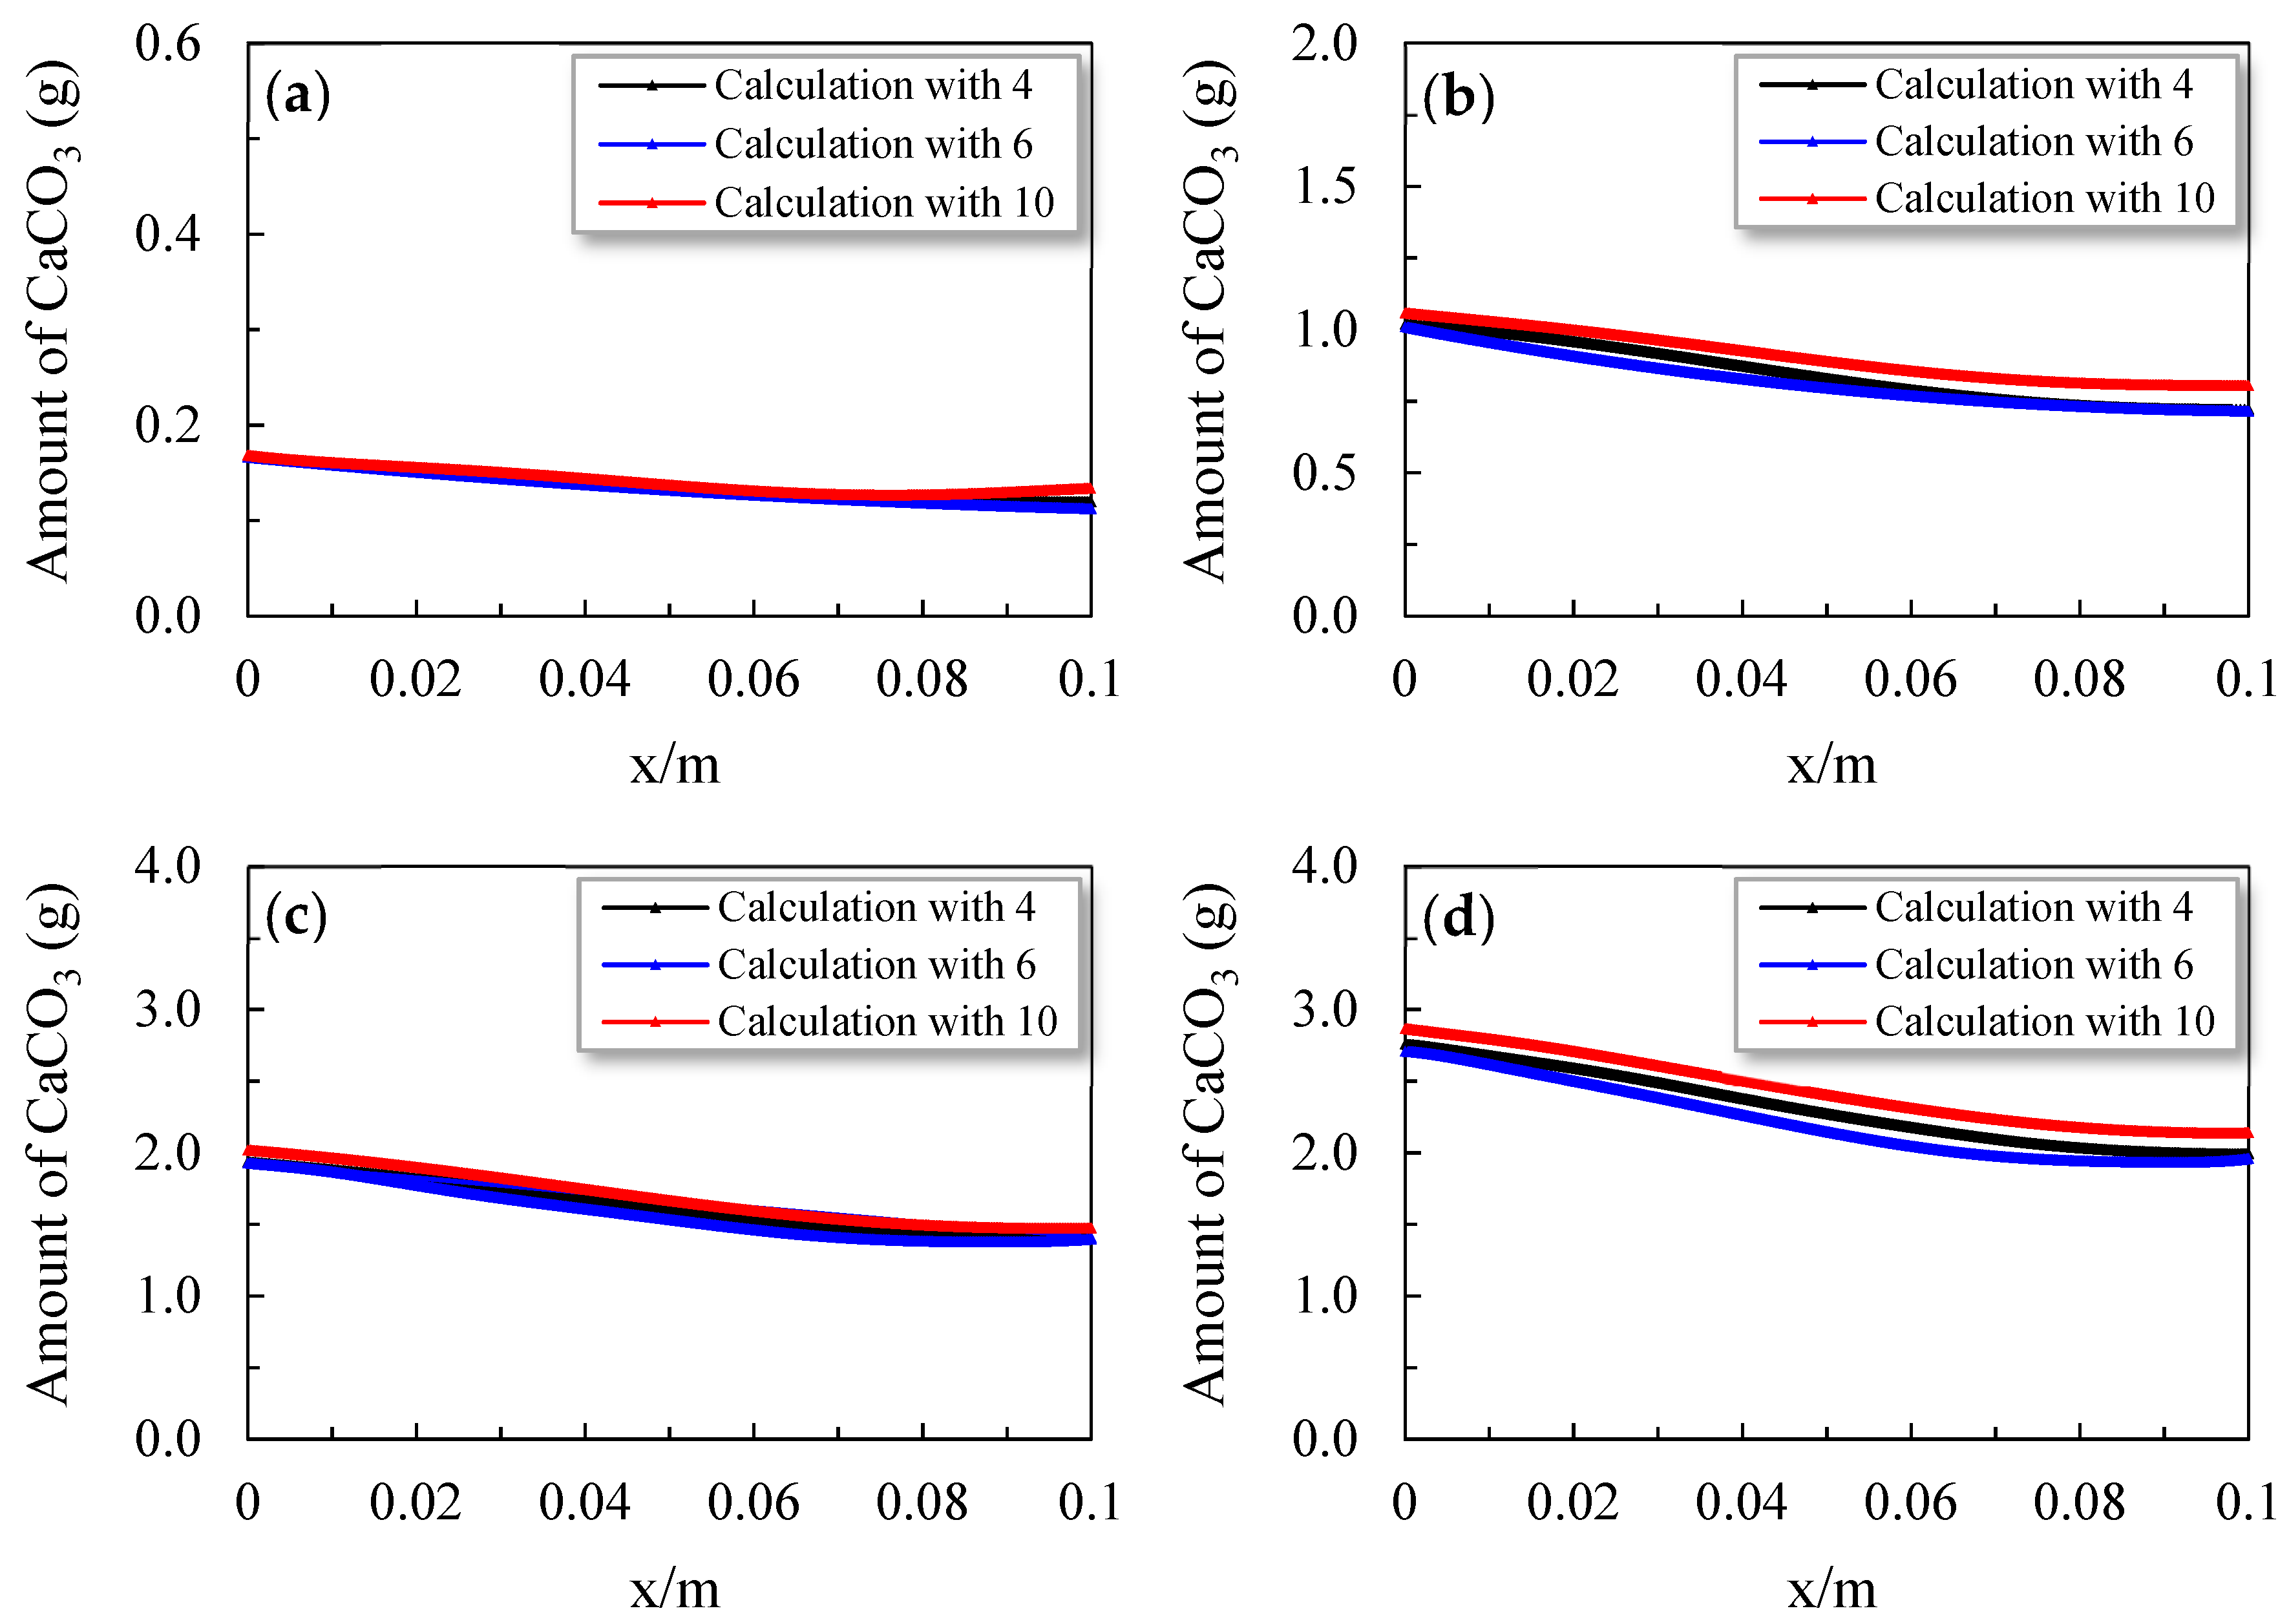
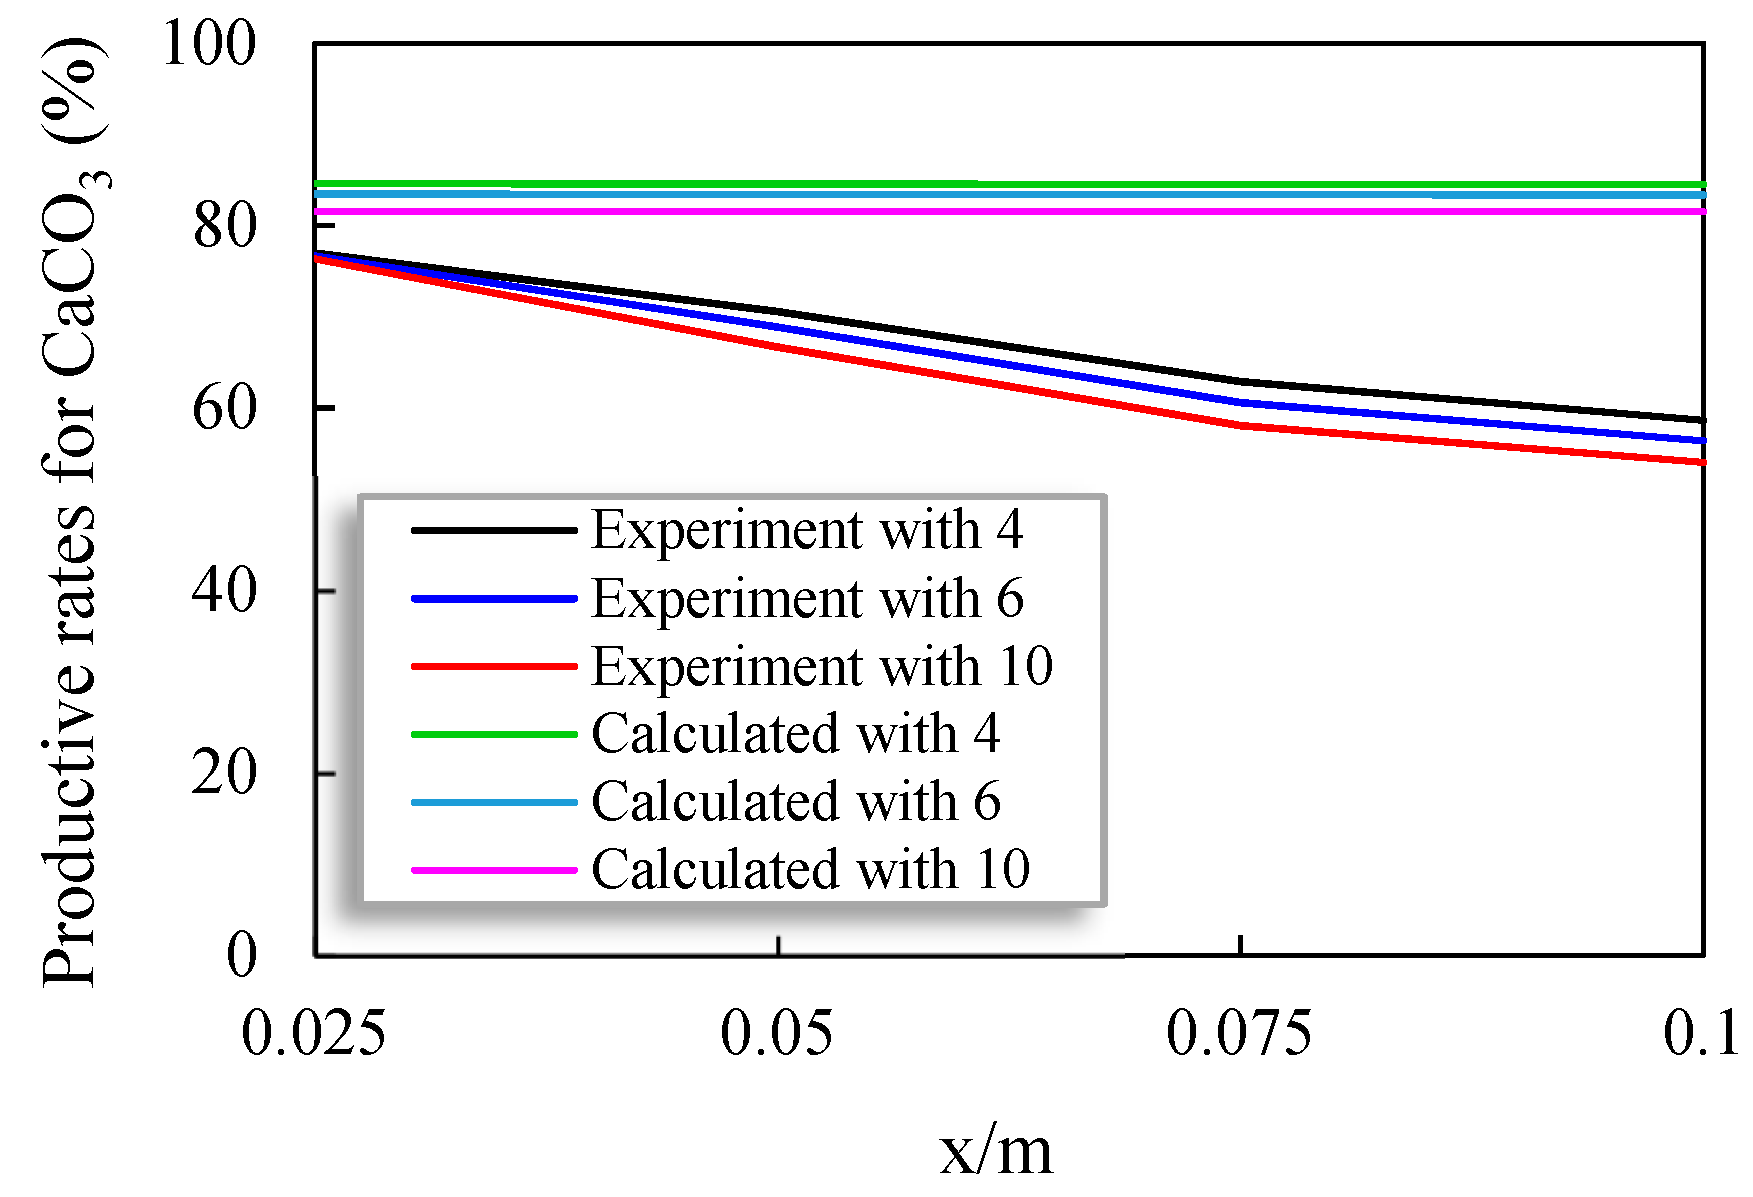
4.4. Productive Rates of CaCO3

Acid could also be used to degrade the levels of cement slurry, meaning that the outcomes could be misinterpreted. However, the use of HCl in concrete is an acceptable technique to quantify CaCO3 produced through MICP [2,23,24]. Thus, the acid pickling technique was utilized for comparison in the current research. The fluctuations in the values of CaCO3 in the rough concrete cracks at the time of the MICP repair test are presented in Figure 6. The values of CaCO3 were reasonably lower after 24 h due to the smaller volume of the biofilm fractions (Figure 6a). According to Figure 6b–d, CaCO3 increased notably as the repair time increased, and the amount of increase was different at the different crack locations. The amounts of CaCO3 increased more rapidly at the inlet and were affected by the volume fractions of the biofilm and distribution of reactants. It was further observed that as the surface roughness of the concrete crack decreased, the bacterial suspension and the contents of the cementation solution decreased with the same amounts (Table 3). Hence, the volumes of CaCO3 in cracks 4# and 6# were smaller than the volume of CaCO3 in crack 10#, as displayed in Figure 6d. However, the CaCO3 productive rates were lower for concrete crack 10# due to the small efficiencies of microbial utilization.
The distribution of the CaCO3 productive rates after the 21-day repair is clearly displayed in Figure 7. By increasing the distance from the crack inlet, the productive rates of CaCO3 decreased (Figure 7). Additionally, the productive rates of CaCO3 were lower for crack 10#; however, the amount of decrease was also higher. Due to the boundary conditions, there was also a revival at the crack outlet, which was not in line with the experimental results. The productive rates of CaCO3 were obtained in four parts of the cracks in the tests. Correspondingly, the productive rates of calcium carbonate were larger in the upper part of the cracks as compared to the lower part. The productive rate of CaCO3 with the proposed model was 95% at the inlet of crack 4#, which was greater than the experimental result due to the ideal calculation conditions. At the outlet, the calculated CaCO3 amount was about 72% for crack 4# (Table 3). From Table 3, the average productive rates of CaCO3 were 72%, 73%, and 79% for the samples with rough cracks 4#, 6#, and 10#, respectively. More bacterial cells remained in the case of cracks 4# and 6#; therefore, the typical productive rates of calcium carbonate were increased by reducing the roughness of the cracks. The experimental average productive rates of CaCO3 were similar to the calculated results for cracks 4# and 6#, indicating the effectiveness and feasibility of the new model. The consonance between the calculated curves and measured rates of CaCO3 was also greater. It could be suggested that the new mathematical model is more operative for small cracks. As compared to the experimental results, the average productive rates of CaCO3 were higher in the sample with crack 10# (Table 3). This was due to the greater roughness of the crack, which created problems for bacteria when adhering to its surface, finally resulting in a reduction in consumed urea, with lower productivity of CaCO3 and smaller concentrations of biomass than in the calculated results.
Good repair effects are defined at more than 70% productive rates of CaCO3. The cracks with less rough surface could be repaired by microbially induced calcium carbonate precipitation technique during the 21-day repair time. However, in the tests, the measured outcomes were similar to the distribution range of calcium carbonate for 10# cracks. The dissimilarity between the experimental and calculated results was quite small, which shows the effectiveness of the mathematical model.

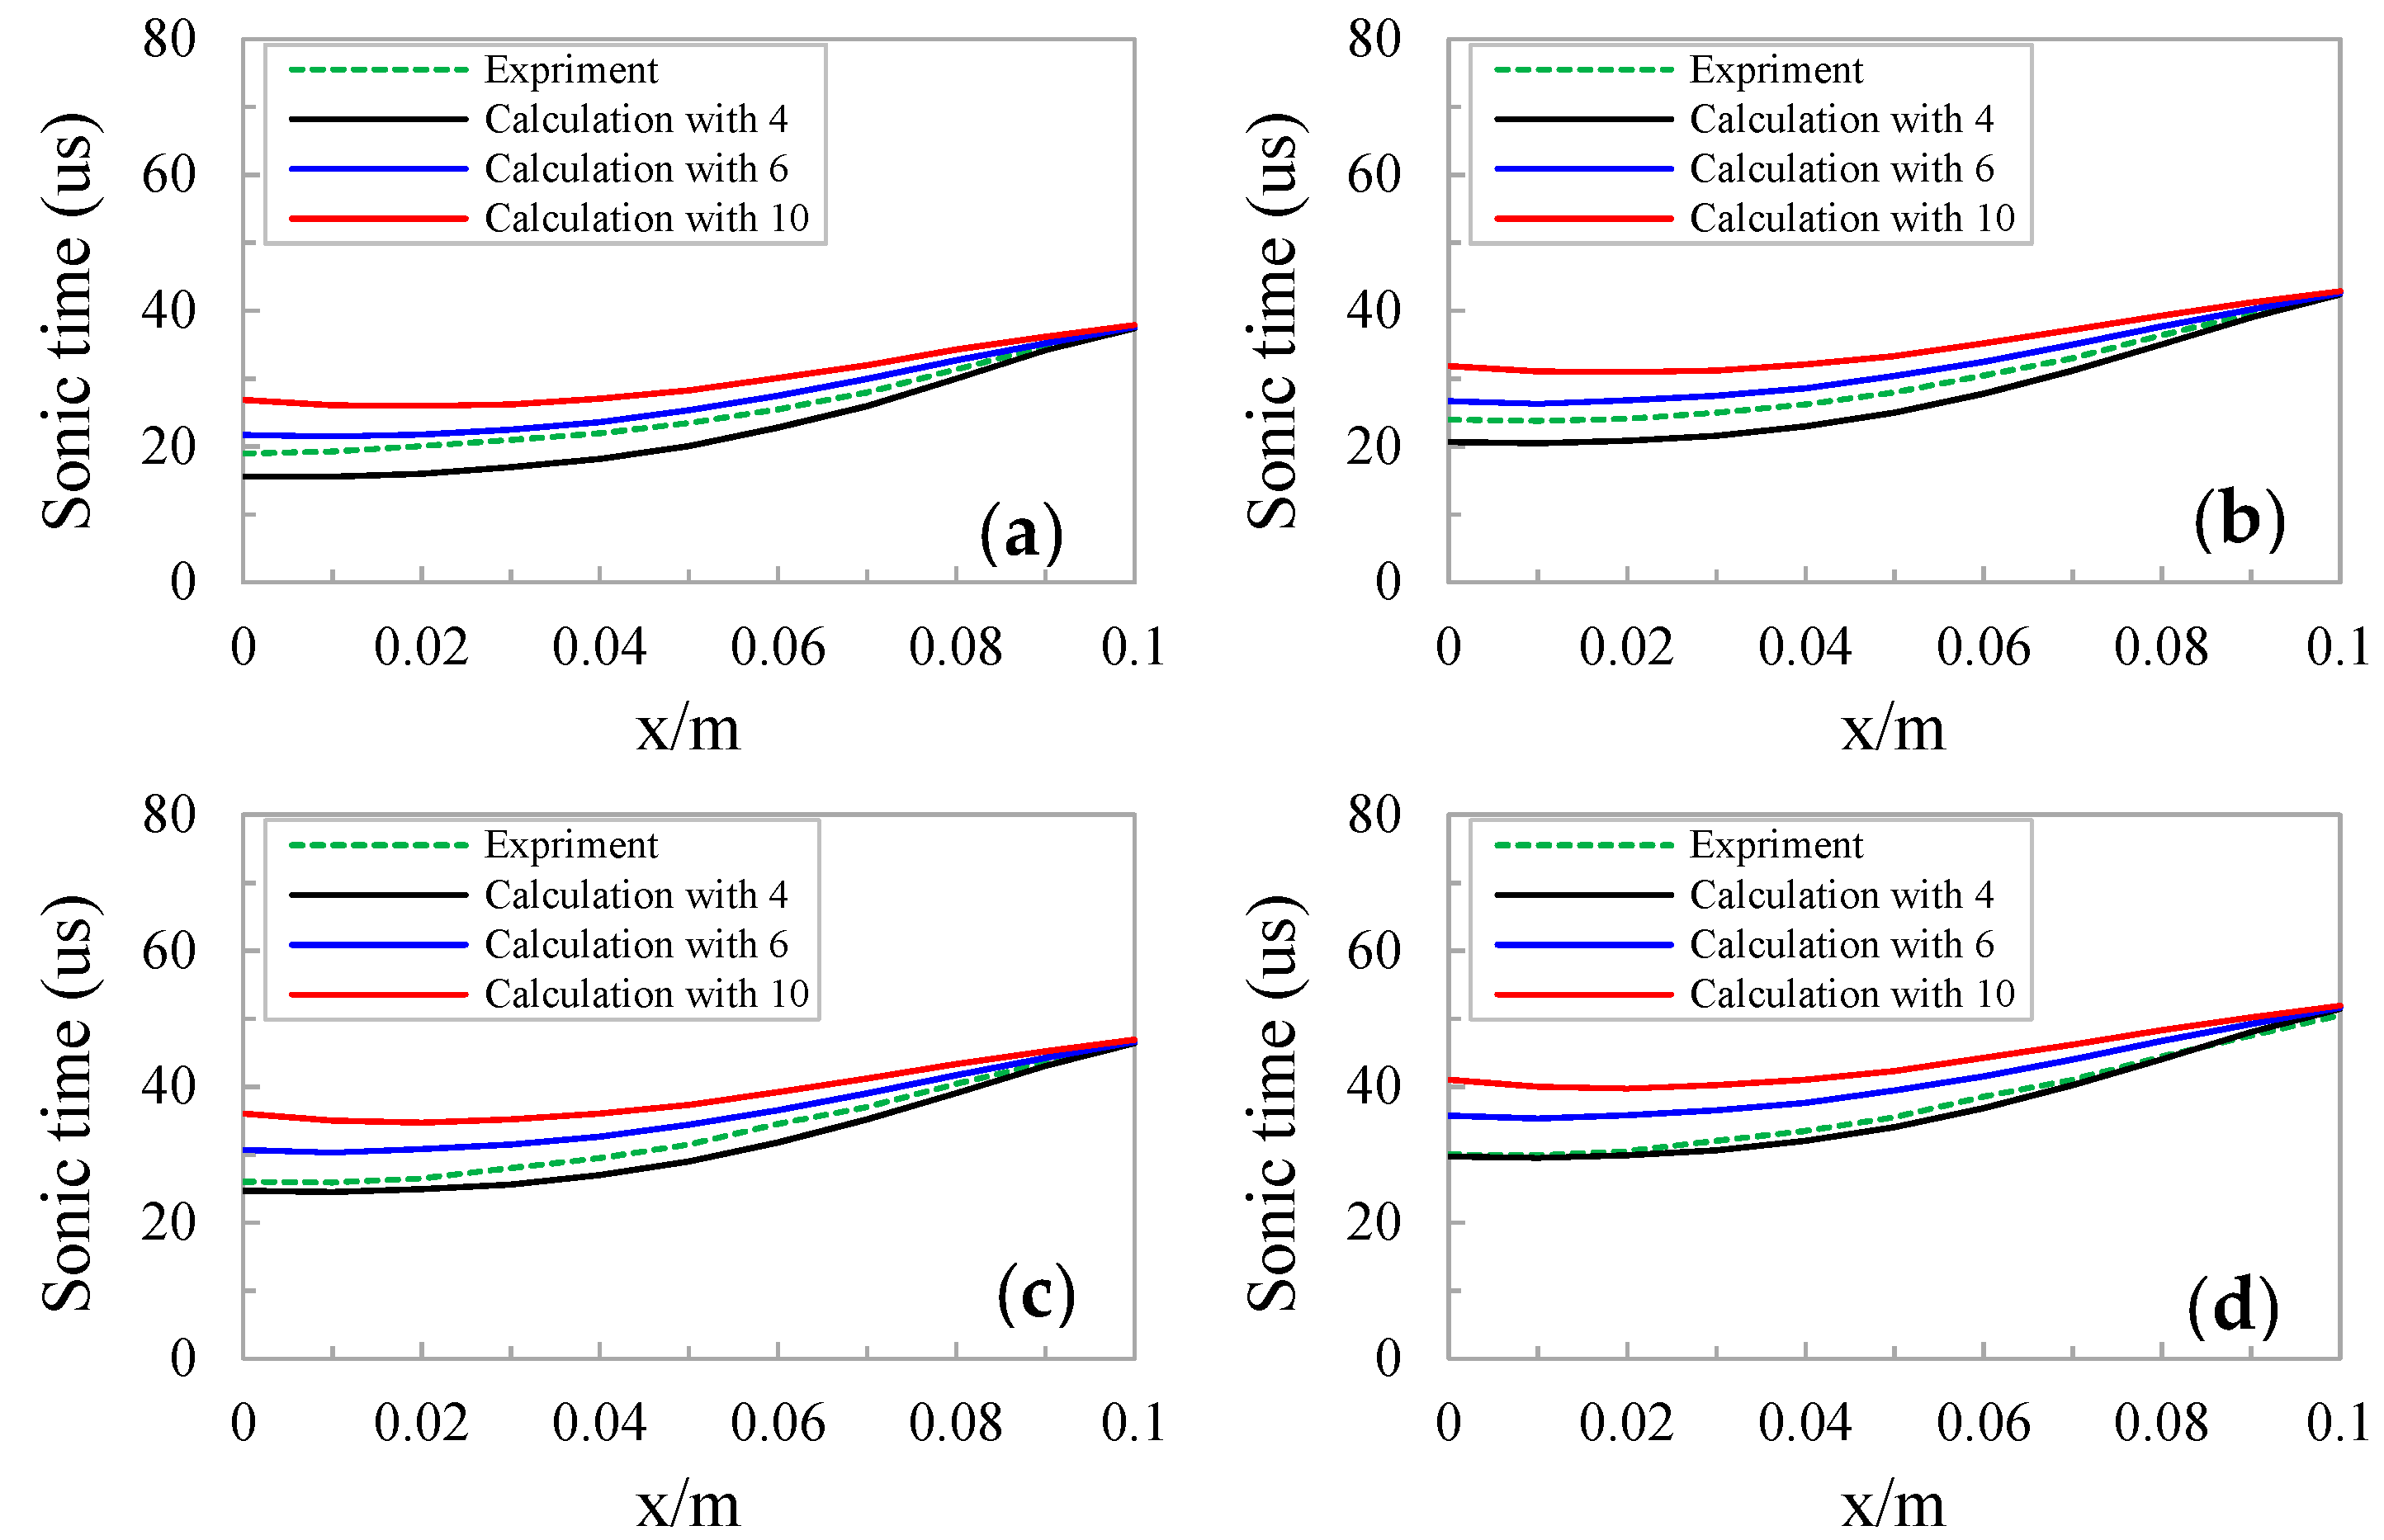
4.5. Sonic Time Values

Concrete has the ability to heal itself [2]. Self-produced healing consists of both carbonation and leaching of the cement slurry and hydration of non-reacted cement [63]. The values of sonic time are a suitable indicator to assess the influences of repair [16,28,29]. The experimental results determined through ultrasonic tests and the calculated values of sonic time with various crack roughness profiles are presented in Figure 8. Equation (25) was used here to calculate the precise values of sonic time for the concrete samples with different crack surface roughness profiles. The calculated sonic times were different between them during MICP repair.
As the distance from the inlet decreased, the calculated rates of CaCO3 increased. This was due to the smaller values of sonic time in the upper portion of the concrete cracks. In addition, the calculated values of sonic time increased after decreasing the repair time. At the inlet, the amounts of decrease were higher due to the increased values of precipitated CaCO3. The upper portions of the less rough cracks were repaired more completely as compared to the rougher cracks, and there was more precipitation of CaCO3. As well, between different locations, there was a smaller difference in sonic time, except for crack 10# (Figure 8d). This was simply due to the uniform distribution of CaCO3 precipitation. Figure 8c,d demonstrate that the sonic time of the repaired sample with crack 10# was notably larger than that of the concrete samples with less roughness profiles, 4# and 6#, which shows that the concrete samples with smoother surfaces were effectively repaired. By increasing the crack roughness profile, the measured results and calculated sonic time increased. This was due to the increase in surface roughness, resulting in a reduction in the productive rates of CaCO3. There were still a few small voids in crack 10#; meanwhile, the insufficient amount of calcium carbonate could not completely seal the crack, finally producing higher values of sonic time.
The rate of coincidence between the calculated results and measured sonic time for the sample with crack roughness profile 4# at 21 days was higher (Figure 8a). Likewise, the overall findings of sonic time revealed that the suggested model is better for less rough concrete cracks. At 21 days, the estimated sonic time was higher for crack 10# as compared to the calculated values at different locations, and the calculated difference in sonic time was small. On the other hand, the calculated results and estimated sonic time values were in between the data without actual values and cracks. Generally, the proposed mathematical model can provide a solid foundation and speculative support for the civil engineering field in repairing rough concrete cracks with the MICP technique.

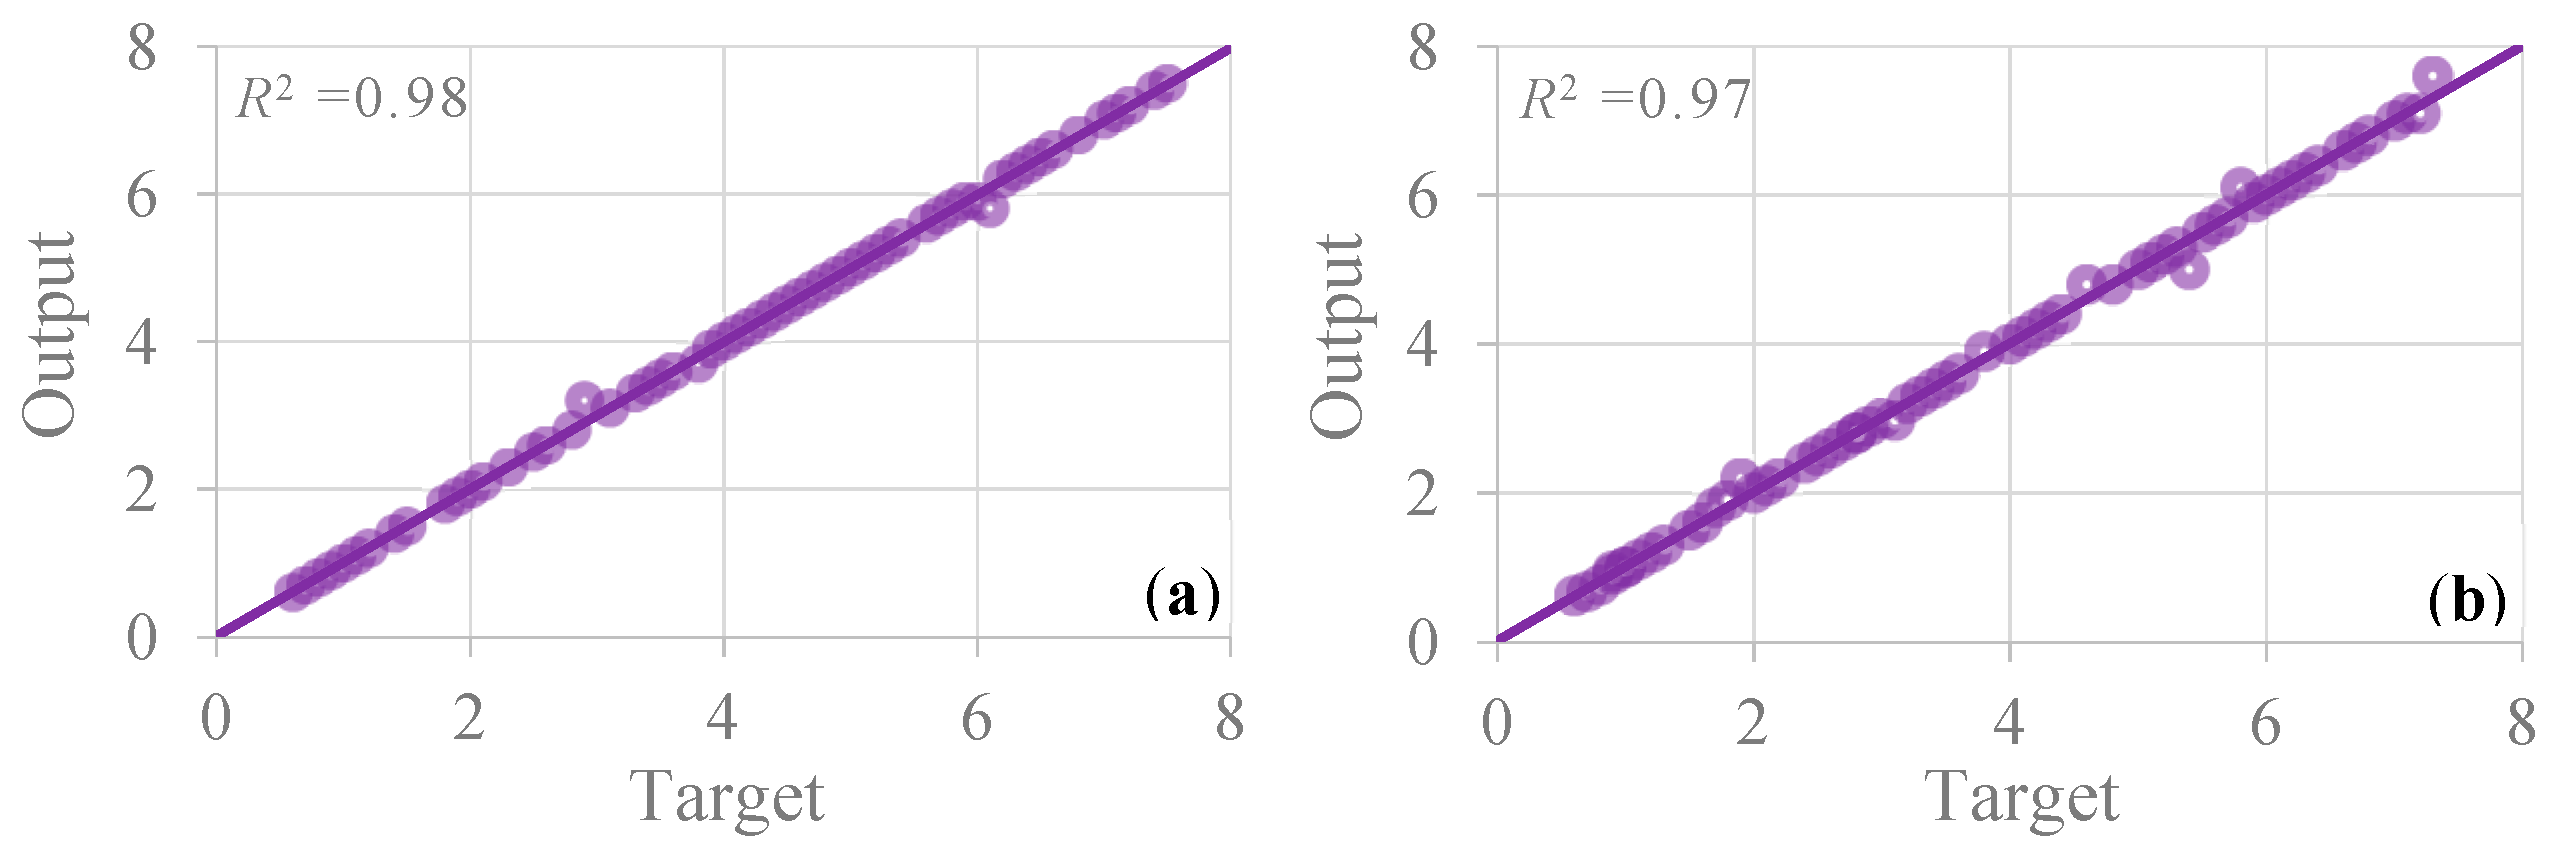
5. Model Accuracy and Application

To judge the accuracy of the proposed model, the determination coefficient (R2) has been generally used and is well known today. The R2 value defines the goodness of method, that is an arithmetical approach for observing the accuracy of a technique in forecasting the real data sets. The determination coefficient (R2) has been used to evaluate the performance of proposed reduction method. Larger value of R2 indicates that the forecasting precision of the method is high. These matrices used the following Equation (28) as:
R 2 = i = 1 n ( A i B ) 2 / i 1 n ( A i B ) 2
where, A and B are the targeted and output values, respectively, and n is the number of specimens.
A comparison of targeted and output values is presented in Figure 9, at the calculated and experimental stage. The constant of determination (R2) between the calculated and experimental results shows a good crack repairing capacity of the proposed model. There is almost no remarkable dissimilarity between the calculated and experimental results (Figure 9). Results show that the developed mathematical model is an appropriate tool to repair concrete cracks of rough surface.
MICP has a wide range of applications in the field of concrete and building material repairs. One area of research involves using MICP to produce self-healing concrete, reduce water adsorption, and fill cracks. Recently, Ahmad et al. [60] repaired structural cracks by bacterial sustainable concrete treated with MICP. They found that the surface deposition of CaCO3 reduced water absorption by 65–90%, depending on the porosity of the specimens. This, in turn, decreased the carbonation rate and chloride migration by about 25–30% and 10–40%, respectively. They also observed an increased resistance to freezing and thawing. Dai et al. [49] used MICP method for surface treatment of concrete, evaluating the efficiency of the resulting improvement in both macroscale and microscale properties of the materials.
The developed model and MICP technique is also applied to repair rough cracks of old concrete surfaces. Figure 10 shows the self-healing effects on concrete rough cracks after 28 days of water curing. It could be seen that the reference cases had mostly been repaired, while a few white powders appeared on the surface of the samples and the cracks were almost completely repaired. Some areas of rougher cracks did not heal completely as compared to less rough cracks as shown in Figure 10a. As the unprotected bacteria had limited survival time to move easily in rougher cracks and cement-based materials, resulting in the poor repair effect, which indicates that the proposed model is more effective to repair cracks of less rough surfaces. The area repair rate of specimens was estimated by using the method presented by Zheng and Qian [64]. The results showed that the cracks of rougher surfaces were less repaired, and the area repair rate of this group was 91%, while the area repair rate of less rough cracks was 98%, as clearly observed from Figure 10b–d.
The proposed mathematical model based on MICP has a wide range of applications in the field of concrete repairs and building materials. One area of research involves using MICP technique to deposit films of CaCO3 on the surfaces to reduce water adsorption, produce self-healing concrete, or fill cracks. The proposed mathematical model can be used to calculate the distribution of calcium carbonate in the concrete rough cracks, in order to validate the practicability of the CaCO3 precipitation model, ureolysis, and solute transport model in the tests.

6. Conclusions

In the current research, a novel mathematical model was proposed by considering biofilm growth, the transport of solutes, geochemistry, CaCO3 precipitation, the transport of suspended biomass, and ureolysis. By using this model, the productive rates of CaCO3, concentrations of biomass, concentrations of solutes, and biofilm volume fractions were estimated via Python. The accuracy of the proposed model was judged by coefficient of determination (R2). Additionally, numerous rough concrete cracks were repaired through the MICP technique in the experiments to validate the usefulness and applicability of the proposed model. The following main conclusions are drawn:
(1)
In different rough cracks, the concentrations of suspended biomass changed significantly, and the suspended biomass concentrations diminished slowly during the experiments. The suspended biomass concentration for the rougher crack (crack 10#) was higher. The experimental results were in line with the calculated results, which validated that the transport model of suspended biomass is feasible and precise.
(2)
The biofilm volume fractions in the mathematical model decreased after increasing the distance from the crack inlet. The distributions of the concentrations of urea in the rough concrete cracks had similar laws, finally causing an increase in the productive rates of calcium carbonate. For the smoother cracks (4# and 6#), the reducing limits were higher after the daily cycle. In the smoother cracks, the productive rates of calcium carbonate were very similar to the experimental outcomes. The variation between the experimental and calculated outcomes was in an acceptable range.
(3)
The value of sonic time in all cracks diminished after increasing the repair time. The smoother cracks had lower values of sonic time and showed excellent repair effects as compared to the rougher crack. As well, near the inlet, the sonic time values for cracks 4# and 6# were small due to the precipitation of CaCO3.
Overall, the practicability and feasibility of the new mathematical model is verified through crack repair experiments. The model provides a better technique to civil engineers that leverages repair period and microbial metabolism to impart a new repairing, adjustive, and sensing multifunctionality to concrete.

Author Contributions

S.Z.: methodology, formal analysis, funding acquisition, visualization, and validation. S.W.: project administration, editing, funding acquisition, data curation, and validation. Z.A.: writing, investigation, and visualization. X.Z.: writing, draft preparation, conceptualization, software, and resources. All authors have read and agreed to the published version of the manuscript.

Funding

This work was conducted with support from the National Natural Science Foundation of China (Grant Nos. 51474050 and U1602232), the State Key Laboratory of Geohazard Prevention and Geoenvironment Protection (Grant No. SKLGP2014K011), and the Program for Liaoning Excellent Talents in University (Grant No. LN2014006), granted to Prof. Shuhong Wang.

Data Availability Statement

The data used to support of this study are included within the article.

Conflicts of Interest

The authors declare no conflict of interest.

Appendix A

Table A1. Parameter in the MICP model for crack repair.
ParameterValue
Yield coefficient Y0.5
The mass of oxygen consumed per unit mass of nutrient F0.5
Biofilm density ρ f 2.0 g/L
Maximum substrate utilization rate k μ 4.1667 × 10⁻⁵ L/s
Half-saturation constant of oxygen K O 2.0 × 10⁻⁵ g/L
Half-saturation constant of nutrient K N 7.99 × 10⁻⁴ g/L
Empirical parameter K p H 6.15 × 10⁻¹⁰
Endogenous decay rate k d e c , 1 3.18 × 10⁻⁷ g/L
Decay rate due to calcite precipitation k d e c , 2 1.0
Biomass attachment rate k a t t 6.15 × 10⁻⁷ mm/s
Biofilm detachment 1 k d e t , 1 3.0 × 10⁻⁹ mm/Pa s
Biofilm detachment 2 k d e t , 2 0.0 dm/Pa
Urea growth rate k u r e a 0.7067 mol/g s
Urease content in biofilm k u b 0.001
Half-saturation constant of urea K u 0.355 mol/kgw
Calcite precipitation 1 k 1 8.9 × 10⁻⁷ mol/mm2 s
Calcite precipitation 2 k 2 5.01 × 10⁻¹⁰ mol/mm2 s
Calcite precipitation 3 k 3 6.6 × 10⁻¹³ mol/mm2 s
Component diffusivity1.0 × 10−3 mm2/s
Calcite density ρ c 2710 g/L
Molecular weight of calcite M c 100.09 g/mol
Exponent for calcite precipitation rate n p 1.0
Constant coefficient β 0.1
Temperature25 °C
Table A2. Initial conditions.
Initial ConditionsValue
Nutrient concentration C N 0 kg/m3
Oxygen concentration C O 0 kg/m3
Biomass concentration C b i o 0 kg/m3
Biofilm volume fraction ε f 0
Calcite volume fraction ε c 0.0
pH8.2
Total carbon CT1.318 × 10−5 mol/L
Total nitrogen NT0.187 mol/L
Total calcium CaT0.0 mol/L
Table A3. Inlet boundary conditions.
Inlet Boundary ConditionsValue
Nutrient concentration C N 3.0 kg/m3
Oxygen concentration C O 8.0 × 10⁻³ kg/m3
Biomass concentration C b i o 7.44 × 10⁻⁸ kg/m3
Urea concentration C u 30 kg/m3
Calcium concentration C c a 20 kg/m3
Total carbon CT1.318 × 10−5 mol/L
Total nitrogen NT0.187 mol/L
Total calcium CaT0.0 mol/Ls
Injection speed4 mL/min

References

  1. Du, W.; Qian, C.; Xie, Y. Demonstration application of microbial self-healing concrete in sidewall of underground engineering: A case study. J. Build. Eng. 2023, 63, 105512. [Google Scholar] [CrossRef]
  2. Sun, X.; Miao, L.; Wu, L.; Wang, H. Theoretical quantification for cracks repair based on microbially induced carbonate precipitation (MICP) method. Cem. Concr. Compos. 2021, 118, 103950. [Google Scholar] [CrossRef]
  3. Jiang, L.; Han, Q.; Wang, W.; Zhang, Y.; Lu, W.; Li, Z. A sugar-coated microbial agent for self-healing cracks in concrete. J. Build. Eng. 2023, 66, 105890. [Google Scholar] [CrossRef]
  4. Fan, S.; Li, M. Understanding intrinsic healing process in cementitious cracks through modeling and experiments. Cem. Concr. Res. 2022, 162, 106931. [Google Scholar] [CrossRef]
  5. Jogi, P.K.; Lakshmi, T.V. Self healing concrete based on different bacteria: A review. Mater. Today Proc. 2021, 43, 1246–1252. [Google Scholar] [CrossRef]
  6. Zhu, J.; Shen, D.; Jin, B.; Wu, S. Theoretical investigation on the formation mechanism of carbonate ion in microbial self-healing concrete: Combined QC calculation and MD simulation. Constr. Build. Mater. 2022, 342, 128000. [Google Scholar] [CrossRef]
  7. Wen, C.; Shen, D.; Luo, Y.; Wang, W.; Liu, C.; Li, M. Early-age autogenous shrinkage and tensile creep of concrete reinforced with polypropylene macro fiber. J. Sustain. Cem.-Based Mater. 2023, 12, 1255–1269. [Google Scholar] [CrossRef]
  8. Wen, C.; Luo, Y.; Wang, W.; Yao, P.; Shen, D. Early-Age Cracking Potential of Fly Ash High Performance Concrete Internally Cured with Super Absorbent Polymers. J. Test. Eval. 2023, 51, 2422–2441. [Google Scholar] [CrossRef]
  9. Goushis, R.; Mini, K. Effectiveness of polymeric and cementitious materials to secure cracks in concrete under diverse circumstances. Int. J. Adhes. Adhes. 2022, 114, 103099. [Google Scholar] [CrossRef]
  10. Fan, Z.; Wang, C.; Xue, H.; Yi, K.; Liu, S. Rheological Properties of Epoxy-Grouting Materials for Early Cracks of Cast-In-Situ Concrete on Bridge Deck. J. Mater. Civ. Eng. 2023, 35, 04023282. [Google Scholar] [CrossRef]
  11. Aytekin, B.; Mardani, A.; Yazıcı, Ş. State-of-art review of bacteria-based self-healing concrete: Biomineralization process, crack healing, and mechanical properties. Constr. Build. Mater. 2023, 378, 131198. [Google Scholar] [CrossRef]
  12. Liu, N.; Haugen, M.; Benali, B.; Landa-Marbán, D.; Fernø, M.A. Pore-scale spatiotemporal dynamics of microbial-induced calcium carbonate growth and distribution in porous media. Int. J. Greenh. Gas Control 2023, 125, 103885. [Google Scholar] [CrossRef]
  13. Zhao, Y.; Peng, L.; Zeng, W.; sun Poon, C.; Lu, Z. Improvement in properties of concrete with modified RCA by microbial induced carbonate precipitation. Cem. Concr. Compos. 2021, 124, 104251. [Google Scholar] [CrossRef]
  14. Tamayo-Figueroa, D.P.; Meneses-Martínez, H.O.; Darghan-Contreras, A.E.; Lizarazo-Marriaga, J.; Brandão, P.F. A comparison index in mortar repair treatments by microbiologically induced carbonate precipitation and its evaluation by a non-destructive technique. Eur. J. Environ. Civ. Eng. 2023. [Google Scholar] [CrossRef]
  15. Feng, J.; Chen, B.; Sun, W.; Wang, Y. Microbial induced calcium carbonate precipitation study using Bacillus subtilis with application to self-healing concrete preparation and characterization. Constr. Build. Mater. 2021, 280, 122460. [Google Scholar] [CrossRef]
  16. Rauf, M.; Khaliq, W.; Khushnood, R.A.; Ahmed, I. Comparative performance of different bacteria immobilized in natural fibers for self-healing in concrete. Constr. Build. Mater. 2020, 258, 119578. [Google Scholar] [CrossRef]
  17. Onyelowe, K.C.; Ebid, A.M.; Riofrio, A.; Baykara, H.; Soleymani, A.; Mahdi, H.A.; Jahangir, H.; Ibe, K. Multi-Objective Prediction of the Mechanical Properties and Environmental Impact Appraisals of Self-Healing Concrete for Sustainable Structures. Sustainability 2022, 14, 9573. [Google Scholar] [CrossRef]
  18. Omoregie, A.I.; Palombo, E.A.; Nissom, P.M. Bioprecipitation of calcium carbonate mediated by ureolysis: A review. Environ. Eng. Res. 2021, 26, 200379. [Google Scholar] [CrossRef]
  19. Sun, X.; Miao, L.; Tong, T.; Wang, C. Improvement of microbial-induced calcium carbonate precipitation technology for sand solidification. J. Mater. Civ. Eng. 2018, 30, 04018301. [Google Scholar] [CrossRef]
  20. Althoey, F.; Zaid, O.; Alsulamy, S.; Martínez-García, R.; de Prado-Gil, J.; Arbili, M.M. Experimental study on the properties of ultra-high-strength geopolymer concrete with polypropylene fibers and nano-silica. PLoS ONE 2023, 18, e0282435. [Google Scholar] [CrossRef]
  21. Althoey, F.; Zaid, O.; Alsulamy, S.; Martínez-García, R.; de Prado Gil, J.; Arbili, M.M. Determining engineering properties of ultra-high-performance fiber-reinforced geopolymer concrete modified with different waste materials. PLoS ONE 2023, 18, e0285692. [Google Scholar] [CrossRef] [PubMed]
  22. Althoey, F.; Zaid, O.; Martínez-García, R.; de Prado-Gil, J.; Ahmed, M.; Yosri, A.M. Ultra-high-performance fiber-reinforced sustainable concrete modified with silica fume and wheat straw ash. J. Mater. Res. Technol. 2023, 24, 6118–6139. [Google Scholar] [CrossRef]
  23. Sidhu, N.; Goyal, S.; Reddy, M.S. Self-healing by biocomposite containing metakaolin immobilized bacterial spores in concrete using low-cost corn steep liquor media. J. Sustain. Cem.-Based Mater. 2023. [Google Scholar] [CrossRef]
  24. Bagga, M.; Hamley-Bennett, C.; Alex, A.; Freeman, B.L.; Justo-Reinoso, I.; Mihai, I.C.; Gebhard, S.; Paine, K.; Jefferson, A.D.; Masoero, E. Advancements in bacteria based self-healing concrete and the promise of modelling. Constr. Build. Mater. 2022, 358, 129412. [Google Scholar] [CrossRef]
  25. Sun, X.; Miao, L.; Wang, C. Glucose addition improves the bio-remediation efficiency for crack repair. Mater. Struct. 2019, 52, 111. [Google Scholar] [CrossRef]
  26. Wang, X.; Xu, J.; Wang, Z.; Yao, W. Use of recycled concrete aggregates as carriers for self-healing of concrete cracks by bacteria with high urease activity. Constr. Build. Mater. 2022, 337, 127581. [Google Scholar] [CrossRef]
  27. Algaifi, H.A.; Bakar, S.A.; Sam, A.R.M.; Abidin, A.R.Z.; Shahir, S.; AL-Towayti, W.A.H. Numerical modeling for crack self-healing concrete by microbial calcium carbonate. Constr. Build. Mater. 2018, 189, 816–824. [Google Scholar] [CrossRef]
  28. Castro-Alonso, M.J.; Montañez-Hernandez, L.E.; Sanchez-Muñoz, M.A.; Macias Franco, M.R.; Narayanasamy, R.; Balagurusamy, N. Microbially induced calcium carbonate precipitation (MICP) and its potential in bioconcrete: Microbiological and molecular concepts. Front. Mater. 2019, 6, 126. [Google Scholar] [CrossRef]
  29. Reshma, T.; Kumar, P.C.; Khalid, S. Influence of self-healing behavior of bacteria & e-waste incorporated concrete on its mechanical properties. Mater. Today Proc. 2023. [Google Scholar] [CrossRef]
  30. Hu, Z.; Liu, Y.; Xu, X.; Yuan, W.; Yang, L.; Shao, Q.; Guo, Z.; Ding, T.; Huang, Y. Efficient intrinsic self-healing epoxy acrylate formed from host-guest chemistry. Polymer 2019, 164, 79–85. [Google Scholar] [CrossRef]
  31. Zhang, C.; Wang, M.; Liu, R.; Li, X.; Yan, J.; Du, H. Enhancing self-healing efficiency of concrete using multifunctional granules and PVA fibers. J. Build. Eng. 2023, 76, 107314. [Google Scholar] [CrossRef]
  32. Sun, X.; Miao, L.; Chen, R. Adding aluminum oxide to improve the repairing effect of cracks based on bio-remediation. J. Adv. Concr. Technol. 2019, 17, 177–187. [Google Scholar] [CrossRef]
  33. Wang, X.; Nackenhorst, U. A coupled bio-chemo-hydraulic model to predict porosity and permeability reduction during microbially induced calcite precipitation. Adv. Water Resour. 2020, 140, 103563. [Google Scholar] [CrossRef]
  34. Konstantinou, C.; Wang, Y.; Biscontin, G. A systematic study on the influence of grain characteristics on hydraulic and mechanical performance of MICP-treated porous media. Transp. Porous Media 2023, 147, 305–330. [Google Scholar] [CrossRef]
  35. Sun, X.; Miao, L.; Chen, R.; Wang, H.; Wu, L. A revised porous media model of microbially induced carbonate precipitation for loess solidification. J. Geotech. Geoenviron. Eng. 2023, 149, 04023031. [Google Scholar] [CrossRef]
  36. Kurz, D.L.; Secchi, E.; Stocker, R.; Jimenez-Martinez, J. Morphogenesis of biofilms in porous media and control on hydrodynamics. Environ. Sci. Technol. 2023, 57, 5666–5677. [Google Scholar] [CrossRef]
  37. Peszynska, M.; Trykozko, A.; Iltis, G.; Schlueter, S.; Wildenschild, D. Biofilm growth in porous media: Experiments, computational modeling at the porescale, and upscaling. Adv. Water Resour. 2016, 95, 288–301. [Google Scholar] [CrossRef]
  38. Markale, I.; Carrel, M.; Kurz, D.L.; Morales, V.L.; Holzner, M.; Jiménez-Martínez, J. Internal Biofilm Heterogeneities Enhance Solute Mixing and Chemical Reactions in Porous Media. Environ. Sci. Technol. 2023, 57, 8065–8074. [Google Scholar] [CrossRef]
  39. Medina Boyd, I. Effects of Stress in the Growth of Microbial Biofilms. Master’s Thesis, Pontificia University, Santiago, Chile, 2023. Available online: https://repositorio.uc.cl/handle/11534/66418 (accessed on 26 July 2023).
  40. Shi, W.; Wang, M.; Wu, L.; Xie, X.; Wang, M.; Lu, T. Study of Concrete Crack Repair using Bacillus megaterium. Adv. Mater. Sci. Eng. 2022, 2022, 6188680. [Google Scholar] [CrossRef]
  41. Gao, R.; Ma, J.; Liu, G.; Chen, H.; Wen, J.; Wang, J. Optimization of deposition process for a productive and cohesive bio-CaCO3 to repair concrete existing cracks. Appl. Microbiol. Biotechnol. 2023, 107, 3479–3494. [Google Scholar] [CrossRef]
  42. Bilgic, A.; Cimen, A. Synthesis, characterisation, adsorption studies and comparison of superparamagnetic iron oxide nanoparticles (SPION) with three different amine groups functionalised with BODIPY for the removal of Cr (VI) metal ions from aqueous solutions. Int. J. Environ. Anal. Chem. 2023, 103, 1866–1891. [Google Scholar] [CrossRef]
  43. Hossain, M.R.; Sultana, R.; Patwary, M.M.; Khunga, N.; Sharma, P.; Shaker, S.J. Self-healing concrete for sustainable buildings. A review. Environ. Chem. Lett. 2022, 20, 1265–1273. [Google Scholar] [CrossRef]
  44. Algaifi, H.A.; Bakar, S.A.; Sam, A.R.M.; Ismail, M.; Abidin, A.R.Z.; Shahir, S.; Altowayti, W.A.H. Insight into the role of microbial calcium carbonate and the factors involved in self-healing concrete. Constr. Build. Mater. 2020, 254, 119258. [Google Scholar] [CrossRef]
  45. Landa-Marbán, D.; Tveit, S.; Kumar, K.; Gasda, S.E. Practical approaches to study microbially induced calcite precipitation at the field scale. Int. J. Greenh. Gas Control 2021, 106, 103256. [Google Scholar] [CrossRef]
  46. Ebigbo, A.; Phillips, A.; Gerlach, R.; Helmig, R.; Cunningham, A.B.; Class, H.; Spangler, L.H. Darcy-scale modeling of microbially induced carbonate mineral precipitation in sand columns. Water Resour. Res. 2012, 48, 1–17. [Google Scholar] [CrossRef]
  47. Lauchnor, E.G.; Topp, D.; Parker, A.; Gerlach, R. Whole cell kinetics of ureolysis by Sporosarcina pasteurii. J. Appl. Microbiol. 2015, 118, 1321–1332. [Google Scholar] [CrossRef]
  48. Liu, Y.; Ali, A.; Su, J.-F.; Li, K.; Hu, R.-Z.; Wang, Z. Microbial-induced calcium carbonate precipitation: Influencing factors, nucleation pathways, and application in waste water remediation. Sci. Total Environ. 2023, 860, 160439. [Google Scholar] [CrossRef]
  49. Dai, Q.; Wang, W.; Xu, F.; Zhao, Y.; Zhou, L.; Wang, L.; Jiang, R. Study on the Combined Behaviour of Montmorillonite and Carbonate Mineralizing Bacteria on Lead Retention and Fixation. Minerals 2023, 13, 763. [Google Scholar] [CrossRef]
  50. Du, W.; Qian, C. Revealing the effect mechanism of calcareous aggregate and silica aggregate on the strength of ordinary concrete: Experiments, microscopic characterization, and molecular simulation. J. Build. Eng. 2023, 72, 106646. [Google Scholar] [CrossRef]
  51. Fu, Q.; Liu, M.; Zhang, S.; Lu, L.; Fang, N.; Chen, J.; Shama, S.; Wang, J. Growth and mineralization characteristics of Bacillus subtilis isolated from marine aquaculture wastewater and its application in coastal self-healing concrete. Mater. Today Commun. 2023, 35, 105654. [Google Scholar] [CrossRef]
  52. Barton, N.; Choubey, V. The shear strength of rock joints in theory and practice. Rock Mech. 1977, 10, 1–54. [Google Scholar] [CrossRef]
  53. Ma, L.; Pang, A.-P.; Luo, Y.; Lu, X.; Lin, F. Beneficial factors for biomineralization by ureolytic bacterium Sporosarcina pasteurii. Microb. Cell Factories 2020, 19, 12. [Google Scholar] [CrossRef]
  54. Snow, D.T. Anisotropie permeability of fractured media. Water Resour. Res. 1969, 5, 1273–1289. [Google Scholar] [CrossRef]
  55. Qin, Y.; Li, M.; Li, Y.; Ma, W.; Xu, Z.; Chai, J.; Zhou, H. Effects of nylon fiber and nylon fiber fabric on the permeability of cracked concrete. Constr. Build. Mater. 2021, 274, 121786. [Google Scholar] [CrossRef]
  56. Li, M.; Chai, J.; Zhang, X.; Qin, Y.; Ma, W.; Duan, M.; Zhou, H. Quantifying the recycled nylon fibers influence on geometry of crack and seepage behavior of cracked concrete. Constr. Build. Mater. 2023, 373, 130853. [Google Scholar] [CrossRef]
  57. Dharmabiksham, B.; Murali, K. Experimental investigation on the strength and durability aspect of bacterial self-healing concrete with GGBS and dolomite powder. Mater. Today Proc. 2022, 66, 1156–1161. [Google Scholar] [CrossRef]
  58. Albuhairi, D.; Di Sarno, L. Low-carbon self-healing concrete: State-of-the-art, challenges and opportunities. Buildings 2022, 12, 1196. [Google Scholar] [CrossRef]
  59. Li, H.-F.; Yu, Q.-Q.; Zhang, K.; Wang, X.-Y.; Liu, Y.; Zhang, G.-Z. Effect of types of curing environments on the self-healing capacity of mortars incorporating crystalline admixture. Case Stud. Constr. Mater. 2023, 18, e01713. [Google Scholar] [CrossRef]
  60. Ahmad, S.S.; Elmahdy, M.A.; ELShami, A.; Yousry, E.-S.M. Bacterial sustainable concrete for repair and rehabilitation of structural cracks. J. Sustain. Cem.-Based Mater. 2023, 12, 627–646. [Google Scholar] [CrossRef]
  61. Sportelli, M.C.; Kranz, C.; Mizaikoff, B.; Cioffi, N. Recent advances on the spectroscopic characterization of microbial biofilms: A critical review. Anal. Chim. Acta 2022, 1195, 339433. [Google Scholar] [CrossRef]
  62. Kumar, S.; Nguyen, A.T.; Goswami, S.; Ferracane, J.; Koley, D. Real-time monitoring of biofilm formation using a noninvasive impedance-based method. Sens. Actuators B Chem. 2023, 376, 133034. [Google Scholar] [CrossRef] [PubMed]
  63. Ryparova, P.; Prošek, Z.; Schreiberova, H.; Bílý, P.; Tesarek, P. The role of bacterially induced calcite precipitation in self-healing of cement paste. J. Build. Eng. 2021, 39, 102299. [Google Scholar] [CrossRef]
  64. Zheng, T.; Qian, C. Self-healing of later-age cracks in cement-based materials by encapsulation-based bacteria. J. Mater. Civ. Eng. 2020, 32, 04020341. [Google Scholar] [CrossRef]
Figure 1. Rough concrete crack model.
Sustainability 15 13122 g001
Figure 2. Whole process of the crack repair experiments.
Sustainability 15 13122 g002
Figure 3. Suspended biomass concentrations in the leachate.
Sustainability 15 13122 g003
Figure 4. Volume fractions of biofilm in cracks with varying surface roughness: (a) 1 day, (b) 7 days, (c) 14 days, and (d) 21 days.
Sustainability 15 13122 g004
Figure 5. Concentrations of urea in the cracks. (a) Initial concentration of urea on the 1st day. (b) Concentration of urea on the 1st day after the daily cycle. (c) Initial concentration of urea on the 7th day. (d) Concentration of urea on the 7th day after the daily cycle. (e) Initial concentration of urea on the 14th day. (f) Concentration of urea on the 14th day after the daily cycle. (g) Initial concentration of urea on the 21st day. (h) Concentration of urea on the 21st day after the daily cycle.
Sustainability 15 13122 g005
Figure 6. Distribution of CaCO3 after (a) 1 day, (b) 7 days, (c) 14 days, and (d) 21 days.
Sustainability 15 13122 g006
Figure 7. Productive rates of CaCO3 in the concrete cracks.
Sustainability 15 13122 g007
Figure 8. Values of sonic time for repaired rock samples after (a) 1 day, (b) 7 days, (c) 14 days, and (d) 21 days.
Sustainability 15 13122 g008
Figure 9. Accuracy of the proposed model: (a) at calculated results and (b) at experimental results.
Sustainability 15 13122 g009
Figure 10. Surface binarization images of rough cracked samples before and after 28 days of incubation: (a1,b1,c1,d1) unrepaired concrete cracks and (a2,b2,c2,d2) repaired concrete cracks.
Sustainability 15 13122 g010
Table 1. Components of the concrete sample (kg/m3).
ComponentWaterCementGravelSandCoal AshWater Reducer
content160330990845858
Table 2. Barton standard joint profile and JRC values, from Barton and Choubey [52].
Crack No.Joint ProfileJRCS0 (m2)
4Sustainability 15 13122 i0016.70.1027
6Sustainability 15 13122 i00210.80.1025
10Sustainability 15 13122 i00318.70.1086
Table 3. Productive rates of CaCO3 in the experiments.
Crack No.Volume of Cementation Solution (mL)Concentration of Cementation Solution (M)Repairing Period (Day)Theoretical Producing Mass (g)Practical Producing Mass (g)Productive Rates for CaCO3
4#200.52116.18111.6572%
200.52116.18112.14375%
200.52116.18111.16569%
6#200.52116.14410.97868%
200.52116.14411.78573%
200.52116.14412.75479%
10#200.52117.10612.8375%
200.52117.10613.68580%
200.52117.10613.85681%
Disclaimer/Publisher’s Note: The statements, opinions and data contained in all publications are solely those of the individual author(s) and contributor(s) and not of MDPI and/or the editor(s). MDPI and/or the editor(s) disclaim responsibility for any injury to people or property resulting from any ideas, methods, instructions or products referred to in the content.

