Article

Cattle Grazing Moderates Greenhouse Gas and Particulate Matter Emissions from California Grassland Wildfires

1
LD Ford, Consultants in Rangeland Conservation Science, 5984 Plateau Drive, Felton, CA 95018, USA
2
University of California Agriculture and Natural Resources, Santa Clara County, 1553 Berger Drive, Bldg. 1, San Jose, CA 95112, USA
3
University of California Agriculture and Natural Resources, San Benito County, 3228 Southside, Hollister, CA 95023, USA
4
Graduate Group in Ecology, University of California, One Shields Ave, Davis, CA 95616, USA
5
University of California Agriculture and Natural Resources, Stanislaus County, 3800 Cornucopia Way, Ste. A, Modesto, CA 95358, USA
6
Department of Animal Science, University of California, One Shields Ave, Davis, CA 95616, USA
*
Author to whom correspondence should be addressed.
Sustainability 2023, 15(18), 13539; https://doi.org/10.3390/su151813539
Submission received: 3 August 2023 / Revised: 27 August 2023 / Accepted: 31 August 2023 / Published: 11 September 2023
(This article belongs to the Special Issue Grazing Management, Conservation and Climate Mitigation on Rangelands)

Abstract

:
Between 2010 and 2020, an average of 36,037 hectares of grassland burned in wildfires in California each year, emitting greenhouse gasses (GHGs) and particulate matter (PM). These emissions impact climate and human health. Cattle grazing removes herbaceous fuel through the consumption of forage; however, ruminant digestion also emits GHGs. The purpose of this study was to examine the GHG and PM impact of livestock grazing in grasslands that go on to burn. We used Monte Carlo simulation to determine whether forage consumption by livestock led to reductions in grassland wildfire emissions and whether these reductions outweighed the emissions from the digestion of that forage. We estimate that between 2010 and 2020, an average of 11,590 metric tons (MT) of herbaceous fuel were removed by cattle annually from grasslands in California that went on to burn. This resulted in annual wildfire emission reductions ranging between 0.001 and 0.025 million metric tons (MMT) of CO2 equivalents (CO2e) and between 11 and 314 MT of PM2.5; a small fraction of total GHG and PM emissions from wildfires in California. We also evaluated the change in emissions if burned grasslands in California’s Central and North Coast regions—where removing grazing can lead to the encroachment of shrubs into grasslands—were instead shrublands. If the grasslands that burned in these regions in 2020 had instead been shrublands, we estimate that as much as 0.90 MMT more CO2e and 8448 MT more PM2.5 would have been emitted by wildfires, highlighting the long-term implications of livestock grazing.

1. Introduction

1.1. Wildfires in California: Recent Trends and Impacts

Recent fire seasons in California have been among the worst on record, part of a trend of larger and more severe wildfires driven in part by climate change [1,2,3,4]. Both the area burned by wildfire and the incidence of severe wildfires and megafires are projected to increase in the coming decades [2]; however, management practices have the potential to mitigate these projected changes substantially [2,5,6].
In addition to threatening human lives, buildings, and landscapes, wildfires emit large quantities of both greenhouse gases (GHGs) and particulate matter (PM), which contribute to climate change and reduced air quality [7,8]. Wildfire emissions include carbon dioxide, methane, nitrous oxide, carbon monoxide, and a form of PM called black carbon (BC), all of which have climate impacts [8,9,10]. While carbon dioxide is the major component of wildfire emissions, non-carbon dioxide emissions can substantially increase the CO2-equivalent (CO2e) emissions of wildfires. In addition to their climate impact, wildfire emissions can elevate PM2.5 concentrations to hazardous levels in major population centers [11,12,13]. Though only a small percentage of total wildfire emissions, CO2 and PM from grassland wildfires in California can be large in absolute terms. In 2020, the state’s largest recorded wildfire year, grassland wildfires emitted approximately 2 million metric tons of CO2 (not including CO2e from non-CO2 emissions) [7].

1.2. Cattle Grazing, Wildfire, and the Carbon Cycle on California Rangelands

Grazing is a common, extensive land use and a vegetation management tool on California’s rangelands, taking place on ~13.8 million hectares (ha) (34.1 million acres (ac)), or 33% of the state’s total land area [14]. Rangelands include grassland, shrubland, and savanna ecosystem types [14]; however, this paper focuses on grasslands, as cattle preferentially graze on grasses and forbs [15]. Grazing occurs on both private and public lands; roughly 5.7 million ha (14 million ac) of non-federal land and 7.7 million ha (19 million ac) of federal land are grazed in California [16,17,18,19]. Beef cattle are by far the most prevalent grazing animal on California rangeland [20,21]. Grazing can be used as a fire management tool, and fuel reduction through livestock grazing is a goal frequently included in management plans by state, regional, county, and local agencies [22].
In California grasslands, the amount of carbon uptake and whether a particular site is a net carbon source or sink can vary interannually, largely due to variability in annual rainfall [23,24,25]. Cattle grazing may affect soil carbon storage in California grasslands, though any effects appear specific to site characteristics and grazing regime [26,27,28].
The most significant way in which cattle grazing impacts rangeland carbon storage and emissions is at longer time scales, where cattle grazing can affect shrub encroachment onto grasslands. Where grazing is absent and fires are suppressed, there is a trend of shrub encroachment onto grassland in coastal parts of the state [29,30,31,32]. Cattle grazing has been found to prevent or slow shrub encroachment in the North Coast region [30,31,32]. Shrubland contains substantially more carbon than grassland in the form of above- and belowground biomass, though soil carbon amounts are similar between the two ecosystem types [32,33,34].
Livestock grazing is also responsible for significant emissions of greenhouse gases: beef cattle grazing on rangelands emit methane from the enteric fermentation of forage and nitrous oxide from nitrogen in manure [35]. Globally, emissions from grazing-based beef operations account for 875.4 MMT CO2e in emissions annually [36] or approximately 12% of global livestock emissions. Cumulatively, livestock contribute approximately 14.5% of human-caused greenhouse gas emissions [36]. In California, beef cattle production emits approximately 3.4 MMT CO2e annually [37].
At the same time, grazing also results in the removal of billions of pounds of forage across the state, which reduces the amount of fuel available for combustion in the event of wildfire [22] and creates patchiness of fuel which can reduce the fire’s spread across the landscape [38,39,40,41]. In 2017, beef cattle grazing removed an estimated average of 668 kg per ha (596 pounds per ac) of forage/fuel from grazed rangelands throughout the state. The amount of fuel consumed per acre varied by region, from approximately 195 kg/ha (174 lbs/ac) removed in the Southeast Interior region to 1143 kg/ha (1020 lbs/ac) removed in the San Joaquin/Sierra region [22]. The regions used by Ratcliff et al. (2022) [22] are shown in Figure 1. The total estimated fuel reduction by cattle in California in 2017 was 5.3 billion kg (11.6 billion lbs).
Both cattle grazing and wildfire affect greenhouse gas emissions from rangelands in California. In light of this, here we investigate how grazing may modify emissions of greenhouse gases and particulates from grassland wildfires in California. We estimate the difference in emissions between grazed and ungrazed burned grasslands and how short-term impacts from the removal of herbaceous fuels compare to long-term impacts from altering grassland–shrubland successional dynamics. To answer these questions, we performed three analyses: (1) We built a model to assess the trade-offs between grazing and fire emissions on grasslands in California for the years 2010–2020. (2) We performed a case study to assess the impacts of grazing on emissions from the 2020 SCU Lightning Complex fires. (3) We evaluated GHG and PM2.5 emissions from burned shrublands versus grasslands to provide context for the long-term impacts associated with livestock grazing and shrub encroachment.
There is considerable uncertainty in the estimates of GHG and PM emissions from wildfires [8], greenhouse gas emissions from livestock [42], and even in the estimated global warming potential of some key emissions [10]. In cases where uncertainty is high, probability distributions are non-normal, and model functions are complex, Monte Carlo simulation models provide a method to estimate emissions while representing uncertainty associated with the estimate [43,44]. Representing uncertainty in the results in these cases (rather than just mean values) is important so that confidence in the estimate can be assessed. A Monte Carlo approach was a key component of our model, and our results are presented with uncertainty derived from several published sources.

2. Materials and Methods

2.1. Greenhouse Gas and Particulate Matter Model

To evaluate the influence of cattle grazing on the emissions of greenhouse gasses and particulate matter from grazed grasslands that burn in wildfires, we built a deterministic model that simultaneously estimated the emissions of greenhouse gases and particulate matter from cattle grazing activities and from wildfires (hereafter “GHG_PM Model”). Model inputs included parameters for the quantity and forage quality of aboveground biomass, the amount of forage consumed through grazing, wildfire characteristics, and emission factors associated with fire and grazing (Supplemental Table S1). Model outputs were the major GHG and PM emissions associated with wildfires and cattle grazing.
Fire emission factors were based on grassland emission factors in the First Effects Fire Model [45] and its source document for the grassland emission factors [8] (Supplemental Table S1). Livestock grazing emission factors were obtained from the Intergovernmental Panel on Climate Change (IPCC) Chapter 10 (2019) [42]. We assumed that livestock grazing resulted in no additional particulate emissions. Model variables, default parameters, and equations are shown in the Supplemental materials. Additional references cited in the Supplemental materials, but not elsewhere in the main text, are as follows: Cromer (2017) [46], Friedl et al. (2005) [47], Larsen et al. (2021) [48], and National Research Council (2000) [49].
To characterize uncertainty in our model results, we created a function that simulated 1000 input values for the GHG_PM Model with emission factor values drawn from known distributions to simulate the range of values for each emission factor. Values and their sources are in Supplementary Table S1. Summary statistics were then performed on the resulting 1000 estimated values to determine the mean and spread of data (5 to 95% percentiles of all simulated data results).
To evaluate GHG emissions, we converted all emissions to CO2 equivalents (CO2e) using GWP100 values based on Myhre et al. (2013) [10]. GWP100 values used in our analysis were CH4 = 28, CO = 1.8, and N20 = 298. Black carbon has highly variable GWP100 values: mean = 900, range = 100–1700. Therefore, we included uncertainty in the GWP values for black carbon when we calculated our results. All other GWP values use the mean GWP100 value. Black carbon amount was not directly estimated from the FOFEM emission factors; therefore, we estimated it as 19% of all PM2.5 emissions following the California Air Resources Board (2015) [50]. All modeling and computation were performed in the program R [51].

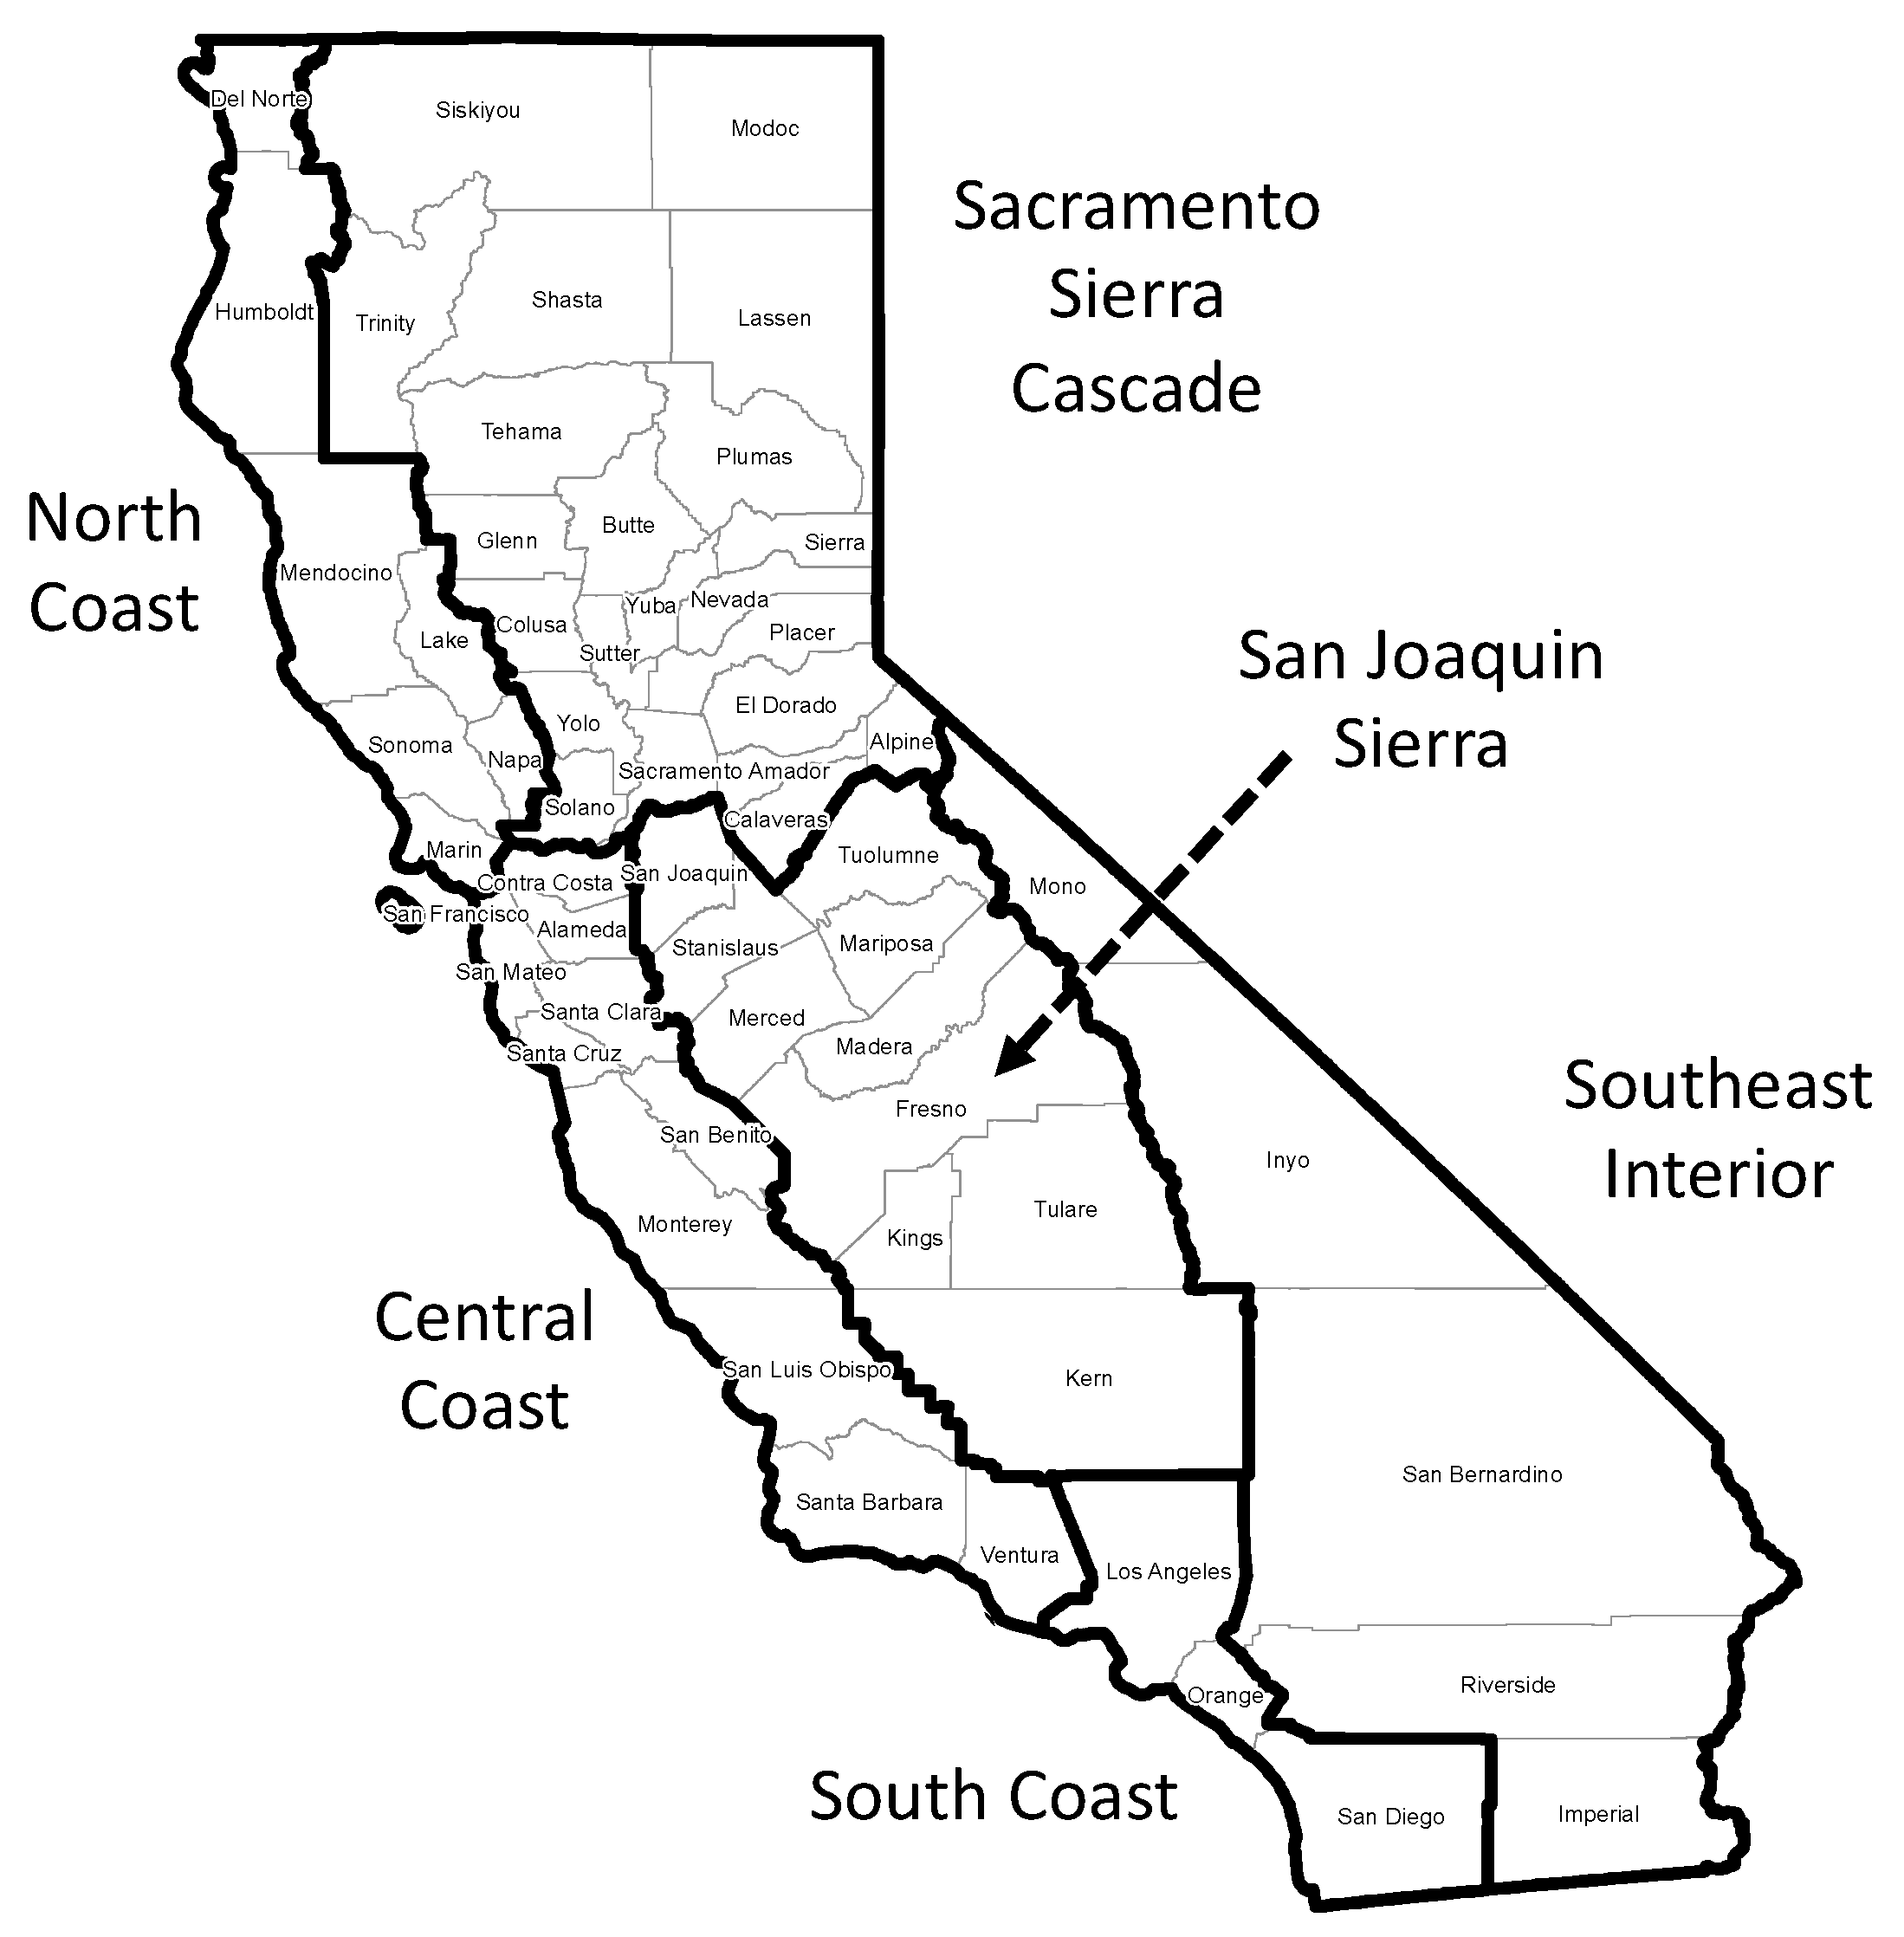
2.2. State-Wide Case Study

The state-wide case study evaluated the impact of livestock grazing on wildfire emissions from 2010 to 2020. To do so, we needed to know the total amount of forage removed by cattle on burned grasslands in the state. We estimated this using Equation (1).
total forage removed by cattle = grassland acres burned × cattle forage consumption per acre
To calculate the grassland area burned, we performed spatial analyses in ArcGIS [52]. Wildfire boundaries from 10 consecutive years (2010–2020) were extracted from the CALFIRE Fire Perimeters data [53]. A vegetation layer from the USGS GAP/LANDFIRE National Terrestrial Ecosystems (GAP) was intersected with the fire boundaries from each year to produce an overlay of the types of vegetation burned [54]. Burned grasslands were subsetted from the entire intersection, and this layer was divided into 6 distinct regions (Figure 1).
Per-acre forage consumption in each region was based on Ratcliff et al. (2022) [22], which showed that average forage consumption per acre by beef cattle varies by region. The regional consumption values from that study were (1) Central Coast region = 230 lbs/ac, (2) North Coast region = 450 lbs/ac, (3) Sacramento–Sierra–Cascade region = 246 lbs/ac, (4) San Joaquin–Sierra region = 588 lbs/ac, (5) South Coast region = 23 lbs/ac, and (6) Southeast Interior region = 16 lbs/ac. These numbers are based on the kind, class, number, and duration of grazing per unit of grazed land. These values were influenced by variations in average forage production and livestock production practices. These values represent forage consumed on all rangelands in a region, regardless of whether they were grazed or not. This was necessary since we do not know which rangelands in the state are grazed and which are not. Therefore, the average grazing across all rangelands regardless of grazing status was used to calculate the total forage removed from burned grasslands in each region. It should be noted that these values represent estimated regional averages. Grazing intensity (and fuel removal) is highly variable within regions, and can even vary within a given ranch or pasture [22].
In the model, the fire alarm date—the date each fire was first recorded by CALFIRE—was used to signify the end of the grazing period and to estimate the proportion of the total grazing year when grazing actually occurred. The fire alarm date for each fire was also used to determine how much the remaining fuel should be reduced due to the summer decomposition of aboveground biomass. We assumed that the grazing season started in October of the previous year. Therefore, if a fire burned in June, we assumed that 75% of the average forage consumption for that region would have been consumed, rather than the 100% that would have been consumed if cattle were allowed to graze the entire season. This assumption may overestimate use in summer pastures; however, it may conversely underestimate use on rangelands where cattle are removed before fall.
Monte Carlo Model. The model tracks all carbon flowing into and out of the system (in aboveground biomass) over the course of a year. It estimates the amount of CO2 removed from the atmosphere to create the aboveground biomass in a grassland in a given year (based on the carbon content of the vegetation and the total production of aboveground biomass). The fate of that carbon (and other elements in the aboveground biomass) is then modeled using established emissions factors for livestock, including enteric methane, nitrogen excretion and volatilization, and methane emissions from manure. CO2 from livestock respiration and manure decomposition is calculated after removing the carbon fraction from the total carbon consumed. Fuel load takes into account biomass consumed by livestock and fractional loss due to summer decomposition. GHG and PM emissions from vegetation burned in wildfires are calculated based on fuel load using the emissions factors from Urbanski et al. (2014) and FOFEM (2020) [8,45]. Unconsumed and unburned biomass is subject to summer decomposition during the summer months and winter decomposition during the winter months, each resulting in CO2 emissions. Belowground carbon balance is not accounted for in this model because the relationship between belowground carbon sequestration and grazing is not well established in California and is likely highly site-specific [23,26].
Default parameters (and their associated variations) are used for all emission factors in the GHG_PM Model. These parameters include uncertainty parameters from the published literature relating to forage quality (digestible energy: gross energy, total digestible nutrients, forage ash percent), livestock GHG emissions factors (N2O emission and volatilization, CH4 conversion factor), fire emissions factors (CO, CO2, CH4, PM2.5), and even variation in the GWP100 value of black carbon (Supplementary Materials Table S1). The model was run 1000 times. In each iteration, values were drawn randomly from the distributions of these variables and the model output was saved. Results included mean values and 95% confidence intervals drawn from the resulting simulated dataset. Model equations and parameter values are provided in the Supplementary Materials.

2.3. SCU Lightning Wildfire Complex Case Study

This case study was similar to the state-wide case study; however, it only evaluated emissions from one fire complex in the year 2020. The SCU Lightning Wildfire Complex burned 160,508 hectares (396,624 acres) in six counties in Central California. It burned from 18 August 2020 to 1 October 2020.
Unlike the state-wide case study, we have actual stocking rates for the ranches within the SCU Wildfire burn areas. Stocking rates for 2020 (in AUM per acre) were obtained for ranches by interviewing ranchers in Santa Clara County, San Joaquin County, and Stanislaus County and by contacting the East Bay Regional Parks District (EBRPD) and the San Francisco Public Utilities Commission (SFPUC), both large rangeland owners in the affected area. In Santa Clara County, all ranches with >80.9 hectares (200 acres) of burned grassland were contacted (representing 96% of grazed grasslands that burned in that county). Elsewhere, all ranches with burned grassland were contacted. When direct information was not available for a grazed parcel, educated guesses were made from adjacent parcels or based on standard stocking rates in the county.
Parcel maps of these areas were intersected with a vegetation map [55] to determine the total grassland acres burned per ranch in Santa Clara County and Alameda County. In San Joaquin and Stanislaus Counties, a vegetation layer from the USGS GAP/LANDFIRE National Terrestrial Ecosystems (GAP) project was used to derive the total grassland acres burned [54]. The total acres of each parcel were multiplied by forage removed per acre (based on AUM stocking rates) to determine the total forage removed by cattle before the fire burned grasslands in this area.
This total amount of consumed forage was then evaluated in the GHG_PM model to estimate the difference in GHG and PM emissions due to forage removal by cattle. As with the state-wide case study, default parameters (and their associated variations) were used in a Monte Carlo model to estimate GHG and PM emissions with uncertainty (Supplementary Table S1). The model was run with 1000 iterations with simulated variability in input parameters.

2.4. Shrub and Grass Analysis

To examine the potential long-term effects of grazing on wildfire emissions, we modeled how shrub encroachment could affect CO2e and PM2.5 emissions from wildfires in areas where shrub encroachment into grasslands occurs in the absence of grazing. The best-documented shrub encroachment dynamic in California is the Northern Coastal Scrub in the grassland/shrubland areas of the Central and North Coast regions of the state [29]. Therefore, we used this as our model system. We also included Coastal Sage Scrub in the model since it is a common shrub type in the area, with known fuel parameters [45]. This analysis estimated the total amount of CO2e and PM2.5 emissions if grasslands that burned in the Central Coast and North Coast Regions had instead been either type of shrubland, then it calculated the difference between emissions from a grazed grassland and the two shrub types. It addresses the question of how much additional CO2e and PM2.5 would be released by a wildfire in the Central and North Coast Regions if the grasslands in those regions were to transition to shrublands in the absence of grazing.
We estimated per-acre emissions from Coastal Sage Scrub by using emissions estimates for this shrubland type from [45]. For Northern Coastal Scrub, we multiplied the Coastal Sage Scrub emissions by the ratio of total fuel loads in Northern Coastal Scrub (18.73 MT/ha (8.4 tons/acre), per Russell and McBride (2003) [32]) to Coastal Sage Scrub (38.1 MT/ha (17 tons/acre), per FOFEM (2020) [45]). We did this because there is no pre-set fuel parameter for Northern Coastal Scrub, but it shares some species and characteristics with Coastal Sage Scrub. Grasslands were assumed to have 2.24 MT/ha (1 ton/acre) of biomass at the time of the burn. This is based on several long-term residual dry matter estimates from multiple sites in the Central and North Coast regions [56,57,58].
To assess how much more CO2e and PM2.5 would have been emitted by wildfires if the grasslands that burned in the North and Central Coast regions were converted to shrubland in the absence of grazing, we multiplied the shrubland emissions per acre by total grassland acres burned in these regions in 2020. This analysis shows what would happen if 100% of grasslands were instead shrublands. In truth, the removal of cattle grazing would not result in all grassland types converting to shrublands, so this number is best viewed as a high estimate. Importantly, this analysis does not consider the effect of carbon storage in shrub biomass. The overall effect on radiative forcing is a more complex topic that should consider shrub encroachment rates, C accumulation rates, long-term grazing emissions, and fire return intervals.

3. Results

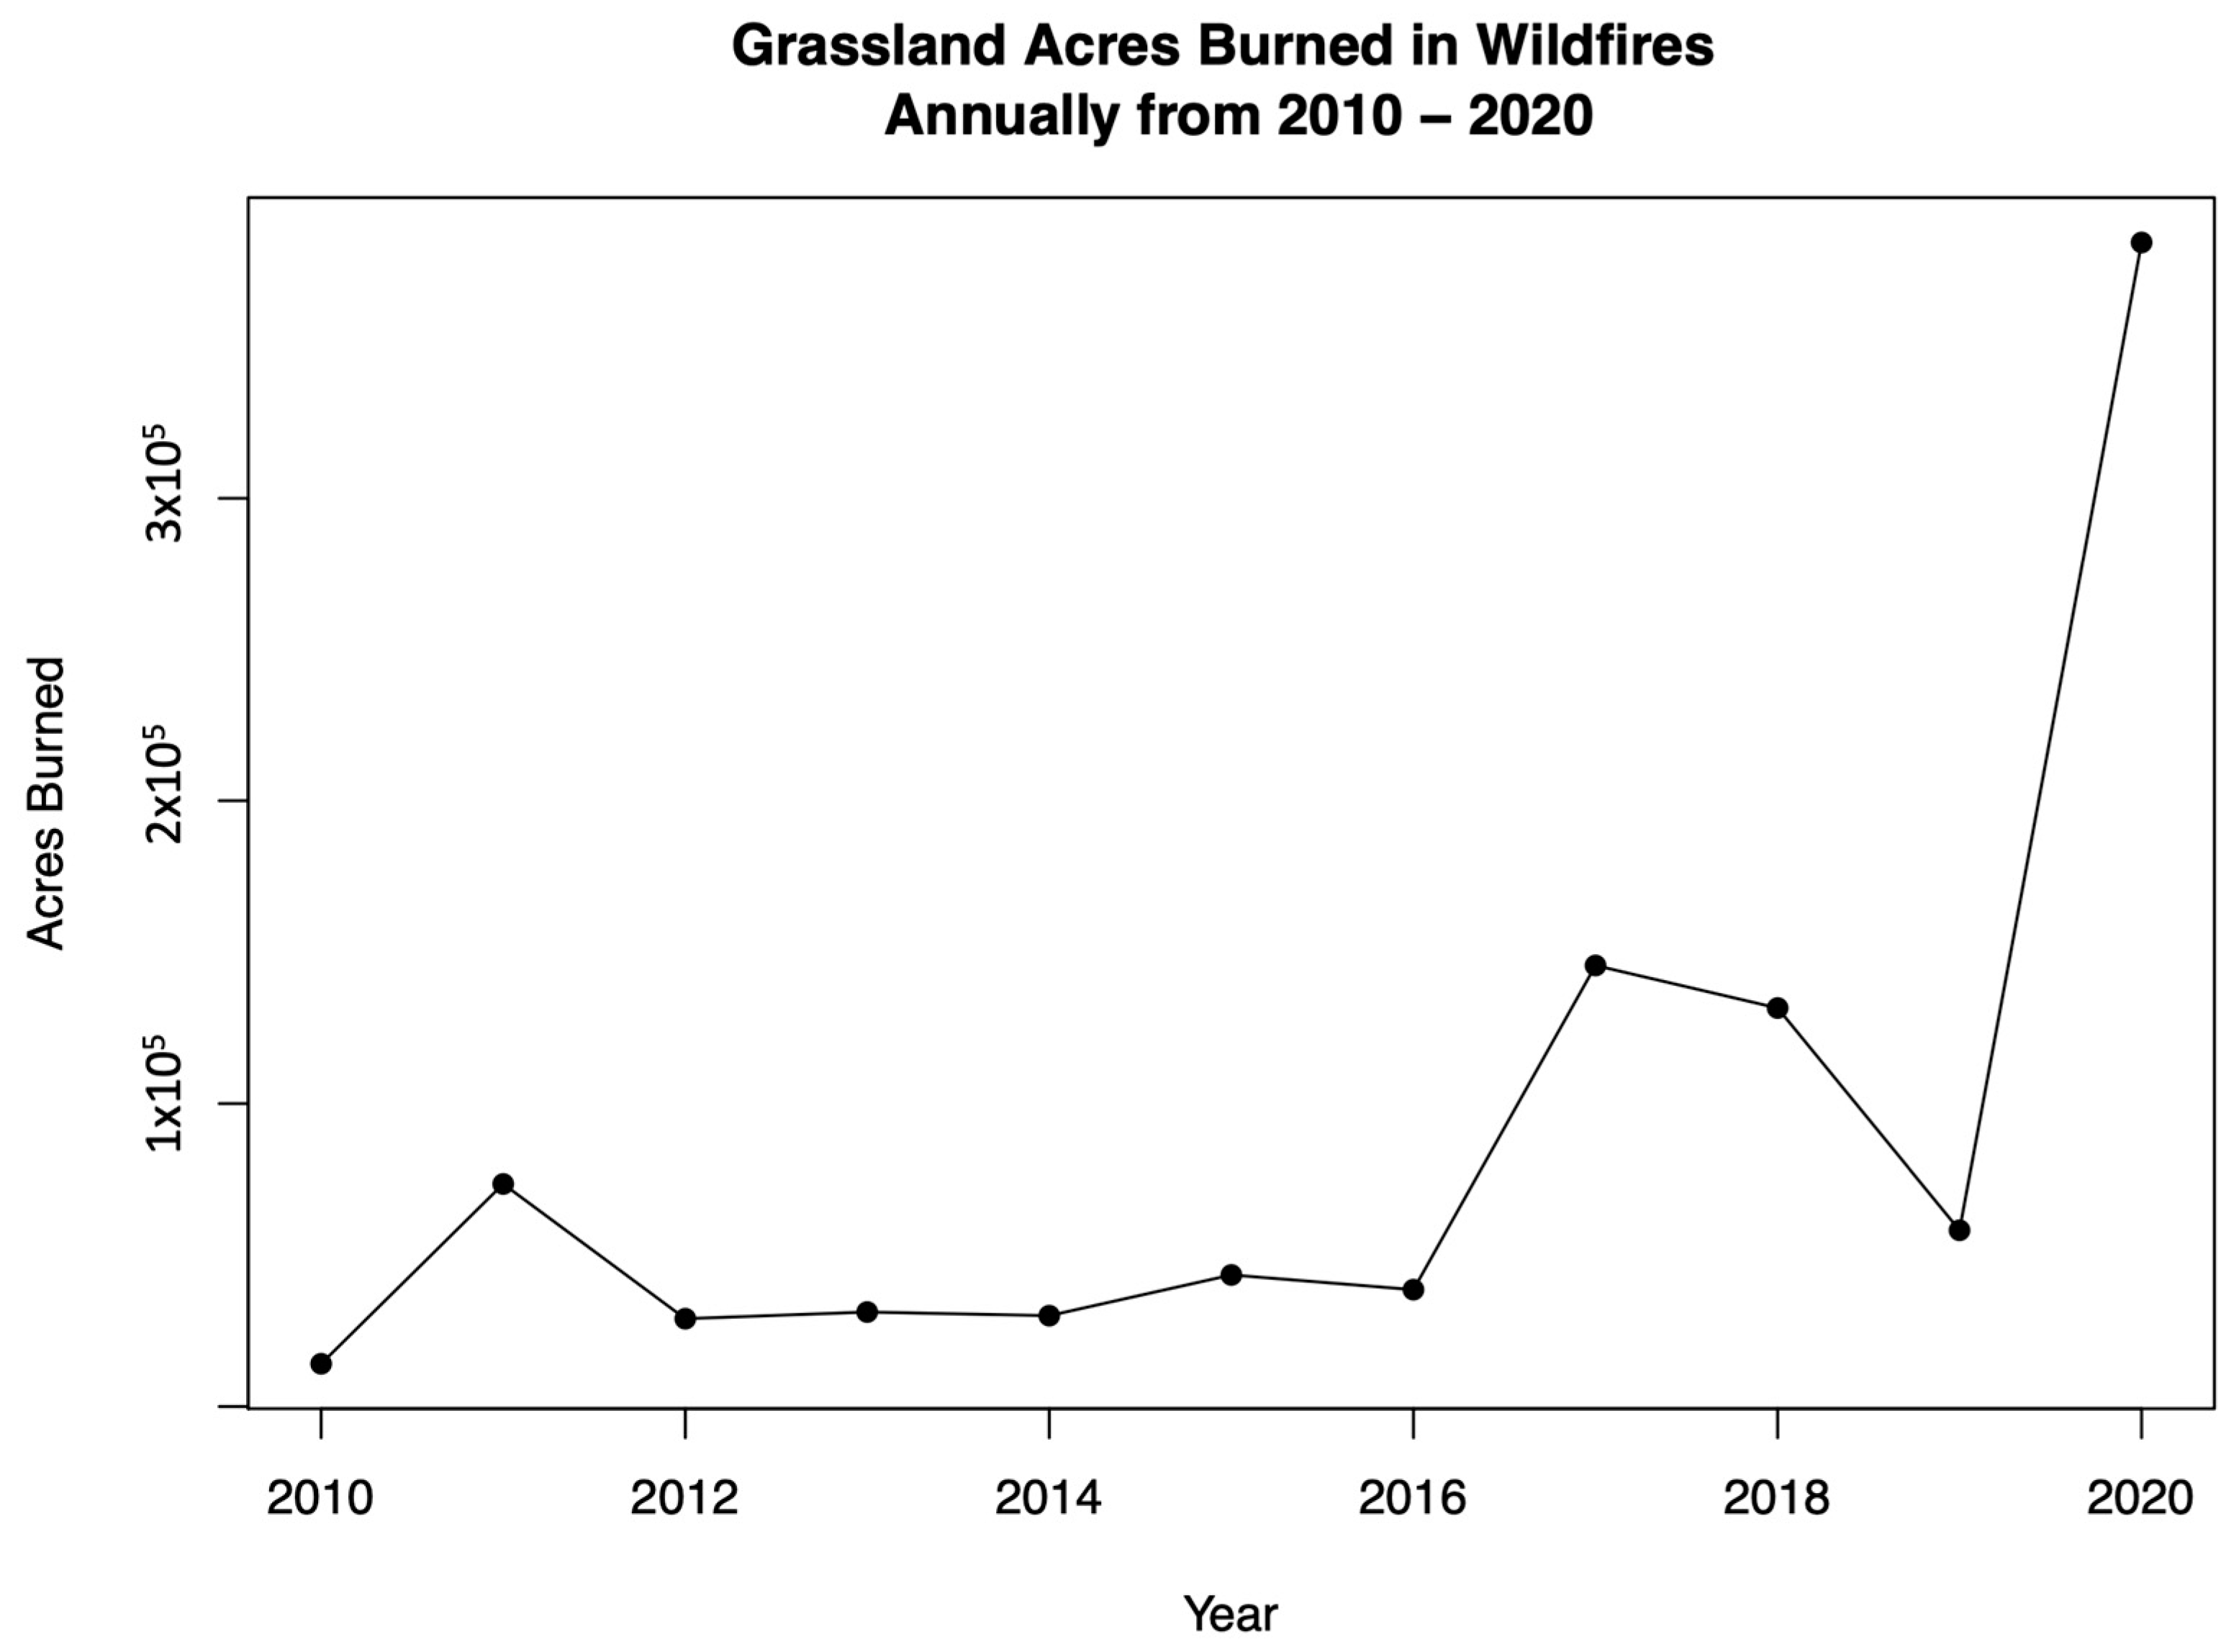
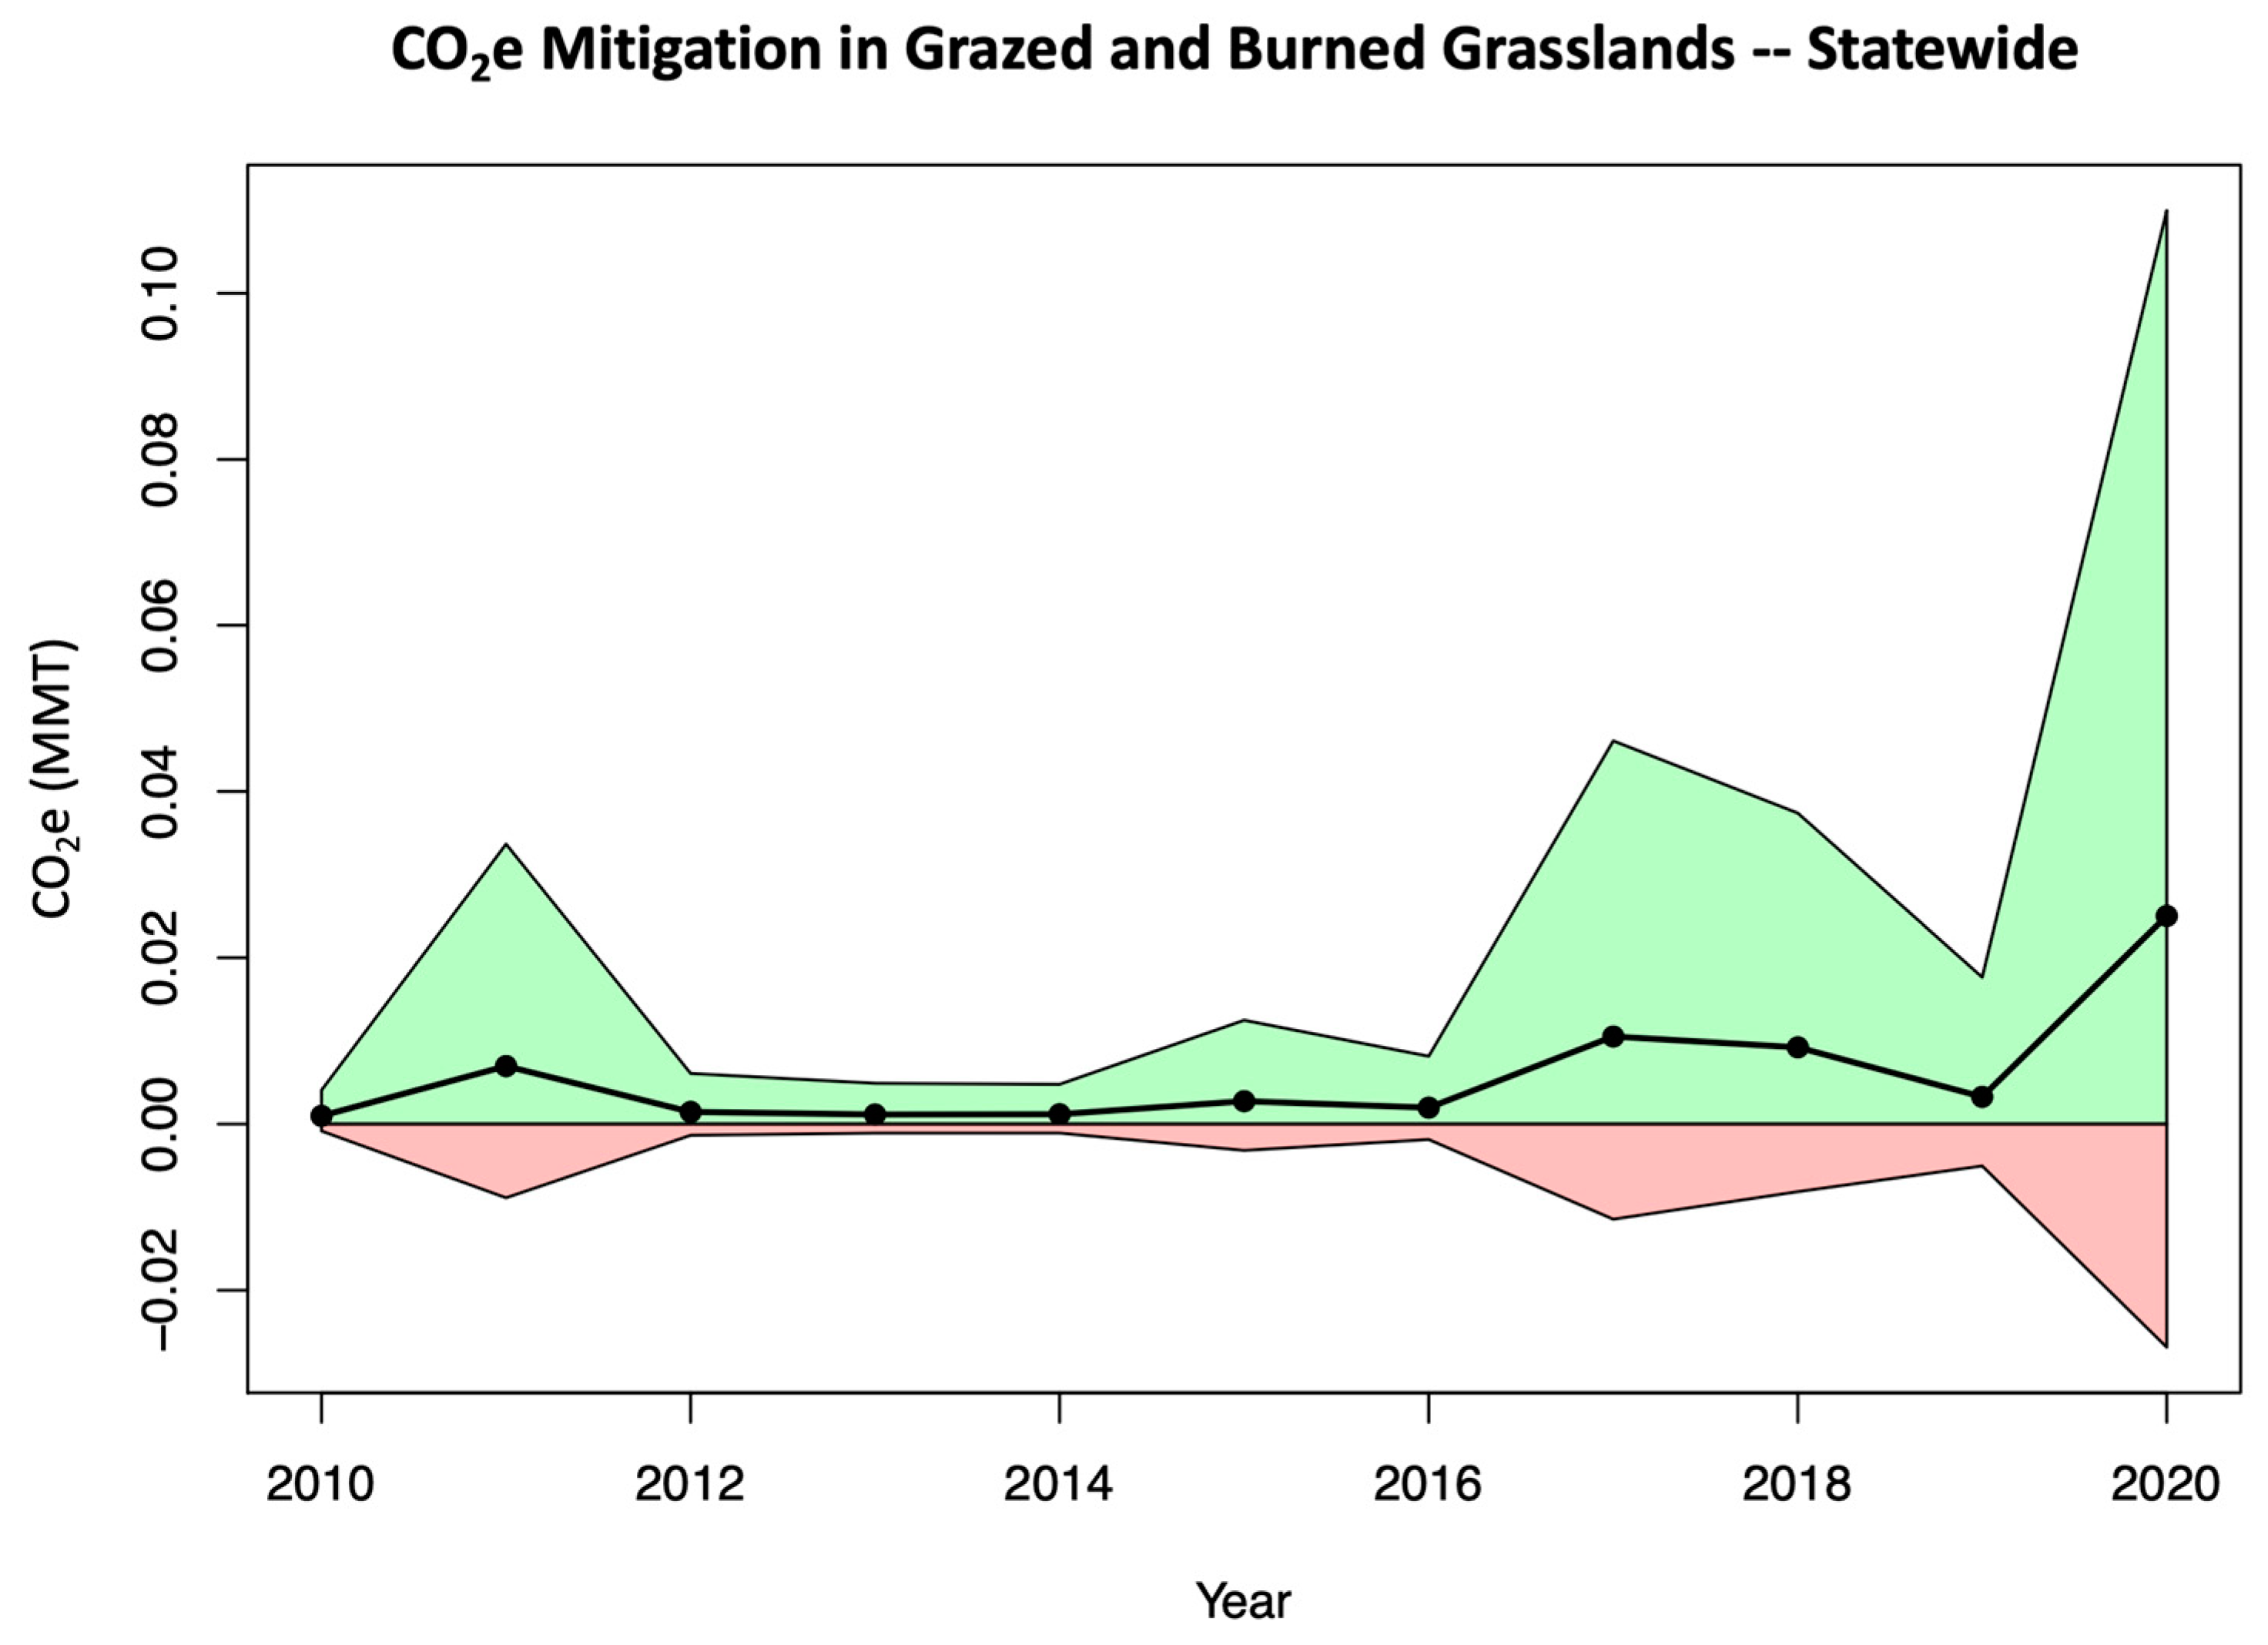
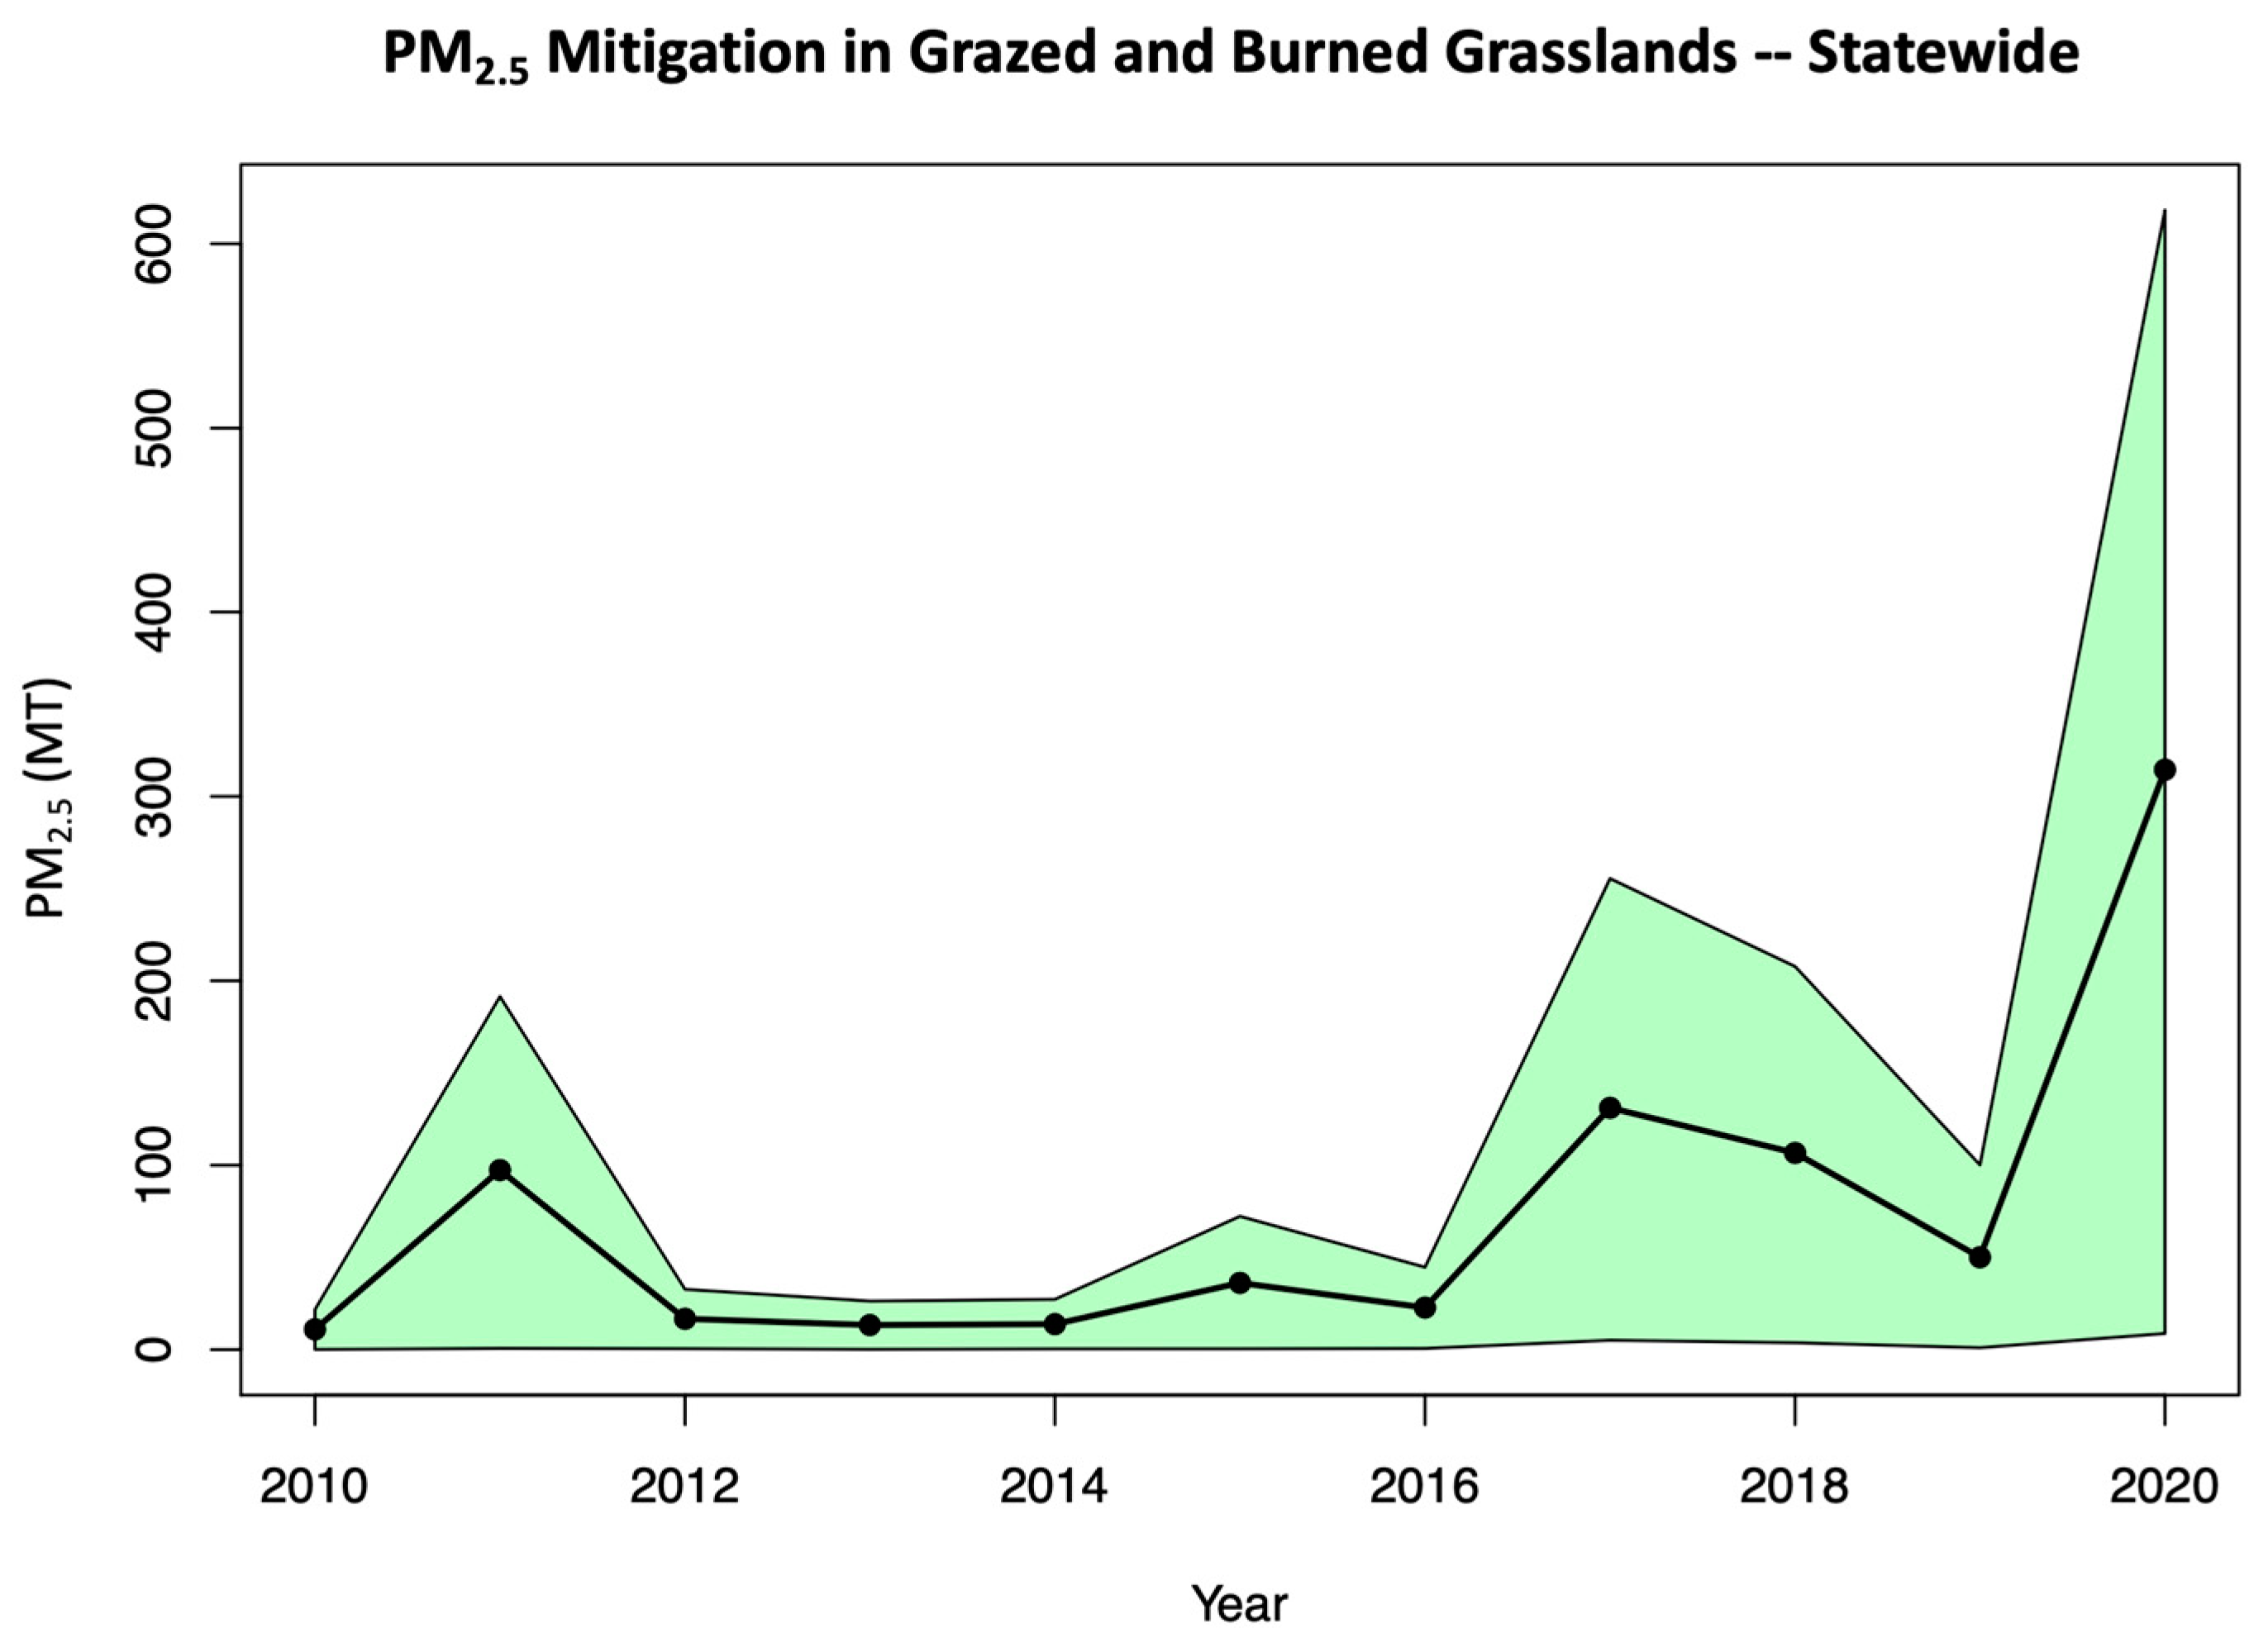
3.1. State-Wide Analysis

Between 2010 and 2020, an average of 36,037 ha (89,049 ac) of grassland burned annually in wildfires in California. Over that time period, there was a trend of larger areas of grassland burning annually (Figure 2). The average annual burn area varies significantly between regions of the state, from 1877 ha (4637 ac) in the Southeast Interior counties to 10,936 ha (27,023 ac) in the Sacramento–Sierra–Cascade region (Table 1). In general, the counties with a larger grassland area burned also had higher average fuel removal rates due to higher livestock stocking rates. Grazing resulted in variable fuel removal between regions. On average, between 2010 and 2020, grazing livestock removed 11,590 metric tons (12,775 tons) of fuel each year from California grasslands that later burned in wildfires (Figure 3 and Figure 4).

3.2. SCU Lightning Complex Wildfire

The SCU Lightning Complex Fires burned a total of 22,817 hectares (56,382 acres) of grazed grassland in Santa Clara County, San Joaquin County, Stanislaus County, and Alameda County (Table 2). Eight hundred and twenty-three acres of grazed grassland in Santa Clara County were omitted because it occurred on parcels with less than 81 hectares (200 acres) of burned grassland, and 291 hectares (718 acres) of burned grassland was omitted in Alameda County because it was outside the East Bay Regional Parks District and San Francisco Public Utilities Commission lands. Burned areas included privately owned land in addition to the public lands in the SFPUC Alameda Watershed and the EBRPD. Cumulatively, grazing in grasslands affected by the SCU Lightning Complex Fires resulted in the estimated removal of 9618 MT (10,602 tons) of forage (and fuel) before the SCU fires began (Table 2).
This forage would support 21,203 cows (and calves up to 6 months of age) for one month or 1767 cows for a year. The forage consumed by these animals resulted in the estimated emission of 239 MT of methane (99.7% from enteric fermentation) and 3.5 MT of nitrous oxide from nitrogen excreted in manure. These emissions have a cumulative impact of 0.008 MMT (7753 MT) of CO2e.
If the forage that was consumed by cattle was instead burned in the SCU fires, the model predicts that 0.0051 MMT (5109 MT) more CO2e would have been emitted. The majority of this difference in CO2e is due to the emission of black carbon from the combustion of fuel, which accounted for 0.01 MMT (10,600 MT) of CO2e. As with the state-wide results, high uncertainty in the GWP100 estimate for black carbon is responsible for most of the uncertainty in the results.

3.3. Effect of Shrub Encroachment on GHG/PM Emissions in Fire

In our model, if the grassland area that burned in the Central and North Coast regions in 2020 had instead been shrublands, these fires would have released between 0.35 and 0.90 MMT (0.39 to 0.99 million tons) more CO2e and 3674 to 8448 MT (4050 to 9312 tons) more PM2.5 than fires in grazed grasslands would have, depending on shrub type. When compared to the 0.02 MMT CO2e and the 302 MT of PM2.5 mitigated by grazing herbaceous fuels in grasslands across the whole state in 2020, the long-term impact of preventing grasslands from becoming shrublands in just the Central and North Coast regions could have an 18 to 45 and 12 to 28 times greater impact on mitigating CO2e and PM2.5 emissions from wildfire (respectively) than reducing herbaceous fuels through grazing at the state-wide level. These estimates are based on existing grasslands being converted to 100% cover of shrublands before burning. The magnitude of these emissions is highly dependent on the percentage of grassland that is converted to shrubland, the rate of encroachment, and the total aboveground biomass attained by the shrubland before burning.

4. Discussion

4.1. CO2 Equivalents

Taking into account the GHGs emitted by cattle grazing as well as the GHGs emitted by wildfires reveals that grazing tends to reduce the amount of CO2e emitted from wildfires in grazed grasslands. In 2020, when the largest area of grassland burned in the past 11 years, this mitigation of greenhouse gasses via grazing totaled 0.025 MMT (0.028 million tons) of CO2e statewide. While significant, it is a very small portion of the estimated 107 MMT of CO2 released by wildfires in California in 2020, the majority of these emissions coming from forests [7]. On average, only 36,037 hectares (89,049 acres) of grassland burned annually between 2010 and 2020. This is a small fraction of the grazed grasslands in California. In years where grazing occurs in an area but there is no wildfire, there are still CH4 and N2O emissions from cattle grazing, so there is a net emission of GHGs in those years from grazing. Therefore, over time, the degree to which grazing will contribute to or offset GHG emissions from wildfire in an area is a factor of fire return intervals, total forage production, and the total consumption of forage by cattle.
Our model’s estimate of the GHG mitigation provided by cattle grazing on grasslands that go on to burn is likely an underestimate. There are several variables that this analysis did not consider, which could potentially increase the total amount of CO2e mitigated by grazing in grasslands that go on to burn. For instance, grazed grasslands may exhibit less severe fire behavior than ungrazed grasslands [22,38,39,40,41,59], thus reducing the total burn area. Another variable we did not consider was the long-term accumulation of fuels. Even annual grasslands may accumulate multiple years of residual dry matter that can increase biomass over time. However, this accumulation is affected by site factors, annual weather, management, and vegetation; thus, it is not directly estimable using existing models. Therefore, our analysis only looked at forage consumed annually, rather than comparing the long-term exclosure of grazing with grazed grasslands.
A major limitation in our ability to estimate the effect of livestock grazing on CO2e emissions from wildfires is the high degree of uncertainty associated with GWP values for black carbon [10]. If black carbon is excluded from our model, the effect of grazing on CO2e from grasslands that burn is negligible or even positive. However, if black carbon is included, the effect is strongly negative—although the 5 to 95 percentile spread of the data includes some positive values (Figure 3). Additionally, black carbon’s impact on global temperature may be on the higher end of the Myhre et al. (2013) [10] spectrum [60]. More specific parameters on the GWP of black carbon and related compounds (such as brown carbon) would help provide more precise estimates.

4.2. PM2.5

PM2.5 is an important air pollutant both because of its heat-trapping potential and its negative effects on human health. In our model, grazing (if present) only reduced emissions of PM2.5 in burned grasslands. Between 2010 and 2020, the average PM2.5 mitigation provided by grazing in grasslands that burned in wildfires was only 0.02% of the state’s average total estimated annual PM2.5 emissions and 0.04% of the state’s average annual PM2.5 emissions from wildfire during that period [9,61]. However, PM2.5 emissions occurring closer to or upwind from population centers can have a greater effect on air quality in nearby regions than more distant fires [11,12]. Therefore, grazing may be especially useful as a tool for reducing herbaceous fuels and potential associated PM2.5 emissions from wildfire, in close proximity to or upwind from population centers.

4.3. Shrub/Grass Dynamics

The biggest impact of grazing and ranching on CO2e and PM2.5 emissions from wildfire is arguably in their longer-term influence on the balance of grasses and shrubs in California rangelands. The relationship between shrub encroachment, the persistence of shrub stands, and the accumulation of fuels is complex and varies depending on region, ecological site factors, shrubland type, and management practices [29,30,31,32,62]. Grazing and associated ranch management practices such as shrub removal can slow or stop shrub encroachment into grasslands in coastal regions of the state or may even cause type conversions from shrublands to grasslands [29,31,32]. However, in montane meadows and hot desert (Mojave and Sonoran) rangelands, grazing may cause or exacerbate shrub encroachment [63,64,65,66].
Shrublands have much more aboveground biomass when compared to grasslands, with higher levels of belowground root biomass as well, although soil C storage can be similar in the two ecosystem types [32,33,34]. In the Central and North Coast regions of California, mature Northern Coastal Scrub can have 18.73 MT/ha (8.4 tons/acre) of aboveground biomass [32] and mature Coastal Sage Scrub can have 38.1 MT/ha (17 tons/ac) of aboveground biomass [45], while many grazed grasslands carry only between 900 and 3363 kg/ha (800–3000 lbs/ac) of aboveground biomass at the end of the grazing season (peak fire season).
However, the accumulation of aboveground biomass in shrublands results in the storage of atmospheric carbon. Therefore, unlike grasslands, where research has shown mixed or uncertain results from the effect of grazing management on ecosystem carbon storage [23,26,27,28,67], rangelands that experience shrub encroachment in the absence of grazing will accumulate aboveground carbon up to some point determined by the shrub type, ecosystem constraints, or major disturbances (such as wildfires).
As a result, the question of whether livestock grazing leads to more or less radiative forcing from the long-term management of rangelands with alternate grassland and shrub states requires further research and will rely on several variables, including (but not limited to): (1) fire return interval, (2) shrub encroachment rates, (3) long-term grazing emissions, and (4) the total C stored in plant material.
CO2e is only one consideration when contemplating the cumulative effect of livestock grazing on wildfires in grassland–shrubland mosaic systems. Wildfires in shrublands emit far greater levels of PM2.5 than grasslands. As PM2.5 associated with livestock grazing is assumed to be negligible, this would be a net emission associated with shrub encroachment and subsequent wildfire. Similarly, the accumulation of fuels associated with shrub encroachment can lead to more severe wildfire behavior. High fuel loads can lead to long flame lengths, a rapid rate of spread, and high fireline heat intensity [59,68,69,70,71,72]. As a consequence, all emissions will increase if wildfires are more difficult to fight and cover a greater area, and other factors such as public safety, air quality, public health, and the production of ecosystem services may also suffer with more intense wildfires [73,74,75,76,77,78].

5. Conclusions

Cattle grazing significantly reduces herbaceous fuels in grazed California rangelands. Approximately 5.3 MMT (5.8 million tons) of fuel are removed by cattle from California rangelands annually [22], leading to the transformation of approximately 2.4 MMT (2.6 million tons) of carbon. This is on par with the 4.6 MMT of carbon transformed by forestry management in the state [7]. Of the 34 million acres grazed annually in California, tens of thousands of acres burn in wildfires each year. Between 2010 and 2020, cattle removed between 1580 MT (1742 tons) and 49,147 MT (54,175 tons) of fuel annually from grasslands that went on to burn in wildfires. After accounting for the production of methane and nitrous oxide emitted by cattle consuming this forage, there is a modest reduction in CO2e associated with grazing in grasslands that burn. This number does not alter the order of the magnitude of CO2e emissions from the beef industry in California; however, it demonstrates that fuel management by livestock can, to a minor degree, mitigate greenhouse gas and particulate emissions from grasslands that burn in wildfires.
In addition to CO2e emissions, cattle grazing can mitigate PM2.5 emissions associated with grassland wildfires. The strategic grazing of grasslands that are proximate to or upwind of population centers can help ensure that these PM2.5 reductions provide the most benefit for public health. The identification of these strategic areas is a topic for further research that would enable guidelines for rangeland management practices to optimally reduce fuel loads and potentially prevent shrub encroachment in key areas.
In areas of the state with documented grassland–shrubland successional dynamics, the long-term maintenance of grassland ecosystems by grazing and associated ranching practices may have much bigger effects on mitigating the emissions of greenhouse gasses and particulate matter from wildfires when compared with the effects of reducing herbaceous fuels alone. Transitions between grassland and shrubland states need to be better defined with respect to shrubland types, management, and ecological site factors across California to better understand the long-term impact of grazing management on wildfire risk, severity, and emissions.
The extent of wildfires in California has increased dramatically as a result of climate change and is predicted to increase with future warming [2,3]. The production of herbaceous forage (i.e., fuel) is predicted to increase and become more variable in some regions of the state [79]. The mitigation of wildfire emissions by livestock grazing is a function of fire return interval, the consumption of forage by livestock, and the accumulation of fuel (and carbon sequestered in that fuel) in the absence of grazing. Maximizing the benefit of livestock grazing as a tool for reducing wildfire emissions will require maintaining flexible grazing arrangements that support ranchers in the face of growing uncertainty in forage production and implementing a tactical grazing approach that targets fuel reduction in strategic areas that reduce the spread of and emissions from wildfires.

Supplementary Materials

The Supplementary Material offers more detail on the model parameters and equations used to estimate greenhouse gas and particulate matter emissions from livestock management and wildfires. The following supporting information can be downloaded at: https://www.mdpi.com/article/10.3390/su151813539/s1, Table S1: Emission factors and model parameters used in the GHG_PM Model; Equations S1–S5. References [8,10,23,26,42,45,46,47,48,49,80] are cited in the supplementary materials.

Author Contributions

Conceptualization, F.R., S.B., D.R. and F.M.; methodology, F.R., S.B., D.R., R.P., T.B., F.M., E.K., K.M. and M.J.; software, F.R.; validation, S.B., F.M. and E.K.; formal analysis, F.R.; investigation, F.R., S.B., D.R., R.P., T.B., F.M., E.K., K.M. and M.J.; data curation, F.R., S.B., R.P., T.B. and K.M.; writing—original draft preparation, F.R., S.B., D.R., R.P., T.B., F.M., E.K., K.M. and M.J.; writing—review and editing, F.R., S.B., D.R., R.P., T.B., F.M., E.K., K.M. and M.J.; visualization, F.R., S.B., D.R., R.P. and K.M.; supervision, F.R., S.B., D.R. and F.M.; project administration, D.R. and F.R.; funding acquisition, D.R. All authors have read and agreed to the published version of the manuscript.

Funding

This research was funded by the California Cattle Council.

Institutional Review Board Statement

Not applicable.

Informed Consent Statement

Not applicable.

Data Availability Statement

Not applicable.

Acknowledgments

The authors thank Klaus Scott for his feedback on the emissions models.

Conflicts of Interest

The authors declare no conflict of interest. The funders had no role in the design of the study; in the collection, analysis, or interpretation of data; in the writing of the manuscript; or in the decision to publish the results.

References

  1. Li, A.X.; Wang, Y.; Yung, Y.L. Inducing Factors and Impacts of the October 2017 California Wildfires. Earth Space Sci. 2019, 6, 1480–1488. [Google Scholar] [CrossRef]
  2. Westerling, A.L. Wildfire Simulations for California’s Fourth Climate Change Assessment: Projecting Changes in Extreme Wildfire Events with a Warming Climate; State of California Energy Commission: Sacramento, CA, USA, 2018.
  3. Williams, A.P.; Abatzoglou, J.T.; Gershunov, A.; Guzman-Morales, J.; Bishop, D.A.; Balch, J.K.; Lettenmaier, D.P. Observed Impacts of Anthropogenic Climate Change on Wildfire in California. Earths Future 2019, 7, 892–910. [Google Scholar] [CrossRef]
  4. Yoon, J.-H.; Wang, S.-Y.S.; Gillies, R.R.; Hipps, L.; Kravitz, B.; Rasch, P.J. Extreme fire season in California: A glimpse into the future? Bull. Am. Meteorol. Soc. 2015, 96, S5–S9. [Google Scholar] [CrossRef]
  5. Huntsinger, L.; Barry, S. Grazing in California’s Mediterranean Multi-firescapes. Front. Sustain. Food Syst. 2021, 5, 715366. [Google Scholar] [CrossRef]
  6. Starrs, C.F.; Butsic, V.; Stephens, C.; Stewart, W. The impact of land ownership, firefighting, and reserve status on fire probability in California. Environ. Res. Lett. 2018, 13, 034025. [Google Scholar] [CrossRef]
  7. California Air Resources Board (CARB). Wildfire Emission Estimates for 2020; California Air Resources Board: Sacramento, CA, USA, 2021.
  8. Urbanski, S. Wildland fire emissions, carbon, and climate: Emission factors. For. Ecol. Manag. 2014, 317, 51–60. [Google Scholar] [CrossRef]
  9. Chow, J.C.; Watson, J.G.; Lowenthal, D.H.; Chen, L.-W.A.; Motallebi, N. Black and Organic Carbon Emission Inventories: Review and Application to California. J. Air Waste Manag. Assoc. 2010, 60, 497–507. [Google Scholar] [CrossRef]
  10. Myhre, G.; Shindell, D.; Bréon, F.-M.; Collins, W.; Fuglestvedt, J.; Huang, J.; Koch, D.; Lamarque, J.-F.; Lee, D.; Mendoza, B.; et al. Anthropogenic and Natural Radiative Forcing. In Climate Change 2013: The Physical Science Basis. Contribution of Working Group I to the Fifth Assessment Report of the Intergovernmental Panel on Climate Change; Stocker, T.F., Qin, D., Plattner, G.-K., Tignor, M., Allen, S.K., Doschung, J., Nauels, A., Xia, Y., Bex, V., Midgley, P.M., Eds.; Cambridge University Press: Cambridge, UK; New York, NY, USA, 2013. [Google Scholar]
  11. Jaffe, D.A.; O’Neill, S.M.; Larkin, N.K.; Holder, A.L.; Peterson, D.L.; Halofsky, J.E.; Rappold, A.G. Wildfire and prescribed burning impacts on air quality in the United States. J. Air Waste Manag. Assoc. 2020, 70, 583–615. [Google Scholar] [CrossRef]
  12. Navarro, K.; Vaidyanathan, A. Notes from the Field: Understanding Smoke Exposure in Communities and Fire Camps Affected by Wildfires—California and Oregon, 2020. Morb. Mortal. Wkly. Rep. 2020, 69, 1873–1875. [Google Scholar] [CrossRef]
  13. Shi, H.; Jiang, Z.; Zhao, B.; Li, Z.; Chen, Y.; Gu, Y.; Jiang, J.H.; Lee, M.; Liou, K.-N.; Neu, J.L.; et al. Modeling Study of the Air Quality Impact of Record-Breaking Southern California Wildfires in December 2017. J. Geophys. Res. Atmos. 2019, 124, 6554–6570. [Google Scholar] [CrossRef] [PubMed]
  14. Spiegal, S.; Huntsinger, L.; Hopkinson, P.; Bartolome, J.W. Range Ecosystems. In Ecosystems of California; Mooney, H., Zavaleta, E., Eds.; University of California Press: Berkeley, CA, USA, 2016; pp. 835–864. [Google Scholar]
  15. Van Soest, P.J. Nutritional Ecology of the Ruminant; Comstock Publishing Associates, Cornell University Press: New York, NY, USA, 1994. [Google Scholar]
  16. U.S. Bureau of Land Management (BLM). California Rangeland Management and Grazing. 2022. Available online: https://www.blm.gov/programs/natural-resources/rangeland-and-grazing/rangeland-health/california (accessed on 15 December 2022).
  17. CDFA (California Department of Food and Agriculture). Links to County Crop Reports. For Our Analysis, We Used 2017 Crop Reports. 2022. Available online: https://www.cdfa.ca.gov/exec/county/CountyCropReports.html (accessed on 30 August 2023).
  18. USDA National Agriculture Statistics Service. 2017 Census of Agriculture; United States Department of Agriculture: Washington, DC, USA, 2017.
  19. U.S. Forest Service (USFS). S_USA. Allotment: U.S. Forest Service. 2021. Available online: http://data.fs.usda.gov/geodata/edw/datasets.php (accessed on 15 July 2021).
  20. Barry, S. Livestock Mobility Through Integrated Beef Production-Scapes Supports Rangeland Livestock Production and Conservation. Front. Sustain. Food Syst. 2021, 4, 549359. [Google Scholar] [CrossRef]
  21. Saitone, T.L. Livestock and Rangeland in California. In California Agriculture: Dimensions and Issues; Martin, P.L., Goodhue, R.E., Wright, B.D., Eds.; UC Berkeley: Giannini Foundation of Agricultural Economics: Berkeley, CA, USA, 2018; Chapter 9. [Google Scholar]
  22. Ratcliff, F.; Rao, D.; Barry, S.; Dewees, S.; Macaulay, L.; Larsen, R.; Shapero, M.; Peterson, R.; Moritz, M.; Forero, L. Cattle grazing reduces fuel and leads to more manageable fire behavior. Calif. Agric. 2022, 76, 60–69. [Google Scholar] [CrossRef]
  23. Booker, K.; Huntsinger, L.; Bartolome, J.W.; Sayre, N.F.; Stewart, W. What can ecological science tell us about opportunities for carbon sequestration on arid rangelands in the United States? Glob. Environ. Chang. 2013, 23, 240–251. [Google Scholar] [CrossRef]
  24. Ma, S.; Baldocchi, D.D.; Xu, L.; Hehn, T. Inter-annual variability in carbon dioxide exchange of an oak/grass savanna and open grassland in California. Agric. For. Meteorol. 2007, 147, 157–171. [Google Scholar] [CrossRef]
  25. Xu, L.; Baldocchi, D.D. Seasonal variation in carbon dioxide exchange over a Mediterranean annual grassland in California. Agric. For. Meteorol. 2004, 123, 79–96. [Google Scholar] [CrossRef]
  26. Buckley Biggs, N.; Huntsinger, L. Managed Grazing on California Annual Rangelands in the Context of State Climate Policy. Rangel. Ecol. Manag. 2021, 76, 56–68. [Google Scholar] [CrossRef]
  27. Carey, C.; Gravuer, K.; Gennet, S.; Osleger, D.; Wood, S. Supporting evidence varies for rangeland management practices that seek to improve soil properties and forage production in California. Calif. Agric. 2020, 74, 101–111. [Google Scholar] [CrossRef]
  28. Silver, W.L.; Ryals, R.; Eviner, V. Soil Carbon Pools in California’s Annual Grassland Ecosystems. Rangel. Ecol. Manag. 2010, 63, 128–136. [Google Scholar] [CrossRef]
  29. Ford, L.D.; Hayes, G.F. Northern Coastal Scrub and Coastal Prairie. In Terrestrial Vegetation of California, 3rd ed.; Barbour, M., Ed.; University of California Press: Berkeley, CA, USA, 2007; pp. 180–207. [Google Scholar]
  30. Keeley, J.E. Fire history of the San Francisco East Bay region and implications for landscape patterns. Int. J. Wildland Fire 2005, 14, 285. [Google Scholar] [CrossRef]
  31. McBride, J.; Heady, H.F. Invasion of Grassland by Baccharis pilularis DC. J. Range Manag. 1968, 21, 106. [Google Scholar] [CrossRef]
  32. Russell, W.H.; McBride, J.R. Landscape scale vegetation-type conversion and fire hazard in the San Francisco bay area open spaces. Landsc. Urban Plan. 2003, 64, 201–208. [Google Scholar] [CrossRef]
  33. Bohlman, G.N.; Underwood, E.C.; Safford, H.D. Estimating Biomass in California’s Chaparral and Coastal Sage Scrub Shrublands. Madroño 2018, 65, 28–46. [Google Scholar] [CrossRef]
  34. Khalili, B.; Ogunseitan, O.A.; Goulden, M.L.; Allison, S.D. Interactive effects of precipitation manipulation and nitrogen addition on soil properties in California grassland and shrubland. Appl. Soil Ecol. 2016, 107, 144–153. [Google Scholar] [CrossRef]
  35. Stackhouse-Lawson, K.R.; Rotz, C.A.; Oltjen, J.W.; Mitloehner, F.M. Carbon footprint and ammonia emissions of California beef production systems. J. Anim. Sci. 2012, 90, 4641–4655. [Google Scholar] [CrossRef]
  36. Gerber, P.J.; Steinfeld, H.; Henderson, B.; Mottet, A.; Opio, C.; Dijkman, J.; Falcucci, A.; Tempio, G. Tackling Climate Change through Livestock—A Global Assessment of Emissions and Mitigation Opportunities; Food and Agriculture Organization of the United Nations (FAO): Rome, Italy, 2013; Available online: https://www.fao.org/3/i3437e/i3437e.pdf (accessed on 30 August 2023).
  37. California Air Resources Board (CARB). Greenhouse Gas Emission Inventory—Query Tool for Years 2000 to 2018, 13th ed.; California Air Resources Board: Sacramento, CA, USA, 2019. Available online: https://www.arb.ca.gov/app/ghg/2000_2018/ghg_sector.php (accessed on 22 July 2021).
  38. Bunting, S.C.; Kilgore, B.M.; Bushey, C.L. Guidelines for Prescribed Burning Sagebrush-Grass Rangelands in the Northern Great Basin; Intermountain Forest and Range Experiment Station, Forest Service, U.S. Department of Agriculture: Ogden, UT, USA, 1987.
  39. Kerby, J.D.; Fuhlendorf, S.D.; Engle, D.M. Landscape heterogeneity and fire behavior: Scale-dependent feedback between fire and grazing processes. Landsc. Ecol. 2007, 22, 507–516. [Google Scholar] [CrossRef]
  40. Launchbaugh, K.L. Targeted Grazing to Manage Wildland Fuels and Alter Fire Behaviour. In Proceedings of the 10th International Rangeland Conference, Saskatoon, SK, Canada, 17–22 July 2016; Iwaasa, A., Lardner, H.A., Schellenberg, M., Willms, W., Larson, K., Eds.; pp. 674–675. [Google Scholar]
  41. Taylor, C.A. Targeted Grazing to Manage Fire Risk. In Targeted Grazing: A Natural Approach to Vegetation Management and Landscape Enhancement; Launchbaugh, K.L., Ed.; American Sheep Industry Association: Denver, CO, USA, 2006; Chapter 12; pp. 107–114. [Google Scholar]
  42. Intergovernmental Panel on Climate Change (IPCC). 2019. Available online: https://www.ipcc-nggip.iges.or.jp/public/2019rf/vol4.html (accessed on 30 August 2023).
  43. Intergovernmental Panel on Climate Change (IPCC). Uncertainties. IPCC Guidelines for National Greenhouse Gas Inventories. 2006. Available online: https://www.ipcc-nggip.iges.or.jp/public/2006gl/pdf/1_Volume1/V1_3_Ch3_Uncertainties.pdf (accessed on 30 August 2023).
  44. Uddin, M.E.; Tricarico, J.M.; Kebreab, E. Impact of nitrate and 3-nitrooxypropanol on the carbon footprints of milk from cattle produced in confined-feeding systems across regions in the United States: A life cycle analysis. J. Dairy Sci. 2022, 105, 5074–5083. [Google Scholar] [CrossRef]
  45. First Order Fire Effects Model (FOFEM). First Order Fire Effects Model; Version 6.7; Fire and Aviation Management Rocky Mountain Research Station, United States Forest Service: Fort Collins, CO, USA, 2020.
  46. Cromer, E.D. A Comparative Analysis of the Nutrient Composition and Digestibility of California Perennial and Annual Grasses at Four Stages of Growth. Master’s Thesis, California Polytechnic State University, San Luis Obispo, CA, USA, 2017. [Google Scholar]
  47. Friedl, A.; Padouvas, E.; Rotter, H.; Varmuza, K. Prediction of Heating Values of Biomass Fuel from Elemental Composition. Anal. Chim. Acta 2005, 544, 191–198. [Google Scholar] [CrossRef]
  48. Royce, L.; Cook, D.; Gardner, D.R.; Lee, S.T.; Shapero, M.; Althouse, L.; Dennis, M.; Forero, L.C.; Davy, J.S.; Rao, D.R.; et al. Seasonal Changes in Forage Nutrient and Toxicity Levels on California Central Coast Rangelands: A Preliminary Study. Grasslands 2021, 31, 15–23. [Google Scholar]
  49. National Research Council. Nutrient Requirements of Beef Cattle. Seventh Revised Edition: Update 2000; National Academy of Sciences: Washington, DC, USA, 2000. [Google Scholar]
  50. California Air Resources Board (CARB). California’s Black Carbon Emission Inventory Technical Support Document; California Air Resources Board: Sacramento, CA, USA, 2015.
  51. R Core Team. R: A Language and Environment for Statistical Computing; R Foundation for Statistical Computing: Vienna, Austria, 2018; Available online: https://www.R-project.org (accessed on 30 August 2023).
  52. ESRI. ArcGIS Desktop: Release 10.7.1.; Environmental Systems Research Institute: Redlands, CA, USA, 2021. [Google Scholar]
  53. CAL Fire. CAL Fire Fire Perimeters Data; CAL Fire FRAP: Sacramento, CA, USA, 2021.
  54. U.S. Geological Survey (USGS) Gap Analysis Project (GAP). U.S. Geological Survey–Gap Analysis Project Species Range Maps CONUS_2001: U.S. Geological Survey Data Release. 2018. Available online: https://doi.org/10.5066/F7Q81B3R (accessed on 30 August 2023).
  55. Bay Area Open Space Council. The Conservation Lands Network 2.0 Report; Bay Area Open Space Council: Berkeley, CA, USA, 2019; Available online: https://www.bayarealands.org/wp-content/uploads/2019/10/CLN%202.0%20Final%20Report.Web.pdf (accessed on 30 August 2023).
  56. Bartolome, J.; Hammond, M.; Hopkinson, P.; Ratcliff, F. 1987–2014 Residual Dry Matter Analysis Report and Updated Rangeland Monitoring Guidelines for Livestock Grazed Grasslands within Point Reyes National Seashore and Golden Gate National Recreation Area; UC Berkeley Rangeland Ecology Lab for Point Reyes National Seashore: Berkeley, CA, USA, 2015. [Google Scholar]
  57. Larsen, R.; Shapero, M.; Horney, M.; Althouse, L.; Meade, D.; Brown, K.; Rao, D.; Striby, K.; Rigby, C.; Jensen, K.; et al. Forage Production Report, California Central Coast, 2001–2019; University of California Agriculture and Natural Resources: Templeton, CA, USA, 2020. [Google Scholar]
  58. National Resources Conservation Service (NRCS). Central Coast Rangeland Coalition Indicators of Sustainable Rangeland Stewardship; National Resources Conservation Service, Hollister Service Center: Hollister, CA, USA, 2010.
  59. Davies, K.W.; Bates, J.D.; Svejcar, T.J.; Boyd, C.S. Effects of Long-Term Livestock Grazing on Fuel Characteristics in Rangelands: An Example from the Sagebrush Steppe. Rangel. Ecol. Manag. 2010, 63, 662–669. [Google Scholar] [CrossRef]
  60. Jacobson, M.Z. Effects of biomass burning on climate, accounting for heat and moisture fluxes, black and brown carbon, and cloud absorption effects: Effects of biomass burning on climate. J. Geophys. Res. Atmos. 2014, 119, 8980–9002. [Google Scholar] [CrossRef]
  61. California Air Resources Board (CARB). CEPAM2019v1.03—Standard Emission Tool. 2019. Available online: https://www.arb.ca.gov/app/emsinv/fcemssumcat/fcemssumcat2016.php?_ga=2.125275138.982877380.1628635369-461986019.1627403480 (accessed on 12 August 2021).
  62. Williams, K.; Hobbs, R.J.; Hamburg, S.P. Invasion of an annual grassland in Northern California by Baccharis pilularis ssp. consanguinea. Oecologia 1987, 72, 461–465. [Google Scholar] [CrossRef] [PubMed]
  63. Archer, S.R.; Andersen, E.M.; Predick, K.I.; Schwinning, S.; Steidl, R.J.; Woods, S.R. Woody Plant Encroachment: Causes and Consequences. In Rangeland Systems: Processes, Management and Challenges; Briske, D.D., Ed.; Springer International Publishing: Cham, Switzerland, 2017; Chapter 2; pp. 25–84. [Google Scholar]
  64. Berlow, E.L.; D’Antonio, C.M.; Reynolds, S.A. Shrub Expansion in Montane Meadows: The Interaction of Local-Scale Disturbance and Site Aridity. Ecol. Appl. 2002, 12, 16. [Google Scholar] [CrossRef]
  65. Dull, R.A. Palynological evidence for 19th century grazing-induced vegetation change in the southern Sierra Nevada, California, USA. J. Biogeogr. 1999, 26, 899–912. [Google Scholar] [CrossRef]
  66. Ostoja, S.M.; Brooks, M.L.; Moore, P.E.; Berlow, E.L.; Blank, R.; Roche, J.; Chase, J.; Haultain, S. Potential environmental effects of pack stock on meadow ecosystems of the Sierra Nevada, USA. Rangel. J. 2014, 36, 411–427. [Google Scholar] [CrossRef]
  67. Conant, R.T.; Cerri, C.E.P.; Osborne, B.B.; Paustian, K. Grassland management impacts on soil carbon stocks: A new synthesis. Ecol. Appl. 2017, 27, 662–668. [Google Scholar] [CrossRef] [PubMed]
  68. Bruegger, R.A.; Varelas, L.A.; Howery, L.D.; Torell, L.A.; Stephenson, M.B.; Bailey, D.W. Targeted Grazing in Southern Arizona: Using Cattle to Reduce Fine Fuel Loads. Rangel. Ecol. Manag. 2016, 69, 43–51. Available online: https://frap.fire.ca.gov/mapping/gis-data/ (accessed on 13 August 2021). [CrossRef]
  69. Davies, K.W.; Boyd, C.S.; Bates, J.D.; Hulet, A. Dormant season grazing may decrease wildfire probability by increasing fuel moisture and reducing fuel amount and continuity. Int. J. Wildland Fire 2015, 24, 849. [Google Scholar] [CrossRef]
  70. Diamond, J.M.; Call, C.A.; Devoe, N. Effects of targeted cattle grazing on fire behavior of cheatgrass-dominated rangeland in the northern Great Basin, USA. Int. J. Wildland Fire 2009, 18, 944. [Google Scholar] [CrossRef]
  71. Launchbaugh, K.L.; Brammer, B.; Brooks, M.L.; Bunting, S.; Clark, P.; Davison, J.; Fleming, M.; Kay, R.; Pellant, M.; Pyke, D.A.; et al. Interactions among Livestock Grazing, Vegetation Type, and Fire Behavior in the Murphy Wildland Fire Complex in Idaho and Nevada, July 2007; USGS: Reston, VA, USA, 2008.
  72. Starns, H.D.; Fuhlendorf, S.D.; Elmore, R.D.; Twidwell, D.; Thacker, E.T.; Hovick, T.J.; Luttbeg, B. Recoupling fire and grazing reduces wildland fuel loads on rangelands. Ecosphere 2019, 10, e02578. [Google Scholar] [CrossRef]
  73. Aguilera, R.; Corringham, T.; Gershunov, A.; Benmarhnia, T. Wildfire smoke impacts respiratory health more than fine particles from other sources: Observational evidence from Southern California. Nat. Commun. 2021, 12, 1493. [Google Scholar] [CrossRef]
  74. Calkin, D.; Short, K.; Traci, M. California Wildfires. In U.S. Emergency Management in the 21st Century, 1st ed.; Rubin, C.B., Cutter, S.L., Eds.; Routledge: New York, NY, USA, 2019; pp. 155–182. [Google Scholar]
  75. Hurteau, M.D.; Westerling, A.L.; Wiedinmyer, C.; Bryant, B.P. Projected Effects of Climate and Development on California Wildfire Emissions through 2100. Environ. Sci. Technol. 2014, 48, 2298–2304. [Google Scholar] [CrossRef]
  76. Lee, C.; Schlemme, C.; Murray, J.; Unsworth, R. The cost of climate change: Ecosystem services and wildland fires. Ecol. Econ. 2015, 116, 261–269. [Google Scholar] [CrossRef]
  77. Reid, C.E.; Maestas, M.M. Wildfire smoke exposure under climate change: Impact on respiratory health of affected communities. Curr. Opin. Pulm. Med. 2019, 25, 179–187. [Google Scholar] [CrossRef]
  78. Underwood, E.C.; Hollander, A.D.; Safford, H.D.; Kim, J.B.; Srivastava, L.; Drapek, R.J. The impacts of climate change on ecosystem services in southern California. Ecosyst. Serv. 2019, 39, 101008. [Google Scholar] [CrossRef]
  79. Chaplin-Kramer, R.; George, M. Effects of Climate Change on Range Forage Production in the San Francisco Bay Area. PLoS ONE 2013, 8, e57723. [Google Scholar] [CrossRef]
  80. US EPA. Chapter 5: Agriculture. Inventory of U.S. Greenhouse Gas Emissions and Sinks; United States Environmental Protection Agency: Washington, DC, USA, 2020.
Figure 1. Beef cattle grazing regions of California (from Ratcliff et al. 2022) [22].
Sustainability 15 13539 g001
Figure 2. Acres of grassland burned annually in California [53,54].
Sustainability 15 13539 g002
Figure 3. Quantity of CO2e mitigated by grazing in burned grasslands across California. The shaded regions show the spread of the data from 5 to 95 percentiles from the Monte Carlo simulation. The green (upper) area represents avoided emissions and the red (lower) represents additional emissions due to grazing. Black dots and lines represent the mean value of CO2e mitigation from 1000 simulation iterations. Data sources for the GHG analysis are described in the Supplemental materials.
Sustainability 15 13539 g003
Figure 4. Annual mitigation of PM2.5 in grazed and burned grasslands across California. The shaded region shows the spread of the data from 5 to 95 percentiles in the Monte Carlo results. Black dots and lines represent the mean value of PM2.5 mitigation from 1000 simulation iterations. Data sources for the PM2.5 analysis are described in the Supplemental materials.
Sustainability 15 13539 g004
Table 1. Regional summary information for burned grasslands from 2010 to 2020. Standard errors (in brackets) are based on the mean values for each of the 11 years calculated per region. The columns on the far right reflect how much more emissions would have occurred if the burned grasslands had not been grazed. Data sources are described in the Supplemental materials. Note: CO2e is presented here in metric tons (MT) not millions of metric tons (MMT) because the magnitude of some emissions is very small.
Average Annual Burned Grassland Annual Fuel
Removal Rate by Cattle
Average Annual Fuel Removal in Burned Grasslands Average CO2e Mitigated by GrazingAverage PM2.5
Mitigated by Grazing
Unitshakg/haMTMTMT
Central Coast6129 (2585)2571408 (604)710.9 (305)9 (3.8)
North Coast6863 (2638)5043229 (1245)1409.4 (585.8)19.4 (7.6)
Sacramento Sierra Cascade10,936 (5047)2772671 (1257)1445 (677.9)17.5 (8.2)
San Joaquin Sierra7266 (2822)6604184 (1721)2246.9 (818.2)27.4 (10.7)
South Coast2965 (915)2568 (23)33.6 (9.6)0.4 (0.1)
Southeast Interior1877 (516)1729 (9)15.8 (4)0.2 (0.1)
Total36,036NA11,5905861.673.9
Table 2. Counties, water districts, and park districts affected by the SCU Lightning Complex fires. Data sources are described in the Supplemental materials. Note: CO2e is presented here in metric tons (MT) not millions of metric tons (MMT) because the magnitude of some emissions is very small for some areas.
Grazed and Burned Grassland AreaAverage Forage ConsumedTotal Forage (Fuel) Removal by CattleCO2e Avoided by Grazing (5th and 95th Percentiles)PM2.5 Avoided by Grazing (5th and 95th Percentiles)
Unitshakg/hakgMTMT
Santa Clara County62913392,128,3431073 (−1247, 4936)13 (0, 26)
San Joaquin County30484621,412,083708 (−779, 3061)9 (0.4, 18)
Stanislaus County11,6594605,347,2652937 (−2702, 12,503)35 (3, 67)
EBRPD47113161,28831 (−34, 130)0.4 (0, 0.7)
SFPUC1348497668,652360 (−362, 1584)4 (0.2, 8)
TOTAL22,8174239,617,6315109 (−5124, 22,214)62 (4, 120)
Disclaimer/Publisher’s Note: The statements, opinions and data contained in all publications are solely those of the individual author(s) and contributor(s) and not of MDPI and/or the editor(s). MDPI and/or the editor(s) disclaim responsibility for any injury to people or property resulting from any ideas, methods, instructions or products referred to in the content.

