Article

To Green or Not to Green: The E-Commerce-Delivery Question

School of Technology and Science, Camilo José Cela University, 28692 Madrid, Spain
*
Author to whom correspondence should be addressed.
Sustainability 2023, 15(16), 12161; https://doi.org/10.3390/su151612161
Submission received: 4 July 2023 / Revised: 31 July 2023 / Accepted: 6 August 2023 / Published: 9 August 2023
(This article belongs to the Special Issue Sustainable E-commerce and Online Marketing Research)

Abstract

:
In an era in which e-commerce has become an integral facet of our lives, the delivery process has evolved into a vital part of online shopping. As the sole tangible interaction in an otherwise digital undertaking, it forms a decisive aspect of consumers’ e-commerce experience. In the face of the ever-growing prevalence of e-commerce, the ecological footprint left by delivery practices has emerged as a pressing concern. This focus is attributed not only to the environmental externalities resulting from e-commerce delivery but also due to the system’s inherent inefficiencies. As the primary beneficiaries of e-commerce, consumers form a pivotal force in driving sustainable delivery initiatives. This study embarks on an exploration of consumers’ attitudes toward environmentally friendly e-commerce-delivery practices. We aim to investigate whether consumers are willing to bear additional costs for assured green deliveries and identify which sustainable practices they perceive as most effective. A survey was conducted among e-commerce users to show their readiness to incur higher costs for green delivery and accept delayed deliveries if they supported sustainability. However, our findings reveal a conflicting scenario. While consumers display a readiness to opt for green deliveries, the price and speed of delivery emerged as more critical considerations. This study also uncovers significant discrepancies in attitudes towards green delivery based on demographic factors, such as gender and generation. Utilizing multivariate logistic regression, the study outlines the main factors that predict a willingness to pay for guaranteed green delivery. This study’s findings stress the need to balance the drive for speed and cost-effectiveness in e-commerce delivery with the urgency to adopt sustainable practices. It underscores the necessity for e-commerce platforms and logistics partners to take the lead in crafting and implementing innovative green delivery solutions while educating and incentivizing consumers to choose sustainable delivery options.

1. Introduction

In recent years, especially since the COVID-19 pandemic, e-commerce has become an indispensable part of the global retail market. For months, the internet was the only means by which many businesses could continue to generate revenue, and it was the only way for consumers to access certain goods. Seventy-four per cent of internet users in the EU shopped online in 2021 [1], with very similar percentages in the rest of the world. According to Statista data, e-commerce in the United States amounted to USD 469.2 billion in 2021, up from USD 431.6 billion in 2020, and in Spain, approximately 24% of total purchases were made over the internet [2].
Although changes in consumer shopping habits have changed permanently in the wake of the pandemic [3], from 2022 onwards, this growth in e-commerce has altered as a result of inflation, slower economic growth, and geopolitical conflicts. This has resulted in slower growth in household online spending because of households saving less and buying fewer unneeded items. Despite these temporary adjustments, many experts agree [4] that the future of retail will be omni-channel-based, with retailers and consumers combining multiple channels to market (O2O model: Offline to Online), sell, buy, and deliver goods. The term ‘phygital’—i.e., physical and digital at the same time—refers to the full integration of the physical and digital worlds in retail.
This phygital experience is evident in e-commerce and in the importance of delivery to customers (physical world), where it has become a critical aspect for consumers over and above the search and online-shopping stages (digital world) [5,6]. However, why do companies attach such a high level of importance to delivery issues in e-commerce? During the online-shopping process, consumers tend not to differentiate between the distributor and the carrier, and mistakes made by the carrier are attributed to the retailer. Product reviews on Amazon, for example, often include comments about delivery, both positive and negative. The courier becomes the seller’s representative [7]. The perceived value of good e-commerce delivery drives customer satisfaction, customer satisfaction drives customer loyalty, and customer loyalty drives profits and growth for these companies (service–profit chain [8]). Timely product delivery, quantity, and quality are critical to the development of e-commerce as they are closely related to customer satisfaction [9].
From a sustainability point of view, several authors [10,11,12,13] point to transport planning and management activities as the most important aspects in addressing the environmental effects of e-commerce. The last leg in transport—i.e., the last-mile delivery—is the most inefficient and energy-intensive part of the logistics chain.
Ignat and Chankov [14] highlight the need for more research into the perceived sustainability of current delivery methods from a consumer perspective. There is a difference between the perceived and the actual cost of a product [15], and there is likely to be a difference between perceived and objective sustainability. In other words, what consumers think is sustainable may need to be revised.
Therefore, e-commerce companies need to take consumer perceptions into account when developing their sourcing strategies. This can be achieved by surveying consumers’ sustainability preferences and providing information on the environmental effects of different delivery methods.
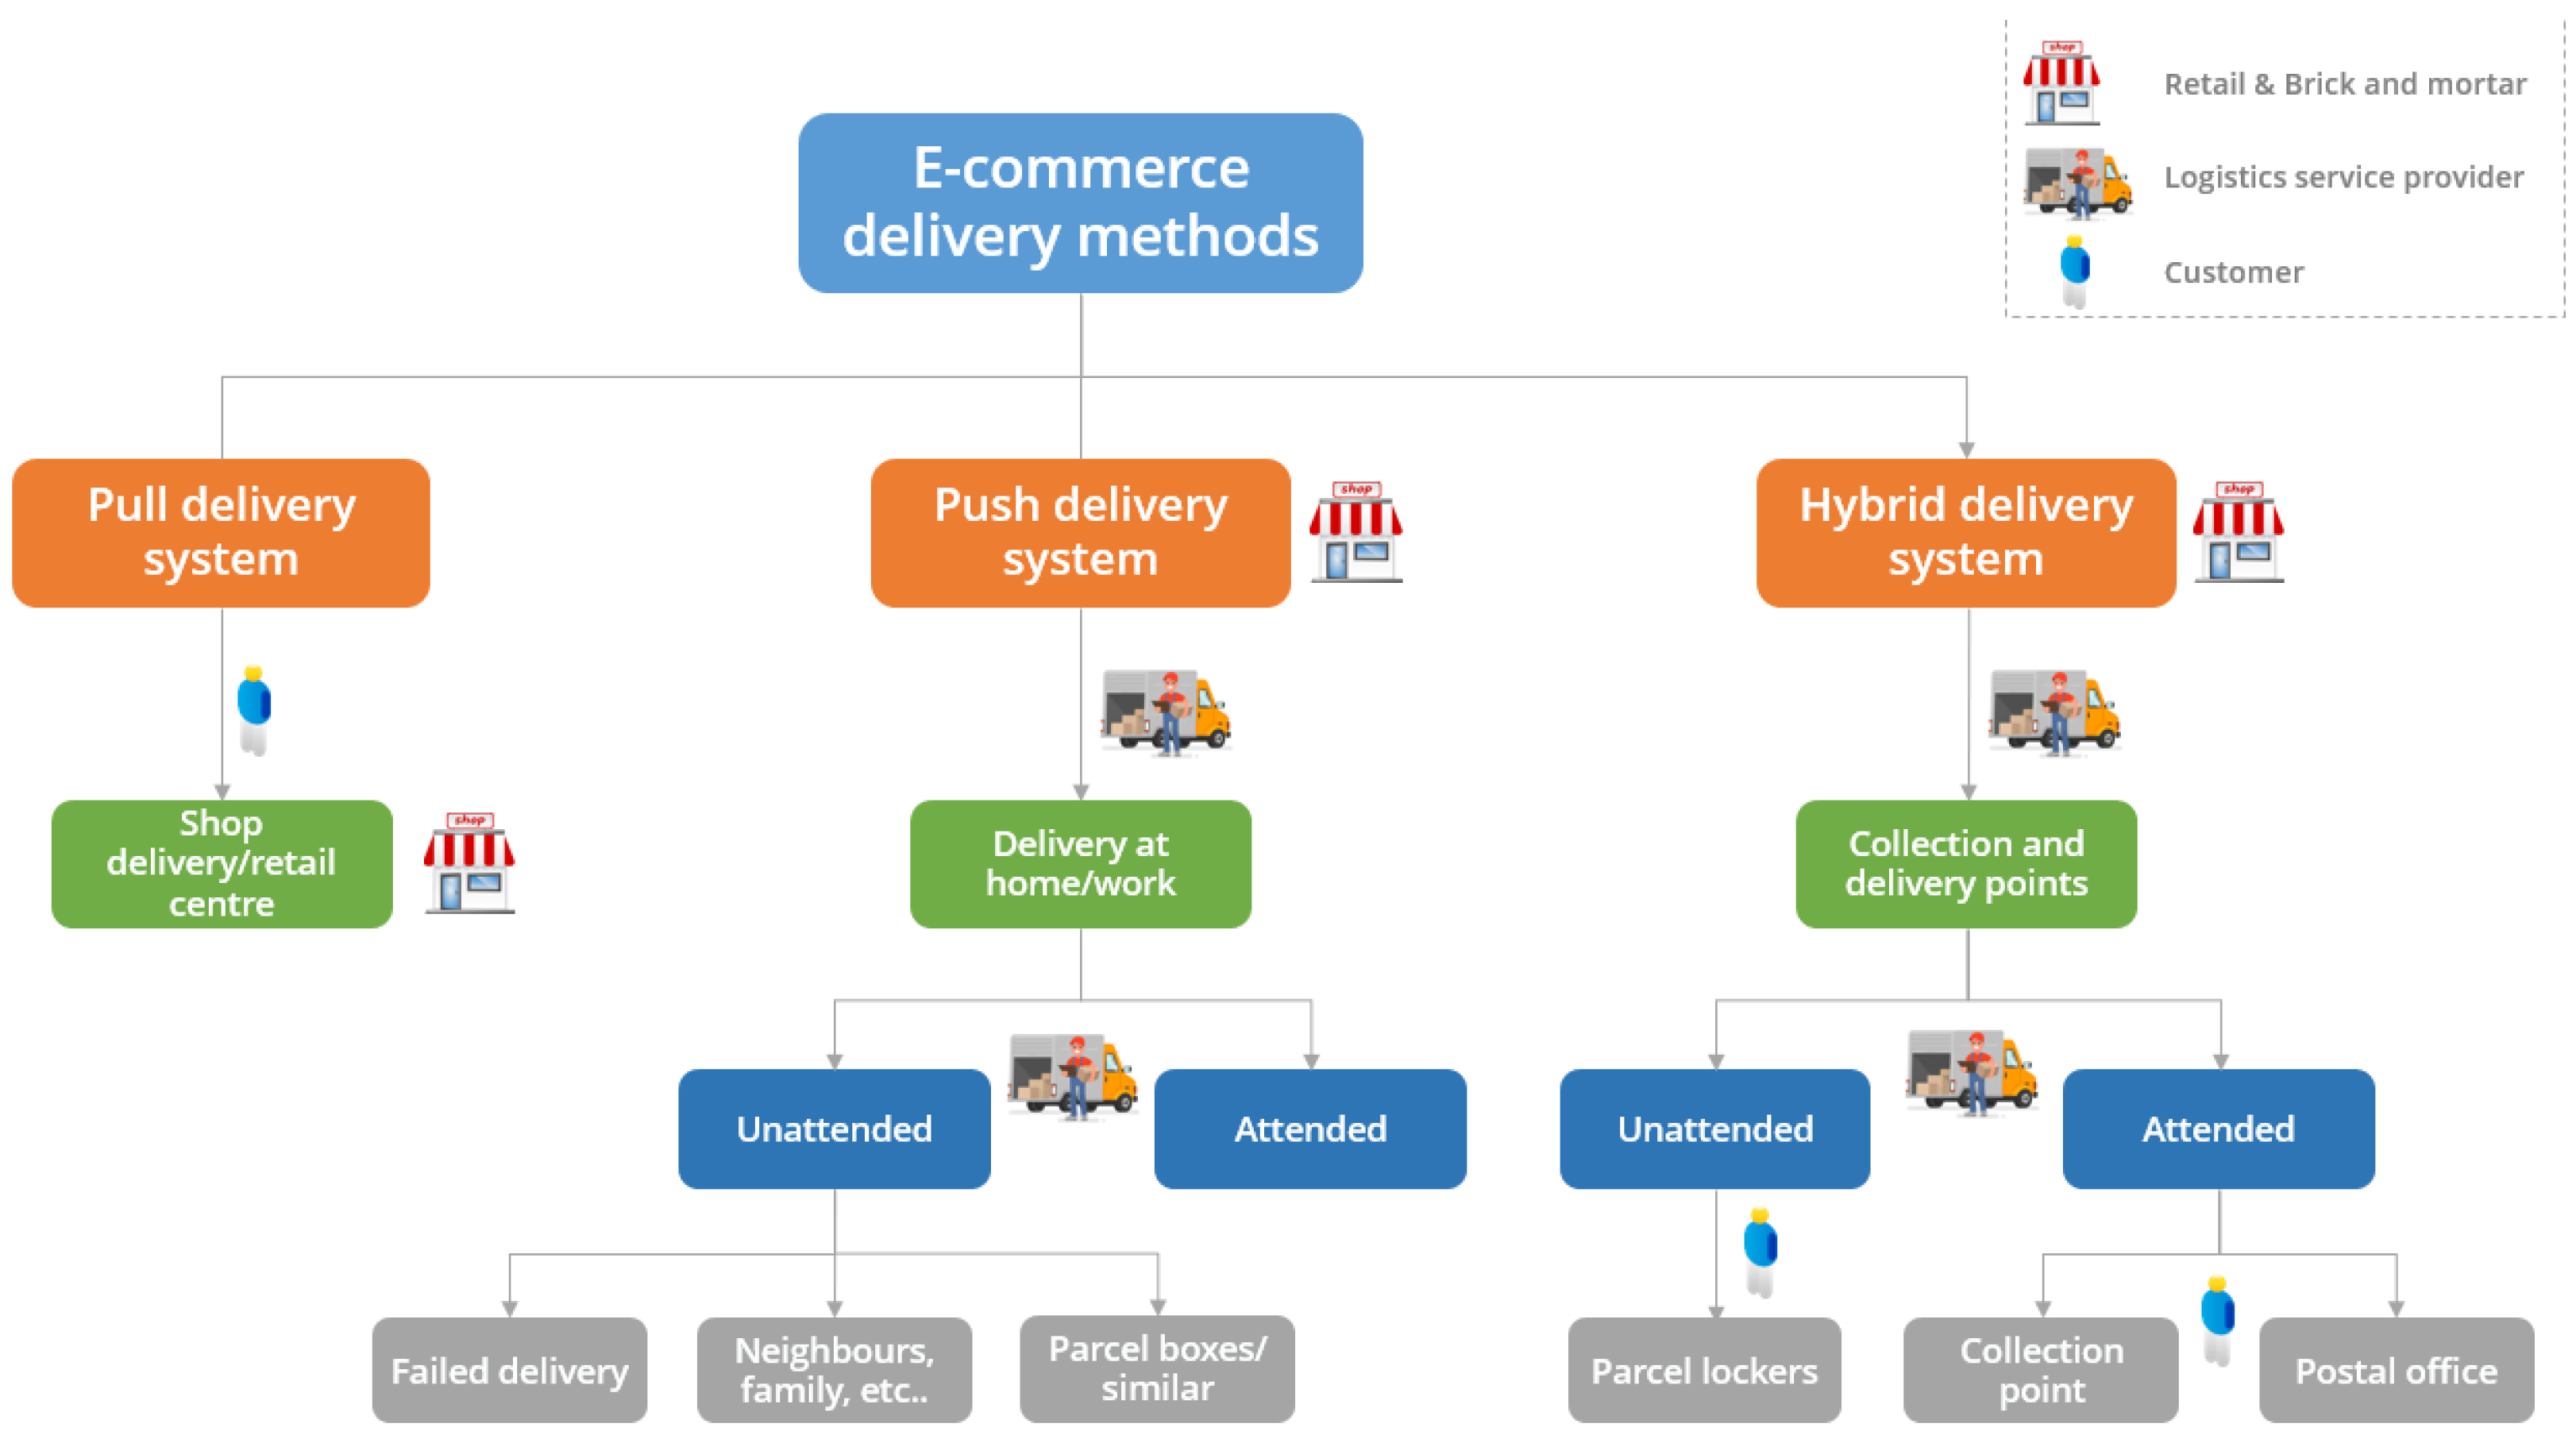
Focusing on the place of delivery of goods in e-commerce and the involvement of different actors in the process (customers, sellers, and/or intermediaries), there are three supply-chain models for delivery in the distribution of e-commerce orders [15]:
The push delivery system: someone other than the seller, usually a logistics service provider (LSP), delivers the goods to the address indicated by the customer. From the starting point—which could be the manufacturer, the retailer, or physical shops—it is the responsibility of the sellers to conduct the entire delivery process. This system is standard, for example, in purchasing clothing through a website, where the seller is responsible for delivery to the customer’s home.
The pull delivery system: in contrast to the push system, customers collect the goods from the points of sale. The customers have full responsibility for the process—from the collection to the delivery of the order at the last desired point. For example, a customer places an order for clothes online, and the same customer picks it up in a shop (BOPIS: buy online and pick up in the store).
The hybrid delivery system: goods are shipped to an intermediate location, where customers pick them up. This system requires the involvement of both the customer and the seller to fulfil the delivery process. For example, consider a clothing order that a customer places online and picks up at a smart locker. In this case, the seller is responsible for the transport part, and the customer is responsible for the other part.
This research covers the three delivery systems shown in Figure 1: push delivery, pull delivery, and hybrid delivery. It also examines how these systems relate to the preferences expressed by e-commerce customers for different sustainable delivery options.
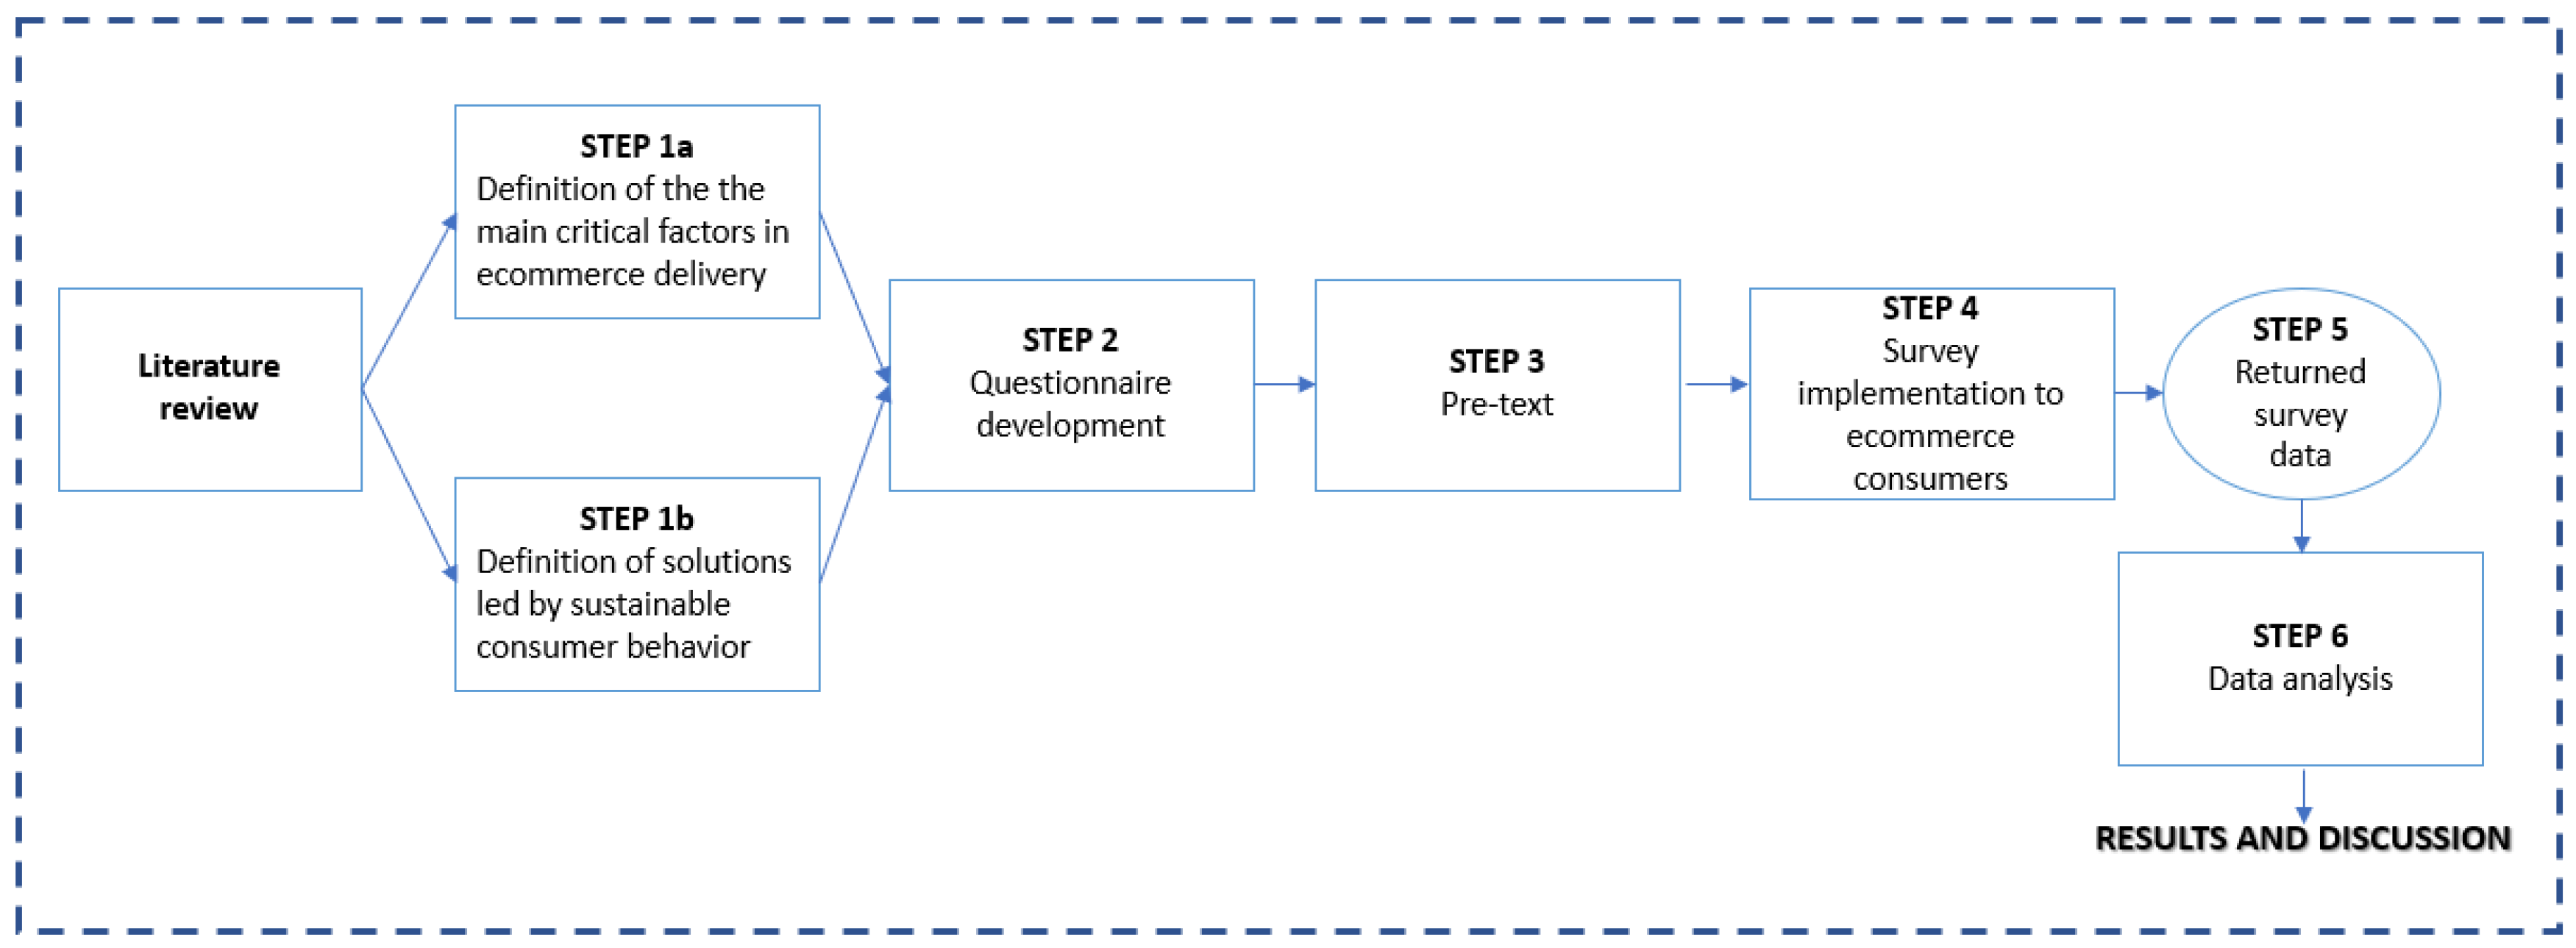
2. Literature Review

Except for digital goods, all other products sold on e-commerce platforms require physical delivery [15]. The delivery of goods to end consumers is an important part of e-commerce, but it is also one of the most polluting and least efficient parts of logistics. The process of delivering goods to consumers can be inefficient due to factors such as urban sprawl and the growth of e-commerce [16]. Additionally, consumer habits and preferences have led to an increase in the distribution of goods over short distances, which requires approaches and measures to minimize the environmental effects. This delivery problem (DP) in e-commerce has been extensively studied by researchers, who have identified the challenges to be addressed within a sustainable economy [17,18,19,20,21,22,23]. As both consumers and businesses are increasingly aware of the environmental impact of e-commerce, a key research question is how to provide a customer-centric and environmentally friendly service. E-retailers need to adapt to the preferences of new online consumers, who increasingly opt for ethical retailers and are willing to pay more for green-branded products [24].

2.1. Delivery Preferences of E-Commerce Customers and Problems Associated with Home Delivery

The home delivery of e-commerce orders (attendance home delivery or AHD) remains the most valued and widely used form of delivery, although its popularity among consumers in recent years has declined in favor of other delivery alternatives [25]. The International Post Corporation [26] surveys more than 33,000 consumers annually in over 40 countries. Regarding the place of delivery, 45% of the respondents received their parcels at home, 16% had their deliveries directed to their letterboxes, and 4% received them at work. Customers value the security and convenience of deliveries that arrive directly on their doorstep [27]. Although the preference for home delivery is undisputed, given the work and schedules of e-commerce customers, deliveries are typically made when customers are not at home to receive them. As a result, customers more often have to opt for an alternative solution to home delivery. Outside the home, 9% of parcels were delivered to a post office, 6% to convenience stores, and 6% to parcel lockers. These are average figures, but there is significant variability among countries [26].
Although home delivery is the majority option, many of the costs associated with this method affect the main stakeholders involved in urban distribution in e-commerce: consumers, carriers/logistics operators, retailers, and public authorities [28]. Home-delivery problems for carriers and consumers are mainly associated with failed services caused by the absence of the recipient from their home at the time of delivery. According to a study conducted in the UK before the pandemic, 50–70% of households were empty on the day of delivery [29]. This problem is the most critical factor in the success of the home-delivery formula. The failure of this formula leads to numerous inconveniences and, ultimately, lower customer satisfaction [30]. From e-commerce customers’ point of view, the following dysfunctionalities can be considered [31]: (i) the recipient of a failed delivery has to travel, on average, 5 km (round trip) to pick up the parcel, which takes 30 min; (ii) at the same time, he/she has to comply with the opening hours of the collection point, which often coincide with his/her usual working hours; (iii) there may be an additional cost, depending on the transport used, public or private, and parking; and (iv) after the collection, the recipient needs to transport the parcel, which may be heavy or difficult to handle, to his/her home. These factors are the opposite of what consumers expect when shopping and using home-delivery services. Most customers prefer home deliveries on weekends and after business hours to ensure their presence at the delivery location, thus avoiding the exposure of the package to the elements and possible theft [32].
From the point of view of logistics service providers, the costs of home-delivery transport in e-commerce are closely related to the number of vehicles needed during the same period. The greater the extent to which the customer can control or select the home-delivery-time window, the higher the costs. The reason for this is simple: the lower the load-factor percentage on the vehicles, the greater the distances travelled to operate within the promised delivery-time windows. This translates into longer working hours for delivery services and an increasing number of vehicles required, leading to a significant increase in the total home-delivery costs [33]. For in-home delivery, there are also inefficiencies from the transport companies’ point of view in the event of failed deliveries [34]: (i) vehicle downtime; (ii) additional fuel consumption by vehicles; (iii) the costs of further attempts in the next few days; and (iv) additional storage costs.
For retailers (e-retailers), home delivery is dichotomous. On the one hand, their primary objective is to satisfy customer needs, with home delivery being the customer’s preference. Nevertheless, home delivery has become increasingly costly. Last-mile-delivery costs account for 53% of total shipping costs and up to 41% of total supply-chain costs [35]. In other words, approximately half of shipping and supply-chain costs are spent on the last mile. On the other hand, consumers are now more interested in how the supply chain can be made more sustainable and increasingly value green delivery in their e-commerce orders [36]. As a result, companies are opting for environmentally friendly deliveries that can give them a competitive advantage and reinforce their brand image on the market [37].
For their part, public administrations are focused on developing attractive and sustainable cities for their citizens. From this perspective, the transport derived from e-commerce delivery is one of the main factors responsible for the environmental degradation and pollution generated in cities. The administration’s major aspiration is to provide the best infrastructure to enable e-commerce parcel deliveries with the fewest possible social and environmental externalities. As physical deliveries derived from e-commerce become increasingly high and significantly affect the city, their concern for solutions grows. The main inefficiencies caused by e-commerce parcel delivery in the city, from the point of view of public administration, are as follows: (i) increased emissions of polluting gases; (ii) increased transport noise; (iii) increased traffic congestion; (iv) the occupation of public spaces by delivery companies; and (v) increased accidents on urban roads [38,39,40,41].

2.2. Sustainable Delivery in E-Commerce and Success Factors

In recent years, numerous initiatives have been developed to minimize the negative effects of urban distribution and lay the foundations for the future achievement of a more robust and circular economy, in which resources are used more sustainably. Several studies in different countries [42,43,44,45] show that greenhouse gas (GHG) emissions associated with the last mile multiply the volume of all other transport operations. This emissions problem is complicated by the fact that demographic and socio-economic changes increase the number of orders and deliveries and, thus, the volume of freight vehicles in urban areas [46]. The EU is working on its Green Deal to become the first carbon-neutral continent by 2050 and decouple its economic growth from its resource use [47]. Transport is one of the basic pillars to be considered, and green delivery is one of the priorities. To achieve ideal sustainable parcel delivery in online e-commerce, the main critical success factors that customers value and that must be met for them to be satisfied with the delivery must be considered. Below are listed the main critical factors in e-commerce delivery and the main sustainable initiatives or solutions led by the increasingly sustainable behavior of online consumers.
Shipping costs: on all surveys regarding the online shopping experience, this appears to be the most important factor, next to low product prices, ahead of others such as same-day delivery and guaranteed delivery time or location [48,49]. Sustainable solutions focus on customers’ willingness to pay to ensure climate-friendly deliveries and the characteristics that these options need to be attractive [50,51,52,53,54]. Price increases in e-commerce home deliveries can have a double effect. On the one hand, it is possible to allocate these extra revenues to compensate for the additional costs of clean deliveries (electric vehicles, cargo bikes, urban microhubs, etc.) or to reduce e-commerce orders when the value of the basket is low and the delivery cost is a relatively high percentage of the order. On the other hand, the willingness to pay more for sustainable delivery is less clear, as even consumers who are positively inclined towards sustainable consumption do not change their behavior when they encounter economic barriers [55].
Packaging: online shopping—and, therefore, the production and use of e-commerce packaging—has grown steadily in recent years, as has its environmental impact [56]. In 2018, more than 20 billion packages were shipped worldwide [57], and packaging has directly affected the environment in the form of increased CO2 emissions and energy use [58,59]. The weight and volume of packaging are also significant because they influence the energy used for transporting these packages to the final recipient [56]. One of the most important aspects is over-packaging, which continues to lead to the excessive use of materials and energy, influencing the impact of production and transport processes [56,60]. This highlights consumers’ willingness to implement the three Rs of recycling (reduce, reuse, and recycle waste) and to use packaging solutions based on environmentally friendly materials and favoring the efficient use of energy [61,62,63,64]. It is also key to avoid packaging waste in every online delivery.
Returns: when shopping online is easy, customers expect it to be equally easy to return their purchases. Many retailers offer free delivery and various ways to return items, including the return of items sold online to shops. Free returns services have led to higher-than-expected returns, resulting in high financial costs for companies, which can lose up to one-third of their revenue from these online returns [65]. However, equally, all externalities (i.e., the negative side effects of transport on society and the environment) and waste caused by direct home deliveries are considerably increased by online order returns [59,66,67]. Therefore, consumers are urging retailers to search for alternatives (e.g., augmented reality to test products, limiting the number of returns or extending the number of days) that allow these returns to be economically sustainable for businesses, consumers, and the planet [68].
Delivery options: the vast majority of e-commerce consumers consider it necessary to have several delivery options for their products. They are open to picking up their deliveries from pick-up points, shops, or delivery lockers and to waiting longer for their purchases [50]. Delivery alternatives in e-commerce translate into convenience for customers as they simplify the online purchasing process. From the perspective of sustainability, the most sustainable e-commerce deliveries are those that optimize the loading of delivery vans, deliver many packages in one stop, take advantage of consumer trips to pick up packages (stores, another convenience centers, or smart lockers), and deliver through sustainable means (cargo bikes, electric vehicles, walkers), or through the collaborative economy.
Fast delivery: along with the increasing volume of e-commerce, consumers are becoming more demanding in terms of critical aspects such as the speed of product delivery, placing additional pressure on the environmental effects of e-commerce consumption [69,70]. The offer of fast delivery by e-retailers may contribute to increase in GHG emissions, given the choice to prioritize speed over other factors [71]. However, several studies highlight a lack of knowledge of how delivery speed and environmental impact are related. Eighty per cent of e-consumers are unaware that fast delivery has a more negative impact on the environment than slow delivery, and 32% of this group even believe that slow delivery is more damaging than fast delivery [72,73]. Solutions can therefore be aimed at ensuring longer delivery or return times while explaining the social and environmental benefits of these deliveries, or at ensuring that customers pay (and compensate) for urgent orders.
While initiatives by retailers and logistics operators can make significant strides towards sustainable e-commerce delivery, consumer engagement is key [73]. Online consumers are inherently concerned about the environment, and their demand for sustainable products is a driving force towards a circular economy. Some experts point out that consumers are willing to pay more for environmentally friendly products, and this percentage is expected to grow in the coming years [74,75,76]. On the other hand, other studies point out that although delivery is increasingly customer-centric and convenience-oriented, this incurs social and environmental costs, for which consumers are still unwilling to pay [50,77]. The consumer profile is also key, with preferences for sustainable deliveries differing widely across generations [78,79].
This study contributes to a holistic view of possible sustainable solutions in e-commerce delivery, taking online customers’ preferences as a starting point. It attempts to move beyond customers’ willingness to pay for sustainable measures by quantifying how much they are willing to pay and by prioritizing the most satisfactory measures for consumers. The research investigates whether there are differences between generations concerning their willingness to be eco-friendly in e-commerce deliveries. Based on the literature review, Table 1 summarizes consumer preferences regarding e-commerce delivery.

3. Research Goal and Research Hypothesis

This research contributes to filling the gaps between different studies and clarifies the extent to which different types of consumer are willing to pay, as well as the measures they consider appropriate to reduce the social and environmental impact of e-commerce deliveries. The main objectives of the research are to assess consumers’ willingness to pay for green deliveries, to determine whether there are significant differences between generations and age groups, and to identify the sustainable measures they prioritize. The following research hypotheses were formulated based on the contributions of the literature review to the main questions addressed in Section 2.: H1—e-commerce consumers are willing to pay additional costs if they are guaranteed an environmentally friendly delivery; H2—there are significant differences between generations and genders in terms of preferences in relation to environmentally friendly delivery in e-commerce; H3—the three Rs of recycling are considered the most effective solutions within e-commerce-packaging recycling; H4—cost is the most valued factor in e-commerce delivery; and H5—socio-demographic factors (gender and generation) can be considered the best predictors of the respondents’ willingness to pay for green e-commerce delivery.
The structure of this paper is as follows. A description of the research methodology is followed by the description of the results obtained, which are presented in tables and figures. Next, a discussion of the results is presented in the context of the literature, along with the conclusions, limitations, and a description of future research. Finally, a list of the studies cited in the manuscript.

4. Methodology

To prove the research hypotheses, this study is divided into six stages, following the methodology outlined in Figure 2.
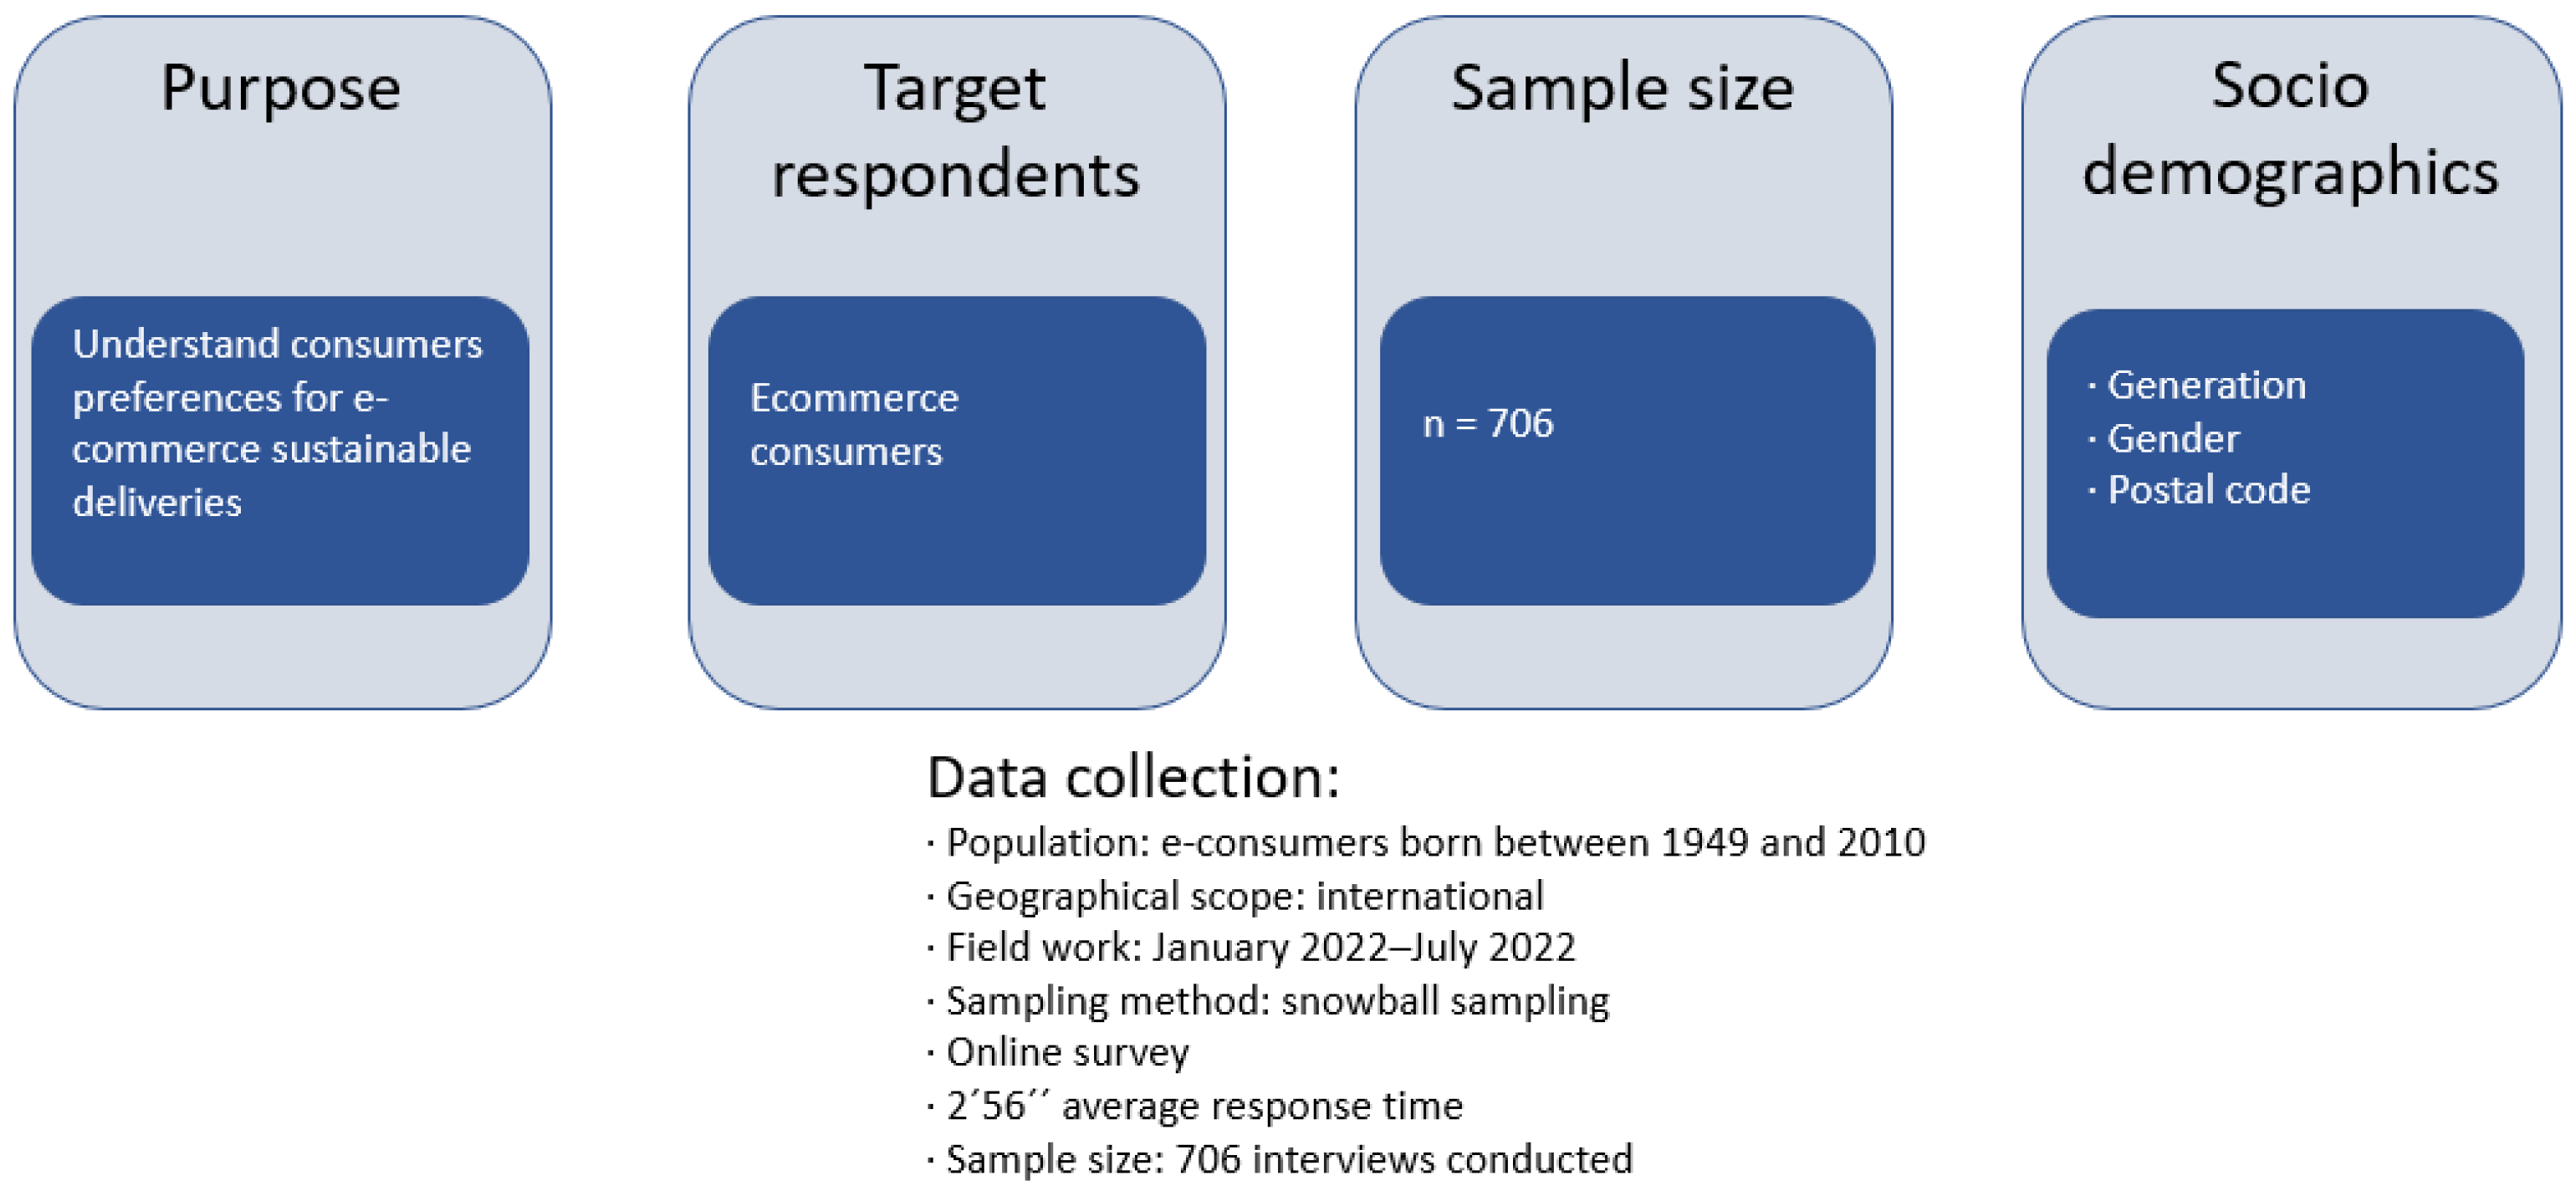
Based on a literature review conducted by the author, both the critical success factors of e-commerce delivery and the leading potential sustainable solutions from the perspective of online consumers were defined (step 1). Also based on this review, a questionnaire was developed and pre-tested with a group of 10 online consumers (steps 2–3). This pre-text questionnaire was used to refine the questions based on the feedback from the respondents. Some aspects of the questionnaire that made it challenging to answer were removed, and other questions were reworded to make them appear more straightforward. The final questionnaire was launched through a snowball-sampling process (non-probabilistic, with inference only applied to the studied group), which produced 706 responses (steps 4–5). Finally, an analysis of the survey data was carried out to determine the results (step 6) and to answer the research questions.
To achieve the set objective, the survey was carried out between July and December 2022. The research took the form of a descriptive survey, with all questions (except one) closed-ended, using the CAWI (computer-assisted web interviewing) technique. Several online consumers from different generations and regions were invited to share the survey and invite their friends, who met the age and e-commerce consumer conditions to participate. The study was partial, participation was voluntary and anonymous, and the respondents could refrain from completing the form at any time. Of the 745 questionnaires collected, 706 reliably completed questionnaires were accepted. The only change open to the respondents was the postcode, and surveys in which this field was not filled in were accepted (see the survey sheet in Figure 3).
The survey was conducted with Microsoft Forms (English and Spanish) and consisted of three sections. The first part contained the respondents’ primary data: gender, generation by age at birth (baby boomers, generation X, millennials, or generation Z), and the postcode where the respondent lived. In the second part, the respondents were asked about his/her willingness to pay for additional shipping costs if the company guaranteed an environmentally friendly delivery (yes or no). If the answer was yes, the respondent was asked to define the additional amount he/she would be willing to pay. Furthermore, in this section, the respondents are asked about the packaging (several sustainable alternatives to reduce the environmental impact are shown) and returns of online orders, and they were asked to indicate how long they would be willing to delay the collection of the return of an e-commerce order if the company selling the product guaranteed an environmentally friendly return. Finally, in the last section, the respondents rated five critical aspects of e-commerce delivery, from 0 (minimum) to 10 (maximum). The created form was subjected to a reliability analysis, for which Cronbach’s alpha test was calculated. The test result was 0.72275, which was satisfactory [80]. A statistical analysis was carried out using descriptive and inferential analyses. Descriptive analysis was used to describe the main characteristics of the sample, using the mean and standard deviation, and Pearson’s correlation analysis was calculated among the respondents’ evaluations of the critical factors in e-commerce delivery. Inferential analysis was performed using a multivariate logistic regression model for the dichotomous outcome, ‘willingness to pay for green e-commerce delivery’—structured as 1 = ‘yes, willing to pay’ and 0 = ‘not willing to pay’—as a function of gender, the generation to which the participants belonged, and the ratings given by these consumers to the critical factors assessed in e-commerce delivery. The results of the regression analysis were expressed as odds ratio (OR) and standard error (SE) with the corresponding 95% confidence intervals, and the level of statistical significance set at the p-value was ≤0.05. Statistical analyses of the collected material were performed with the Microsoft Excel 2021 software (Real statistics 8.0) add-in, ‘Real statistics’, which extends the built-in statistical capabilities of Excel and allows a wide range of statistical analyses to be performed more efficiently.

5. Results

The study targeted four generations, from 16 to 73 years old, but with the condition that they were online shoppers. Responses were received from 390 men, 312 women, and 4 of other genders. By country, the most significant number of responses was received from Spain—90.93%. The remaining responses (9.07%) were split between European and American countries (see Table 2).
The distribution of responses by generation was relatively balanced. Generation Z stood out slightly, with 29.5% of the total responses, followed by millennials, with 27.3%. Generation X accounted for 23.9% of the responses, and in last place was the oldest generation, the baby boomers, with 19.3%.
With regard to green delivery and delivery costs, in response to the survey’s main question—‘Would you be willing to pay extra for the delivery costs of a parcel if the company selling the product guarantees an environmentally friendly delivery (e.g., climate or CO
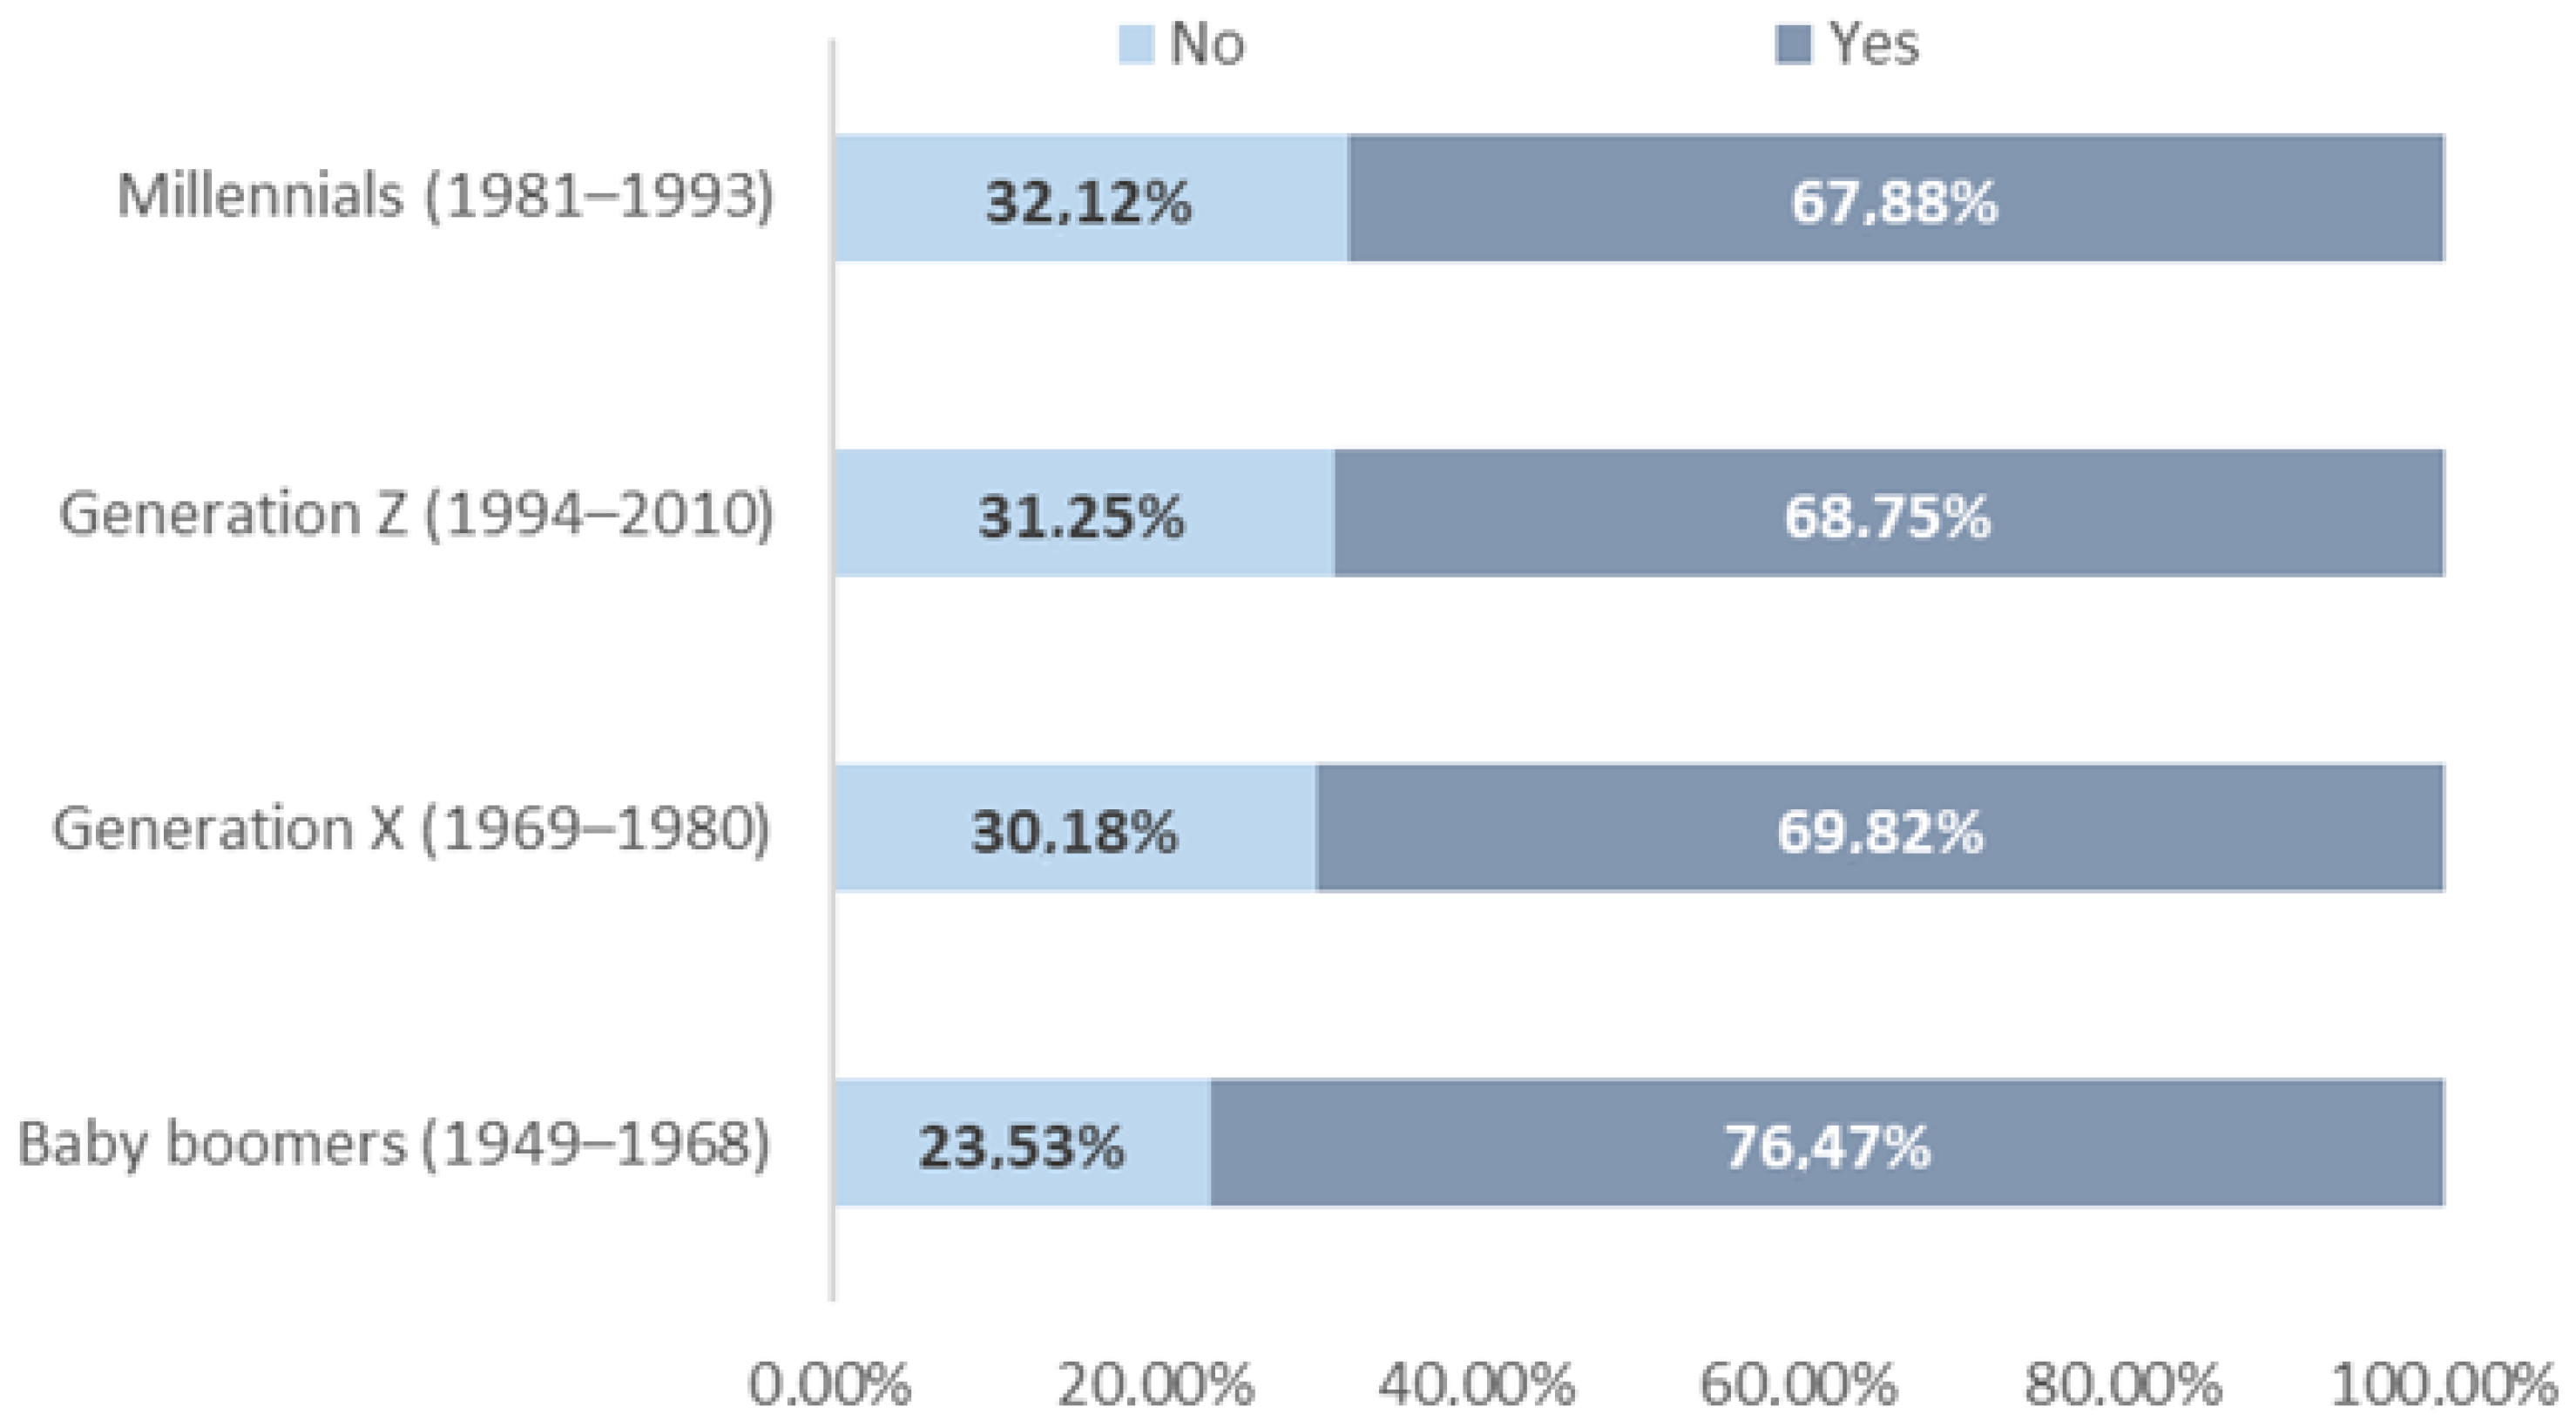
2 neutral)?’—70.25% of the respondents answered yes. There were notable gender differences. While 35.64% of men said they would not be willing to pay more for guaranteed green delivery, this percentage dropped by more than 13 points for the women, with only 22.12% saying they would not be willing to pay more. For those of other genders, the split was 50% in favor and 50% against. Surprisingly, in terms of generation, the respondents from the baby-boomer generation (1949–1968) are the most willing to pay for green e-commerce-parcel delivery (see Figure 4). On the other hand later generations had very similar percentages in favor of guaranteed green delivery (30.18–32.12%) but with a considerable gap from the baby boomers.
By region, there was no significant difference between those favoring green delivery in Spain (69.78%) and those in European countries (70.37%). Among the respondents residing in the different countries of the Americas (see Table 2), a higher percentage of people favored green delivery (75.76%).
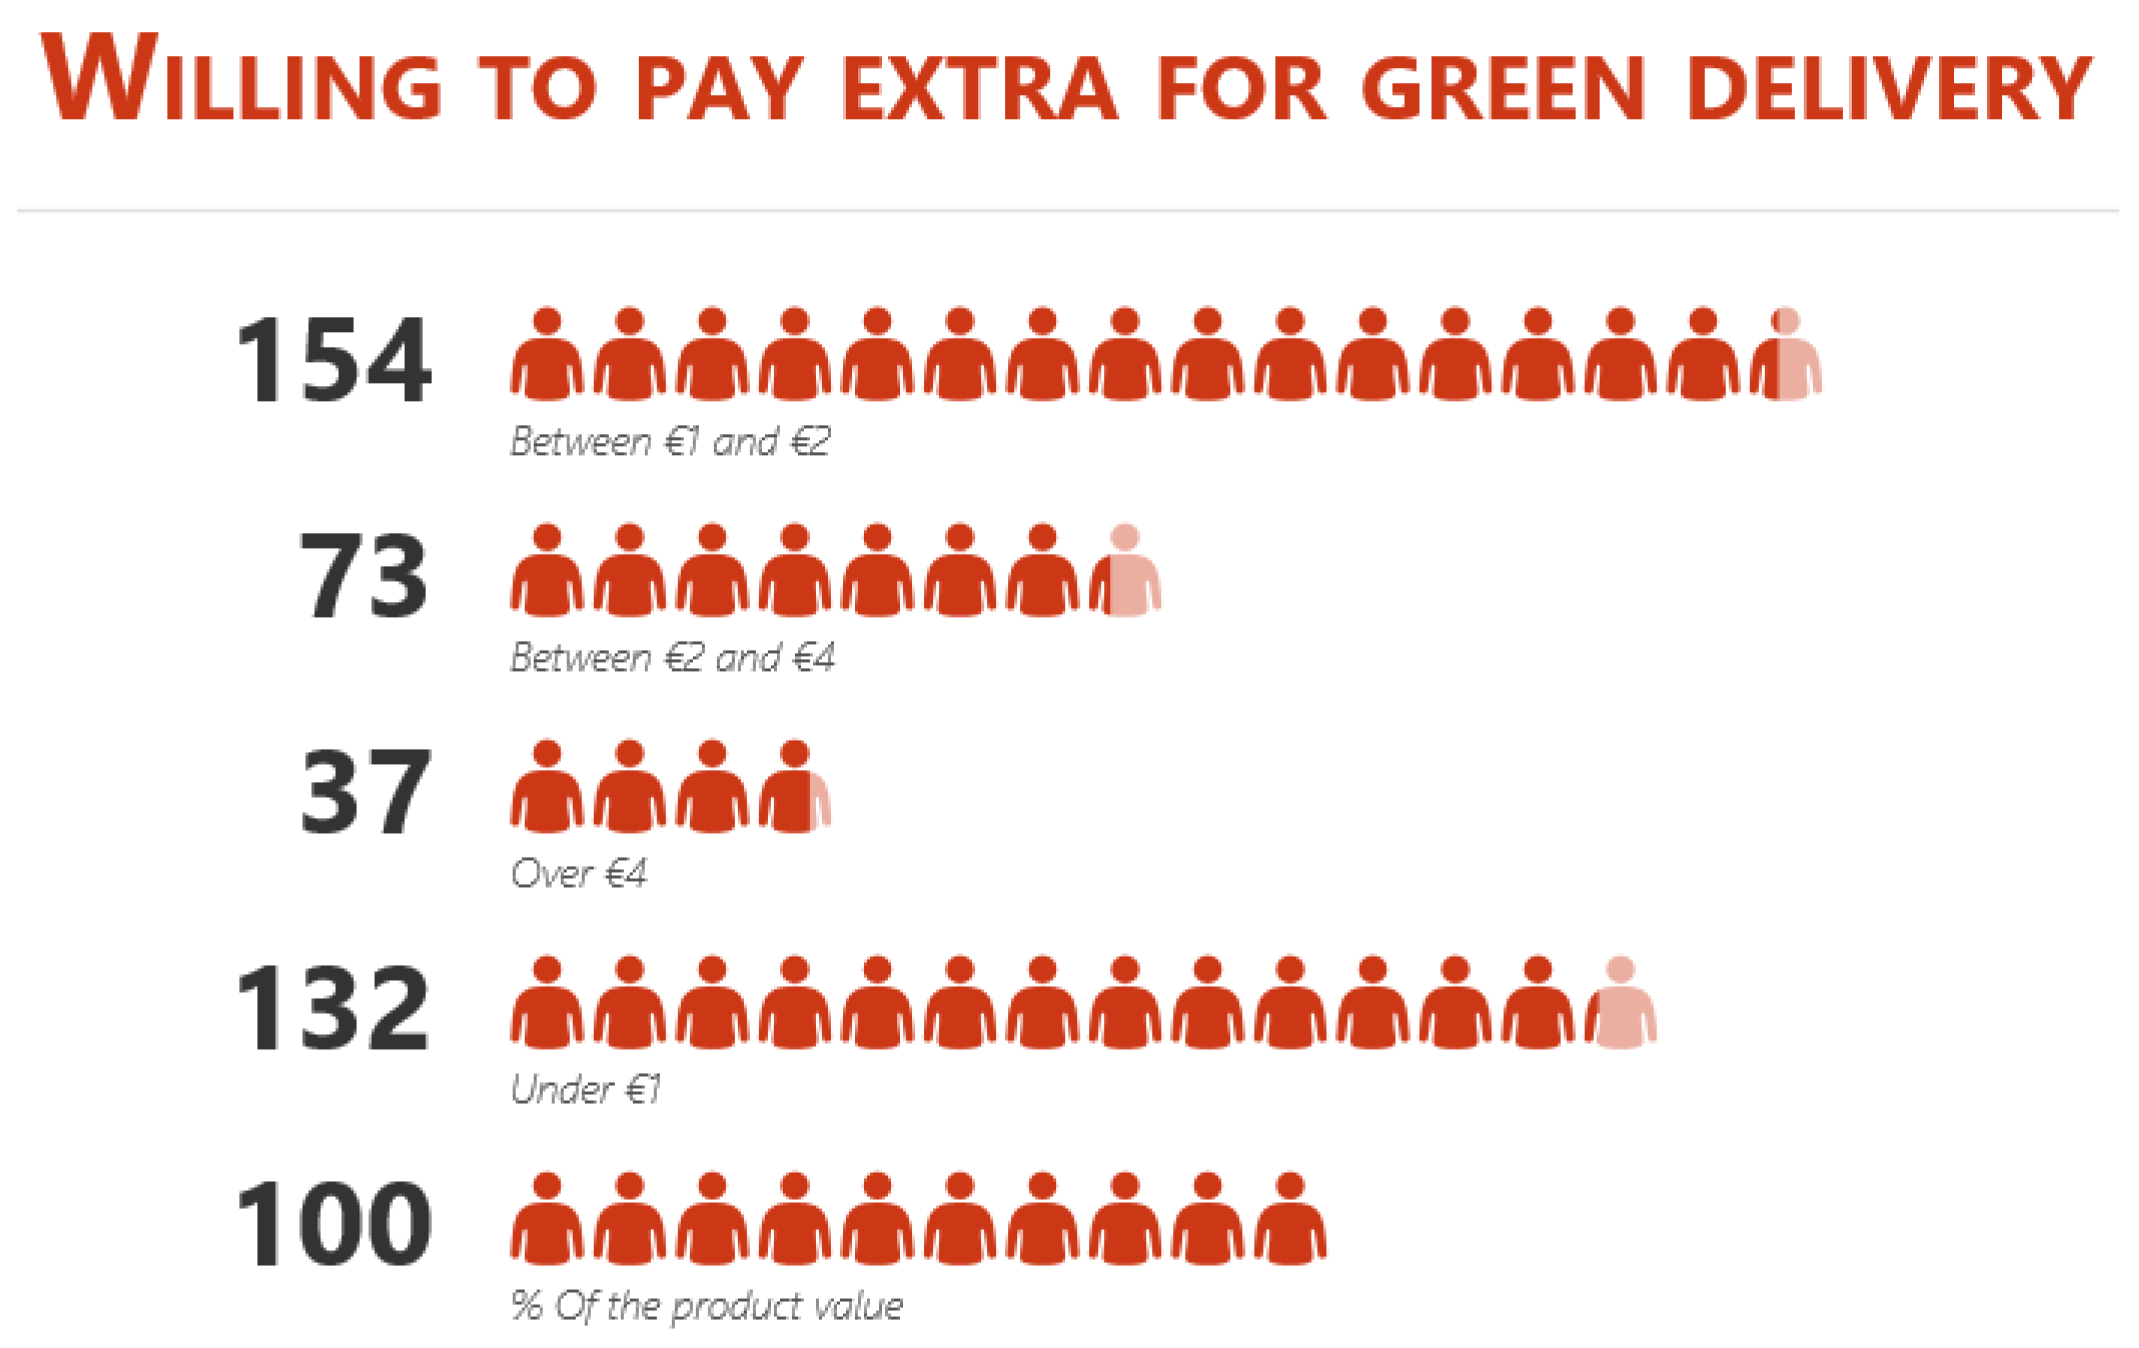
For those who answered yes to the previous question (n = 496), a new question was added—‘What additional amount (EUR) per package would you be willing to pay for a guaranteed green delivery?’. The most frequently accepted options (chosen by more than half of the respondents) were (i) paying between EUR 1 and EUR 2 (31.05%) and (ii) paying less than EUR 1 (26.61%). The least frequently selected option was paying more than EUR 4 for e-commerce delivery, with only 37 responses (7.46%; see Figure 5). It is important to note that the option to ‘pay according to the value of the product’ was supported by 20.16% of the respondents. When analyzing these payment alternatives by gender and region of residence, there were no significant differences among the responses received.
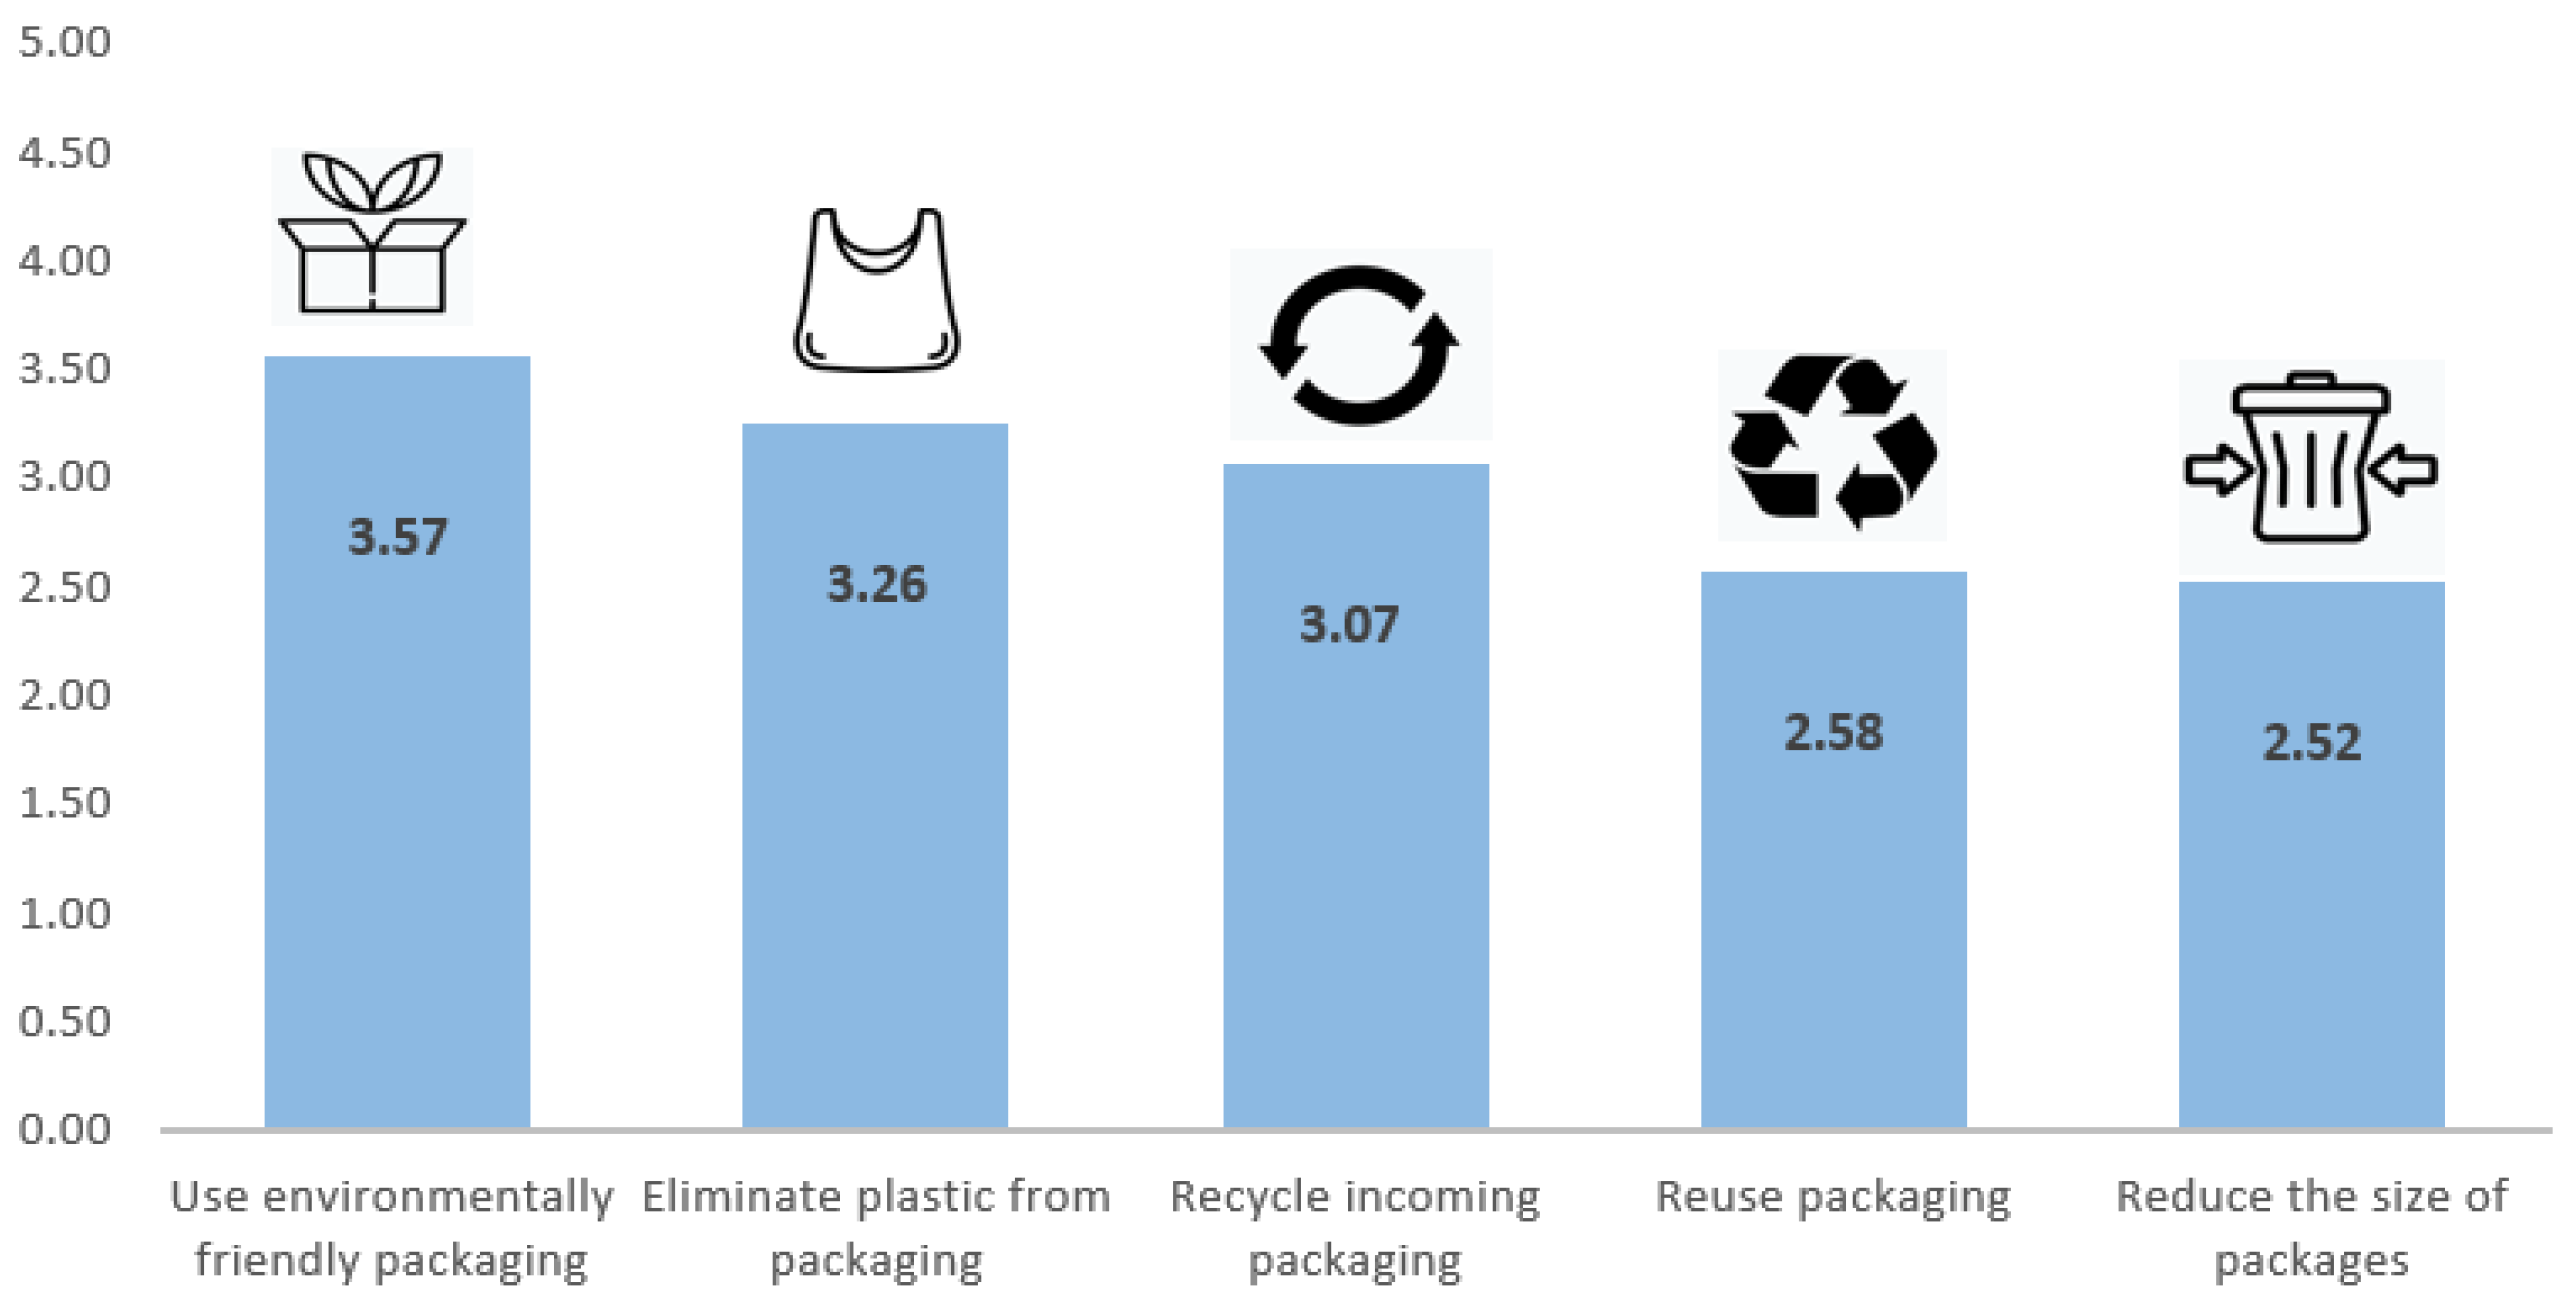
Regarding the packaging of e-commerce products, the respondents were asked to rank, from 5 points (highest) to 1 point (lowest), the alternatives they considered most appropriate to reduce the environmental impact they produced. The alternative with the highest average score was (i) using packaging made from environmentally friendly materials, followed by (ii) eliminating plastic from current packaging received in e-commerce deliveries (see Figure 6). Notably, eliminating plastic was the most frequent first choice (215), but it was also the last option to be considered by many of the respondents (129).
The three Rs of recycling (reduce, reuse, and recycle) were ranked in reverse order. Among these three options, the recycling of the packaging received was the most commonly preferred. The re-use of and reduction in packaging had very similar scores, although the option of reusing was the most frequently chosen as the last option (215). The main statistics related to the packaging preferences of the sample surveyed are shown in Table 3.
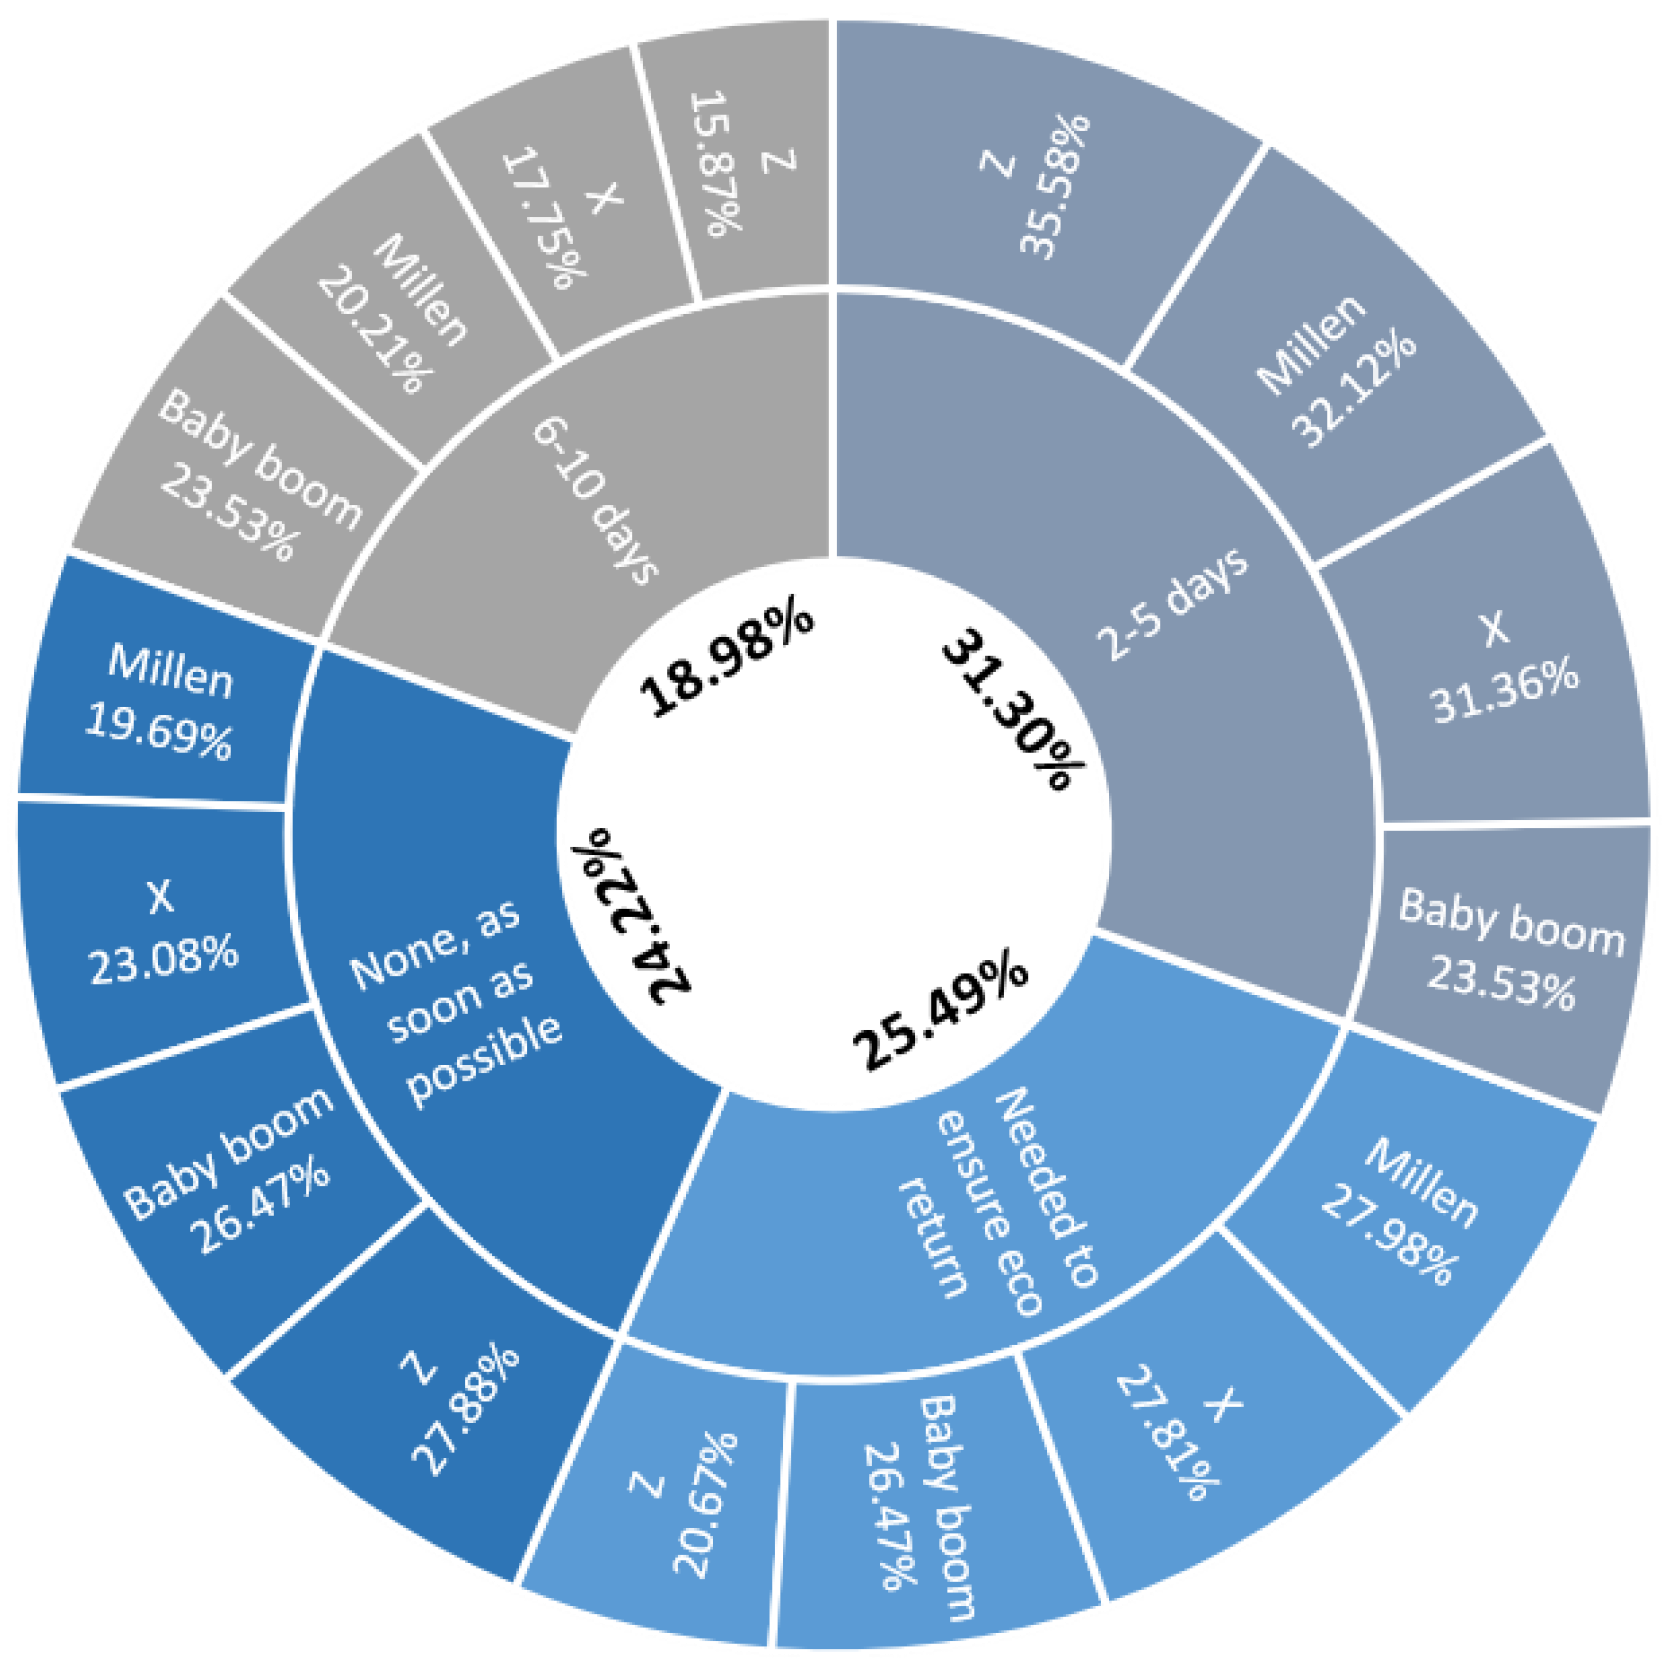
The question returns was as follows: ‘How long would you be willing to delay collecting an e-commerce order return if the company selling the product guarantees an environmentally friendly return?’. As shown in Figure 7, there was no clear preferred option. The option to return the e-commerce package between 2 and 5 days was the preferred option for 31.30% of the total sample. The second most frequently chosen option was ‘as long as necessary to guarantee the ecological return’ (25.49%). This was followed by a significant percentage (24.22%) who stated that they did not want the return to be environmentally friendly, preferring that it be collected as soon as possible. Finally, 18.98% chose to return their order online after between 6 and 10 days.
Among the generations (see Figure 4), the millennials were the most willing to wait if the return was sustainable. In total, 80.31% of the millennials did not mind waiting if an ecological delivery was guaranteed, with the following waiting times noted: between 2 and 5 days (32.12%), between 6 and 10 days (20.21%), or as long as necessary (27.98%). The rest of the generations had similar percentages, except for generation Z, who were the least willing to wait when the delivery time was between 6 and 10 days (15.87%) and who, to a greater extent, expressed their refusal to wait for an ecological return in e-commerce (27.88%). Between 2 and 5 days was the most frequently preferred option for both men and women. It is noteworthy that the women showed a significantly higher preference for an eco-friendly return than the other sexes, irrespective of the waiting time (see Table 4).
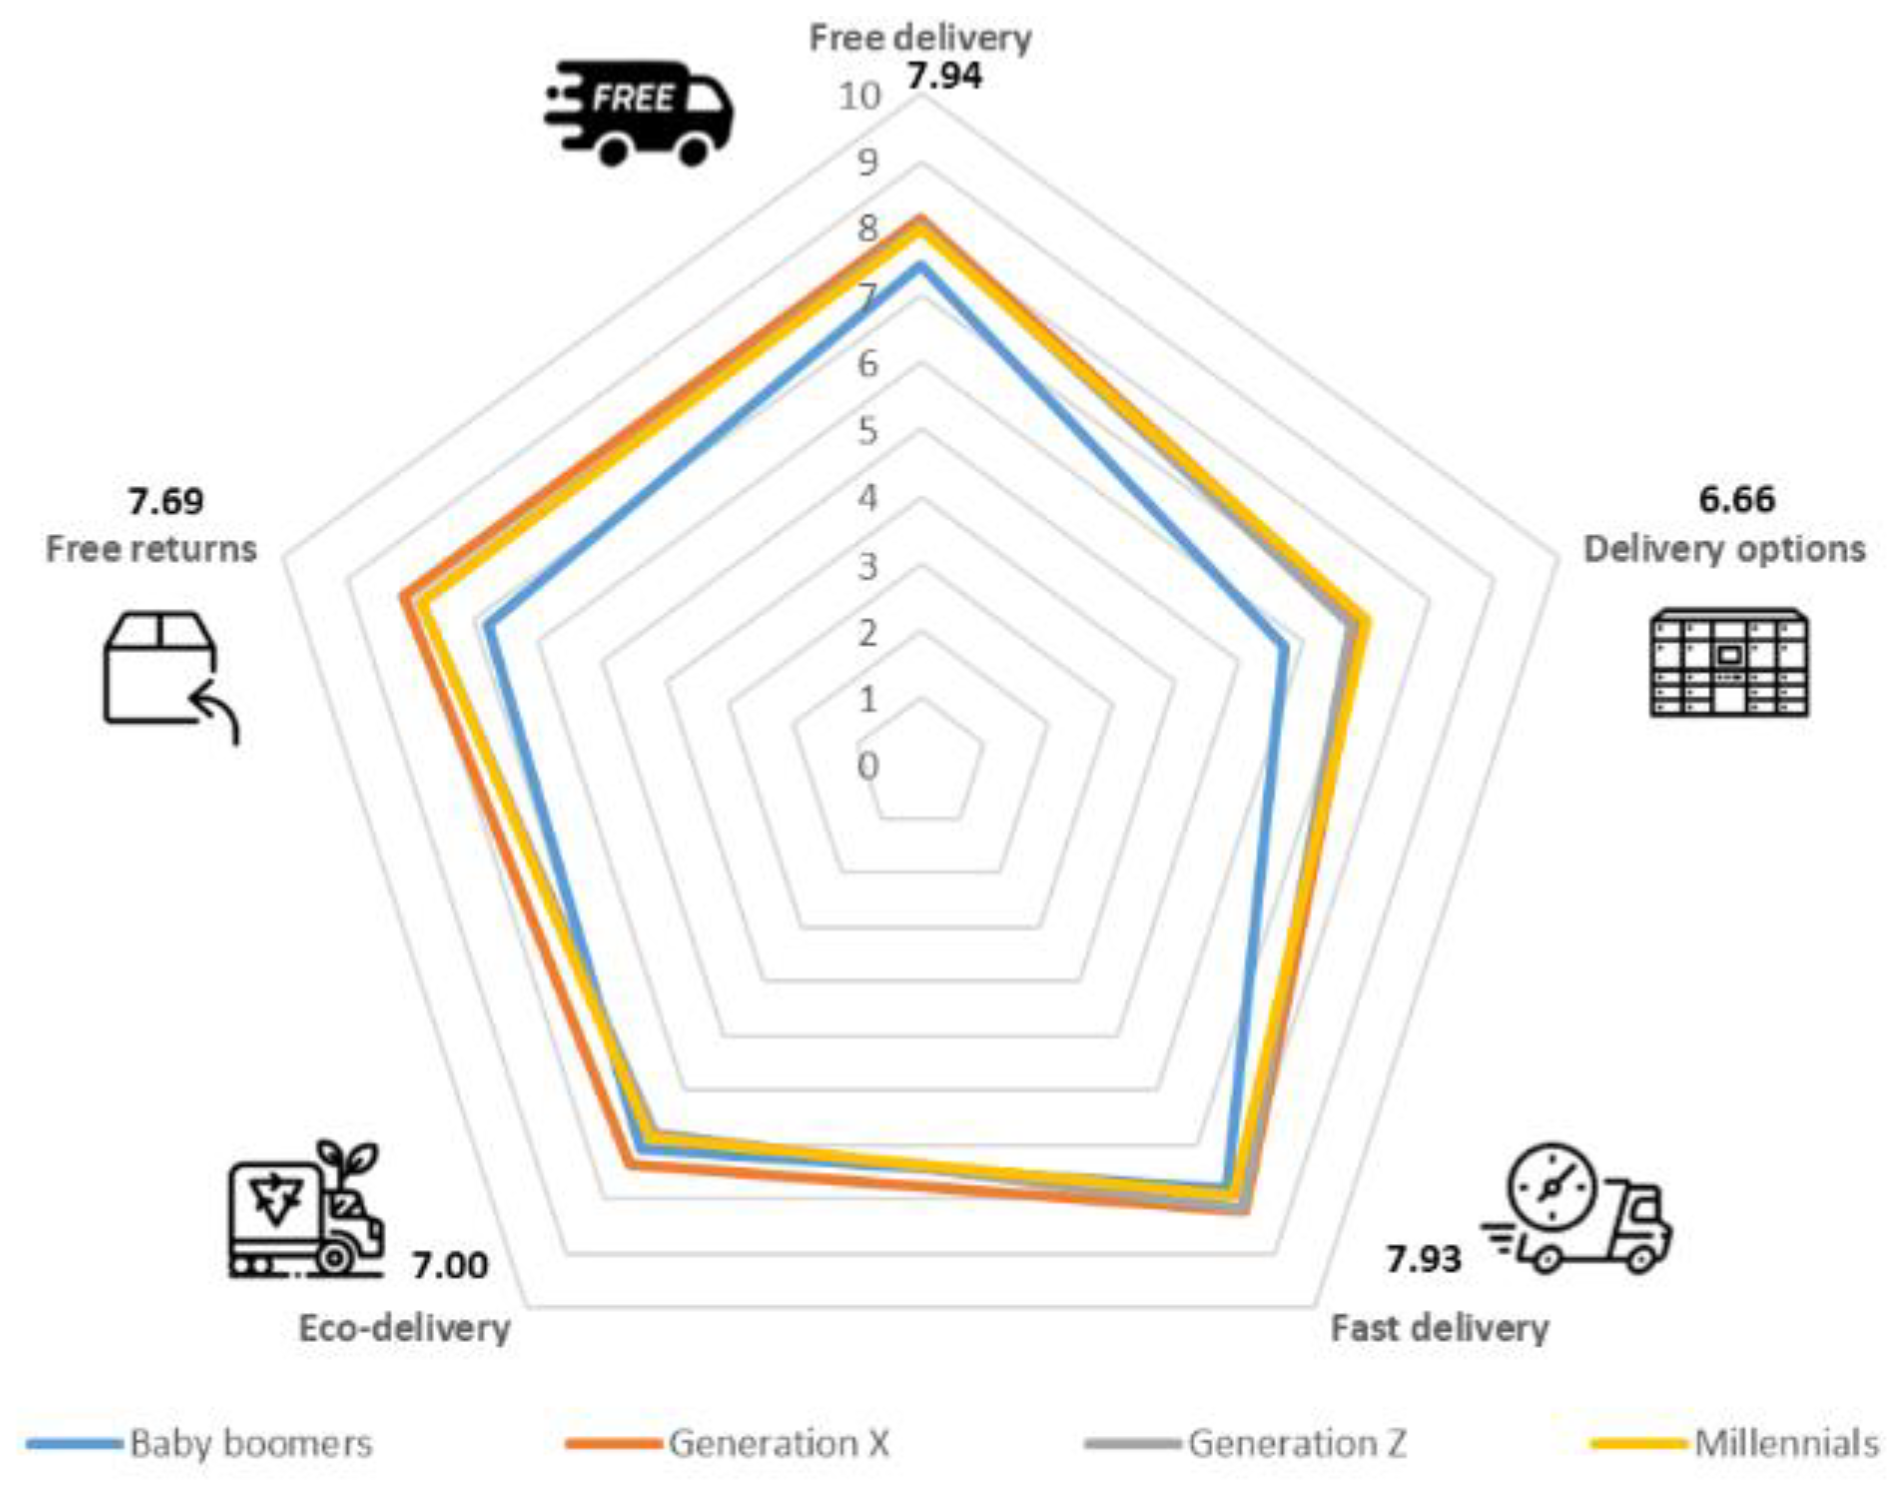
To assess the success factors related to e-commerce delivery, the survey asked the consumers to rate from 0 (lowest score) to 10 (highest score) the following aspects: (i) free delivery, (ii) delivery alternatives (smart lockers, pick-up centers, etc.), (iii) speed of delivery, (iv) green delivery (CO2 neutral), and (v) free returns.
First, a correlation matrix was constructed to measure the linear association of these variables (see Table 5), which showed the correlation coefficients among the variables related to e-commerce delivery for the survey conducted. The correlation coefficient measures the relationship between two variables and ranges from −1 to +1. These values should be interpreted in two ways. The modulus of the number informs the strength of the relationship between the variables, while the ‘+’ sign determines that the direction is directly proportional and the ‘−’ sign is inversely proportional [80].
The correlations between the variables were positive but weak or very weak for most of the variables assessed. Only the variables ‘free returns’ and ‘free delivery’ were considered moderately correlated. At a lower level, the relationships between ‘fast delivery’ and ‘free delivery’ and ‘fast delivery’ and ‘free returns’ appeared with a correlation higher than 0.5.
As shown in Table 6, the most highly rated factor was fast delivery, with an average rating of 8.05 from the surveyed e-commerce customers. Next, the highest-rated aspects were related to cost: free delivery (7.94) and then free returns (7.69). Green e-commerce delivery reached fourth place, with a score of 7.00; in last place, e-commerce customers rated the delivery alternatives available to them the lowest (6.66). As these ratings were obtained on a scale of 0 to 10 and all the options given were positive for the customers, the highest score was the most frequent value (mode) for all the aspects evaluated. Of the 706 respondents, 49 simultaneously scored the highest on all five factors.
The groups provided consistent ratings by generation (see Figure 8). The baby boomers rated all the e-commerce factors the lowest, except for eco-delivery (7.07), which generation Z rated the lowest (6.78). On the other hand, generation X rated four of the five factors the highest. Only delivery options were rated slightly higher by the millennials (6.97 vs. 6.94).
Concerning gender (see Table 7), there were no significant differences between the men and the women, and the ratings were very similar in all the aspects assessed. Regarding the ‘other’ category, very few persons were surveyed, which means that their data were not significant for comparison. Regarding the region of origin, the Spaniards rated all the critical factors of e-commerce delivery proposed lower than the rest of their European contemporaries and the respondents from American countries.
To determine the best predictors of the willingness to pay for eco-friendly e-commerce delivery, a logistic regression was performed, as it is a statistical method that allows the modeling of the probability of a binary qualitative variable (two possible values) as a function of one or more independent variables [81,82]. In the logistic regression model in our research, the values of the probabilities to be predicted corresponded with the dependent variable: ‘willingness to pay extra for an ecological e-commerce delivery.’ This had two possible values (1 = willingness to pay and 0 = unwillingness to pay), and the following independent variables or features were presented: gender (qualitative binary variable), generation (qualitative ordinal variable), and the quantitative variables related to the critical success factors in e-commerce deliveries analyzed in Table 5.
The multiple logistic regression model (Table 8) showed that sex (p = 0.0016), free delivery (p = 0.0001), delivery options (p = 0.0256), and eco-delivery (p ≤ 0.05) contribute to the model and are related to the willingness to pay the additional cost for eco-delivery in e-commerce (statistically significant p-values are highlighted in bold). In contrast, generation, fast delivery, and free returns (p > 0.05) do not contribute to the model and should not be used as predictor variables.
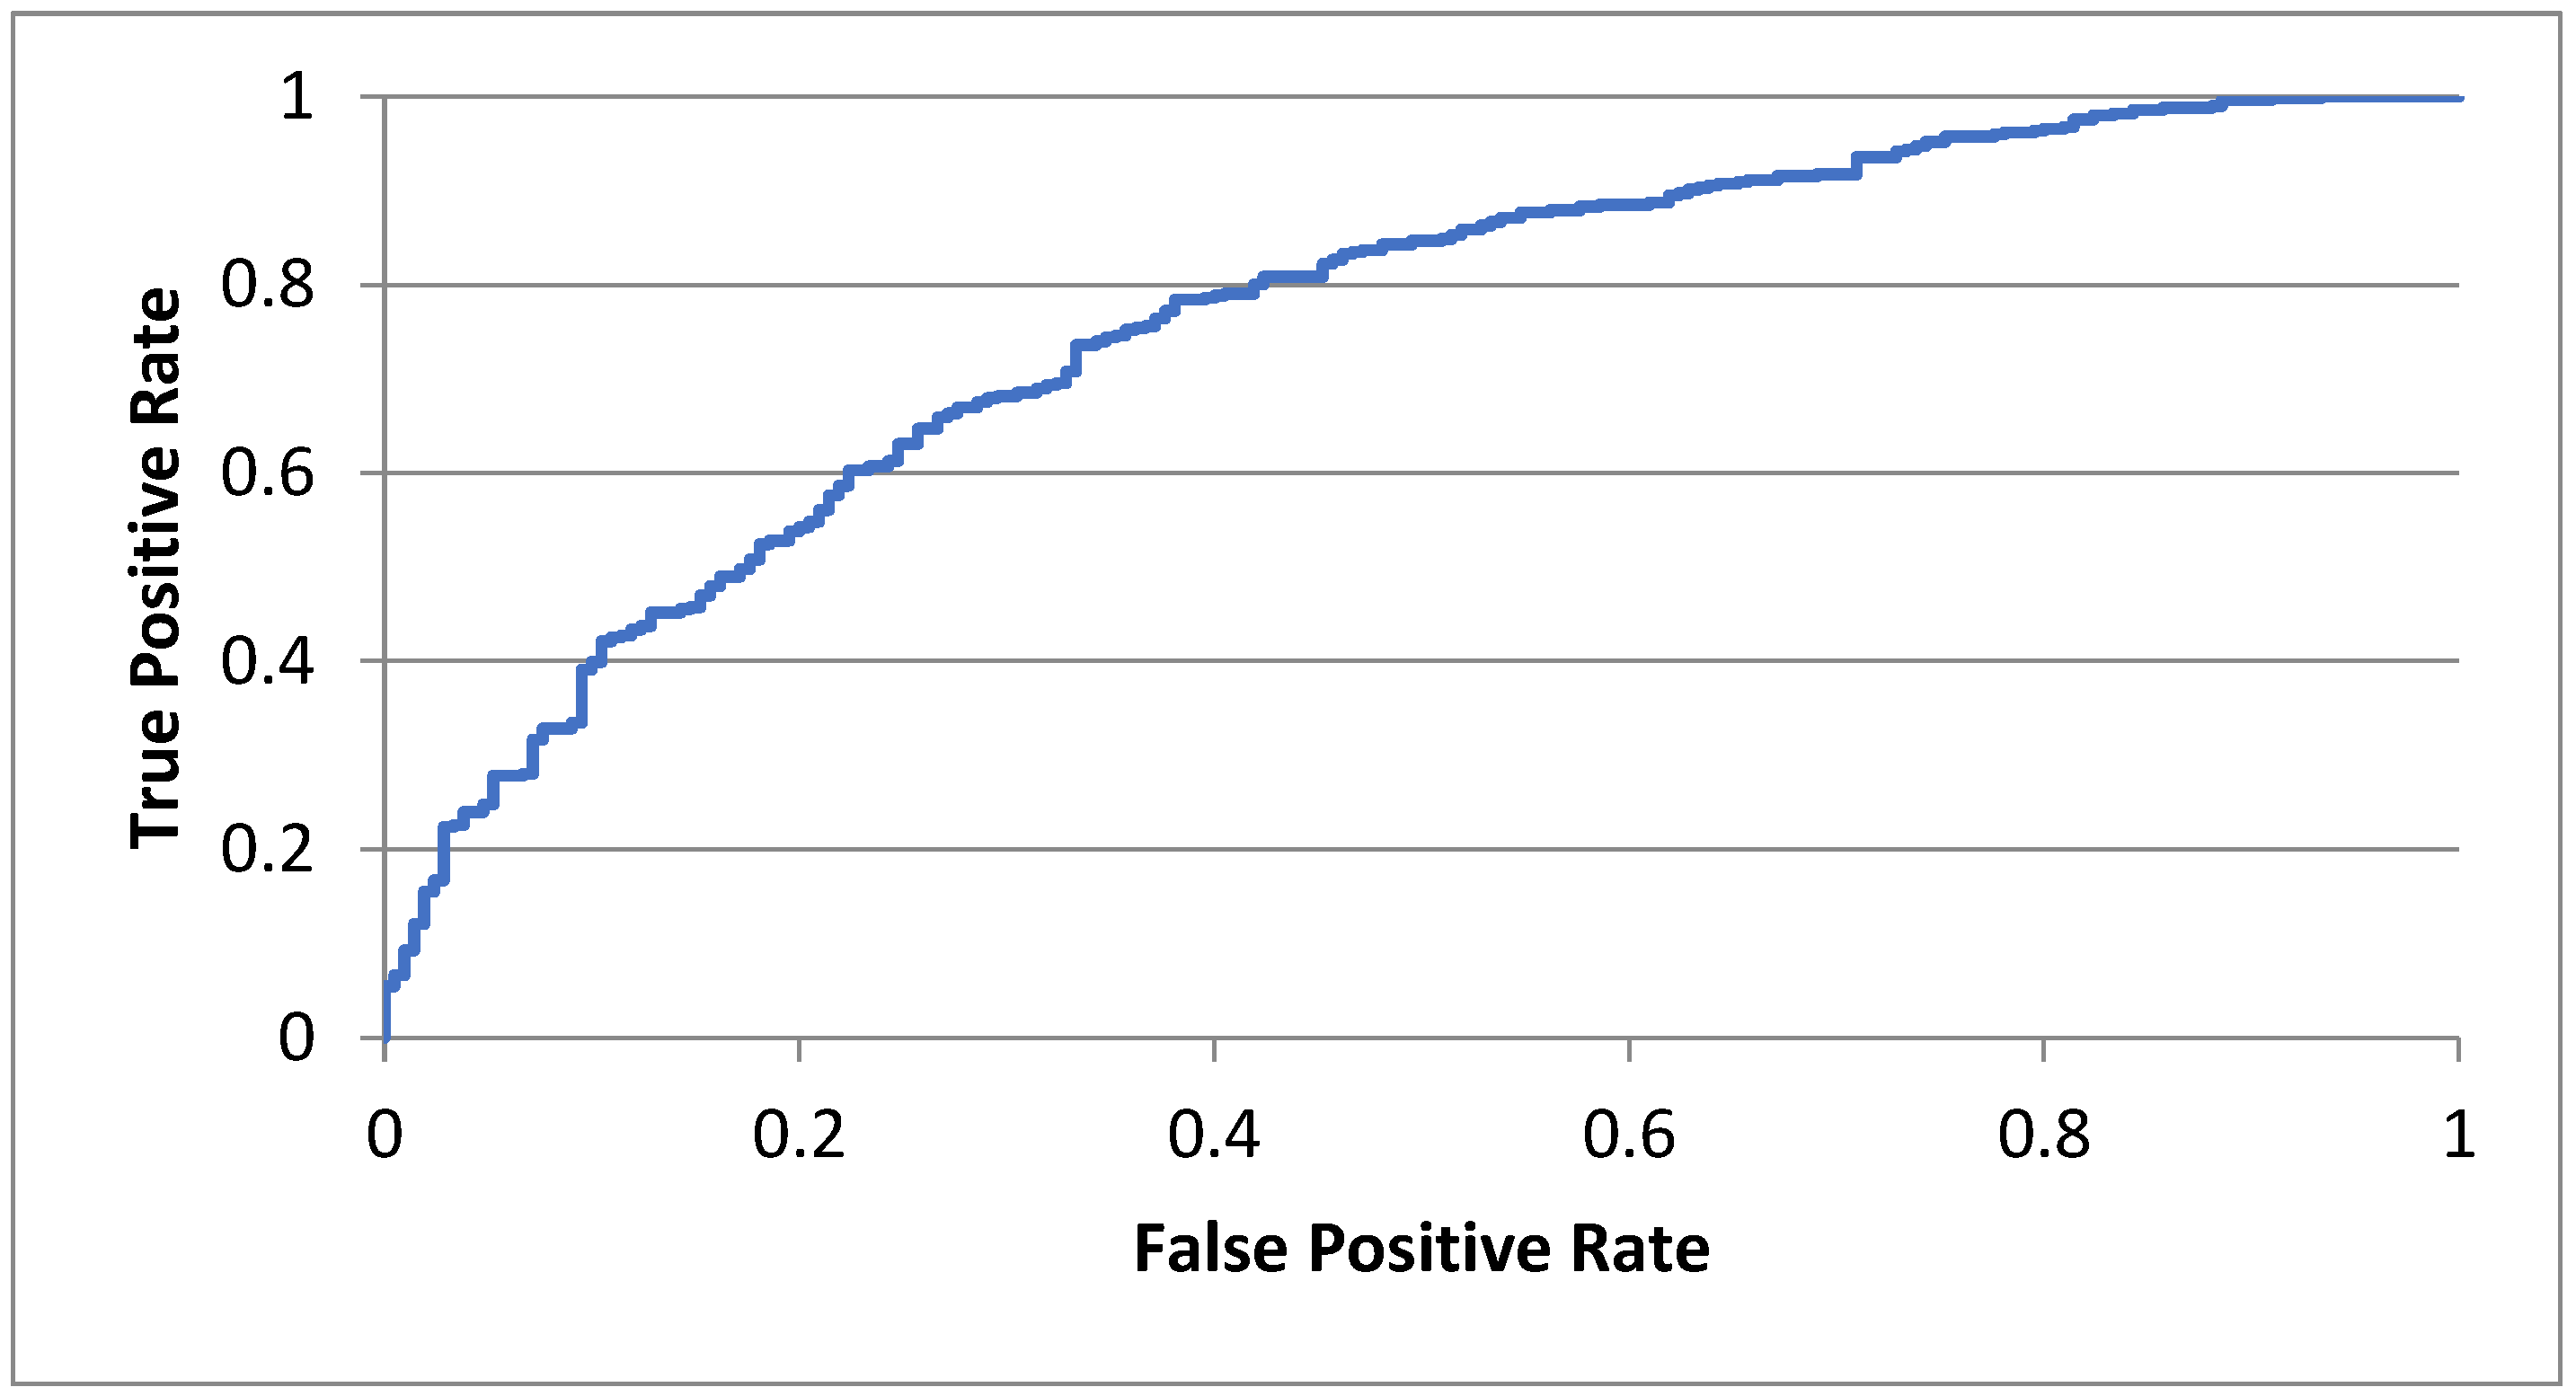
The logistic regression model was significant overall, with a p-value < 0.05 and a χ2 value = 136.98 (7 df), with an alpha = 0.05. The model’s accuracy was 74.08%, indicating that it correctly classified 74.08% of the observations. Below is the receiver operator characteristic (ROC) curve, which shows the diagnostic capability of binary classifiers [83]. The graph shows the true positive rate (TPR) versus the false positive rate (FPR). The TPR is the proportion of observations that were correctly predicted as positive out of all the positive observations (TP/(TP + FN)). The proximity of the curve to the upper left corner indicates a better model performance (see Figure 9).

6. Discussion

Our research confirmed the two hypotheses presented in this study: H1 and H2. Regarding H1, most of the respondents (70.25%) expressed their willingness to pay additional costs for guaranteed green e-commerce delivery. The results align with those of previous studies [6,74,75,76,84]. However, it is important to note that in the face of a generic question, there is a greater risk of response bias (respondents may feel pressured to give socially acceptable answers [85]). To mitigate this potential for generality in the responses, the respondents were asked to specify the amount of money they would be willing to pay, as those who favored lower prices may have been more price-sensitive and may have changed their opinions. The majority result was that the consumers surveyed would pay between EUR 1 and EUR 2 per shipment (31.05%), and less than EUR 1 (26.61%) for an organic online order. The remaining 42.34% would be willing to pay more than EUR 2 or a percentage of the value of a product. With online returns, a large majority (three out of four of the respondents) would be willing to delay the return of an e-commerce package if an environmentally friendly return was guaranteed, albeit with different deadlines. Notably, one in four of the respondents said they were unwilling to wait for an environmentally friendly return. These results can help guide e-retailers and other stakeholders to explore new sustainable practices related to delivering e-commerce.
Regarding H2, there were significant differences between the generations and genders in terms of their willingness to pay additional costs for green deliveries. Contrary to expectations, the older generation (baby boomers) showed a higher willingness to pay for green deliveries than the more modern generations (generation X, millennials, and generation Z). These results differ from those in previous research, in which more modern generations showed more environmentally friendly behavior, in that they were more eco-friendly and more technology- and sustainability-oriented [51,79,86]. This could have been because, although later generations are more socially conscious, or greener, the need to pay to be green was higher in this research. In this context, baby boomers may have greater purchasing power, allowing them to afford this extra cost, but no data are available to corroborate this hypothesis. Regarding gender, women (77.88%) are more willing to pay additional costs for eco-deliveries (more than 13 percentage points than men). In this case, the results align with the those in the literature review [54,77].
The study rejected H3 as, among the five best sustainable practices for recycling proposed, the respondents preferred the use of environmentally friendly materials in packaging. This solution is closely related to the second-highest-rated alternative, ‘eliminate plastic from the packaging we receive in e-commerce’, as both alternatives are designed to avoid generating waste that cannot be reused. When an online order arrives at consumers’ homes, consumers throw the packaging straight into the bin, which highlights the problem of packaging waste in e-commerce: most e-commerce packaging is not designed with sustainability in mind [49,50]. This is an example of a linear economy, in which items move through a unidirectional production, use, and disposal process. The alternative is moving towards a circular packaging economy, in which resources are continually reused or renewed to provide ongoing value. In our research, the three Rs of recycling (reduce, reuse, and recycle) were rated next, although the alternative of recycling packaging was rated higher than reusing and reducing.
Free delivery was the most highly rated critical aspect of e-commerce delivery in our research. This fact rejects H4, but it should be noted that the ratings were very similar between the two aspects (8.05 vs. 7.94). The difference between this result and those of previous consumer studies is that the consumers were given a choice between the alternatives (only one choice), with cost being the preferred option in these cases [48,49]. The cost of returns ranked below the cost of deliveries, in third place. Green deliveries were rated lower than the cost aspects, indicating that the surveyed customers, on the one hand, were willing to pay for green delivery but, on the other hand, that they valued free delivery and returns more highly. This assessment may indicate that consumers prefer and value green deliveries but still want deliveries to be free of charge, i.e., consumers are positively inclined towards sustainable consumption but do not change their behavior when they encounter economic barriers [54]. Delivery alternatives (parcel lockers, delivery points, etc.) were rated the lowest of all the aspects of e-commerce delivery, highlighting that the convenience and security of home delivery outweigh any possible alternatives [27].
Finally, H5 was rejected as the logistic regression indicated that the best predictors of the willingness to pay for green delivery in e-commerce were the following variables (in this order): green delivery, free delivery, gender, and delivery options. According to the results, socio-demographic factors (sex and generation) are not the best predictors in the regression model. Generation does not serve as a predictor of willingness to pay, free return, or fast delivery. There was no strong correlation among the explanatory variables that made up the logistic regression model. As expected, there was only a positive (albeit moderate) correlation between the ‘free returns’ and ‘free delivery’ variables. Again, it is important to highlight the differences between environmental awareness and willingness to pay for environmental issues. Environmental awareness may be a distinctive trait among the younger generation, but it is separate from price-to-pay issues [55].

7. Conclusions, Limitations, and Future Research

According to the data collected, this research shows that consumers are initially aware of or willing to adopt sustainable measures in e-commerce delivery. There is a willingness to pay additional costs if green delivery is guaranteed and sustainable delivery aspects are valued. However, when analyzing the most important factors in e-commerce parcel delivery, speed and free pick-up are aspects that e-consumers place ahead of green delivery. This study’s findings stress the need to balance the drive for speed and cost-effectiveness in e-commerce delivery with the urgency to adopt sustainable practices. This underscores the necessity for e-commerce platforms and logistics partners to take the lead in crafting and implementing innovative green delivery solutions while educating and consumers and incentivizing them to choose sustainable delivery options. This dichotomy highlights that these consumers are inclined towards sustainable delivery until economic barriers are encountered. As companies try to differentiate themselves further in e-commerce through their sustainability policies, it would be interesting to explore, in future research, the best alternative to passing on the associated additional charges so that customers can be assured of green delivery and still believe that they are receiving free and fast deliveries. One alternative could be to increase product prices or make customers pay an annual subscription while offering deliveries that are environmentally friendly.
This study also shows significant differences in terms of the willingness to pay between generations and genders. In theory, more modern generations are more aware of sustainability, but regarding payment, they are more reluctant than older generations. One possible explanation may be that younger generations have, in general, fewer financial resources than older generations. The former may consider it an obligation for companies to be sustainable and may need to understand that they must pay for products or services that should be compulsory in society. Regarding gender, women are more environmentally conscious, which can help retailers to personalize deliveries according to product type and target customer.
Regarding packaging, although many studies focus on the three Rs in e-commerce, the respondents favored using environmentally friendly packaging in and eliminating plastic from e-commerce deliveries. The shipping of products is part of the online shopping experience, and the packaging used plays a key role in adding value for customers. Several sustainable alternatives to traditional plastic-packaging systems exist, such as biodegradable, compostable products or products made from 100% natural materials. The problems arise when plastic is used for disposability purposes, which causes large quantities of plastic to accumulate. However, if plastic packaging is reused and recycled, it can be a valuable and durable material.
Based on the research results, different stakeholders can take actions that are beneficial to them and, at the same time, ensure the sustainability of e-commerce deliveries. Information regarding the willingness of consumers to become more sustainable must be visible and known to all stakeholders because when this information is made available to different actors, they can make more responsible and environmentally friendly decisions.
Finally, according to the survey data, gender may be a good predictor of willingness to pay, but generation is not. The research shows, unsurprisingly, how variables related to environmental awareness (eco-delivery and delivery options) can also be used as predictors of willingness to pay.
Within the theoretical implications of the study, the results of our research provide valuable insights for future researchers seeking to understand how different alternatives can be implemented to improve the sustainability of e-commerce delivery from the perspective of customers. Our research specifically focuses on determining the willingness to pay for green deliveries and assessing various green alternatives while also analyzing the differences between the generations. Therefore, our methodology may also pave the way for further research to gather detailed information on how to materialize and implement measures that reflect the greener attitudes of e-commerce customers.
Among the limitations of the results of our study, we acknowledge that this is a rapidly evolving field and that the references used in this research may need to be updated in the future. In order to provide a comprehensive understanding of the topic, future revisions of this paper will aim to incorporate the latest research in the field of e-commerce and green practices. Within this research, although the respondents’ postcodes are known, information regarding the income of the participants would be relevant. It would be interesting to have this information available and to determine whether there is a relationship between income level and willingness to pay for green e-commerce deliveries. On the other hand, the sampling was non-probabilistic, using the snowball-sample selection method (in which the subjects choose the next one to be surveyed because they meet the requested criteria), which implies that the results cannot be generalized. However, probabilistic sampling could provide more reliable information, and the distribution of respondents by country of origin would be more evenly distributed and less biased.
This research highlights the interest of consumers in the different options that can be presented in the packaging of e-commerce orders. In this sense, future research related to sustainable e-commerce could address packaging and its different alternatives within online orders in greater depth, as it is one of the polluting activities studied the least in the literature. Similarly, it would be desirable to carry out a study with a more balanced sample, according to country of origin, and to be able to compare the differences between them.

Author Contributions

All authors contributed equally to the data preparation and the analysis and to the interpretation of results. All authors made major contributions to writing the manuscript. All authors have read and agreed to the published version of the manuscript.

Funding

This research received no external funding.

Institutional Review Board Statement

Not applicable.

Informed Consent Statement

Informed consent was obtained from all subjects involved in the study.

Data Availability Statement

The data are accessible from the corresponding author upon request.

Conflicts of Interest

The authors declare no conflict of interest.

References

  1. Eurostat. E-Commerce Statistics for Individuals3. 2021. Available online: https://ec.europa.eu/eurostat/statistics-explained/index.php?title=E-commerce_statistics_for_individuals3 (accessed on 2 October 2022).
  2. Statista. Comercio Electrónico en El Mundo. 2022. Available online: https://es.statista.com/temas/9072/comercio-electronico-en-el-mundo/ (accessed on 14 November 2022).
  3. Dionysiou, G.; Fouskas, K.; Karamitros, D. The impact of COVID-19 in e-commerce Effects on consumer purchase behavior. In Strategic Innovative Marketing and Tourism in the COVID-19 Era; Kavoura, A., Havlovic, S.J., Totskaya, N., Eds.; Springer International Publishing: Cham, Switzerland, 2021; pp. 199–210. [Google Scholar] [CrossRef]
  4. McKinsey. The Future of Retail: Omnichannel Shopping in 2030. 2021. Available online: https://www.mckinsey.com/business-functions/growth-marketing-and-sales/our-insights/omnichannel-shopping-in-2030 (accessed on 12 November 2022).
  5. Muñoz-Villamizar, A.; Velázquez-Martínez, J.C.; Haro, P.; Ferrer, A.; Mariño, R. The environmental impact of fast shipping ecommerce in inbound logistics operations: A case study in Mexico. J. Clean. Prod. 2021, 283, 125400. [Google Scholar] [CrossRef]
  6. Nogueira, G.P.M.; de Assis Rangel, J.J.; Shimoda, E. Sustainable last-mile distribution in B2C e-commerce: Do consumers really care? Clean. Responsible Consum. 2021, 3, 100021. [Google Scholar] [CrossRef]
  7. Vakulenko, Y.; Shams, P.; Hellström, D.; Hjort, K. Service innovation in e-commerce last mile delivery: Mapping the e-customer journey. J. Bus. Res. 2019, 101, 461–468. [Google Scholar] [CrossRef]
  8. Heskett, J.L.; Jones, T.O.; Loveman, G.W.; Sasser, W.E., Jr.; Schlesinger, L.A. Putting the service-profit chain to work. Harv. Bus. Rev. 2008, 72, 164–174. [Google Scholar]
  9. Pham, T.S.H.; Ahammad, M.F. Antecedents and consequences of online customer satisfaction: A holistic process perspective. Technol. Forecast. Soc. Chang. 2017, 124, 332–342. [Google Scholar] [CrossRef]
  10. Mangiaracina, R.; Marchet, G.; Perotti, S.; Tumino, A. A review of the environmental implications of B2C E-commerce: A logistics perspective. Int. J. Phys. Distrib. Logist. Manag. 2015, 45, 565–591. [Google Scholar] [CrossRef]
  11. Gevaers, R.; Van De Voorde, E.; Vanelslander, T. Cost modelling and simulation of last-mile characteristics in an innovative B2C supply chain environment with implications on urban areas and cities. Procedia-Soc. Behav. Sci. 2014, 125, 398–411. [Google Scholar] [CrossRef] [Green Version]
  12. Halldórsson, Á.; Wehner, J. Last-mile logistics fulfilment: A framework for energy efficiency. Res. Transp. Bus. Manag. 2020, 37, 100481. [Google Scholar] [CrossRef]
  13. Sallnäs, U.; Björklund, M. Green e-commerce distribution alternatives—A mission impossible for retailers? Int. J. Logist. Manag. 2023, 34, 50–74. [Google Scholar] [CrossRef]
  14. Ignat, B.; Chankov, S. Do e-commerce customers change their preferred last-mile delivery based on its sustainability impact? Int. J. Logist. Manag. 2020, 31, 521–548. [Google Scholar] [CrossRef]
  15. Kandula, S.; Krishnamoorthy, S.; Roy, D. A prescriptive analytics framework for efficient E-commerce order delivery. Decis. Support Syst. 2021, 147, 113584. [Google Scholar] [CrossRef]
  16. E-Commerce Statistics for Individuals. Available online: https://ec.europa.eu/eurostat/statistics-explained/index.php?title=E-commerce_statistics_for_individuals (accessed on 14 November 2022).
  17. Russo, F.; Comi, A. A classification of city logistics measures and connected impacts. Procedia-Soc. Behav. Sci. 2010, 2, 6355–6365. [Google Scholar] [CrossRef]
  18. Taniguchi, E. Concepts of city logistics for sustainable and liveable cities. Procedia-Soc. Behav. Sci. 2014, 151, 310–317. [Google Scholar] [CrossRef] [Green Version]
  19. Kafle, N.; Zou, B.; Lin, J. Design and modeling of a crowdsource-enabled system for urban parcel relay and delivery. Transp. Res. Part B Methodol. 2017, 99, 62–82. [Google Scholar] [CrossRef]
  20. Lim, S.F.W.T.; Jin, X.; Srai, J.S. Consumer-driven e-commerce: A literature review, design framework, and research agenda on last-mile logistics models. Int. J. Phys. Distrib. Logist. Manag. 2018, 48, 308–332. [Google Scholar] [CrossRef] [Green Version]
  21. Taniguchi, E.; Thompson, R.G.; Qureshi, A.G. Recent Developments Prospects for Modeling City Logistics; Taniguchi, E., Thompson, R.G., Eds.; City Logistics 1; John Wiley & Sons, Inc.: Hoboken, NJ, USA, 2018; pp. 1–27. [Google Scholar] [CrossRef]
  22. Florio, A.M.; Feillet, D.; Hartl, R.F. The delivery problem: Optimizing hit rates in e-commerce deliveries. Transp. Res. Part B Methodol. 2018, 117, 455–472. [Google Scholar] [CrossRef]
  23. Di Gangi, M.; Polimeni, A.; Belcore, O.M. Freight distribution in small islands: Integration between naval services and parcel lockers. Sustainability 2023, 15, 7535. [Google Scholar] [CrossRef]
  24. Johnson Jorgensen, J.; Sorensen, K. Negative e-wom resulting from political posts on social media: A case study of a small retailer’s struggle over time. Soc. Sci. 2021, 10, 318. [Google Scholar] [CrossRef]
  25. Schroten, A.; Schep, E.; De Graaff, L.; Bijleveld, M.; Vergeer, R. Environ-Mental Prices Handbook EU28 Version. CE Delft. 2018. Available online: https://www.cedelft.eu/en/publications/2191/environmental-prices-handbook-eu28-version (accessed on 5 December 2022).
  26. International Post Corporation. Cross-Border E-Commerce Shopper Survey 2021. 2022. Available online: https://www.ipc.be/services/markets-and-regulations/cross-border-shopper-survey (accessed on 8 December 2022).
  27. Joerss, M.; Schröder, J.; Neuhaus, F.; Klink, C.; Mann, F. Parcel Delivery. In The Future of Last Mile; McKinsey: Seoul, Republic of Korea, 2016; Available online: https://cutt.ly/YbQQR5j (accessed on 20 December 2022).
  28. Kiba-Janiak, M.; Marcinkowski, J.; Jagoda, A.; Skowrońska, A. Sustainable last mile delivery on e-commerce market in cities from the perspective of various stakeholders. Literature review. Sustain. Cities Soc. 2021, 71, 102984. [Google Scholar] [CrossRef]
  29. Lowe, R.; Rigby, M. The Last Mile. Exploring the Online Purchasing and Delivery Journey; Barclays: New York, NY, USA, 2014. [Google Scholar]
  30. UPS. UPS Pulse of the Online ShopperTM Study. 2019. Available online: https://www.ups.com/assets/resources/media/knowledge-center/ups-pulse-of-the-online-shopper.PDF (accessed on 10 December 2022).
  31. IMRG. Imrg UK Consumer Home. Delivery Review 2015. 2015. Available online: https://www.imrg.org/res/files/D079A1FD568.pdf (accessed on 10 December 2022).
  32. Lee, H.L.; Chen, Y.; Gillai, B.; Rammohan, S. Technological Disruption and Innovation in Last-Mile Delivery. Stanford Graduate School of Business. 2016. Available online: https://www.gsb.stanford.edu/faculty-research/publications/technological-disruption-innovation-last-mile-delivery (accessed on 2 February 2023).
  33. Calabrò, G.; Pira, M.L.; Giuffrida, N.; Fazio, M.; Inturri, G.; Ignaccolo, M. Modelling the dynamics of fragmented vs. Consolidated last-mile e-commerce deliveries via an agent-based model. Transp. Res. Procedia 2022, 62, 155–162. [Google Scholar] [CrossRef]
  34. Hepp, S.B. Innovation in Last Mile Delivery: Meeting Evolving Customer De-mands—The Case of In-Car Delivery [Trabajo de Fin de Master, Universidade Católica Portuguesa]. Repositório Institucional Da Universidade Católica Portuguesa. 2018. Available online: http://hdl.handle.net/10400.14/25359 (accessed on 15 February 2023).
  35. World Economic Forum. The Future of the Last-Mile Ecosystem. Transition Roadmaps for Public- and Private-Sector Players. 2020. Available online: https://www3.weforum.org/docs/WEF_Future_of_the_last_mile_ecosystem.pdf (accessed on 15 December 2022).
  36. Khare, A.; Pandey, S. Role of green self-identity and peer influence in fostering trust towards organic food retailers. Int. J. Retail. Distrib. Manag. 2017, 45, 969–990. [Google Scholar] [CrossRef] [Green Version]
  37. Grima, S.; Sirkeci, O.; Elbeyoglu, K. (Eds.) Global Street Economy and Micro Entrepreneurship, 1st ed.; Emerald Publishing: Bingley, UK, 2020. [Google Scholar]
  38. Cárdenas, I.D.; Dewulf, W.; Beckers, J.; Smet, C.; Vanelslander, T. The e-commerce parcel delivery market and the implications of home B2C deliveries vs. pick-up points. Int. J. Transp. Econ. 2017, 44, 235–256. [Google Scholar] [CrossRef]
  39. Kin, B.; Verlinde, S.; Macharis, C. Sustainable urban freight transport in megacities in emerging markets. Sustain. Cities Soc. 2017, 32, 31–41. [Google Scholar] [CrossRef]
  40. Yang, C.; Chen, M.; Yuan, Q. The geography of freight-related accidents in the era of E-commerce: Evidence from the Los Angeles metropolitan area. J. Transp. Geogr. 2021, 92, 102989. [Google Scholar] [CrossRef]
  41. Seghezzi, A.; Siragusa, C.; Mangiaracina, R. Parcel lockers vs. home delivery: A model to compare last-mile delivery cost in urban and rural areas. Int. J. Phys. Distrib. Logist. Manag. 2022, 52, 213–237. [Google Scholar] [CrossRef]
  42. Cárdenas, I.; Beckers, J.; Vanelslander, T. E-commerce last-mile in Belgium: Developing an external cost delivery index. Res. Transp. Bus. Manag. 2017, 24, 123–129. [Google Scholar] [CrossRef]
  43. Mclaughlin, K. The Emissions Implications of Modern Retailing: Omnichannel vs. Stores and Online Pure-Plays, Bentonville, Arkansas. 2017. Available online: https://cdn.corporate.walmart.com/00/5a/3c20743a4f0db2d00c452aebea95/omni-channel-emissions-modeling-whitepaperfinal04182017.pdf (accessed on 4 February 2023).
  44. Melacini, M.; Tappia, E. A critical comparison of alternative distribution configurations in omni-channel retailing in terms of cost and greenhouse gas emissions. Sustainability 2018, 10, 307. [Google Scholar] [CrossRef] [Green Version]
  45. Jaller, M.; Pahwa, A. Evaluating the environmental impacts of online shop-ping: A behavioral and transportation approach. Transp. Res. Part D Transp. Environ. 2020, 80, 102223. [Google Scholar] [CrossRef]
  46. Comi, A.; Nuzzolo, A. Exploring the relationships between e-shopping attitudes and urban freight transport. Transp. Res. Procedia 2016, 12, 399–412. [Google Scholar] [CrossRef]
  47. European Commission. A European Green Deal—Striving to Be the First Climate-Neutral Continent. European Union. 2019. Available online: https://ec.europa.eu/info/strategy/priorities-2019-2024/european-green-deal_ (accessed on 15 December 2022).
  48. Lukic, V.; Souza, R.; Wolfgang, M. Same-Day Delivery. Not Ready for Prime Time; The Boston Consulting Group: Boston, MA, USA, 2013. [Google Scholar]
  49. Merkert, R.; Bliemer, M.C.J.; Fayyaz, M. Consumer preferences for innovative and traditional last-mile parcel delivery. Int. J. Phys. Distrib. Logist. Manag. 2022, 52, 261–284. [Google Scholar] [CrossRef]
  50. Buldeo Rai, H.; Verlinde, S.; Macharis, C. The “next day, free delivery” myth unravelled: Possibilities for sustainable last mile transport in an omnichannel environment. Int. J. Retail. Distrib. Manag. 2019, 47, 39–54. [Google Scholar] [CrossRef]
  51. Polinori, P.; Marcucci, E.; Bollino, C.A.; Bigerna, S.; Gatta, V. Eco-labeling and sustainable urban freight transport: How much are people willing to pay for green logistics? Int. J. Transp. Econ. 2018, 631–658. [Google Scholar] [CrossRef]
  52. White, K.; Habib, R.; Hardisty, D.J. How to shift consumer behaviors to be more sustainable: A literature review and guiding framework. J. Mark. 2019, 83, 22–49. [Google Scholar] [CrossRef] [Green Version]
  53. Klein, P.; Popp, B. Last-mile delivery methods in e-commerce: Does perceived sustainability matter for consumer acceptance and usage? Sustainability 2022, 14, 16437. [Google Scholar] [CrossRef]
  54. Caspersen, E.; Navrud, S.; Bengtsson, J. Act locally? Are female online shoppers willing to pay to reduce the carbon footprint of last mile deliveries? Int. J. Sustain. Transp. 2021, 16, 1144–1158. [Google Scholar] [CrossRef]
  55. Lehmann, J.; Sheffi, Y. Consumers’ (Not So) Green Purchase Behavior. J. Mark. Dev. Compet. 2020, 14, 76–90. Available online: https://sheffi.mit.edu/sites/sheffi.mit.edu/files/2019-08/Consumers'%20(not%20so)%20Green%20Purchase%20Behavior.pdf (accessed on 20 February 2023).
  56. Escursell, S.; Llorach-Massana, P.; Roncero, M.B. Sustainability in e-commerce packaging: A review. J. Clean. Prod. 2021, 280, 124314. [Google Scholar] [CrossRef]
  57. Eurostat. SDG 12—Responsible Consumption and Production. 2018. Available online: https://ec.europa.eu/eurostat/statistics-explained/index.php?title=SDG_12_-_Responsible_consumption_and_production#Responsible_consumption_and_production_in_the_EU:_overview_and_key_trends (accessed on 22 December 2022).
  58. Pålsson, H.; Pettersson, F.; Winslott Hiselius, L. Energy consumption in e-commerce versus conventional trade channels—Insights into packaging, the last mile, unsold products and product returns. J. Clean. Prod. 2017, 164, 765–778. [Google Scholar] [CrossRef]
  59. Tokar, T.; Jensen, R.; Williams, B.D. A guide to the seen costs and unseen benefits of e-commerce. Bus. Horiz. 2021, 64, 323–332. [Google Scholar] [CrossRef]
  60. Meherishi, L.; Narayana, S.A.; Ranjani, K.S. Sustainable packaging for supply chain management in the circular economy: A review. J. Clean. Prod. 2019, 237, 117582. [Google Scholar] [CrossRef]
  61. Monnot, E.; Reniou, F.; Parguel, B.; Elgaaied-Gambier, L. “Thinking outside the packaging box”: Should brands consider store shelf context when eliminating over-packaging? J. Bus. Ethics 2019, 154, 355–370. [Google Scholar] [CrossRef]
  62. Lu, S.; Yang, L.; Liu, W.; Jia, L. User preference for electronic commerce overpackaging solutions: Implications for cleaner production. J. Clean. Prod. 2020, 258, 120936. [Google Scholar] [CrossRef]
  63. Li, Y.; Feng, C.; Liu, H. Package-free returns: A trend in green ecommerce. In Advances in Digital Marketing and Ecommerce; Martínez-López, F.J., López, D., Eds.; Springer International Publishing: Cham, Switzerland, 2021; pp. 330–334. [Google Scholar] [CrossRef]
  64. Xie, G.; Huang, L.; Apostolidis, C.; Huang, Z.; Cai, W.; Li, G. Assessing Consumer Preference for Overpackaging Solutions in E-Commerce. Int. J. Environ. Res. Public Health 2021, 18, 7951. [Google Scholar] [CrossRef]
  65. Packaging Europe. The Cost of E-Commerce Returns for Retailers. 2022. Available online: https://packagingeurope.com/comment/the-cost-of-e-commerce-returns-for-retailers/8094.article (accessed on 12 February 2023).
  66. Frei, R.; Jack, L.; Krzyzaniak, S.-A. Mapping product returns processes in multichannel retailing: Challenges and opportunities. Sustainability 2022, 14, 1382. [Google Scholar] [CrossRef]
  67. Zhang, Y.; Voorhees, C.M.; Lin, C.; Chiang, J.; Hult, G.T.M.; Calantone, R.J. Information search and product returns across mobile and traditional online channels. J. Retail. 2022, 98, 260–276. [Google Scholar] [CrossRef]
  68. Frei, R.; Jack, L.; Brown, S. Product returns: A growing problem for business, society and environment. Int. J. Oper. Prod. Manag. 2020, 40, 1613–1621. [Google Scholar] [CrossRef]
  69. Manerba, D.; Mansini, R.; Zanotti, R. Attended Home Delivery: Reducing last-mile environmental impact by changing customer habits. IFAC-PapersOnLine 2018, 51, 55–60. [Google Scholar] [CrossRef]
  70. Guo, X.; Lujan Jaramillo, Y.J.; Bloemhof-Ruwaard, J.; Claassen, G.D.H. On integrating crowdsourced delivery in last-mile logistics: A simulation study to quantify its feasibility. J. Clean. Prod. 2019, 241, 118365. [Google Scholar] [CrossRef]
  71. Ding, Y.; Jin, M. Service and pricing strategies in online retailing under car-bon emission regulation. J. Clean. Prod. 2019, 217, 85–94. [Google Scholar] [CrossRef]
  72. B2C Europe. Green & Social Delivery Report. The Future of Ecommerce Lies in Its Sustainability and Sociality; B2C Europe: Brussels, Switzerland, 2018. [Google Scholar]
  73. Buldeo Rai, H.; Broekaert, C.; Verlinde, S.; Macharis, C. Sharing is caring: How non-financial incentives drive sustainable e-commerce delivery. Transp. Res. Part D Transp. Environ. 2021, 93, 102794. [Google Scholar] [CrossRef]
  74. Accenture. Accenture Chemicals Global Consumer Sustainability Survey 2019. 2019. Available online: https://www.slideshare.net/accenture/accenture-chemicals-global-consumer-sustainability-survey-2019 (accessed on 12 February 2023).
  75. Rausch, T.M.; Baier, D.; Wening, S. Does sustainability really matter to consumers? Assessing the importance of online shop and apparel product attributes. J. Retail. Consum. Serv. 2021, 63, 102681. [Google Scholar] [CrossRef]
  76. Direct Link. E-Commerce in Europe. 2022. Available online: https://www.directlink.com/e-commerce-in-europe/ (accessed on 2 February 2023).
  77. Nguyen, D.H.; de Leeuw, S.; Dullaert, W.; Foubert, B.P.J. What is the right delivery option for you? Consumer preferences for delivery attributes in online retailing. J. Bus. Logist. 2019, 40, 299–321. [Google Scholar] [CrossRef] [Green Version]
  78. Falke, A.; Schröder, N.; Hofmann, C. The influence of values in sustainable consumption among millennials. J. Bus. Econ. 2021, 92, 899–928. [Google Scholar] [CrossRef]
  79. Brand, B.M.; Rausch, T.M.; Brandel, J. The importance of sustainability aspects when purchasing online: Comparing generation x and generation z. Sustainability 2022, 14, 5689. [Google Scholar] [CrossRef]
  80. Charter, R.A. Statistical approaches to achieving sufficiently high test score re-liabilities for research purposes. J. Gen. Psychol. 2008, 135, 241–251. [Google Scholar] [CrossRef]
  81. Freedman, D.; Pisani, R.; Purves, R. Statistics (International Student Edition), 4th ed.; Pisani, R., Purves, R., Eds.; W.W. Norton & Company: New York, NY, USA, 2007. [Google Scholar]
  82. Hilbe, J.M. Logistic Regression Models; CRC Press: Boca Raton, FL, USA, 2009. [Google Scholar]
  83. Pepe, M.S. An interpretation for the roc curve and inference using glm procedures. Biometrics 2000, 56, 352–359. [Google Scholar] [CrossRef]
  84. Nielsen. A ‘Natural’ Rise in Sustainability around the World. NielsenIQ. 2019. Available online: https://nielseniq.com/global/en/insights/analysis/2019/a-natural-rise-in-sustainability-around-the-world/ (accessed on 25 February 2023).
  85. Randall, D.M.; Fernandes, M.F. The social desirability response bias in ethics research. J. Bus. Ethics 1991, 10, 805–817. [Google Scholar] [CrossRef]
  86. Dabija, D.C.; Bejan, B.M.; Dinu, V. How sustainability oriented is Generation Z in retail? A literature review. Transform. Bus. Econ. 2019, 18, 140–155. [Google Scholar]
Figure 1. Models for delivery in the distribution of e-commerce orders.
Sustainability 15 12161 g001
Figure 2. Research methodology.
Sustainability 15 12161 g002
Figure 3. Research-survey sheet.
Sustainability 15 12161 g003
Figure 4. Willingness to pay for eco deliveries by generation.
Sustainability 15 12161 g004
Figure 5. Number of people willing to pay for additional cost of green delivery.
Sustainability 15 12161 g005
Figure 6. Assessment of eco-friendly alternatives for ecommerce packaging.
Sustainability 15 12161 g006
Figure 7. Accepted return time for an e-commerce order by generation.
Sustainability 15 12161 g007
Figure 8. Rating of return times for e-commerce orders by generation.
Sustainability 15 12161 g008
Figure 9. Receiver-operator-characteristic curve.
Sustainability 15 12161 g009
Table 1. Customers’ ecommerce-delivery preferences based on reviewed research.
Preference of E-Commerce CustomersPapers
Shipping costs[34,35]
Customers’ willingness to pay more for sustainable delivery[36,37,38,39,40,41,60,61,62]
Consumers’ willingness to implement the three Rs (packaging)[47,48,49,50]
Sustainable returns[54]
Delivery options[36]
Fast delivery[55,56]
Customers’ desire not to pay more for sustainable delivery[36,63]
Table 2. Surveys received by generation and country.
CountryBaby BoomersGeneration XGeneration ZMillennialsTotal
Argentina 224
Belgium1 12
Colombia22 26
France 1225
Germany142310
Greece 1 1
Hungary 1 1
Italy1 23
Mexico 12 3
Panama1311419
Portugal 3115
Spain130151186175642
Not specified 2114
Total136169208193706
Table 3. Main statistics related to the packaging preferences in ecommerce.
Recycle Incoming PackagingReduce the Size of PackagesEco-Friendly PackagingReuse PackagingEliminate Plastic from Packaging
Mean3.072.523.572.583.26
Standard error0.050.050.050.050.06
Median3.002.004.002.003.00
Mode3.001.004.001.005.00
Standard deviation1.301.341.251.391.49
Sample variance1.691.791.571.942.22
Kurtosis−1.08−0.96−0.74−1.16−1.38
Skewness coefficient−0.050.47−0.540.38−0.22
Range4.004.004.004.004.00
Sum2168.001781.002521.001821.002299.00
Confidence level (95.0%)0.100.100.090.100.11
Table 4. Accepted return times for e-commerce orders by gender.
ManWomanOther
As long as needed to ensure an ecological return23.85%27.88%
2–5 days29.49%33.97%
6–10 days18.97%18.91%25.00%
None (as soon as possible) 27.69%19.23%75.00%
Table 5. Correlation matrix between critical delivery factors in e-commerce.
Free DeliveryDelivery OptionsFast DeliveryEco-DeliveryFree Returns
Free delivery1.000
Delivery options0.2711.000
Fast delivery0.5680.2471.000
Eco-delivery0.1490.3970.1881.000
Free returns0.6070.3580.5310.2191.000
Table 6. Main statistics related to critical delivery factors in e-commerce.
Free DeliveryDelivery OptionsFast DeliveryEco-DeliveryFree Returns
Mean7.946.668.057.007.69
Standard error0.080.110.080.090.10
Median8.007.008.007.009.00
Mode10.0010.0010.0010.0010.00
Standard deviation2.062.802.072.452.66
Sample variance4.267.864.275.987.08
Kurtosis0.59−0.771.120.08−0.03
Skewness coefficient−0.94−0.52−1.18−0.76−1.04
Range10.0010.0010.0010.0010.00
Sum5603.004701.005682.004944.005427.00
Confidence level (95.0%)0.150.210.150.180.20
Table 7. Score for critical e-commerce-delivery factors by generation, gender, and region.
Free DeliveryDelivery OptionsFast DeliveryEco-DeliveryFree Returns
Baby boomers7.465.727.797.076.78
Generation X8.156.948.227.368.09
Generation Z8.046.758.196.787.82
Millennials 7.976.987.926.897.82
Man 7.946.658.136.837.65
Woman7.936.697.947.257.71
Other8.005.258.754.259.00
Spain7.876.477.956.897.59
Europe8.598.419.528.338.96
America8.428.488.617.798.30
Table 8. Results of multivariate logistic regression analysis for the explained feature and predictors.
Explained Feature: Willingness to Pay for Ecological DeliveryOR (Odds Ratio)ES (Standard Error) CI (Confidence Interval) 95%pCoeff b
Sex0.5580.1850.388–0.8010.0016−0.584
Generation0.9670.0880.813–1.1490.6996−0.034
Free delivery0.7690.0680.673–0.8780.0001−0.263
Delivery options0.9170.0390.850–0.9900.0256−0.086
Fast delivery0.8870.0620.786–1.0020.0530−0.120
Eco-delivery1.4410.0461.317–1.5770.00000.365
Free-returns0.9560.0500.867–1.0530.3615−0.045
Disclaimer/Publisher’s Note: The statements, opinions and data contained in all publications are solely those of the individual author(s) and contributor(s) and not of MDPI and/or the editor(s). MDPI and/or the editor(s) disclaim responsibility for any injury to people or property resulting from any ideas, methods, instructions or products referred to in the content.

