Article

Distribution and Source Resolution of Heavy Metals in an Electroplating Site and Their Health Risk Assessment

1
College of Environmental and Chemical Engineering, Shanghai University of Electric Power, Shanghai 201306, China
2
School of Environmental Science and Engineering, Shanghai Jiao Tong University, Shanghai 200240, China
3
SGIDI Engineering Consulting (Group) Co., Ltd., Shanghai 200093, China
4
Shanghai Engineering Research Center of Geo-Environment, Shanghai 200093, China
*
Author to whom correspondence should be addressed.
Sustainability 2023, 15(16), 12166; https://doi.org/10.3390/su151612166
Submission received: 4 July 2023 / Revised: 23 July 2023 / Accepted: 8 August 2023 / Published: 9 August 2023
(This article belongs to the Special Issue Sustainability: Resources and Waste Management)

Abstract

:
It is very important to understand the distribution and sources of typical potentially toxic elements in industrial sites in order to provide essential information for risk assessment and the process of land reclamation selection. Here, around 29 soil column samples of 6 m depth were collected using a geoprobe drill rig from a typical electroplating site located in the Yangtze River Delta, which has been operating for more than 20 years. Analysis in the laboratory, including measurement of elemental concentrations using ICP-OES, was carried out. The distribution and sources of typical heavy metals were investigated, and correlated risks were assessed using positive matrix factorization. As, Pb, and Cr were the dominant heavy metal pollutants, with ranges of 3.20–154 mg/kg, 13.9–9271 mg/kg, and 27.2–2970 mg/kg, which were 1.28 times, 11.6 times, and 3.71 times higher than the Chinese national standard, respectively. Pb was found to be accumulated in the top 0–2 m and As in the top 0–3 m due to the presence of a typical clay and loamy soil. Additionally, Cr could be transferred into the groundwater, with a maximum concentration of 497 mg/kg, due to frequent interaction between the groundwater and soil. A PMF model showed that the dominant sources of pollution were the electroplating process section, the glass melting process section, the production process section, and the electroplating wastewater. Pb, As, and Cr were mainly generated from the industrial production process, glass melting process, and electroplating process. The pH and CEC appeared to influence the chemical speciation greatly, with higher content observed bound to carbonates as a result of exchange processes in the case of high CEC and low pH conditions. Both the Pb and As observed could contribute to non-carcinogenic and carcinogenic health risks, respectively, based on PMF-HRA analysis, which should receive greater attention in risk management strategies for polluted sites. Identification of the main sources of heavy metals in a site could provide a basis for potential land reclamation.

1. Introduction

The rapid increase in urbanization and industrial restructuring has resulted in the emergence of a large number of contaminated sites [1]. The legacies of chemical manufacturing accounted for the most significant proportion of these in a recent investigation of 625 industrial areas in China, providing sources of heavy metals including Cr, Pb, Cd, Zn, Ni, and As [2]. As is a widely distributed quasi-metallic element in the environment [3]. Therefore, in the following manuscript, As will be referred to as a heavy metal. Through soil investigation at eight pollution points in five provinces in southeastern China, it was found that Pb, Ni, and Cd were the main pollutants in industrial sites [4]. Coke/chemical processing and oxygen production in steel plants lead to Pb, Cd and Hg pollution [5]. In the electroplating industry, the production process generates a large amount of Cr pollution [6]. The Yangtze River Delta is the economic center of modern China, accounting for almost a quarter of China’s gross domestic product (GDP), though its land area is less than 2.3% [7]. Therefore, the rational use of land resources in the Yangtze Delta is very important. A large number of electroplating, printing and dyeing, and chemical companies have settled here [8], with electroplating industries having been widespread in this area. Taking Shanghai as an example, approximately 452 electroplating companies were present in the past, with 75% of these having relocated in the past ten years due to industrial renewal and adjustment. As a result, these sites should be reclaimed to mitigate the environmental and health risks associated with heavy metal contamination. On the other hand, in the YRD area, the shallow groundwater table and frequent interaction between the groundwater and soil have increased the diffusion of heavy metals. The nature of heavy metals present plays a crucial role in their mobility and their potential risks in soil, which should be considered during the investigation of contaminated sites [9].
Various assessment indicators have been used to assess the ecological risks and pollution levels associated with heavy metals in soil, such as the Nemerow index, the single pollution index, the potential ecological risk index, and health risk assessment [10,11]. The individual contamination index and the Nemerow index have been widely applied for the assessment of heavy metals risks, although individual heavy metal risks cannot be evaluated separately [12]. The Nemerow index approach has often been employed to evaluate the level of heavy metal pollution in the environment. Apart from the concentrations of heavy metals, an ecological risk index has also been used to evaluate the ecological harm in sediments by taking into account factors such as the toxicity level and ecological effects [13]. The use of a health risk assessment model can provide a more specific assessment of the impact of heavy metals in terms of the carcinogenic and non-carcinogenic effects through oral and respiratory routes and skin exposure as intake pathways [14]. Both the pollution and the associated risk should be considered when assessing contaminated sites.
Identifying the primary sources of heavy metal pollutants and their individual contribution is important [15,16]. In recent years, many source apportionment methods have been used to analyze the sources of heavy metal pollution, such as chemical mass balance (CMB) [17], principal component analysis/multiple linear regression (PCA-MLR) [18], the UNMIX model [19], and positive matrix factorization (PMF) [20]. PMF has been widely used for analyzing the sources of heavy metals in soil and is one of the most popular methods. PMF was used to identify quantitatively pollution sources for inorganic pollutants in the surface water and the groundwater on the southern edge of the Junggar Basin [21]. Combination of a PMF model and a health risk assessment model may provide an effective solution for the quantification of contributions to health risks.
In this work, a typical working electroplating site was selected for the assessment of heavy metal pollution after 20 years of operation, in order to evaluate the real situation of the transportation and diffusion of heavy metals in such a special area, and to determine the frequency of interactions between the groundwater and the soil. The distribution, chemical forms, sources, and health risks of heavy metals were investigated at an actual electroplating site in the YRD. Soil column samples of 6 m depth were collected to identify the diffusion of heavy metals in this complex site. The objectives were: (1) to correlate the typical heavy metal species with soil properties; (2) to identify pollution factors, to quantify the contribution rates of heavy metals in each process section, and to assess the degree of harm posed by heavy metals using the PMF model, a potential risk index, and health risk assessment; and (3) to assess the sources of heavy metal health risks by combining the PMF model with a health risk assessment model.

2. Materials and Methods

2.1. Study Area and Soil Sampling

A 31,000 square meter legacy site of a bulb factory was selected in the coastal plain area of the YRD region (located at 121°17′30″–121°17′42″ E and 31°22′51″–31°22′59″ N). The site comprised an inspection workshop, machine repair room, electroplating workshop, glass workshop, grinding machine workshop, overhaul room, and warehouse. Based on preliminary survey, the electroplating workshop and glass workshop were identified as the main areas for heavy metal application. The glass workshop (the sampling point A) and the electroplating workshop (the sampling point B) were selected as heavily polluted areas, while other areas in this site (the sampling point S) were considered as low-pollution areas. A total of 29 soil column samples were collected using a geoprobe drill rig; their locations are shown in Figure 1. Stones were removed from the samples and the samples were then air-dried under natural conditions. The samples were then ground and sieved into two parts. The samples were stored in polyethylene bags. One part was passed through a 0.15 mm sieve for elemental analysis. The other part was passed through a 2 mm sieve for general soil property analysis.

2.2. Chemical Analysis

The classic soil parameters, including soil moisture, pH, TOC, CEC, and soil texture, were analyzed according to the national standard methods, as shown in the Supplementary Materials. Heavy metals were digested according to the U.S. EPA Method 3050. Approximately 0.500 g of sample powder was weighed and placed into a microwave digestion tank with 6 mL of nitric acid, 3 mL of hydrochloric acid, and 2 mL of hydrofluoric acid. The sample was then heated in a microwave digestion device for 7 min to 120 °C, followed by holding for 3 min, heating for 5 min to 160 °C, holding for 3 min, heating for 5 min to 190 °C, and holding for 25 min. After passing through a 0.45 μm filter membrane, the volume was fixed to 50 mL, and an inductively coupled plasma optical emission spectrophotometer (ICP-OES, Agilent, Santa Clara, CA, USA) was used for measurement. The speciation of the heavy metals was determined using Tessier’s sequential extraction procedure [22], which included five fractions: exchangeable (F1), bound to carbonates (F2), bound to iron and manganese oxides (F3), bound to organic matter (F4), and residual (F5), with the details summarized in Table S1. All the analyses of the soil samples were performed in triplicates.

2.3. Source Analysis

PMF, recommended by the US EPA, is a well-established and useful factor analysis tool that can be employed to quantify contamination pollution sources using receptor information. According to the user guide [23], the calculation formula is as follows:
X i j = k = 1 p g i k f k j + e i j
where f is the species distribution of each source, g is the number of masses contributed by each element to each sample, p is the number of factors, and eij is the residual for each sample. Xij represents the measured concentration of the j substance in the i sample, gik represents the contribution of the k source to the i sample, eij represents the residuals corresponding to the samples or species, and fkj represents the contribution of the j substance from the k sample to the model. In PMF 5.0, the factor distributions and contributions are obtained by optimizing the weighted objective function Q under non-negative constraints. The calculation formula is as follows:
Q = i = 1 n j = 1 m x i j k = 1 p g i k f i k u i j 2
where, uij represents the estimated uncertainty associated with the j species in the i sample. The calculation formula of uij is as follows:
u i j = 5 6 M D L c M D L
u i j = E r r o r   f r a c t i o n × c 2 + 0.5 × M D L 2             c > M D L
where c is the sample concentration, MDL is the method detection limit, and the Error fraction is the relative standard deviation.

2.4. Evaluation of Heavy Metal Pollution

The single risk index (Pi) and the Nemerow index (PN) are used as the basic means to evaluate heavy metal pollution in soil profiles [24].
The Pi and PN calculation formula is as follows:
P i = C i / S i
P N = C i S i m a x 2 + C i S i a v e r a g e 2 2
where Pi is the single risk index, PN is the Nemerow pollution index, Ci is the average value of the i-th heavy metal concentration measured in the site, and Si is the minimum pollution limit. The calculation is based on the soil environmental quality risk control standard for soil contamination of development land [25]. The classification of PN [26] is listed in Table S2.

2.5. Health Risk Assessment

The health risk assessment model is widely used in the assessment of human health risk [27]. This model categorizes the population into two groups—adults and children—and assesses the carcinogenic and non-carcinogenic effects of heavy metals and organic compounds through three routes of exposure: oral ingestion, skin contact, and respiratory ingestion.
The exposure calculation formulae are as follows:
Oral intake:
C R i = C i I R C F F I E F E D B W A T
Skin contact:
C R i = C i A F C F S A A B S E F E D B W A T
Respiratory intake:
C R i = C i · P M 10 D A I R P I A F F S P O C F E F E D B W A T
where CRi is the long-term intake dose, and Ci is the mean value of the i heavy metal concentration measured in the field (mg/kg·d) [28,29]. Details of the other parameters in the model are shown in Table S3.
The risk assessment models are calculated as follows:
H Q i = C R i / R f D
C R i = j = 1 3 C R I i j S F i j
where SF is the carcinogenic slope factor of the contaminant and RfD is the non-carcinogenic reference dose of the pollutant. The specific values are shown in Table S4. 𝑆𝐹𝑖𝑗 is the slope coefficient of the j exposure route of carcinogenic heavy metal i, and CRi is the single health risk index of carcinogenic heavy metal i. When the value is more than 1, it means that there is a non-carcinogenic health risk; when 𝐻𝑄𝑖 < 1, it means that the non-carcinogenic health risk can be ignored. The EPA recommended carcinogenic risk index (CR) soil treatment standard is 1 × 10⁻⁶ [30].

3. Results and Discussion

3.1. Distribution of Heavy Metals in the Site

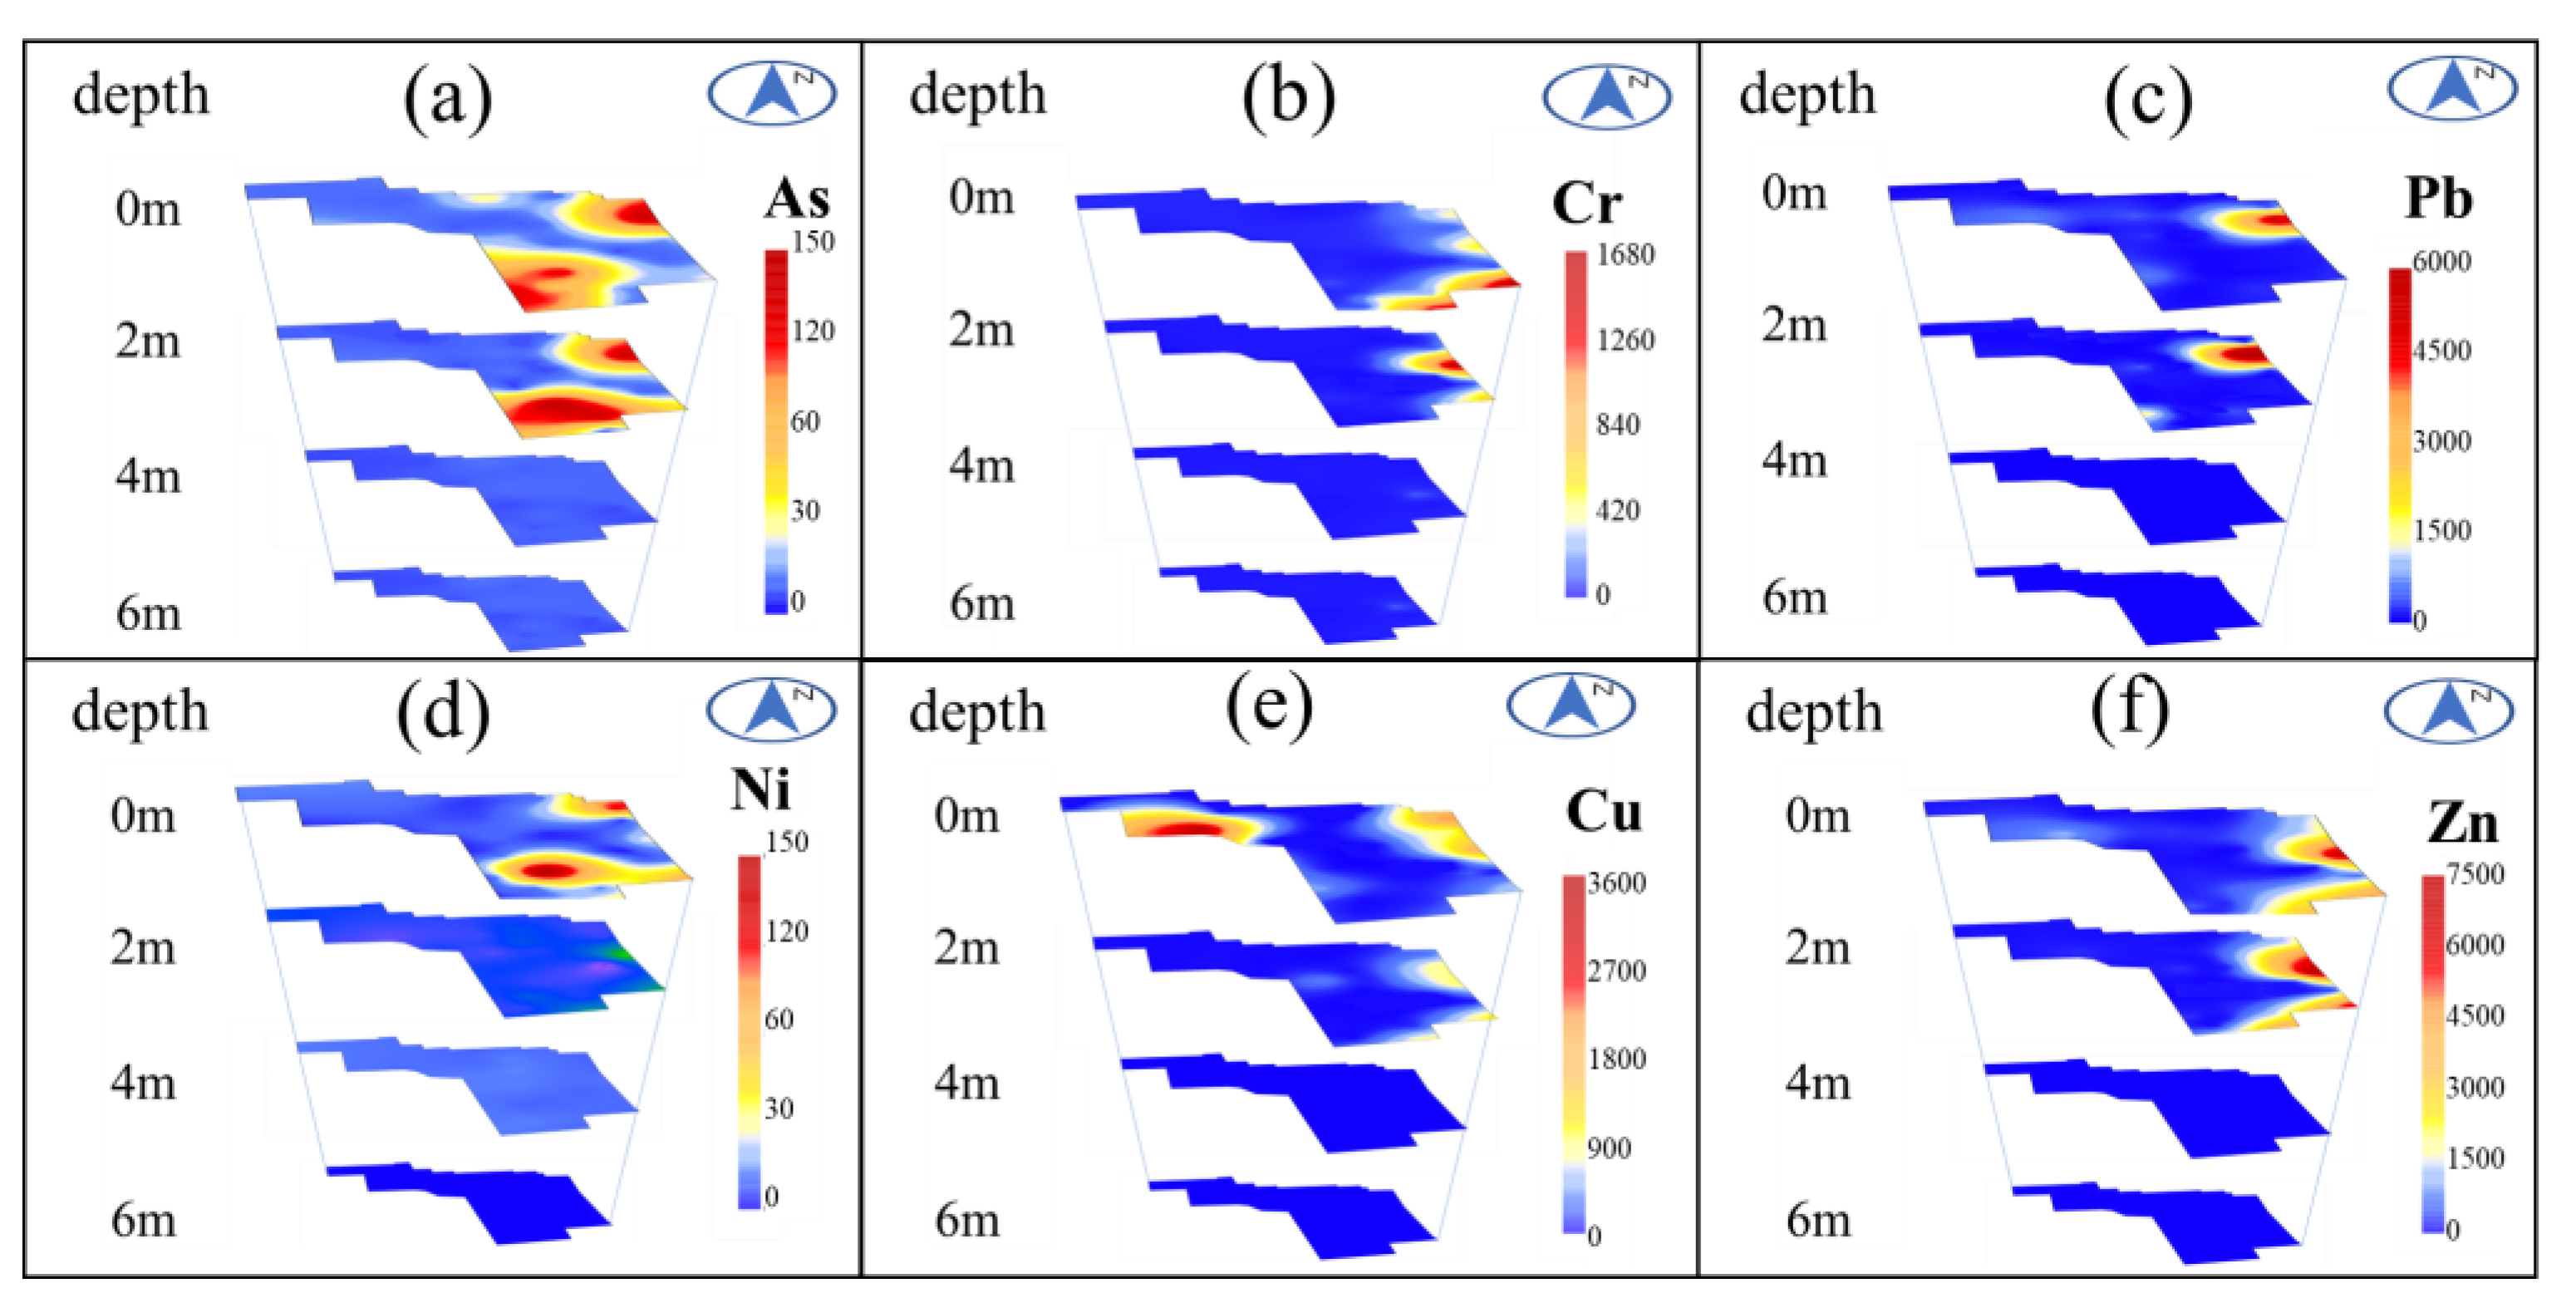
3.1.1. Spatial Distribution of Heavy Metals

The heavy metal horizontal and vertical distribution patterns are shown in Figure 2. The concentrations of Zn, Pb, Cu, Cr, Ni, and As were in the range of 53.8–8010, 13.9–9271, 13.4–3750, 27.2–2970, 12.6–721, and 3.20–154 mg/kg, respectively, with Zn having the highest average concentration (521 mg/kg), followed by Pb (204 mg/kg), Cu (156 mg/kg), Cr (131 mg/kg), Ni (62.1 mg/kg), and As (26.6 mg/kg). The concentrations of all the heavy metals were found to be lower than the soil environmental quality risk control standard for soil contamination of development land [25], The detailed standard values are summarized in Table S5, indicating that the degree of heavy metal pollution in most areas was not serious. However, the heavy metal concentrations were still higher than the average background value for soil in Shanghai, where the pollution site is located, suggesting that these pollutants had accumulated in significant quantities and may pose potential risks to ecological security.
The heavy metal Pb was exclusively detected in area A. The maximum concentration of Pb, which was 9271 mg/kg (11.6 times than national standard), was observed at a depth of 2 m, after which the concentration declined rapidly with increased depth. Cr pollution was observed in area A and the southeast corner of the site. Unlike Pb, which migrated almost vertically downward, Cr tended to migrate horizontally towards the southeast with the site’s runoff due to its stronger lateral migration ability. This is because the acidity and organic matter could promote the leaching of Cr [6]. In addition, Pb is the element that is hardest to mobilize in the environment [31]. The highest concentration of Cr, which was 2970 mg/kg (3.71 times than national standard) was observed at a depth of 2 m in the southeast corner of the site. It was widely detected in the studied area, mainly due to the use of arsenic oxide as a clarifying agent during glass processing. During the glass melting process, arsenic oxide is easily volatilized and polluted the entire site. Its pollution in area A was more serious than in area B. The maximum concentration of As was 154 mg/kg (1.28 times the national standard). Soil pH levels can affect the binding form and solubility of As [32]. Various types of metallic elements and organic matter also have strong As ad-sorption ability, which determines the migration ability of As [33]. The precipitation–dissolution and/or adsorption–desorption processes on the soil surface are the main mechanisms controlling the migration of As in the soil [34]. At a depth of 2 m, the range and intensity of As pollution were greater than those in the surface soil, which was possibly due to the weak adsorption capacity of the surface soil for As, which can diffuse downwards during rainfall and groundwater fluctuations.

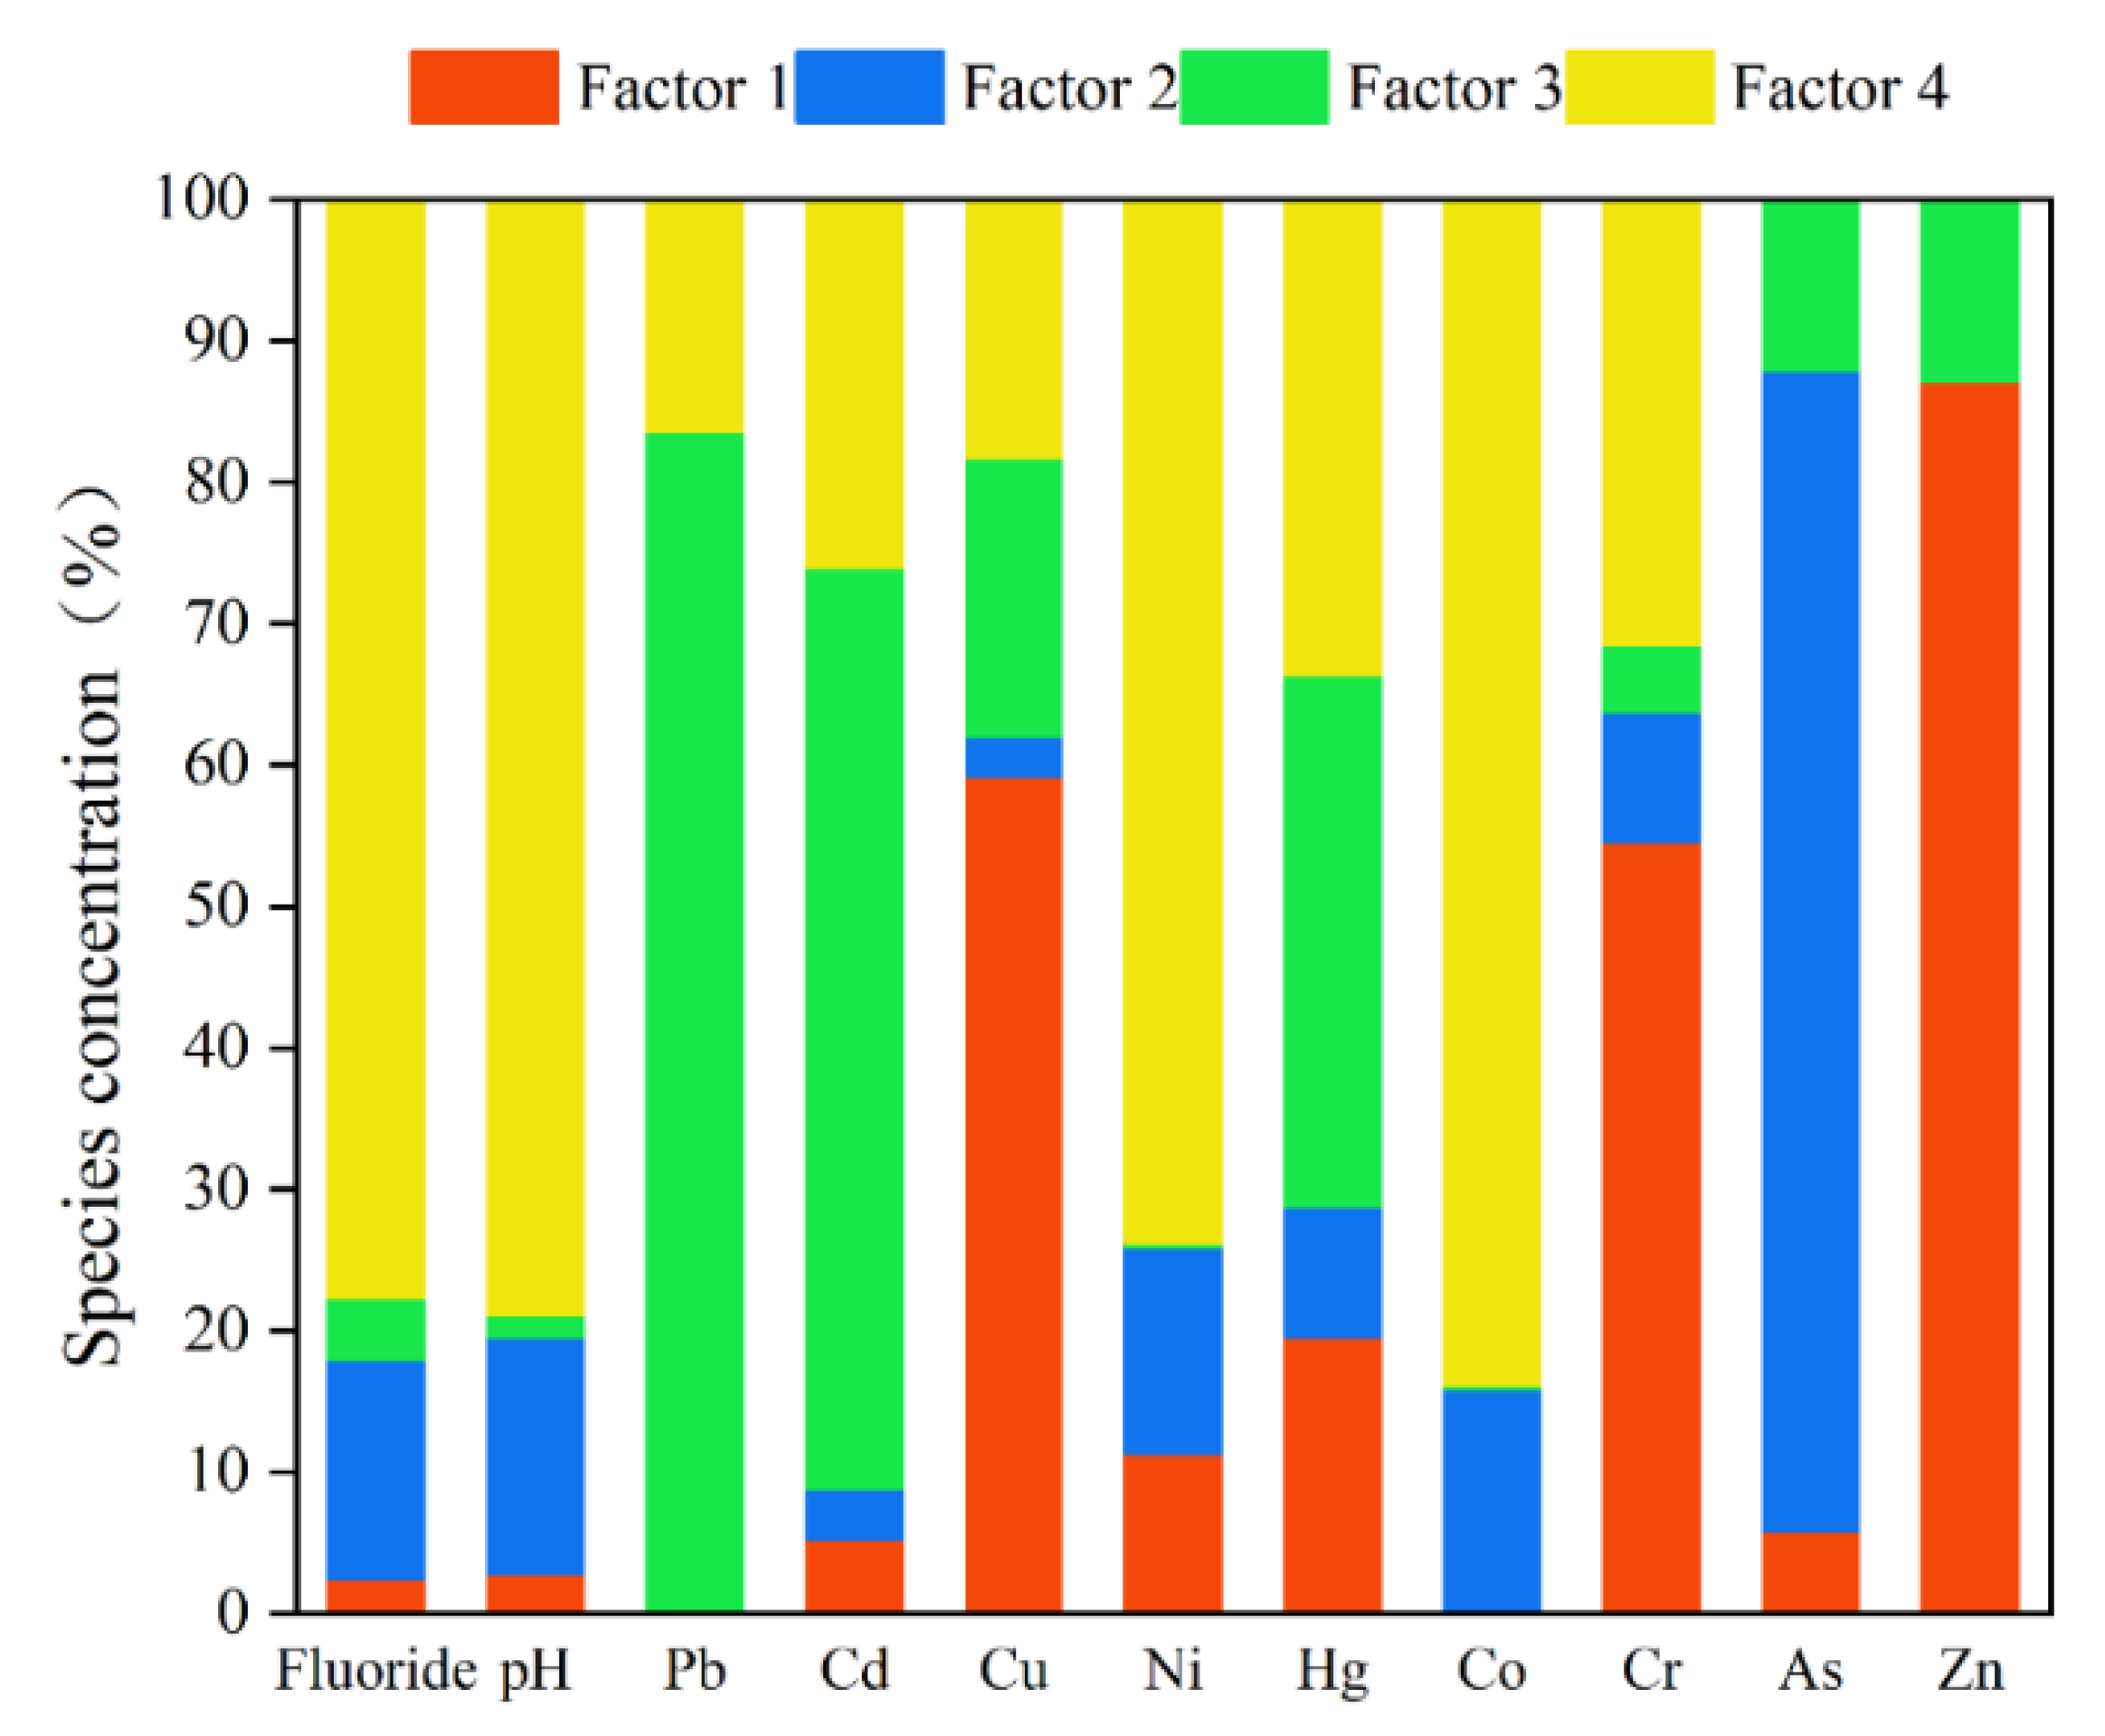
3.1.2. Source Analysis of Heavy Metals

The heavy metal source analysis results using the PMF model are shown in Figure 3. The dominant sources of pollution were identified as the electroplating process section, the glass melting process section, the production process section, and the electroplating wastewater. Specifically, the electroplating process section was responsible for 59.3% of Cu, 87.1% of Zn, and 54.5% of Cr pollution. This section plated Zn on Cu to enhance conductivity, resulting in Cu- and Zn-associated pollution, and caused Cr pollution through subsequent passivation processes. The glass melting process section contributed to 82.0% As pollution mainly due to the utilization of arsenic oxide as a clarifier during glass processing, which was easily volatilized during the glass melting process. The production process section contributed to 83.3% of Pb, 65.1% of Cd, and 37.7% of Hg pollution. Pb and Hg were added to improve the clarity of glass, while CdS was used as a melting aid and catalyst for organic reactions in the glass production process. Electroplating wastewater contributed to 77.7% of F-, 73.8% of Ni, and 83.9% of Co pollution. Co was added during the functional Ni plating process to enhance coating hardness and wear resistance, while F- was used to protect metal component stability and durability during electroplating. The pH value of the acidic electroplating wastewater was also affected.

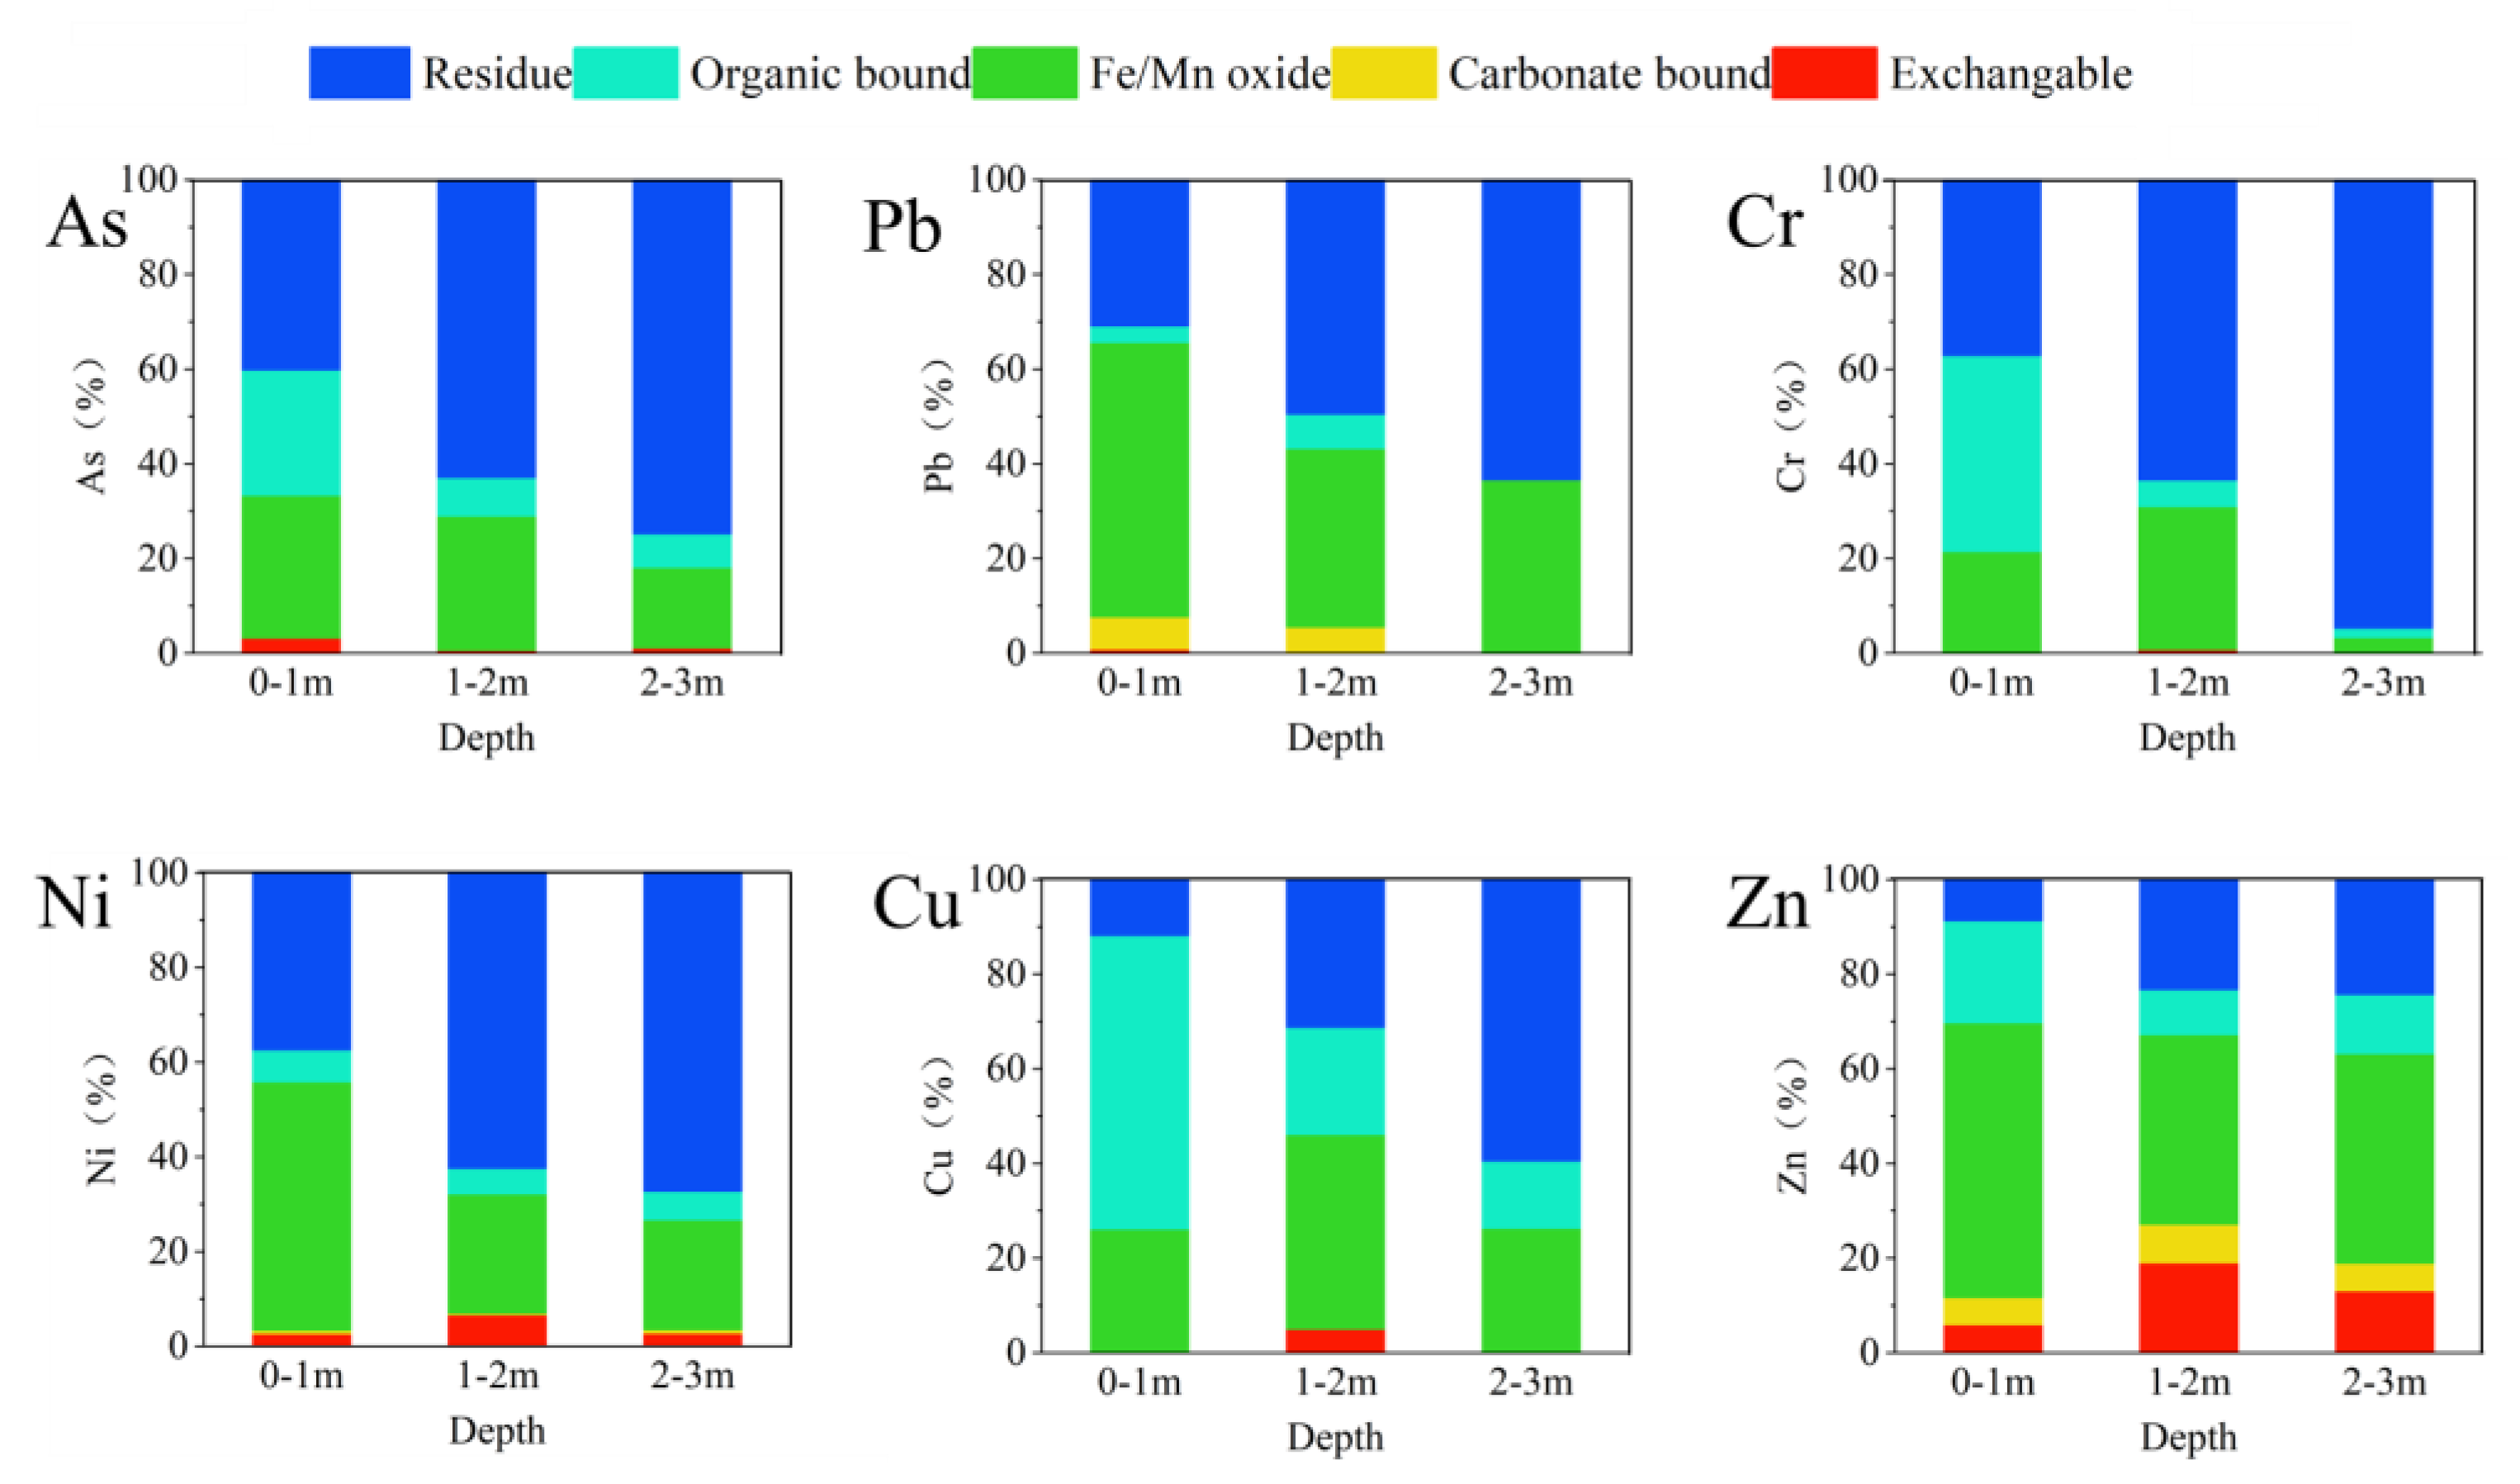
3.2. Correlation between Heavy Metal Forms and Soil Properties

The chemical properties and basic physical properties of the soil samples are shown in Table S6. The pH values ranged from 2.5 to 10.1, with most of the soil samples in the study area being weakly alkaline, and only a few samples being acidic. The soil moisture content ranged from 9.03% to 67.6%, while the cation exchange capacity (CEC) ranged from 1.42 to 202 cmol/L. The TOC content ranged from 7.78 to 18.6 g/kg. The site was mainly composed of clay and loamy soil, with clay, loam, and sand particles making up an average of 39.1%, 29.8%, and 31.1%, respectively.
The correlation between the heavy metal speciation and the soil physicochemical properties is shown in Figure S1. The correlation analysis revealed that pH and CEC were the main controlling factors for heavy metal speciation, which is consistent with previous studies [35,36]. High CEC values indicated that the soil particles had a strong affinity for adsorbing or complexing heavy metals, thereby affecting their speciation in the soil. For instance, an increase in the CEC content of soil can significantly decrease the proportion of exchangeable and carbonate-bound forms of Cd [37]. The vertical distributions of the chemical speciation of Pb, Zn, Cu, Ni, Cr, and As in the soil are shown in Figure 4. The surface soil contained 59.8% of the first four forms of As, which decreased to 25.1% at a depth of 3 m. This reduction in exchangeable As can likely be attributed to a decrease in CEC [38]. The binding ratios of Pb to Fe/Mn oxides at 0, 2, and 3 m were 58.4%, 37.7%, and 36.5%, respectively. In contrast, the residues ratios increased to 31.1%, 49.6%, and 63.4%, respectively. In slightly alkaline soil environments, Pb combines with alkaline ions (such as OH) in the soil to form fixed states such as Pb(OH)2 or Pb(OH)3, which means it is more prone to exist in organic-bound, iron-manganese oxide-bound, and residual states [39]. The Pb levels were relatively safe because of low mobility under the conditions of neutral or weak alkalinity [31]. Under slightly acidic soil environments, Pb mainly exists in exchangeable and carbonate-bound states because the increased H+ ions in the soil easily adsorb exchangeable Pb ions on soil particles [40,41]. In slightly acidic soil environments, Pb in the water, exchangeable, and carbonate fractions can easily dissolve from the soil and pollute the environment. The high amounts of Pb associated with carbonates and exchangeable fractions in the soil are possibly attributable to anglesite (PbSO4) and cerussite (PbCO3) [42], which are slightly soluble in water and more soluble in acetate solution as a result of the formation of Pb-acetate complexes [43]. The residues accounted for 37.1%, 63.4%, and 94.7% of Cr, at depths of 0, 2, and 3 m, respectively. Cr (VI) in the soil mainly exists in an exchangeable form and binds to carbonates [44]. However, this part only accounted for 0.5% of the total Cr, indicating that the majority of Cr in the soil occurred in the form of Cr (III).

3.3. Risk Assessment of the Site

3.3.1. Nemerow Index and Health Risk Assessment

The Nemerow index values are shown in Table S7. There were a total of five that exceeded standard points within the site, with an exceeding rate of 17.24%. There were three points that reached the pollution limit, and the remaining 21 points were all below the safety limit of 0.7. According to the results of the Nemerow index, the topsoil in Area A was selected for health risk assessment; the results are shown in Table S8. The health risk of skin contact for adults was higher than that for children due to the larger skin absorption area of adults. The health risks of respiratory pathway and oral intake for children were greater than those for adults due to their different behavior patterns and physiological characteristics [45,46]. For example, children often suck their fingers, which is the main pathway for toxic substances to be ingested through the mouth [47,48].
Regarding non-carcinogenic risk, Pb was found to pose the highest risk for both children and adults, followed by As, Cr, Cu, Ni, and Zn in descending order. Only Pb exceeded the non-carcinogenic health risk limit of 1, while the other heavy metals did not pose non-carcinogenic health risks. This result indicated Pb pollution should be paid more attention, especially for children. The results are consistent with the research results of Zhang et al. [49]. and Yu et al. [50]. Exposure can lead to an increased risk of cancer in humans over the long term [51,52]; the results showed that, for adults, the risk of carcinogenesis due to oral intake was relatively high, while the risk of carcinogenesis due to skin exposure and inhalation was negligible. For children, the carcinogenic risk of As through oral intake was 3.28 × 10⁻⁴, which translated to 3.28 out of 10,000 people suffering from cancer, and was considered unacceptable for the public. The carcinogenic risk of respiratory inhalation was also relatively high for children, while the carcinogenic risk of skin exposure was negligible. As may represent the main factor for carcinogenic risk. Therefore, remediation methods, such as leaching, should be carried out on Pb- and As-contaminated soil to eliminate the pollution source as soon as possible.

3.3.2. Source-Oriented Health Risk Assessment

The source-oriented health risk assessment (PMF-HRA) approach was employed to assess the health risks of different pollution sources on this site. The contribution rates of various pollution sources to human health risk are shown in Figure 5. The contribution rates of various pollution sources to non-carcinogenic risks (HQi) were similar for adults and children, which is consistent with the findings of Ma et al. [53]. The identical carcinogenic risk of various pollution sources for children and adults was due to the presence of only one carcinogenic element, As, on the site. The production process section was the largest non-carcinogenic health risk contributor for both adults and children, accounting for 63.1% and 65.4%, respectively. This was mainly because the production process section contributed 83.3% of Pb pollution on the site, which was a significant source of non-carcinogenic health risk. The glass melting process section was a significant contributor to carcinogenic risk, accounting for 81.9%, because it was the primary source of the heavy metal As.

4. Conclusions

Around 29 soil columns were collected from the legacy electroplating site located in the YRD, and the sources and chemical speciation were investigated in terms of the horizontal and vertical distributions. The concentrations of Zn, Pb, Cu, Cr, Ni, and As were in the range of 53.8–8010, 13.9–9271, 13.4–3750, 27.2–2970, 12.6–721, and 3.20–154 mg/kg, respectively, with Zn having the highest average concentration (521 mg/kg), followed by Pb (204 mg/kg), Cu (156 mg/kg), Cr (131 mg/kg), Ni (62.1 mg/kg), and As (26.6 mg/kg). The main pollutants found were As, Pb, and Cr, which exceeded the national standards by 11.6 times, 1.28 times, and 3.71 times, respectively. In the horizontal direction, these heavy metals mainly accumulated in the glass workshop area, and the electroplating workshop area. In the vertical direction, As and Cr migrated faster, while Pb migrated more slowly. The pH and CEC of the soil were identified as the key factors controlling heavy metal chemical speciation, with exchangeable and carbonate-bound forms being more prevalent under high CEC and low pH conditions. Pb existed in the form of Pb(OH)2 or Pb(OH)3 under alkaline conditions, and in the form of anglesite (PbSO4) and cerite (PbCO3) under acidic conditions. The PMF model identified the electroplating process, the glass melting process, the production process, and the electroplating wastewater as the major sources of heavy metal pollution. The 𝐻𝑄𝑖 of Pb for oral intake in adults and children was 1.12 and 3.99. The CR for oral intake in adults and children was 9.18 × 10⁻⁵ and 3.28 × 10⁻⁴. Pb and As were the main heavy metals for non-carcinogenic and carcinogenic health risks, respectively, and oral intake was the most important exposure pathway. The production process was the largest non-carcinogenic health risk source for both adults and children, and the glass melting process was an important source of carcinogenic risk. Pb and As also cause severe health risks, which should be paid more attention in the risk management of polluted sites. The investigation of heavy metal pollution in contaminated sites is an essential process for controlling residual site pollution and potentially enabling site reuse and is of great significance for the sustainable development of land.

Supplementary Materials

The following supporting information can be downloaded at: https://www.mdpi.com/article/10.3390/su151612166/s1, Text S1: Soil characterization; Figure S1: Correlation between soil physicochemical properties and heavy metal; Table S1. The extraction media used in the sequential extraction; Table S2: The classification standards of Nemerow composite index; Table S3: The typical parameters and values in the health risk assessment model; Table S4: RfD and SF value of health risk assessment model; Table S5. Soil environmental quality risk control standard for soil contamination of development land; Table S6: Physical and chemical properties of the site soil; Table S7: Nemerow index of the site soil; Table S8: Carcinogenic and non-carcinogenic risks of heavy metals in adults and children.

Author Contributions

Z.F.: conceptualization, methodology, validation, writing—original draft, formal analysis; X.X.: writing—review and editing; R.W.: investigation; Z.M.: investigation; L.W.: supervision; X.C.: resources, supervision; Z.L.: writing—review and editing, resources. All authors have read and agreed to the published version of the manuscript.

Funding

This work was supported by the project of the National Key Research and Development Program of China (No. 2018YFC1800600), Research on Pollution Reduction and Carbon Reduction Methods for Low Carbon Environmental Protection Industrial Parks (2022 National Foreign Expert Project, No. zk2022061) and Tianfu Scholar (Ziyang Lou, No. zk2023072).

Institutional Review Board Statement

Not applicable.

Informed Consent Statement

Not applicable.

Data Availability Statement

The data presented in this study are available on request from the corresponding author.

Conflicts of Interest

The authors declare no conflict of interest.

References

  1. Yan, K.; Wang, H.; Lan, Z.; Zhou, J.; Fu, H.; Wu, L.; Xu, J. Heavy metal pollution in the soil of contaminated sites in China: Research status and pollution assessment over the past two decades. J. Clean. Prod. 2022, 373, 133780. [Google Scholar] [CrossRef]
  2. Peng, J.-Y.; Zhang, S.; Han, Y.; Bate, B.; Ke, H.; Chen, Y. Soil heavy metal pollution of industrial legacies in China and health risk assessment. Sci. Total Environ. 2022, 816, 151632. [Google Scholar] [CrossRef] [PubMed]
  3. Shi, L.-D.; Guo, T.; Lv, P.-L.; Niu, Z.-F.; Zhou, Y.-J.; Tang, X.-J.; Zheng, P.; Zhu, L.-Z.; Zhu, Y.-G.; Kappler, A.; et al. Coupled anaerobic methane oxidation and reductive arsenic mobilization in wetland soils. Nat. Geosci. 2020, 13, 799–805. [Google Scholar] [CrossRef]
  4. Shentu, J.; Fang, Y.; Wang, Y.; Cui, Y.; Zhu, M. Bioaccessibility and reliable human health risk assessment of heavy metals in typical abandoned industrial sites of southeastern China. Ecotoxicol. Environ. Saf. 2023, 256, 114870. [Google Scholar] [CrossRef]
  5. Cui, X.; Geng, Y.; Sun, R.; Xie, M.; Feng, X.; Li, X.; Cui, Z. Distribution, speciation and ecological risk assessment of heavy metals in Jinan Iron & Steel Group soils from China. J. Clean. Prod. 2021, 295, 126504. [Google Scholar] [CrossRef]
  6. Sun, S.-S.; Ao, M.; Geng, K.-R.; Chen, J.-Q.; Deng, T.-H.-B.; Li, J.-J.; Guan, Z.-T.; Mo, B.-L.; Liu, T.; Yang, W.-J.; et al. Enrichment and speciation of chromium during basalt weathering: Insights from variably weathered profiles in the Leizhou Peninsula, South China. Sci. Total Environ. 2022, 822, 153304. [Google Scholar] [CrossRef] [PubMed]
  7. She, S.; Hu, B.; Zhang, X.; Shao, S.; Jiang, Y.; Zhou, L.; Shi, Z. Current Status and Temporal Trend of Potentially Toxic Elements Pollution in Agricultural Soil in the Yangtze River Delta Region: A Meta-Analysis. Int. J. Environ. Res. Public Health 2021, 18, 1033. [Google Scholar]
  8. Jiang, Y.; Huang, M.; Chen, X.; Wang, Z.; Xiao, L.; Xu, K.; Zhang, S.; Wang, M.; Xu, Z.; Shi, Z. Identification and risk prediction of potentially contaminated sites in the Yangtze River Delta. Sci. Total Environ. 2022, 815, 151982. [Google Scholar] [CrossRef]
  9. Jia, J.; Bai, J.; Xiao, R.; Tian, S.; Wang, D.; Wang, W.; Zhang, G.; Cui, H.; Zhao, Q. Fractionation, source, and ecological risk assessment of heavy metals in cropland soils across a 100-year reclamation chronosequence in an estuary, South China. Sci. Total Environ. 2022, 807, 151725. [Google Scholar] [CrossRef]
  10. Xu, Z.-J.; Zhu, H.-B.; Shu, L.-Y.; Lai, X.-X.; Lu, W.; Fu, L.; Jiang, B.; He, T.; Wang, F.-P.; Li, Q.-S. Estimation of the fraction of soil-borne particulates in indoor air by PMF and its impact on health risk assessment of soil contamination in Guangzhou, China. Environ. Pollut. 2022, 308, 119623. [Google Scholar] [CrossRef]
  11. Zhang, Q.; Ye, J.; Chen, J.; Xu, H.; Wang, C.; Zhao, M. Risk assessment of polychlorinated biphenyls and heavy metals in soils of an abandoned e-waste site in China. Environ. Pollut. 2014, 185, 258–265. [Google Scholar] [CrossRef] [PubMed]
  12. Wang, Z.; Luo, P.; Zha, X.; Xu, C.; Kang, S.; Zhou, M.; Nover, D.; Wang, Y. Overview assessment of risk evaluation and treatment technologies for heavy metal pollution of water and soil. J. Clean. Prod. 2022, 379, 134043. [Google Scholar] [CrossRef]
  13. Wei, B.; Yang, L. A review of heavy metal contaminations in urban soils, urban road dusts and agricultural soils from China. Microchem. J. 2010, 94, 99–107. [Google Scholar] [CrossRef]
  14. Yang, S.; Sun, L.; Sun, Y.; Song, K.; Qin, Q.; Zhu, Z.; Xue, Y. Towards an integrated health risk assessment framework of soil heavy metals pollution: Theoretical basis, conceptual model, and perspectives. Environ. Pollut. 2023, 316, 120596. [Google Scholar] [CrossRef]
  15. Jiang, Z.; Yang, S.; Luo, S. Source analysis and health risk assessment of heavy metals in agricultural land of multi-mineral mining and smelting area in the Karst region—A case study of Jichangpo Town, Southwest China. Heliyon 2023, 9, e17246. [Google Scholar] [CrossRef]
  16. Tian, Y.; Liu, J.; Han, S.; Shi, X.; Shi, G.; Xu, H.; Yu, H.; Zhang, Y.; Feng, Y.; Russell, A.G. Spatial, seasonal and diurnal patterns in physicochemical characteristics and sources of PM2.5 in both inland and coastal regions within a megacity in China. J. Hazard. Mater. 2018, 342, 139–149. [Google Scholar] [CrossRef]
  17. Huang, R.-J.; Cheng, R.; Jing, M.; Yang, L.; Li, Y.; Chen, Q.; Chen, Y.; Yan, J.; Lin, C.; Wu, Y.; et al. Source-Specific Health Risk Analysis on Particulate Trace Elements: Coal Combustion and Traffic Emission As Major Contributors in Wintertime Beijing. Environ. Sci. Technol. 2018, 52, 10967–10974. [Google Scholar] [CrossRef]
  18. Li, Y.; Ma, L.; Ge, Y.; Abuduwaili, J. Health risk of heavy metal exposure from dustfall and source apportionment with the PCA-MLR model: A case study in the Ebinur Lake Basin, China. Atmos. Environ. 2022, 272, 118950. [Google Scholar] [CrossRef]
  19. Liao, S.; Jin, G.; Khan, M.A.; Zhu, Y.; Duan, L.; Luo, W.; Jia, J.; Zhong, B.; Ma, J.; Ye, Z.; et al. The quantitative source apportionment of heavy metals in peri-urban agricultural soils with UNMIX and input fluxes analysis. Environ. Technol. Innov. 2021, 21, 101232. [Google Scholar] [CrossRef]
  20. Liang, J.; Liu, Z.; Tian, Y.; Shi, H.; Fei, Y.; Qi, J.; Mo, L. Research on health risk assessment of heavy metals in soil based on multi-factor source apportionment: A case study in Guangdong Province, China. Sci. Total Environ. 2023, 858, 159991. [Google Scholar] [CrossRef]
  21. Lei, M.; Zhou, J.; Zhou, Y.; Sun, Y.; Ji, Y.; Zeng, Y. Spatial distribution, source apportionment and health risk assessment of inorganic pollutants of surface water and groundwater in the southern margin of Junggar Basin, Xinjiang, China. J. Environ. Manag. 2022, 319, 115757. [Google Scholar] [CrossRef]
  22. Tessier, A.; Campbell, P.G.C.; Bisson, M. Sequential extraction procedure for the speciation of particulate trace metals. Anal. Chem. 1979, 51, 844–851. [Google Scholar] [CrossRef]
  23. U.S.E.P.A. EPA Positive Matrix Factorization (PMF) 5.0 Fundamentals and User Guide; U.S.E.P.A.: Washington, DC, USA, 2014; p. 20460. [Google Scholar]
  24. Liu, X.; Chen, S.; Yan, X.; Liang, T.; Yang, X.; El-Naggar, A.; Liu, J.; Chen, H. Evaluation of potential ecological risks in potential toxic elements contaminated agricultural soils: Correlations between soil contamination and polymetallic mining activity. J. Environ. Manag. 2021, 300, 113679. [Google Scholar] [CrossRef]
  25. China EPA. National Standards of the People’s Republic of China. Soil Environmental Quality Risk Control Standard for Soil Contamination of Development Land (GB36600—2018); Environmental Protection Agency Beijing: Beijing, China, 2018. [Google Scholar]
  26. Jiang, Y.; Wang, X.; Wu, M.; Sheng, G.; Fu, J. Contamination, source identification, and risk assessment of polycyclic aromatic hydrocarbons in agricultural soil of Shanghai, China. Environ. Monit. Assess. 2011, 183, 139–150. [Google Scholar] [CrossRef]
  27. Zhang, S.; Han, Y.; Peng, J.; Chen, Y.; Zhan, L.; Li, J. Human Health Risk Assessment for Contaminated Sites: A Retrospective Review. Environ. Int. 2022, 107700. [Google Scholar] [CrossRef]
  28. Yang, S.; Zhao, J.; Chang, S.X.; Collins, C.; Xu, J.; Liu, X. Status assessment and probabilistic health risk modeling of metals accumulation in agriculture soils across China: A synthesis. Environ. Int. 2019, 128, 165–174. [Google Scholar] [CrossRef] [PubMed]
  29. Su, C.; Wang, J.; Chen, Z.; Meng, J.; Yin, G.; Zhou, Y.; Wang, T. Sources and health risks of heavy metals in soils and vegetables from intensive human intervention areas in South China. Sci. Total Environ. 2023, 857, 159389. [Google Scholar] [CrossRef]
  30. Duan, Y.; Zhang, Y.; Li, S.; Fang, Q.; Miao, F.; Lin, Q. An integrated method of health risk assessment based on spatial interpolation and source apportionment. J. Clean. Prod. 2020, 276, 123218. [Google Scholar] [CrossRef]
  31. Alloway, B.J. Sources of Heavy Metals and Metalloids in Soils. In Heavy Metals in Soils: Trace Metals and Metalloids in Soils and Their Bioavailability; Alloway, B.J., Ed.; Springer: Dordrecht, The Netherlands, 2013; pp. 11–50. [Google Scholar] [CrossRef]
  32. Huang, J.H.; Hu, K.N.; Decker, B. Organic arsenic in the soil environment: Speciation, occurrence, transformation, and adsorption behavior. Water Air Soil Pollut. 2011, 219, 401–415. [Google Scholar] [CrossRef]
  33. Smedley, P.L.; Kinniburgh, D.G. A review of the source, behaviour and distribution of arsenic in natural waters. Appl. Geochem. 2002, 17, 517–568. [Google Scholar] [CrossRef] [Green Version]
  34. Wu, Y.; Zhou, X.-Y.; Lei, M.; Yang, J.; Ma, J.; Qiao, P.-W.; Chen, T.-B. Migration and transformation of arsenic: Contamination control and remediation in realgar mining areas. Appl. Geochem. 2017, 77, 44–51. [Google Scholar] [CrossRef]
  35. Zhang, Y.; Zhang, H.; Zhang, Z.; Liu, C.; Sun, C.; Zhang, W.; Marhaba, T. PH Effect on Heavy Metal Release from a Polluted Sediment. J. Chem. 2018, 2018, 1–7. [Google Scholar] [CrossRef]
  36. Acosta, J.A.; Jansen, B.; Kalbitz, K.; Faz, A.; Martínez-Martínez, S. Salinity increases mobility of heavy metals in soils. Chemosphere 2011, 85, 1318–1324. [Google Scholar] [CrossRef]
  37. Amirahmadi, E.; Hojjati, S.M.; Kammann, C.; Ghorbani, M.; Biparva, P. The potential effectiveness of biochar application to reduce soil Cd bioavailability and encourage oak seedling growth. Appl. Sci. 2020, 10, 3410. [Google Scholar] [CrossRef]
  38. Hartley, W.; Dickinson, N.M.; Riby, P.; Lepp, N.W. Arsenic mobility in brownfield soils amended with green waste compost or biochar and planted with Miscanthus. Environ. Pollut. 2009, 157, 2654–2662. [Google Scholar] [CrossRef]
  39. Maneechakr, P.; Mongkollertlop, S. Investigation on adsorption behaviors of heavy metal ions (Cd2+, Cr3+, Hg2+ and Pb2+) through low-cost/active manganese dioxide-modified magnetic biochar derived from palm kernel cake residue. J. Environ. Chem. Eng. 2020, 8, 104467. [Google Scholar] [CrossRef]
  40. Tabelin, C.B.; Igarashi, T.; Villacorte-Tabelin, M.; Park, I.; Opiso, E.M.; Ito, M.; Hiroyoshi, N. Arsenic, selenium, boron, lead, cadmium, copper, and zinc in naturally contaminated rocks: A review of their sources, modes of enrichment, mechanisms of release, and mitigation strategies. Sci. Total Environ. 2018, 645, 1522–1553. [Google Scholar] [CrossRef] [PubMed]
  41. Du, H.; Huang, Q.; Lei, M.; Tie, B. Sorption of Pb(II) by Nanosized Ferrihydrite Organo-Mineral Composites Formed by Adsorption versus Coprecipitation. ACS Earth Space Chem. 2018, 2, 556–564. [Google Scholar] [CrossRef]
  42. Silwamba, M.; Ito, M.; Hiroyoshi, N.; Tabelin, C.B.; Hashizume, R.; Fukushima, T.; Park, I.; Jeon, S.; Igarashi, T.; Sato, T.; et al. Recovery of lead and zinc from zinc plant leach residues by concurrent dissolution-cementation using zero-valent aluminum in chloride medium. Metals 2020, 10, 531. [Google Scholar] [CrossRef] [Green Version]
  43. Giordano, T.H. Anglesite (PbSO4) solubility in acetate solutions: The determination of stability constants for lead acetate complexes to 85 °C. Geochim. Cosmochim. Acta 1989, 53, 359–366. [Google Scholar] [CrossRef]
  44. Xu, Y.; Fan, Z.; Huang, Q.; Lou, Z.; Xu, X.; Xu, Y.; Shen, Y. Cr Migration Potential and Species Properties in the Soil Profile from a Chromate Production Site in the Groundwater Depression Cone Area. Bull. Environ. Contam. Toxicol. 2022, 109, 600–608. [Google Scholar] [CrossRef]
  45. Jiang, Y.; Chao, S.; Liu, J.; Yang, Y.; Chen, Y.; Zhang, A.; Cao, H. Source apportionment and health risk assessment of heavy metals in soil for a township in Jiangsu Province, China. Chemosphere 2017, 168, 1658–1668. [Google Scholar] [CrossRef]
  46. Li, Z.; Ma, Z.; van der Kuijp, T.J.; Yuan, Z.; Huang, L. A review of soil heavy metal pollution from mines in China: Pollution and health risk assessment. Sci. Total Environ. 2014, 468–469, 843–853. [Google Scholar] [CrossRef]
  47. Liu, H.; Zhang, Y.; Yang, J.; Wang, H.; Li, Y.; Shi, Y.; Li, D.; Holm, P.E.; Ou, Q.; Hu, W. Quantitative source apportionment, risk assessment and distribution of heavy metals in agricultural soils from southern Shandong Peninsula of China. Sci. Total Environ. 2021, 767, 144879. [Google Scholar] [CrossRef]
  48. Zhang, X.; Zhang, P.; Shao, M.; Zang, X.; Zhang, J.; Mao, F.; Qian, H.; Xu, W. SALL4 activates TGF-β/SMAD signaling pathway to induce EMT and promote gastric cancer metastasis. Cancer Manag. Res. 2018, 10, 4459–4470. [Google Scholar] [CrossRef] [PubMed] [Green Version]
  49. Zheng, N.; Liu, J.; Wang, Q.; Liang, Z. Health risk assessment of heavy metal exposure to street dust in the zinc smelting district, Northeast of China. Sci. Total Environ. 2010, 408, 726–733. [Google Scholar] [CrossRef]
  50. Yu, B.; Wang, Y.; Zhou, Q. Human health risk assessment based on toxicity characteristic leaching procedure and simple bioaccessibility extraction test of toxic metals in urban street dust of Tianjin, China. PLoS ONE 2014, 9, e92459. [Google Scholar] [CrossRef]
  51. Cao, S.; Duan, X.; Zhao, X.; Ma, J.; Dong, T.; Huang, N.; Sun, C.; He, B.; Wei, F. Health risks from the exposure of children to As, Se, Pb and other heavy metals near the largest coking plant in China. Sci. Total Environ. 2014, 472, 1001–1009. [Google Scholar] [CrossRef] [PubMed]
  52. Saleh, H.N.; Panahande, M.; Yousefi, M.; Asghari, F.B.; Oliveri Conti, G.; Talaee, E.; Mohammadi, A.A. Carcinogenic and Non-carcinogenic Risk Assessment of Heavy Metals in Groundwater Wells in Neyshabur Plain, Iran. Biol. Trace Elem. Res. 2019, 190, 251–261. [Google Scholar] [CrossRef] [PubMed]
  53. Ma, W.; Tai, L.; Qiao, Z.; Zhong, L.; Wang, Z.; Fu, K.; Chen, G. Contamination source apportionment and health risk assessment of heavy metals in soil around municipal solid waste incinerator: A case study in North China. Sci. Total Environ. 2018, 631–632, 348–357. [Google Scholar] [CrossRef]
Figure 1. Distribution of functional areas and sampling points in the plant.
Sustainability 15 12166 g001
Figure 2. Spatial distribution of heavy metals in the soil profile, (a), (b), (c), (d), (e), and (f) represent As, Cr, Pb, Ni, Cu, and Zn, respectively.
Sustainability 15 12166 g002
Figure 3. Source analysis of heavy metals by the PMF model (Factor 1: electroplating process section; Factor 2: glass melting process section; Factor 3: production process section; Factor 4: electroplating wastewater).
Sustainability 15 12166 g003
Figure 4. Heavy metal speciation in the site at different depths.
Sustainability 15 12166 g004
Figure 5. Contribution rate of various pollution sources within the site to human health risks: (a) Non-carcinogenic health risks in adults; (b) Non-carcinogenic health risks in children; (c) Carcinogenic health risks in adults; (d) Carcinogenic health risks in children (HQi: health quotient index CR: carcinogenic risk).
Sustainability 15 12166 g005
Disclaimer/Publisher’s Note: The statements, opinions and data contained in all publications are solely those of the individual author(s) and contributor(s) and not of MDPI and/or the editor(s). MDPI and/or the editor(s) disclaim responsibility for any injury to people or property resulting from any ideas, methods, instructions or products referred to in the content.

