Article

An Iterative Method for the Simulation of Rice Straw-Based Polyol Hydroxyl Moieties

by
Roger G. Dingcong, Jr.
1,
Daryl B. Radjac
2,
Fortia Louise Adeliene M. Alfeche
3,
Arniel Ching O. Dizon
2,
Kassandra Jayza Gift D. Tejas
1,
Roberto M. Malaluan
1,2,
Harith H. Al-Moameri
4,
Gerard G. Dumancas
5,
Arnold C. Alguno
1,6 and
Arnold A. Lubguban
1,2,*
1
Center for Sustainable Polymers, Mindanao State University—Iligan Institute of Technology, Iligan City 9200, Philippines
2
Department of Chemical Engineering and Technology, Mindanao State University—Iligan Institute of Technology, Iligan City 9200, Philippines
3
Materials Science and Engineering Program, Graduate School of Engineering, Mindanao State University—Iligan Institute of Technology, Iligan City 9200, Philippines
4
Department of Materials Engineering, Mustansiriyah University, Baghdad 10052, Iraq
5
Department of Chemistry, The University of Scranton, Scranton, PA 18510, USA
6
Department of Physics, Mindanao State University—Iligan Institute of Technology, Iligan City 9200, Philippines
*
Author to whom correspondence should be addressed.
Sustainability 2023, 15(15), 12082; https://doi.org/10.3390/su151512082
Submission received: 8 June 2023 / Revised: 28 July 2023 / Accepted: 31 July 2023 / Published: 7 August 2023
(This article belongs to the Section Sustainable Chemical Engineering and Technology)

Abstract

:
Bio-derived polyol products have gained global interest as a green and sustainable substitute for fossil-based polyols in a diverse range of polyurethane (PU) applications. According to previous studies, PU properties are highly influenced by the reaction kinetics during their formation. One major factor affecting this is the reactivity of their polyol’s functional hydroxyl moieties that are classified as primary, secondary, and hindered-secondary. However, experimental quantitative characterization of these polyol hydroxyl moieties remains a challenge in the field due to various factors affecting them, including extensive time requirements, the need for substantial and expensive resources, large potential errors, and the generation of wastes, as well as health and safety considerations. In this study, the molar fraction of primary, secondary, and hindered-secondary hydroxyl moieties of a petroleum-based polyol (V490) and a rice straw-based polyol were determined via an iterative computational method. The method employed a MATLAB script that can simultaneously solve multiple differential equations involving PU gelling reaction kinetics and thermodynamics. In this manner, numerical combinations of the fraction of each type of hydroxyl moiety are generated by looping together the respective numerical fractions for each moiety. The best-fit combinations of the fractions of the mixed polyol’s hydroxyl moieties were successfully found via curve fitting of the simulated and experimental gelling temperature profile with an average numerical deviation of less than 1%. Thus, the method presented in this study offers a faster and more reliable characterization of the polymeric reaction kinetics than the experimental and conventional computational methods for product property enhancement and development in the field.

1. Introduction

In the pursuit of sustainable and greener development in the polyurethane (PU) manufacturing industries, there have been various attempts to replace fossil-based polyols with bio-derived feedstock such as biomasses and vegetable oils [1,2,3,4]. One of the most abundant bio-resources that attracts global interest as a sustainable alternative are lignocellulosic biomasses [3,5]. These can be obtained from various sources, including forest residues, agricultural wastes, and bagasse [6]. The main structure of lignocellulosic biomass mainly consists of cellulose, hemicelluloses, and lignin, all of which contain functional hydroxyl groups [
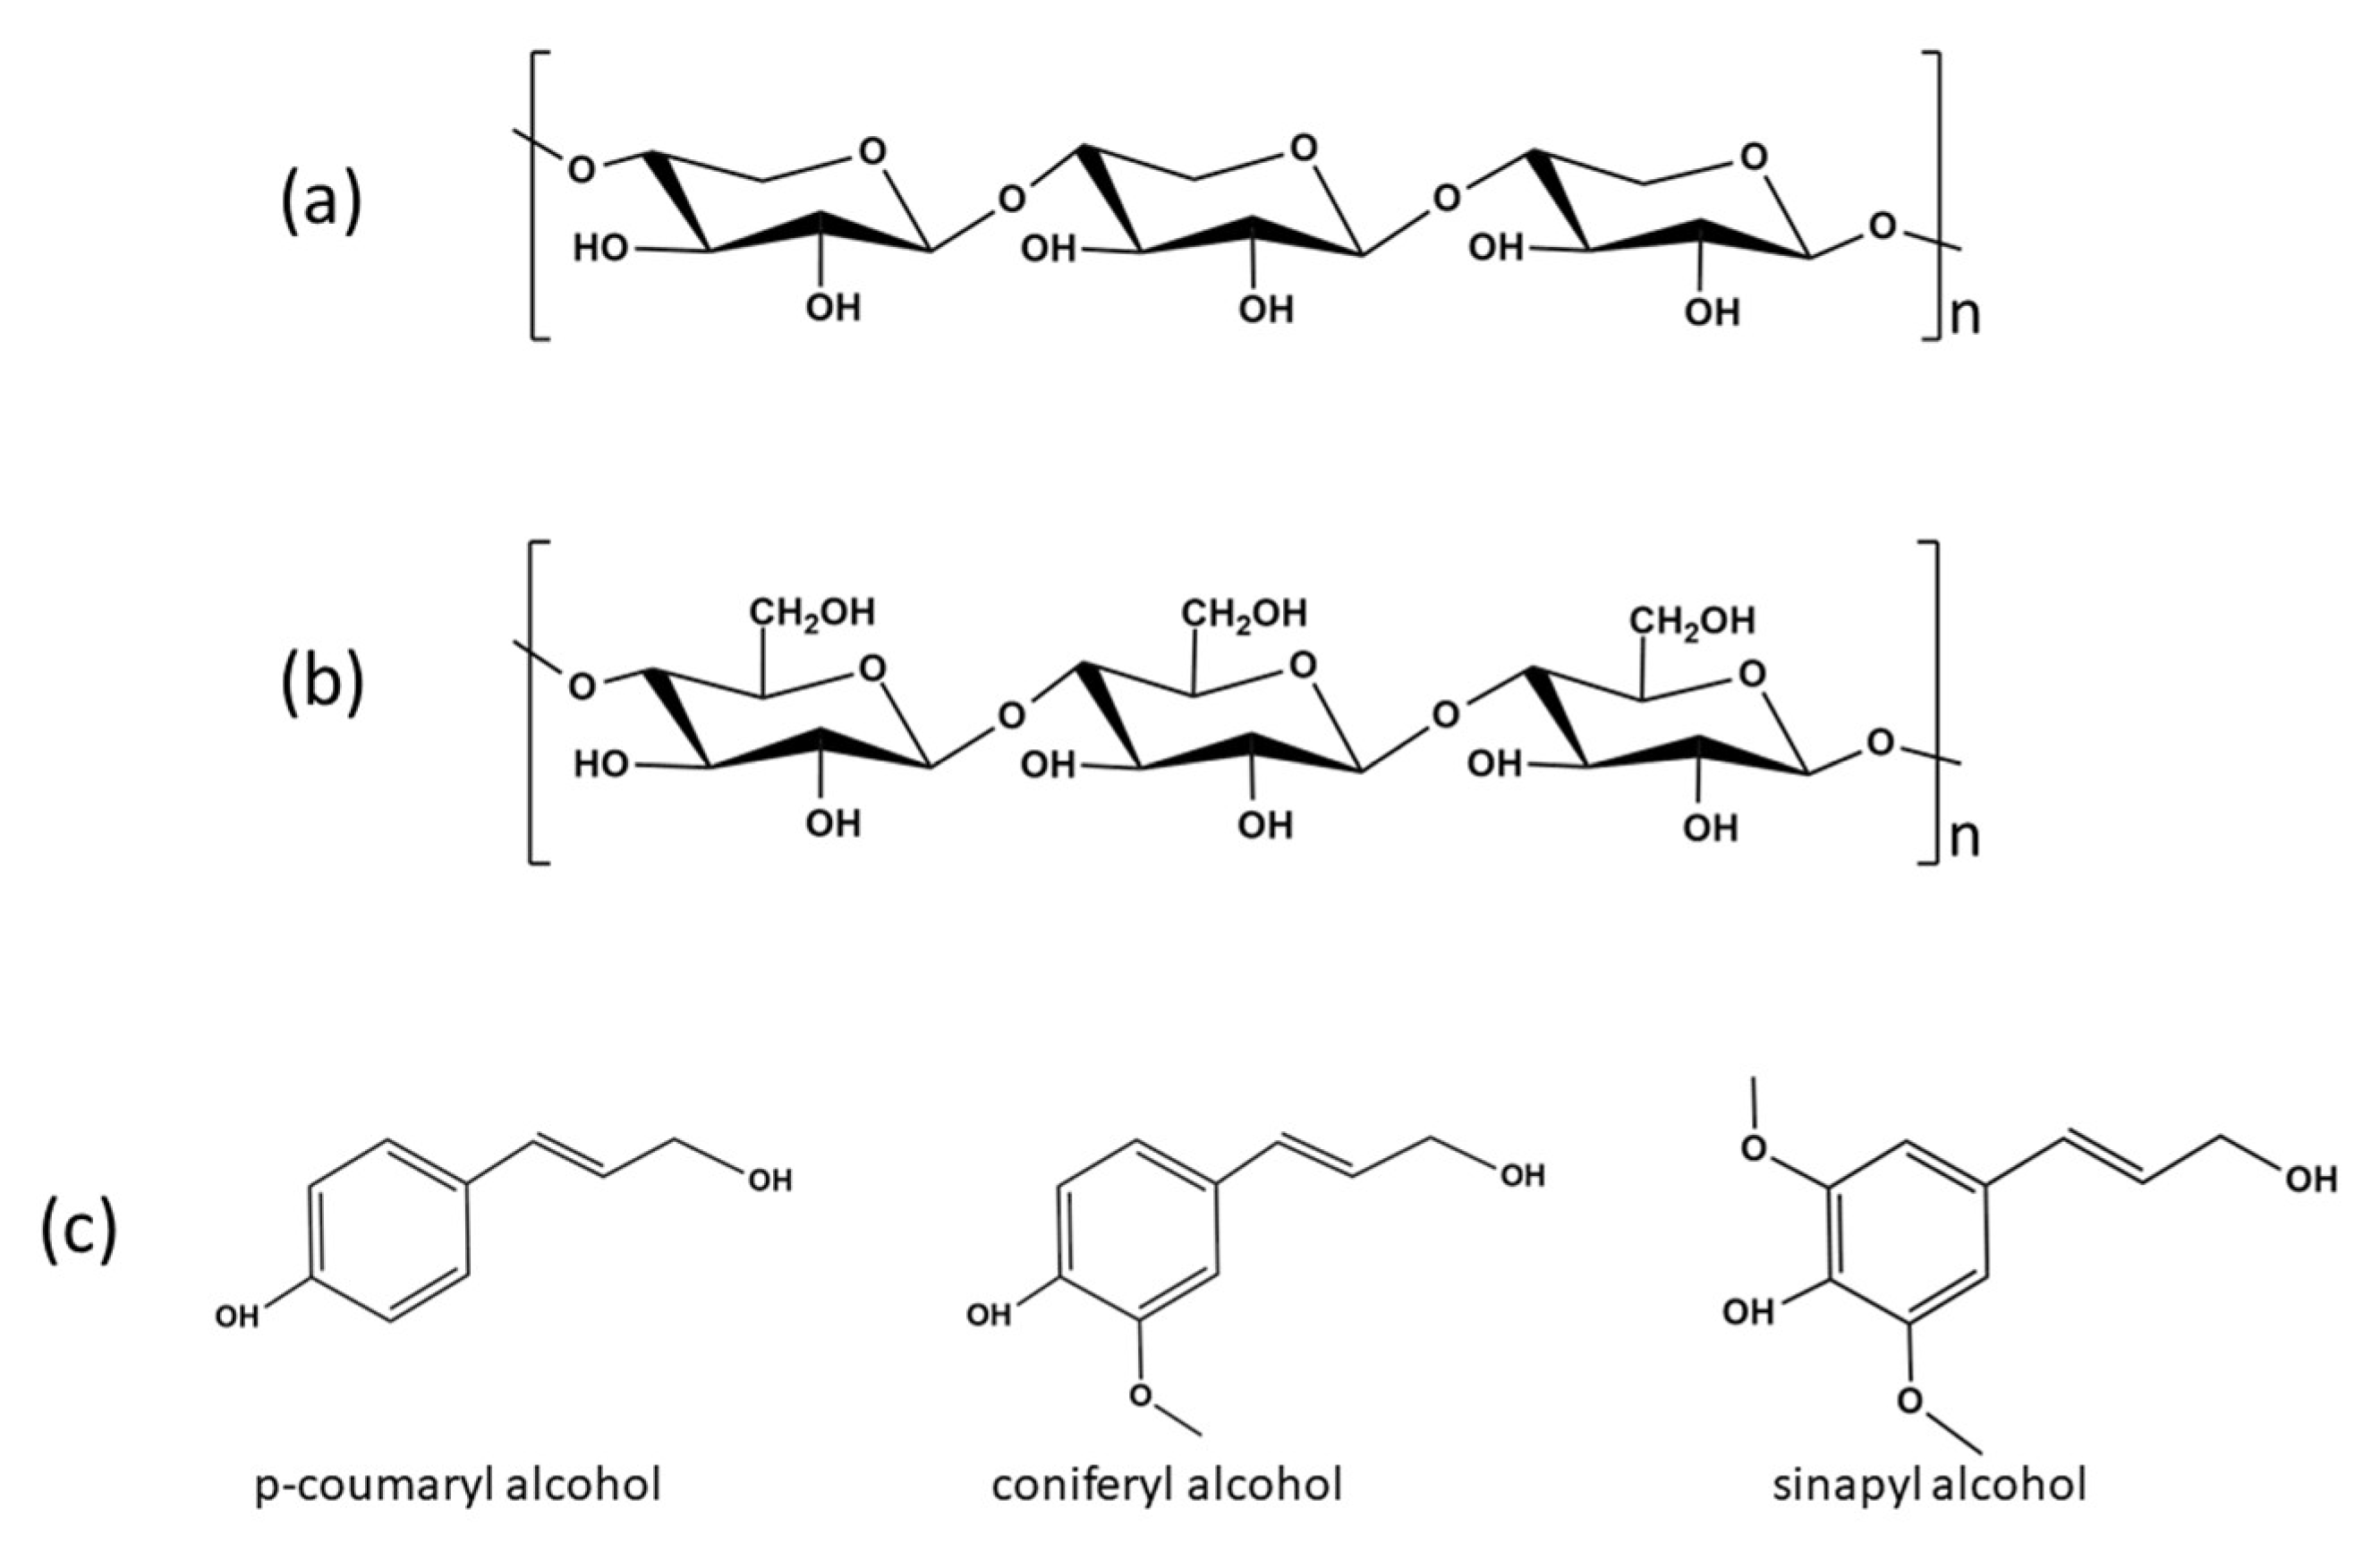
7]. Cellulose is a polymer made of repeating β-glucose connected via glycosidic linkages as shown in Figure 1a [8]. Hemicellulose is a branched heteropolymer of pentose and hexose sugars [7,9]. One of the most predominant types of hemicelluloses is xylan which consists of repeating D-xylopyranose units as shown in Figure 1b [10]. On the other hand, lignin is a complex aromatic polymer that is mainly made from coniferyl hydroxyl, p-coumaryl hydroxyl, and sinapyl hydroxyl, whose structures are shown in Figure 1c [11]. Lignocellulosic biomass is generally converted into liquid polyols via oxypropylation or liquefaction process for various PU product applications, including flexible and rigid PU foams [12,13].
The utilization of bio-derived materials in the manufacturing processes of PU products has led to the establishment of new formulations and protocols. One crucial aspect that profoundly affects the properties of these products is the reaction kinetics during the PU manufacturing process [14,15,16,17,18]. Alfeche et al. (2023) successfully modeled the physicomechanical properties of rigid PU foam based on coconut oil, focusing on the gel reaction kinetics and gel time [19]. It was found that PU reaction kinetics are largely influenced by the chemical properties of the polyol, such as heat capacities, functionalities, and hydroxyl values.
The hydroxyl groups of the polyol can be classified as primary, secondary, and hindered-secondary, with each category playing a crucial role in determining the distinct characteristics of the resulting PU networks [20,21]. The presence of primary hydroxyl groups leads to the formation of more compact PU networks. Conversely, the predominance of secondary hydroxyl groups introduces detrimental dangling chains that act as plasticizers within the PU matrix. Moreover, the presence of hindered-secondary hydroxyl groups in the middle of the carbon chain introduces high steric hindrance, which restricts urethane crosslinking [22]. Hence, a comprehensive understanding of the hydroxyl moieties in the polyol provides invaluable insights that can contribute to the enhancement of PU product properties through improved and optimized design and formulation.
The hydroxyl functional moieties are generally characterized via titration and nuclear magnetic resonance spectroscopic analysis [1,23]. These experimental techniques, however, may be unavailable or implausible to certain laboratories and can be costly, time-intensive, space-consuming, imprecise, tedious, produce wastes, and involve health and safety risks. Hence, computational methods are explored as an alternative approach to address sustainability and practicality in such polyol characterizations.
Ghoreishi et al. (2014) have developed a method that predicts the hydroxyl moieties of petroleum-based polyols by employing curve-fitting techniques on PU gel reaction temperature profiles [20]. They further examined and modeled the influence of hydroxyl moieties on the reaction kinetics and temperature profiles during gel formation. However, it should be noted that the existing model still necessitates the utilization of alcohol compounds as references for accurate predictions [20].
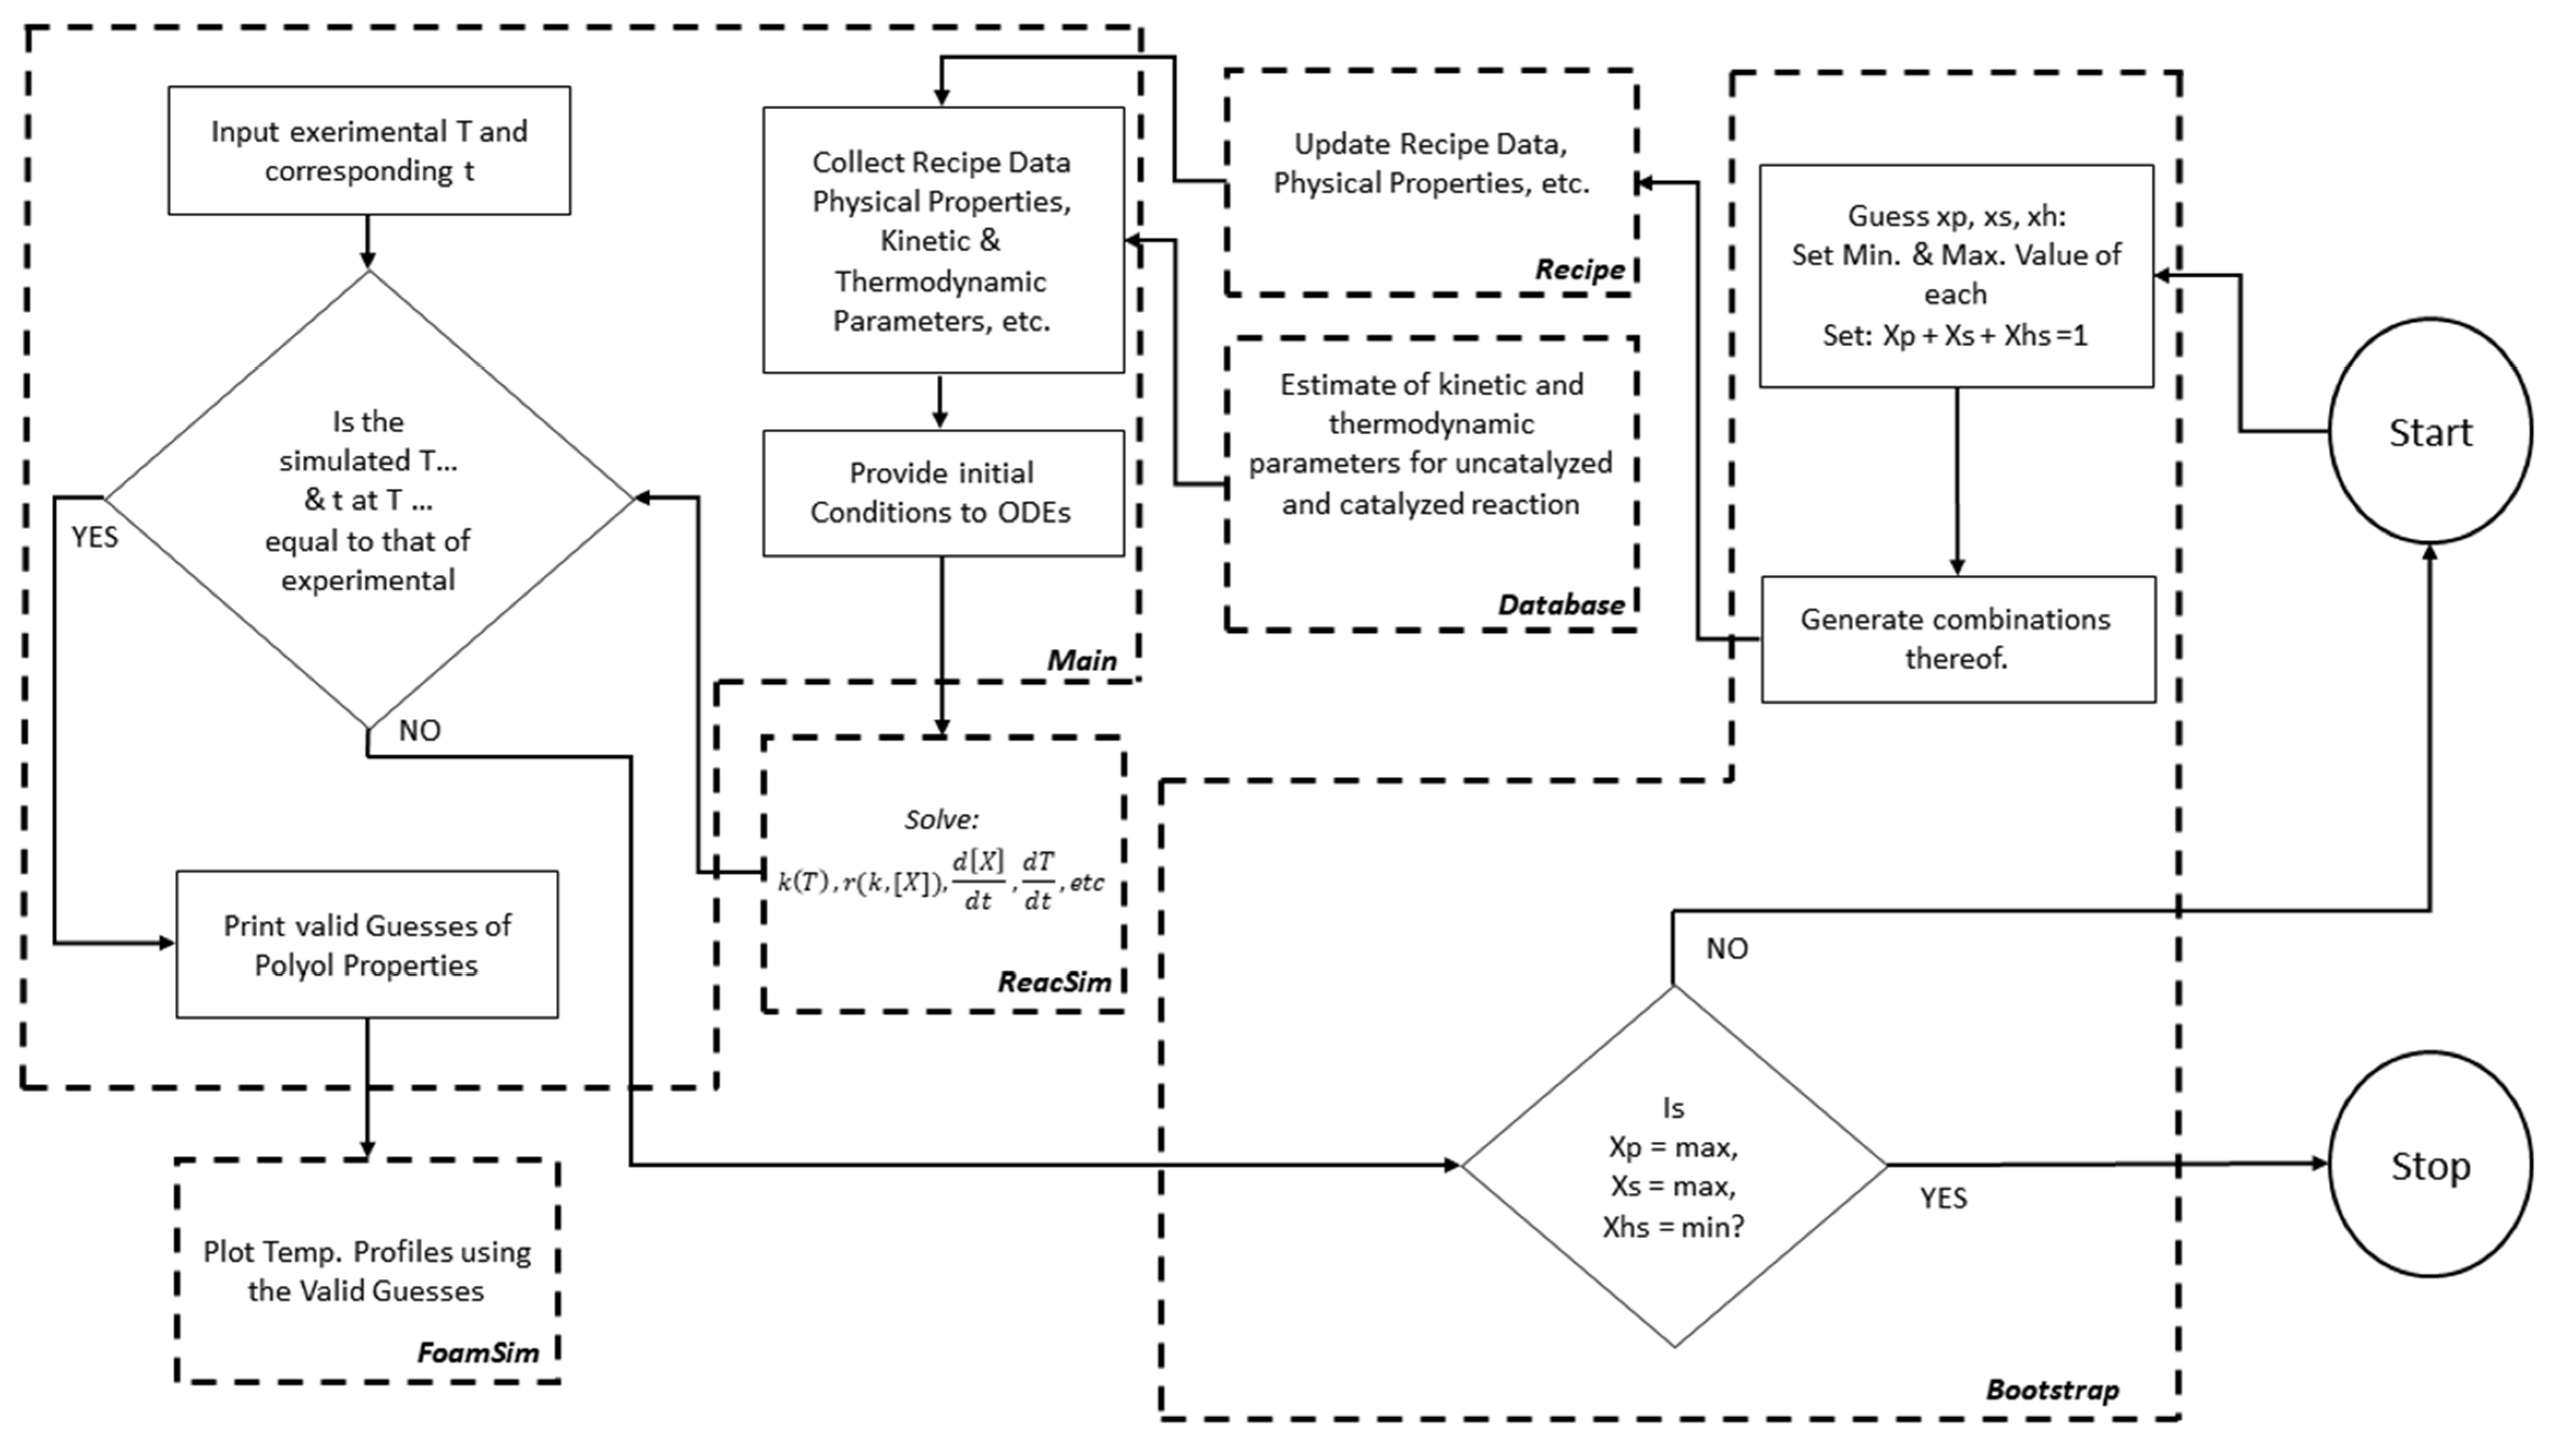
To date, comprehensive understanding has been scarce regarding the hydroxyl moieties found in lignocellulosic biomasses. This study addresses this scarcity by accurately predicting the primary, secondary, and hindered-secondary hydroxyl moieties present in a mixture of rice straw-based (RSB) and petroleum-based polyols via iterative computational method using MATLAB computer software without the need for reference compounds. For this purpose, a script was developed that can solve multiple simultaneous differential equations. These equations describe the kinetics and thermodynamics of the PU gelling reaction, based on the experimental inputs, assumptions, and heuristics described and derived from previous studies [14,20,24]. Utilizing the provided inputs, the script conducts an energy balance analysis to generate an expression for the temperature profile. Subsequently, the script employs temperature profile curve fitting by comparing the experimental and simulated data. This procedure serves as a criterion for predicting the fraction of each type of hydroxyl moiety. The corresponding fractions of hydroxyl moieties from the best-fit temperature profiles are then recorded and saved.
One notable aspect of the script developed in this study is that it is designed to operate with minimal human intervention. The script is a one-time user input, where the necessary parameters are provided, and it takes responsibility for conducting the iteration processes automatically. This reduces the potential for human error and enhances the efficiency of the analysis. Furthermore, the script code is designed and optimized to facilitate the encapsulation of foaming simulations, thereby enabling seamless and effortless modifications to accommodate future investigations involving foaming reactions. This sophisticated implementation ensures enhanced scientific rigor, allowing researchers to delve into the intricacies of foaming phenomena with greater ease and flexibility. By employing the script code, researchers can efficiently manipulate and refine the parameters and variables associated with foaming reactions, fostering a deeper understanding of their underlying mechanisms and paving the way for further advancements in this field of study.
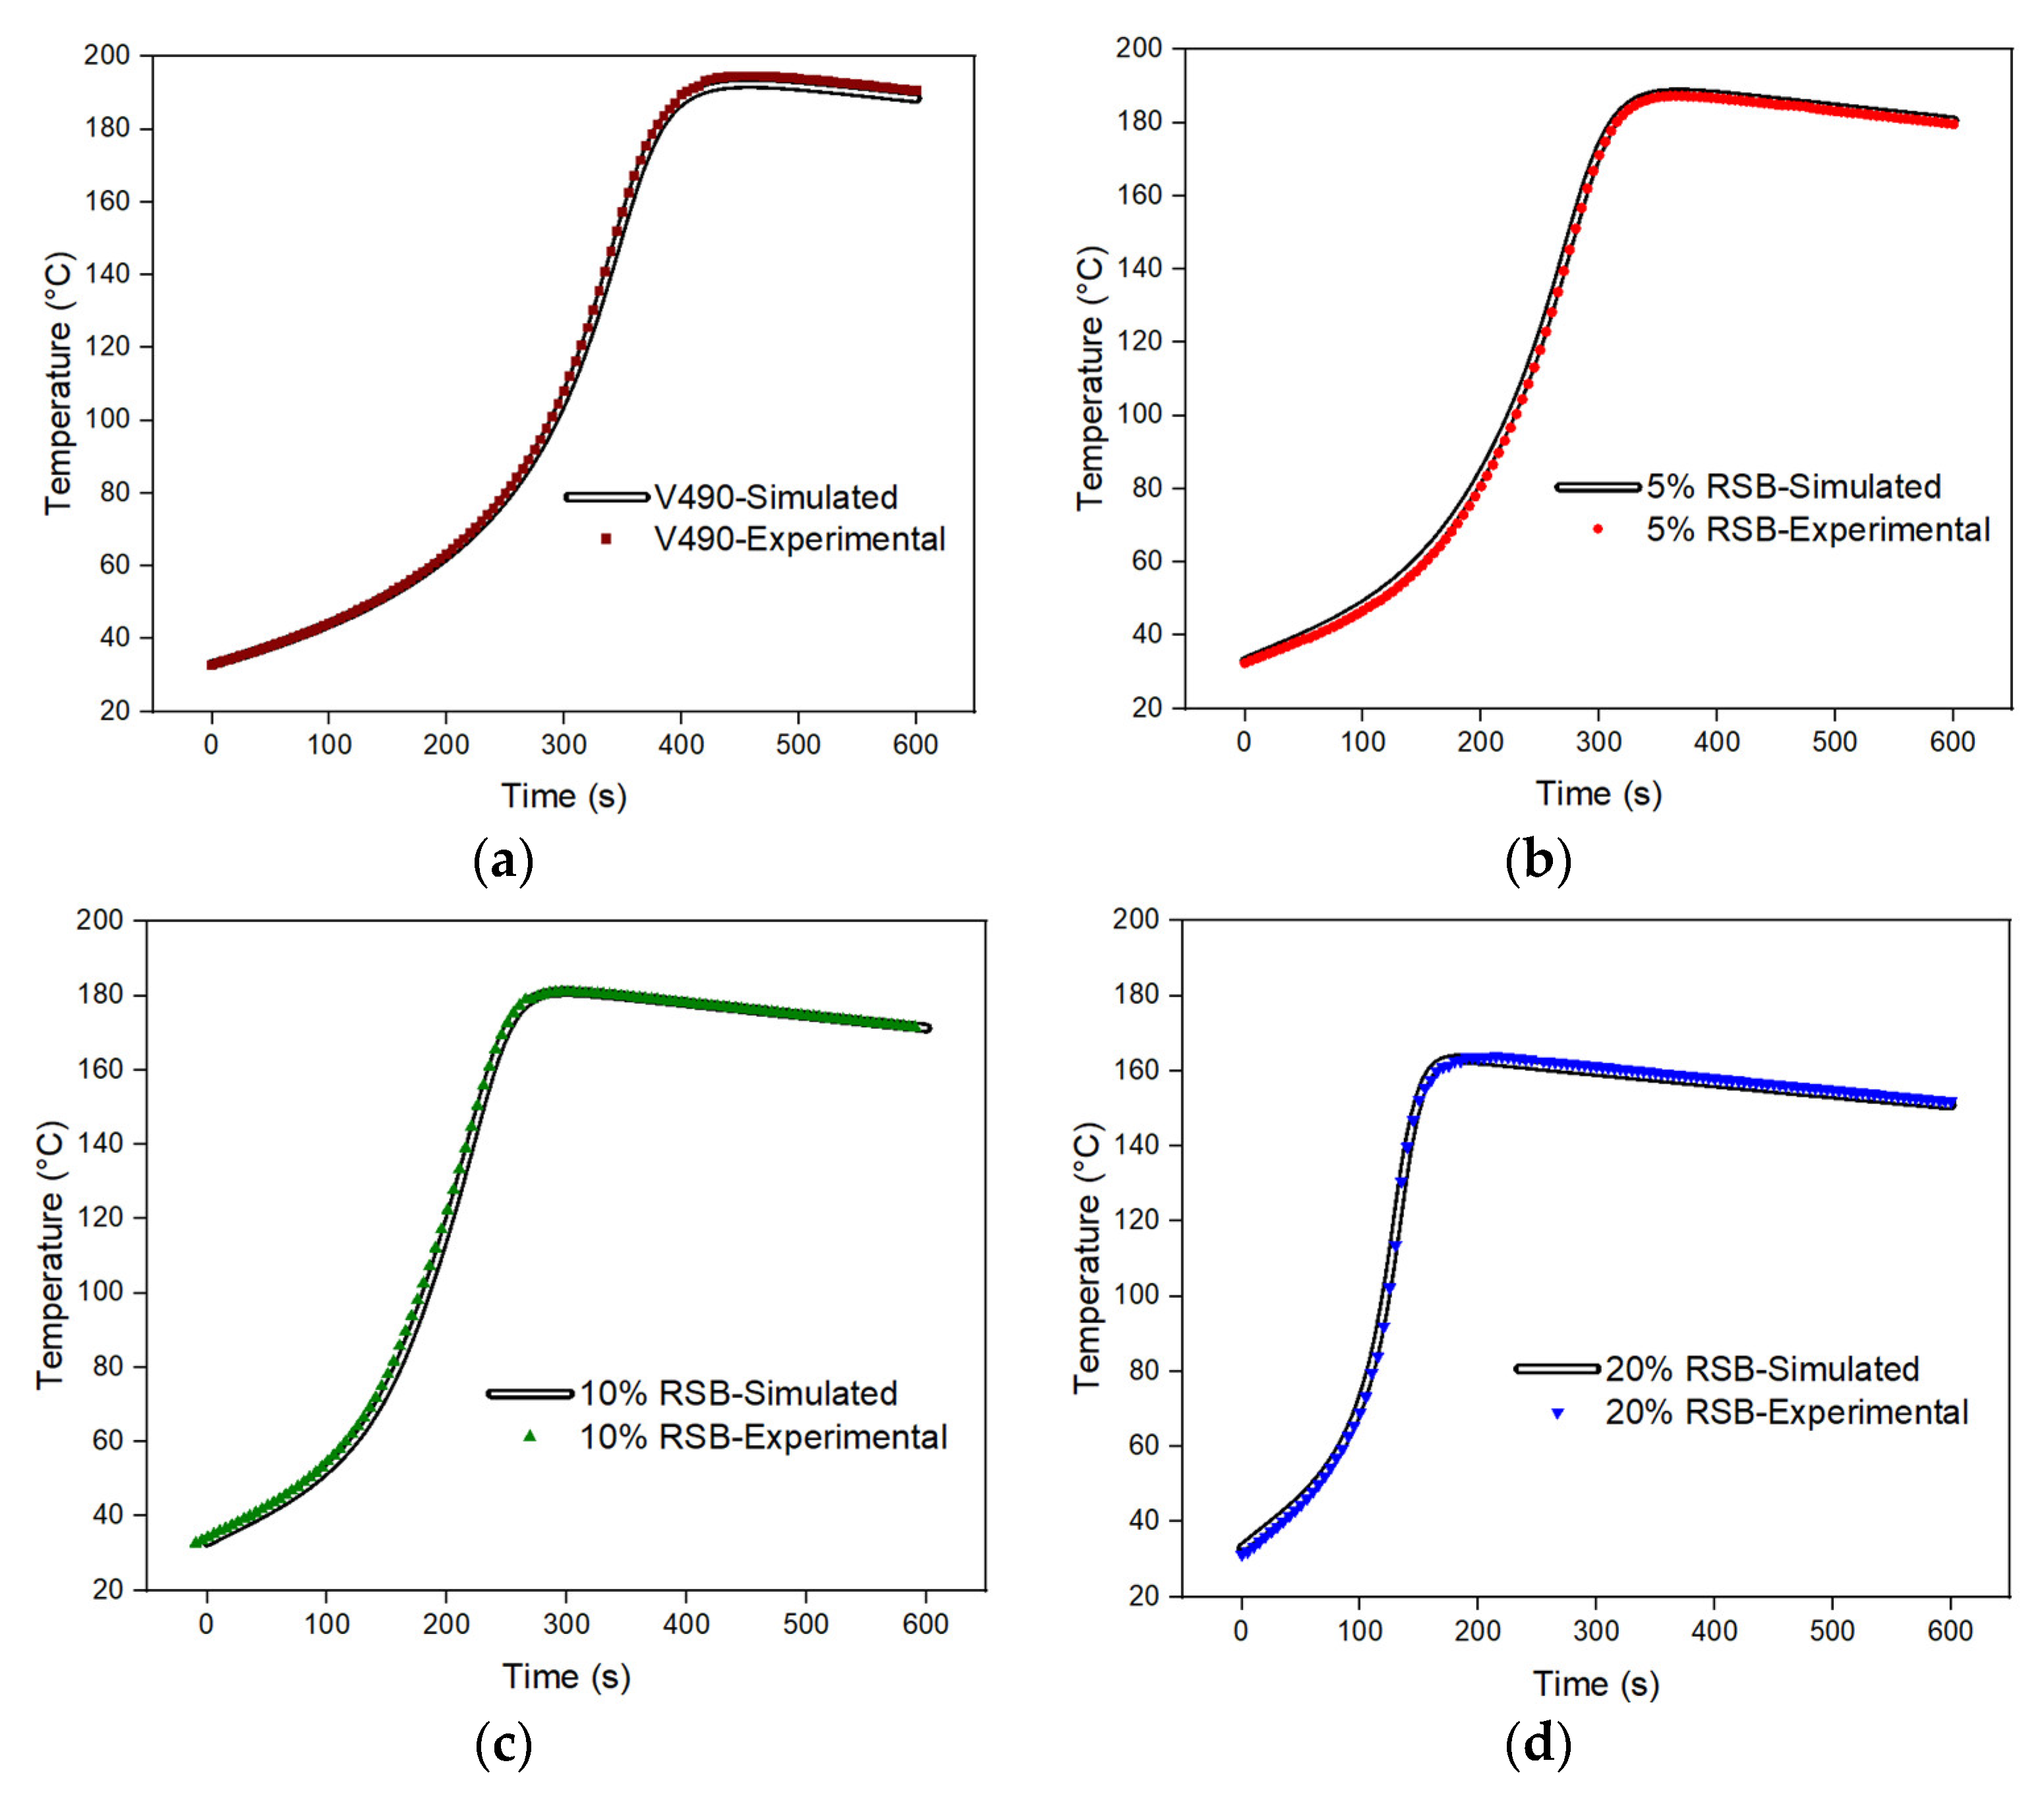
Hence, this study presents an important step towards a more comprehensive understanding of the hydroxyl moieties in lignocellulosic biomasses. By employing an iterative computational method and developing a script that automates the simulation process, the present study provides a scientific approach to quantitatively characterize the hydroxyl moieties in polyol mixtures. The script’s validity was demonstrated through its successful application to the gel temperature profile, reinforcing its utility as a valuable tool in future research and industrial applications.

Model Description

The PU gelling reaction occurs when the polyol and polyisocyanate are mixed, resulting in macromolecules with urethane structures, thus forming PUs as shown in Figure 2 [25]. The relationships between the concentrations of the reactants in Figure 2 are employed to develop a gel reaction kinetic expression as presented in Equation (1) [24]. In Equation (1), r g e l is the summation of gel reaction rates of polyol mixtures, k g e l , i is the reaction rate constant of gel i , C c a t g e l is the concentration of the gelling catalyst, C i s o is the concentration of the isocyanate groups, C O H , i is the concentration of hydroxyl groups of polyol i, and r g e l , i is the gel reaction rate of polyol i.
r g e l = i k g e l , i × C c a t g e l × C i s o × C O H , i = i r g e l , i
Moreover, the rate equations are considered to be elementary as in Equation (2). In Equation (2), ri represents the rate of any reaction i in Table 1, k represents the rate constant for any reaction, and X1 and X2 represent the concentration of the reacting moieties involved in the reaction. Additionally, a study by Zhao et. al. (2013) on catalyst impact on PU foam polymerization verified that Equation (3) provides a good estimate of catalyzed reaction rate constants, where c represents any particular catalyst/s used [24]. In Equation (3), ki represents the overall rate constant for reaction i, kuncat represents the uncatalyzed reaction rate constant, and kcat j represents the reaction rate constant in the presence of catalyst c (cat c).
r = k X 1 X 2
k = k u n c a t + c a t   c × k c a t   c
The computational counterpart of the characterization of the gelling temperature of the reacting system (T) as a function of time (t) can be found as the solution of the thermodynamic differential equation ( d T d t ) reflected in Equation (4) [24]. In Equation (4), ∑iHi × ri represents the instantaneous heat released from the reactions happening in the duration of the gelling process, UAT represents the instantaneous heat transfer from the system to the surroundings, and ∑ (n × Cp) represents the instantaneous heat capacity of the mixture. With a database or guess of pertinent physical, thermodynamic, and kinetic parameters and information on initial conditions, the solution to Equation (2) can be found although the process may be lengthy and challenging as it involves more than one differential equation.
d T d t = i Δ H i × r i + U A Δ T n × C p
In the lens of the foam temperature profiling, several exothermic reactions take place. These reactions can be both gelling and blowing reactions [13,26]. Among these two types of reactions, only the gelling reactions are influenced by the polyol’s hydroxyl functionalities [27]. Thus, this study focuses only on the investigation of the PU gelling reactions identified by the previous studies as presented in Table 1 [20,24,28]. Aside from the polyol-isocyanate reactions (reactions 1 to 12), reactions 13 and 14 can also take place depending on the other ingredients present.
Moreover, the kinetic parameters such as k0 (reaction rate constant at 25 °C), h (heat or reaction), E (activation energy), and U (heat transfer coefficient) used in this study are based on the values reported by Ghoreishi et al. (2014) for each type of hydroxyl moiety as summarized in Table 2 [20].

2. Materials and Methods

2.1. Materials

Polymeric methylene diphenyl diisocyanate (PAPI™ 27), silicone surfactants (Dabco DC 2303), catalysts (Polycat® 8), petroleum-based polyether polyol (Voranol® 490 has a hydroxyl functionality of 4.3, an average molecular weight of 460, and a hydroxyl number of 490), and crude glycerol were obtained from Dow Chemical. Reagent-grade sulfuric acid (H₂SO₄) was purchased from Sigma-Aldrich. RSB polyol was produced via the liquefaction process.

2.2. Polyol Characterization

The synthesized polyol’s hydroxyl value (OHV) was measured according to ASTM D4274-16 Test Method D. The molecular weight was determined using a Shimadzu HPLC-GPC (RID-20A). The density of the prepared polyol was determined according to ASTM D4669. The specific heat capacity of the prepared polyol was evaluated through differential scanning calorimetry (DSC) using a Perkin Elmer DSC 4000 (Perkin Elmer, Waltham, MA) with a heating rate of 10 °C/min (sample weight 5–10 mg) as suggested by ASTM D3418. Moreover, the heating range from −50 °C to 150 °C was employed in the DSC analysis of polymeric polyol systems, as the glass transition temperature of these materials typically occurs within this range. This choice ensures consistency with established practices [29,30] in the field and allows for the accurate characterization of the specific heat capacity of the polyol samples. The Cp of the mixed polyol was calculated as
C p s = C p s t × D s × W s t D s t × W s  
where, Cp(s) represents the specific heat capacity (in J/g-K) of the polyol sample, Cp(st) represents the specific heat capacity (in J/g-K) of the sapphire standard, Ds represents the vertical displacement (in mW) between the thermal curves of the specimen and the specimen holder at a specific temperature, Dst represents the vertical displacement (in mW) between the thermal curves of the specimen and the sapphire standard at a specific temperature, Wst represents the mass of the sapphire standard in mg, and Ws represents the mass of the polyol sample in mg.

2.3. Gelling Reaction and Temperature Profiling

PU gel was prepared using the formulation and recipes presented in Table 3. It was prepared by mixing the B-side, composed of the polyols, catalyst, and surfactant in a plastic cup for 10–15 s with an electronic mixer at a high speed of 3000 rpm to ensure effective mixing at a shorter time frame. The mixture was then allowed to degas for 2 min. The pre-weighed A-side, which is the Polymeric MDI with an isocyanate index of 110, was added to the mixture. Given the rapid gel formation observed in polyurethane polymers, the rapid mixing of A-side and Polymeric MDI at a similar speed was limited to a duration of 7–10 s, as gel formation can begin as early as 20 s. To accommodate this, a minimum of 10 s is allocated for transferring the mixture into the mold before gel formation starts. This time allowance is critical to maintain the desired foaming characteristics and ensure proper mold filling. By following these specific timing considerations, the foaming process can be optimized, leading to the desired gel structure and properties in polyurethane products. Then, the resulting mixture was quickly poured into a mold box with an aluminum lining. It is also worth noting that such timings are chosen based on the gelling protocols established in the previous studies [5,26]. The internal temperature of the reacting system was then measured using a Type K Thermocouple. The temperature readings were logged at an interval of five seconds using a Pico Technology USB TC-08 Temperature Data Logger with 3 replicates.

2.4. Computational Determination of Polyol Properties

The determination of the mixed polyol’s properties through computational methods was performed using MATLAB computer software. The properties being computationally determined are the molar fractions of primary (Xp), secondary (Xs), and hindered secondary (Xhs) hydroxyl moieties of the mixed polyol. A MATLAB script, following the algorithm presented in Figure 3, is utilized for this purpose.
The overall script operates based on user input of the experimental temperature profile for the PU gelling reaction. It also involves an iterative process of guessing the polyol properties and numerically testing their validity using a series of six coded functions written in MATLAB as provided in the Supplementary Materials:
  • The Bootstrap function code in Function (S1) employs a for-loop statement to generate multiple combinations of hydroxyl moieties, utilizing the specified value ranges outlined in Table 4. The ranges of values in Table 4 were selected based on the fractional moiety values of petroleum-based polyol reported in the previous study [20]. To enhance the accuracy and reliability of the simulated moiety values, the selected ranges were cautiously expanded, ensuring a lower and upper limit difference of 0.5, while maintaining a small interval size of 0.01. This meticulous approach allows for a thorough exploration of a larger parameter space, providing robust and precise simulation results. Moreover, as indicated by the previous study [20], the hydroxyl groups present in the polyol are categorized as primary, secondary, and hindered-secondary/tertiary. Therefore, it is expected that the sum of each combination of these values is equal to 1. Subsequently, these generated combinations are utilized as inputs as a recipe value in the matrix in the Recipe function code, allowing for further analysis and evaluation.
  • The Recipe function code in Function (S2) serves to store essential physicochemical data of the polyol, including molecular weight, specific heat capacity, OH value, functionality, density, hydroxyl moiety fractions, and other pertinent inputs such as the masses of polyols and isocyanates utilized in the formulation, while considering an isocyanate index of 1.1 per parts polyol. Notably, the values of hydroxyl moiety fractions undergo continuous modifications during each Bootstrap update within the iterative cycles. The output generated by the Recipe function code will serve as input for the Main function, enabling subsequent analyses and computations.
  • The Database function code in Function (S3) stores a comprehensive collection of data on the estimated kinetics, presented in Table 2 as established by previous studies [20,24], and experimental thermo-chemical parameters, presented in Table 5 along with the Recipe data obtained from the previous function, are subsequently utilized in the Main function code for subsequent analyses and computations.
  • The ReacSim function code in Function (S4) is responsible for calling the outputs from the Recipe and Database function codes within the Main function code. These outputs, along with the reaction kinetic expressions, serve as inputs for the differential equations implemented in the ReacSim function code. By utilizing these inputs, the ReacSim function code generates a simulated temperature profile. This simulated profile is subsequently validated in the Main function code, where it is compared against experimental data or predefined criteria to assess its accuracy and reliability.
  • The Main function code in Function (S5) rigorously validates all simulated temperature profile data generated by the ReacSim function code. The validation of the simulated data is performed by employing an error tolerance approach, aiming to achieve a simulated temperature profile that best fits the experimental temperature profile. In this study, the simulated temperature profiles are considered valid if they fall within +/− 5% of the average experimental temperature profile. This stringent criterion ensures that the simulated profiles closely align with the experimental data, validating the accuracy and reliability of the optimization process. By adhering to this error tolerance threshold, the study establishes a robust and rigorous framework for evaluating and validating the simulated temperature profiles against the experimental results. Moreover, the Main function code extracts and outputs the relevant fractions of hydroxyl moieties corresponding to the valid temperature profile data.
  • The FoamSim function code in Function (S6) displays the simulated temperature versus time profiles (T vs. t) of the guesses validated by the Main function code.
Subsequently, all viable simulated data are meticulously compared to identify the optimal fit with the experimental data characterized by the lowest standard error, achieved through the calculation of individual errors.

3. Results and Discussions

3.1. Experimental Results

The gel temperature profile of polyurethane (PU) systems is influenced by two main factors: the hydroxyl value of the polyol and its corresponding fractional moieties. Each moiety exhibits different reactivity when reacting with isocyanates during polyurethane formation. Polyols with higher hydroxyl values exhibit higher maximum temperatures (Tmax), resulting in shorter gel times. On the other hand, polyols with higher concentrations of primary and/or secondary hydroxyl moieties also exhibit higher Tmax and faster reaction kinetics, leading to shorter gel times. This disparity arises because the reactions of primary alcohols exhibit a faster reaction rate compared to hindered-secondary alcohols when reacting with isocyanates, as shown in Table 6.
Figure 4a displays the experimental temperature profiles of rice straw-based (RSB) polyurethane gels with varying V490 polyol replacements. These profiles provide insights into the thermal behavior and gelation process of the polyurethane system. Figure 4b depicts the actual image of a representative polyurethane gel sample, offering visual confirmation of the gel formation.
Analyzing the gel times (the time taken to reach Tmax) of the experimental temperature profiles presented in Figure 4a, it is observed that a higher percentage of rice straw-based (RSB) polyol replacement results in shorter gel times compared to cases with lower RSB replacements. This implies that RSB PU gels demonstrate faster reaction kinetics than V490-based PU gels. This observation suggests that RSB polyol contains a higher fraction of primary or secondary hydroxyls compared to V490 polyol. Additionally, it is noticed that higher RSB polyol replacement leads to a lower Tmax compared to systems with lower replacements. This can be attributed to the relatively lower hydroxyl value of RSB polyol compared to V490, as indicated in Table 5 since Tmax values are directly influenced by the number of reactive alcohol moieties [29].
Further investigation in Figure 4 reveals a gradual decrease in temperature as the system approaches thermal equilibrium, indicating heat dissipation from the PU foam system during the cooling phase following the gelling process [19]. This observation suggests that heat is transferred from the PU foam system to the surroundings during the cooling phase, resulting in a gradual decrease in temperature.

3.2. Computational Results

The algorithm presented in Figure 3 was executed using the experimental temperature profiles as inputs, along with the specified ranges and intervals of the kinetic parameters, fractions of hydroxyl moieties, and recipe data outlined in Table 2, Table 4 and Table 5, respectively. Afterward, the MATLAB script code was then executed, employing a rigorous arrangement of for-loops and combinations to explore various fractions of primary, secondary, and hindered-secondary hydroxyl moieties. These simulated profiles were subsequently adjusted through curve fitting procedures, aiming to obtain the best fit with the corresponding experimental profiles. By iteratively performing these calculations and comparisons, the script code identified the optimal values of the hydroxyl moieties for each system, as indicated in Table 7. These values represent the predicted hydroxyl moieties corresponding to the best-fit simulated temperature profiles as shown in Figure 5.
Analysis of the data presented in Table 5 reveals a correlation between the increased RSB polyol replacement and the corresponding fractions of primary, secondary, and hindered-secondary hydroxyl (OH) groups. Specifically, it is observed that as the RSB replacement percentage increases, the Xp and Xhs increase, while Xs decreases. This finding indicates that RSB polyol contains a higher proportion of primary and hindered-secondary hydroxyls and a lower proportion of secondary hydroxyls compared to V490 polyol.
Moreover, the presence of primary hydroxyls in RSB polyol can be attributed to the natural occurrence of intrinsic primary hydroxyls in its lignin component. In contrast, V490 polyol does not possess such inherent primary hydroxyls. Consequently, the reaction kinetics of V490 polyol is relatively slower compared to the system with 20% RSB polyol replacement, as evidenced by the temperature profiles depicted in Figure 5. These findings highlight the influence of polyol hydroxyl moiety composition on the reaction kinetics during the PU gelling process.
The developed script code in this study has limitations in its applicability, as it is specifically designed for pure rice straw-based and petroleum-based polyols with hydroxyl functionalities. Hybrid systems involving amine-containing polyols are not compatible with the current script code due to their unique chemical composition and reactivity, requiring distinct computational approaches. Similar to previous investigations, the computational method in the present study focuses solely on the polyurethane gelling process, excluding blowing reactions that can introduce complexities and inaccuracies. By employing a gelling simulation approach, the study ensures that the reaction kinetics primarily involve alcohol fractional moieties reacting with isocyanate, enhancing the accuracy of predicting the hydroxyl group fractions.

4. Conclusions

The present study has developed an iterative computational method that can accurately predict the hydroxyl moieties of both petroleum-based and bio-based polyols. The method takes advantage of the use of MATLAB software to model the PU gel reaction kinetics of the thermo-kinetic behavior of both petroleum and bio-based systems. This rigorous process facilitated the accurate determination of the hydroxyl moieties for the simulated temperature profiles of each system. The script code’s ability to systematically explore various combinations and its utilization of curve-fitting techniques ensured the selection of the most suitable profiles that closely resembled the experimental data. As such, testing the validity of the script on an experimental formulation reveals its accuracy as shown in the simulated and experimental temperature curve fits with an average deviation of less than 1% as shown in Figure 5. Hence, the iterative method developed in the present study exhibits a reliable approach to estimating the hydroxyl moieties of an unknown polyol in a more accurate, practical, and sustainable approach compared to the conventional methods. Consequently, this study serves as a foundation for the advancement of further scientific exploration and development in the field of PU synthesis and processing in terms of sustainability and accuracy.

5. Recommendations

Future studies should explore alternative computational approaches that effectively accommodate both the urethane and urea systems, including their hybrids while encompassing exothermic and endothermic polymer reaction systems. Additionally, investigating the impact of blowing reactions is crucial. Iterative computational studies on diverse bio-based polyol feedstock are recommended to assess the suitability and potential of the present computational in various applications. Such investigations will contribute to a comprehensive understanding of polyol compositions, enabling informed decision-making and advancements in the field. Additionally, it is recommended to leverage the capabilities of supercomputers to reduce the running time of the script, enabling the faster acquisition of results. The utilization of supercomputing resources can significantly enhance computational efficiency and expedite the data analysis process, leading to more efficient and timely research outcomes.

Supplementary Materials

The following supporting information can be downloaded at: https://www.mdpi.com/article/10.3390/su151512082/s1, Function (S1): Bootstrap function; Function (S2): Recipe function; Function (S3): Database function; Function (S4): ReacSim function; Function (S5): Main function; Function (S6): FoamSim function.

Author Contributions

Conceptualization, R.G.D.J., D.B.R. and A.C.O.D.; methodology, R.G.D.J., D.B.R. and A.C.O.D.; software, R.G.D.J. and D.B.R.; validation, R.G.D.J., D.B.R. and A.C.O.D.; formal analysis, R.G.D.J., D.B.R. and A.C.O.D.; investigation, R.G.D.J., D.B.R. and A.C.O.D.; resources, A.C.O.D., A.A.L., A.C.A., G.G.D. and R.M.M.; data curation, R.G.D.J. and D.B.R.; writing—original draft preparation, R.G.D.J. and D.B.R.; writing—review and editing, R.G.D.J., D.B.R., F.L.A.M.A., K.J.G.D.T., H.H.A.-M. and G.G.D.; visualization, R.G.D.J., K.J.G.D.T. and D.B.R.; supervision, A.C.O.D., A.A.L. and R.M.M.; project administration, A.C.O.D., A.A.L., A.C.A., G.G.D. and R.M.M. All authors have read and agreed to the published version of the manuscript.

Funding

The authors would like to acknowledge the financial support of the Department of Science and Technology through the Niche Centers in the Region (NICER), R&D Center for Sustainable Polymers (101-02-0194-2022).

Institutional Review Board Statement

Not applicable.

Informed Consent Statement

Not applicable.

Data Availability Statement

Not applicable.

Acknowledgments

Gerard Dumancas wishes to thank the Balik Scientist Program of the Department of Science and Technology, Philippine Council for Health, Research, and Development for the opportunity to serve the Filipino community through science, technology, and innovation. The Balik (Filipino word for “Return” or “Repatriate”) Scientist Program (BSP) seeks highly trained Filipino scientists, technologists, experts, and professionals residing abroad to return to the Philippines and transfer their expertise to the local community.

Conflicts of Interest

The authors declare no conflict of interest.

References

  1. Meng, X.; Crestini, C.; Ben, H.; Hao, N.; Pu, Y.; Ragauskas, A.J.; Argyropoulos, D.S. Determination of hydroxyl groups in biorefinery resources via quantitative 31P NMR spectroscopy. Nat. Protoc. 2019, 14, 2627–2647. [Google Scholar] [CrossRef] [PubMed]
  2. Huang, L.Z.; Ma, M.G.; Ji, X.X.; Choi, S.E.; Si, C. Recent Developments and Applications of Hemicellulose from Wheat Straw: A Review. Front. Bioeng. Biotechnol. 2021, 9, 690773. [Google Scholar] [CrossRef] [PubMed]
  3. Zhang, Q.; Lin, X.; Chen, W.; Zhang, H.; Han, D. Modification of rigid polyurethane foams with the addition of nano-SiO2 or lignocellulosic biomass. Polymers 2020, 12, 107. [Google Scholar] [CrossRef] [PubMed] [Green Version]
  4. Hu, S.; Luo, X.; Li, Y. Polyols and polyurethanes from the liquefaction of lignocellulosic biomass. ChemSusChem 2014, 7, 66–72. [Google Scholar] [CrossRef]
  5. Amran, U.A.; Zakaria, S.; Chia, C.H.; Roslan, R.; Jaafar, S.N.S.; Salleh, K.M. Polyols and rigid polyurethane foams derived from liquefied lignocellulosic and cellulosic biomass. Cellulose 2019, 26, 3231–3246. [Google Scholar] [CrossRef]
  6. Abo, B.O.; Gao, M.; Wang, Y.; Wu, C.; Ma, H.; Wang, Q. Lignocellulosic biomass for bioethanol: An overview on pretreatment, hydrolysis, and fermentation processes. Rev. Environ. Health 2019, 34, 57–68. [Google Scholar] [CrossRef] [PubMed]
  7. Hernández-Beltrán, J.U.; Hernández-De Lira, I.O.; Cruz-Santos, M.M.; Saucedo-Luevanos, A.; Hernández-Terán, F.; Balagurusamy, N. Insight into pretreatment methods of lignocellulosic biomass to increase biogas yield: Current state, challenges, and opportunities. Appl. Sci. 2019, 9, 3721. [Google Scholar] [CrossRef] [Green Version]
  8. Pinto, E.; Aggrey, W.N.; Boakye, P.; Amenuvor, G.; Sokama-Neuyam, Y.A.; Fokuo, M.K.; Karimaie, H.; Sarkodie, K.; Adenutsi, C.D.; Erzuah, S.; et al. Cellulose processing from biomass and its derivatization into carboxymethylcellulose: A review. Sci. Afr. 2022, 15, e01078. [Google Scholar] [CrossRef]
  9. Muktham, R.; Bhargava, S.K.; Bankupalli, S.; Ball, A.S. A Review on 1st and 2nd Generation Bioethanol Production-Recent Progress. J. Sustain. Bioenergy Syst. 2016, 6, 72–92. [Google Scholar] [CrossRef] [Green Version]
  10. Sun, R.C.; Sun, X.F.; Tomkinson, J. Hemicelluloses and their derivatives. In Hemicelluloses: Science and Technology; ACS Symposium Series; American Chemical Society: Washington, DC, USA, 2004; Volume 864, pp. 2–22. [Google Scholar] [CrossRef] [Green Version]
  11. Yoo, C.G.; Meng, X.; Pu, Y.; Ragauskas, A.J. The critical role of lignin in lignocellulosic biomass conversion and recent pretreatment strategies: A comprehensive review. Bioresour. Technol. 2020, 301, 122784. [Google Scholar] [CrossRef]
  12. Saffar, T.; Bouafif, H.; Braghiroli, F.L.; Magdouli, S.; Langlois, A.; Koubaa, A. Production of Bio-based Polyol from Oxypropylated Pyrolytic Lignin for Rigid Polyurethane Foam Application. Waste Biomass Valorization 2020, 11, 6411–6427. [Google Scholar] [CrossRef]
  13. Petrovic, Z.S. Polyurethanes from vegetable oils. Polym. Rev. 2008, 48, 109–155. [Google Scholar] [CrossRef]
  14. Varshouee, G.H.; Heydarinasab, A.; Vaziri, A.; Roozbahani, B. Determining final product properties and kinetics studies of polypropylene polymerization by a validated mathematical model. Bull. Chem. Soc. Ethiop. 2018, 32, 579–594. [Google Scholar] [CrossRef]
  15. Li, J.; Jiang, S.; Ding, L.; Wang, L. Reaction kinetics and properties of MDI base poly (urethane-isocyanurate) network polymers. Des. Monomers Polym. 2021, 24, 265–273. [Google Scholar] [CrossRef]
  16. García, F.; García, J.M.; Rubio, F.; De La Peña, J.L.; Guzmán, J.; Riande, E. Reaction kinetics and gel effect on the polymerization of 2-ethoxyethyl methacrylate and 2(2-ethoxyethoxy) ethyl methacrylate. J. Polym. Sci. Part A Polym. Chem. 2002, 40, 3987–4001. [Google Scholar] [CrossRef]
  17. Al-Moameri, H.H.; Hassan, G.; Jaber, B. Simulation Physical and Chemical Blowing Agents for Polyurethane Foam Production. IOP Conf. Ser. Mater. Sci. Eng. 2019, 518, 062001. [Google Scholar] [CrossRef]
  18. Peyrton, J.; Chambaretaud, C.; Avérous, L. New insight on the study of the kinetic of biobased polyurethanes synthesis based on oleo-chemistry. Molecules 2019, 24, 4332. [Google Scholar] [CrossRef] [Green Version]
  19. Alfeche, F.L.A.M.; Dingcong, R.G.; Mendija, L.C.C.; Al-Moameri, H.H.; Dumancas, G.G.; Lubguban, A.A.; Malaluan, R.M.; Alguno, A.A.; Lubguban, A.A. In Silico Investigation of the Impact of Reaction Kinetics on the Physico-Mechanical Properties of Coconut-Oil-Based Rigid Polyurethane Foam. Sustainability 2023, 15, 7148. [Google Scholar] [CrossRef]
  20. Ghoreishi, R.; Zhao, Y.; Suppes, G.J. Reaction modeling of urethane polyols using fraction primary secondary and hindered-secondary hydroxyl content. J. Appl. Polym. Sci. 2014, 131, 40388. [Google Scholar] [CrossRef]
  21. Lubguban, A.A.; Ruda, R.J.G.; Aquiatan, R.H.; Paclijan, S.; Magadan, K.O.; Balangao, J.K.B.; Escalera, S.T.; Bayron, R.R.; Debalucos, B.; Lubguban, A.A.; et al. Soy-Based Polyols and Polyurethanes. KIMIKA 2017, 28, 1–19. [Google Scholar] [CrossRef] [Green Version]
  22. Nagy, L.; Vadkerti, B.; Lakatos, C.; Fehér, P.P.; Zsuga, M.; Kéki, S. Kinetically equivalent functionality and reactivity of commonly used biocompatible polyurethane crosslinking agents. Int. J. Mol. Sci. 2021, 22, 4059. [Google Scholar] [CrossRef]
  23. Saller, K.M.; Gnatiuk, I.; Holzinger, D.; Schwarzinger, C. Semiquantitative Approach for Polyester Characterization Using Matrix-Assisted Laser Desorption Ionization/Time-of-Flight Mass Spectrometry Approved by 1H NMR. Anal. Chem. 2020, 92, 15221–15228. [Google Scholar] [CrossRef]
  24. Zhao, Y.; Gordon, M.J.; Tekeei, A.; Hsieh, F.H.; Suppes, G.J. Modeling reaction kinetics of rigid polyurethane foaming process. J. Appl. Polym. Sci. 2013, 130, 1131–1138. [Google Scholar] [CrossRef]
  25. De Souza, F.M.; Kahol, P.K.; Gupta, R.K. Introduction to Polyurethane Chemistry. In Polyurethane Chemistry: Renewable Polyols and Isocyanates; ACS Symposium Series; American Chemical Society: Washington, DC, USA, 2021; Volume 1380, pp. 1–24. [Google Scholar] [CrossRef]
  26. Li, X.; Fang, Z.; Li, X.; Tang, S.; Zhang, K.; Guo, K. Synthesis and application of a novel bio-based polyol for preparation of polyurethane foams. New J. Chem. 2014, 38, 3874–3878. [Google Scholar] [CrossRef]
  27. Rao, R.R.; Mondy, L.A.; Long, K.N.; Celina, M.C.; Wyatt, N.; Roberts, C.C.; Soehnel, M.M.; Brunini, V.E. The kinetics of polyurethane structural foam formation: Foaming and polymerization. AIChE J. 2017, 63, 2945–2957. [Google Scholar] [CrossRef]
  28. Zhao, Y.; Zhong, F.; Tekeei, A.; Suppes, G.J. Modeling impact of catalyst loading on polyurethane foam polymerization. Appl. Catal. A Gen. 2014, 469, 229–238. [Google Scholar] [CrossRef]
  29. Toxqui-Terán, A.; Leyva-Porras, C.; Ruíz-Cabrera, M.Á.; Cruz-Alcantar, P.; Saavedra-Leos, M.Z. Thermal study of polyols for the technological application as plasticizers in the food industry. Polymers 2018, 10, 467. [Google Scholar] [CrossRef] [PubMed] [Green Version]
  30. Parcheta, P.; Datta, J. Structure analysis and thermal degradation characteristics of bio-based poly(propylene succinate)s obtained by using different catalyst amounts. J. Therm. Anal. Calorim. 2017, 130, 197–206. [Google Scholar] [CrossRef] [Green Version]
  31. Ionescu, M. Chemistry and Technology of Polyols for Polyurethanes; Smithers Rapra Technology Ltd.: Shropshire, UK, 2005; ISBN 9781847350350. [Google Scholar]
Figure 1. General component of lignocellulosic biomasses; (a) cellulose, (b) hemicellulose, and (c) lignins.
Sustainability 15 12082 g001
Figure 2. General reaction mechanism of polyols and polyisocyanates producing polyurethane structures.
Sustainability 15 12082 g002
Figure 3. MATLAB algorithm employed presenting the general looping process for the simulation of hydroxyl fractional moieties and their corresponding temperature profile using.
Sustainability 15 12082 g003
Figure 4. Experimental polyurethane gel reaction temperature profile at different rice straw-based (RSB) polyol replacements labeled according to their polyol origin; V490 (i.e., derived fully from Voranol® 490), 5%RSB (i.e., 5%RSB–95%V490), 10%RSB (i.e., 10%RSB–90%V490), and 20%RSB (i.e., 20%RSB–80%V490) (a) and an actual image of the polyurethane foam sample during the experimental temperature profiling (b).
Sustainability 15 12082 g004
Figure 5. Curve fitting of both simulated and experimental polyurethane gel temperature profiles at different Rice Straw-Based (RSB) and Voranol 490 polyols (V490) blends; (a) V490 (i.e., derived fully from Voranol® 490), (b) 5%RSB (i.e., 5%RSB–95%V490), (c) 10%RSB (i.e., 10%RSB–90%V490), and (d) 20%RSB (i.e., 20%RSB–80%V490) showing the accuracy of the simulation model in comparison with the experimental temperature profiles.
Sustainability 15 12082 g005
Table 1. Summary of possible reactions occurring during the polyurethane gelling process [20,24].
No.ReactionsNo.Reactions
1 A + B p P 8 P A + B s P
2 A + B s P 9 P A + B h s P
3 A + B h s P 10 P A + B p P P
4 A + B p P P 11 P A + B s P P
5 A + B s P P 12 P A + B h s P P
6 A + B h s P P 13 A + U r P
7 P A + B p P 14 A + U r P
A represents an isocyanate group, B represents a hydroxyl group in the polyol component, P represents the growing polyurethane polymer, Bp, Bs, and Bhs represent the primary, secondary, and hindered-secondary hydroxyl group in the polyol component, respectively, while BpP, BsP, and BhsP represent a primary, a secondary, and a hindered-secondary/tertiary hydroxyl group on P, respectively, and Ur represents the urethane moiety according to Ghoreishi et al. (2014) [20].
Table 2. Summary of kinetic parameters of primary, secondary, and hindered-secondary hydroxyls.
Parameterk0EhU
Primary50037,00068,0002
Secondary5540,00068,0002
Hindered-secondary4240,00068,0002
Table 3. Gel reaction recipes and formulations for the preparation of the experimental gelling processes at different blends of rice straw-based (RSB) and Voranol 490 (V490) polyols [5].
Foam FormulationComponentsPU-V490PU-5-RSBPU-10-RSBPU-20-RSB
PolyolV490100959080
RSB051020
CatalystsPolycat 80.50.50.50.5
SurfactantDabco DC 23031.51.51.51.5
IsocyanateMDI Papi™ 27144.94141.72138.50132.07
Table 4. Summary of the ranges and intervals of the fractional hydroxyl moiety values used in the iterative computations in the script code.
Primary, XpSecondary, XsHindered-Secondary, Xhs
Lower limit00.10.5
Interval0.010.010.01
Upper limit0.50.51
Table 5. Summary of the thermo-chemical properties of polyols that are used as recipe inputs in the script code.
PolyolOH Value, mg KOH/gMW, g/molDensity, g/cm3Cp, J/g-K
V490487.64911.111.80
5%RSB-V490473.4482.41.101.64
10%RSB-V490465.3476.61.091.42
20%RSB-V490446.2461.51.081.17
Table 6. The relative reaction rates of different hydroxyl moieties during a non-catalyzed reaction with isocyanates at 25 °C [31].
Hydroxyl MoietiesFormulaRelative Reaction Rate (Non-Catalyzed at 25 °C)
Primary hydroxylR-CH2-OH2.5
Secondary hydroxylR2-CH-OH0.75
Hindered-secondary/tertiary hydroxylR3-C-OH0.0125
Table 7. Summary of fractional hydroxyl moieties of Voranol 490 and 5%, 10%, and 20% bio-replaced rice straw-based polyol.
Voranol 4905%RSB-V49010%RSB-V49020%RSB-V490
Primary, Xp00.020.030.06
Secondary, Xs0.260.210.160.10
Hindered-secondary, Xhs0.740.770.810.84
Disclaimer/Publisher’s Note: The statements, opinions and data contained in all publications are solely those of the individual author(s) and contributor(s) and not of MDPI and/or the editor(s). MDPI and/or the editor(s) disclaim responsibility for any injury to people or property resulting from any ideas, methods, instructions or products referred to in the content.

