


Experimental Study on the Flexural Properties of FRP-Reinforced Super-Span Concrete T-Beam after Service

Abstract
:1. Introduction
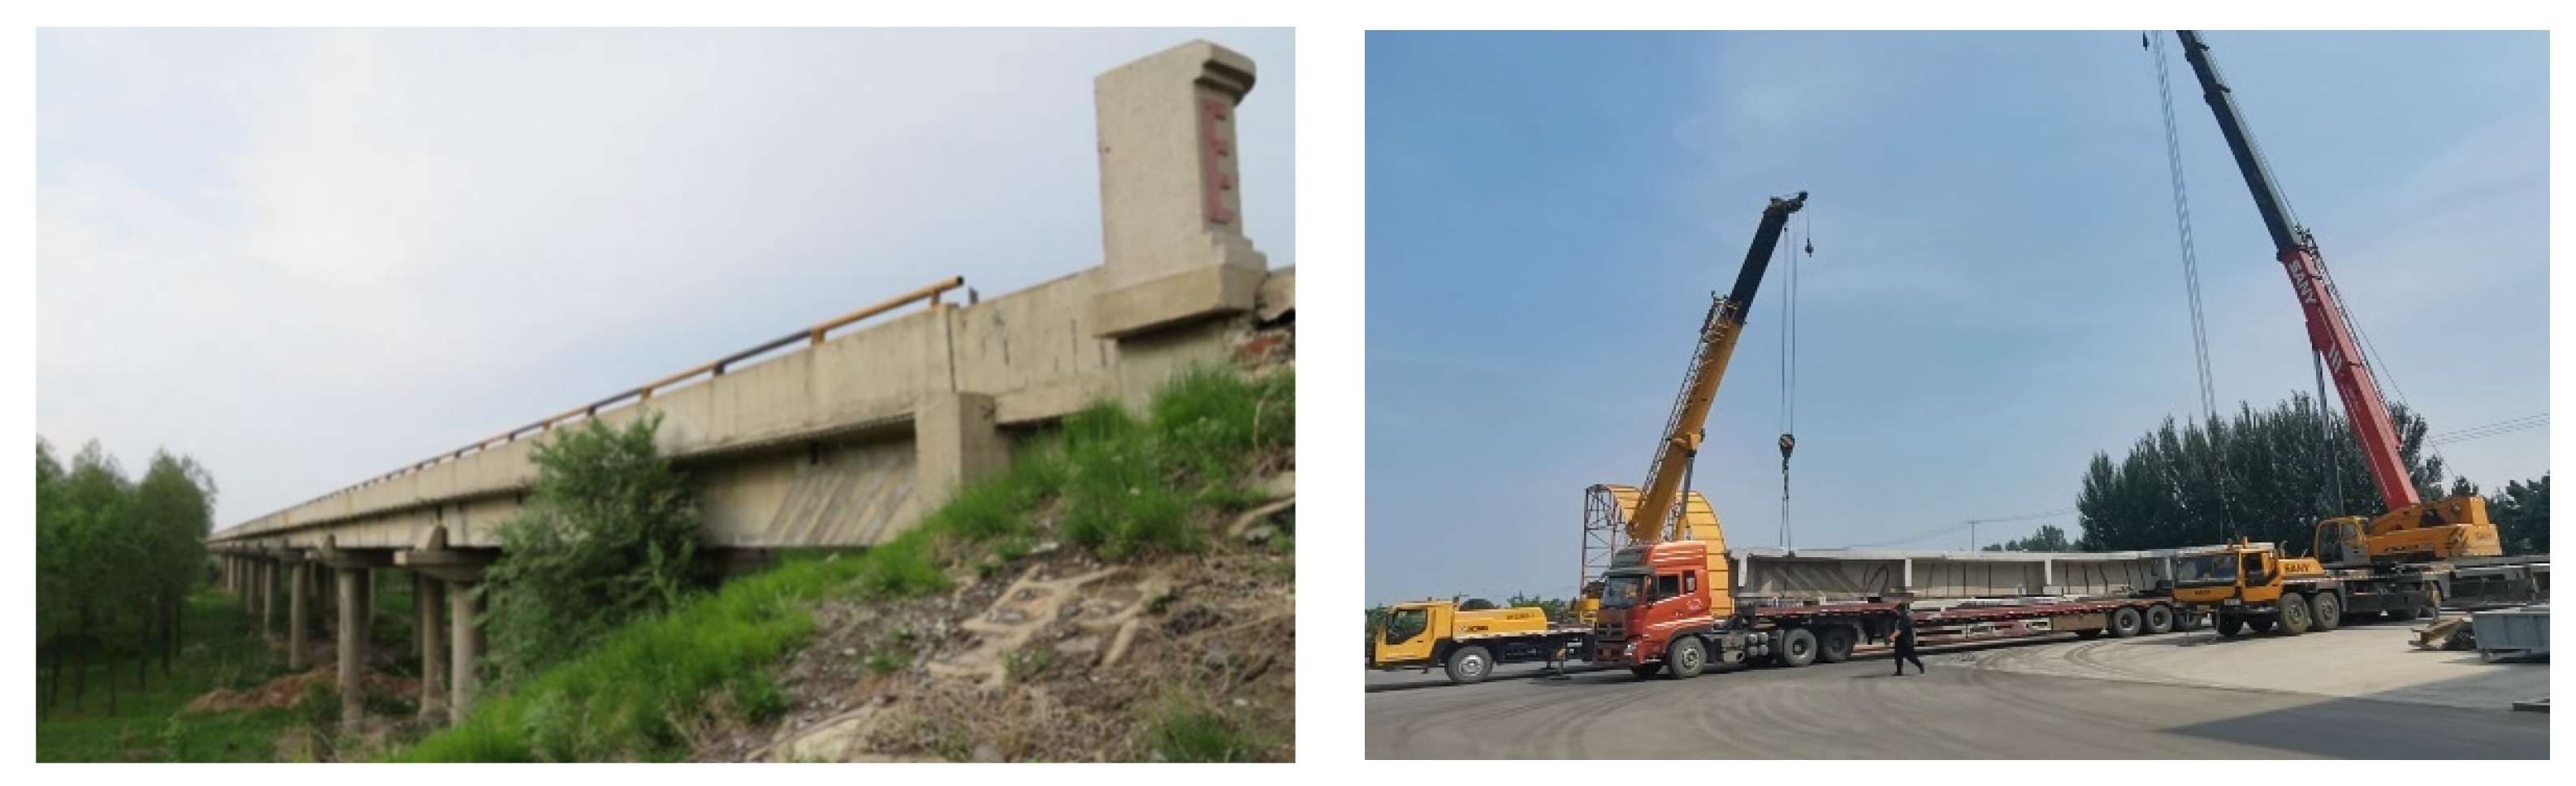
2. Test Specimen
3. Experimental Program
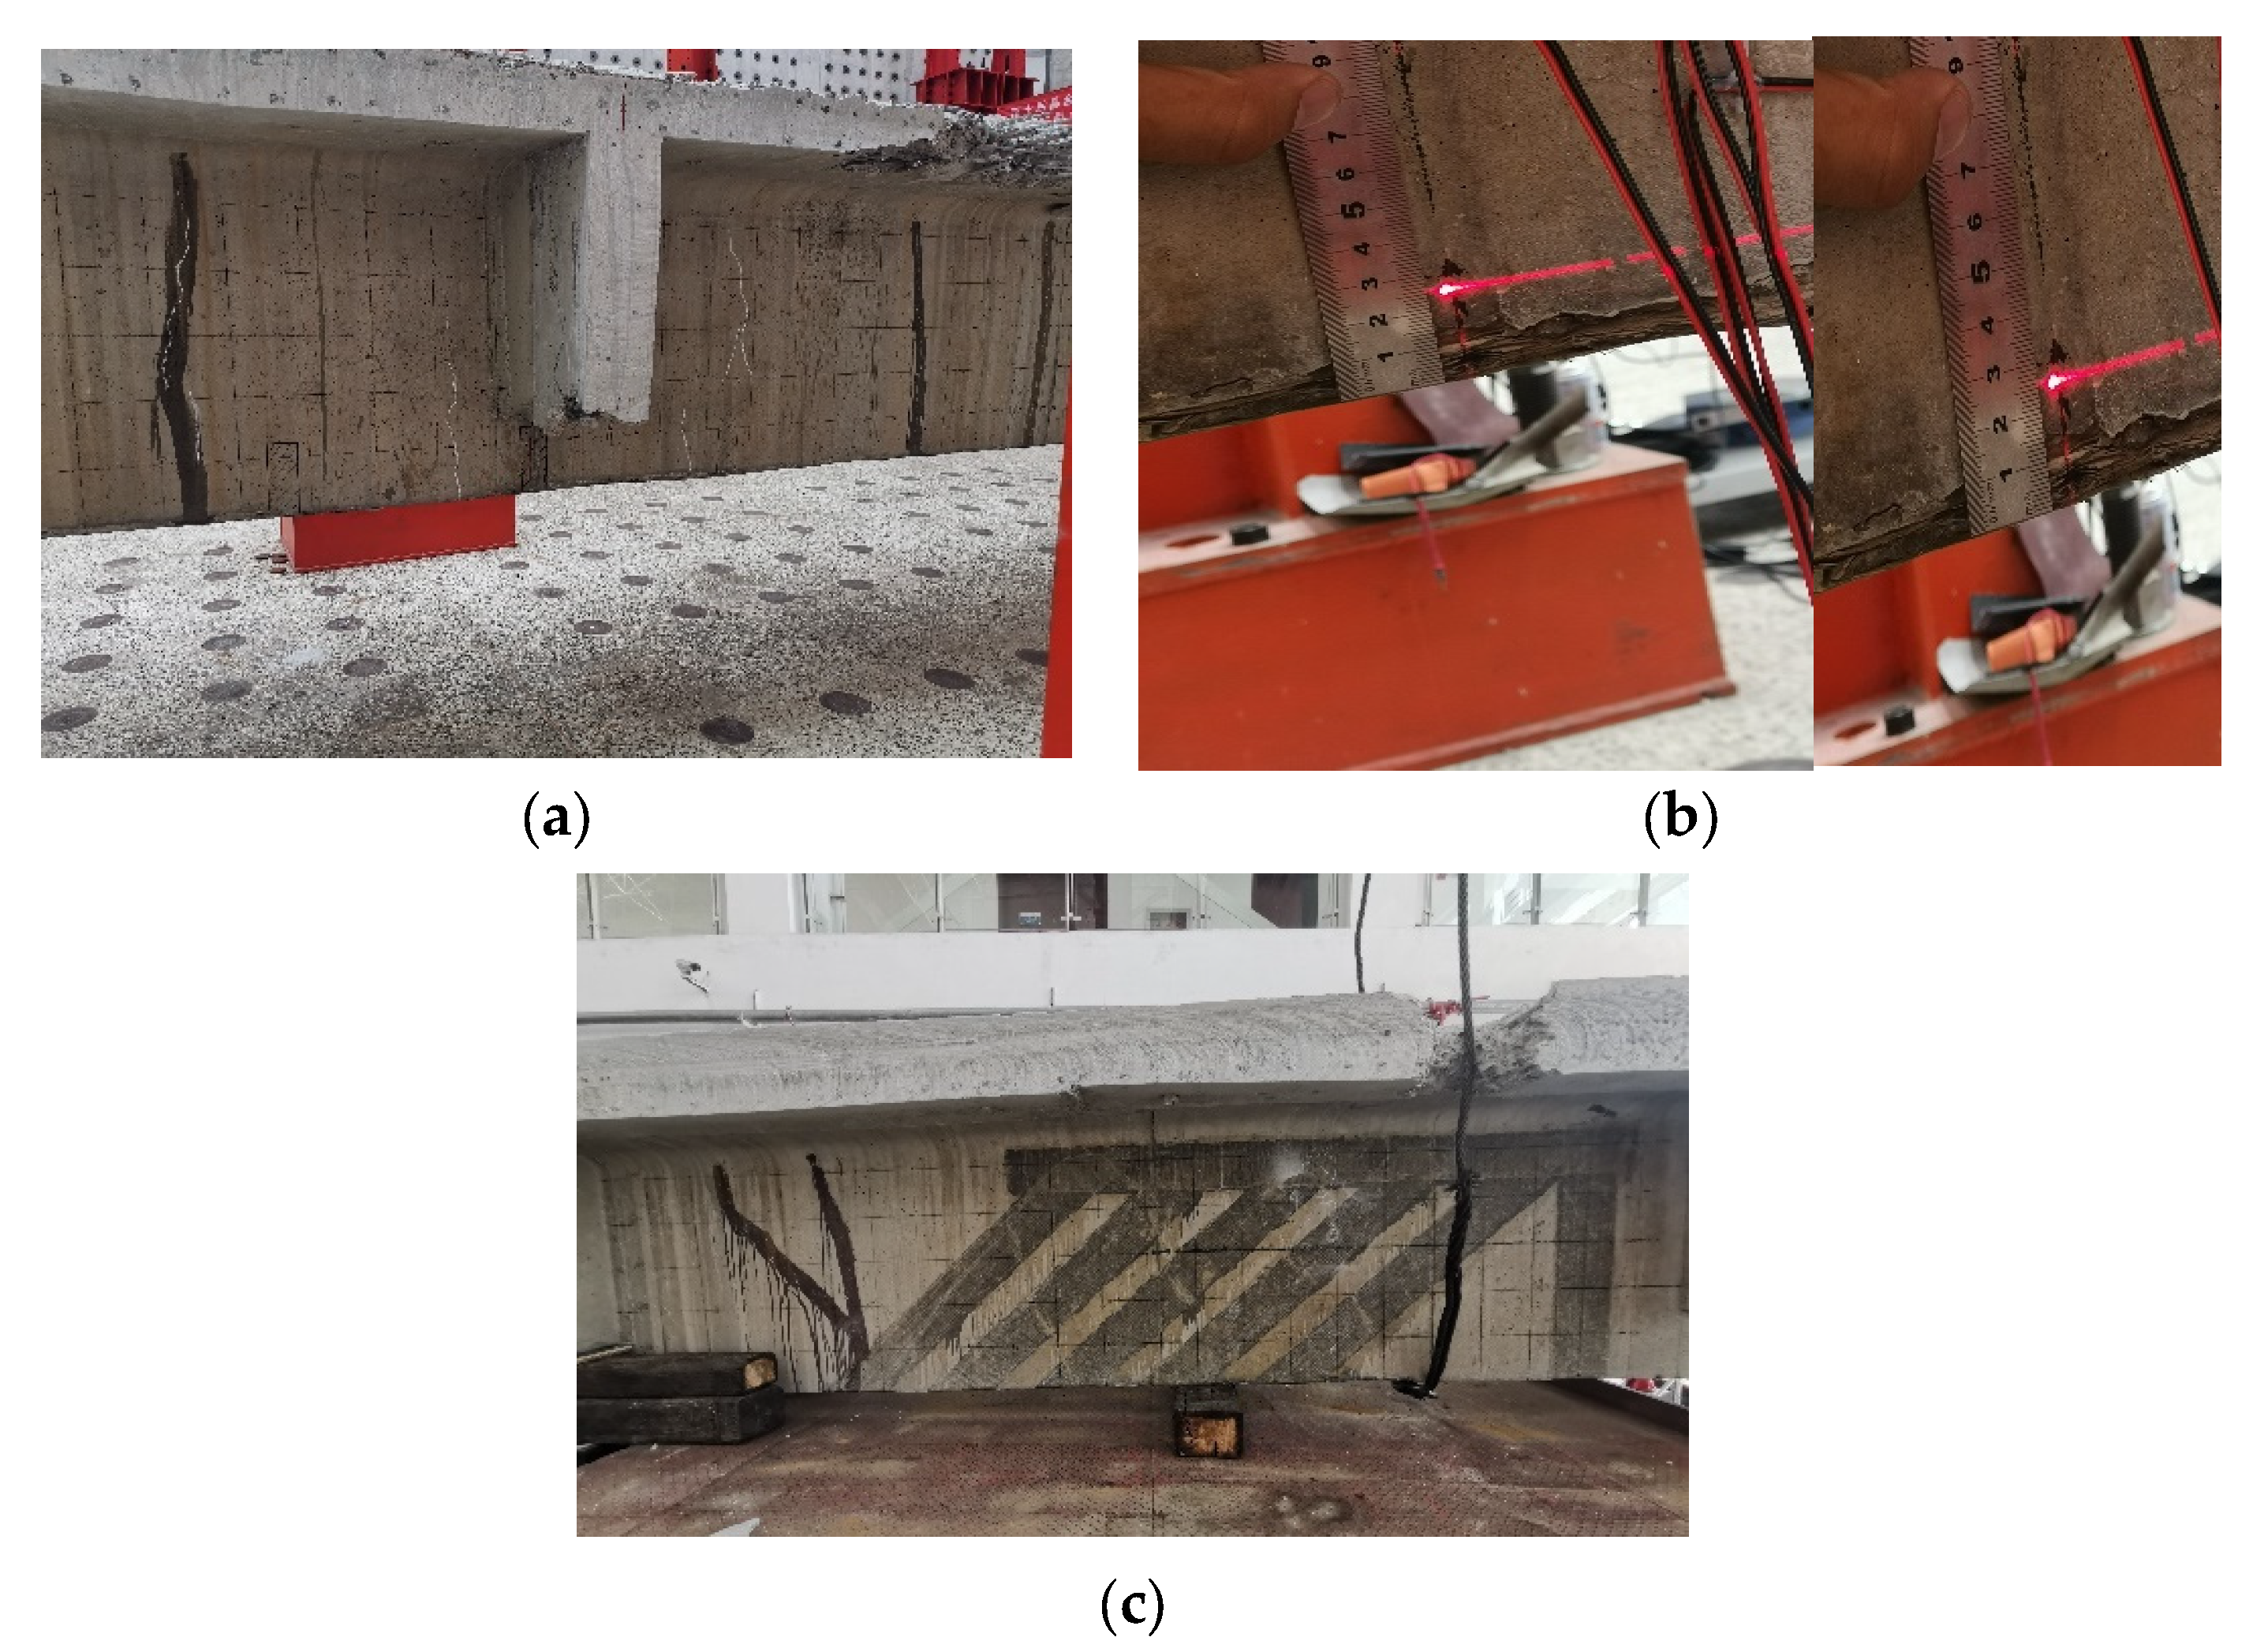
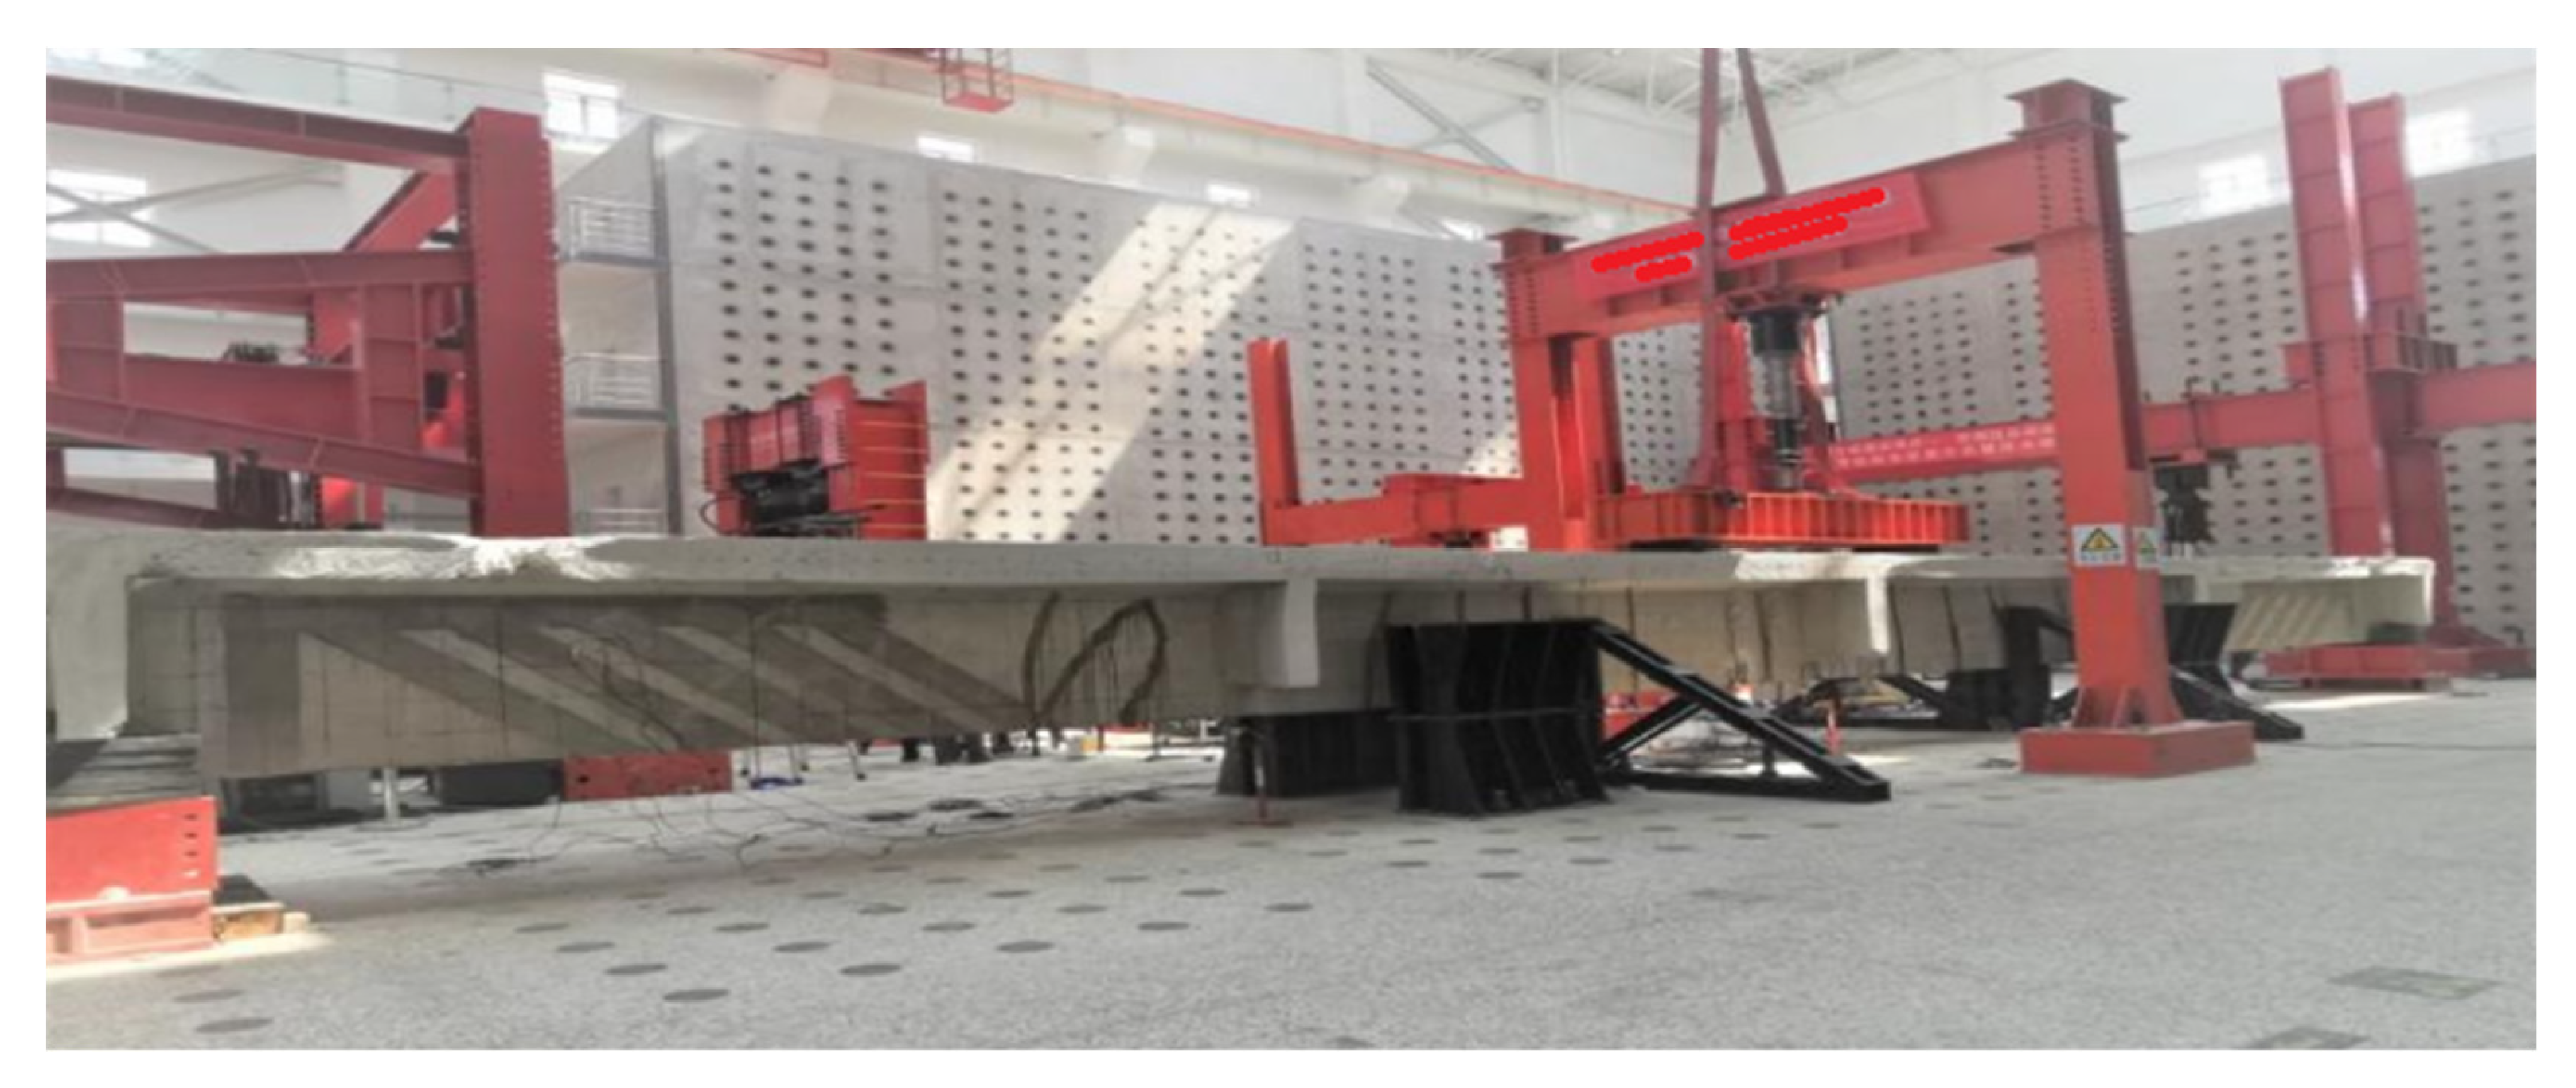
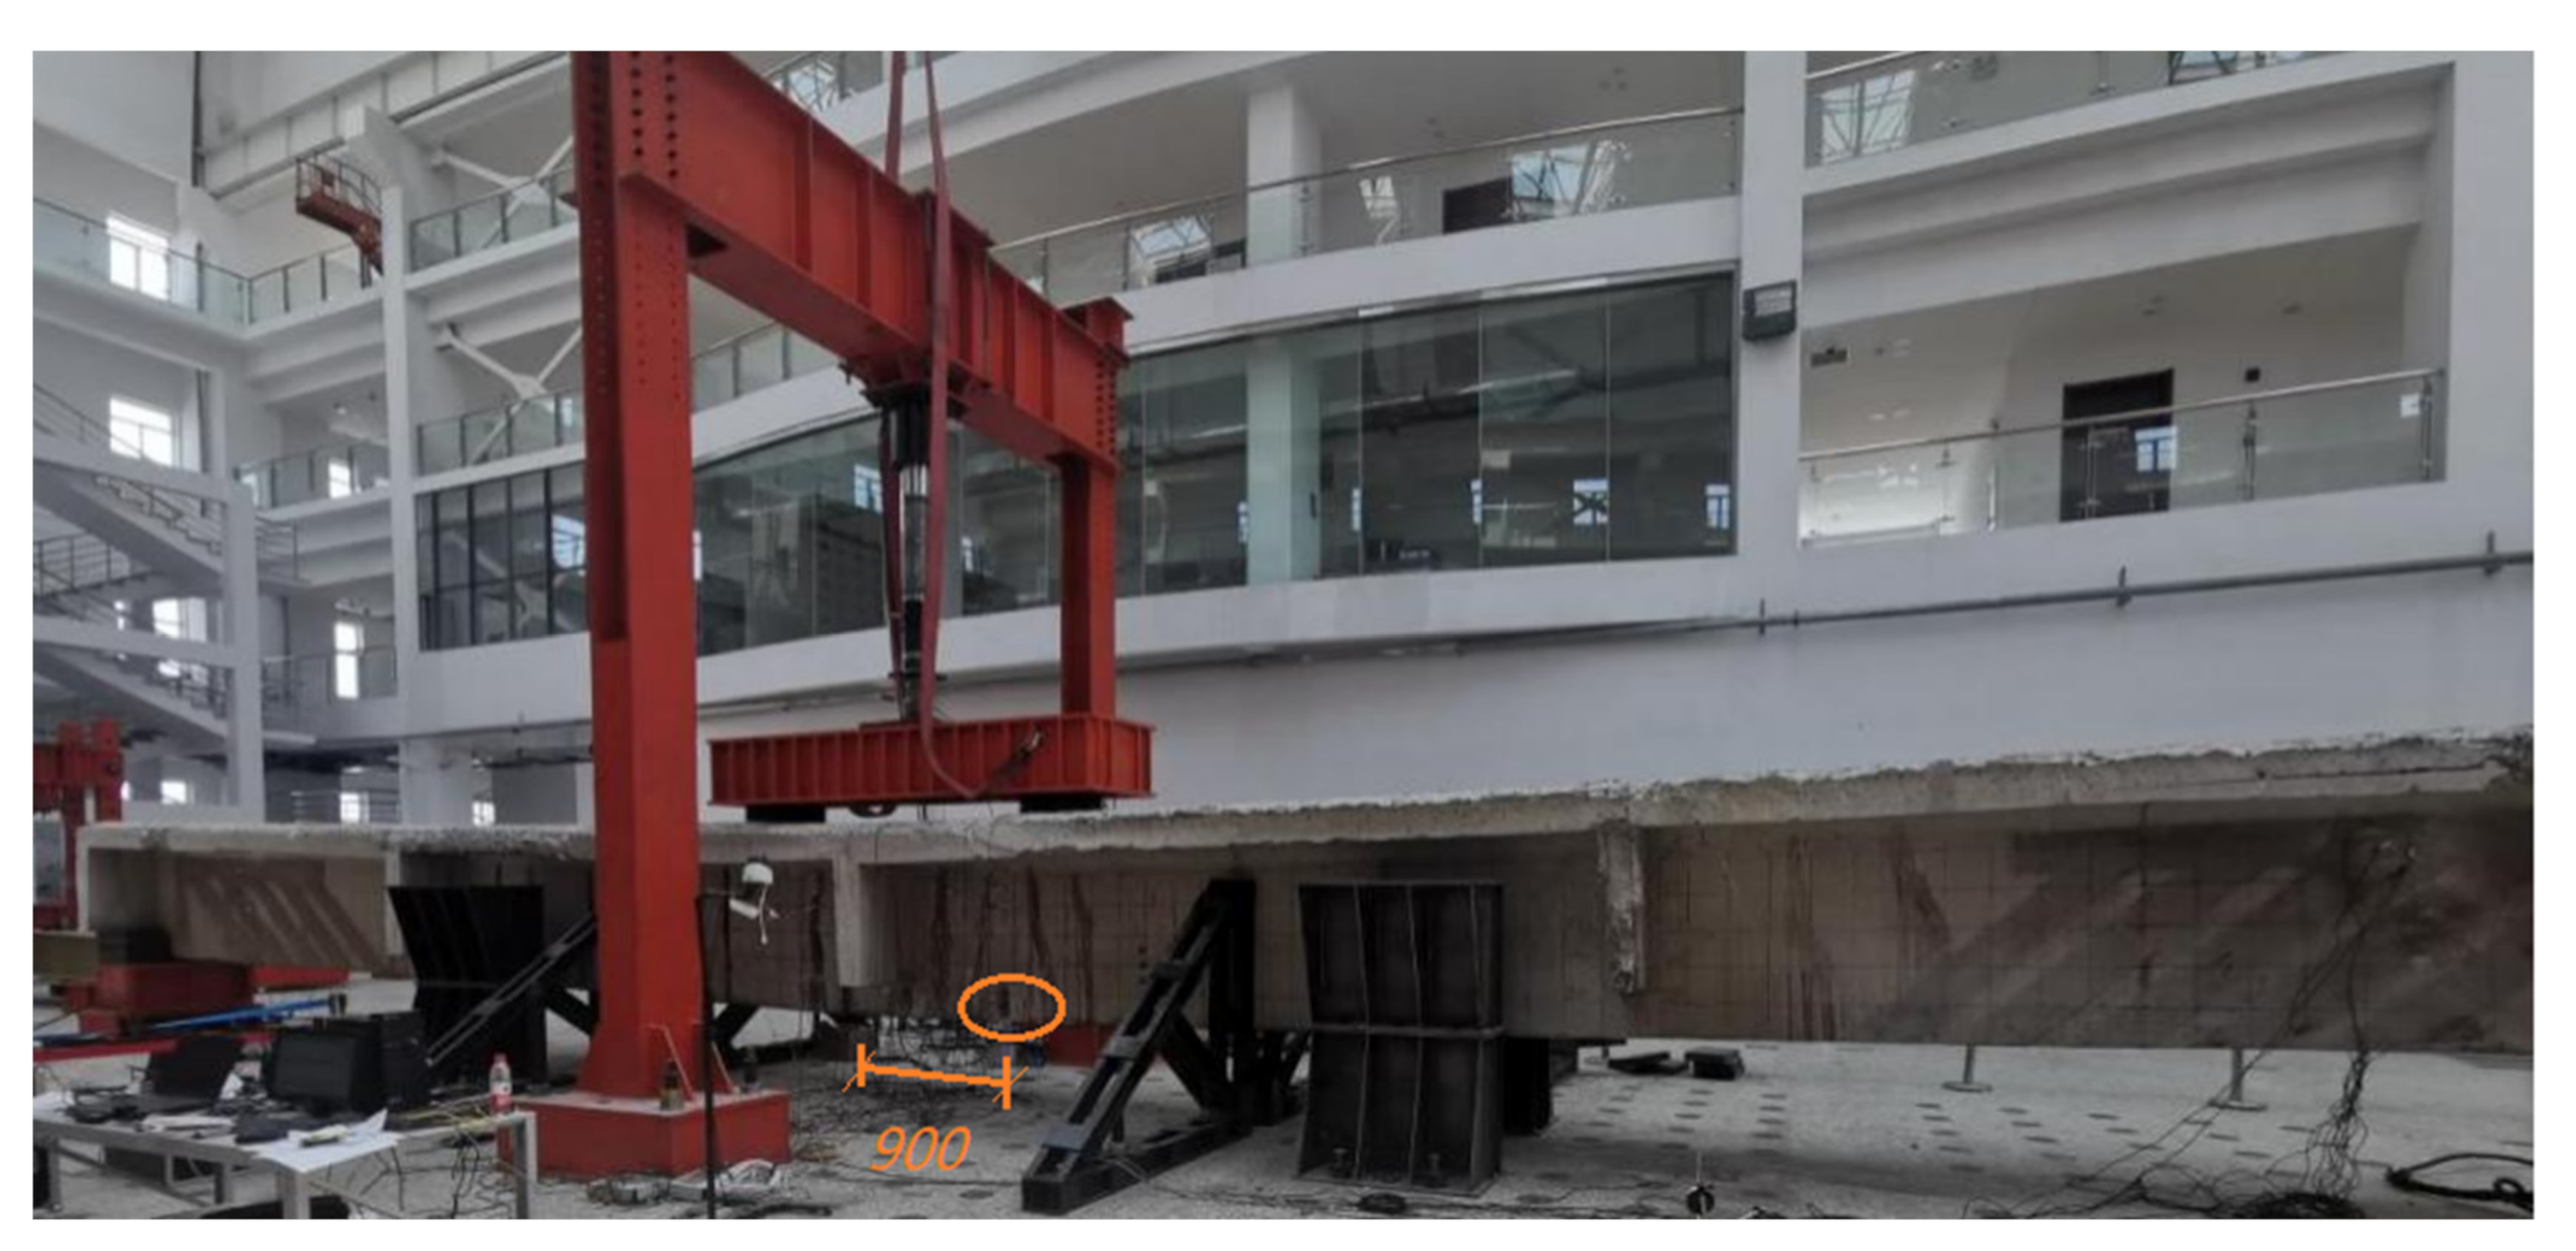
3.1. Test Preparation
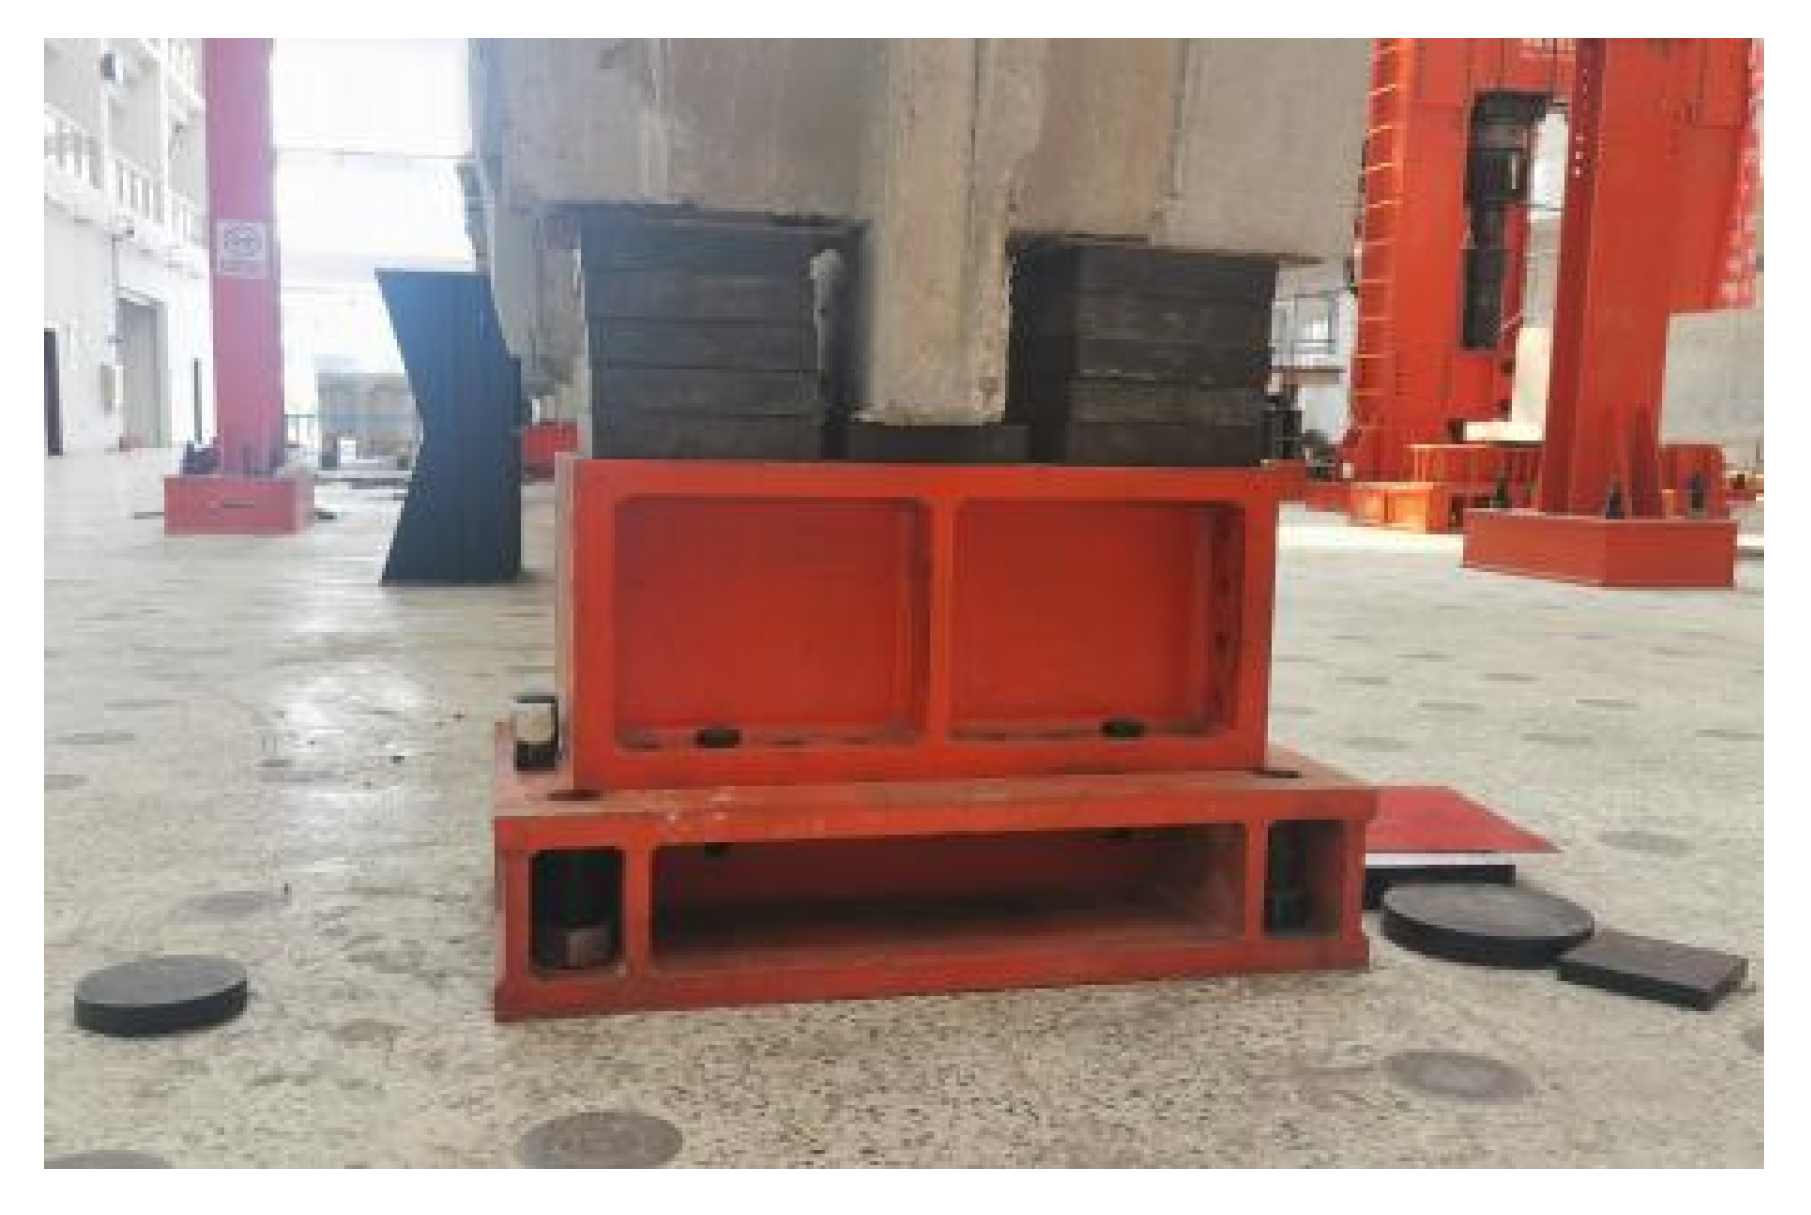
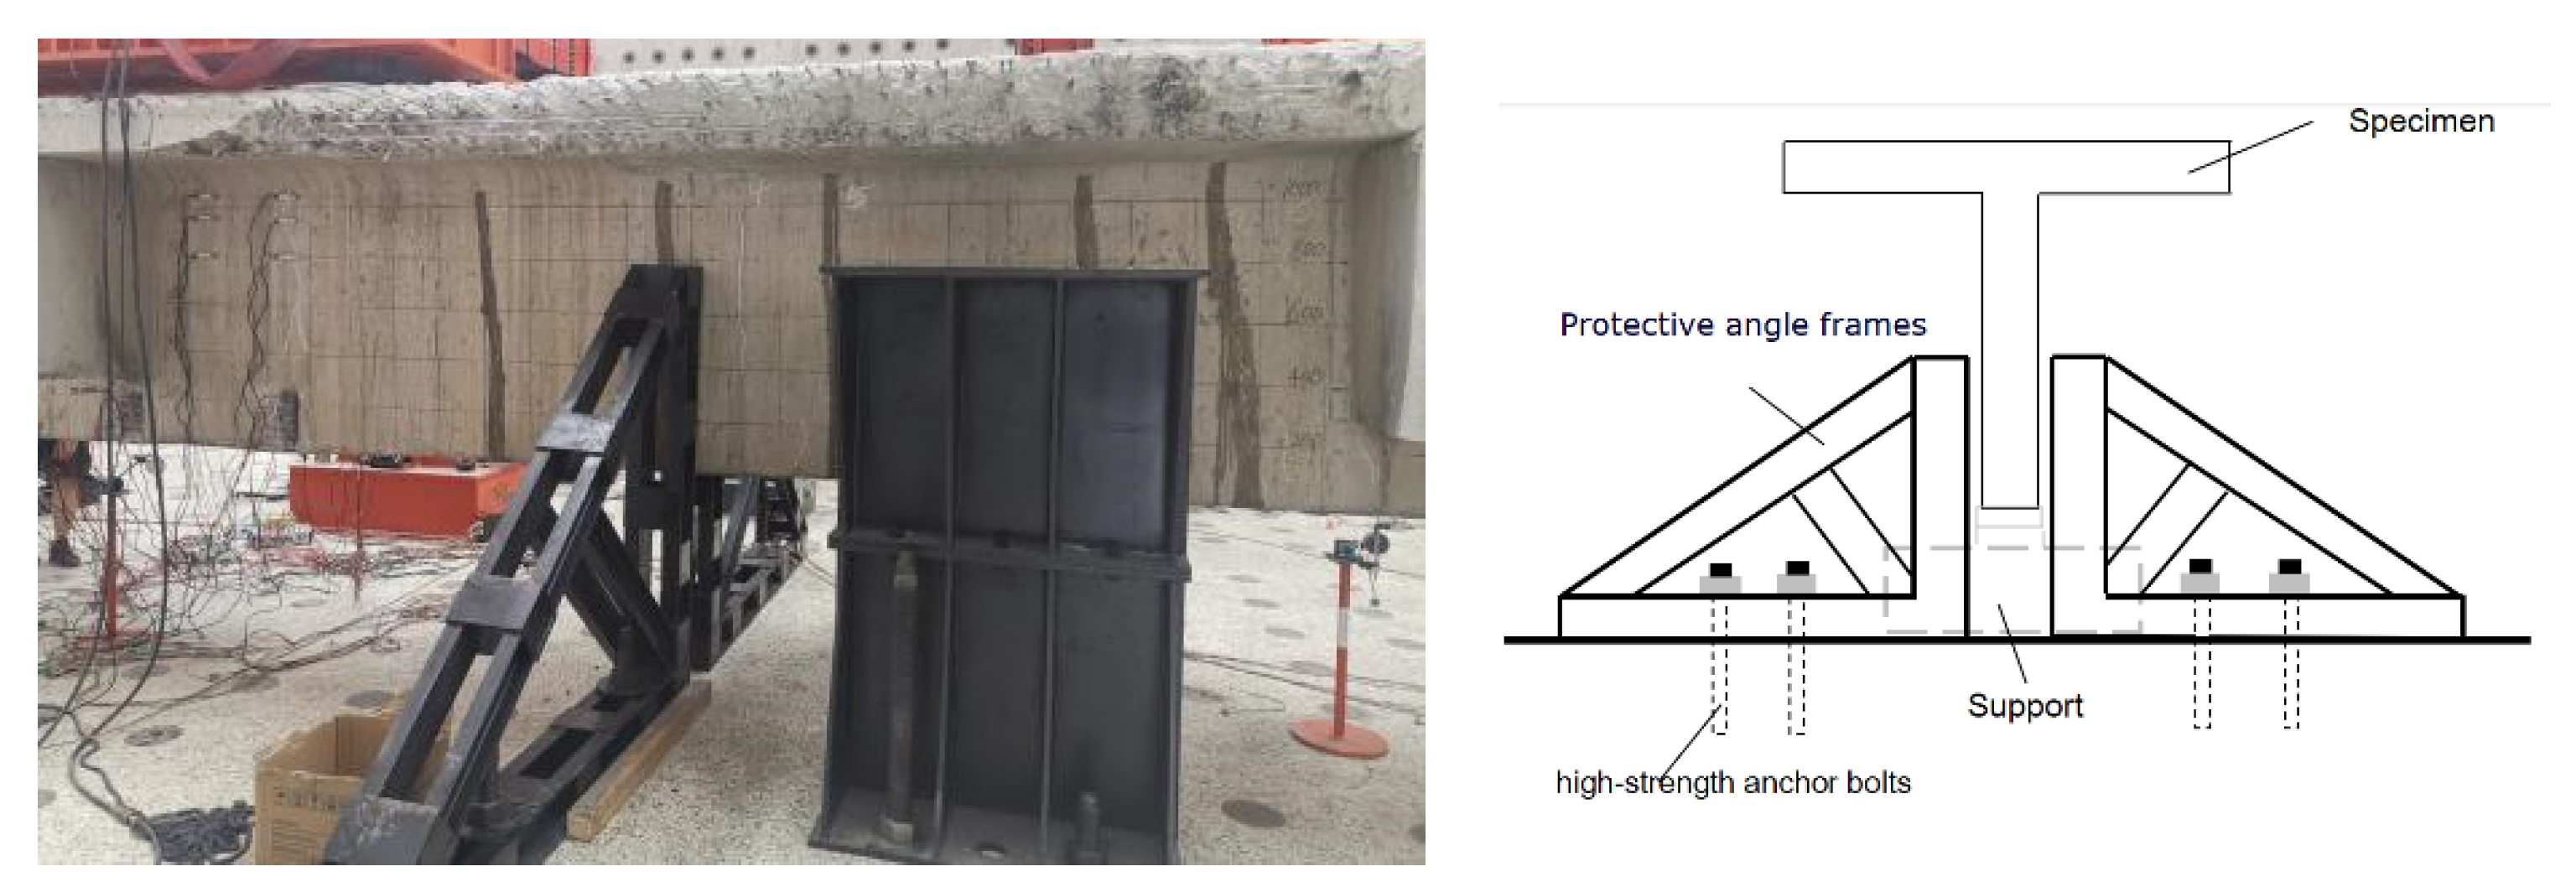
3.2. Test Setup
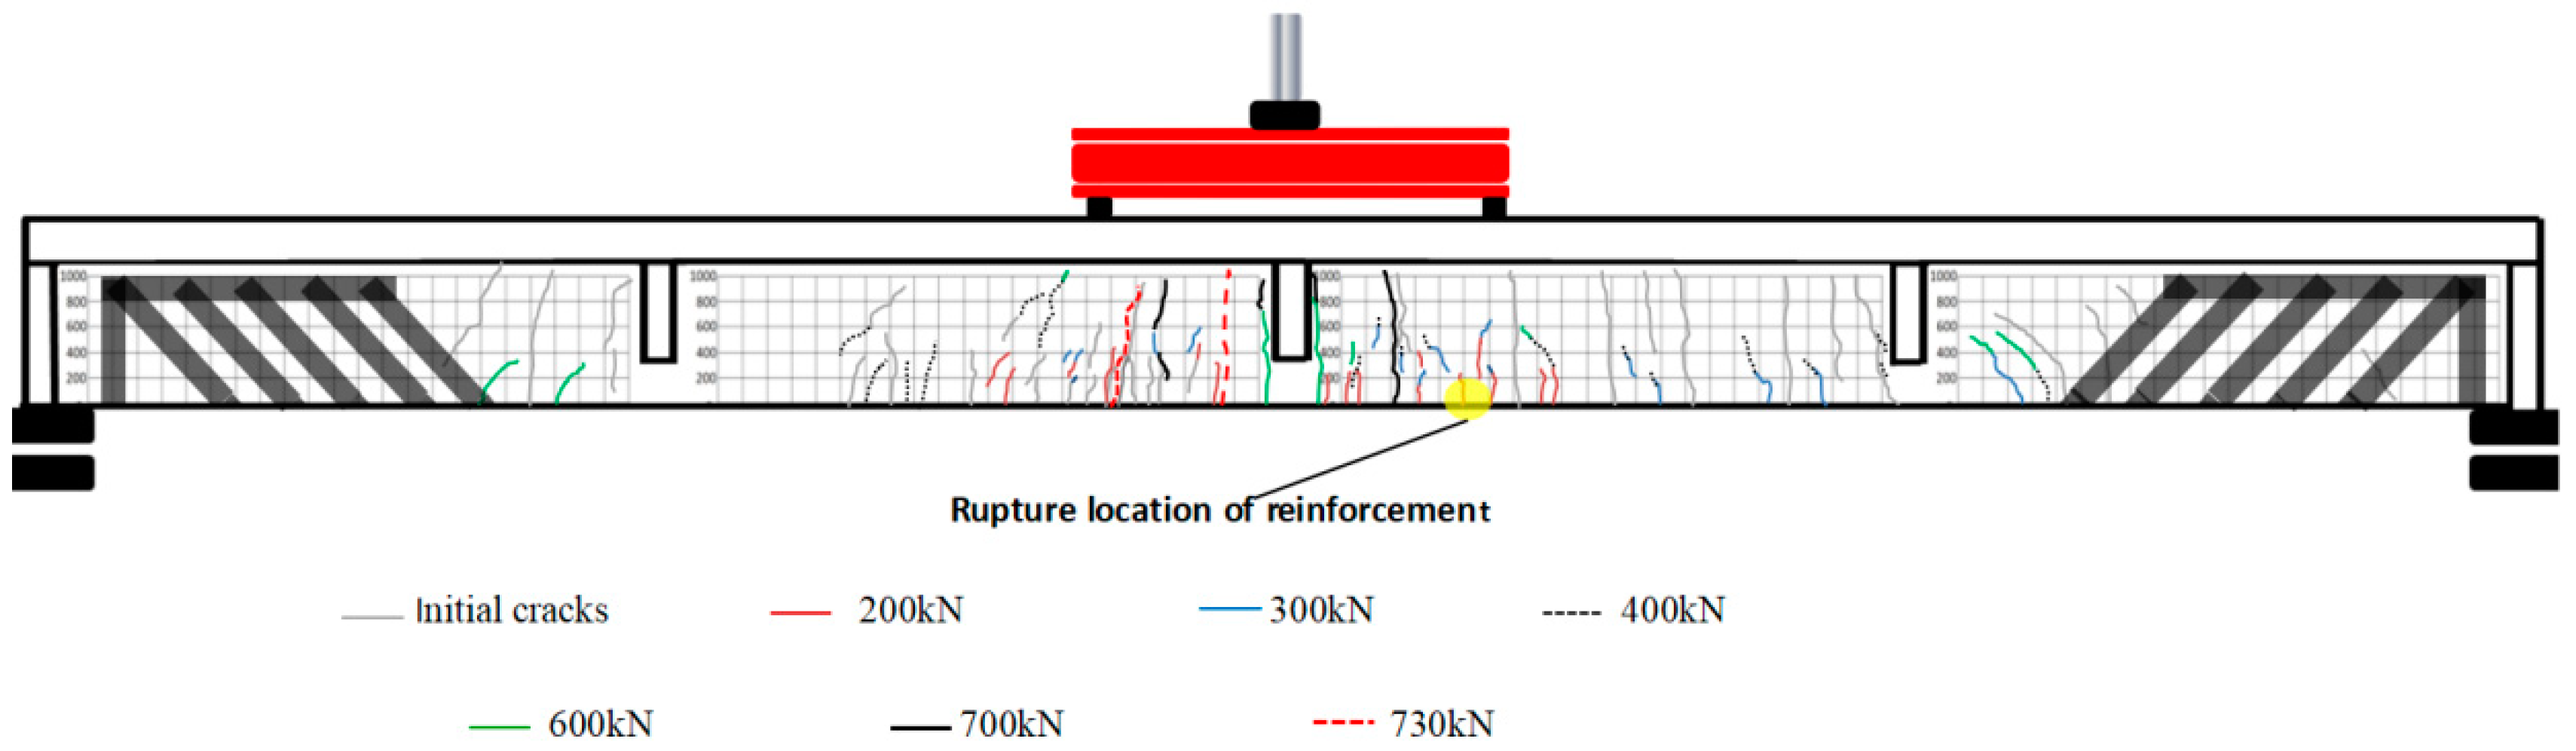
3.3. Experimental Procedure
4. Analysis and Discussion
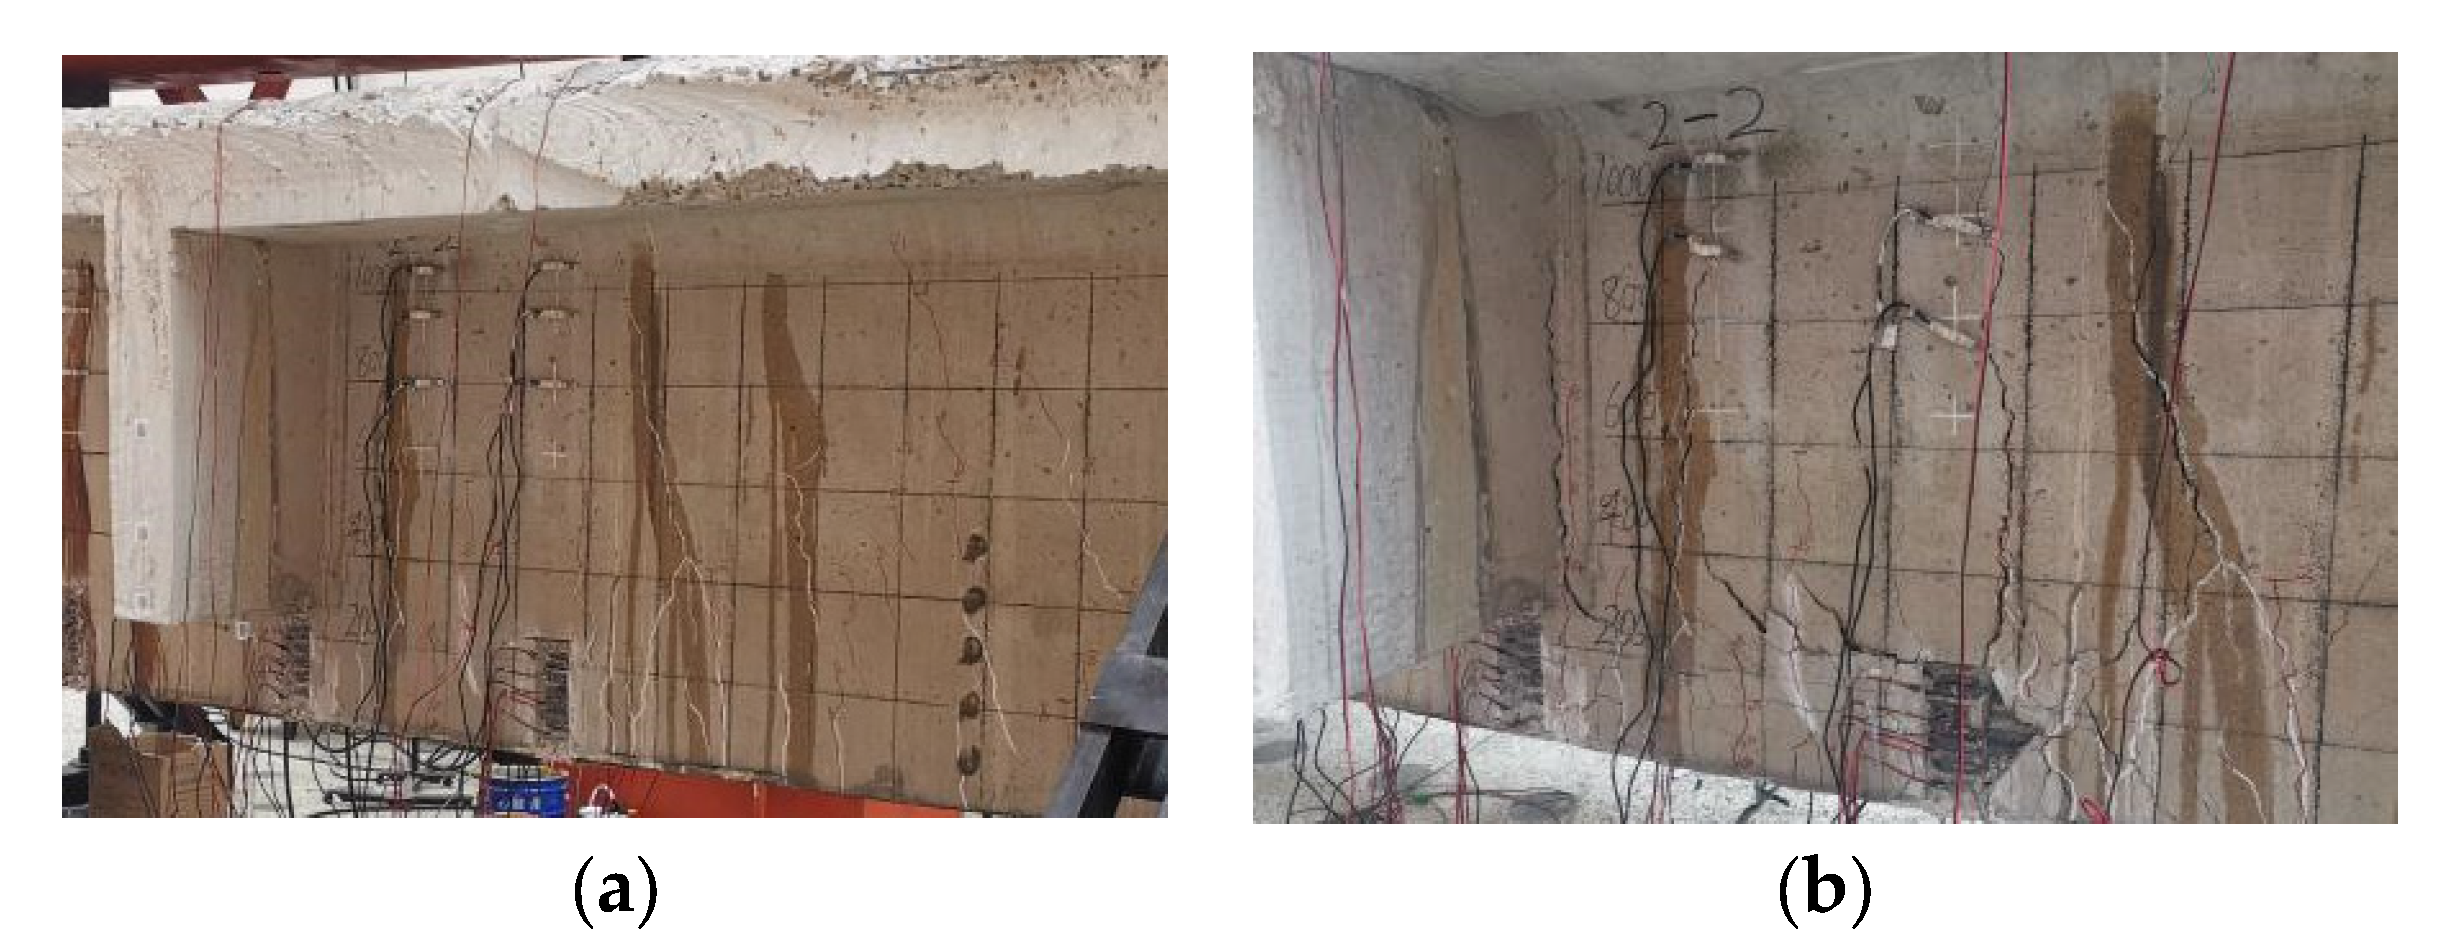
4.1. Analysis of Experimental Results
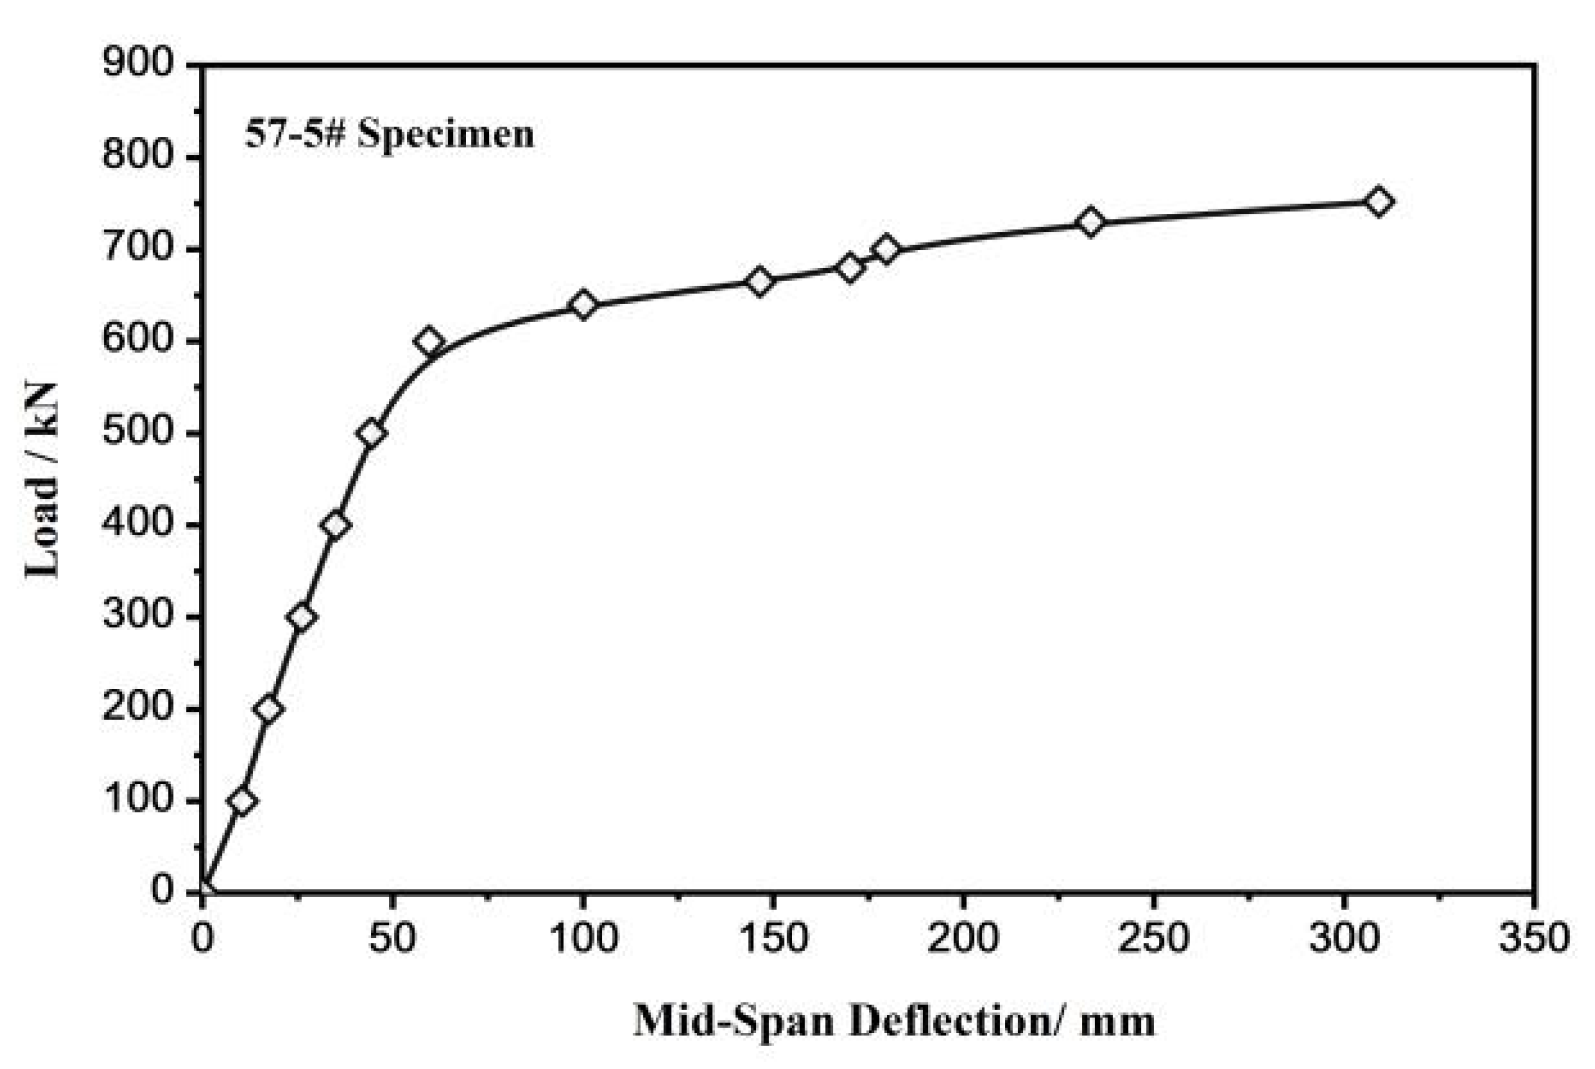
4.1.1. Load-Deflection Curve
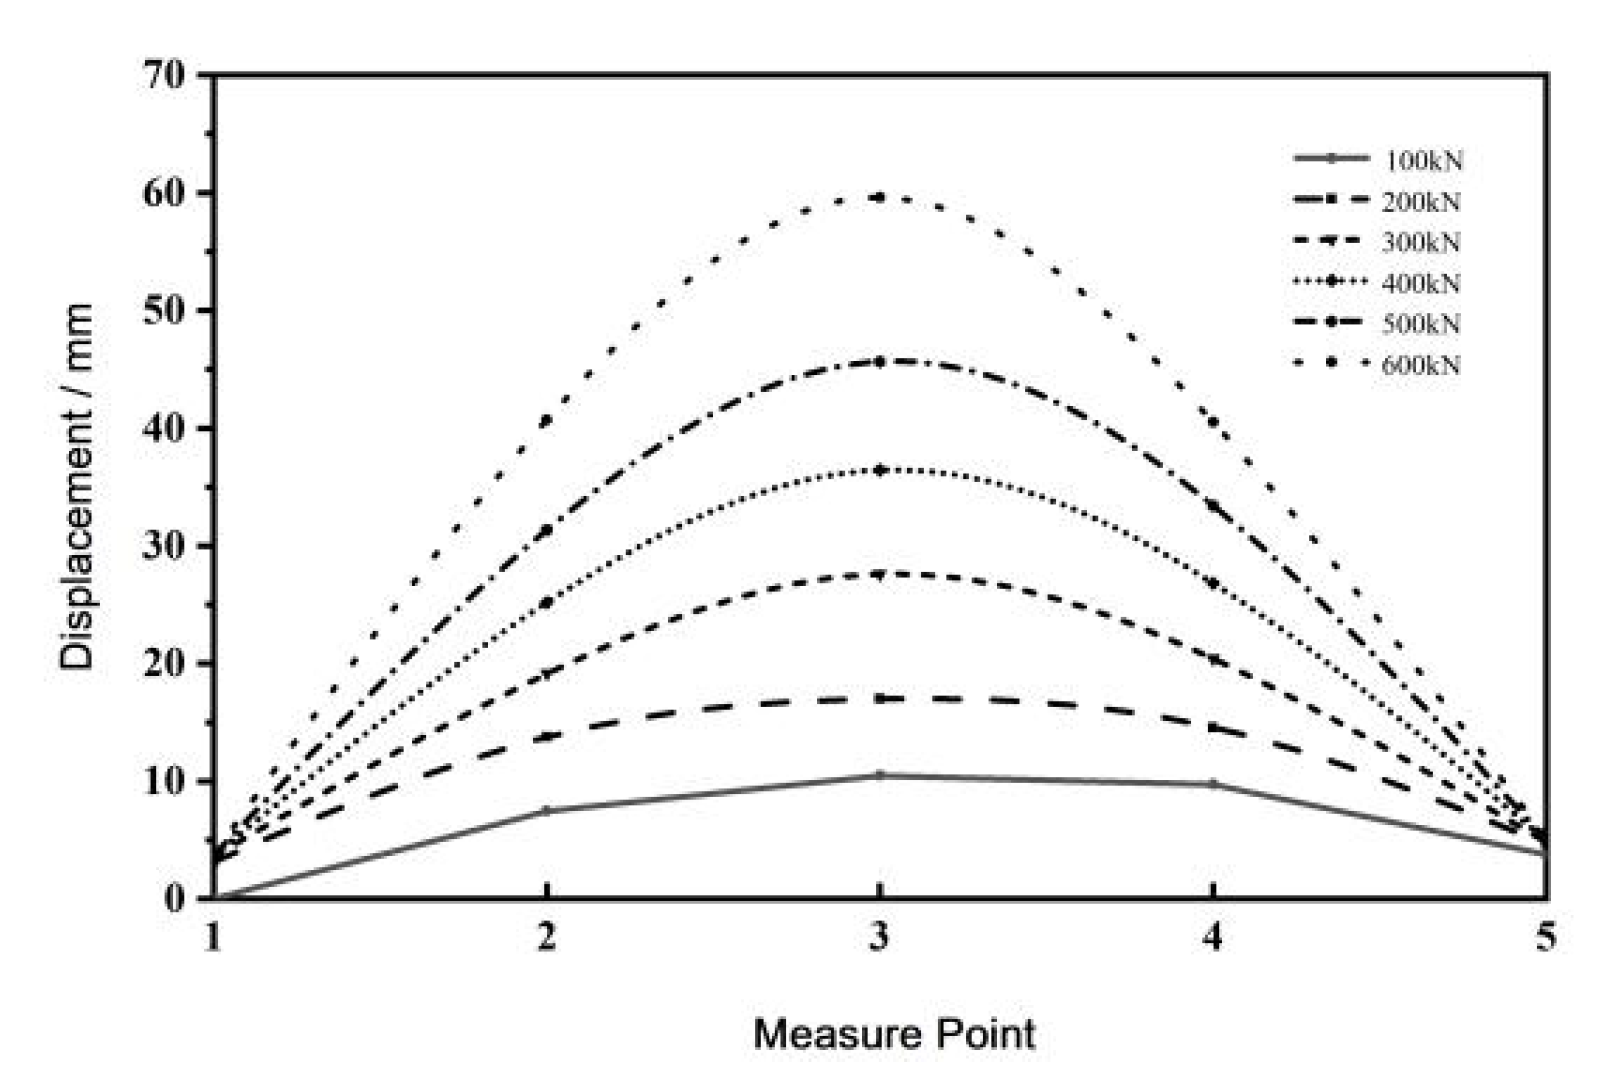
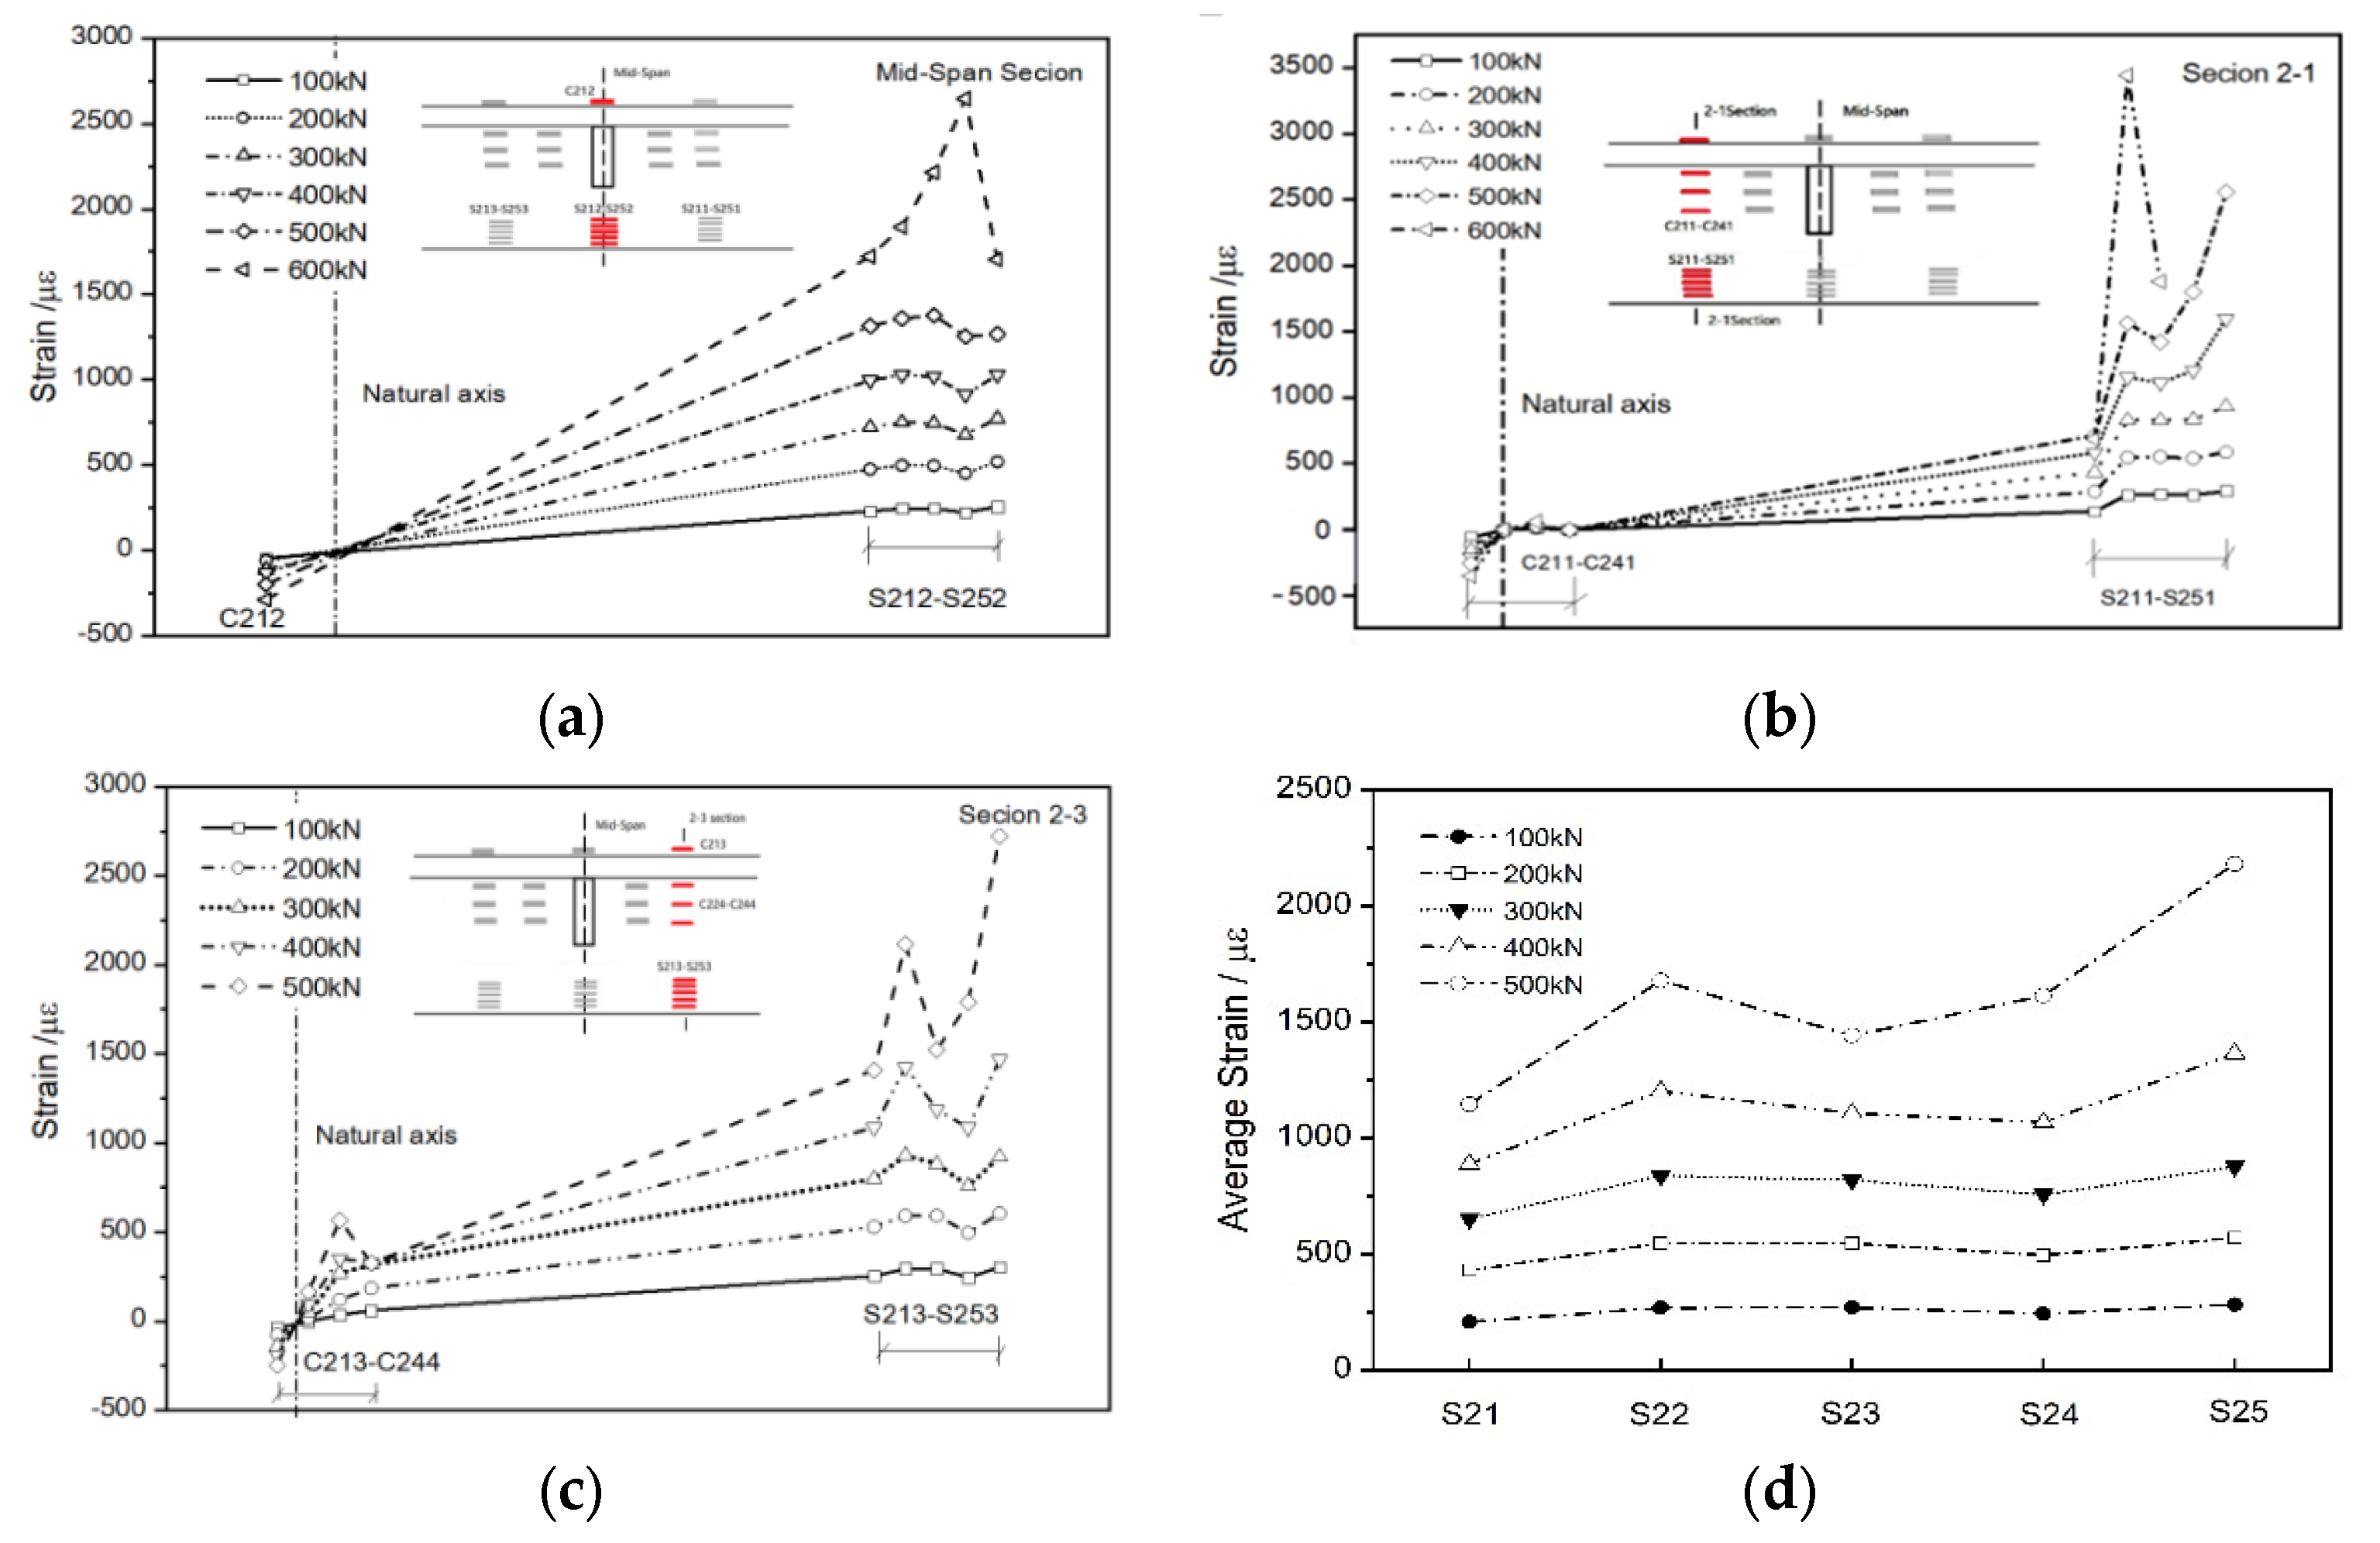
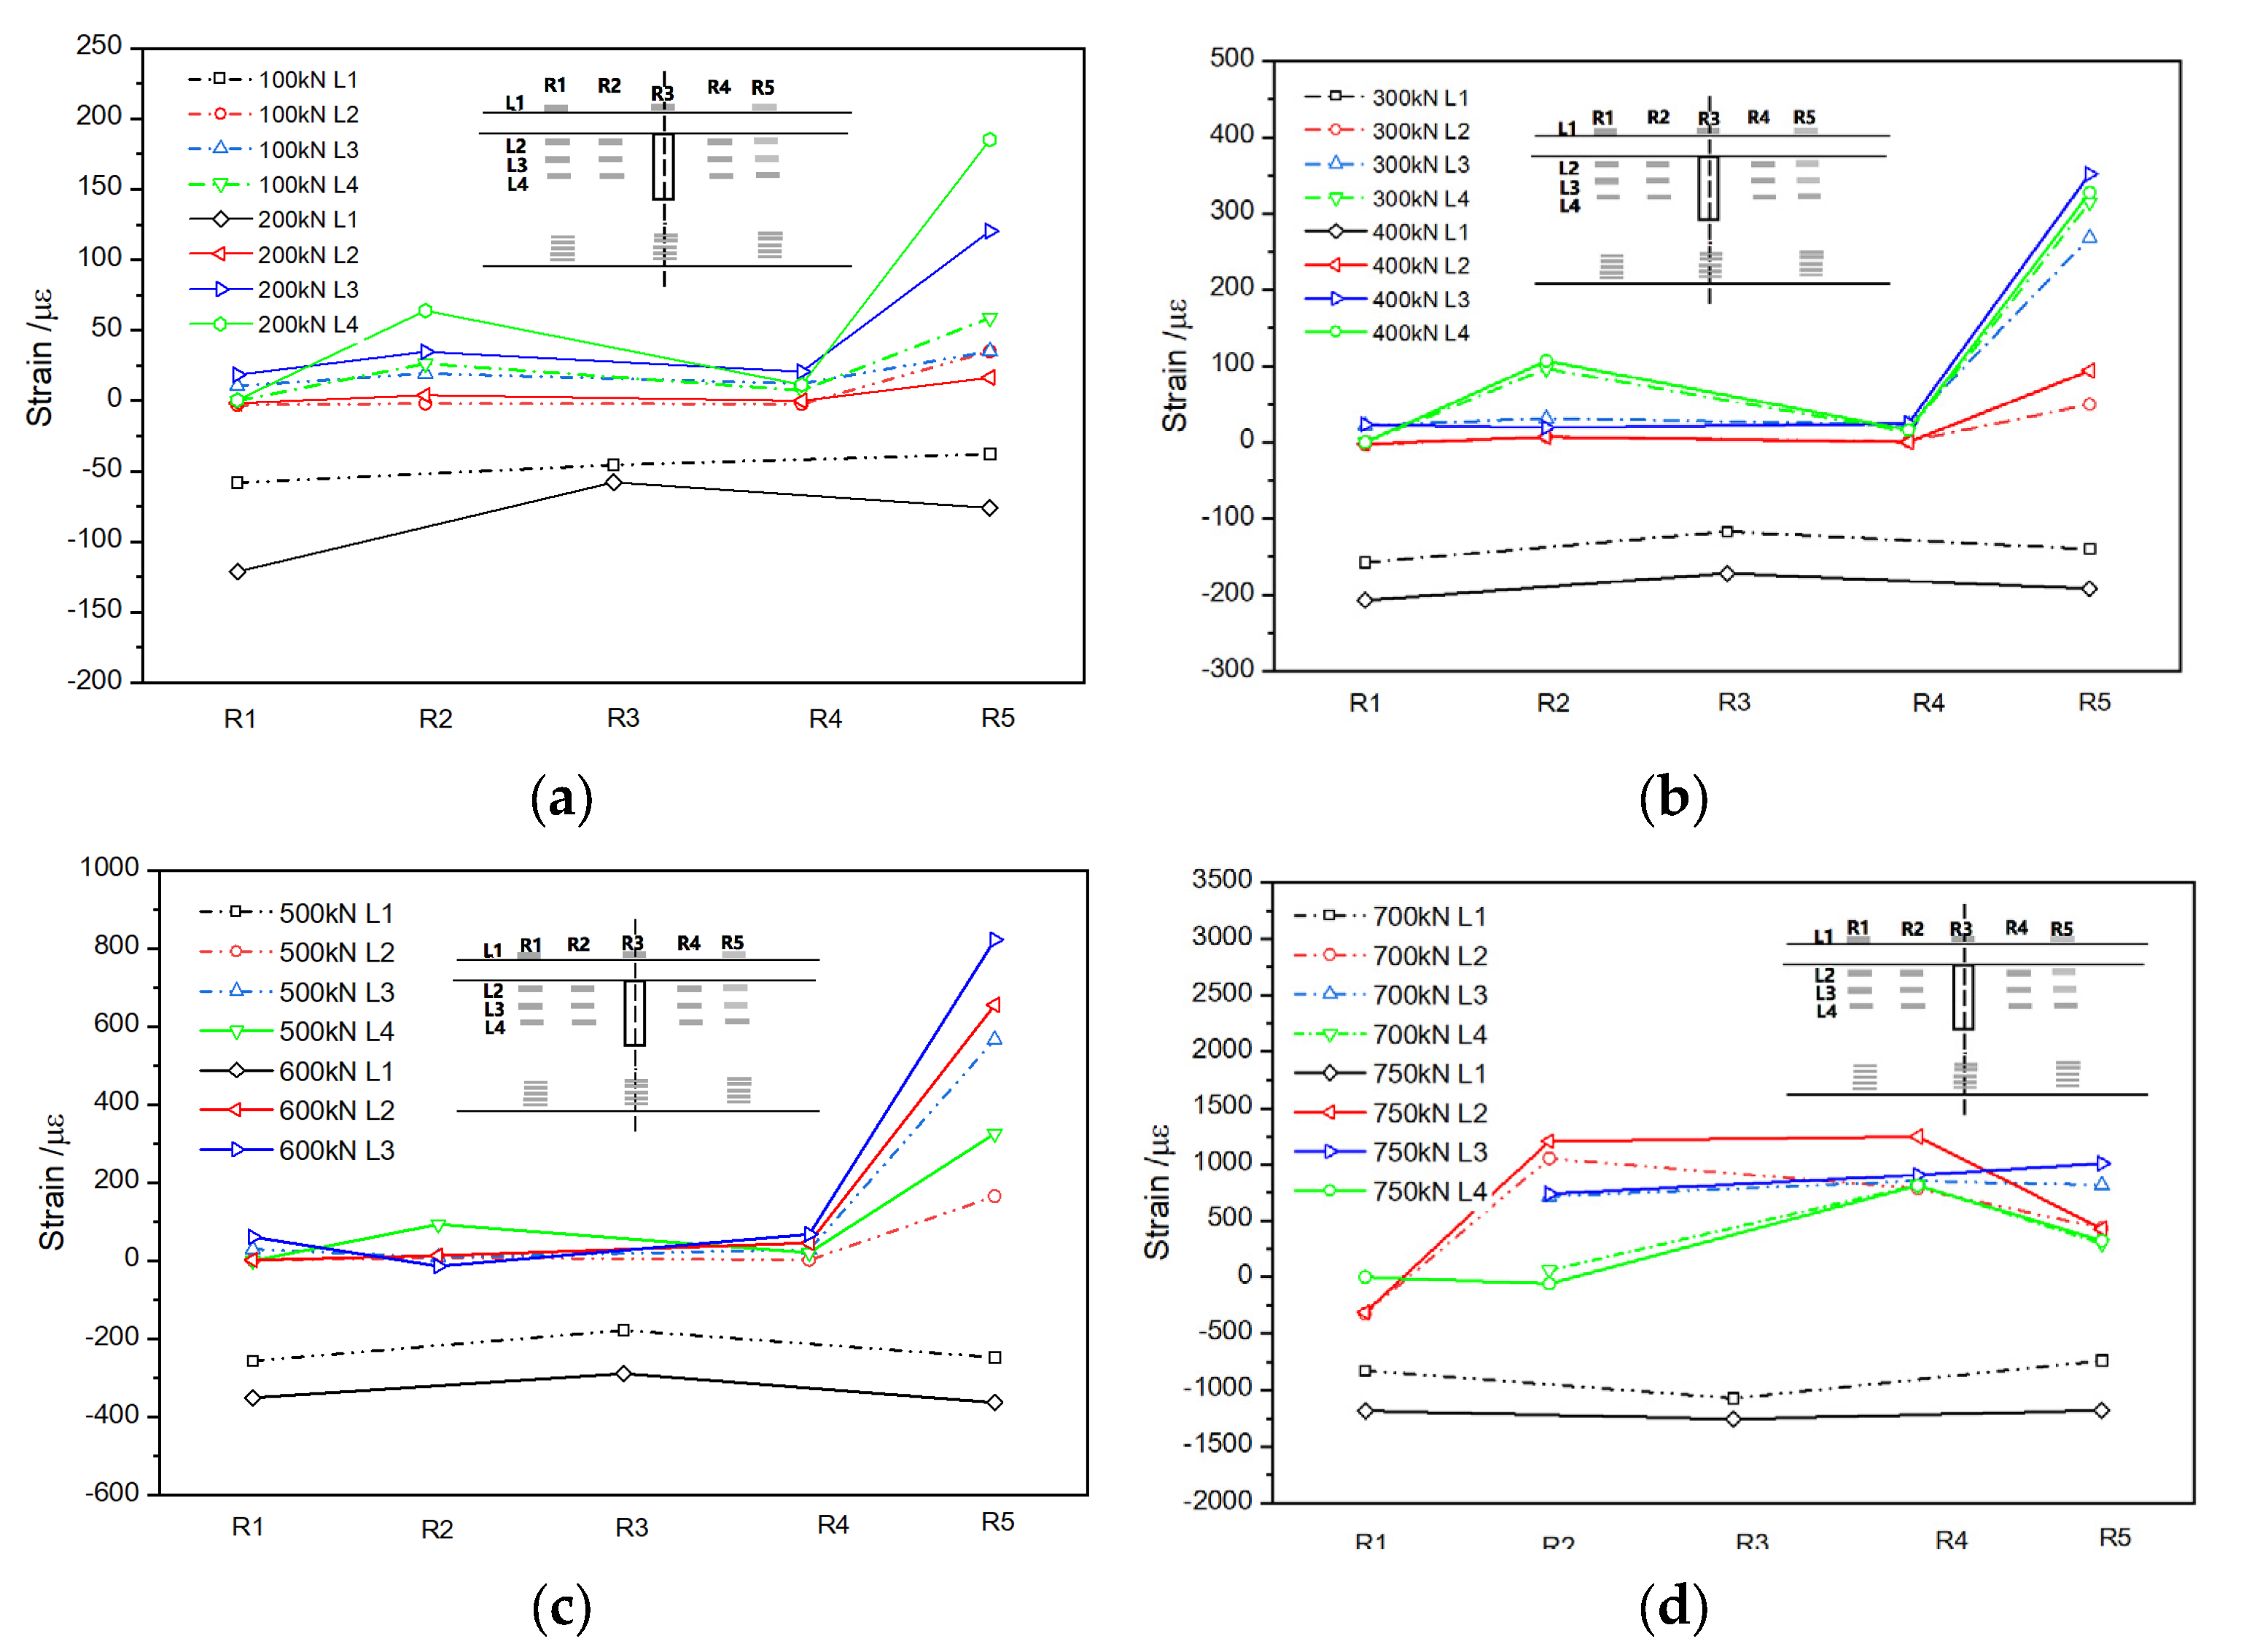
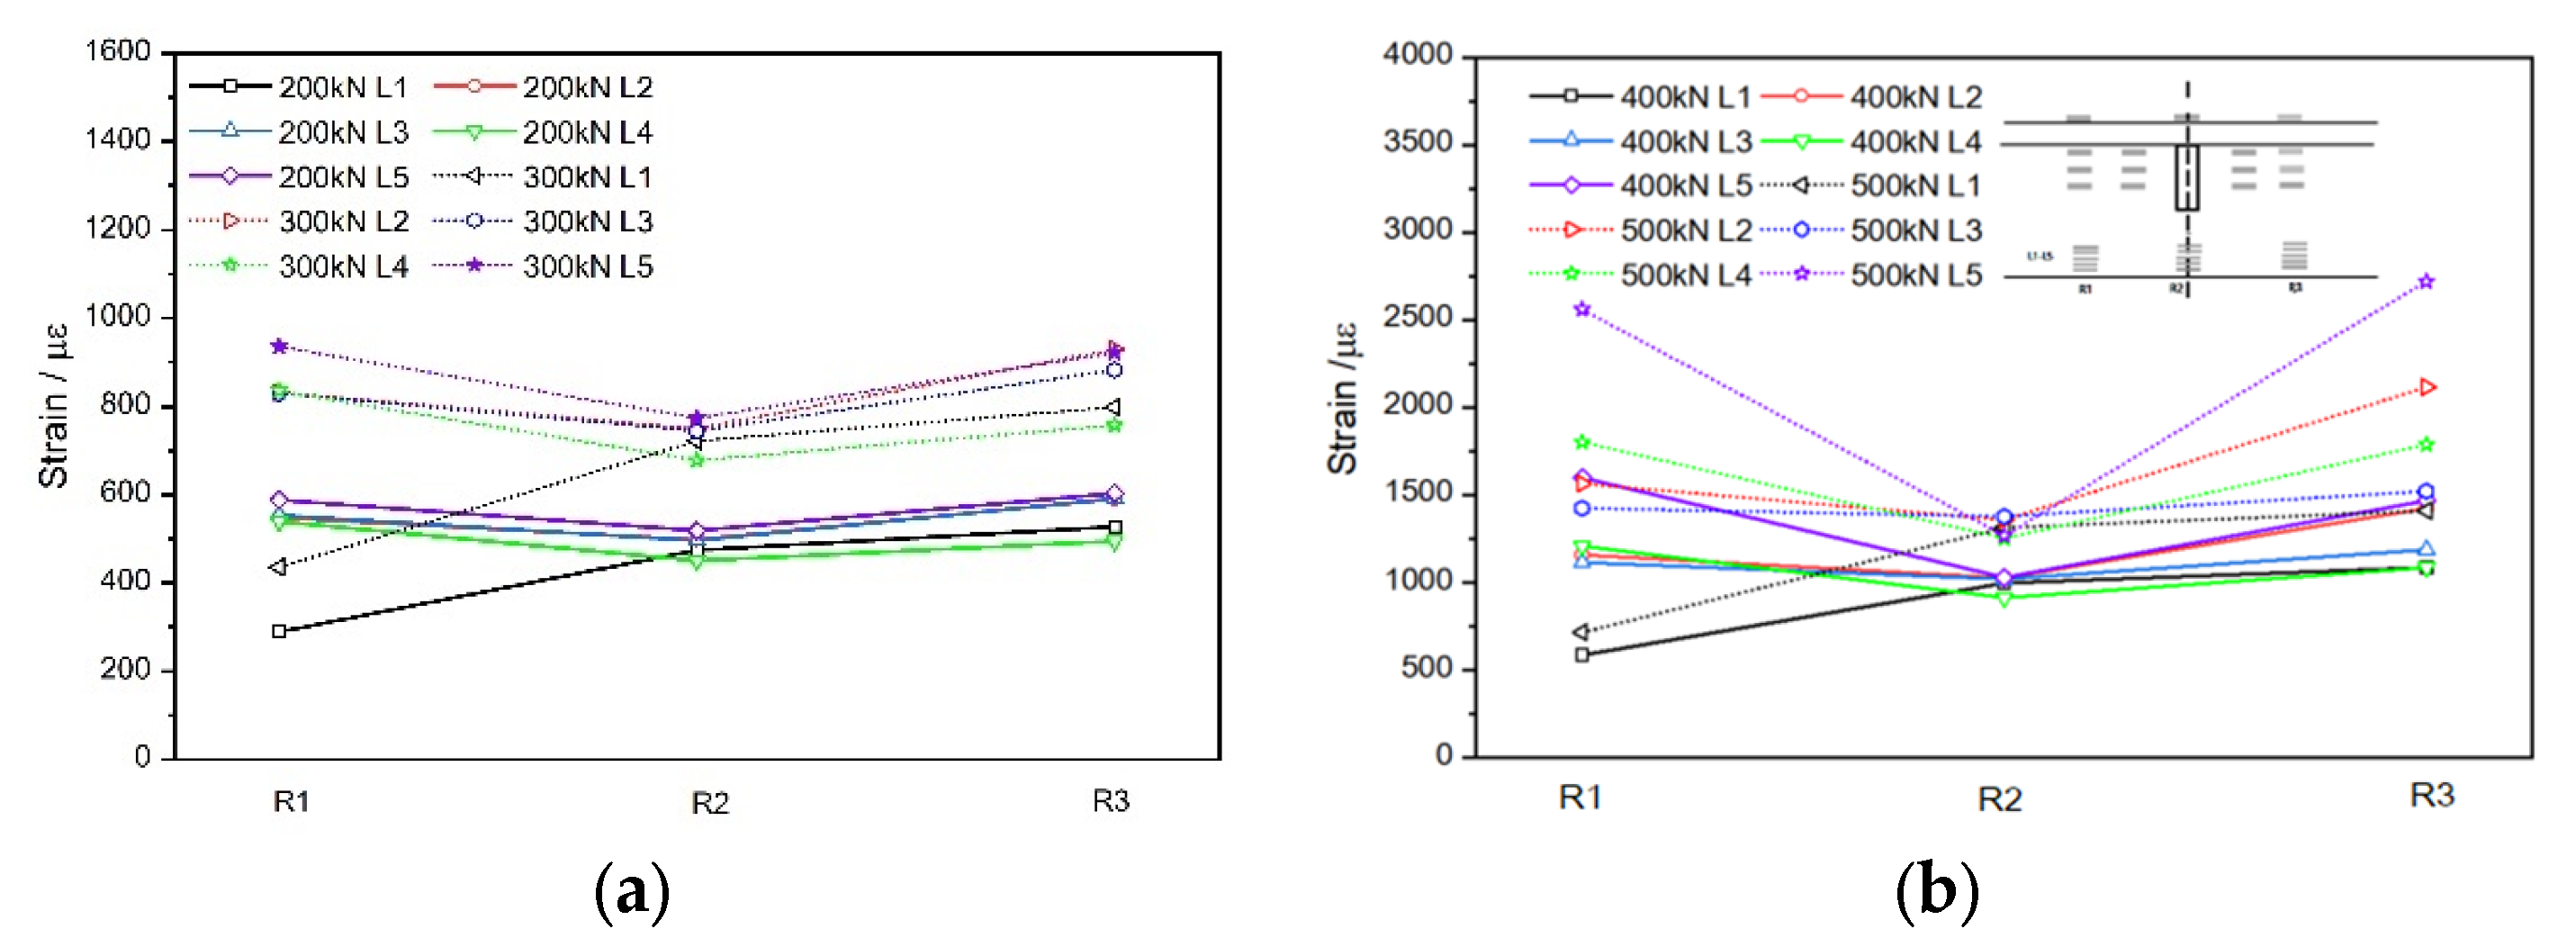
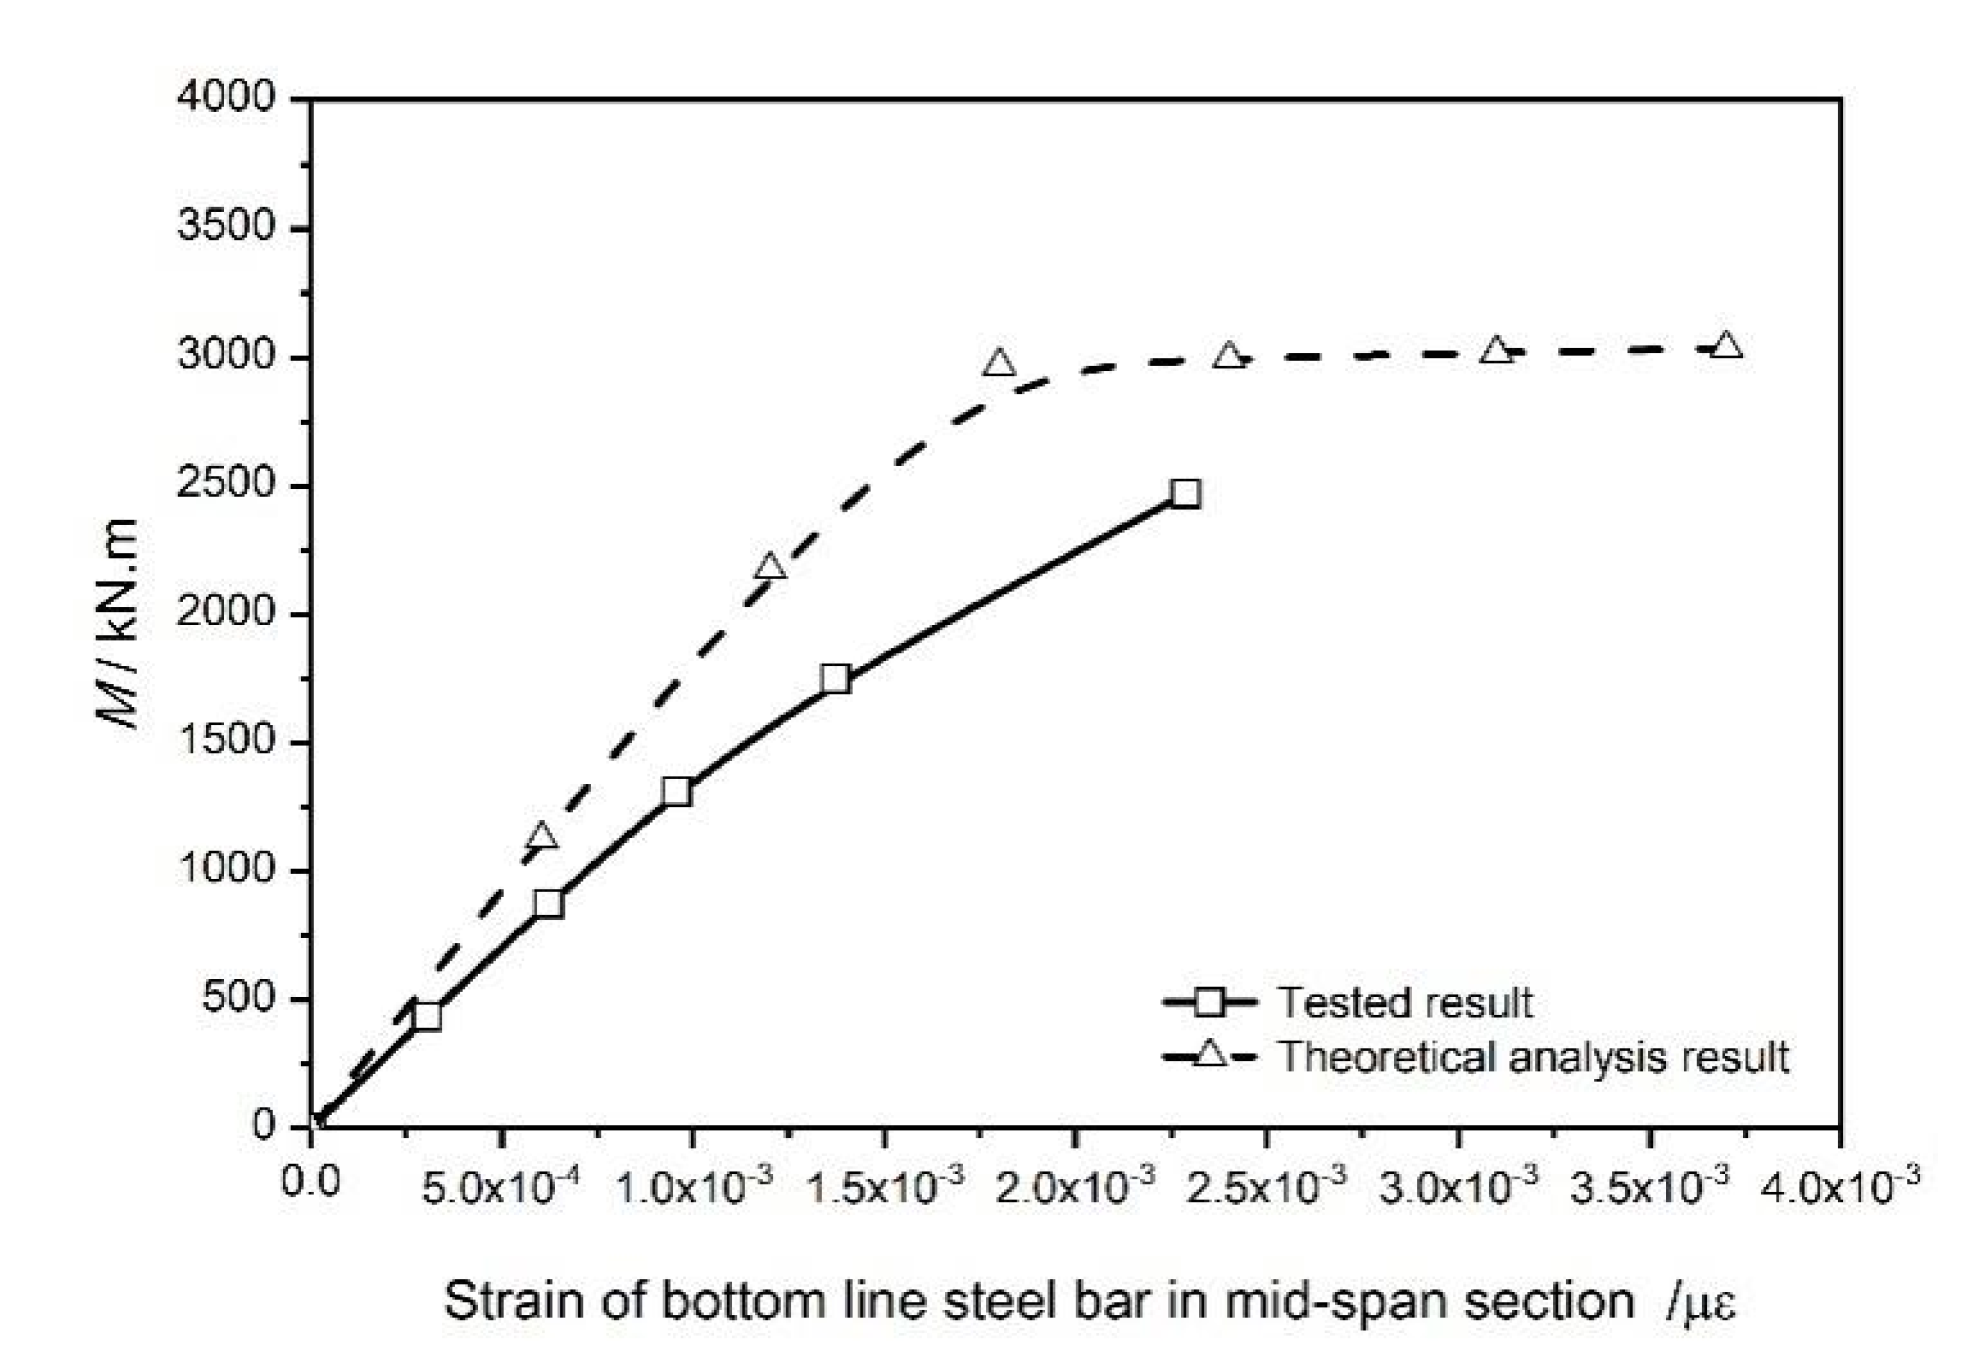
4.1.2. Analysis of Strain
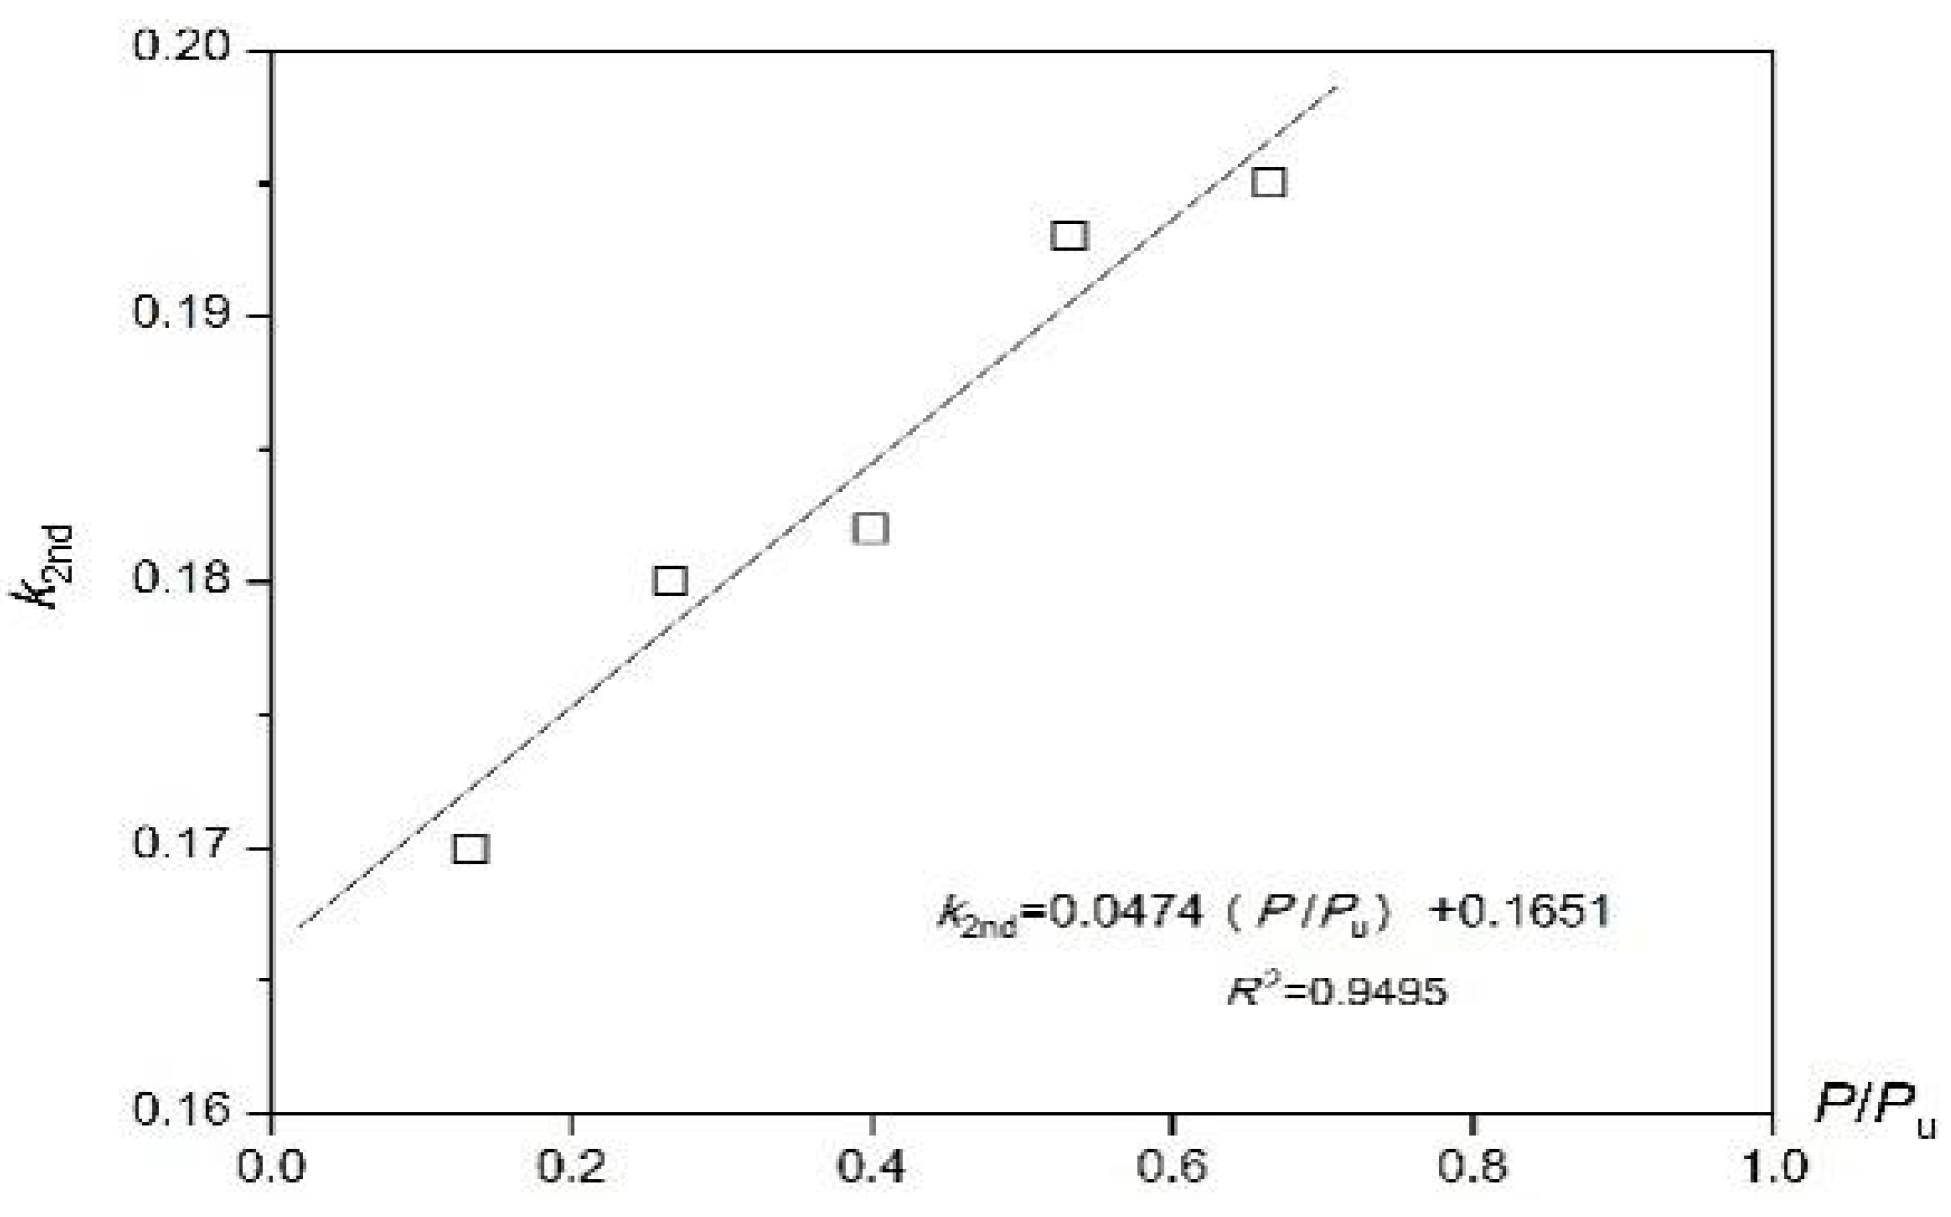
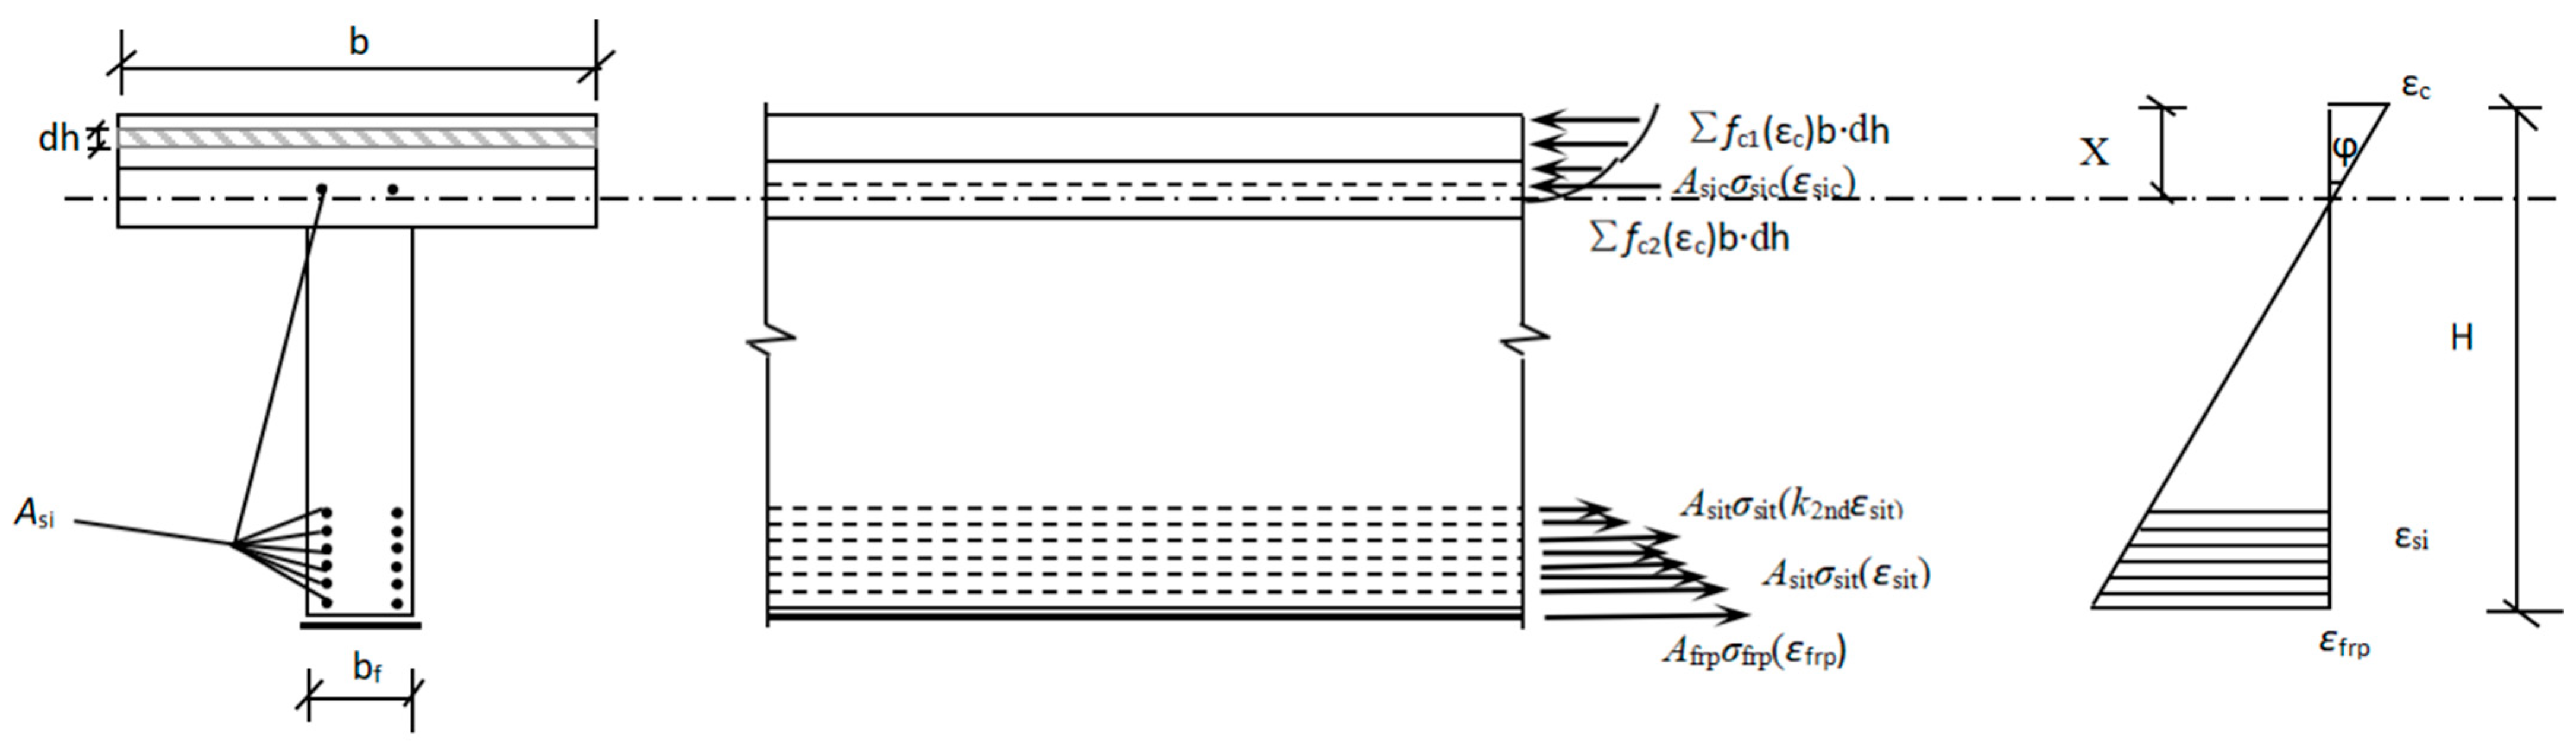
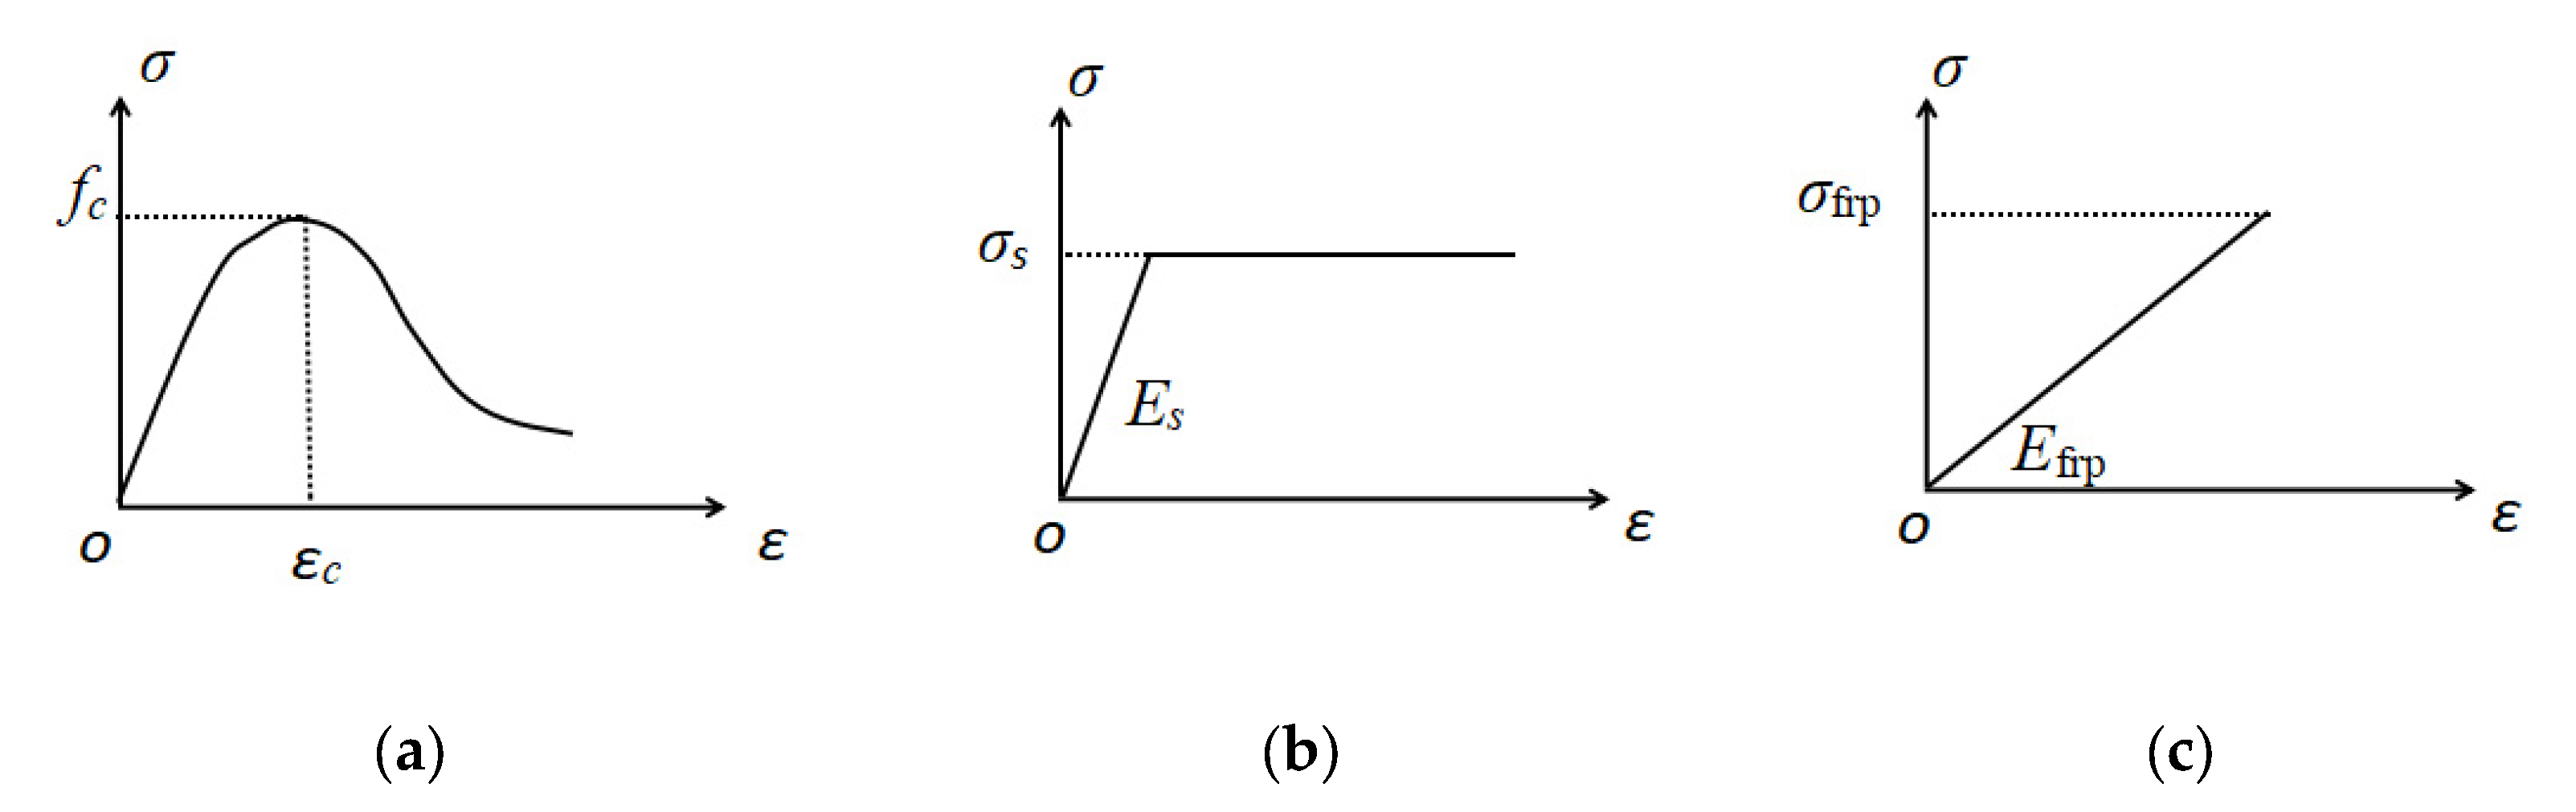
4.2. Theoretical Analysis
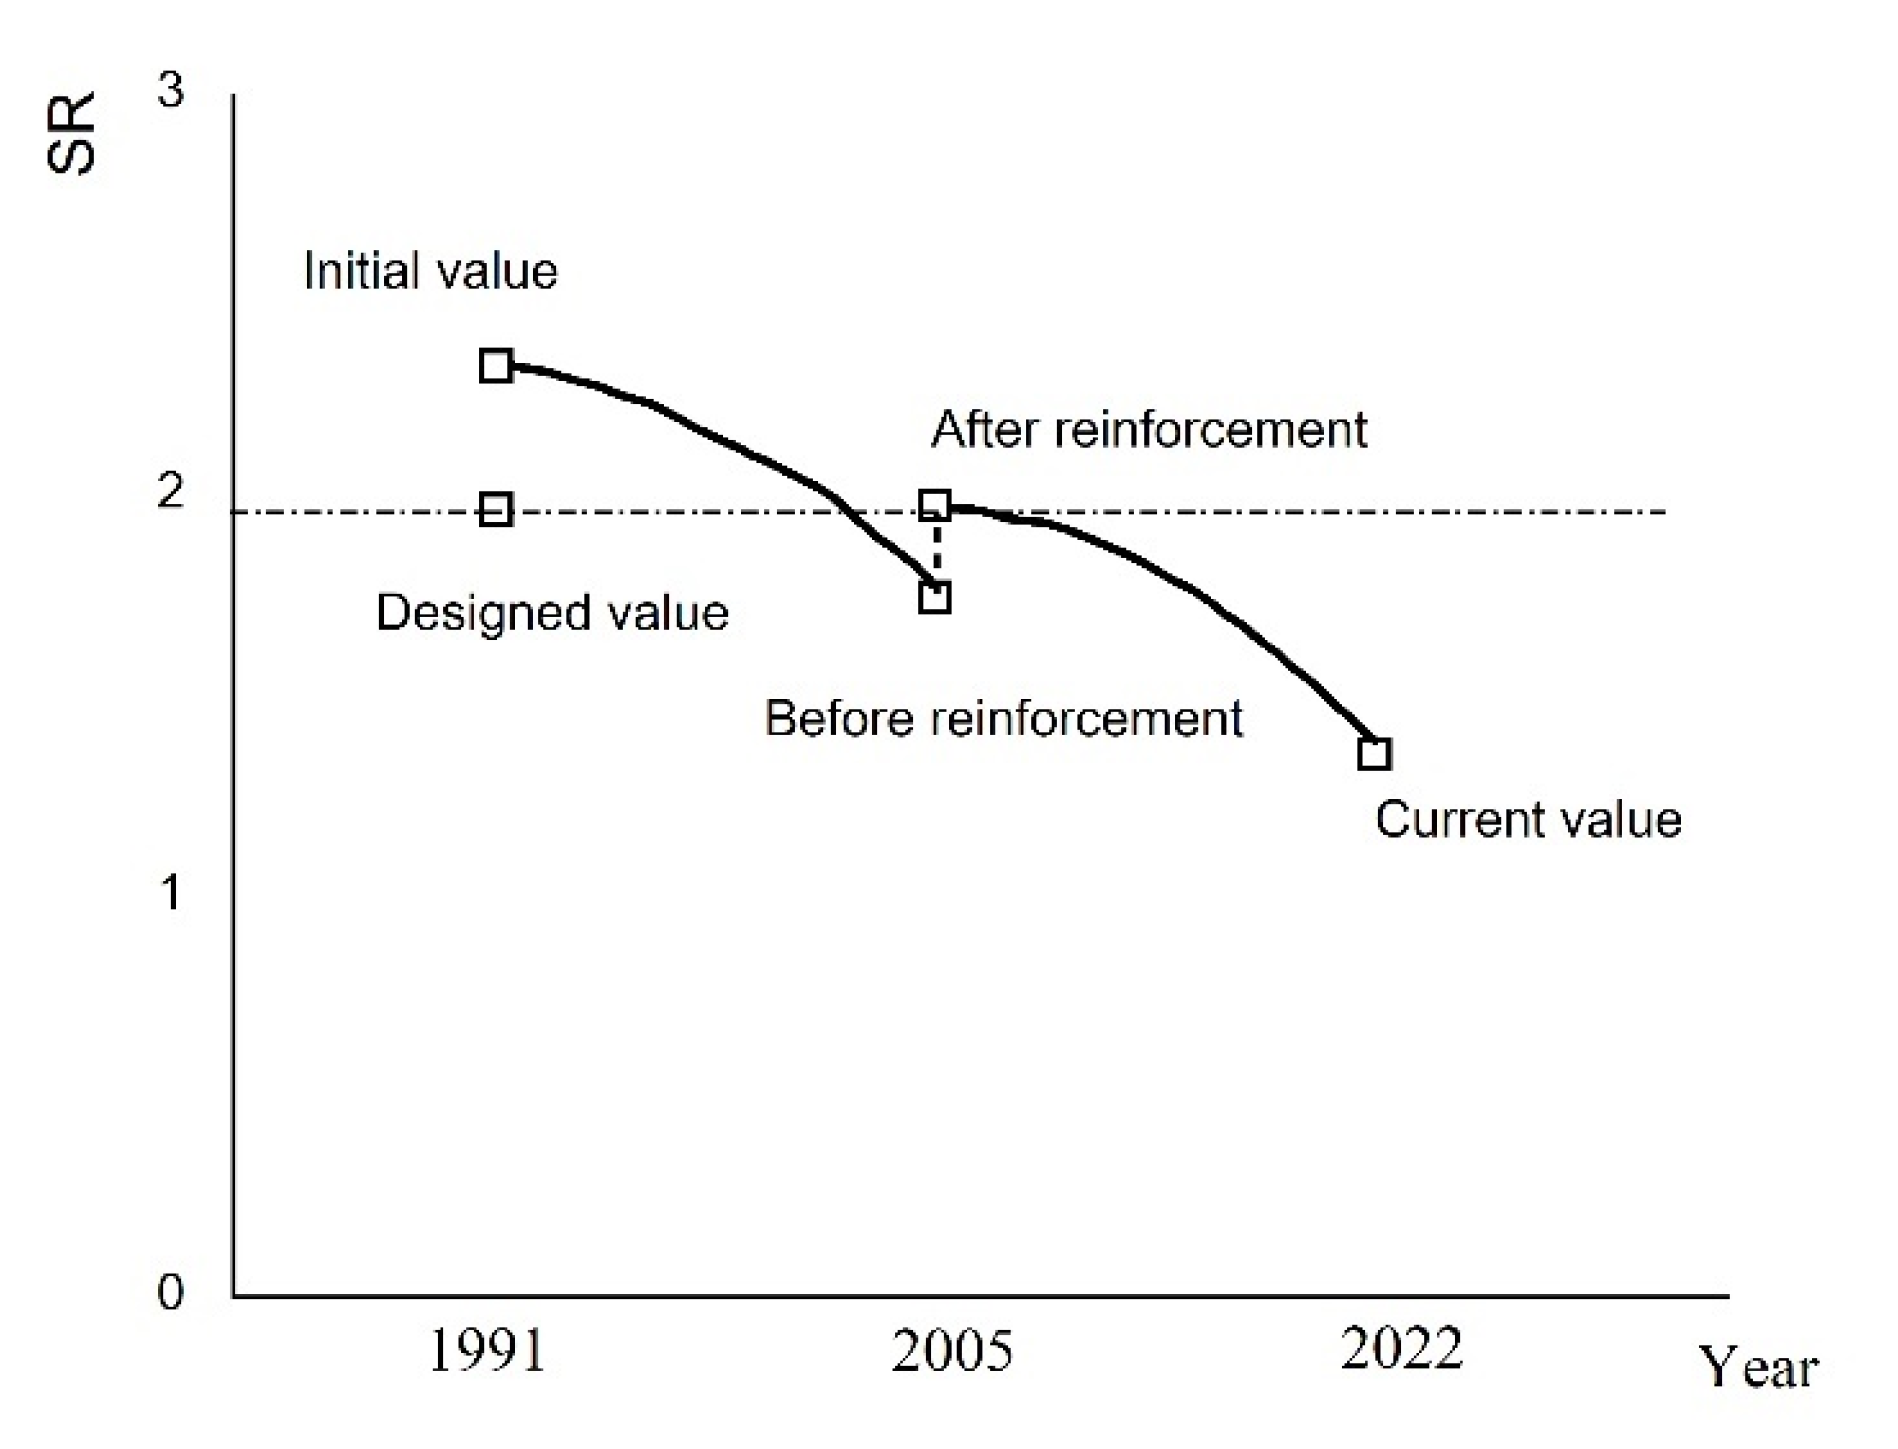
4.3. Bearing State Analysis of the Whole Life of Super-Span T-Beam
5. Conclusions
- (1)
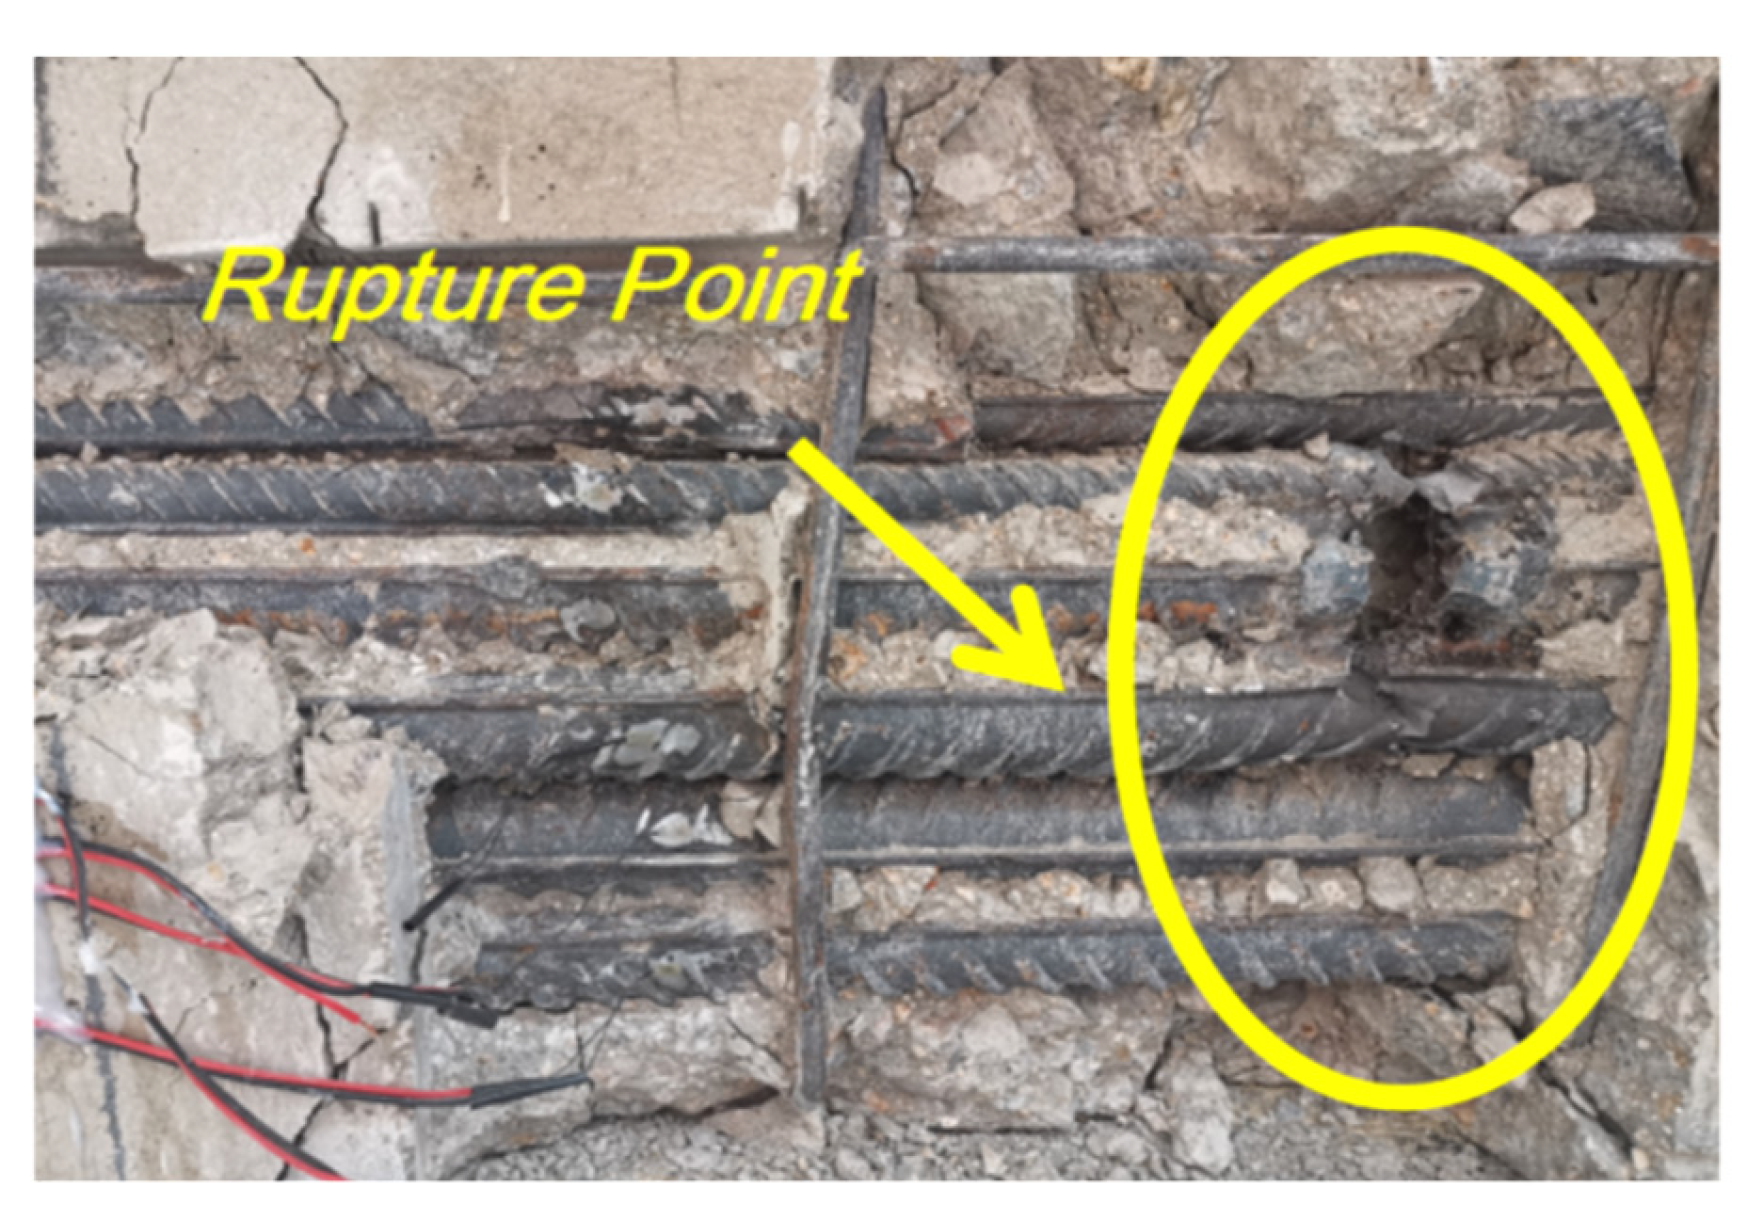
- The failure process of the retrofitted old super-span FRP reinforced concrete T-beam was recognized. The failure of the specimen initially occurred with the original cracks in the middle span of the specimen extending upward. The strain distribution of concrete is asymmetrical during bending. The bearing capacity of specimen losses is absolutely marked by the sudden fracture of GFRP and longitudinal steel bars.
- (2)
- The presence of the stiffened rib plate changed the stress state and strain distribution of the maximum bending moment section. The weakening effect of the stiffened rib plate on the adjacent section should be considered when the rib plate is installed on the maximum bending moment section.
- (3)
- It is difficult to perfectly meet the plane cross-section of the strain distribution of specially designed longitudinal steel bars arranged vertically. The sectional analysis carried out in this study should be revised by the experimental data.
- (4)
- The reliability of the super-span T-beam can be expressed by the SR index, which is mostly affected by the upgrading of the service load rather than the influence of service life and atmospheric environment.
Author Contributions
Funding
Institutional Review Board Statement
Informed Consent Statement
Data Availability Statement
Conflicts of Interest
References
- Lee, H.K.; Cheong, S.H.; Ha, S.K.; Lee, C.G. Behavior and performance of RC T-section deep beams externally strengthened in shear with CFRP sheets. Compos. Struct. 2011, 93, 911–922. [Google Scholar] [CrossRef]
- Nayak, C.B.; Narule, G.N.; Surwase, H.R. Structural and cracking behaviour of RC. T-beams strengthened with BFRP sheets by experimental and analytical investigation. J. King Saud Univ. Eng. Sci. 2022, 34, 398–405. [Google Scholar] [CrossRef]
- Jabbar, A.M.; Hamood, M.J.; Mohammed, D.H. The effect of using basalt fibers compared to steel fibers on the shear behavior of ultra-high performance concrete T-beam. Case Stud. Constr. Mater. 2021, 15, e00702. [Google Scholar] [CrossRef]
- Kar, S.; Biswal, K.C. FRP shear contribution prediction for U-wrapped RC T-beams using a soft computing tool. Structures 2020, 27, 1093–1104. [Google Scholar] [CrossRef]
- Hassan, A.; Baraghith, A.T.; Atta, A.M.; El-Shafiey, T.F. Retrofitting of shear-damaged RC T-beams using U-shaped SHCC jacket. Eng. Struct. 2021, 245, 112892. [Google Scholar] [CrossRef]
- Mhanna, H.H.; Hawileh, R.A.; Abdalla, J.A. Shear behavior of RC T-beams externally strengthened with anchored high modulus carbon fiber-reinforced polymer (CFRP) laminates. Compos. Struct. 2021, 272, 114198. [Google Scholar] [CrossRef]
- Arslan, M.H.; Yazman, S.; Hamad, A.A.; Aksoylu, C.; Ozkılıç, Y.O.; Gemi, L. Shear strengthening of reinforced concrete T-beams with anchored and non-anchored CFRP fabrics. Structures 2022, 39, 527–542. [Google Scholar] [CrossRef]
- Nie, X.; Zhang, S.; Teng, J.; Chen, G.M. Experimental study on RC T-section beams with an FRP-strengthened web opening. Compos. Struct. 2018, 185, 273–285. [Google Scholar] [CrossRef]
- Belarbi, A.; Bae, S.W.; Brancaccio, A. Behavior of full-scale RC T-beams strengthened in shear with externally bonded FRP sheets. Constr. Build Mater. 2012, 32, 27–40. [Google Scholar] [CrossRef]
- Sogut, K.; Dirar, S.; Theofanous, M.; Faramarzi, A.; Nayak, A.N. Effect of transverse and longitudinal reinforcement ratios on the behaviour of RC T-beams shear-strengthened with embedded FRP BARS. Compos. Struct. 2021, 262, 113622. [Google Scholar] [CrossRef]
- Khalifa, A.; Nanni, A. Improving shear capacity of existing RC T-section beams using CFRP composites. Cem. Concr. Compos. 2000, 22, 165–174. [Google Scholar] [CrossRef]
- Fahmy, M.F.; Idriss, L.K. Flexural behavior of large scale semi-precast reinforced concrete T-beams made of natural and recycled aggregate concrete. Eng. Struct. 2019, 198, 109525. [Google Scholar] [CrossRef]
- Li, L.; Fan, X.; Shi, X.; Shao, X. Experimental study on flexural behavior of large-scale prestressed UHPC T-shaped beam. J. Civil. Eng. 2018, 51, 84–94. (In Chinese) [Google Scholar]
- Hason, M.M.; Mussa, M.H.; Abdulhadi, A.M. Flexural ductility performance of hybrid-recycled aggregate reinforced concrete T-beam. Mater. Today 2021, 46, 682–688. [Google Scholar] [CrossRef]
- Huy, P.; Riadh, A. Experimental investigation into flexural retrofitting of reinforced concrete bridge beams using FRP composites. Compos. Struct. 2004, 66, 617–625. [Google Scholar] [CrossRef]
- Peng, F.; Xue, W.; Tan, Y. Design approach for flexural capacity of concrete T-beams with bonded prestressed and nonprestressed FRP reinforcements. Compos. Struct. 2018, 204, 333–341. [Google Scholar] [CrossRef]
- Zaki, M.A.; Rasheed, H.A.; Roukerd, R.R.; Raheem, M. Performance of reinforced concrete T beams strengthened with flexural CFRP sheets and secured using CFRP splay anchors. Eng. Struct. 2020, 210, 110304. [Google Scholar] [CrossRef]
- Almahmood, H.; Ashour, A.; Sheehan, T. Flexural behaviour of hybrid steel-GFRP reinforced concrete continuous T-beams. Compos. Struct. 2020, 254, 112802. [Google Scholar] [CrossRef]
- Khalid, W.S.; Mustafa, M.R.; Hayder, A.R. Debonding characterization for all-lightweight RC T-Beams strengthened in flexure with FRP. J. Build. Eng. 2021, 44, 103377. [Google Scholar] [CrossRef]
- Zhang, Y.; Elsayed, M.; Zhang, L.; Nehdi, M. Flexural behavior of reinforced concrete T-section beams strengthened by NSM FRP bars. Eng Struct 2021, 233, 111922. [Google Scholar] [CrossRef]
- Diab, H.M.; Abdelaleem, T.; Rashwan, M.M. Moment redistribution and flexural performance of RC continuous T-beams strengthened with NSM FRP or steel bars. Structures 2020, 28, 1516–1538. [Google Scholar] [CrossRef]
- Schanck, A.P.; Davids, W.G. Capacity assessment of older t-beam bridges by nonlinear proxy finite-element analysis. Structures 2020, 23, 267–278. [Google Scholar] [CrossRef]
- Choi, K.; Lee, D.; You, Y.; Han, S. Long-term performance of 15-year-old full scale RC beams strengthened with EB FRP composites. Compos. Struct. 2022, 299, 116055. [Google Scholar] [CrossRef]
- Wang, X.; Chen, Z.; Ding, L.; Shi, Y.; Zhu, Z.; Wu, Z. Long-term flexural behavior of concrete beams with hybrid FRP and steel reinforcements in simulated marine environment. Structures 2021, 33, 4556–4567. [Google Scholar] [CrossRef]
- Guo, R.; Li, C.; Xian, G. Water absorption and long-term thermal and mechanical properties of carbon/glass hybrid rod for bridge cable. Eng. Struct. 2023, 274, 115176. [Google Scholar] [CrossRef]
- Pan, Y.; Yan, D. Study on the durability of GFRP bars and carbon/glass hybrid fiber reinforced polymer(HFRP) bars aged in alkaline solution. Compos. Struct. 2021, 261, 113285. [Google Scholar] [CrossRef]
- GB50010-2010; Chinese Code for Design of Concrete Structures. China Architecture & Building Press: Beijing, China, 2015; pp. 209–211.
- Gao, X.; Yang, Y.; Li, J. Change law of time-dependent concrete compressive strength in the atmospheric environment. J. Civil. Eng. 2014, 48, 19–26. (In Chinese) [Google Scholar]


| Sample Number | Average Diameter /mm | Average Height /mm | Compression Force /kN | Compressive Strength /MPa | Average Compressive Strength /MPa | Standard Deviation |
|---|---|---|---|---|---|---|
| cb-1 | 75.3 | 75.6 | 165.02 | 37 | 33.9 | 2.37 |
| cb-2 | 75.1 | 75.3 | 177.52 | 40.1 | ||
| cb-3 | 75.5 | 75.7 | 152.12 | 33.9 | ||
| cb-4 | 75.3 | 75.8 | 147.05 | 33.0 | ||
| cb-5 | 75.1 | 75.3 | 150.37 | 33.8 | ||
| cb-6 | 75.3 | 75.4 | 150.23 | 33.8 | ||
| cb-7 | 75.6 | 76.0 | 144.76 | 32.2 | ||
| cb-8 | 75.6 | 75.7 | 136.53 | 30.4 | ||
| cb-9 | 75.3 | 75.7 | 149.43 | 33.6 | ||
| cb-10 | 75.8 | 75.3 | 147.56 | 32.7 | ||
| cb-11 | 75.6 | 75.6 | 163.86 | 36.3 | ||
| cb-12 | 75.4 | 75.7 | 143.35 | 32.1 | ||
| cb-13 | 75.2 | 75.4 | 151.38 | 33.7 | ||
| cb-14 | 75.4 | 75.5 | 156.18 | 35.0 | ||
| cb-15 | 75.6 | 75.3 | 144.99 | 32.2 | ||
| cp-1 | 75.4 | 75.4 | 213.90 | 47.8 | 50.4 | 3.95 |
| cp-2 | 75.1 | 75.2 | 206.29 | 46.6 | ||
| cp-3 | 75.6 | 75.3 | 255.21 | 56.8 | ||
| cp-4 | 75.4 | 75.4 | 225.87 | 50.6 | ||
| cp-5 | 75.1 | 75.0 | 222.74 | 50.3 |
| Average Diameter /mm | Yield Strength/MPa | Average Value /MPa | Tensile Strength /MPa | Elongation /% | |
|---|---|---|---|---|---|
| st-1 | 32 | 318.0 | 320.7 | 530.9 | 16.5 |
| st-2 | 32 | 317.8 | 515.1 | 12.3 | |
| st-3 | 32 | 313 | 519.4 | 10.3 | |
| st-4 | 32 | 329.1 | 527.3 | 18.0 | |
| st-5 | 32 | 325.6 | 513.7 | 8.3 |
| fcb /MPa | fcp /MPa | fy /MPa | fu /MPa | Es /GPa | fGFRP /MPa | EGFRP/GPa | |
|---|---|---|---|---|---|---|---|
| Nominal value in original design | 22.4 | 42.0 | 360 | 580 | 210 | 800 | 80 |
| Actual measured value of current period | 31.2 | 45.9 | 320.7 | 521.3 | 215.2 | _ | _ |
| My/kN.m | Pu/kN | |
|---|---|---|
| Experimental result | 2260.5 | 752.0 |
| Theoretical result | 2968.3 | 799.9 |
| Err. | 23.8% | 5.9% |
| Year | Concrete Strength/MPa | Section Form | Service Load Ms /kN m | Resistant Force MR /kN m | SR = Ms/MR | |
|---|---|---|---|---|---|---|
| Beam Body | Pavement | |||||
| 1991 (Design) | 250# (18 MPa) | 250# (18 MPa) |  | 1509.0 | 2966.3 | 1.966 |
| 1991 | 30.26 | 30.26 |  | 1296.0 | 3011.3 | 2.324 |
| 2005 (Before reinforcing) | 30.71 | 30.71 | 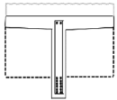 | 1725.0 | 3011.9 | 1.746 |
| 2005 (After reinforcing) | 30.71 | 44.58 |  | 1725.0 | 3406.1 | 1.975 |
| 2022 | 31.2 | 45.9 |  | 2430.0 | 3290.0 | 1.354 |
Disclaimer/Publisher’s Note: The statements, opinions and data contained in all publications are solely those of the individual author(s) and contributor(s) and not of MDPI and/or the editor(s). MDPI and/or the editor(s) disclaim responsibility for any injury to people or property resulting from any ideas, methods, instructions or products referred to in the content. |
© 2023 by the authors. Licensee MDPI, Basel, Switzerland. This article is an open access article distributed under the terms and conditions of the Creative Commons Attribution (CC BY) license (https://creativecommons.org/licenses/by/4.0/).
Share and Cite
Hou, D.; Hu, T.; Zhang, G.; Chu, B.; Zhu, J.; Yang, X. Experimental Study on the Flexural Properties of FRP-Reinforced Super-Span Concrete T-Beam after Service. Sustainability 2023, 15, 11903. https://doi.org/10.3390/su151511903
Hou D, Hu T, Zhang G, Chu B, Zhu J, Yang X. Experimental Study on the Flexural Properties of FRP-Reinforced Super-Span Concrete T-Beam after Service. Sustainability. 2023; 15(15):11903. https://doi.org/10.3390/su151511903
Chicago/Turabian StyleHou, Dongxu, Tieming Hu, Guanhua Zhang, Boqi Chu, Jing Zhu, and Xingdong Yang. 2023. "Experimental Study on the Flexural Properties of FRP-Reinforced Super-Span Concrete T-Beam after Service" Sustainability 15, no. 15: 11903. https://doi.org/10.3390/su151511903
APA StyleHou, D., Hu, T., Zhang, G., Chu, B., Zhu, J., & Yang, X. (2023). Experimental Study on the Flexural Properties of FRP-Reinforced Super-Span Concrete T-Beam after Service. Sustainability, 15(15), 11903. https://doi.org/10.3390/su151511903