Article

Enhancing Meteorological Drought Modeling Accuracy Using Hybrid Boost Regression Models: A Case Study from the Aegean Region, Türkiye

1
Department of Civil Engineering, Inonu University, Malatya 44000, Türkiye
2
Department of Industrial Engineering, Yasar University, Izmir 35100, Türkiye
3
Department of Civil Engineering, Yasar University, Izmir 35100, Türkiye
4
Department of Civil Engineering, Bursa Technical University, Bursa 16310, Türkiye
*
Author to whom correspondence should be addressed.
Sustainability 2023, 15(15), 11568; https://doi.org/10.3390/su151511568
Submission received: 24 May 2023 / Revised: 12 July 2023 / Accepted: 25 July 2023 / Published: 26 July 2023
(This article belongs to the Special Issue Drought and Sustainable Water Management)

Abstract

:
The impact of climate change has led to significant changes in hydroclimatic patterns and continuous stress on water resources through frequent wet and dry spells. Hence, understanding and effectively addressing the escalating impact of climate change on hydroclimatic patterns, especially in the context of meteorological drought, necessitates precise modeling of these phenomena. This study focuses on assessing the accuracy of drought modeling using the well-established Standard Precipitation Index (SPI) in the Aegean region of Türkiye. The study utilizes monthly precipitation data from six stations in Cesme, Kusadasi, Manisa, Seferihisar, Selcuk and Izmir at Kucuk Menderes Basin covering the period from 1973 to 2020. The dataset is divided into three sets, training (60%), validation (20%), and testing (20%) sets. The study aims to determine the SPI-3, SPI-6 and SPI-12 using a multi-station prediction technique. Three boosting regression models (BRMs), namely Extreme Gradient Boosting (XgBoost), Adaptive Boosting (AdaBoost), and Gradient Boosting (GradBoost), were employed and optimized with the help of the Weighted Mean of Vectors (INFO) technique. Model performances were then evaluated with the Root Mean Square Error (RMSE), Mean Absolute Error (MAE), Mean Absolute Percentage Error (MAPE), Coefficient of Determination (R2) and the Willmott Index (WI). Results demonstrated a distinct superiority of the XgBoost model over AdaBoost and GradBoost in terms of accuracy. During the test phase, the XgBoost model achieved RMSEs of 0.496, 0.429 and 0.389 for SPI-3, SPI-6 and SPI-12, respectively. The WIs were 0.899, 0.901 and 0.825 for SPI-3, SPI-6 and SPI-12, respectively. These are considerably lower than the corresponding values obtained by the other models. Yet, the comparative statistical analysis further underscores the effectiveness of XgBoost in modeling extended periods of drought in the Aegean region of Türkiye.

1. Introduction

Drought is a naturally occurring disaster that takes place mostly due to insufficient rainfall for a prolonged duration [1,2]. It is widely regarded as a catastrophic and relatively less comprehended hazard. In Türkiye, a developing country located in both Asia and Europe, the drought issue is a rising concern for the authorities. The country, with its diverse geography, experiences unequal and challenging drought patterns which urge comprehensive and immediate action [3]. From the mild Mediterranean climate in the south to the densely forested altitudes in the north, adjacent to the Black Sea, Türkiye has diverse climatic regions. This inherent variability necessitates an intricate and region-based understanding of droughts to deal with their impacts. While the increase in the frequency and severity of extreme weather phenomena can be linked to global warming [4,5,6,7,8], shorter-term events like meteorological and agricultural droughts often exhibit more complex behavior. Thus, it is vital to accurately forecast droughts and establish drought early warning systems for effective planning and resilience [9]. Several Drought Indices (DIs) have been developed to assess the effects of droughts from various perspectives [10]. Some of these indices include the Standardized Precipitation Index (SPI), Drought Area Index (DAI), Palmer Drought Severity Index (PDSI), Standardized Precipitation Evapotranspiration Index (SPEI), Reconnaissance Drought Index (RDI), and Streamflow Drought Index (SDI) [11,12,13,14]. Although the SPI is a well-established and reliable DI recommended by the World Meteorological Organization, multi-variable DIs such as the SPEI are reported to provide a more comprehensive assessment of droughts in a given region. Consequently, hydro-meteorological variables (such as precipitation or streamflow) play a crucial role in determining the DIs, which can be calculated using a single dataset, or benefit from utilizing data fusion techniques to capture more complicated drought patterns. Given the complex time–space interplay of hydro-meteorological variables, which directly impact the effectiveness of DIs, there is a need for the development of more localized and region-specific indices to enhance our understanding of drought phenomena in different regions. Furthermore, the pronounced frequency of droughts resulting from climate change underscores the urgency for decision-makers to deepen their knowledge of drought and its impacts on agriculture, which is a primary source of income for many citizens in Türkiye [3]. This calls for more comprehensive and innovative research that considers not only the climatic and environmental factors, but also the socio-economic aspects.
The determination of drought severity is based on historical records. Karavitis et al. [15] have noted that the depiction of the onset and severity of drought events cannot be fully captured by a single approach. Past studies have utilized various regression and data-driven techniques, such as Artificial Neural Networks (ANNs), the Adaptive Neuro-Fuzzy Inference System (ANFIS) and the fuzzy algebra system to forecast drought indices [16]. ANNs have been used to forecast the Standardized Hydrological Drought Index (SHDI) in Iran [17] and Nonlinear Aggregated Drought Index–based drought conditions [18], while ANFIS has been tested for its suitability in forecasting the SPI at different time scales [19]. Other techniques, such as wavelet–ANN models and M5–tree and multivariate adaptive regression splines (MARS) models, have also been employed in drought forecasting studies. For instance, Nourani et al. [20] found that wavelet–AI models enhance drought forecast accuracy. Mishra et al. [21] also confirmed this finding, utilizing a hybrid model combining linear stochastic and nonlinear ANN models to estimate drought forecasts using SPI. The selection of the appropriate model is a key challenge in the use of physical and conceptual models for data-intensive research. In a recent study by Mehr et al. [22], the Elman neural network (ENN) together with Simulated Annealing (SA) optimization and the support vector machine (SVM) were used in predicting the SPI-3, SPI-6 and SPI-12 in Ankara, Türkiye. It was concluded that the multi-station prediction scenarios are capable of enhancing our capabilities in the prediction of SPI drought.
Despite the promising results, these models have their own limitations, primarily associated with high-dimensional data robustness, model interpretability, and computational efficiency [23]. On the other hand, the Extreme Gradient Boosting (XgBoost) algorithm proposed by Chen and Guestrin [24] is reported to fulfill these limitations by combining all predictors and training “weak” learners into “strong” learners through an additive strategy. To date, XgBoost has been used in various fields [25,26] but has yet to be extensively explored in drought prediction applications [27]. In addition, while standalone AI-based models have been reported as effective, the utilization of optimized AI-based models in drought prediction approaches has not been thoroughly explored [28].
In particular, studies related to engineering construction, structural damage detection, environmental monitoring, and natural disaster modeling [29] have recently reported the efficacy of model-dependent Hyperparameter Optimization (HPO) techniques, including Bayesian optimization, multi-fidelity, and metaheuristic-based approaches, in improving the predictive accuracy of AI models. Nevertheless, the success of these approaches has not been thoroughly examined in drought assessment. In this respect, one of the motivations of this study is to contribute to the development of AI by proposing a novel technique for optimizing hyperparameters in sophisticated algorithms such as XgBoost. The identification of an optimal hyperparameter is strongly dependent upon the careful selection of an appropriate optimization methodology. Due to their non-convex or non-differentiable nature, HPO problems may not be adaptable to conventional optimization techniques, resulting in local optima instead of a global optimum. Yet, the gradient descent–based techniques are prevalent conventional optimization algorithms that can adjust continuous hyperparameters by computing gradients. Decision-theoretic methodologies, Bayesian optimization models, multi-fidelity optimization techniques, and metaheuristics algorithms have been found to be more appropriate for HPO problems. These methods can identify not only the continuous, but also the discrete, categorical, and conditional hyperparameters. Moreover, it has been observed that they outperform conventional optimization methods such as gradient descent.
The main objective of the study is to develop a novel hybrid technique that incorporates the advantages of multiple models, such as INFO, XgBoost, AdaBoost, and GradBoost, to accurately predict future meteorological drought with the help of the reliable SPI drought indicators (i.e., SPI-3, SPI-6 and SPI-12). Yet, to the best knowledge of the authors, this combination has not been previously investigated in detail. As a result, and after the determination of the SPI time series, the predictive hybrid model developed in this study offers a novel, rapid, and efficient approach to conduct pointwise and multi-station drought prediction. Thus, the INFO tuning algorithm was used to determine the optimal configuration for the Boost Regression Models (BRMs). Additionally, a comprehensive comparative analysis was conducted to address the limitations of future studies. Several performance assessment metrics and statistical comparison methods were employed to evaluate the predictive capabilities of the models.

2. Materials and Methods

2.1. Study Area and Data

The Kucuk Menderes Basin (KMB) encompasses an area of roughly 702,931 ha, which is located between 38°41′05″–37°24′08″ N latitudes and 28°24′36″–26°11′48″ E longitudes. It covers about 0.897% of the total land area of Türkiye. The KMB has borders with the Gediz and Buyuk Menderes basins, which are also two of the most important basins in Western Türkiye. Similarly to the other stream flows in the Aegean region, the Kucuk Menderes River owns an open watershed ending at the Aegean Sea. The region is encompassed by a range of mountains, including the Bozdag, Callibadagi, Mahmutdagi, and Kesme Mountains in the north and west, the Beydag and Kumeli Mountains in the south and west, and the Karadag, Culha, and Ayrik (Oyuk) Mountains in the east. The region also has borders with the Aegean Sea and Izmir Bay in the west. The basin covers a total area of 6.967 km2, and encompasses several stream flows, namely the Ulucay, Camlı, Aktas, Kocahavra, and Keles. The city of Izmir holds a significant position in the agricultural sector due to its fertile plains, abundant water resources, well-structured organization, and favorable climate that facilitates product diversification [30].
The specific study area is located in the Aegean region of Türkiye and includes the Izmir and Aydin provinces (Figure 1). For further investigation of the meteorological drought, six meteorological stations located in the most important cities of Cesme, Kusadasi, Manisa, Seferihisar, Selcuk, and Izmir during 1973–2020 are used. These locations also represent the most important hubs for agri-food security and urban settlements in the KMB.

2.2. Standard Precipitation Index (SPI)

Over the years, numerous drought indices including simple indices, such as the percentage of normal precipitation, to more complex indices such as the Palmer Drought Severity Index have been developed. However, scientists realized the need for a simple, easy-to-calculate, and statistically relevant index. This led to the development of the Standardized Precipitation Index (SPI) by McKee et al. [31]. The SPI is a powerful, flexible index that only requires precipitation data as input and is effective in analyzing both wet and dry periods. The SPI is also capable of determining different types of drought with the help of modified time windows. For instance, SPI-1 and SPI-3 are the indicators of short-term and immediate droughts (meteorological), SPI-6 and SPI-9 are used in the determination of the mid-term droughts (agricultural), whereas longer time periods are also used to interoperate the hydrological and climatic disturbances (e.g., SPI-12, SPI-48, etc.) [1]. Hence, its simplicity and effectiveness render it a reliable and comprehensive drought index that is recommended for application by the World Meteorological Organization (WMO).
The classical approach for obtaining the SPI involves forming the cumulative distribution function (CDF) for the total precipitation from the fitted frequency distribution, as proposed by McKee, Doesken and Kleist [31]. The probabilities from the fitted CDF are then tested against known distributions for their goodness of fit. The Gamma distribution is commonly used as the model distribution due to its left-boundedness by zero and positive skewness. As the application of the SPI is well documented, the interested reader may refer to McKee [32] for more details about the formulation and its application.
McKee, Doesken and Kleist [31] and McKee [32] utilized the precipitation probabilities for periods of 3, 6, 12, 24 and 48 months, suggesting a minimum of 30 years of datasets for analysis. The importance of these timescales and the duration of records have been extensively examined and employed in various contexts. Shorter timescales have demonstrated their usefulness in assessing meteorological and agricultural droughts, while longer timescales are more applicable to hydrological studies. However, based on the current state of the art, sub-monthly scales are rarely used in drought studies. Wu et al. [33] discovered that the duration of records becomes crucial for extensive computation of drought in areas where precipitation patterns shift over time.
In this study, the SPI was calculated using monthly precipitation records from Cesme, Kusadasi, Manisa, Seferihisar, Selcuk and Izmir stations, covering the period from 1973 to 2020. Specifically, the SPIs with 3-month, 6-month and 12-month moving averages were computed. Subsequently, the data records from Cesme, Kusadasi, Manisa, Seferihisar, and Selcuk stations were utilized to predict the corresponding SPI values at the Izmir station (the most important socio-economic location within the district and the third-largest city in Türkiye). The original time series was divided into separated training (60%), validation (20%) and testing (20%) datasets. Then, the prediction was carried out using the models, described below.

2.3. Extreme Gradient Boosting (XgBoost) Regression

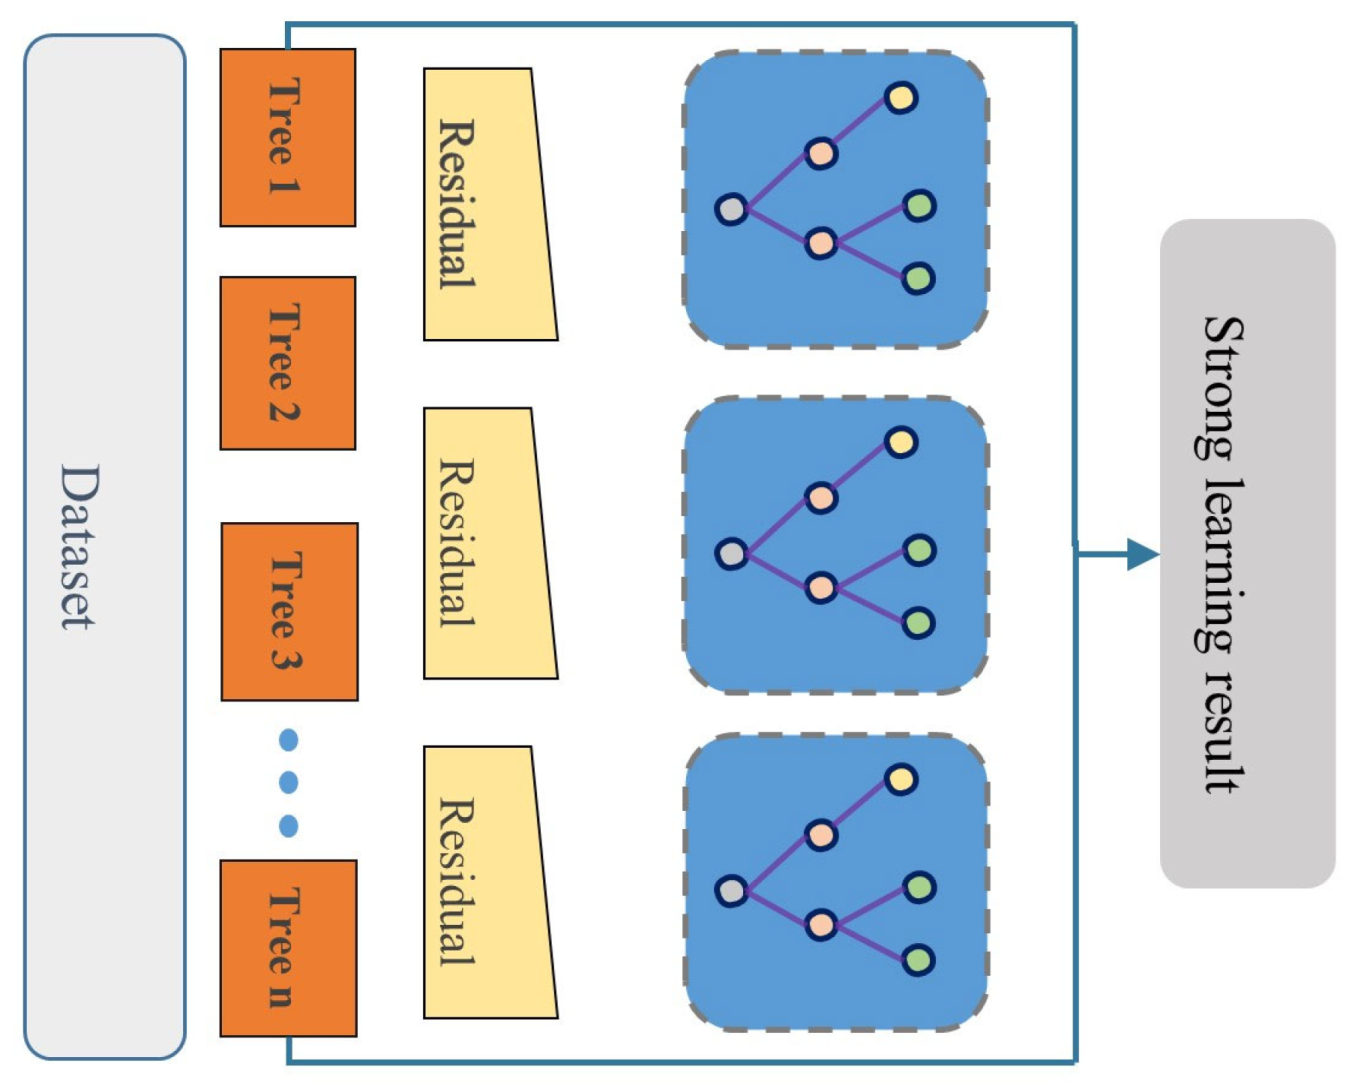
The XgBoost algorithm, introduced by Chen and Guestrin [24], is a distinct implementation method for Gradient Boosting Machine and Regression Trees (CART). By consolidating predictive and regularization terms in streamlined objective functions, it aims to circumvent overfitting while optimizing the utilization of computational resources. Furthermore, XgBoost automatically conducts parallel calculations throughout the training process. Figure 2 shows the progress of the XgBoost model [34].
When compared to other AI techniques, XgBoost Regression is a very efficient supervised learning algorithm. It comprises a base learner and an objective function, with the loss function in the objective function measuring the difference between the actual and predicted values. To measure the variation between the actual and predicted values, a regularization term was provided as well. In order to predict a single value, XgBoost uses ensemble learning, which considers a number of base learners or models. Strong learning results from combining the predictions of these foundational learners, as the good predictions compensate for the poor ones [35].
In XgBoost, the first learner is fitted to the entire input data space, followed by fitting a second model to the residuals in order to tackle the shortcomings of a weak learner. This fitting procedure continues until the stopping criteria are met, with the final result depicting the summation of each learner’s prediction. XgBoost constructs a series of weak learners, which are combined to create the ultimate prediction model. As the algorithm develops each regression tree, it minimizes the average value of the loss function for all steps on the training set. The expression of the objective function initiates as follows:
O b j θ = i = 1 n l y ´ i , y i + Ω f k
where l is the differentiable loss function, y ´ i is the real data, y i is the predicted data and Ω is the regularization term to avoid overfitting. This term serves as a penalty for complex trees that possess numerous leaves, thereby favoring simpler and more predictive trees.
Ω f k = γ T + 1 2 λ w 2
where γ and λ are parameters of the regularization term. T represents the overall count of leaves present within the decision tree. Following this stage, when the derivative of the objective function is computed using the second-order Taylor Series expansion, it can be expressed as follow:
L t = i = 1 n l y i , y ^ i t 1 + f t x i + Ω f t
O b j θ i = 1 n l y i , y ´ i t 1 + g i f t x i + 1 2 h i f t 2 x i + Ω f t + C o n s t
where g i = y ´ t 1 l y i , y ´ i t 1 and h i = 2 y ´ t 1 l y i , y ´ i t 1 are first order and second order terms of the Taylor expansion, respectively.

2.4. Adaptive Boosting (AdaBoost) Regression

The Adaptive Boosting Regression (AdaBoost) algorithm is a prominent and extensively employed ensemble learning method [36]. AdaBoost is distinguished by its utilization of initial training data to generate a weak learner (base learner), followed by the adjustment of training data distribution based on the predictive performance for subsequent rounds of weak learner training. Better emphasis is placed on training samples with lower predictive accuracy in the preceding step [37,38].
To train a base learner, G(Xi), a specific learning algorithm is employed, and the relative predicting error for each sample (Yi) can be represented by Equation (5). The loss function, denoted as L, typically offers options including linear, square, or exponential losses.
e i = L Y i , G X i
Naturally, the performance of a single weak learner is expected to be inadequate. Hence, the objective of AdaBoost is to iteratively generate a series of weak learners denoted as G(Xi), which are subsequently combined to construct a robust learner denoted as H(Xi), utilizing a specific combination strategy outlined in Equation (6). The combination strategy incorporates the weight of the weak learner ( α k ) and G(Xi) as
H X = ν k = 1 n l n 1 α k g X  
where g(X) is obtained through the median of all the α k G k X , the regularization factor or learning rate, which serves to avoid overfitting.
Utilizing a re-weighting approach, the weak learner and its corresponding weight are obtained by modifying the original training data. This involves adjusting the distribution weights of each sample based on the predicting error of the previous weak learner. Consequently, mis-predicted samples have increased weights to concentrate on them during the subsequent training process. In each iteration, the weak learner is determined and the relative predicting error is computed. Subsequently, the total error ratio for that particular iteration is expressed as
e k = i = 1 m e k i  
where eki and ek are the relative predicting error and total error, respectively.
As a result of the former, (wi) relates to the training data samples and signifies that mis-predicted samples have their weights increased to enhance their learning in subsequent steps. On the other hand, the latter ( α k ) relates to the weak learners and indicates that more accurate weak learners hold significant influence over the final results. Additionally, Equation (7) for e reveals that AdaBoost provides a robust framework rather than a specific learning algorithm, as it does not explicitly specify the detailed form of the weak learner.

2.5. Gradient Boosting (GradBoost) Regression

Gradient boosting is a form of ensemble method that leverages the creation of multiple weak models and combines them to achieve enhanced overall performance [39,40,41]. The gradient boosting algorithm commences by initializing a base learner (F0), typically in the form of a constant function. Subsequently, it employs a steepest-descent procedure to minimize the loss function. In this process, steps are taken in proportion to the negative gradient of the loss function, L y , F x = y F x 2 , to identify the local minimum. Following this stage, the m-th regression tree (Fm(x)) is updated and the derivative of the objective function is computed as follows.
y ´ i = L y i , F x i F x i F x = F m 1 x

2.6. Weighted Mean of Vectors Optimization (INFO)

The INFO algorithm is an optimization method that uses a unique updating rule operator to increase the population diversity during the search procedure. This updating rule operator consists of two main parts: a mean-based rule and a convergence acceleration. The mean-based rule uses a weighted mean of randomly selected vectors to create new vectors, helping the algorithm search the solution space globally. This rule is based on the best, better, and worst solutions found in the population, and employs wavelet functions (WFs) to enhance the search. WFs help create efficient oscillation and generate fine-tuning by controlling the dilation parameter [42]. The scale factor is changed using an exponential function, which depends on the maximum number of generations.
In the establishment of the INFO algorithm, the population is initiated with Np members, each of which with different random positions. To be considered in this respect, each position is represented by x l g , where l denotes the l-th individual and g indicates the generation. Afterward, a function f(x) is applied to evaluate the goodness of fit. Then, the dynamic parameters, β, α, and σ are calculated for each generation g using the following rules.
β = 2 × e x p 4 × g / M a x g
α = c × e x p d × g / M a x g
σ = 2 × α × r a n d α
The mean-based rule is the weighted mean that is computed with two different mechanisms, WM1 and WM2, for each individual l. For W M 1 l g , it randomly selects individuals x a 1 , x a 2 and x a 3 , later to be used in calculation of the weights w 1 , w 2 , w 3 and the corresponding weighted average. The weights are based on cosine and exponential functions, while W M 2 l g follows a similar approach, but uses different individuals x b s , x b t and x w s that can be recognized as best, better, and worse solutions, respectively.
M e a n R u l e = r × W M 1 l g + 1 r × W M 2 l g
W M 1 l g = δ × w 1 x a 1 x a 2 + w 2 x a 1 x a 3 + w 3 x a 2 x a 3 w 1 + w 2 + w 3 + ε + ε × r a n d  
w 1 = c o s f x a 1 f x a 2 + π × e x p f x a 1 f x a 2 ω
w 2 = c o s f x a 1 f x a 3 + π × e x p f x a 1 f x a 3 ω
w 3 = c o s f x a 2 f x a 3 + π × e x p f x a 2 f x a 3 ω
ω = m a x f x a 1 , f x a 2 , f x a 3  
Convergence acceleration (CA) is the second part of the updating rule for the operator. It improves the algorithm’s global search ability by using the best vector to move the current vector in the search space. The CA is multiplied by a random number to ensure different step sizes for each vector in every generation. The method improves global search by moving the current vector x l g in the direction of the best vector, scaled by a random number. CA is calculated as follows:
C A = r a n d n × x b s x a 1 f x b s f x a 1 + ε  
The new position z l g is then calculated by adding the weighted mean and CA to the current position, all scaled by σ as
z l g = x l g + σ × M e a n R u l e + C A
Finally, the new vector is calculated, and the updating rule is defined using the exploration and exploitation search phases. The scaling rate of a vector can be changed based on an exponential function. Large values of this parameter lead to divergence from the weighted mean of vectors (exploration search), while small values cause the current position to move towards the weighted mean of vectors (exploitation search). It defines the updating rule for exploration and exploitation phases. If a random number is less than 0.5, we use one rule to calculate z 1 l g and z 2 l g ; otherwise, we use a different rule. Depending on a random number, u l g is calculated either by adding the difference of z 1 l g and z 2 l g to z 1 l g or to z 2 l g . The above steps are repeated for a maximum number of generations Maxg or until convergence is achieved [43].

2.7. The Proposed Hyperparameter Optimization with INFO

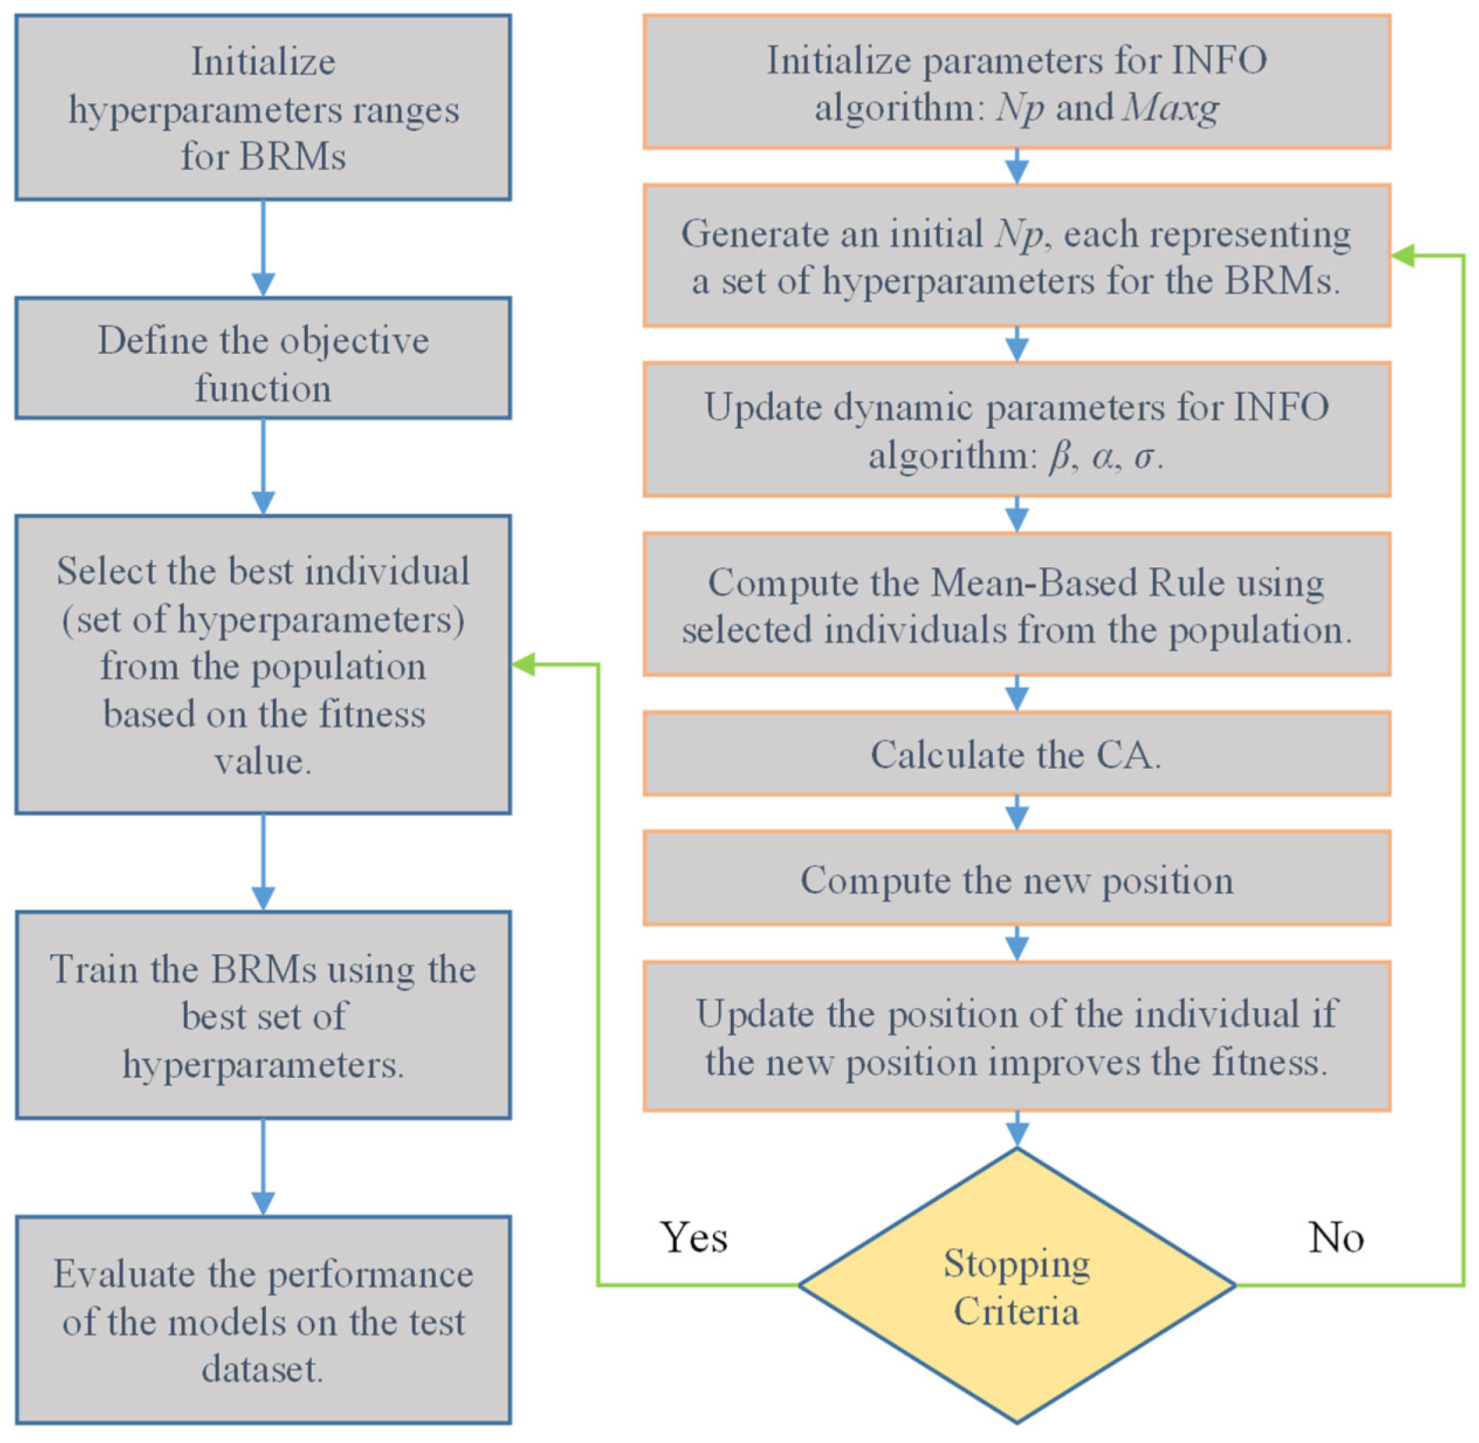
The grid search method, which involves adjusting parameters individually within a specified range, is not ideal for optimizing floating-point parameters due to its enumeration-based approach. In contrast, metaheuristic algorithms offer a fast convergence speed and can efficiently reach the optimal solution, saving significant time through continuous operations. Therefore, to optimize the hyperparameters of the BRM algorithm, we proposed the XgBoost-INFO method, which combines the metaheuristic optimization for determining the ranges of floating-point hyperparameters. In our approach, we consider eight hyperparameters in the XgBoost, AdaBoost and GradBoost algorithms, namely, number of the gradient boosted trees, learning rate, maximum depth of a tree, regular term of weight L2 and L1, minimum loss reduction needed for partitioning a leaf node of a tree, minimum sum of the instance weights contained in child nodes, and the loss function [44]. Table 1 provides the meanings of these hyperparameters. Figure 3 indicates the flowchart of the HPO.

2.8. Performance Metrics

The Root Mean Square Error (RMSE), Mean Absolute Error (MAE), Mean Absolute Percentage Error (MAPE), Coefficient of Determination (R2) and Willmott Index (WI) were used for the evaluation of the results. The following equations summarize these measures.
R M S E = i = 1 n y ^ i y i 2 n
M A E = 1 n i = 1 n y ^ i y i
R 2 = i = 1 n y ^ i y ¯ 2 i = 1 n y i y ¯ 2
W I = 1 i = 1 n y ^ i y i 2 i = 1 n y ^ i y ¯ + y i y ¯ 2
where y i , y ¯ and y ^ i are, respectively, the i-th observation, mean value of the observation data, and the predicted value for i-th data.

3. Results

The statistical properties of the monthly SPI at the selected stations, including the range (R), kurtosis coefficient (K), skewness coefficient (S), arithmetic mean, and standard deviation (SD) are presented in Table 2. As detailed before, the study introduces BRMs, XgBoost, AdaBoost and GradBoost models for a set of multi-station drought predictions using the SPI-3, SPI-6 and SPI-12 for the evaluation of the meteorological drought at Izmir station. The models were trained using 60% of the available data, while the remaining 40% was split into testing and validation sets, each comprising 20% of the data. The optimal BRMs were determined using INFO optimization, and then used to predict the entire SPI time series. The predicted SPI time series were then compared to the original time series with the help of the performance metrics, scatter plots, and box-plots. Table 3 provides the initial results for the analysis.
The models were then evaluated based on RMSE, MAE, MAPE, R2 and WI. When considering the SPI-3, XgBoost outperformed AdaBoost and GradBoost on the testing set, with an RMSE: 0.496, R2: 0.704 and WI: 0.899. The XgBoost algorithm also performed as the best option during the training phase, presenting an RMSE: 0.523, R2: 0.723 and WI: 0.905. The validation results of XgBoost for the SPI-3 are also satisfactory when representing RMSE: 0.695, R2: 0.622 and WI: 0.858. When a longer period was considered, for the SPI-3, the XgBoost model outperformed the other models in the testing set, with an RMSE: 0.429, R2: 0.714 and WI: 0.901. During the training phase, XgBoost exhibited an RMSE: 0.325, R2: 0.906 and WI: 0.971. For validation, XgBoost achieved an RMSE: 0.599, R2: 0.704 and WI: 0.908. A similar result was obtained for SPI-12, where XgBoost gave a higher R2 and WI and lower RMSE, MAE and MAPE, in contrast to AdaBoost and GradBoost models. The results showed that the XgBoost model outperformed AdaBoost and GradBoost in the SPI-3, SPI-6 and SPI-12 periods. Specifically, in the testing phase for the SPI-3 period, XgBoost recorded an RMSE: 0.496, R2: 0.704 and WI: 0.899. In the SPI-6 period, the respective metrics were 0.429, 0.714 and 0.901, respectively, for RMSE, R2 and WI. This performance is similar in the training and validation phases as well, indicating XgBoost’s superior generalization ability.
It is noteworthy that the model’s performance in the validation set was slightly weaker compared to that of the training set. This is evident in the higher RMSE, MAE and MAPE values observed in the validation data for the SPI-3, SPI-6 and SPI-12 periods. This discrepancy indicates some degree of overfitting, as the model learned the training data too well but failed to generalize the results for unseen data. Overfitting occurs when a model learns the training data too well, including its noise and outliers, and performs poorly on new, unseen data. On the contrary, underfitting happens when a model fails to capture the underlying patterns of the data, resulting in poor performance on both training and test data. Overestimation refers to a scenario where a model consistently predicts values that are higher than the actual values, while underestimation occurs when the model consistently predicts values that are lower than the actual ones. By examining the results, one may distinguish the differences in RMSE, MAE, and MAPE values for the XgBoost model on the validation sets, which are relatively higher than those on the training sets for the SPI-3, SPI-6 and SPI-12 periods.
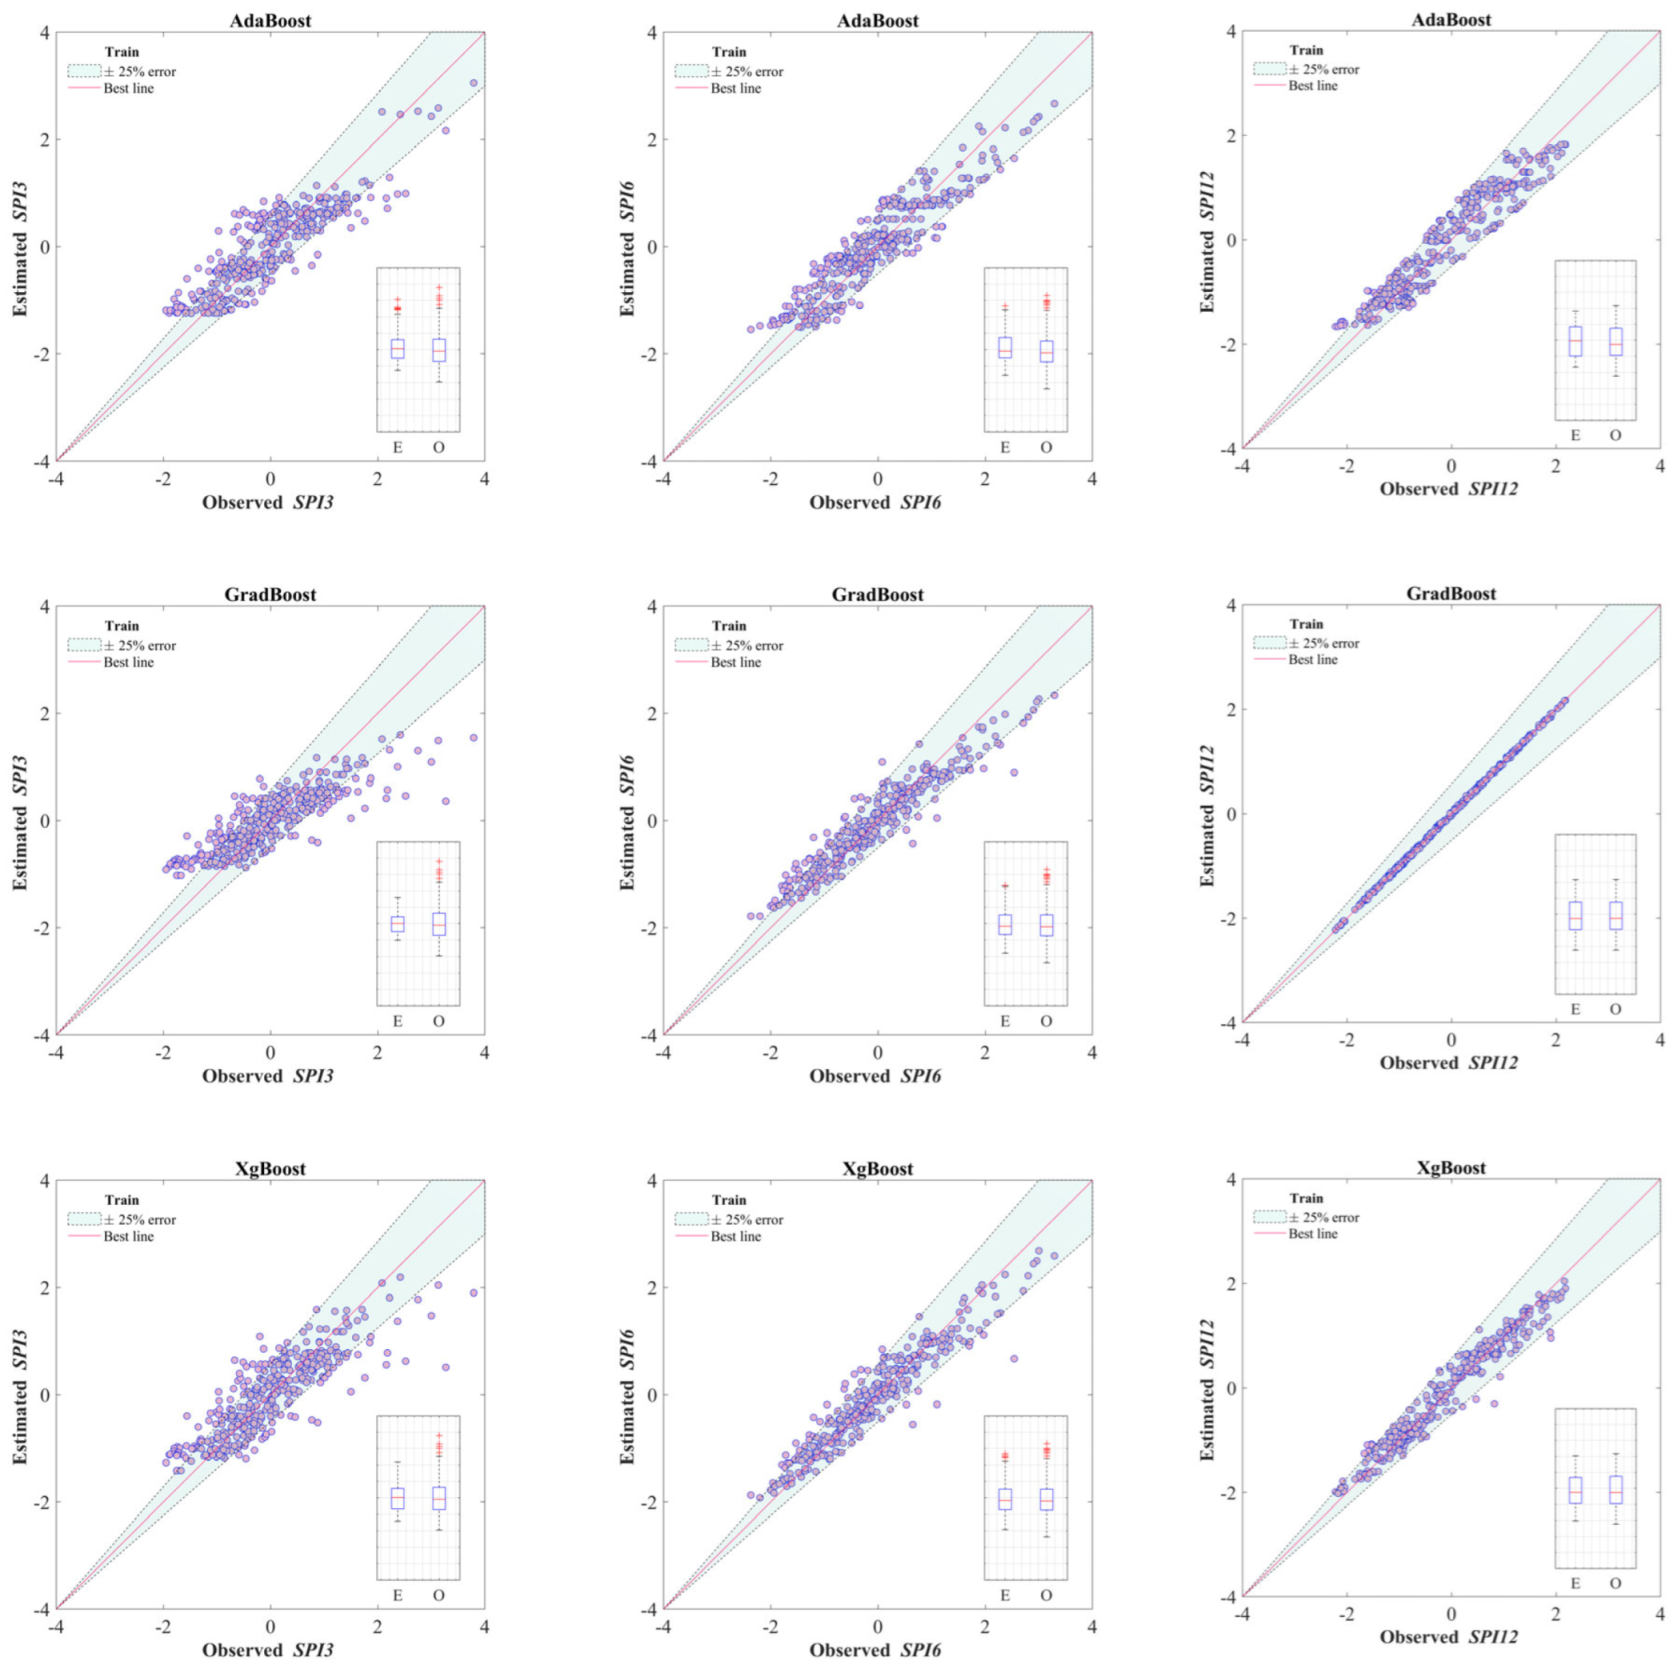
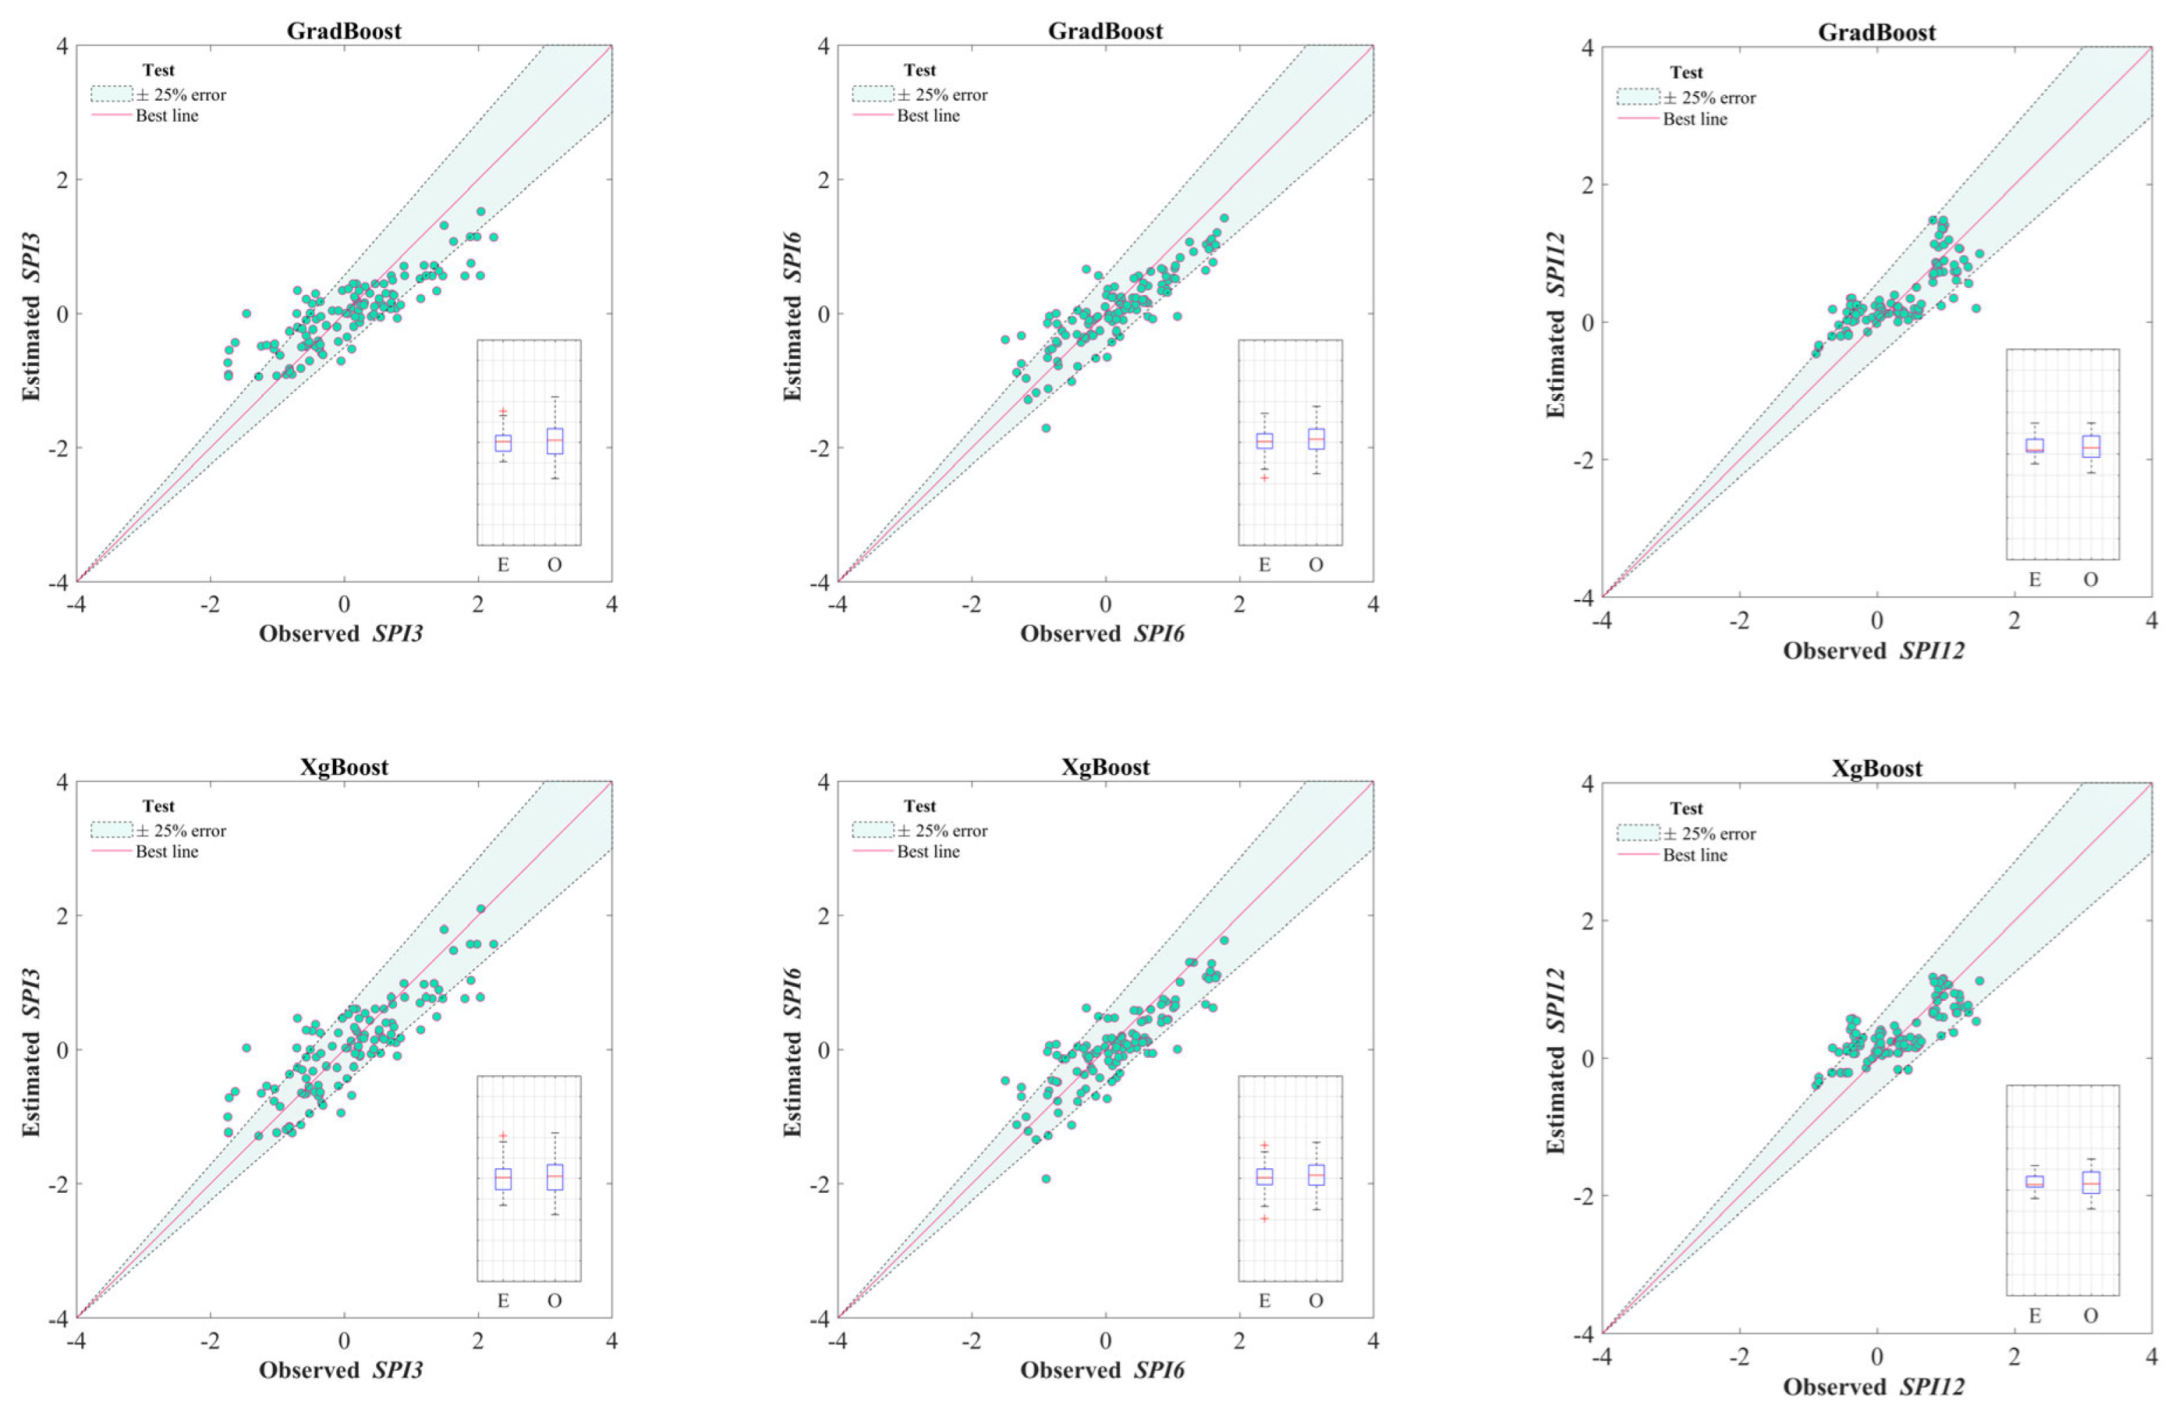
This could potentially indicate a slight overfitting of the model on the training data. It is important to monitor this discrepancy to prevent the model from losing its ability to generalize unseen data. Techniques such as cross-validation, regularization, or early stopping could be implemented in future studies to reduce the problem of overfitting. As detailed before, scatter plots are also used in the evaluation of the models. In this respect, Figure 4 and Figure 5 depict the performance of the model in the training and testing stages. In general, the performance of the models was weaker in the test stage. Yet, this is quite natural, as training performance benefits from the observed values in parameter optimization. In all models, there was balance between overestimation and underestimation, while all models showed a convergence through the end of the modelling experiment.

4. Discussion

This study recommends a multi-phase drought model that utilizes XgBoost, AdaBoost and GradBoost, along with the application of the INFO algorithm. The suggested model’s efficacy and accuracy were measured using a variety of well-established performance criteria. The utilization of data-driven models in drought prediction, as seen in the literature, aligns well with the outcomes of this study. For instance, Belayneh et al. [45] emphasized the merits of employing AI methods, specifically ANNs and Support Vector Regression (SVR), as opposed to conventional stochastic models like the ARIMA model, in the projection of Standard Precipitation Index (SPI) values. This superiority was attributed to the capacity of ANNs and SVRs to capture non-linear elements within temporal data. In this study, the Extreme Gradient Boosting (XgBoost) outperformed both the Adaptive Boosting (AdaBoost) and Gradient Boosting (GradBoost) models in modeling SPI-3, SPI-6 and SPI-12 for the Aegean region of Türkiye. The outcomes might be attributed to the robust handling of non-linearity and multidimensional relationships within the dataset by the XgBoost model, akin to the strengths identified in ANNs and SVRs by Belayneh, Adamowski, Khalil and Ozga-Zielinski [45].
Consistent with the Laimighofer and Laaha [46] findings, the current investigation acknowledges the significant role that the selection of observation duration and distribution plays in modeling meteorological drought. These factors are recognized as major sources of uncertainty. The precision of SPI measurements was significantly amplified by extending the observation period, to encompass an extensive time frame from 1973 to 2020. This concurs with the assertions of Carbone, et al. [47], who advocate a duration of 60 years or longer for achieving stability in parameter estimation.
When evaluating the core principles of the study, it is important to understand that the multi-station prediction for drought or precipitation is primarily influenced by the proximity of the predictor stations to the target station [22]. As a result, the selected predictor stations would be more representative of the drought/precipitation state in the target station. Therefore, it is important to justify the morphological and climatic similarities, as well as consider the possibility of persistence (i.e., auto-correlation), in order to determine the most effective approach for predicting future drought events. In addition, according to AghaKouchak et al. [48], developing a bottom-up forecasting technique and providing stability to the uncertainty in drought prediction is more crucial than reproducing past events precisely. To this end, incorporating the randomness and uncertainty of climatic events into the models has been reported to be more successful. Yet, further research is necessary to fully understand the spatial and temporal complexity associated with drought prediction under climate changes [49]. Drought prediction faces, also, the challenge of an ever-changing climate. To address this issue, it is crucial to use models capable of removing or smoothing the non-stationarity and inconsistency in the time series. Hence, incorporating a data fusion technique or hybridizing multiple modeling approaches can significantly improve the accuracy of drought prediction.
This study demonstrates the potential benefits of using the XgBoost-INFO model for drought forecasting. As a metaheuristic algorithm, the XgBoost-INFO offers a fast convergence speed and can efficiently reach its optimal solution, saving significant time through continuous operations. In addition, by incorporating the floating-point hyperparameters for the XgBoost, AdaBoost and GradBoost algorithms, the model benefits both from the advantages of each of them and the information determined from the nearby stations. In brief, by incorporating the spatial properties of the nearby stations, clustering of the events, and spatiotemporal uncertainties in the variables, this approach is applicable to regions prone to long periods of drought, such as the Aegean region in Türkiye. It is also worthy of discussion that the selection of a proper set of performance metrics would affect our understanding of the best model concept. Keeping in mind that at least one best-fit evaluation criterion (e.g., R2), together with an error determination indicator (e.g., RMSE), is usually required to identify the best model. The fusion of such performance indicators into a single weighted grade [50,51] would be helpful in the determination of the best model.
Despite the promising results from the BRMs in drought event prediction, certain limitations persist. In similar studies, a wide range of time windows, ranging from SPI-1 to SPI-48, have been used to evaluate long-term drought events. In this study, to specifically focus on the immediate meteorological drought in the region, the analysis primarily relied on the use of the reliable and well-established SPI-3, SPI-6 and SPI-12 indices. The study was unable to incorporate the role of climate change or variability, which could potentially enhance forecasting accuracy. This is also in line with the necessity of depicting lon- term drought patterns such as SPI-48.
Future studies may investigate the impact of data pre-processing or data clustering techniques to augment the predictive precision of the SPI-3 model. Furthermore, the adaptability of the XgBoost–INFO approach could be tested in relation to other unpredictable hydrological events. Additionally, examining the effectiveness of the model for hydrological drought forecasting could be an important expansion of this work, considering the substantial implications of accurate forecasting on water budgets, employment, and household (individual) incomes. Future studies could also focus on different regional contexts and varying temporal scales, integrating additional climatic and non-climatic predictors. The role of climate change and variability is another critical factor which future models should aim to integrate, as it could offer a more holistic understanding of drought event prediction.

5. Conclusions

This research details the optimization and validation process of a new technique known as a hybrid boosting regression model (BRM), designed to model meteorological drought events (i.e., SPI-3, SPI-6 and SPI-12). The effectiveness of this new method was tested by predicting the well-known monthly SPI-3, SPI-6 and SPI-12 time series in the province of Izmir, Türkiye. Different statistical metrics were used to evaluate and assess the models. The results revealed that the XgBoost–INFO method delivered the most accurate results for both time scales. However, when it came to SPI-3 modeling, there is a certain limitation in the model accuracy. To increase this predictive precision, future studies could investigate the impact of data pre-processing or data clustering techniques. As for potential uses for the model proposed, it is important to underscore that the XgBoost–INFO approach can be adapted to similar research domains related to several other unpredictable hydrological events. It was concluded that:
  • XgBoost–INFO offers a fast convergence speed and can efficiently reach its optimal solution effectively.
  • A pointwise multi-station drought prediction method can be employed to develop a road map and enhance resilience in water resource management.
  • The Kucuk Menderes Basin and the city of Izmir are susceptible to future droughts, emphasizing the need for concerted action.
The scope of the current study is limited to meteorological drought modeling. However, future research may consider investigating the effectiveness of the model in hydrological drought forecasting to broaden the scope of understanding in this field.

Author Contributions

Conceptualization, E.G., E.S. and M.J.S.S.; Methodology, E.G., E.S. and M.J.S.S.; Software, E.G. and E.S.; Validation, M.J.S.S. and B.V.; Formal Analysis, E.S., M.J.S.S. and B.V.; Investigation, E.G. and E.S.; Resources, M.J.S.S.; Data Curation, M.J.S.S.; Writing (Original Draft Preparation), E.G. and E.S.; Writing—Review and Editing, M.J.S.S. and B.V.; Visualization, E.G. and E.S.; Supervision, M.J.S.S.; Project Administration, M.J.S.S.; Funding Acquisition, M.J.S.S. All authors have read and agreed to the published version of the manuscript.

Funding

This study is supported by Yasar University, BAP 095 project entitled “Drought Assessment in Izmir District, Turkey”, under the coordination of the third author (M.J.S. Safari).

Institutional Review Board Statement

Not applicable.

Informed Consent Statement

Not applicable.

Data Availability Statement

Not applicable.

Acknowledgments

The authors want to express their gratitude to the Turkish Meteorology General Directorate (MGM) for providing the database used in this study.

Conflicts of Interest

The authors declare no conflict of interest. The sponsors had no role in the design, execution, interpretation, or writing of the study.

References

  1. Yihdego, Y.; Vaheddoost, B.; Al-Weshah, R.A. Drought indices and indicators revisited. Arab. J. Geosci. 2019, 12, 69. [Google Scholar] [CrossRef]
  2. Vaheddoost, B.; Safari, M.J.S. Application of signal processing in tracking meteorological drought in a mountainous region. Pure Appl. Geophys. 2021, 178, 1943–1957. [Google Scholar] [CrossRef]
  3. Dabanlı, İ.; Mishra, A.K.; Şen, Z. Long-term spatio-temporal drought variability in Turkey. J. Hydrol. 2017, 552, 779–792. [Google Scholar] [CrossRef]
  4. Dai, A. Characteristics and trends in various forms of the Palmer Drought Severity Index during 1900–2008. J. Geophys. Res. Atmos. 2011, 116, D12115. [Google Scholar] [CrossRef] [Green Version]
  5. Das, S.; Das, J.; Umamahesh, N.V. Identification of future meteorological drought hotspots over Indian region: A study based on NEX-GDDP data. Int. J. Climatol. 2021, 41, 5644–5662. [Google Scholar] [CrossRef]
  6. Das, S.; Das, J.; Umamahesh, N.V. Investigating the propagation of droughts under the influence of large-scale climate indices in India. J. Hydrol. 2022, 610, 127900. [Google Scholar] [CrossRef]
  7. Rashad, M.; Hafez, M.; Popov, A.I. Humic substances composition and properties as an environmentally sustainable system: A review and way forward to soil conservation. J. Plant Nutr. 2022, 45, 1072–1122. [Google Scholar] [CrossRef]
  8. Hafez, M.; Popov, A.I.; Rashad, M. Evaluation of the effects of new environmental additives compared to mineral fertilizers on the leaching characteristics of some anions and cations under greenhouse plant growth of saline-sodic soils. Open Agric. J. 2020, 14, 246–256. [Google Scholar] [CrossRef]
  9. Das, S.; Das, J.; Umamahesh, N.V. Copula-based drought risk analysis on rainfed agriculture under stationary and non-stationary settings. Hydrol. Sci. J. 2022, 67, 1683–1701. [Google Scholar] [CrossRef]
  10. Tsakiris, G.; Vangelis, H. Establishing a drought index incorporating evapotranspiration. Eur. Water 2005, 9, 3–11. [Google Scholar]
  11. Morid, S.; Smakhtin, V.; Moghaddasi, M. Comparison of seven meteorological indices for drought monitoring in Iran. Int. J. Climatol. J. R. Meteorol. Soc. 2006, 26, 971–985. [Google Scholar] [CrossRef]
  12. Tsakiris, G.; Vangelis, H. Towards a drought watch system based on spatial SPI. Water Resour. Manag. 2004, 18, 1–12. [Google Scholar] [CrossRef]
  13. Tsakiris, G.; Pangalou, D.; Vangelis, H. Regional drought assessment based on the Reconnaissance Drought Index (RDI). Water Resour. Manag. 2007, 21, 821–833. [Google Scholar] [CrossRef]
  14. Nalbantis, I.; Tsakiris, G. Assessment of hydrological drought revisited. Water Resour. Manag. 2009, 23, 881–897. [Google Scholar] [CrossRef]
  15. Karavitis, C.A.; Alexandris, S.; Tsesmelis, D.E.; Athanasopoulos, G. Application of the standardized precipitation index (SPI) in Greece. Water 2011, 3, 787–805. [Google Scholar] [CrossRef]
  16. Spiliotis, M.; Papadopoulos, C.; Angelidis, P.; Papadopoulos, B. Classifying hydrological drought through fuzzy sets. Eur. Water 2020, 71, 41–61. [Google Scholar]
  17. Dehghani, M.; Saghafian, B.; Nasiri Saleh, F.; Farokhnia, A.; Noori, R. Uncertainty analysis of streamflow drought forecast using artificial neural networks and Monte-Carlo simulation. Int. J. Climatol. 2014, 34, 1169–1180. [Google Scholar] [CrossRef]
  18. Barua, S.; Ng, A.W.M.; Perera, B.J.C. Artificial neural network–based drought forecasting using a nonlinear aggregated drought index. J. Hydrol. Eng. 2012, 17, 1408–1413. [Google Scholar] [CrossRef]
  19. Bacanli, U.G.; Firat, M.; Dikbas, F. Adaptive neuro-fuzzy inference system for drought forecasting. Stoch. Environ. Res. Risk Assess. 2009, 23, 1143–1154. [Google Scholar] [CrossRef]
  20. Nourani, V.; Baghanam, A.H.; Adamowski, J.; Kisi, O. Applications of hybrid wavelet–artificial intelligence models in hydrology: A review. J. Hydrol. 2014, 514, 358–377. [Google Scholar] [CrossRef]
  21. Mishra, A.K.; Desai, V.R.; Singh, V.P. Drought forecasting using a hybrid stochastic and neural network model. J. Hydrol. Eng. 2007, 12, 626–638. [Google Scholar] [CrossRef]
  22. Mehr, A.D.; Vaheddoost, B.; Mohammadi, B. ENN-SA: A novel neuro-annealing model for multi-station drought prediction. Comput. Geosci. 2020, 145, 104622. [Google Scholar] [CrossRef]
  23. Babajide Mustapha, I.; Saeed, F. Bioactive molecule prediction using extreme gradient boosting. Molecules 2016, 21, 983. [Google Scholar] [CrossRef] [Green Version]
  24. Chen, T.; Guestrin, C. Xgboost: A scalable tree boosting system. In Proceedings of the 22nd ACM SIGKDD International Conference on Knowledge Discovery and Data Mining, San Francisco, CA, USA, 13–17 August 2016; pp. 785–794. [Google Scholar]
  25. Fan, J.; Wang, X.; Wu, L.; Zhou, H.; Zhang, F.; Yu, X.; Lu, X.; Xiang, Y. Comparison of Support Vector Machine and Extreme Gradient Boosting for predicting daily global solar radiation using temperature and precipitation in humid subtropical climates: A case study in China. Energy Convers. Manag. 2018, 164, 102–111. [Google Scholar] [CrossRef]
  26. Carmona, P.; Climent, F.; Momparler, A. Predicting failure in the US banking sector: An extreme gradient boosting approach. Int. Rev. Econ. Financ. 2019, 61, 304–323. [Google Scholar] [CrossRef]
  27. Zhang, R.; Chen, Z.-Y.; Xu, L.-J.; Ou, C.-Q. Meteorological drought forecasting based on a statistical model with machine learning techniques in Shaanxi province, China. Sci. Total Environ. 2019, 665, 338–346. [Google Scholar] [CrossRef]
  28. Danandeh Mehr, A.; Tur, R.; Alee, M.M.; Gul, E.; Nourani, V.; Shoaei, S.; Mohammadi, B. Optimizing Extreme Learning Machine for Drought Forecasting: Water Cycle vs. Bacterial Foraging. Sustainability 2023, 15, 3923. [Google Scholar] [CrossRef]
  29. Janizadeh, S.; Vafakhah, M.; Kapelan, Z.; Mobarghaee Dinan, N. Hybrid XGboost model with various Bayesian hyperparameter optimization algorithms for flood hazard susceptibility modeling. Geocarto Int. 2022, 37, 8273–8292. [Google Scholar] [CrossRef]
  30. Mersin, D.; Gulmez, A.; Safari, M.J.S.; Vaheddoost, B.; Tayfur, G. Drought Assessment in the Aegean Region of Turkey. Pure Appl. Geophys. 2022, 179, 3035–3053. [Google Scholar] [CrossRef]
  31. McKee, T.B.; Doesken, N.J.; Kleist, J. The relationship of drought frequency and duration to time scales. In Proceedings of the 8th Conference on Applied Climatology, Anaheim, CA, USA, 17–22 January 1993; pp. 179–183. [Google Scholar]
  32. McKee, T.B. Drought monitoring with multiple time scales. In Proceedings of the 9th Conference on Applied Climatology, Dallas, TX, USA, 15–20 January 1995. [Google Scholar]
  33. Wu, H.; Hayes, M.J.; Wilhite, D.A.; Svoboda, M.D. The effect of the length of record on the standardized precipitation index calculation. Int. J. Climatol. J. R. Meteorol. Soc. 2005, 25, 505–520. [Google Scholar] [CrossRef] [Green Version]
  34. Pandey, M.; Karbasi, M.; Jamei, M.; Malik, A.; Pu, J.H. A Comprehensive Experimental and Computational Investigation on Estimation of Scour Depth at Bridge Abutment: Emerging Ensemble Intelligent Systems. Water Resour. Manag. 2023, 37, 3745–3767. [Google Scholar] [CrossRef]
  35. Ma, M.; Zhao, G.; He, B.; Li, Q.; Dong, H.; Wang, S.; Wang, Z. XGBoost-based method for flash flood risk assessment. J. Hydrol. 2021, 598, 126382. [Google Scholar] [CrossRef]
  36. Margineantu, D.D.; Dietterich, T.G. Pruning adaptive boosting. In Proceedings of the Fourteenth International Conference on Machine Learning (ICML 1997), Nashville, TN, USA, 8–12 July 1997; pp. 211–218. [Google Scholar]
  37. Feng, D.-C.; Liu, Z.-T.; Wang, X.-D.; Chen, Y.; Chang, J.-Q.; Wei, D.-F.; Jiang, Z.-M. Machine learning-based compressive strength prediction for concrete: An adaptive boosting approach. Constr. Build. Mater. 2020, 230, 117000. [Google Scholar] [CrossRef]
  38. Singh, U.K.; Jamei, M.; Karbasi, M.; Malik, A.; Pandey, M. Application of a modern multi-level ensemble approach for the estimation of critical shear stress in cohesive sediment mixture. J. Hydrol. 2022, 607, 127549. [Google Scholar] [CrossRef]
  39. Di Persio, L.; Fraccarolo, N. Energy Consumption Forecasts by Gradient Boosting Regression Trees. Mathematics 2023, 11, 1068. [Google Scholar] [CrossRef]
  40. Nie, P.; Roccotelli, M.; Fanti, M.P.; Ming, Z.; Li, Z. Prediction of home energy consumption based on gradient boosting regression tree. Energy Rep. 2021, 7, 1246–1255. [Google Scholar] [CrossRef]
  41. Natekin, A.; Knoll, A. Gradient boosting machines, a tutorial. Front. Neurorobot. 2013, 7, 21. [Google Scholar] [CrossRef] [Green Version]
  42. Ahmadianfar, I.; Heidari, A.A.; Noshadian, S.; Chen, H.; Gandomi, A.H. INFO: An efficient optimization algorithm based on weighted mean of vectors. Expert Syst. Appl. 2022, 195, 116516. [Google Scholar] [CrossRef]
  43. Ikram, R.M.A.; Mostafa, R.R.; Chen, Z.; Parmar, K.S.; Kisi, O.; Zounemat-Kermani, M. Water temperature prediction using improved deep learning methods through reptile search algorithm and weighted mean of vectors optimizer. J. Mar. Sci. Eng. 2023, 11, 259. [Google Scholar] [CrossRef]
  44. Pan, S.; Zheng, Z.; Guo, Z.; Luo, H. An optimized XGBoost method for predicting reservoir porosity using petrophysical logs. J. Pet. Sci. Eng. 2022, 208, 109520. [Google Scholar] [CrossRef]
  45. Belayneh, A.; Adamowski, J.; Khalil, B.; Ozga-Zielinski, B. Long-term SPI drought forecasting in the Awash River Basin in Ethiopia using wavelet neural network and wavelet support vector regression models. J. Hydrol. 2014, 508, 418–429. [Google Scholar] [CrossRef]
  46. Laimighofer, J.; Laaha, G. How standard are standardized drought indices? Uncertainty components for the SPI & SPEI case. J. Hydrol. 2022, 613, 128385. [Google Scholar]
  47. Carbone, G.J.; Lu, J.; Brunetti, M.J.I.J.o.C. Estimating uncertainty associated with the standardized precipitation index. Int. J. Climatol. 2018, 38, e607–e616. [Google Scholar] [CrossRef]
  48. AghaKouchak, A.; Pan, B.; Mazdiyasni, O.; Sadegh, M.; Jiwa, S.; Zhang, W.; Love, C.A.; Madadgar, S.; Papalexiou, S.M.; Davis, S.J. Status and prospects for drought forecasting: Opportunities in artificial intelligence and hybrid physical–statistical forecasting. Philos. Trans. R. Soc. A 2022, 380, 20210288. [Google Scholar] [CrossRef]
  49. Mishra, A.K.; Singh, V.P. Drought modeling—A review. J. Hydrol. 2011, 403, 157–175. [Google Scholar] [CrossRef]
  50. Vaheddoost, B.; Aksoy, H.; Abghari, H. Prediction of water level using monthly lagged data in Lake Urmia, Iran. Water Resour. Manag. 2016, 30, 4951–4967. [Google Scholar] [CrossRef]
  51. Saadatnejadgharahassanlou, H.; Zeynali, R.I.; Vaheddoost, B.; Gharehbaghi, A. Parametric and nonparametric regression models in study of the length of hydraulic jump after a multi-segment sharp-crested V-notch weir. Water Supply 2020, 20, 809–818. [Google Scholar] [CrossRef]
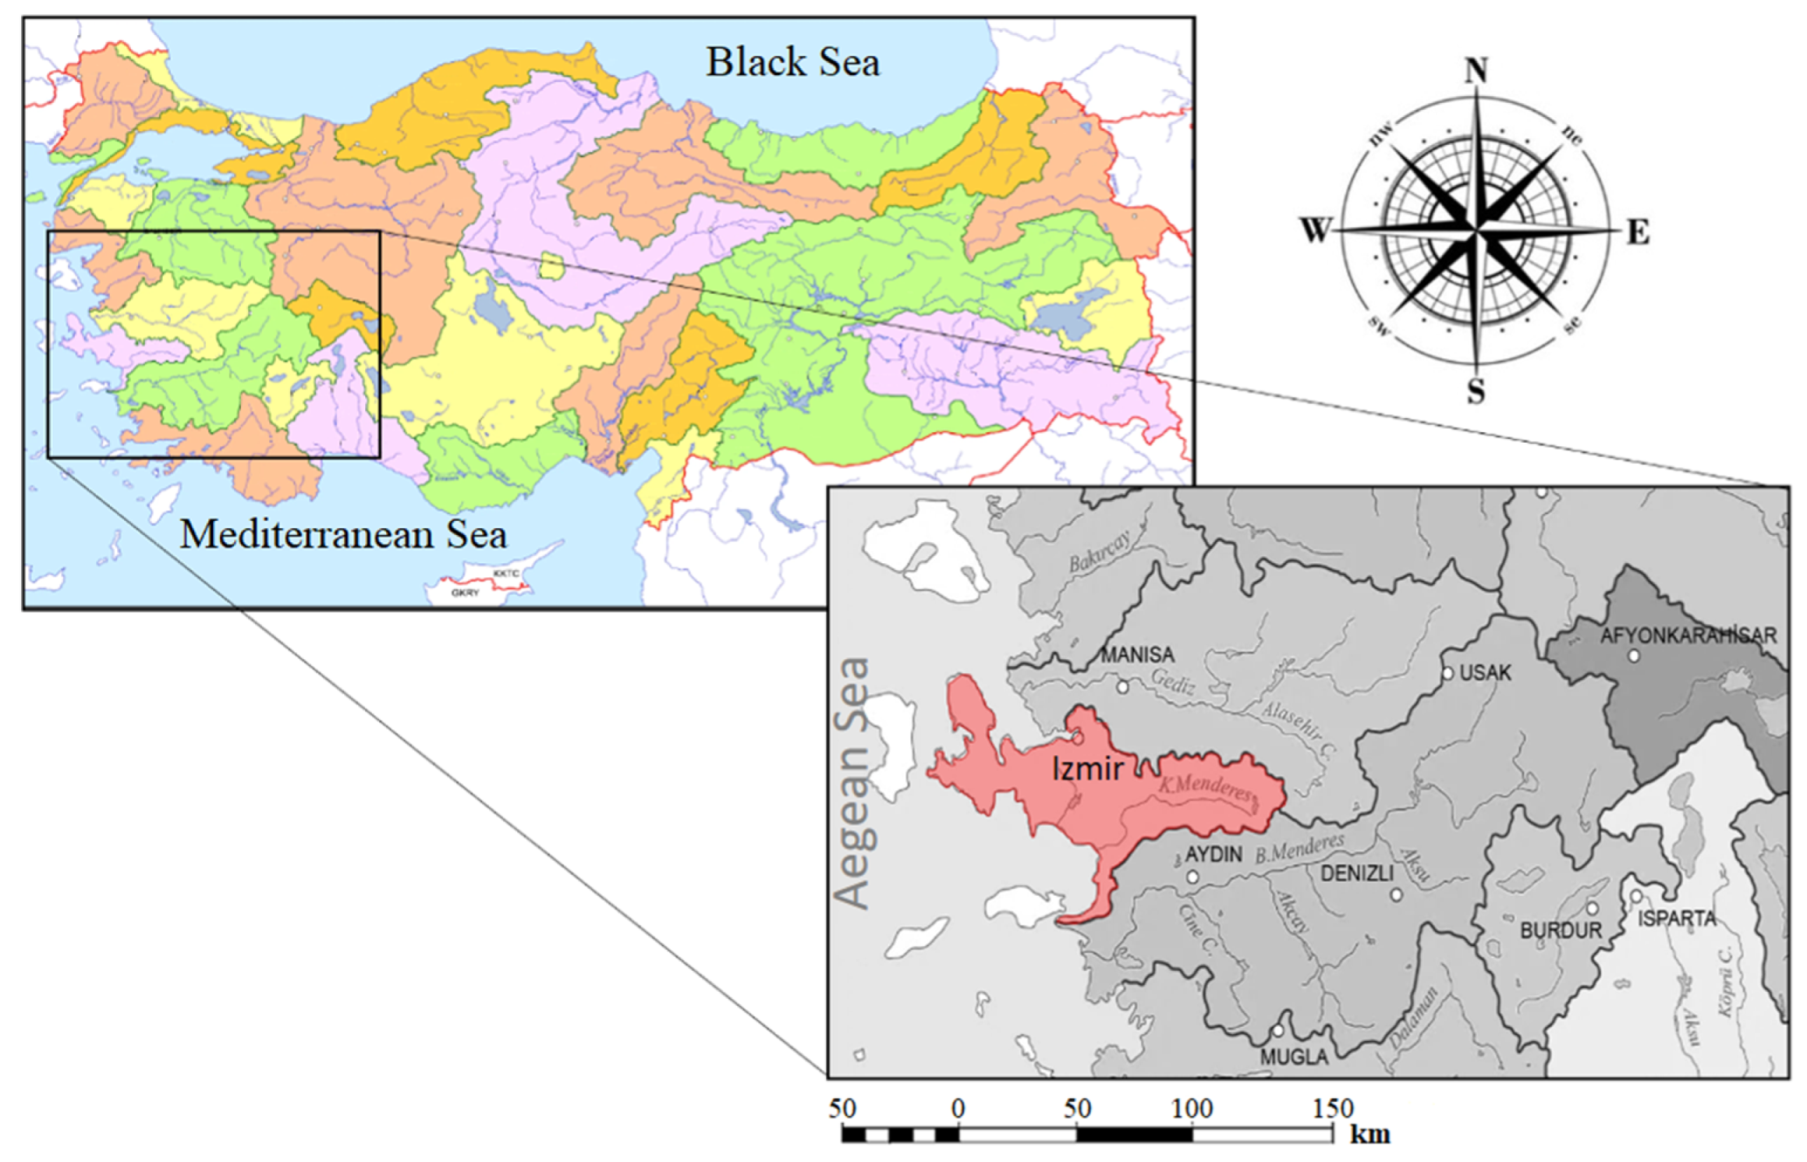
Figure 1. Study area (The Kucuk Menderes Basin).
Sustainability 15 11568 g001
Figure 2. XgBoost model structure.
Sustainability 15 11568 g002
Figure 3. Flowchart of the hybridization of BRMs and INFO.
Sustainability 15 11568 g003
Figure 4. Scatter plot of SPI-3, SPI-6 and SPI-12 in training stage for BRMs.
Sustainability 15 11568 g004
Figure 5. Scatter plot of SPI-3, SPI-6 and SPI-12 in test stage for BRMs.
Sustainability 15 11568 g005aSustainability 15 11568 g005b
Table 1. Hyperparameters of the BRMs and setting range.
HyperparametersModelsRangeData Type
Number of the gradient boosted trees (n_estimators)XgBoost, AdaBoost, GradBoost50–700integer
Learning rate (learning_rate)XgBoost, AdaBoost, GradBoost0.01–0.1float
Maximum depth of a treeXgBoost, GradBoost1–3integer
Regular term of weight L2 (lambda)XgBoost0.01–0.1float
Regular term of weight L1 (alpha)XgBoost, GradBoost0.01–0.1float
Minimum loss reduction needed for partitioning a leaf node of a tree (gamma)XgBoost0.01–0.1float
Minimum sum of the instance weights contained in child nodes (min_child_weight)XgBoost0.01–0.1İnteger
Loss functionAdaBoost
Table 2. Statistics of the SPI time series in the selected stations.
StationRangeKurtosisSkewnessMeanStandard Deviation
Seferihisar−2.71~2.860.41−0.300.220.90
Cesme−3.17~2.930.53−0.300.170.90
Kusadasi−3.38~3.410.91−0.080.040.91
Manisa−3.57~3.640.76−0.270.200.94
Selcuk1.02~−0.2531.02−0.100.230.92
Izmir−2.9~2.730.39−0.250.110.91
Table 3. Performance of the BRMs for SPI-3, SPI-6 and SPI-12.
StageRMSEMAEMAPER2WIModelMonth
Train0.4940.3981.5010.7570.917AdaBoostSPI3
Test0.5460.4221.4080.6340.871
Validation0.6710.5441.1040.6440.871
Train0.5230.3931.3870.7230.905XgBoost
Test0.4960.4011.2410.7040.899
Validation0.6950.5511.1100.6220.858
Train0.5860.4421.1690.7250.849GradBoost
Test0.5480.4321.0540.7040.842
Validation0.7560.6020.9660.6120.789
Train0.4020.3381.2200.8550.954AdaBoostSPI6
Test0.4370.3311.3190.6810.899
Validation0.5790.4711.8420.7180.910
Train0.3250.2290.8670.9060.971XgBoost
Test0.4290.3511.4900.7140.901
Validation0.5990.4812.1460.7040.908
Train0.3560.2650.8970.9040.962GradBoost
Test0.4260.3491.5030.7310.895
Validation0.5940.4852.0910.7090.902
Train0.3190.2690.8500.9120.976AdaBoostSPI12
Test0.3470.2651.0380.7060.863
Validation0.6550.5271.1180.6270.886
Train0.2320.1720.5740.9540.987XgBoost
Test0.3890.3101.3560.5730.825
Validation0.7310.5771.2040.5500.859
Train0.0230.0190.0631.0001.000GradBoost
Test0.3770.3091.1140.5860.849
Validation0.6820.5491.1190.6010.878
Disclaimer/Publisher’s Note: The statements, opinions and data contained in all publications are solely those of the individual author(s) and contributor(s) and not of MDPI and/or the editor(s). MDPI and/or the editor(s) disclaim responsibility for any injury to people or property resulting from any ideas, methods, instructions or products referred to in the content.