Article

Meteorological Drought Assessment and Trend Analysis in Puntland Region of Somalia

by
Nur Mohamed Muse
1,
Gokmen Tayfur
1 and
Mir Jafar Sadegh Safari
2,*
1
Department of Civil Engineering, Izmir Institute of Technology, Izmir 35430, Turkey
2
Department of Civil Engineering, Yaşar University, Izmir 35100, Turkey
*
Author to whom correspondence should be addressed.
Sustainability 2023, 15(13), 10652; https://doi.org/10.3390/su151310652
Submission received: 28 March 2023 / Revised: 28 June 2023 / Accepted: 4 July 2023 / Published: 6 July 2023
(This article belongs to the Special Issue Drought and Sustainable Water Management)

Abstract

:
Drought assessment and trend analysis of precipitation and temperature time series are essential in the planning and management of water resources. Long-term precipitation and temperature historical records (monthly for 41 years, from 1980 to 2020) are used to investigate annual drought characteristics and trend analysis in Somalia’s northern region. Six drought indices of the normal Standardized Precipitation Index (normal-SPI), the log normal Standardized Precipitation Index (log-SPI), the Standardized Precipitation Index using the gamma distribution (Gamma-SPI), the Percent of Normal Index (PNI), the Discrepancy Precipitation Index (DPI), and the Deciles Index (DI) are used in this study for the annual drought assessment. The log-SPI, the gamma-SPI, the PNI, and the DPI could capture historical extreme and severe droughts that occurred in the early 1980s and over the last two decades. The results indicate that Somalia has gone through extended drought periods over the past quarter century, exacerbating the existing humanitarian situation. The normal-SPI, gamma-SPI, and PNI indicate less and moderate drought conditions, whereas log-SPI, DPI, and DI accurately capture historical extreme and severe drought periods; thus, these methods are recommended as annual drought assessment tools in the studied region. Not only are the PNI and DPI less correlated to each other, but their correlation coefficient (CC) with SPI-based drought indices are not as high as SPI-based indices which are close to unity. For the purpose of the trend analysis, the Mann Kendall (MK) test, the Spearman’s rho (SR) test, and the Şen test are used. Furthermore, the Pettitt test is implemented to detect the change points and the Thiel-Sen approach is used to estimate the magnitude of trend in the precipitation and temperature time series. The results indicate that there is overall warming in the region which has experienced a significant shift in trend direction since 2000. The trend analysis of annual precipitation data time series shows that Bossaso and Garowe stations have significant positive trends, while the Qardho station has no trend. In 1997 and 1998, respectively, abrupt changes in annual precipitation are detected at Qardho and Garowe stations. Due to the civil war of more than three decades in Somalia and the non-institutionalized governance to inform historical drought conditions in the country, determining the most appropriate meteorological drought index would help to develop a drought monitoring system for states and the entire country.

1. Introduction

Drought is a natural disaster that occurs due to less precipitation than average over a lengthy period of time in a region, affecting natural environmental functions and human activities. Inadequate rainfall can reduce soil moisture or groundwater, decrease river flow, cause agricultural failure, and cause water scarcity. Malnutrition and death are primarily caused by shortages of food and water [1,2]. Drought has both immediate and long-term effects on the environment and the economy. It is regarded as a natural hazard that can lead to mass migration. It has killed more than 11 million people and harmed 2 billion people since the 19th century, far more than any other natural disaster. Droughts can happen in almost every part of the world, even in wet places [3]. Droughts can last for several weeks, months, years, a decade, or longer in some regions. The longer a drought exists, the worse the consequences for humans are. Droughts cause water and food insecurity, especially in developing countries, and worsen hunger and civil unrest problems.
Drought can be classified into four categories as meteorological, agricultural, hydrological, and socioeconomic. Meteorological drought is described as a lack of precipitation across a region for an extended period of time, typically accompanied by high temperatures, high winds, and low humidity, all of which can cause potential evapotranspiration to increase. Agricultural drought can be defined as the varying vulnerability of crops at different stages of development, from emergence through maturity [1]. Agriculture drought is the first economic sector that could be influenced by weather conditions. Low precipitation may impact streamflow, lake, and reservoir levels and may cause their elevations to drop to abnormally low levels as a result. Hydrological drought refers to the effects of periods of rainfall or snowfall shortages on surface or subsurface water supplies, including streamflow, reservoir, and groundwater. Watershed or river basin scales are frequently used for analysis of hydrological drought’s frequency and severity. Although all droughts begin with a lack of rainfall, hydrologists are primarily interested in how precipitation manifests itself in the hydrologic system. Hydrological droughts frequently occur concurrently with or later than meteorological and agricultural droughts. Precipitation shortfalls require time to express themselves in components of the hydrological system such as soil moisture, streamflow, groundwater, and reservoir levels. Socioeconomic drought negatively impacts people’s health, quality of life, and the supply of goods and services to a community [4,5,6].
Climate change and human activities have increased greenhouse gas emissions into the atmosphere, leading to a sustained rise in global average temperatures [7,8,9]. As a result, evapotranspiration rates have increased, and higher temperatures have resulted in wildfires and longer dry spells. As a result of global warming, droughts are becoming more common [10,11]. To this end, historical droughts should be investigated in terms of causes and impacts during their occurrences. Drought mitigation should be done in three stages: before, during, and after the drought. Not only would the consequences be considerably decreased, but also they would be at a low cost.
Somalia has been engulfed in civil war for nearly two decades, resulting in non-institutionalized governance [5,11,12,13]. Drought research is hampered by war, making it challenging to raise drought awareness. In Somalia, there is currently no national drought monitor in place. Therefore, determining the most appropriate meteorological drought index would help authorities to develop a drought monitoring system for states and the entire country. This technique can give decision-makers in the region a clear picture of the drought risk and allow them to take preventative steps. Many earlier studies in Somalia on drought incidences have concentrated on crisis management [11,12,13] rather than examining drought occurrence patterns and regional distribution. Hence, there is an obvious need to better understand historical drought to build a strategy for mitigating drought-related impacts in the future. Drought monitoring is an essential issue for predicting and analyzing drought consequences. Droughts in Somalia’s especially semi-arid Puntland state have resulted in thousands of people and livestock deaths and significant economic consequences for the agricultural sector due to the uneven temporal and spatial distribution of rainfall.
The main contributions of this study are as follows:
(i)
This is a problem-oriented study aiming at providing insights for the decision-makers in the region to have a clear picture of the drought risk and allow them to take preventative steps. More than three decades of civil war in Somalia have resulted in the non-institutionalized governance to inform historical drought conditions in the country.
(ii)
This study aims to investigate and assess the duration and severity of meteorological droughts using different meteorological indices due to no single index that can represent all aspects of meteorological drought. To this end, Percent of Normal Index (PNI), Deciles Index (DI), Standardized Precipitation Index (normal-SPI, gamma-SPI, log-SPI), and Discrepancy Precipitation Index (DPI) are utilized.
(iii)
This study aims to identify the annual precipitation and temperature trends during 1980–2020 in the Puntland region of Somalia. To the best knowledge of the authors, no comprehensive study has yet been conducted to investigate the trends and turn points events for the temperature and precipitation time series in Puntland region of Somalia in the literature. This study might give insights to the water resources planning in the region under climate change conditions.
The PNI, DI, and DPI indices are applied to annual data series, and their computations are quite simple. PNI and DPI require normal distribution of the data while DPI does not require any imposing of any probability distribution function [14]. The SPI methods require normal distribution, log-normal distribution, or gamma-distribution [6]. However, these methods can also be applied to shorter periods (monthly, three-month, and six-month) drought assessments. More details on the limitations and advantages of different drought indices can be found in Mihsra and Singh [6].

2. Study Area

Somalia, with a total land area of 637 km2, is a peninsula in Africa’s north eastern region, bordered by three other countries on three sides; Djibouti is located in northwest, Ethiopia on the western edge, and Kenya in the southwest. Somalia is surrounded by three bodies of water: Gulf of Aden, Indian Ocean, and Guardafui Channel. The topography in Somalia can be distinguished as five distinct physio-geographic zones as follows: (i) plains along the northern coast known as Guban, (ii) the northern Golis mountain range and the plateaus, (iii) the central coastal plains, (iv) the broad limestone-sandstone plateau that spans most of central and southern Somalia, and (v) the part of south flood plains which have the highest potential for agricultural production. Somalia’s climate has no significant seasonal variation due to its closeness to the equator. However, certain unpredictable rainstorms occur from time to time. The average daily maximum temperature ranges from 25 °C to 40 °C. The average daily minimum temperature varies from 15 °C to 20 °C, except for high altitudes along the eastern seaboard. The annual precipitation in the northeastern region is less than 90 mm and approximately 200 mm to 300 mm in the central highlands. However, the northwest and southwestern parts of the country receive more rain, averaging from 410 mm to 510 mm per year.
Rainfall is typically in the form of scattered showers or severe downpours, and it is highly unpredictable. In Somalia, there are four distinct seasons: (i) Jilal season, which lasts from December up to March and is the driest and most challenging time of the year; (ii) Gu season, or primary rainy season, which lasts from April to June and is the wettest period of the year. The rains, which originate in the southwest, revitalize the pasture area, particularly on the central plateau, and the desert quickly changes into lush flora during this period; (iii) Hagaa season is the second dry season, which lasts from July to September and is the driest period of the year; and (iv) Deyr season which includes the second and shorter rainy season from October to November.
Except for those living along Juba and Shabelle rivers, all regions in Somalia rely on groundwater for domestic water, livestock, and small-scale agriculture. There is a deficiency in rain, and there is no perennial surface water in most parts of the country. Boreholes, shallow wells, and springs are Somalia’s most common groundwater resources. Residents in rural and urban areas use groundwater to meet their domestic and livestock water demands and small-scale irrigation. The most common groundwater resources are shallow wells (manual drilling), wells, springs, subsurface dams, and infiltration galleries. The region uses important groundwater resources such as dug wells, boreholes, and springs.
Puntland is a state in north eastern Somalia, bordering the Gulf of Aden to the north and the Indian Ocean to the southeast (Figure 1). Puntland has a population of about 2.4 million people and covers about one-third of the country’s geographical area of 212,500 km2. The state’s climate is described as semi-arid with a warm climate. There are two rainy seasons of Gu and Deyr as described above with a poor rainfall distribution pattern of 27–250 mm annually. Most of Puntland territory is arid rangelands, and it is best suited for livestock grazing and not for crop production due to the general scarcity of water and the saline soils with high content of salt deposits.
The National Office of Meteorology of Somalia provided the data used in this study. The meteorological data from three meteorological stations (Bossaso, Qardho and Garowe) located in Puntland region are used (Figure 1). Precipitation and maximum and minimum temperatures time series are shown in Figure 2, Figure 3 and Figure 4, respectively. The data involved the long-term monthly precipitation and temperature historical records from 1980 to 2020. This study, however, employed the annual data, based on the recorded monthly data, to investigate the annual drought characteristics and trend analysis in Somalia’s northern region.

3. Methods

The Standardized Precipitation Index (log-SPI, normal-SPI, and gamma-SPI), Deciles Index (DI), Discrepancy Precipitation Index (DPI), and Percentage of Normal Index (PNI) are used in this study to detect annual meteorological drought based on monthly precipitation data in the three stations in Puntland state of Somalia. In order to identify trends in the precipitation and temperature time series, the Mann Kendall (MK) test, Spearman’s rho (SR) test, Şen trend test, Pettitt test, and Thiel-Sen technique are used.

3.1. Drought Indices

3.1.1. Standardized Precipitation Index Methods

The Standardized Precipitation Index methods (normal-SPI, log-SPI, and gamma-SPI) are extensively used for evaluating the severity of meteorological drought. A long-term precipitation series [6] can be used to calculate the index established by Mckee et al. [15]. The drought classification is the same for each index, as presented in Table 1 where the negative SPI illustrates dry periods, while positive SPI values indicate wet periods [16].

Normal-SPI

The normal-SPI uses the normal probability distribution [17]. In terms of mathematics, it is straightforward to compute, and in this example, the SPI index can be expressed as follows:
S P I = Z = x μ ^ σ ^
where x is a precipitation value; Z is the standardized precipitation value; and μ ^ and σ ^ are the mean and standard deviation of precipitation data, respectively.

Log-SPI

Similar to the gamma distribution, the log-normal distribution is positively skewed and non-negative. It is a logarithmic modification of the data and has the advantage of simplicity [18]. The log-normal SPI is determined as follows:
S P I = Z = ln ( x ) μ ^ σ ^

Gamma-SPI

Gamma-SPI is the most widely applied observational model for precipitation data. It involves fitting a gamma probability density function to a given time series of precipitation [19]. Its probability density function is defined as
g ( x ) = 1 β α Γ ( α ) x α 1 e π β   for   x > 0
where β and α and are the shape and scale parameters, respectively, and Γ(α) is the Gamma function defined by [20]:
Γ ( α ) = 0   γ α 1 e y d y
α and β parameters can be estimated as follows:
α = 1 4 A 1 + 1 + 4 A 3
β = x ¯ α
with
A = ln ( x ¯ ) ln ( x ) n
where n is the number of observations and x ¯ represents the average precipitation. After estimating the coefficients, the probability density function is integrated concerning x, which yields the following expression for the cumulative probability:
G ( x ) = 0 x   g ( x ) d x = 1 β α Γ ( α ) 0 x   x α 1 e x / β d x
Substituting t for x/β
G ( x ) = 1 Γ ( α ) 0 x   t α 1 e t d t
can be obtained. As the gamma function is not defined for x = 0, for the possibility of zero values, the cumulative probability is
H ( x ) = q + ( 1 q ) G ( x )
in which q is zero probability. In the case of zero precipitation probability (q), the cumulative probability distribution is transformed into the standard normal distribution.

3.1.2. Percent of Normal Index (PNI)

The Percent of Normal Index (PNI) is a meteorological drought statistic computed by dividing actual precipitation by average precipitation and multiplying the result by 100 percent to get the percentage of normal [17]. It is typically used to calculate the long-term mean precipitation when at least a 30-year average is considered. The drought index is generally considered as 100 percent monthly, seasonally, and annually, with less than 100 percent of PNI values indicating dry periods. As a result, applying PNI alone cannot give conclusive results. Table 2 shows the PNI drought index classification.

3.1.3. Discrepancy Precipitation Index (DPI)

Tayfur [14] developed the Discrepancy Precipitation Index (DPI) to analyze and monitor the meteorological drought. The method does not apply a probability distribution to the precipitation data; instead, it is based on the mean value discrepancy. The D-score values are used to classify droughts, and drought categorization ranges are identical to the standard precipitation index (SPI). The suggested DPI is based on the discrepancy of precipitation data concerning the mean value. It is mathematically expressed as follows
D P I = D i = log P i P ¯
P ¯ = 1 N i = 1 N   P i = 1,2 , 3 , , N
where Di is the discrepancy value (D-score) for the i-th precipitation, Pi is the precipitation in data series, and P ¯ is the mean value of the precipitation data series-typically considered to be a 30-year mean [17]. Accordingly, once D = 0, Pi is equal to P ¯ , D is positive when Pi > P ¯ , and D is negative when Pi < P ¯ . The drought classification is categorized according to D-score values, as presented in Table 3 [14].

3.1.4. Deciles Index (DI)

Gibbs and Maher [22] proposed the Deciles Index (DI) that involved dividing monthly precipitation data into deciles. DI is a simple tool that takes simple precipitation data and is commonly used in Australia. To generate a cumulative frequency distribution using the DI approach, long-term total monthly precipitation records were ranked from highest to lowest. Afterwards, the distribution was separated into ten equal deciles, as represented in Table 4.

3.2. Trend Test Methods

3.2.1. Spearman’s Rho Test

This method determines whether or not there is a trend in a data time series. The null hypothesis H0 implies that the presented data are independently and identically distributed across time. In contrast, the alternative hypothesis H0 shows a trend during the period under consideration. Through Spearman’s rho (SR) test statistics D and ZSR are obtained using Equations (13) and (14), respectively, as [23]
D = 6 i = 0 n   R x i i 2 n n 2 1
Z S R = D n 2 1 D 2
where R(xi) is the rank of i-th observation xi within the time series having size of n. In this test, Ho is rejected, and Ha is accepted if |ZSR| > 2.08 for the 5% significance level. Positive values of ZSR indicate the trending decrease, while the negative values indicate an increasing trend.

3.2.2. Mann–Kendall Test

The fundamental goal of the Mann–Kendall test (MK) is to determine whether the variable of interest has a monotonic rising or decreasing trend over time. The term monotonic upward (downward) trend refers to a variable that continuously rises (falls) across time. The null hypothesis H0 and the alternative hypothesis Ha are related to the non-existence and existence of a trend, respectively [23]. The MK test is calculated as follows:
s g n x i x j = 1 ;   I f x j > x i 0 ;   I f x j = x i 1 ;   I f x j < x i
S = i = 1 n 1   j = i + 1 n   s g n x i x j
where xi and xj, respectively, indicate the data values at times i and j, and n is the length of the data set. If S value is positive, the variable consistently increases through time, while the negative value of S indicates a decreasing trend. Equation (17) is used in cases where n is larger than 0 [24].
V a r ( S ) = n ( n 1 ) ( 2 n + 5 ) i = 1 p   t i t i 1 2 t i + 5 18
where p indicates the number of tied groups, and ti is the number of data points in the path group. After the variance of time is provided in Equation (17), the standard Z can be expressed by Equation (18) as follows [23].
Z = S 1 Var S I f   S > 0 0 ; I f   S = 0 S + 1 Var S ; I f   S < 0
The calculated Z value is compared with the standard regular distribution table with two tailed confidence levels. When |Z| > Z1α/2, H0 is rejected, and Ha is accepted, which means there is a significant trend. Otherwise, H0 is accepted, and Ha is rejected, which means the trend is not statistically significant. The significant level of 5%, which refers to Z1α/2 = 1.96, was used for the MK method in this study.

3.2.3. Şen Test

Şen’s linear trend slope method, introduced by Şen [25], is used to determine the trend’s linear slope. According to the Cartesian coordinate system, this method is based on dividing the data’s time series into two equal halves, rating them from highest to lowest, and then plotting them against each other with the first sub-series (xi) on the X-axis and the second sub-series (xj) on the Y-axis.

3.2.4. Thiel-Sen Test

After the identified trend tests, the Thiel-Sen method is utilized to calculate the magnitude of the slope. To explain the Thiel-Sen technique mathematically, Equation (19) can be utilized [23].
β = M e d i a n x j x i j i
where xi and xj denote the time series’ sequential data values in the times i and j, respectively; and β shows the estimated the trend slope in the data time series.

3.2.5. Pettitt’s Test

Pettitt’s test [26] frequently finds a single change-point in a hydro-meteorological time series with ambiguous data. Let t be the time of the transition point for a given time series (x1, x2, …, xn) of length n. By dividing the time series at time t, the samples x1, x2, …, xt and xt+1, xt+2, …, xn can be obtained. Ut as a test statistic can be represented as [27]
U t = i = 1 t   j = i + 1 n   s g n x i x j
s g n x = 1   i f   x > 0 0   i f   x = 0 1   i f   x < 0
The maximum |Ut| at time t can be considered the most significant change point.
The approximated significance change probability P(t) for the change point can be expressed by [27]
P ( t ) = 1 e x p 6 U t 2 n 3 + n 2
When the approximated probability exceeds (1 − α), the change point considered to be a statistically significant level of α.

4. Results

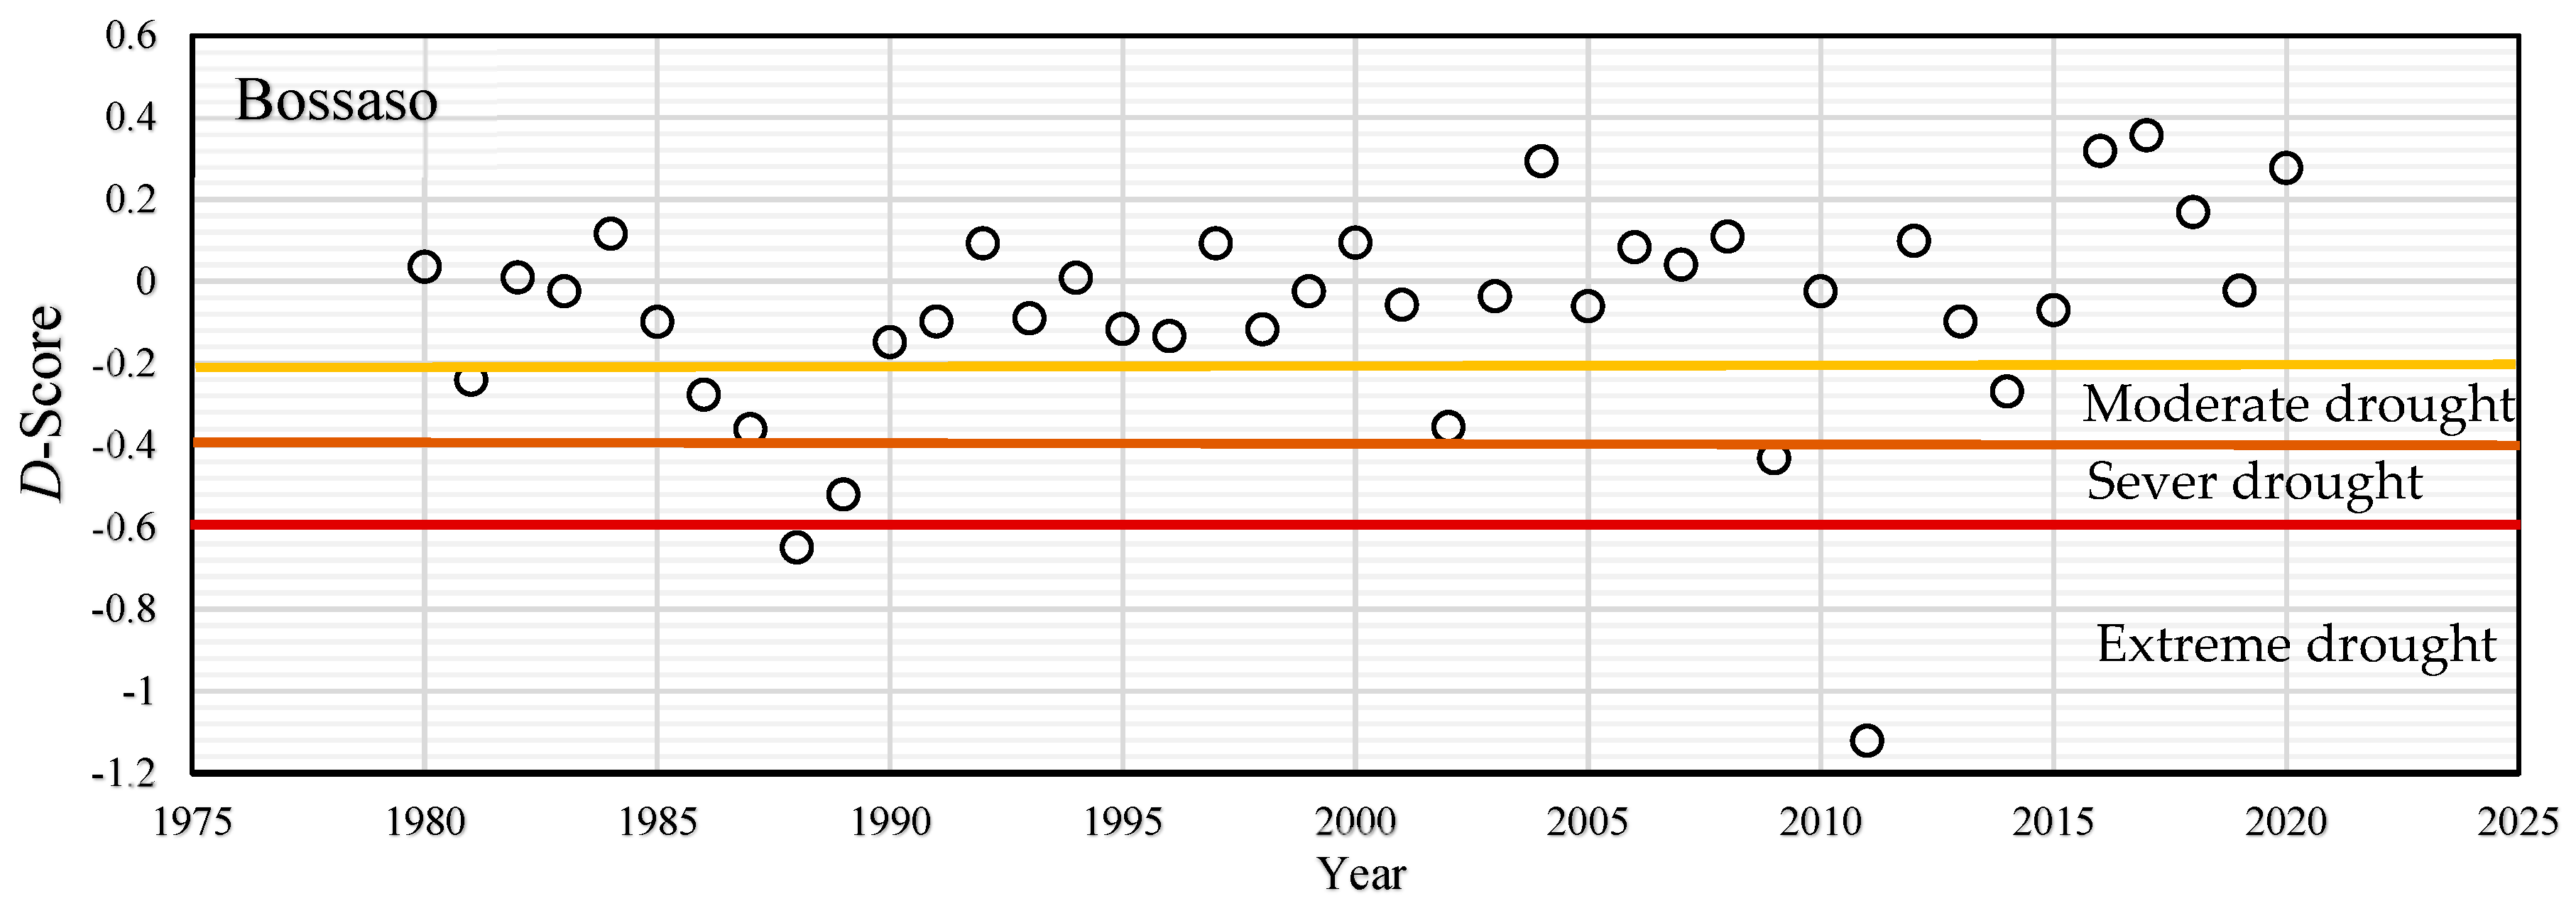
4.1. Drought Analysis

Different drought indices based on monthly precipitation records for 41 years obtained from three stations are investigated. These methods are used to determine the features of drought and to analyze which drought index(es) may be used to evaluate drought in the region. For three stations, Qardho, Bossaso, and Garowe, the Standardized Precipitation Index (Normal-SPI, Log-SPI, and Gamma-SPI), the Percent of Normal Index (PNI), the Deciles Index (DI), and Discrepancy Precipitation Index (DPI) are calculated, as detailed further below.

4.1.1. Bossaso Station

The DPI, SPI, and PNI findings are presented in Figure 5, Figure 6 and Figure 7, respectively, while Table 5 provides a summary of the DI results for the Bossaso Station. It is seen in Figure 5 that Bossaso Station experienced extreme droughts in the years 1988 and 2011 with DPI values of −0.65 and −1.12, respectively; severe droughts in the years 1989 and 2009 with DPI values of −0.52 and −0.43 respectively; and moderate droughts in the years 1981, 1986, 1987, 2002 and 2014 with DPI values of −0.24, −0.28, −0.36, −0.35, and −0.27, respectively. As shown in Figure 6, although there are slight differences for Normal-SPI, Log-SPI, and Gamma-SPI, all of the methods generated the same results. In this case, the log-SPI and the gamma-SPI performed similarly in predicting the severe drought in 2011. The normal-SPI produces wetter and less drought-prone conditions. The data presented in Figure 5, Figure 6 and Figure 7 demonstrate that the extreme drought was identified in 2011, while separate drought events took place in 1988, 1989, and 2009. Long dry spells were observed between the years 1986 and 1989, as well as between 2009 and 2011. According to the DI approach, droughts occurred when annual precipitation was less than 24.98 mm. As shown in Table 5, precipitations less than 22.29 mm/year and 10 mm/year were severe and extreme drought indicators, respectively.

4.1.2. Qardho Station

Figure 8, Figure 9 and Figure 10 show the results of the DPI, SPI, and PNI measurements. DI findings are shown in Table 6. According to the DPI results given in Figure 8 for the Qardho station, it is seen that extreme droughts happened in 2008 and 2011 with DPI values of −1.31 and −1.09, respectively; severe droughts in 1988, 2000 and 2015, with DPI values of −0.47, −0.41, and −0.52, respectively; and moderate droughts in 1980, 1981, 1987, and 2022 with DPI values of −0.22, −0.27, −0.29, and −0.21, respectively. The extreme droughts occurred in 2011 and 2008, as indicated by the Normal-SPI, Log-SPI, Gamma-SPI, and DPI. Normal-SPI, DPI, and PNI show moderate droughts. In the years 2002 and 2004, the Log-SPI and Gamma-SPI captured severe droughts. Droughts in 1981, 2004, 2005, and 2010 were moderate, according to the Log-SPI and DPI. The years 2005 and 2010 were identified as moderate drought years by the Log-SPI and Gamma-SPI. The data presented in Figure 8, Figure 9 and Figure 10 demonstrate that the extreme droughts were identified in 2011, while separate drought events took place in 1988, 1989, and 2009. Long dry spells were observed between the years 1986 and 1989, as well as between 2009 and 2011. Droughts occurred when yearly rainfall was less than 220 mm, according to DI values (Table 6). When annual rainfall fell below 210 mm, severe droughts developed.

4.1.3. Garowe Station

The DPI, SPI, and PNI results for Garowe station are presented in Figure 11, Figure 12 and Figure 13, respectively, while Table 7 summarizes the DI results for the Garowe station. Looking at Figure 11, it can be understood that Garowe station experienced extreme droughts in the years 2011 and 2012 with DPI values of −0.87 and −0.92, respectively; severe droughts in the years 1996, 2001, 2015, and 2016 with DPI values of −0.42, −0.47, −0.41, and −0.55, respectively; and moderate droughts in the years 1981, 1982, 1986, 1987, and 1995 with DPI values of −0.22, −0.25, −0.27, −0.32, and −0.39, respectively. For extreme, severe, and moderate droughts intensities, the Normal-SPI, Log-SPI, Gamma-SPI, and DPI all show the same results at this station. According to the results of the four methods mentioned, the extreme droughts occurred in 2011 and 2012, severe droughts in 2015 and 2016, and moderate droughts in 1986, 1987, 1995, 1996, and 2001. Droughts occurred when yearly rainfall was less than 166 mm according to DI values shown in Table 7. When annual rainfall fell below 162 mm and 136 mm, these became severe and extreme droughts conditions, respectively.

4.2. Trend Analysis

Trend analysis is a technique for determining whether or not a hydro-meteorological data set is trending. The main goal of the trend analysis in this study is to view past and future changes in meteorological variables (precipitation and temperature). The trend in precipitation and temperature time series was investigated using 41 years of meteorological records. In order to identify the trends in the time series, the Mann–Kendall (MK) test, Spearman’s rho (SR), and the Şen trend test are used. The Pettitt test is applied for detecting the change point while the Thiel-Sen technique is implemented to assess the magnitude of trend in the precipitation and temperature time series.

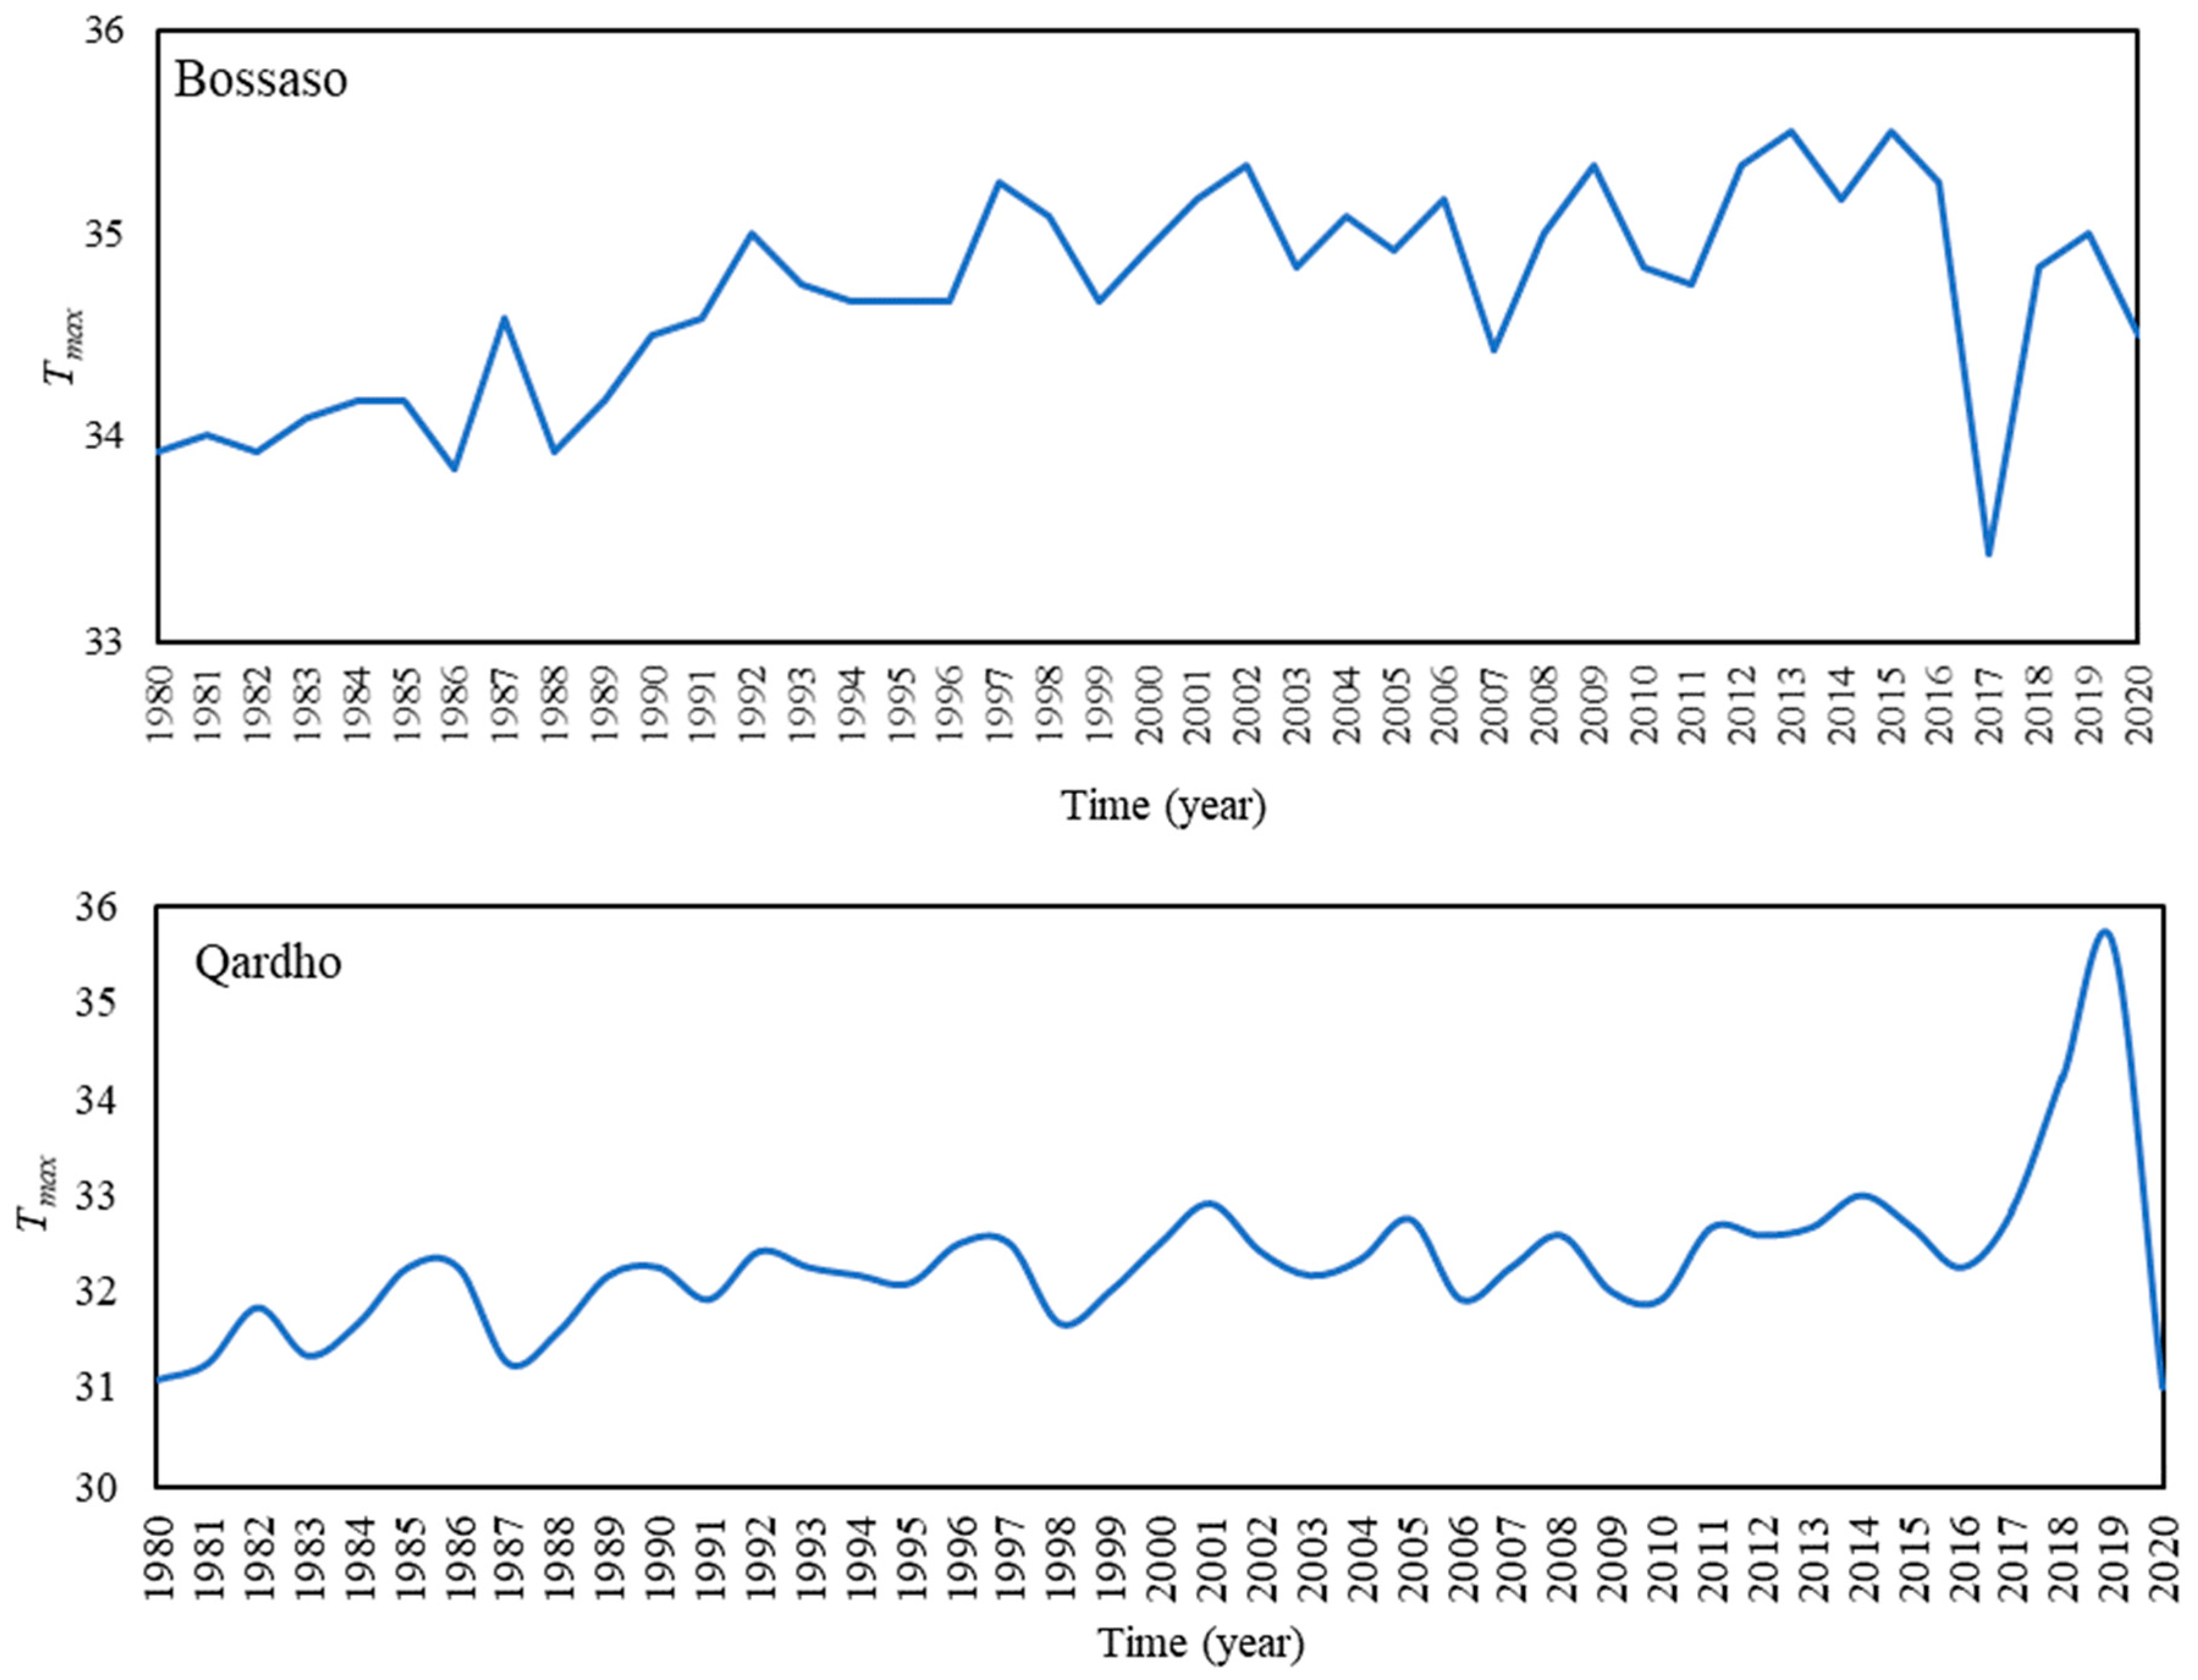
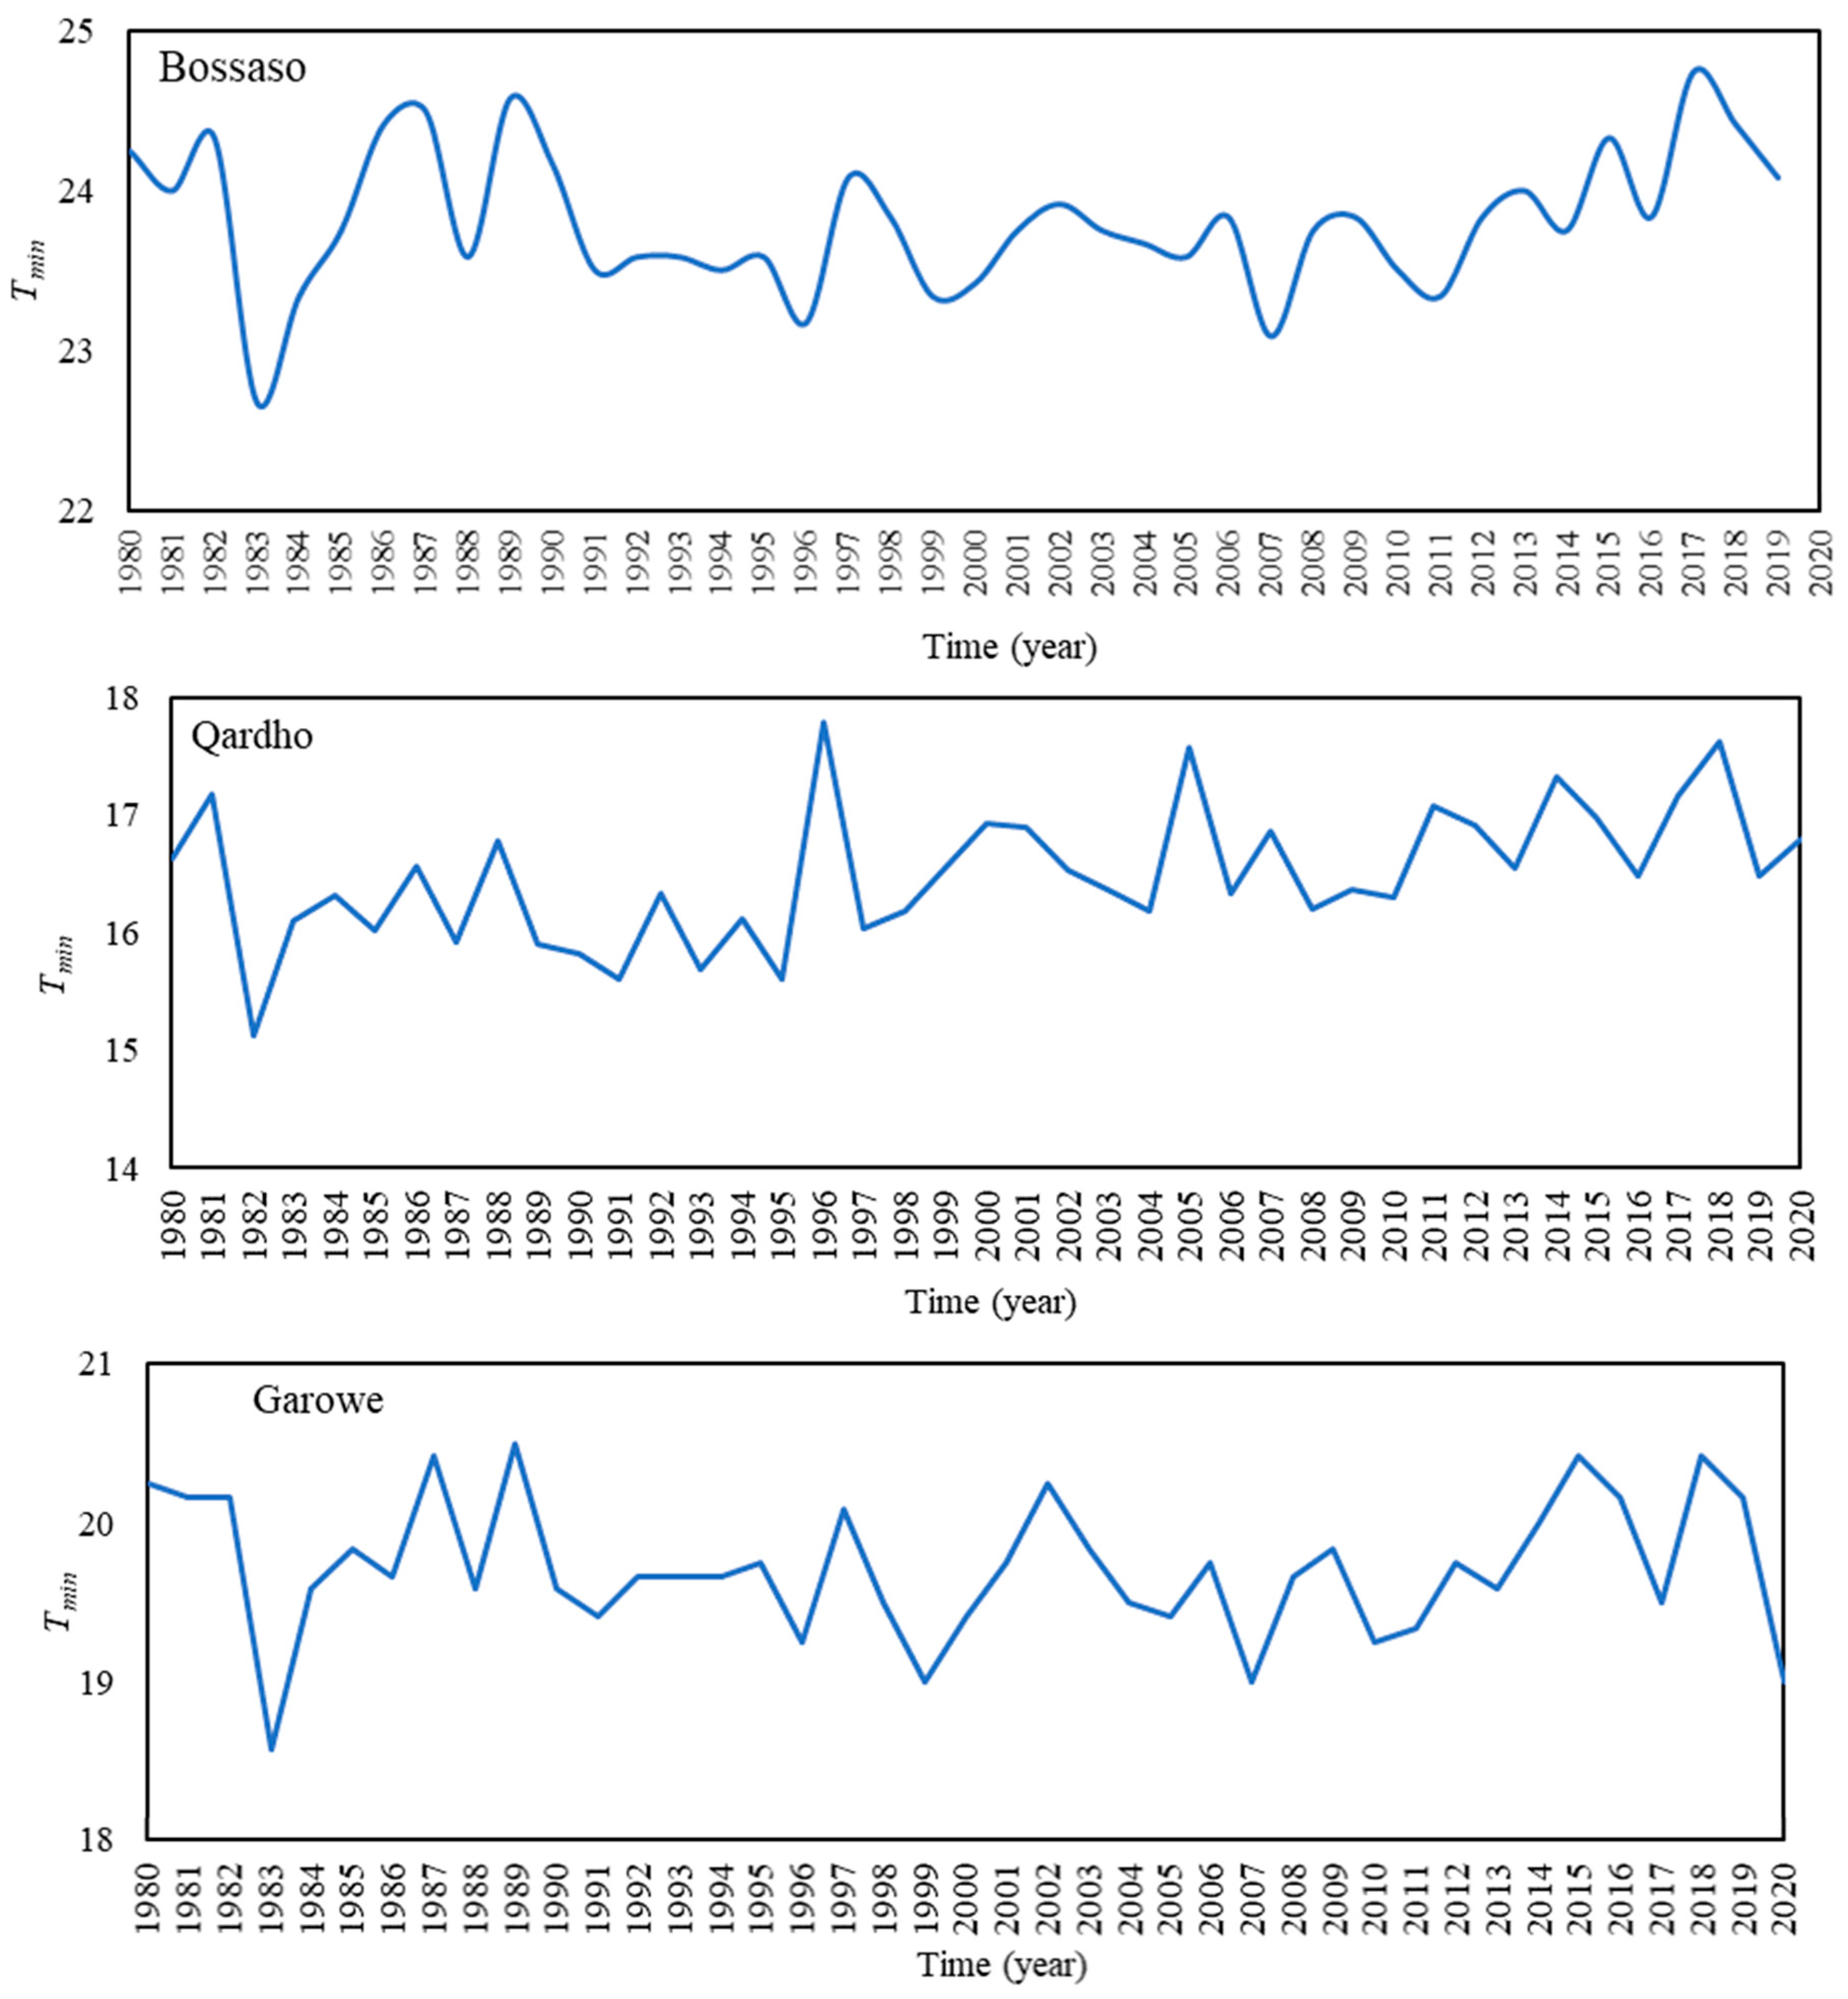
4.2.1. Temperature Trend

The Mann–Kendall, Spearman’s rho, Şen, and Pettitt tests are used to investigate maximum, minimum, and average annual temperature trends. MK, Şen, and SR tests are used to identify trends in temperature time series, while Pettitt’s test is used to detect change points. Results for temperature trend analysis are given in Table 8. For three study stations, almost all records show an increasing trend.
The MK and SR tests produced the same results for three stations; they found significant trends in the minimum and the average temperature in all of the stations and significant trends in the maximum temperature at Bossaso and Garowe stations. However, no trend in the maximum temperature records at Qardho station was seen. After the trends were identified using the MK and SR tests, the Thiel-Sen method was used to estimate the magnitude of the slope (change per unit time), and the results showed that the annual average temperature increased at a rate of 0.2 °C, 0.3 °C, and 0.4 °C per decade in the Qardho, Bossaso, and Garowe stations, respectively. Pettitt’s test for the results in all stations found that there are sudden shifts, also known as jumps, in the annual temperature’s maximum, minimum, and average values. The year 2000 marks the beginning of the sudden change in the temperature time series.

4.2.2. Precipitation Trend

The annual precipitation time series are analyzed using the three rain gauge stations of Bossaso, Qardho, and Garowe. Results of precipitation trend analysis based on five different approaches are shown in Table 9. According to the results, the MK and SR methods came up with the same result: increasing trends are absorbed in the Bossaso and Garowe stations, but no trend was seen in the Qardho station. The annual precipitation in Bossaso and Garowe stations increased as 3.67 mm and 5.41 mm per year, respectively, using the Theil Sen’s method. In the years 1998 and 1997, two change points are discovered in the Qardho and Garowe stations, respectively. Similar to the MK and SR tests, the Şen trend test shows an increasing trend in Bossaso and Garowe stations, while a significant trend was not detected in Qardho station in the precipitation time series.

5. Discussion

The droughts and trend analysis not only linked to each other for better understanding the climate change variability, but they could also give insights in conducting appropriate strategies for water resources management. Owing to the temporal and spatial precipitation distribution in the region, drought has resulted in significant social and economic consequences. Drought assessment and hydro-meteorological time series data trend analysis are of importance in African countries such as Somalia to investigate the climate change impacts. Relying on the brief literature review conducted in this study, drought patterns and its distribution have not been examined in Somalia. To this end, conducting the drought assessment analysis is quite important to better understand the historical drought to construct mitigation strategies for drought-related impacts in the region. Furthermore, together with conducting trend analysis of temperature and precipitation time series, in order to obtain conclusive results in terms of meteorological drought, several indices must be incorporated in the study to achieve reliable results. Therefore, this study applied six drought indices of normal-SPI, log-SPI, gamma-SPI, DPI, PNI, and DI for drought analysis in Somalia.
The drought intensities for three studied stations are summarized in Table 10. The extreme, severe, and moderate drought intensities are indicated for the normal-SPI, the log-SPI, the gamma-SPI, the DPI, and the PNI methods. The DI approach cannot detect moderate drought intensities because it only reveals extreme and severe droughts. The year 2011 was an extreme drought year for Bossaso station. In the years 1988 and 1989, severe drought occurred for Bossaso station according to the normal-SPI and DPI methodologies. The moderate drought years for Bossaso station were 1981, 1986, 1987, 2002, and 2009. According to these results, the normal-SPI tends to make under-predictions by one step regarding the severity of the drought. As for the years of extreme drought, the DPI, PNI, log-SPI, and gamma-SPI methods predict 2011 and 2008 as extreme drought years for Qardho station. Using the same methods, Qardho station had severe droughts in the years 2015 and 2000. In Garowe station, all methods indicate that 2011 and 2012 were extreme drought years, 2015 and 2016 were severe drought years, and 1986, 1987, 1995, 1996, and 2001 were moderate drought years (Table 10).
In order to show the similarities between different drought indices, the correlation coefficient (CC) statistical criterion, defined by Equation (23), is used in this study.
C C = D I D I ¯ D I I D I I ¯ D I D I ¯ 2 D I I D I I ¯ 2
where DI and DII are first and second drought indices whose correlation is investigated, and D I I ¯ and D I I I ¯ are the mean of DI and DII, respectively. The CC values between all studied drought indices are shown Table 11. It is seen that all SPI-based drought indices are closely related to each other, having CC close to unity. The PNI and DPI are less correlated to each other. Different results of several drought indices can be attributed to their mathematical computational approaches. For the calculation of the normal-SPI, the normal probability distribution is calculated, while in the log-SPI, the logarithmic modification of the data is used. As the most popular drought index, the gamma-SPI fits the precipitation data into the gamma probability density function which makes it as an advanced version of the normal-SPI and the log-SPI indices. The DPI and DI have simple calculation procedures where the mean value of discrepancy is calculated in the DPI while the distribution of precipitation data is separated into equal deciles in DI.
Table 12 presents the dry spell periods that can provide a clearer picture of the drought characteristics in each site. As seen, PNI, SPI, and DPI methods captured the same dry spell periods for the three stations. DPI method, as opposed to the other methods, also captured the dry spell in 1980–1981 at Quardho Station. The dry spell periods are not satisfactorily predicted by the DI method. These results indicate that first the DPI and then the SPI and the PNI methods can be suggested for the study area. As also seen in Table 12, Bassaso and Qardho stations have experienced the same and fewer dry periods, as opposed to Garowe Station, which has experienced more periods.
The drought indices outcomes in contrast to the precipitation quantities are evaluated in Figure 14 for Bossaso, Qardho, and Garowe stations, separately. This gives insights for better understanding the drought indices performance in terms of real precipitation time series. It is seen in Figure 14, for all stations, that the SPI-based drought indices are more sensitive for real precipitation quantities where higher fluctuations can be seen in comparison to the PNI and DPI drought indices. For example, in the years 1987–1988, 2004, 2009, 2011, 2016, and 2017 at Bossaso station; the years 1988, 1995, 2000, 2008–2009, 2011, and 2017 for Qardho station; and the years 2000–2001, 2011–2012, and 2018–2019, significant negative and positive peak values can be seen in Figure 14. It has to be emphasized that although the drought indices quantities are different for each index, their trends for showing the drought circumstance are quite similar. Comparison of six drought indices for three stations in Figure 14 gives a more understandable picture for drought condition of Puntland region of Somalia. An extreme drought has been seen in 2011 for all stations, while starting from 2016–2017, a wet condition can be found for all three stations. It can be noticed from Figure 14 that for the last years, drought condition becomes wet for Bossaso and Qardho stations, which have a positive trend, while in the case of Garowe, the drought condition is more significant where it shows a negative trend at year 2020 in comparison to the year 2019.
Results obtained in this study are supported by the findings of Musei et al. [28] who reported extreme droughts in 2011 in Somalia by applying the Standardized Precipitation Evapotranspiration Index (SPEI). Uhe et al. [29] studied drought conditions in Kenya, located at the south-west of Somalia, utilizing precipitation data through two global climate models. They reported severe drought in Kenya for the year 2016. Similar to the results obtained by Uhe et al. [29], Garowe station, which is the nearest one to Kenya, shows similar results where severe drought occurred in 2016.
Drought in northern Somalia is mainly caused by climate variability [12]. A lack of or insufficient precipitation is the primary cause of drought in northern Somalia. Human activities also have a considerable impact on the management of the water cycle. Deforestation, overgrazing, and over-cultivation harm the water cycle. Moreover, agriculture minimizes evaporation, stores water, attracts rainfall, and supplies significant atmospheric moisture through transpiration; tree and vegetation cover are vital for the water cycle. In this view, deforestation causes decreasing vegetation cover, and removing trees increases evaporation, diminishing the soil’s ability to hold water, making it more vulnerable to desertification. The capacity of soil to hold water is located most of the time in Somalia’s northern areas. In various geographical regions around the research area, small lakes, rivers, and streams are the principal sources of downstream surface water. These surface water flows dry off downstream during scorching seasons or due to certain human activities, resulting in drought.
The temperature time series trend analysis results show that temperature changes from 1980 to 2020 reflect overall warming in the region. The annual average temperatures in Bossaso, Qardho, and Garowe stations increased. While all stations have significant positive trends in minimum temperatures, the magnitudes of the increasing trend for the stations Qardho, Bossaso, and Garowe are found to be 0.2 °C, 0.3 °C, and 0.4 °C per decade, respectively. The Şen trend test revealed that the low temperatures (maximum, minimum, and average) increased more than the medium and high temperatures. The abrupt change in annual temperatures (maximum, minimum, and average) is detected for all stations in 2000, indicating that the region experienced a significant shift in trend direction in that year. The trend analysis of precipitation data time series shows that Bossaso and Garowe stations have significant positive trends, while the Qardho station has no trend. The most significant positive trend was detected in Garowe station with a magnitude value of 5.41 mm per year, while precipitation in the station of Bossaso increased by 3.67 mm per year, according to Thiel-Sen results. In 1998, for the Qardho station, and in 1997, for the Garowe station, abrupt changes in annual precipitation were detected.
Limitations of this study can be linked to the employment of a small number of stations in the analysis. Considering more stations in the studied area may have provided more conclusive results. However, due to the civil war of more than three decades in Somalia and the non-institutionalized governance, finding reliable data is a quite a difficult task. There are not many stations, most of which are not even operational. Only from these three stations reliable data have been obtained. Considering a larger number of stations by incorporating stations in neighboring countries such as Ethiopia and Kenya may have enhanced the contribution of the study. On the other hand, investigation of climate change and climate variability as the large-scale oscillations phenomenon can be considered in future studies. In addition, drought frequency analysis and examination of different probability distributions can be recommended as future research directions.

6. Conclusions

This study investigated the performances of six different drought index methods for assessing drought in Puntland region of Somalia from 1980 to 2020 using historical precipitation data collected from three stations. Furthermore, the trend analysis of temperature and precipitation time series are conducted by applying five different trend analysis approaches. The following are the conclusions reached:
(1)
A severe drought hit the entire East African region between July 2011 and mid-2012, described as the worst in the last 60 years. It had caused widespread devastation by triggering a catastrophic food crisis in Somalia, Djibouti, Ethiopia, and Kenya, threatening the livelihoods of 9.5 million people in those countries.
(2)
Somalia has gone through extended droughts over the previous 40 years, exacerbating the humanitarian situation.
(3)
Several severe droughts have occurred in recent years, including 1964, 1969, 1974, 1987, 1988, 2000, 2001, 2004, 2008, 2011, 2016, and 2017.
(4)
Severe drought is likely in Garowe, Bossaso, and Qardho stations when precipitation is less than 162 mm/year, 25 mm/year, and 220 mm/year, respectively.
(5)
For the drought analysis within the Puntland regions, drought indices produced nearly the same results.
(6)
The log-SPI and gamma-SPI produce similar results having CC values close to unity by predicting more severe drought conditions, whereas the normal-SPI gives more wet cases and fewer drought cases for all stations.
(7)
Normal-SPI, gamma-SPI, and PNI indicate less and moderate drought conditions, whereas log-SPI, DPI, and DI accurately captured the historical extreme and severe drought periods; thus, these methods are recommended for the use as drought assessment tools in this region.
(8)
Not only are the PNI and DPI less correlated to each other, but their CC with the SPI-based drought indices are also not as high as the SPI-based indices.
(9)
Drought monitoring and early warning are critical instruments for managing crop losses, preventing famines, and lowering the danger of famine. In Somalia, there is currently no national drought monitor in place. Therefore, determining the most appropriate meteorological drought index would help authorities to develop a drought monitoring system for states and the entire country. This technique can give decision-makers in the region a clear picture of the drought risk and allow them to take preventative steps. It is suggested that more research must be done to assess and evaluate meteorological drought indices across the country.
(10)
Temperature and precipitation data trend analysis shows positive trends in precipitation and temperature. Although all the stations are experiencing slight increases in precipitation and temperature, they differ in trend direction changes (slope and jumps).
(11)
The annual average temperatures in Qardho, Bossaso, and Garowe are found to increase by 0.2 °C, 0.3 °C, and 0.4 °C per decade.
(12)
The abrupt changes in annual temperatures (maximum, minimum, and average) are detected for all stations in 2000, indicating that the region experienced a significant shift in trend direction in that year.
(13)
The precipitation time series has a positive trend detected in Bossaso and Garowe stations (at the rate of 3.67 mm per year in Bossaso and 5.41 mm per year in Garowe), while no trend is detected in Qardho station.
Future research may consider supplementing the existing precipitation data with a satellite-based rainfall product to improve the accuracy of drought analysis. Developed by the Climate Hazards Group at the University of California, Santa Barbara, application of CHIRPS and CHIRTS-Monthly is recommended as a future research direction.

Author Contributions

Conceptualization, N.M.M., G.T. and M.J.S.S.; methodology, N.M.M., G.T. and M.J.S.S.; software, N.M.M.; validation, G.T. and M.J.S.S.; formal analysis, N.M.M., G.T. and M.J.S.S.; investigation, N.M.M.; resources, N.M.M. and G.T.; data curation, N.M.M. and G.T.; writing (original draft preparation), N.M.M., G.T. and M.J.S.S.; writing—review and editing, G.T. and M.J.S.S.; visualization, N.M.M.; supervision, G.T. and M.J.S.S.; project administration G.T. All authors have read and agreed to the published version of the manuscript.

Funding

This research received no external funding.

Institutional Review Board Statement

This content is entirely unique to the writers and has never been published before. No further publication of the material is presently being explored. The author’s personal research and analysis are accurately and completely reflected in the work.

Conflicts of Interest

The authors declare no conflict of interest. The sponsors had no role in the design, execution, interpretation, or writing of the study.

References

  1. Vaheddoost, B.; Safari, M.J.S. Application of signal processing in tracking meteorological drought in a mountainous region. Pure Appl. Geophys. 2021, 178, 1943–1957. [Google Scholar] [CrossRef]
  2. Mustafa, A.; Rahman, G. Assessing the spatio-temporal variability of meteorological Drought in Jordan. Earth Syst. Environ. 2018, 2, 247–264. [Google Scholar] [CrossRef]
  3. Mersin, D.; Gulmez, A.; Safari, M.J.S.; Vaheddoost, B.; Tayfur, G. Drought Assessment in the Aegean Region of Turkey. Pure Appl. Geophys 2022, 179, 3035–3053. [Google Scholar] [CrossRef]
  4. Said, A.A.; Cetin, M.; Yurtal, R. Drought assessment and monitoring using some drought indicators in the semi-arid Puntland State of Somalia. Fresenius Environ. Bull. 2019, 28, 8765–8772. [Google Scholar]
  5. Mehr, A.D.; Safari, M.J.S.; Nourani, V. Wavelet packet-genetic programming: A new model for meteorological drought hindcasting. Tek. Dergi 2021, 32, 11029–11050. [Google Scholar] [CrossRef] [Green Version]
  6. Mishra, A.K.; Singh, V.P. A review of drought concepts. J. Hydrol. 2010, 391, 202–216. [Google Scholar] [CrossRef]
  7. Haji-Aghajany, S.; Amerian, Y.; Amiri-Simkooei, A. Function-Based Troposphere Tomography Technique for Optimal Downscaling of Precipitation. Remote Sens. 2022, 14, 2548. [Google Scholar] [CrossRef]
  8. Haji-Aghajany, S.; Amerian, Y.; Amiri-Simkooei, A. Impact of Climate Change Parameters on Groundwater Level: Implications for Two Subsidence Regions in Iran Using Geodetic Observations and Artificial Neural Networks (ANN). Remote Sens. 2023, 15, 1555. [Google Scholar] [CrossRef]
  9. Wang, S.; Zhang, Q.; Wang, J.; Liu, Y.; Zhang, Y. Relationship between drought and precipitation heterogeneity: An analysis across rain-fed agricultural regions in eastern Gansu, China. Atmosphere 2021, 12, 1274. [Google Scholar] [CrossRef]
  10. Kew, S.F.; Philip, S.Y.; Hauser, M.; Hobbins, M.; Wanders, N.; van Oldenborgh, G.J.; Weil, K.; Veldkamp, T.I.E.; Kimutai, J.; Funk, C.; et al. Impact of precipitation and increasing temperatures on drought in eastern Africa. Earth Syst. Dyn. Discuss. 2019, 12, 17–35. [Google Scholar] [CrossRef]
  11. Maxwell, D.; Fitzpatrick, M. The 2011 Somalia famine: Context, causes, and complications. Glob. Food Secur. 2012, 1, 5–12. [Google Scholar] [CrossRef]
  12. Maystadt, J.F.; Ecker, O. Extreme weather and civil war: Does drought fuel conflict in Somalia through livestock price shocks? Am. J. Agric. Econ. 2014, 96, 1157–1182. [Google Scholar] [CrossRef]
  13. Shiau, J.T. Fitting drought duration and severity with two-dimensional copulas. Water Resour. Manag. 2006, 20, 795–815. [Google Scholar] [CrossRef]
  14. Tayfur, G. Discrepancy precipitation index for monitoring meteorological Drought. J. Hydrol. 2021, 597, 126174. [Google Scholar] [CrossRef]
  15. McKee, T.B.; Doesken, N.J.; Kleist, J. The relationship of drought frequency and duration to time scales. In Proceedings of the 8th Conference on Applied Climatology, Anaheim, CA, USA, 17–22 January 1993. [Google Scholar]
  16. Cacciamani, C.; Morgillo, A.; Marchesi, S.; Pavan, V. Monitoring and Forecasting Drought on a Regional Scale: Emilia-Romagna Region Methods and Tools for Drought Analysis and Management; Springer: Berlin/Heidelberg, Germany, 2007; pp. 29–48. [Google Scholar]
  17. Hayes, M.J. Drought Indices; Wiley Online Library: Hoboken, NJ, USA, 2006. [Google Scholar]
  18. Lloyd-Hughes, B.; Saunders, M.A. A drought climatology for Europe. Int. J. Climatol. 2002, 22, 1571–1592. [Google Scholar] [CrossRef]
  19. Angelidis, P.; Maris, F.; Kotsovinos, N.; Hrissanthou, V. Computation of drought index SPI with alternative distribution functions. Water Resour. Manag. 2012, 26, 2453–2473. [Google Scholar] [CrossRef]
  20. Gąsiorek, E.; Musiał, E. Evaluation of the Precision of Standardized Precipitation Index (SPI) Based on Years 1954–1995 in Łódź. J. Ecol. Eng. 2015, 16, 49–53. [Google Scholar] [CrossRef]
  21. Barua, S.; Ng, A.; Perera, B. Comparative evaluation of drought indexes: Case study on the Yarra River catchment in Australia. J. Water Resour. Plan. Manag. 2010, 137, 215–226. [Google Scholar] [CrossRef]
  22. Gibbs, W.J.; Maher, J.V. Rainfall Deciles as Drought Indicators; Bureau of Meteorology: Melbourne, Australia, 1967.
  23. Shadmani, M.; Marofi, S.; Roknian, M. Trend analysis in reference evapotranspiration using Mann-Kendall and Spearman’s Rho tests in arid regions of Iran. Water Resour. Manag. 2012, 26, 211–224. [Google Scholar] [CrossRef] [Green Version]
  24. Salas, J.D. Analysis and modelling of hydrologic time series. In Handbook of Hydrology; Maidment, D.R., Ed.; McGraw-Hill: New York, NY, USA, 1993. [Google Scholar]
  25. Sen, Z. Innovative trend analysis methodology. J. Hydrol. Eng. 2012, 17, 1042–1046. [Google Scholar] [CrossRef]
  26. Pettitt, A.N. A non-parametric approach to the change-point problem. J. R. Stat. Soc. Ser. C (Appl. Stat.) 1979, 28, 126–135. [Google Scholar] [CrossRef]
  27. Chen, S.-T.; Kuo, C.-C.; Yu, P.-S. Historical trends and variability of meteorological droughts in Taiwan. Hydrol. Sci. J. 2009, 54, 430–441. [Google Scholar] [CrossRef]
  28. Musei, S.K.; Nyaga, J.M.; Dubow, A.Z. SPEI-based spatial and temporal evaluation of drought in Somalia. J. Arid. Environ. 2021, 184, 104296. [Google Scholar] [CrossRef]
  29. Uhe, P.; Philip, S.; Kew, S.; Shah, K.; Kimutai, J.; Mwangi, E.; van Oldenborgh, G.J.; Singh, R.; Arrighi, J.; Jjemba, E.; et al. Attributing drivers of the 2016 Kenyan drought. Int. J. Climatol. 2018, 38, e554–e568. [Google Scholar] [CrossRef] [Green Version]
Figure 1. Study area and meteorological stations.
Sustainability 15 10652 g001
Figure 2. Precipitation time series for Bossaso, Qardho, and Garowe stations.
Sustainability 15 10652 g002aSustainability 15 10652 g002b
Figure 3. Maximum temperature (Tmax) time series for Bossaso, Qardho, and Garowe stations.
Sustainability 15 10652 g003aSustainability 15 10652 g003b
Figure 4. Minimum temperature (Tmin) time series for Bossaso, Qardho, and Garowe stations.
Sustainability 15 10652 g004
Figure 5. DPI results for 12-month period for Bossaso station.
Sustainability 15 10652 g005
Figure 6. SPI results for 12-month period for Bossaso Station.
Sustainability 15 10652 g006
Figure 7. PNI results for 12-month period for Bossaso station.
Sustainability 15 10652 g007
Figure 8. DPI results for 12-month period for Qardho station.
Sustainability 15 10652 g008
Figure 9. SPI results 12-month period for Qardho station.
Sustainability 15 10652 g009
Figure 10. PNI results for 12-month period for Qardho station.
Sustainability 15 10652 g010
Figure 11. DPI results for 12-month period for Garowe station.
Sustainability 15 10652 g011
Figure 12. SPI results for 12-month period for Garowe station.
Sustainability 15 10652 g012
Figure 13. PNI results for 12-month period for Garowe station.
Sustainability 15 10652 g013
Figure 14. Comparison of drought indices to precipitation quantities for three stations.
Sustainability 15 10652 g014
Table 1. Drought classification for SPI values.
SPIDrought Classification
≥2.00Extremely wet
1.50 to 1.99Very wet
1.00 to1.49Moderately wet
0.99 to −0.99Near normal
−1.00 to −1.49Moderately drought
−1.50 to −1.99Severe drought
≤−2.00Extremely drought
Table 2. PNI drought classification (Barua et al. [21]).
PNI (%)Drought Classification
≥100Wet
80 to 110Normal
55 to 80Moderately dry
40 to 55Severely dry
≤40Extremely dry
Table 3. Drought classification for DPI values [14].
DPIDrought ClassificationRemark
0.0 to −0.19Near normalabout 36% more or less than the mean value
−0.20 to −0.39Moderate droughtabout 37–59% less than the mean value
−0.40 to −0.59Severe droughtabout 60–74% less than the mean value
≤−0.60Extreme droughtabout 75% or more less than the mean value
Table 4. Drought classification for DI values.
DIDrought Classification
Deciles 1–2Lowest 20% much below normal
Deciles 3–4Next lowest 20% below normal
Deciles 5–6Middle 20% near normal
Deciles 7–8Next highest 20% above normal
Deciles 9–10Highest 20% much above normal
Table 5. DI result for Bossaso station.
Annual Rainfall Values (mm)Drought Classification
13.8–9.6Much below normal
20.7–22.3Below normal
25–27Near normal
31.4–33.7Above normal
48.1–60Much above normal
Table 6. DI result for Qardho station.
Annual Rainfall Values (mm)Drought Classification
96.9–168.3Much below normal
212.6–217.3Below normal
220.5–227.1Near normal
234.3–258Above normal
344.6–481.8Much above normal
Table 7. DI result for Garowe station.
Annual Rainfall Values (mm)Drought Classification
43.7–136.2Much below normal
151–161.4Below normal
166–183.7Near normal
208–243.4Above normal
318.8–406.4Much above normal
Table 8. Temperature time series trend analysis results.
StationTrend Test
Method
SRMKŞenThiel-SenPettitt’s Test
ZSRZTrend? (+/−)β (Rate of Increase)
per Decade (°C)
Changepoint
(Year)
BossasoTmax2.62.45Yes (+)0.22000
Tavg5.274.22Yes (+)0.32000
Tmin6.115.17Yes (+)0.42000
QardhoTmax1.891.34No (−)--
Tavg6.024.77Yes (+)0.22000
Tmin7.245.47Yes (+)0.32000
GaroweTmax2.712.52Yes (+)0.22000
Tavg5.674.5Yes (+)0.42000
Tmin5.154.29Yes (+)0.52000
Table 9. Precipitation time series trend analysis results.
StationTrend Test
Method
SRMKŞenThiel-SenPettitt’s Test
ZSRZTrend? (+/−)β (Rate of Increase)
Per Year (mm)
Changepoint
(Year)
Bossaso 3.433.12Yes (+)3.672000
Qardho 1.841.62No (−)0.861998
Garowe 3.422.86Yes (+)5.411997
Table 10. Summary of drought analysis results for three stations.
MethodDrought IntensityBossasoQardhoGarowe
Normal-SPIExtreme20112011
2008
2011
2012
Severe1988
1889
2015
2000
2015
2016
Moderate1981
1986
1987
2002
2009
1988
1987
1986
1987
1995
1996
2001
Log-SPI, Gamma-SPIExtreme20112011
2008
2011
2012
Severe1988
1889
2015
2000
2015
2016
Moderate2009
1986
1987
1981
2002
1988
1987
1986
1987
1995
1996
2001
PNIExtreme20112011
2008
2011
2012
Severe1988
1889
2015
2000
2015
2016
Moderate2009
1986
1987
1981
2002
1988
1987
1986
1987
1995
1996
2001
DPIExtreme1988
2011
2011
2008
2011
2012
Severe1889
2009
2015
2000
1988
1996
2001
2015
2016
Moderate1981
1986
1987
2002
2014
1980
1981
1987
2002
1982
1986
1987
1995
1996
2001
DIExtreme and Severe2011
1988
1889
2011
2008
2015
2000
2011
2012
2015
2016
Table 11. The correlation coefficient (CC) between different drought indices.
Normal-SPILog-SPIGamma-SPIPNIDPI
Bossaso
Normal-SPI1
Log-SPI0.9951
Gamma-SPI0.9960.9971
PNI0.8850.8910.8851
DPI0.8680.8880.8690.8721
Qardho
Normal-SPI1
Log-SPI0.9941
Gamma-SPI0.9950.9981
PNI0.7500.7500.7491
DPI0.8800.8810.8810.5421
Garowe
Normal-SPI1
Log-SPI0.9881
Gamma-SPI0.9940.9951
PNI0.8590.8410.8421
DPI0.5960.6270.6260.4331
Table 12. Dry spell periods.
MethodBossasoQardhoGarowe
Period
Normal-SPI1986–19891987–19881986–1987
1995–1996
2011–2012
2015–2016
Log-SPI, Gamma-SPI1986–19891987–19881986–1987
1995–1996
2011–2012
2015–2016
PNI1986–19891987–19881986–1987
1995–1996
2011–2012
2015–2016
DPI1986–19891980–1981
1987–1988
1986–1987
1995–1996
2011–2012
2015–2016
DI1988–1989 2011–2012
2015–2016
Disclaimer/Publisher’s Note: The statements, opinions and data contained in all publications are solely those of the individual author(s) and contributor(s) and not of MDPI and/or the editor(s). MDPI and/or the editor(s) disclaim responsibility for any injury to people or property resulting from any ideas, methods, instructions or products referred to in the content.

