Abstract
Airlines’ principal focus these days is on managing safety risks. However, multiple management systems are established individually to manage other risks without any form of interoperability to function as one integrated management system, to have a holistic view of the different risks in an organisation. This study will review if an integrated management system can be developed by looking at the interoperability of existing management systems to define a common standard/language across all individual management systems, to work as one integrated system. A survey was developed and rolled out via aviation organisations towards airlines to capture the quantitative data on how management systems are implemented, as these data are currently unavailable. The main contribution of this article is that it provides an overview of how management systems are implemented within airlines today, how they work together, and where interoperability could be improved between different systems. This paper provides the primary outcome of the survey, an overview of the status of interoperability between the different systems, and where interactions could be improved. Findings have shown that although different management systems are implemented, there needs to be a correlation to be able to work as an integrated system. Secondly, different management systems speak different risk languages with work against integration. Finally, large airlines with a fleet of over 50 aircraft have less integration between their different management systems. Besides the lack of regulations, IMS in aviation needs more research. This paper’s contribution lies here, as it provides an overview of which management systems are implemented in the aviation industry and if integration exists between those. Due to the limited research in this field, this paper, with the survey results, provides new insights into if and how interoperability exists between different systems in aviation. It also provides a unique insight into the different management systems airlines use. The results will be used in the following research phase to develop a concept for an integrated management system, one language, on which other management systems can be built.
1. Introduction
As of 2002, EASA Aviation regulations took effect for all European operators. A strong focus is added to the Management System of an airline, consisting of a safety pillar and a compliance monitoring pillar. It became clear that the requirements for safety were much more advanced than the compliance monitoring requirements. However, strangely enough, the regulator leaves it up to the operator on how and which risks must be assessed, leading to different methodologies used in the industry. No comparison can be made between operators.
Looking at the Management Systems of an airline, limited standards are defined. If standards are defined, for example, in the safety pillar of the management system, in that case, there is no possibility to compare data or benchmark the different risks similarly. We know that the risks an airline faces today are safety risks and go far beyond that (compliance risks, economic risks, security risks, cybersecurity, environmental risks, etc.). There is no integration standard or interoperability standard between the different management systems. What we see today is that management systems are added as silos without any connections to other existing management systems, creating diversity in how each system operates and making working together extremely difficult. In addition, if interoperability is possible and processes have been identified on how different risks can be assessed in a holistic way, it has to be seen how this can be achieved. Are there current software systems in place that can create this interoperability, and which software language is to be used? Many methods for software integration are possible, but it needs to be assessed which software system could be the best fit for the different processes so that all management systems can interchange and interoperate [1,2].
Hence, an airline cannot see if a compliance risk returns as a different risk in another domain. For example, maintenance staff that are not properly trained can be a compliance risk, a health risk to the individual, a financial risk for the organisation due to potential mistakes, and can create delays and even a safety risk for the flight. Are all these risks assessed, and if so, how? Are they looked at individually for each pillar by identifying the most significant risk individually, or is the overall risk looked at for an organisation?
The framework lies here to see if a standard can be created for an Integrated Management System (IMS), to ensure that management systems can have a specific language so that different risks can be identified and used industry-wide to see if proper analysis and benchmarking can be conducted. The current regulations nor industry standards have developed such a uniform language, unable to benchmark internally or with the industry in general. Besides the lack of regulations, IMS in aviation needs more research. This paper’s contribution lies here, as it provides an overview of which management systems are implemented in the aviation industry and if integration exists between those. Due to the limited research in this field, this article, with the survey results, provides new insights into if and how interoperability exists between different systems in aviation. It also provides a unique insight into the different management systems airlines use.
Literature Review
Surprisingly, limited articles or studies regarding integrated management systems are available for the aviation industry. Numerous articles are available about safety management systems as stand-alone systems and different methods to improve such a system; however, a literature review on the integration with other systems is a very scarce resource for the aviation industry. Due to limited articles or studies in the aviation industry, it is valuable to investigate other sectors to see how integrated management systems are developed to see if lessons can be learned to implement such a system in the aviation industry. Looking into other industries means that most articles are about ISO (International Organization for Standardization) standards and how they can be integrated. It is worthwhile to mention that articles on ISO standards in the aviation industry are also limited as covered in the literature if we think about ISO standards like Occupational Health and Safety or Environmental standards. They may be implemented in an aviation environment but are almost non-existent in the literature.
Integrated Management Systems (IMS) have become a topic since the beginning of this century. The first questions were raised about the word integration and to which degree an individual system can be integrated. Singh defines three types of integration, varying from 0% integration to 50% and 100% [3]. No integration means that all systems work independently and have almost no interactions. The second type of 50% already goes for some alignment between the different systems, but there is still a clear line where one stops and another begins. At the same time, 100% is where there are full interactions and standardisations between the different systems. This view was defined previously by Seghezzi [4] but nominated the integrations as “addition”, “merger”, and “integration”.
The 100% integration can also be understood as a “language created between the different departments and tuned to the same wavelength” [5]. This view has also been shared by Nunhes [6] and Palmira [7], who speaks about a certain autonomy of individual systems integrated via some interrelated components but without describing these components. Integration does not mean that all processes are integrated, as some Management Systems (MS) have specific requirements unique to their existence that do not allow integration [7,8]. Karapetric [9] goes even further and defines that a complete loss of identification for the individual MS should characterise an IMS.
It becomes clear that an IMS differs from an MS. It needs different components and can be seen as “a set of interrelated processes” [10] to meet the different stakeholders’ requirements. Maier [11] uses a similar definition, where “integrated” cannot mean the simple annexation of other MS, which have been developed independently. However, common elements are the cornerstone of IMS. The approach of Maier is more accurate. An IMS is not just another MS in addition, but rather a tool that has a specific language translated into the individual MS that are part of the IMS, without losing the identity of each MS. The importance of the identity of the individual MS and that not all components from each management system can be integrated is also described by different authors [12,13]. “Different systems have different requirements, not all document or component should be integrated, it cannot be integrated then it can be used as a single management system” or by Algheriani [14] who describes it as follows: “IMS as an attempt to create a single management system which is built based on interrelationships among the various management systems with a focus on effectively satisfying the needs of interest groups”.
Besides discussing the definition of an IMS, many articles are written on the different components of an IMS based on individual ISO management systems from different industries [15,16,17,18,19,20]. Different proposals are described to identify which components are the cornerstone of an IMS. Some authors define components like policy, responsibilities, and management review [12,21]. Others include a component called objectives [22,23], and other authors add a component called “documentation”. A review was conducted in 2019 [24] to unify the past literature. The main contribution of this study is the technical framework of the 30 most cited articles on IMS between 2006 and 2016, based on data from articles from Scopus and Web of Science databases. Based on that literature review, Nunhes created a concept where an IMS is built upon six pillars to try to understand how an IMS should work, as shown below (Figure 1). The six pillars (systematic management, standardisation, integration, organisation, de-bureaucratisation, continuous improvement) resulted from different components described in the literature over his review’s ten years timeframe. However, the review is missing on how this should be implemented.
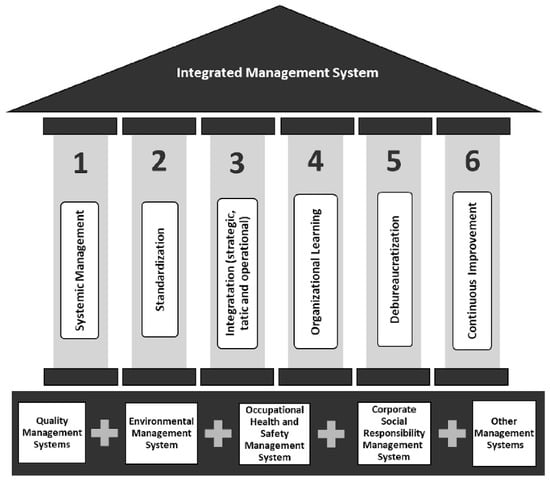
Figure 1.
Nunhes, Bernardo, and Oliveira, 2019.
Since the review of Nunhes of 2019, the number of articles on IMS has reduced, but some new concepts have been raised slowly concerning IMS. Aside from the composition of components for an IMS, a new factor called “risk” comes into play. Muzaimi [13] believes that this component should be considered in an IMS because each management system defines a risk, environmental risks, occupational health risks, compliance risks, etc., and all these risks should be managed via the IMS to have a holistic business risk. Algheriani [14] states that it should be an integral part of an IMS to include the awareness of different risks in the continuous improvement concept and how this should be assessed. It will enhance an organisation’s risk culture driven from top to bottom.
As studies and articles are scarce for integrated management systems in the aviation industry, other industries also admit that the topic needs more research. The review of Nunhes comprises many articles and mentions that this study is just a starting point for further research for an IMS, as there is a lack of case studies, quantitative studies, and surveys on implementing an IMS. The author is not alone in that point of view, and it has been shared with many authors [7,14,25,26,27]. In addition to further research, some authors mention that there is a need for more international standards for IMS, and more validated concepts and models are needed [28,29,30]. The current SMS in aviation is not able to manage complex risks across the business, and a new sort of system is needed to be able to manage diverse risk information by integrating organizational processes [31]. It shows that IMS remains a concept today, and many authors have reviewed how an IMS should look but also mentioned that no empirical studies exist to prove the concept.
2. Methods
2.1. Study Area
The survey has been distributed via social media platforms and email distribution channels of EASA, IATA, Flight Safety Foundation and IBAC. Due to GDPR, the email distribution details could not be shared with the researcher, so it is unknown how many airlines have received the survey link or spotted the survey via social media channels from these organisations to participate in the survey. As none of the participating associations holds any data to know who participated or not, it is a limitation to ensure sufficient participants conduct the survey, but it is considered the highest chance to get airlines to participate in the survey using the associations’ social media channels and collecting sufficient data.
2.2. Research Method
A post-positivism approach is used with a qualitative method, using a survey, to obtain different data points. The data points are selected based on the current ICAO Safety Management System (SMS) requirement, as it is the only mandated aviation system to ensure compliance with regulatory requirements. These data points have been set off against other management systems, ISO, and IOSA to understand the current correlation between them. This method was used to determine the data points unavailable today and was the best method for this study. After validation of all the responses, 77 airlines participated in the complete survey, and the sample size was sufficient to capture the desired information for the research.
2.3. Research Instrument
The literature review pointed out that integration can mean different things (partial or full integration, with or without the individual entity of each system). In order to understand which data need to be collected, a new concept needs to be created to see if the required data for such a concept exists and can be captured. IMS is often presented or compared to a house where the IMS is the roof of the house, built on walls of processes and where the foundations are the individual management systems, like the example from Nunhes.
In this concept, the IMS is not the roof of the individual management systems but a holistic concept. (Figure 2) It is based on a foundation of processes on which other management systems are built. The roof symbolises the result, which are the approvals and procedures applied in the organisation, considering the different management system requirements and the requirements for the Integrated Management System.
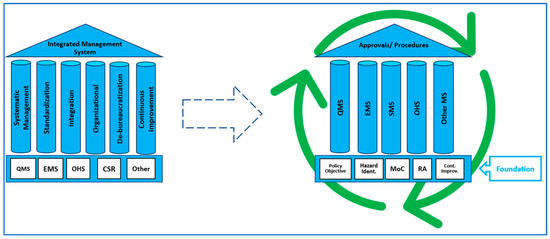
Figure 2.
IMS concept.
The literature review also revealed a big unknown on how to set up an IMS. Therefore, the question in this concept is how to define that foundation. What are the building blocks and materials to make a solid foundation? On this foundation, other systems can be added, respecting their own identity due to the specific scope of each management system. This results in an integrated system where other systems can be built as the standard components are integrated into the foundation.
To define that foundation, as the aviation industry is highly regulated, we start from the existing system SMS, which is regulated and imposed on each airline to have this implemented, to understand how this system works and to build upon it. It is necessary to consider this factor. Otherwise, we could end up with a concept that might not be regulatory compliant. This requirement is founded on the ICAO Annex 19 [32,33] and ICAO Doc9859 [34,35,36,37], which provide the baseline for implementing an SMS. It consists of 4 components and 12 elements.
Besides regulated management systems, there are also industry standard management systems, of which ISO standards are the most common and known in different industries.
The ISO Management Systems are founded on the PDCA Cycle from Deming [38]. The Wheel of Deming was developed by Dr. W. Edwards Deming in 1950, based on Shewart [39] Cycle from 1939, and is a circular method to continuously review processes, products, and services. It is a continuous feedback loop to improve, solve problems, and manage changes by preventing error re-occurrence by establishing and continuously improving those standards. The cycle consists of four components, Plan, Do, Check, and Act (PDCA), and is applied to each ISO Management System.
By plotting the Deming wheel to the ICAO components/elements of a Safety Management System (Figure 3), we could define some data points in the regulatory required systems and industry-standard systems.
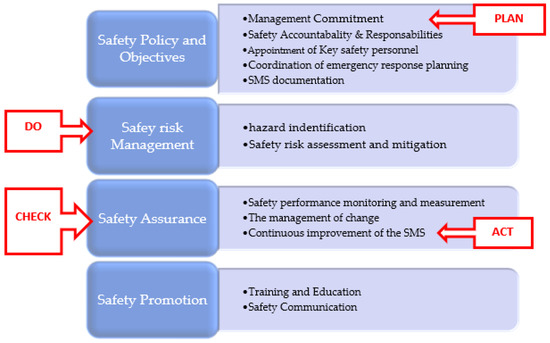
Figure 3.
ICAO SMS elements vs. PDCA cycle.
The following common points would be the foundation to ensure each system can be built upon this foundation:
- Plan: Identify objectives necessary for the organisation to commit to statements described in the policy;
- Do: Identify the different hazards, assess them, and try to mitigate them to an acceptable level to ensure meeting the objectives;
- Study: Study the performance of the actions taken to ensure it provides the expected result after mitigations, and check changes to the organisation to ensure it does not create new hazards;
- Act: Continuous improvement by adding measures to counter changes and lessons learned from the system to improve, change, or add objectives to increase the standard.
Several questions are derived from this selection: a combination of a single choice, multiple choice, and a 5-point Likert scale, depending on the different survey questions. Each common point of the PDCA cycle consisted of multiple questions to understand how each step is working from the point of view of the Safety Management System and how it works with other systems, but also vice versa, to confirm if the interoperability exists in the other direction. A summary of the complete data set is provided in this article. The survey is complemented with demographic data points to understand if the interoperability of different systems depends on these demographic parameters.
This paper is structured in the same logic as the chosen data points. The paragraphs of Section 3 represent the primary outcome of the survey results to the selected elements. Section 3.1 represents the outcome of the impact of the chosen demographic parameters and which are used throughout the survey. The second subsection contains the management commitment of each system of the “Plan” element. The “Do” step is divided into two subsections, Section 3.3 and Section 3.4, showing how each system identifies its hazards and how these are assessed and mitigated. The following paragraphs represent the survey results of the performance monitoring and change management processes, two elements of the “Check” step. Section 3.7 conclude the last step of the survey, representing the continuous improvement results, the “Act” step of Demings’ wheel. The presentation of the main results of the survey is concluded in Section 4.
3. Results
3.1. Data Collection and Analysis
Due to the data collected, this paper’s most significant results are presented from the research survey. Figure 4 shows the demographic impact of the 77 airlines that completed the survey.
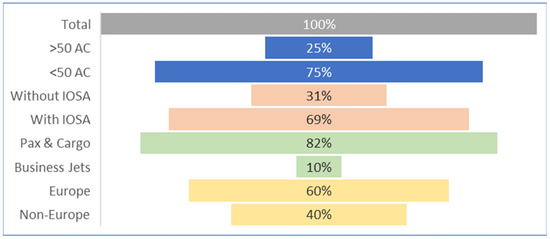
Figure 4.
Percentages of demographic impact.
Most participating airlines are European airlines with a fleet smaller than 50 aircraft. Nineteen large operators participated in the survey (25%). Two are business jet operators, and one is a cargo operator. The remaining sixteen operators, according to IATA WATS (World Air Transport Statistics), represented, in 2019, 25% of the top 20 airlines based on RPK (scheduled Revenue Passenger Kilometres), represented 29% of the top 20 airlines worldwide in 2020, and represented 23% of the top 20 airlines worldwide in 2021. Therefore, this demographic parameter will be considered for the analyses.
The number of business jets operators who participated in the survey is only 10%, representing eight operators in absolute numbers, which is relatively low compared to the other participants and, therefore, will not be considered for the analysis and only be shown as an indication. A small group of 8% are operators with helicopters, aeromedical, or cargo-only operators, which are not defined as separate groups for analysis.
By looking at some demographic parameters, more differences can be seen. The average amount of management systems implemented per organisation is 3.87 systems (green line in Figure 5). Business operators tend to have fewer systems implemented (average of 2.5). It is mainly because there is less need to have an Aviation Security system in place (as they are not IOSA certified, as a consequence, it does not require to be implemented) and do not participate in other standards like ISO at all. Pax and Cargo operators airlines have, on average, 4.05 systems implemented. The size of the airlines matters as airlines with a large fleet have, on average, 4.42 systems implemented compared to smaller companies with less than 50 aircraft (on average, 3.68).
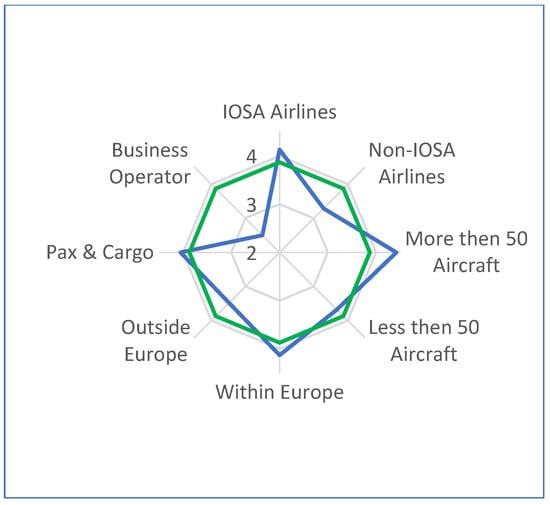
Figure 5.
Average MS implemented.
The main difference is that larger airlines have, in 68% of the cases, implemented a fatigue management system, compared to 43% with smaller airlines (Figure 6). Another difference is that large airlines have implemented more ISO standards than small airlines. One explanation could be that large airlines are more exposed and complex organisations with more in-house maintenance facilities than smaller airlines, where contracting services could be more applied. Furthermore, these facilities require some standards not covered in aviation regulations and, therefore, require ISO standards like the OHS Systems. As they are more exposed to media, the environmental topic could be more critical as there is a tendency to operate as green as possible (hence the environmental systems in place). However, due to their exposure, they could be more a risk for cyber-attacks, which could explain the highest rate of cybersecurity systems implemented. Considering that only 27% of the survey are airlines with a large fleet, it can already be noted that they have implemented more different management systems, including the highest percentage of ISO standards.
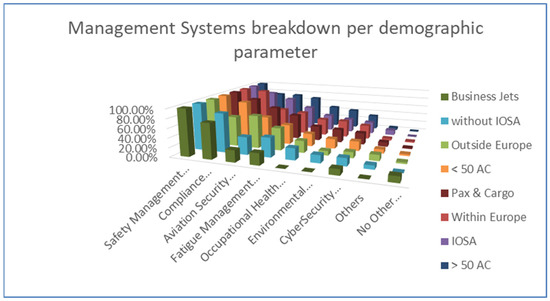
Figure 6.
MS breakdown vs. demographic parameter.
The main difference between IOSA operators (average of 4.13) and non-IOSA operators (average of 3.29) is that non-IOSA operators implemented much fewer Security Management Systems (almost 50% less compared to IOSA operators) and other ISO systems (10% and more compared to IOSA operators). Only safety management and compliance monitoring systems are equally implemented.
Outside Europe (average of 3.48), compared to inside Europe (average of 4.13), there is a drop in implementing a compliance monitoring system, environmental system, and cybersecurity system (lowest of all demographic groups). However, they have a higher aviation security system implementation. Different reasons could be at play here. Outside the EU, different rules apply for airlines, and it is not part of the research to evaluate each participating airline from each country to review the local requirements for MS. In Europe, safety and compliance monitoring systems are mandated, which might differ in other parts of the world. In addition, European airlines are seemingly more open to implementing ISO standards than airlines outside Europe.
3.2. Management Commitment
Policies and objectives, which can be related to the step “Plan” of Deming’s wheel (Figure 3), are the first data points captured. When different systems are implemented, different policies exist (Figure 7). In 74% of the responses, input from other systems is considered to avoid conflicting policies. Policies define commitments and objectives. Without coordination, it could result in counterproductive goal setting, as one system’s objective could work against another. As an example, reducing emissions by changing the fuel policy could have a negative effect on the safety of an aircraft. Policies and objectives are the first elements in a management system. An objective is a tangible measure, a specific step to achieve what is defined in a policy. Both are interconnected. Consequently, the same should be seen in the objectives settings between the different systems.
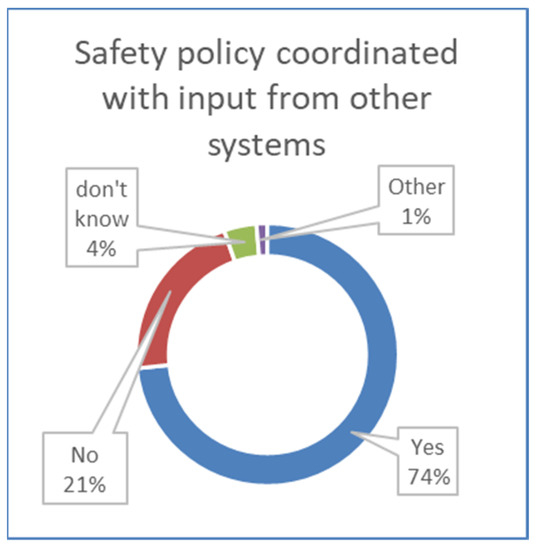
Figure 7.
Policy coordination.
Therefore, two additional questions were asked to see if safety objectives are coordinated with other systems and vice versa if objectives from other managements are coordinated with safety objectives.
The outcome of the data shows an imbalance in that connection. Regardless of the level of integration of policies, considerable coordination exists to set up policies between the different systems (74% in Figure 7) but significantly less when the objectives are set up (Figure 8). It is unclear why this difference is because objectives result from policies. One would expect the same amount of coordination between policies and objectives.
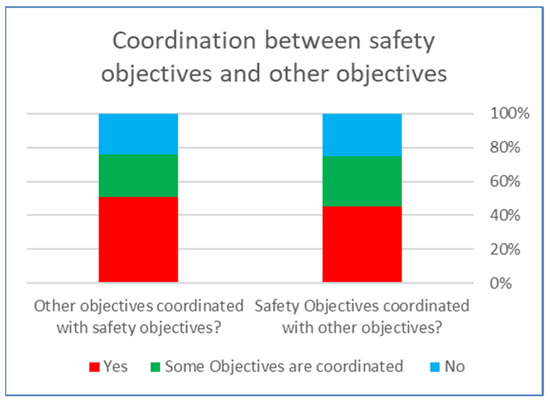
Figure 8.
Coordination of objectives.
Maybe policies are less coordinated than the data show us, or are objectives more coordinated? More interesting is the misalignment as it will reduce the efficiency of how these systems work together, if at all, and could result in systems which work against each other, which is the opposite goal of an integrated system.
3.3. Hazard Identification
The second set of data points is related to Deming’s “Do” step, which consists of two elements, of which hazard identification is the first.
This element will have multiple data points in the survey as we are touching the core of each management system to identify risks and assess and mitigate them ALARP (As Low as Reasonably Possible). The first data point is the reporting tool used, which is the entry point in a system when a risk is identified. In 74% of the answers, one reporting system is used for the different systems. There is no demographic impact, and the high percentage was confirmed later in the survey to verify if other reporting tools exist. It indicates that the same reporting tool is used for events reported to an organisation, meaning the data are centralised for the different systems. Risks today come from various places like industry events, notifications from regulators, and own reporting data. The variety of risks is expanding and does not remain only for safety-related events. The majority is using one reporting tool to receive all these kinds of risks, which is a good indicator (Figure 9).
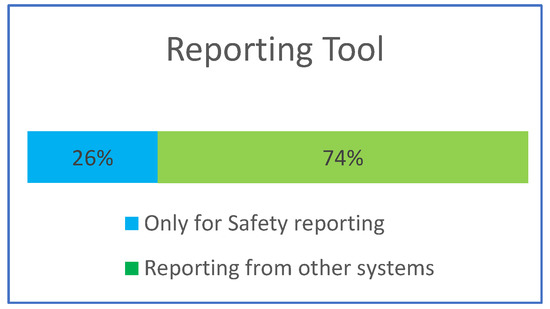
Figure 9.
Usage of reporting tool.
Although the reported events are centralised, the different risk analysis varies. Most airlines use the ICAO 5*5, followed by a custom-made matrix developed by the airlines. By comparing if the same matrixes are used in other systems besides the safety system, we see that only 65% of the other systems use the same matrix on average. In other words, in 35% of the cases, the risk from other management systems is looked at differently and classified differently than the risk for a Safety Management System (Figure 10).
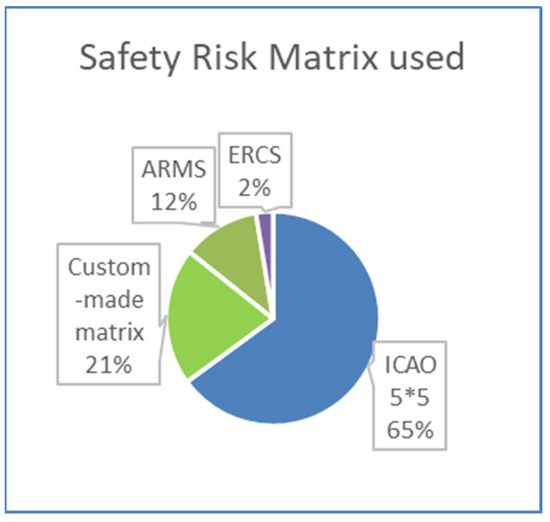
Figure 10.
Risk matrix used.
What stands out is, when looking at the larger airlines, which have the most management systems in place on average; they not only have the most custom-made matrices in place for safety management (32%, Figure 11) but also 47% are using other risk matrixes for the different implemented management systems. In comparison, smaller airlines tend to have a more aligned approach to risk rating between the different management systems. It needs to be clarified why management systems of larger airlines use more different risk matrixes for each system. Could large airlines have a more significant company structure, making the silo effect between the different systems more apparent? Although there is a high rate of using the same reporting tool to identify hazards, different systems use different matrices to rate the risk. There should be a correlation between the reporting tool and the risk matrix used. As the same tool is used to identify different risk hazards, all centralised, one would expect that the next step in the process, to evaluate the risk, is also standardised, but nothing is less true.
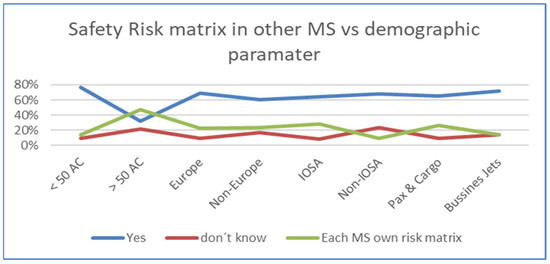
Figure 11.
Risk matrix vs. demographic parameter.
It indicates a need for more integration between the different systems. Comparing one system’s risk level with another would be difficult if different matrixes are used. What does a high-risk red event mean in one system if another matrix is used for other systems? For the decision makers, it means they need to know which event is risk-rated in which system, understand the risk matrix used in that particular system, and make the right decisions. Moreover, do all, or some individual systems, use a different matrix? This simple example demonstrates the complexity it induces.
The difference between a centralised reporting tool and how these risks are evaluated becomes more apparent when examining how these risks are classified via the taxonomies available. More important is the high number of custom-made classifications, as the other classifications requested by authorities or industry are too comprehensive or cumbersome. Therefore, custom-made trees are used to classify safety risks which are then linked to other taxonomies. It also indicates that there is no industry standard (Figure 12).
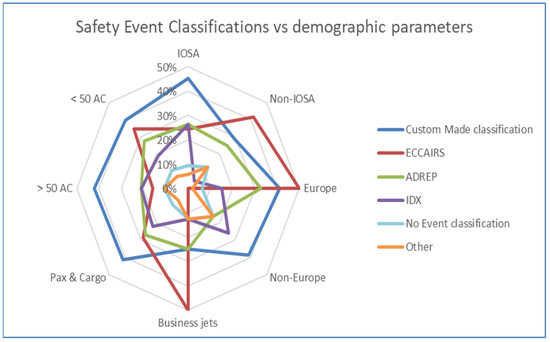
Figure 12.
Event classification vs. demographic parameters.
Regardless of which classification is used for safety events, only 41% of the classification type is used in other management systems (Figure 13). Moreover, almost 35% do not use any classification in other management systems, and 24% have an individual classification system. ADREP, ECCAIRS, and IDX were initially developed for operational safety events. However, if management systems are integrated, one would expect that at least the own developed classification trees are used cross-system wise, but that is also not the case. The low level of the same classification used in other systems for airlines with more than 50 aircraft, or differently added, the high number of no classifications used and where each system has its own classification sticks out. The same is true for non-IOSA operators, where 50% do not use any classification to define risks entering the organisation.
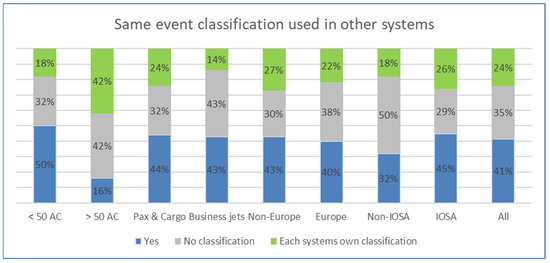
Figure 13.
Classification used in different MS.
It indicates another lag in integration. If no taxonomy or other taxonomies are used for different systems, having an integrated system where all systems can “speak” to each other would be challenging. For example, if a risk is identified as “procedures not followed” and in other management systems classified as “not following procedures” or “not adhering to procedures”, it would be challenging to keep the overview if risks are returning in different nomenclature in different systems. The holistic overview can only be kept when different classifications are used and there is a mapping between them. In addition, it should be defined which classification is the “master” classification which could provide the overall risk picture of which risks are occurring.
Compared to the event classification, to understand the “what” type of risk is happening, there is less variation in defining “why” these reported risks are happening (Figure 14). On average, the participants use HFACS (38%) and custom-made classifications (36%). It is worth mentioning that the responses under “others” are mainly techniques, like the “5 WHY”, to determine a root cause, but this is not a classification. Therefore, the 12% of participants identified as not having a root cause classification is higher, probably closer to almost 30%, if some of the “others” are also considered as “no root cause classification” labels. The higher score for the usage of HFACS is to be encouraged as it includes soft aspects to identify why events are happening in an organisation, and it determines the maturity of an implemented SMS [40].
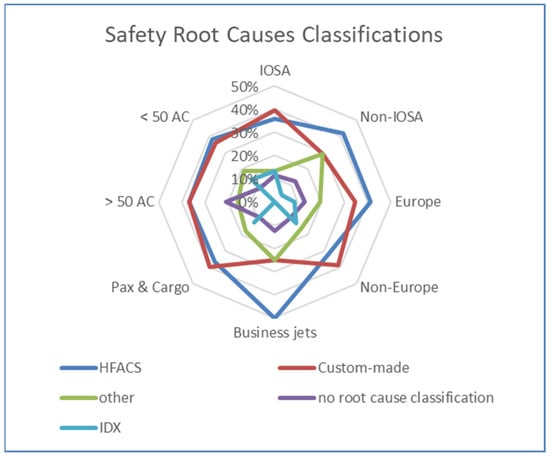
Figure 14.
Root cause classifications.
The same observation as for the “what“ classification applies to the “why” classification (Figure 15), that only 44% use the same classification in other systems, with an absolute minimum for airlines with more than 50 aircraft and business jet operators. Alternatively, they have a high amount of no classification used for determining causes in other systems, together with non-IOSA operators.
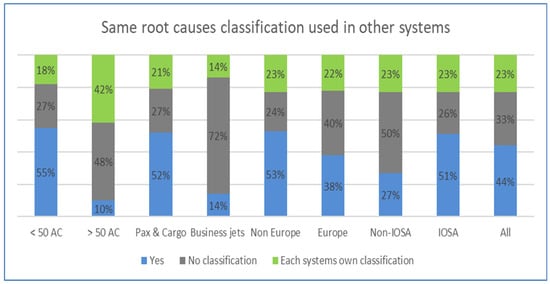
Figure 15.
Cause classification in other MS.
The same problem as with “what” classifications is also present here. If, for example, a reason for a certain risk is identified due to “training”, but in other systems, this classification is named “Training missing”, “lack of training”, or “training oversight”, the holistic understanding of why risks are happening is challenging. Only an additional mapping could counter this, but a master classification would need to be defined to have the complete picture.
3.4. Risk Assessment and Mitigations
The second element of Demings’ “DO” step, after hazard identification, is the element of risk assessment. Data points were collected for risk assessments and mitigations to verify if this includes the involvement of multiple systems to identify the different risks.
Most airlines use the ICAO 5*5 matrix (Figure 16) and custom-made matrixes to conduct safety risk assessments. Other implemented management systems use 70% of the same matrix as the Safety Management System to conduct risk assessments (Figure 17). No trends are spotted in the data by looking at the different demographic parameters; the same pictures apply.
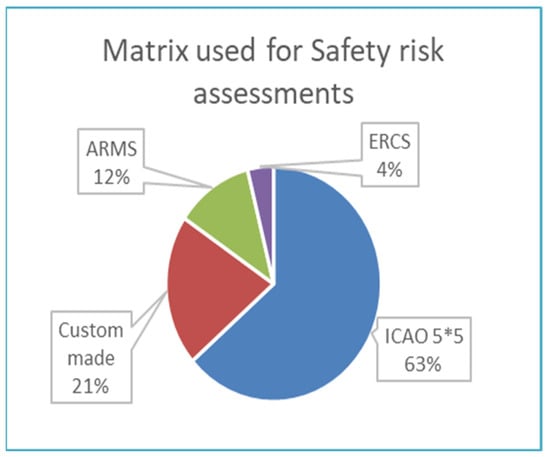
Figure 16.
Risk matrix safety assessments.
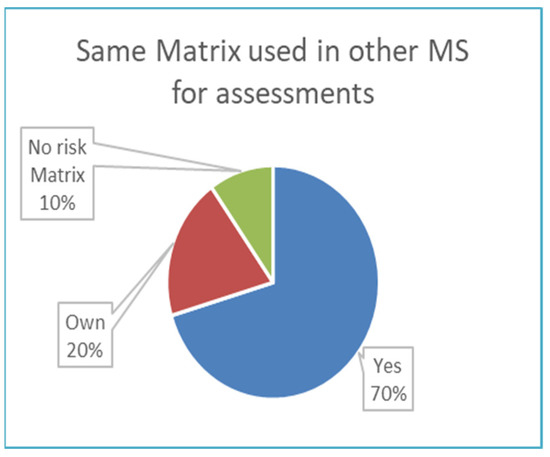
Figure 17.
Risk matrix other MS.
This also aligns with the risk matrixes used when events (hazard identification) are reported (Figure 10). It indicates that the same method is used for different organisational processes. If a risk matrix is used to evaluate an event’s risk, the same matrix is used to conduct risk assessments. A small note is that the ARMS methodology consists of two risk approaches, one for reported events and one for conducting assessments, resulting in different risk matrixes for both processes within one ARMS method.
There is a high coordination rate between the individual systems, as almost 80% of the risk assessments consider the risks of other systems and vice versa (Figure 18).
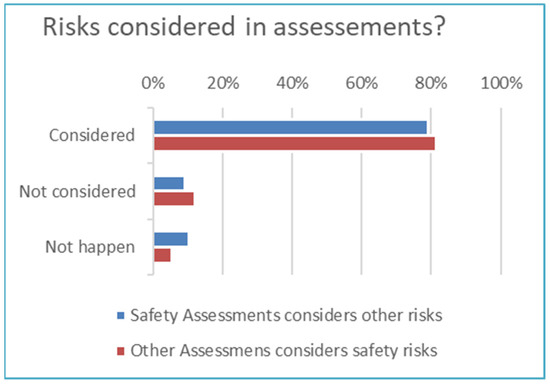
Figure 18.
Risk in assessments.
Risk assessments do not need to classify events as one specific event is looked at in more detail and analyses what is already in place to assess a specific risk resulting from an event. The absence of taxonomies could facilitate this cooperation.
The result of these assessments is translated into mitigation actions to enforce what is already in place or to create new barriers to prevent the event from happening again. As each management system considers different risk angles for conducting an assessment, one would expect that the mitigations are coordinated. This is the case, and Figure 19 shows that, due to those assessments including different systems, sometimes mitigation actions fall outside a pure aviation safety point of view and confirms that other management systems are part of the assessment and, therefore, look beyond the safety management system.
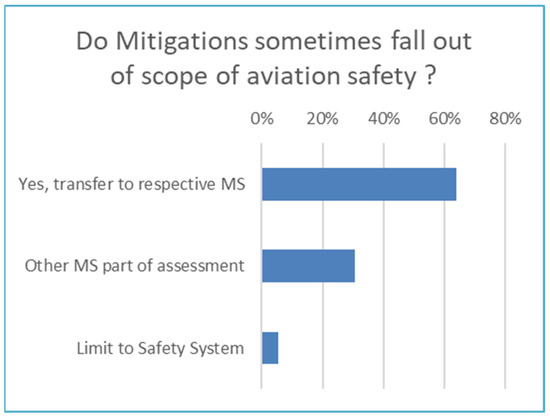
Figure 19.
Mitigations outside safety risks.
When mitigation actions are transferred to other management systems, it is to be questioned how this works as the other system could speak another risk language (matrix/classification). One would need to know all the different evaluation methods used in each system to know that it is a risk in the first place for the organisation and to understand that mitigation is required, which could impact multiple systems.
3.5. Performance and Measurement
The first element of the component risk assurance, which is also part of the “Check” step from Deming’s wheel, is performance and measurement, achieved via the collection of trends. The term “trends” is to be understood as a collection of activities such as, but not limited to, surveys, audits, training, and promotion.
Looking at the action taken following the identified trends of each system and if those are shared amongst the other systems, only 64%, on average, are coordinating trends with other systems. A total of 24% took action when it involved other systems, and 12% replied that no actions are coordinated with other systems.
As we have seen that not all systems use the same method to define and classify risk, the average of 24%, which relates to when other systems are impacted, is questionable. If different systems use different methods, how would one system know which trends could have a risk impact on another system? Adding to the different demographic parameters (Figure 20), the larger airlines interact less with other systems and the non-IOSA airlines. This is in line with the result of previous data points, as these groups use the most different risk matrixes and taxonomies for the different systems, which increases the complexity between the different systems. Consequently, sharing trends spotted in one system and coordinating this with other systems is challenging.
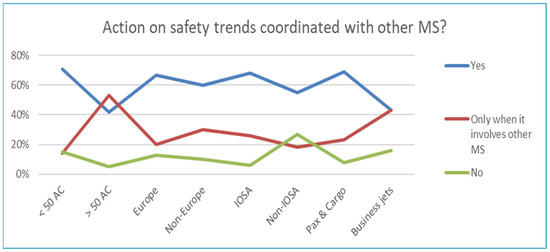
Figure 20.
Coordination of trends amongst MS.
3.6. Management of Change
The second element of the “Check” step in the PDCA cycle, falling under the SMS component risk assurance, is the Management of Change. This process is created to evaluate changes, not only internal changes in a company but also external changes which could impact an organisation. Changes are not limited to aviation safety but could be various changes with different risks, meaning the involvement of different management systems.
A similar picture comes out for the risk assessment, where 67% (Figure 21) use an ICAO matrix to assess these risks and other management systems, and 77% (Figure 22) use the same matrix as the safety management system. When not the same matrix is used, only a minority have created their own matrix (6%), and 17% do not use a risk matrix at all.
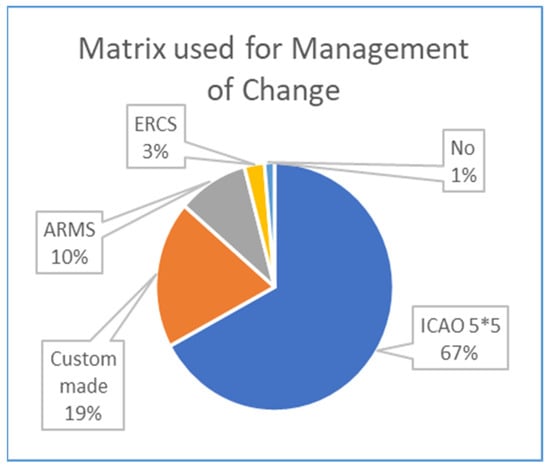
Figure 21.
Risk matrix for MoC.
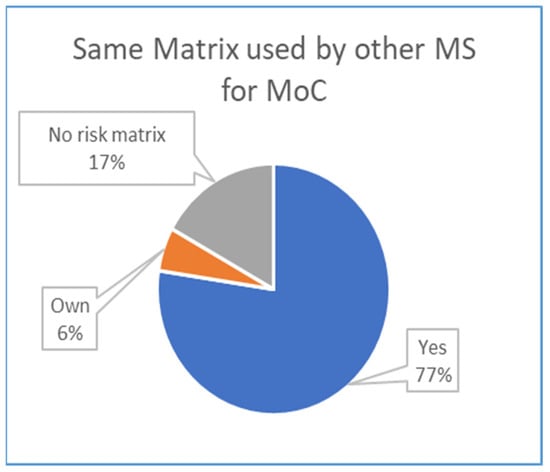
Figure 22.
Matrix used by other MS for MoC.
Looking at the demographic differences, a slight change for larger airlines can be seen (Figure 23). The use of the same matrix for change management in other management systems drops to 53%, and almost 37% of the other systems use their own risk matrix. It also applies to non-European airlines, but the peaks are less significant, where only 64% use the same matrix, whereas, in 25% of the cases, each management system has its own matrix.
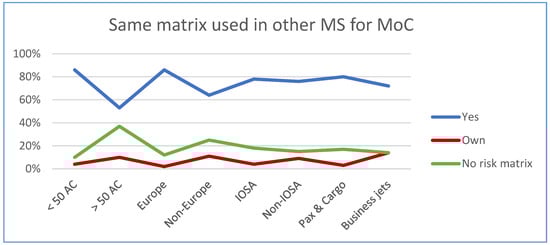
Figure 23.
Matrix used for MoC vs. demographic parameters.
Besides the different risk matrixes in use, other risks are considered in only 52% of the cases (Figure 24). It is not surprising, as we have seen that the different systems use different risk evaluations and classifications. The change process can be for any internal or external change that could imply a new organisational risk. Like the risk assessment, this process should include many potential risks, but this does not result from the survey. It confirms (again) that the current interoperability between systems is difficult.
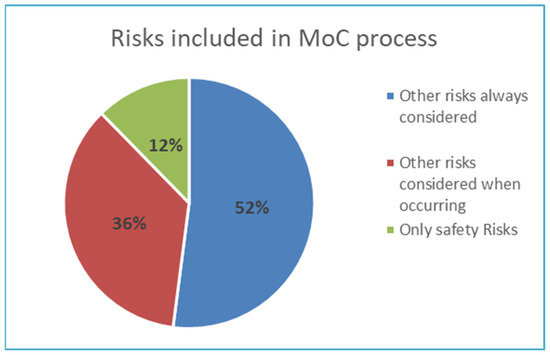
Figure 24.
Risks in MoC process.
3.7. Continuous Improvement
The last data points of the survey are on continuous improvements of the ICAO SMS, representing the corresponding “Act” step of Demings’ wheel. Questions were raised to learn from the different risks in the various management systems to see if improvements are shared between the systems.
There is some inconsistency as the communication flow from an SMS system is more present (Figure 25). A total of 82% responded that improvements are communicated towards other systems. However, other management systems only communicate towards SMS in 18% of the cases, and even 29% do not communicate with the safety management system (Figure 26). If communication is established in one way, one will suspect that there is communication established in the other way. As this is not the case, it indicates that the integration is absent. Otherwise, we would see two-way communication.
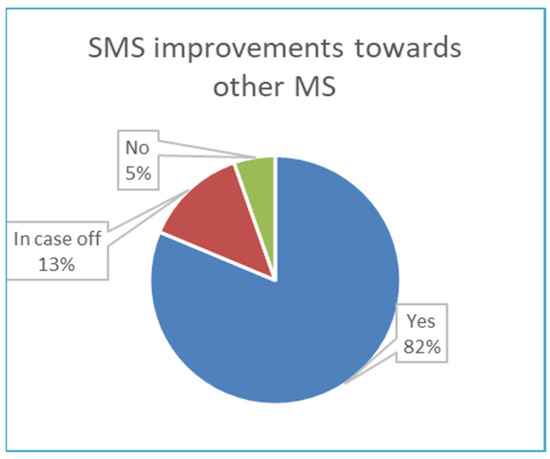
Figure 25.
SMS improvements toward other MS.
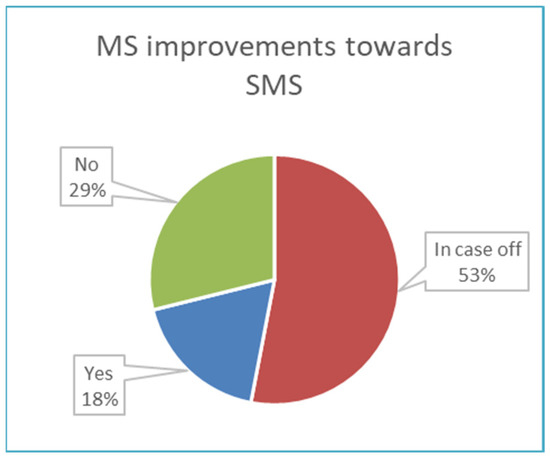
Figure 26.
MS improvements toward SMS.
This significant imbalance in communication is remarkable. Why does a Safety Management System communicate with other systems, not vice versa? It might result from the fact that no standard taxonomy nor standard risk evaluation is used, which results in each management system speaking its language, which might increase communication complexity. Some processes have less coordination between the different systems, but the gap is smaller. Although other processes (risk assessments and change management) are seemingly working closer together, the outcome and implementation have been questioned because of the need for more language or translation between the different management systems.
Can organisations not make the translation bridge between the safety management system, which is more mature due to its mandatory character, and other management systems, which results in this imbalance?
4. Discussions and Limitations
The survey compared the different systems to the ICAO Annex 19 Safety Management requirements. As this is the only system mandated worldwide, it is used as a baseline to ensure, when creating a concept and further on creating an IMS model, that it complies with the ICAO requirements, not conflicting with it. The Deming Wheel Concept, used as a basis for ISO standards, is also mapped against the different systems. It resulted in an indication of the required data needed for the research.
As no data are available, a survey was rolled out to capture as much data as possible. The survey proceeded with some demographic data points to identify participant groups’ differences. As 77 airlines completed the survey entirely, the capture is to be considered successful, and the data results were validated. As no previous data are available, and similar surveys have not been conducted on this scale, it needs to be considered a positive outcome as it provides a first understanding of how systems work together. On average, 3.87 management systems are implemented within airlines. Large airlines with over 50 aircraft in the fleet have the most systems implemented (on average, 4.42) and the most ISO systems implemented. The survey started to investigate if a correlation exists between policies and objectives, demonstrating an imbalance. Different types of policies exist (all-in-one, stand-alone, partially combined), and there seems to be coordination to define different policies for the different management systems implemented. However, when looking at the objectives settings, which is the outcome of policies with concrete goal settings, there needs to be more coordination between the different systems. As policies and objectives go hand-in-hand, the coordination of objectives should be as high as when creating policies, if not higher.
Risk assessment processes and management of change processes also require to evaluate risk. A good outcome of the survey is that a centralised system is used to identify risks from different systems. However, the evaluation of these risks needs to be standardised. Most airlines use a 5 × 5-scale matrix (five levels of probability and five levels of severity scaling), but in 35% of the responses, another matrix is used to evaluate risks from other systems. It is also true for other processes studied in the survey. In other words, when an airline selects a risk matrix, it uses the same for all processes. There is a sidenote to the risk matrixes used. The difference in risk matrixes might exist in some or more management systems implemented. A safety management system could have implemented an ICAO 5*5 matrix, also used in the security management system. However, another matrix is used for compliance monitoring, which makes it easily complex as multiple combinations could exist.
The different risk matrixes used (or not used) for various management systems increase complexity for decision makers. They must navigate the various management systems and understand the risk evaluations conducted for different events to take proper action. This lack of standardisation between the different management systems is even more apparent when looking at the classifications for all these events entering a management system. Mandatory and non-mandatory risks/events are recorded, and a structure is needed to manage all these entries to understand “what” is happening. Besides a standardisation to evaluate risk (risk matrix), a common taxonomy is also needed to ensure that similar risk factors can be seen in other systems. Most airlines use custom-made taxonomies mapped out against other mandated taxonomies to identify what type of risk is noticed. However, only 41% use the same taxonomy on other systems.
The same can be seen by looking at taxonomies used to understand “why” all these events are happening. Only 44% of the different management systems use the same taxonomy, and the majority use other or no classifications.
The two classifications used to define what and why certain risks happen go hand-in-hand. If an airline is not using classification to define “what” is happening, it will not use a taxonomy to identify “why” certain risks happen. In other words, there is no partial integration in that sense; some components are aligned or not. The lack of classification systems used amongst the different implemented management systems is another sign of needing more integration between the different systems. It indicates a need for more interoperability between systems.
If other or no classification is used between the different systems, it would be difficult to understand if different risks could impact other management systems. The holistic approach will disappear and become counterproductive as decision makers could make decisions due to an individual system, which could negatively affect another system.
If we define risk language as a combination of risk evaluation and classification, there is a big gap between the systems implemented.
Mitigation actions are present across management systems. However, the actual implementation of how these actions are transferred is to be seen, as not all systems use the same matrix approach as seen before. Looking at the risk assessment process, more coordination exists amongst the different systems. It involves the risk point of view of other systems, which is also translated into the risk assessment outcome. The same goes for the performance of the systems, the so-called trends, which comprise audits, surveys, training, and promotion. The survey also shows a reasonable coordination rate, but how this is implemented still needs to be answered. How would one system know that an audit result or a training need also affects another system, as the language between those systems is not aligned? Although the process for risk assessment has a higher implementation among the different systems, this is the opposite of the change management process. Risks from other management systems are considered in only 52% of the responses. If a risk assessment process is in place, which involves coordination between the different systems to identify the different risks, it would also be for the change management process, but it is not. This is strange as the process is to capture changes due to various internal and external risks, which could have a risk impact on one or more systems and indicates another need for interoperability.
The lack of bilateral working relationships between the different systems is becoming more pronounced when looking at the last element of continuous improvement. All the systems would need to learn from each other, but that communication could be improved. The communication flow from a Safety Management System exists towards other systems but only exists for about 50% in the other direction. This significant imbalance is another indication as before, where implementation actions were questioned as different systems have different ways of evaluating risk and using different taxonomies. These different languages from the various systems are challenging to translate amongst each other.
The conclusion is that large airlines with over 50 aircraft in their fleet have the most systems implemented, including ISO management systems. They have significantly less coordination and processes aligned between those systems than other demographic groups. It might be because larger organisations are more complex and suffer from siloed departments. However, to their exposure of being a large airline, it would be in their interest to have one approach to have a holistic approach to the risks they are facing.
Another limitation could be the availability of software systems. Does each management system use dedicated software to manage its risk? If procedures and processes are made to create an IMS, there might be an additional need to create interoperability between software systems so that data can be exchanged amongst them. Or would one software system exist, able to align all the processes for an IMS and have the possibility to map the holistic risk approach?
The survey results already provided a first inside on the subject. Due to various reasons, it remains challenging to reach out to airlines to participate in such a survey. Although 77 airlines participated, it remains a small portion of all the airlines in the industry worldwide.
5. Conclusions
From the information gathered via the survey, the next step in the research is to build further on the IMS concept to develop a method to create interoperability between the different management systems by creating an IMS language to facilitate this. This language should be defined, and a common understanding of how risk should be evaluated uniformly throughout the different management systems by developing a risk matrix that different management systems can use. The scale of such a matrix should be calibrated for each management system and aligned among them. A significant risk in a Safety Management System should have an equivalent in another management system. An example is that a significant safety risk, like an aircraft accident, is an equivalent significant risk in a Security Management System, for example, a bomb threat during flight. To classify risks between all those systems, a uniform taxonomy should be developed which could work for all the different systems so that all systems can identify in the same way what is occurring in the airline and why it is occurring.
In addition, an alignment for the building blocks of the “foundation”s’ concept should be defined to ensure which processes can work together (or not at all). These components are to be defined to build a foundation for an IMS for airlines, to which any other MS can be added so that the individual identity of each management system is respected.
An airline would benefit from such an integrated management system in two ways. An airline would understand which risks are occurring in its organisation, what the impact is, and why they would occur, not limited to safety. Events that were not looked at from a safety point of view could also impact other systems and vice versa. A risk coming from a security system or OHS system will not be treated isolated but holistically. Secondly, by setting up a framework, integrating future management systems into the IMS would be easy.
The outcome of some demographic parameters on the survey results will drive the selection of different airlines to test the IMS method via case studies. Large airlines seem more siloed than smaller airlines, and different case studies could explain this anomaly. The case studies will evaluate the possibility of the practical implementation of the IMS model and where further research is needed. It will also define the challenges for airlines to implement such an IMS and highlights the gaps in current regulations and standards to implement an IMS.
Author Contributions
Conceptualisation, J.M.; methodology, J.M.; software, J.M.; validation, J.M.; formal analysis, J.M.; investigation, J.M.; resources, J.M.; data curation, J.M.; writing—original draft preparation, J.M.; writing—review and editing, J.M., W.D. and R.M.; visualisation, J.M.; supervision, W.D. and R.M.; project administration, J.M.; funding acquisition, J.M. All authors have read and agreed to the published version of the manuscript.
Funding
This research received no external funding.
Institutional Review Board Statement
Not applicable.
Informed Consent Statement
Not applicable.
Data Availability Statement
The data presented in this study are available on request from the corresponding author. The data are not publicly available as data capture has been conducted using an online platform called Qualtrics under the licence and student login of the University of Antwerp.
Conflicts of Interest
The authors declare no conflict of interest.
References
- Górski, T. Integration Flows Modeling in the Context of Architectural Views. IEEE Access 2023, 11, 35220–35231. [Google Scholar] [CrossRef]
- Leal, G.D.S.S.; Guédria, W.; Panetto, H. An ontology for interoperability assessment: A systemic approach. J. Ind. Inf. Integr. 2019, 16, 100100. [Google Scholar] [CrossRef]
- Singh, S.N. Establishing an Integrated Management System (ISO 9001, ISO 14001, OHSAS 18001) within Typical Manufacturing Industry. Master’s Thesis, Department of Biotechnology and Environmental Science, Thapar University India, Patiala, India, 2009. [Google Scholar]
- Seghezzi, H. Business concept redesign. Total Qual. Manag. 1997, 8, 36–43. [Google Scholar] [CrossRef]
- Garvin, D. How the Baldrige award really works. Harv. Bus. Rev. 1991, 69, 80–93. [Google Scholar]
- Nunhes, T.V.; Motta Barbosa, L.C.F.; de Oliveira, O.J. Identification and analysis of the elements and functions integrable in integrated management systems. J. Clean. Prod. 2017, 142, 3225–3235. [Google Scholar] [CrossRef]
- López-Fresno, P. Implementation of an integrated management system in an airline: A case study. TQM J. 2010, 22, 629–647. [Google Scholar] [CrossRef]
- Almeida, J.; Domingues, P.; Sampaio, P. Different perspectives on management systems integration. Total Qual. Manag. Bus. Excell. 2014, 25, 338–351. [Google Scholar] [CrossRef]
- Karapetrovic, S.; Willborn, W. Integration of quality and environmental management systems. TQM Mag. 1998, 10, 204–213. [Google Scholar] [CrossRef]
- Carvalho, K.M.; Picchi, F.; Camarini, G.; Edna, M.Q.O. Benefits in the Implementation of Safety, Health, Environmental and Quality Integrated System. Int. J. Eng. Technol. 2015, 7, 333–338. [Google Scholar] [CrossRef]
- Maier, D.; Vadastreanu, A.M.; Keppler, T.; Eidenmuller, T.; Maier, A. Innovation as a part of an existing integrated management system. Procedia Econ. Financ. 2015, 26, 1060–1067. [Google Scholar] [CrossRef]
- Muzaimi, H.; Chew, B.C.; Hamid, S.R. Integrated management system: The integration of ISO 9001, ISO 14001, OHSAS 18001 and ISO 31000. In AIP Conference Proceedings; American Institute of Physics Inc.: College Park, MD, USA, 2017. [Google Scholar] [CrossRef]
- Muzaimi, H.; Hamid, S.R.; Chew, B.C. Integrated Management System for quality management system accreditation. J. Adv. Manuf. Technol. 2018, 12 (Suppl. 1), 87–100. [Google Scholar]
- Algheriani, N.M.S.; Kirin, S.; Spasojevic Brkic, V. Risk model for integrated management system. Teh. Vjesn. 2019, 26, 1833–1840. [Google Scholar] [CrossRef]
- ISO 31000; Risk Management–Principles and Guidelines. International Organisation of Standards (ISO): Geneva, Switzerland, 2009.
- ISO 9000; Quality Management. International Organisation of Standards (ISO): Geneva, Switzerland, 1987.
- ISO 18001; Occupational Health and Safety Management. International Organisation of Standards (ISO): Geneva, Switzerland, 2007.
- ISO 45001 9000; Occupational Health and Safety Management. International Organisation of Standards (ISO): Geneva, Switzerland, 2018.
- ISO 14001; Environmental Management. International Organisation of Standards (ISO): Geneva, Switzerland, 1996.
- International Organisation of Standards (ISO). IUMSS The Integrated Use of Management System Standards, 1st ed.; International Organisation of Standards (ISO): Geneva, Switzerland, 2008. [Google Scholar]
- Yatim, M.H.B.M. A Review on Integration of ISO14001 and OHSAS 18001 Management System in an Organisation. Master’s Thesis, University of Malaya, Kuala Lumpur, Malaysia, 2004. [Google Scholar]
- De Oliveira, O.J. Guidelines for the integration of certifiable management systems in industrial companies. J. Clean. Prod. 2013, 57, 124–133. [Google Scholar] [CrossRef]
- Abad, J.; Dalmau, I.; Vilajosana, J. Taxonomic proposal for integration levels of management systems based on empirical evidence and derived corporate benefits. J. Clean. Prod. 2014, 78, 164–173. [Google Scholar] [CrossRef]
- Nunhes, T.V.; Bernardo, M.; Oliveira, O.J. Guiding principles of integrated management systems: Towards unifying a starting point for researchers and practitioners. J. Clean. Prod. 2019, 210, 977–993. [Google Scholar] [CrossRef]
- Bernardo, M.; Casadesus, M.; Karapetrovic, S.; Heras, I. Integration of standardised management systems: Does the implementation order matter? Int. J. Oper. Prod. Manag. 2010, 32, 291–307. [Google Scholar] [CrossRef]
- Leopoulos, V.; Voulgaridou, D.; Bellos, E.; Kirytopoulos, K. Integrated management systems: Moving from function to organisation/decision view. TQM J. 2010, 22, 594–628. [Google Scholar] [CrossRef]
- Marinello, V.; Dinicolò, G.L.M. Integrated management systems between evolutionary routes and management process. Corp. Ownersh. Control 2019, 16, 60–66. [Google Scholar] [CrossRef]
- Lahuta, P.; Kardoš, P.; Hudáková, M. Integrated Risk Management System in Transport. Transp. Res. Procedia 2021, 55, 1530–1537. [Google Scholar] [CrossRef]
- Bugdol, M.; Jedynak, P. Integrated Management Systems; Springer: New York, USA, 2015; ISBN 978-3-319-10027-2. [Google Scholar]
- Daneshjo, N.; Malega, P.; Kóňa, J.; Barilová, B. Integrated Management System and Corporate Risk Management. TEM J. 2021, 10, 1686–1693. [Google Scholar] [CrossRef]
- Malakis, S.; Kontogiannis, T.; Smoker, A. A pragmatic approach to the limitations of safety management systems in aviation. Saf. Sci. 2023, 166, 2023. [Google Scholar] [CrossRef]
- International Civil Aviation Organisation (ICAO). Annex 19, Safety Management, 1st ed.; ICAO: Montreal, QC, Canada, 2013. [Google Scholar]
- International Civil Aviation Organisation (ICAO). Annex 19, Safety Management, 2nd ed.; ICAO: Montreal, QC, Canada, 2016. [Google Scholar]
- International Civil Aviation Organisation (ICAO). Doc 9859 AN/474, Safety Management Manual (SMM), 1st ed.; ICAO: Montreal, QC, Canada, 2006. [Google Scholar]
- International Civil Aviation Organisation (ICAO). Doc 9859 AN/474, Safety Management Manual (SMM), 2nd ed.; ICAO: Montreal, QC, Canada, 2009. [Google Scholar]
- International Civil Aviation Organisation (ICAO). Doc 9859 AN/474, Safety Management Manual (SMM), 3rd ed.; ICAO: Montreal, QC, Canada, 2013. [Google Scholar]
- International Civil Aviation Organisation (ICAO). Doc 9859 AN/474, Safety Management Manual (SMM), 4th ed.; ICAO: Montreal, QC, Canada, 2018. [Google Scholar]
- Deming, W.E. Elementary Principles of the Statistical Control of Quality, JUSE; Nippon Kagaku Gijutsu Remmei: Tokyo, Japan, 1952. [Google Scholar]
- Shewart, W.A. Statistical Method from the Viewpoint of Quality Control; Department of Agriculture, Dover Publications: New York, NY, USA, 1986; p. 45. ISBN 978-0-486-65232-0. [Google Scholar]
- Stroeve, S.; Smeltink, J.; Kirwan, B. Assessing and Advancing Safety Management in Aviation. Safety 2022, 8, 20. [Google Scholar] [CrossRef]
Disclaimer/Publisher’s Note: The statements, opinions and data contained in all publications are solely those of the individual author(s) and contributor(s) and not of MDPI and/or the editor(s). MDPI and/or the editor(s) disclaim responsibility for any injury to people or property resulting from any ideas, methods, instructions or products referred to in the content. |
© 2023 by the authors. Licensee MDPI, Basel, Switzerland. This article is an open access article distributed under the terms and conditions of the Creative Commons Attribution (CC BY) license (https://creativecommons.org/licenses/by/4.0/).