Abstract
In order to determine the appropriate utilization conditions of the Vyalov long-term strength prediction equation, this study selected three soil samples from the loess region. These samples were subjected to varying numbers of freeze–thaw cycles, namely 0, 4, 6, 8, 10, 50, and 100 cycles. Subsequently, post-test soil samples underwent spherical template indenter press-in tests and grain size determinations. The experimental outcomes demonstrated that the Vyalov long-term strength prediction equation accurately reflected the long-term strength variations of frozen loess after 10 freeze–thaw cycles. A further analysis revealed that the stability of the soil samples’ grain composition played a vital role in ensuring the accuracy of the prediction equation. Notably, a highly significant positive correlation was observed between the silt content of the soil samples and the prediction equation parameter β. Moreover, employing the Vyalov long-term strength prediction equation after 10 freeze–thaw cycles yielded prediction results consistent with the freeze–thaw cycles–time analogy method for durations of 10, 20, and 30 years. This study is beneficial for the construction and operation of projects in loess areas.
1. Introduction
Loess, as an environmentally sustainable building material, finds extensive application in diverse projects within loess regions. In China, loess soils encompass approximately 6.6% of the country’s total land area, while globally they constitute approximately 10% of the Earth’s land area [1]. With the deep development of Western China (key infrastructure projects on the western seasonal permafrost areas), the problem of freeze–thaw disasters of loess is highlighted [2,3,4], and the freeze–thaw effect seriously affects the construction and operation of loess areas, such as loess-area tunnels in the construction process, due to soil relaxation; poor bearing capacity leads to poor control of tunnel construction quality [5]. The structure of loess undergoes significant transformations during freeze–thaw cycles due to cryogenic actions, resulting in substantial alterations in its long-term strength and deformation characteristics. These changes possess the potential to directly impact the stability of loess regions [6].
The testing and analysis of long-term strength in frozen loess have garnered considerable attention among scholars [7]. However, research on predicting the long-term strength of frozen loess remains relatively limited. Typically, the prediction of long-term strength in frozen soil is accomplished through methods such as a time analogy and utilization of long-term strength prediction equations. Notable examples include the temperature–time analogy method [8], the Vyalov logarithmic equation [9], the Roman power equation [10], and the Wu Ziwang power equation [8]. Due to the existence of ice cementation in frozen soil, frozen soil shows obvious rheology and temperature dependence under a load [11]. In the design of structures within cold regions, the typical service life ranges from 50 to 100 years. Therefore, in engineering applications, it becomes imperative to comprehensively account for the rheological behavior of frozen soil. The short-term test results, which yield insights into the temporal decline in strength, need to be extrapolated to the expected service life of buildings to accurately predict the long-term strength of frozen soil [12]. Roman et al. [13] conducted experiments employing the spherical template indenter, leading to the establishment of the Vyalov long-term strength prediction equation, which proves to be applicable to a wide range of soil types. Notably, the accuracy of predicting equivalent cohesion using this equation is comparable to that achieved through experimental determination. Chen et al. [14] derived the Vyalov long-term strength prediction equation specifically applicable to silt by utilizing sand, silt, and clay as representative examples. Zhou et al. [15] conducted a study on frozen loess and determined that, in comparison to the Roman method and the Wu Ziwang method, the Vyalov method exhibited a superior linear fitting degree. Consequently, the researchers concluded that the Vyalov prediction equation is more suitable for accurately predicting the long-term strength of frozen loess. However, the aforementioned studies mainly focus on identifying the soil types suitable for the Vyalov long-term strength prediction equation, without providing insights into the specific usage conditions of this equation or exploring the relationship between the prediction equation parameter β and the grain composition of the soil sample. Given that a significant portion of loess is located in the seasonal permafrost zone and undergoes repeated freeze–thaw cycles, it becomes crucial to determine the usage conditions of the Vyalov long-term strength prediction equation through freeze–thaw cycle tests and analyze the relevant parameters.
This study took Fuping loess, Haidong loess, and Lanzhou loess with high silt content and strong frost susceptibility as the objects of study. After 0, 4, 6, 8, 10, 50, and 100 freeze–thaw cycles, the long-term strength changes were tested using a spherical template indenter. The variations of the prediction results of the Vyalov long-term strength prediction equation were studied under a different number of freeze–thaw cycles. Then, through grain size determination and a correlation analysis, the reason for improving the accuracy of the prediction equation and the impact of grain composition on the parameter β of the prediction equation were further analyzed. Additionally, the long-term strength of loess was predicted for different time periods, specifically 10, 20, and 30 years. Two different methods were employed for this prediction after subjecting the samples to 10 freeze–thaw cycles: the freeze–thaw cycles–time analogy method [16] and the Vyalov long-term strength prediction equation. To verify the accuracy of the Vyalov long-term strength prediction equation after 10 freeze–thaw cycles, a comparative analysis was conducted by comparing the results obtained from both methods. This study has important theoretical significance for the comparative study of the mechanical behavior of frozen loess under freeze–thaw actions. It also has practical value for the prediction and analysis of engineering stability in cold areas.
2. Theoretical Basis
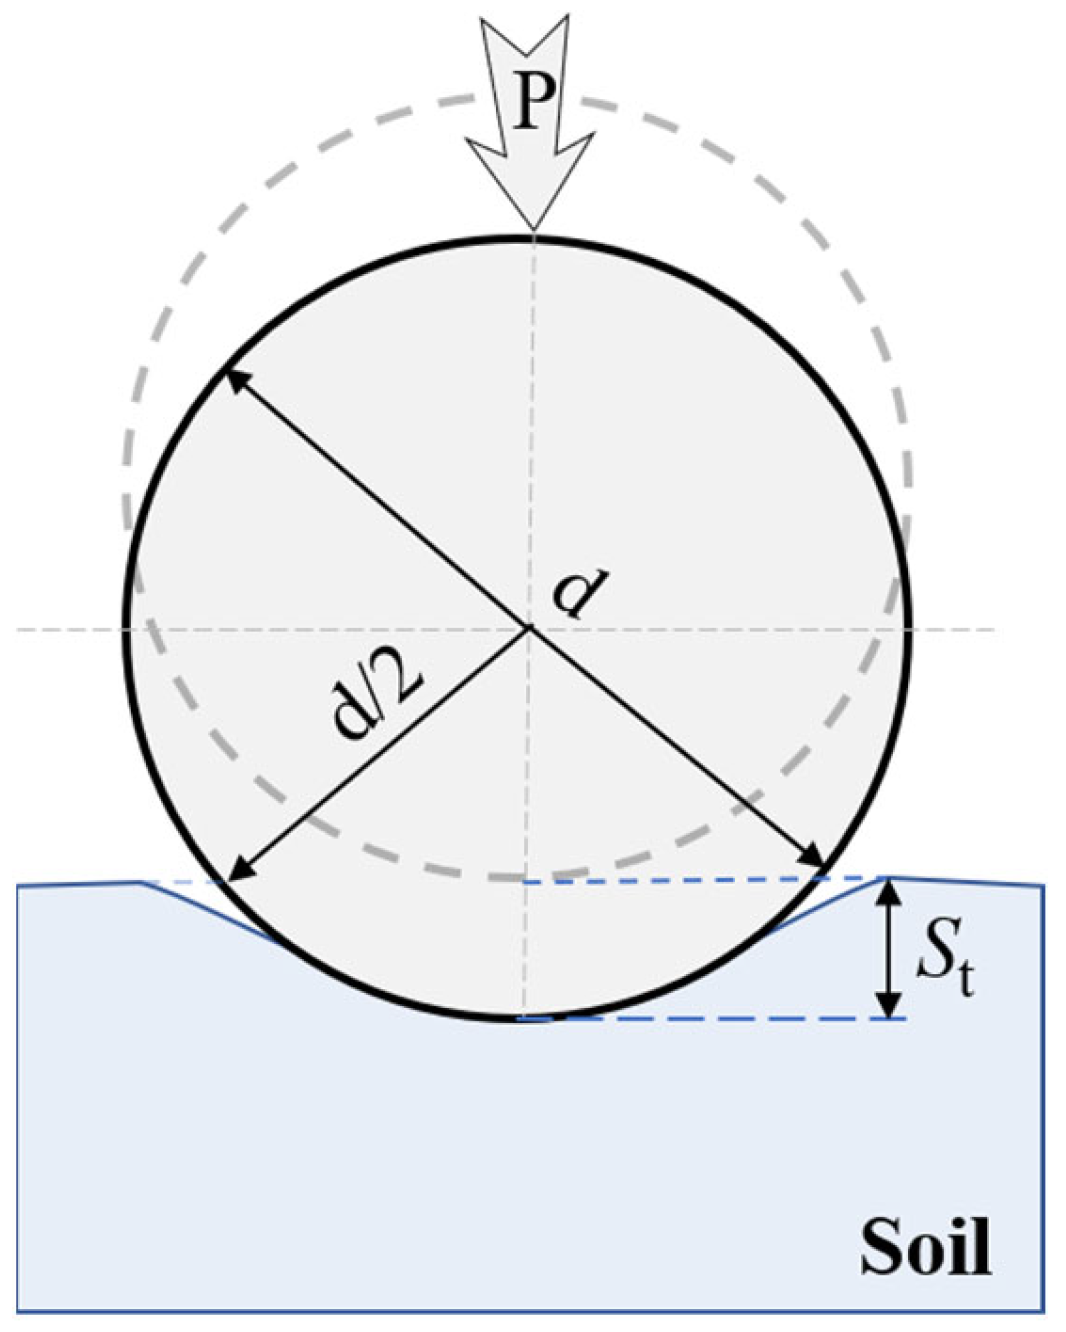
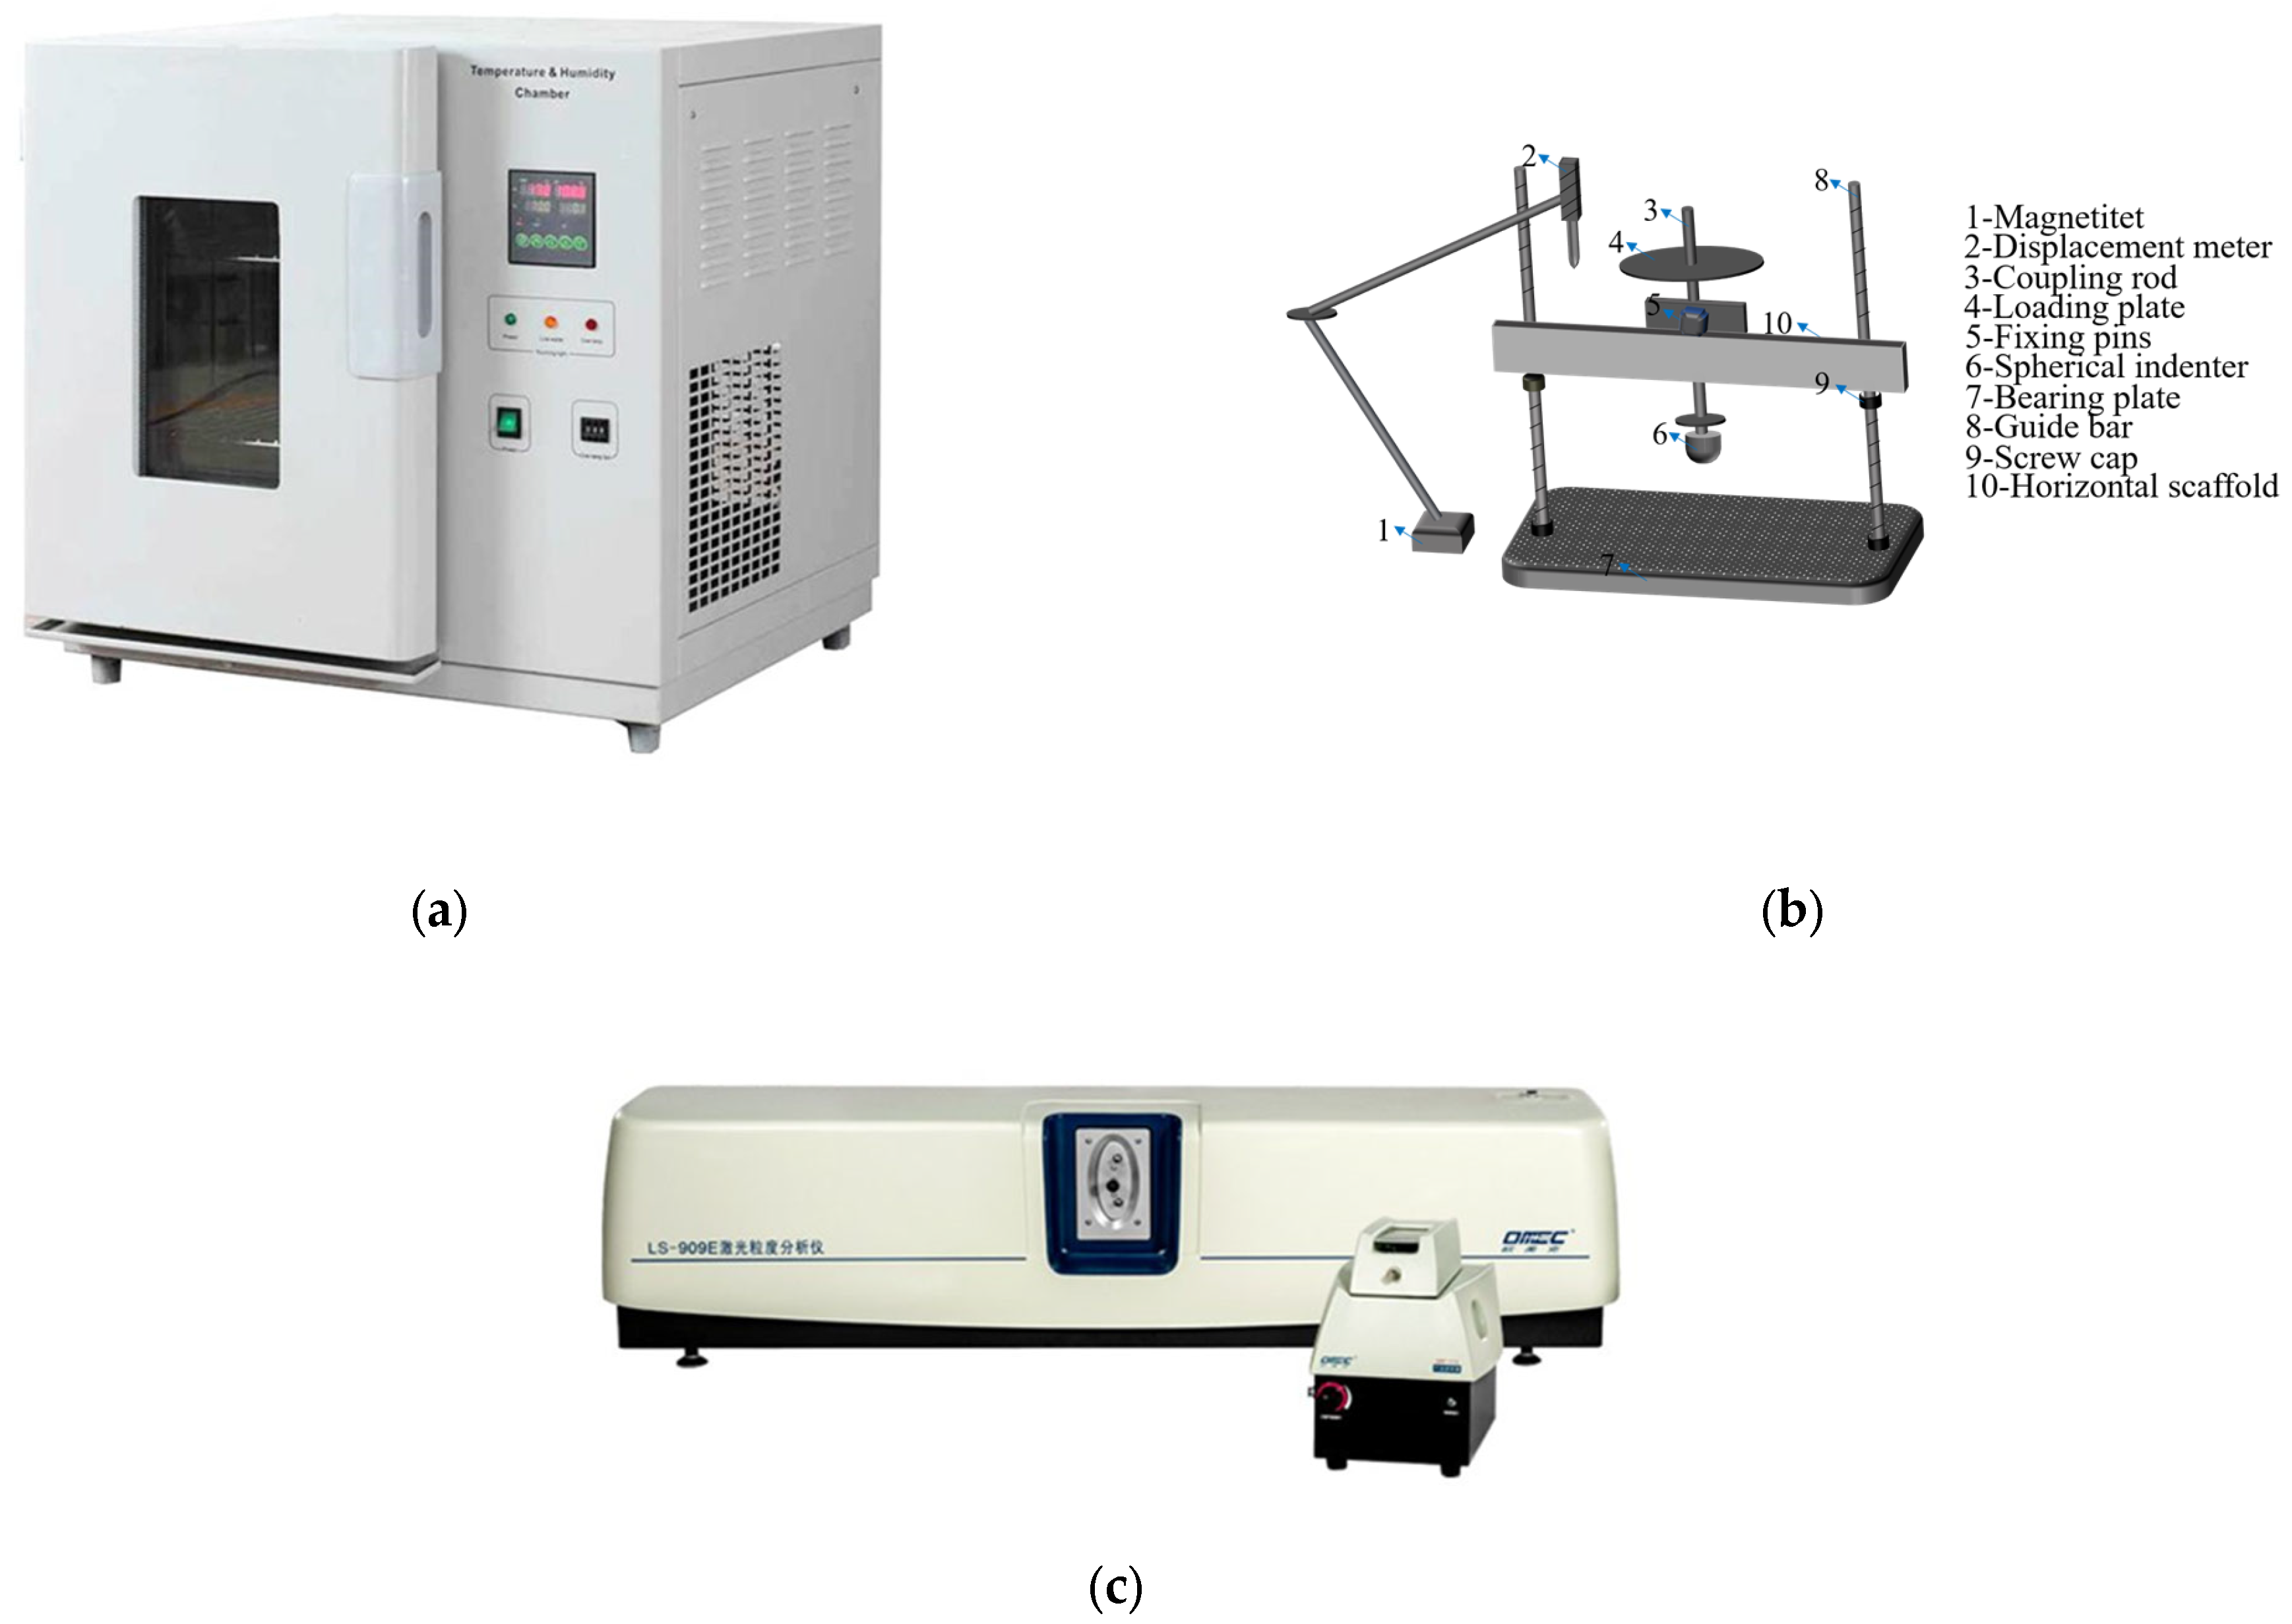
2.1. Spherical Template Indenter Press-In Test
The working principle of the spherical template indenter is similar to that of the Brinell hardness tester [17], which is based on the analysis method of the plasticity theory first proposed by Russian scientist Isherinsky.
Previous research results have proved that the shear strength of frozen soil consists of two parts; one is friction and the other is the cohesion between soil grains [18].
where is the shear strength of the soil, kPa; is the cohesion of the soil, kPa; is the normal stress in the shear plane, kPa; is the angle of internal friction of the soil, °; is the temperature, °C; is the water (ice) content; and is the time, s.
According to previous research, it has been found that the internal friction of silty soil is nearly zero under freezing conditions [19]. Then, the above equation was abbreviated as:
That is, in theory, when the shear strength of frozen loess was tested with a spherical template indenter, its shear strength was equivalent to the cohesive force . However, in practical operation, there may be other factors that affect it, resulting in the actual cohesive force value being greater than the shear strength . Therefore, according to the suggestion of Tsytovich, in order to accurately reflect the shear strength , the actual cohesive force value can be regarded as the equivalent cohesive force , and the equivalent cohesive force can be used as the strength index of frozen soil, which is expressed as [20]. If according to the derivation of the deformation equation of incomplete elastic and viscoplastic objects, the formula of cohesion can be expressed as Equation (3) [21,22]:
where is the equivalent cohesive force per unit area over time, MPa; is the vertical load acting on the spherical template indenter, N; is the correction factor, indicating the hardness ratio of the platen to the soil, which is taken as 0.18 for plastic materials; is the diameter of the spherical template indenter, mm, and this study selects = 22 mm for testing according to the recommendations given in the Russian national standard; and is the depth of the spherical template indenter pressed into the soil over time, mm.
The actual cohesion values measured in this study were all the equivalent cohesive force values . The process of pressing the spherical template indenter into the soil is shown in Figure 1, and according to the test, the law of the depth of pressing the spherical template indenter with time could be obtained, and then the equivalent cohesive force value of the frozen soil was calculated with Equation (3).
Figure 1.
The schematic diagram of spherical template indenter pressed into soil.
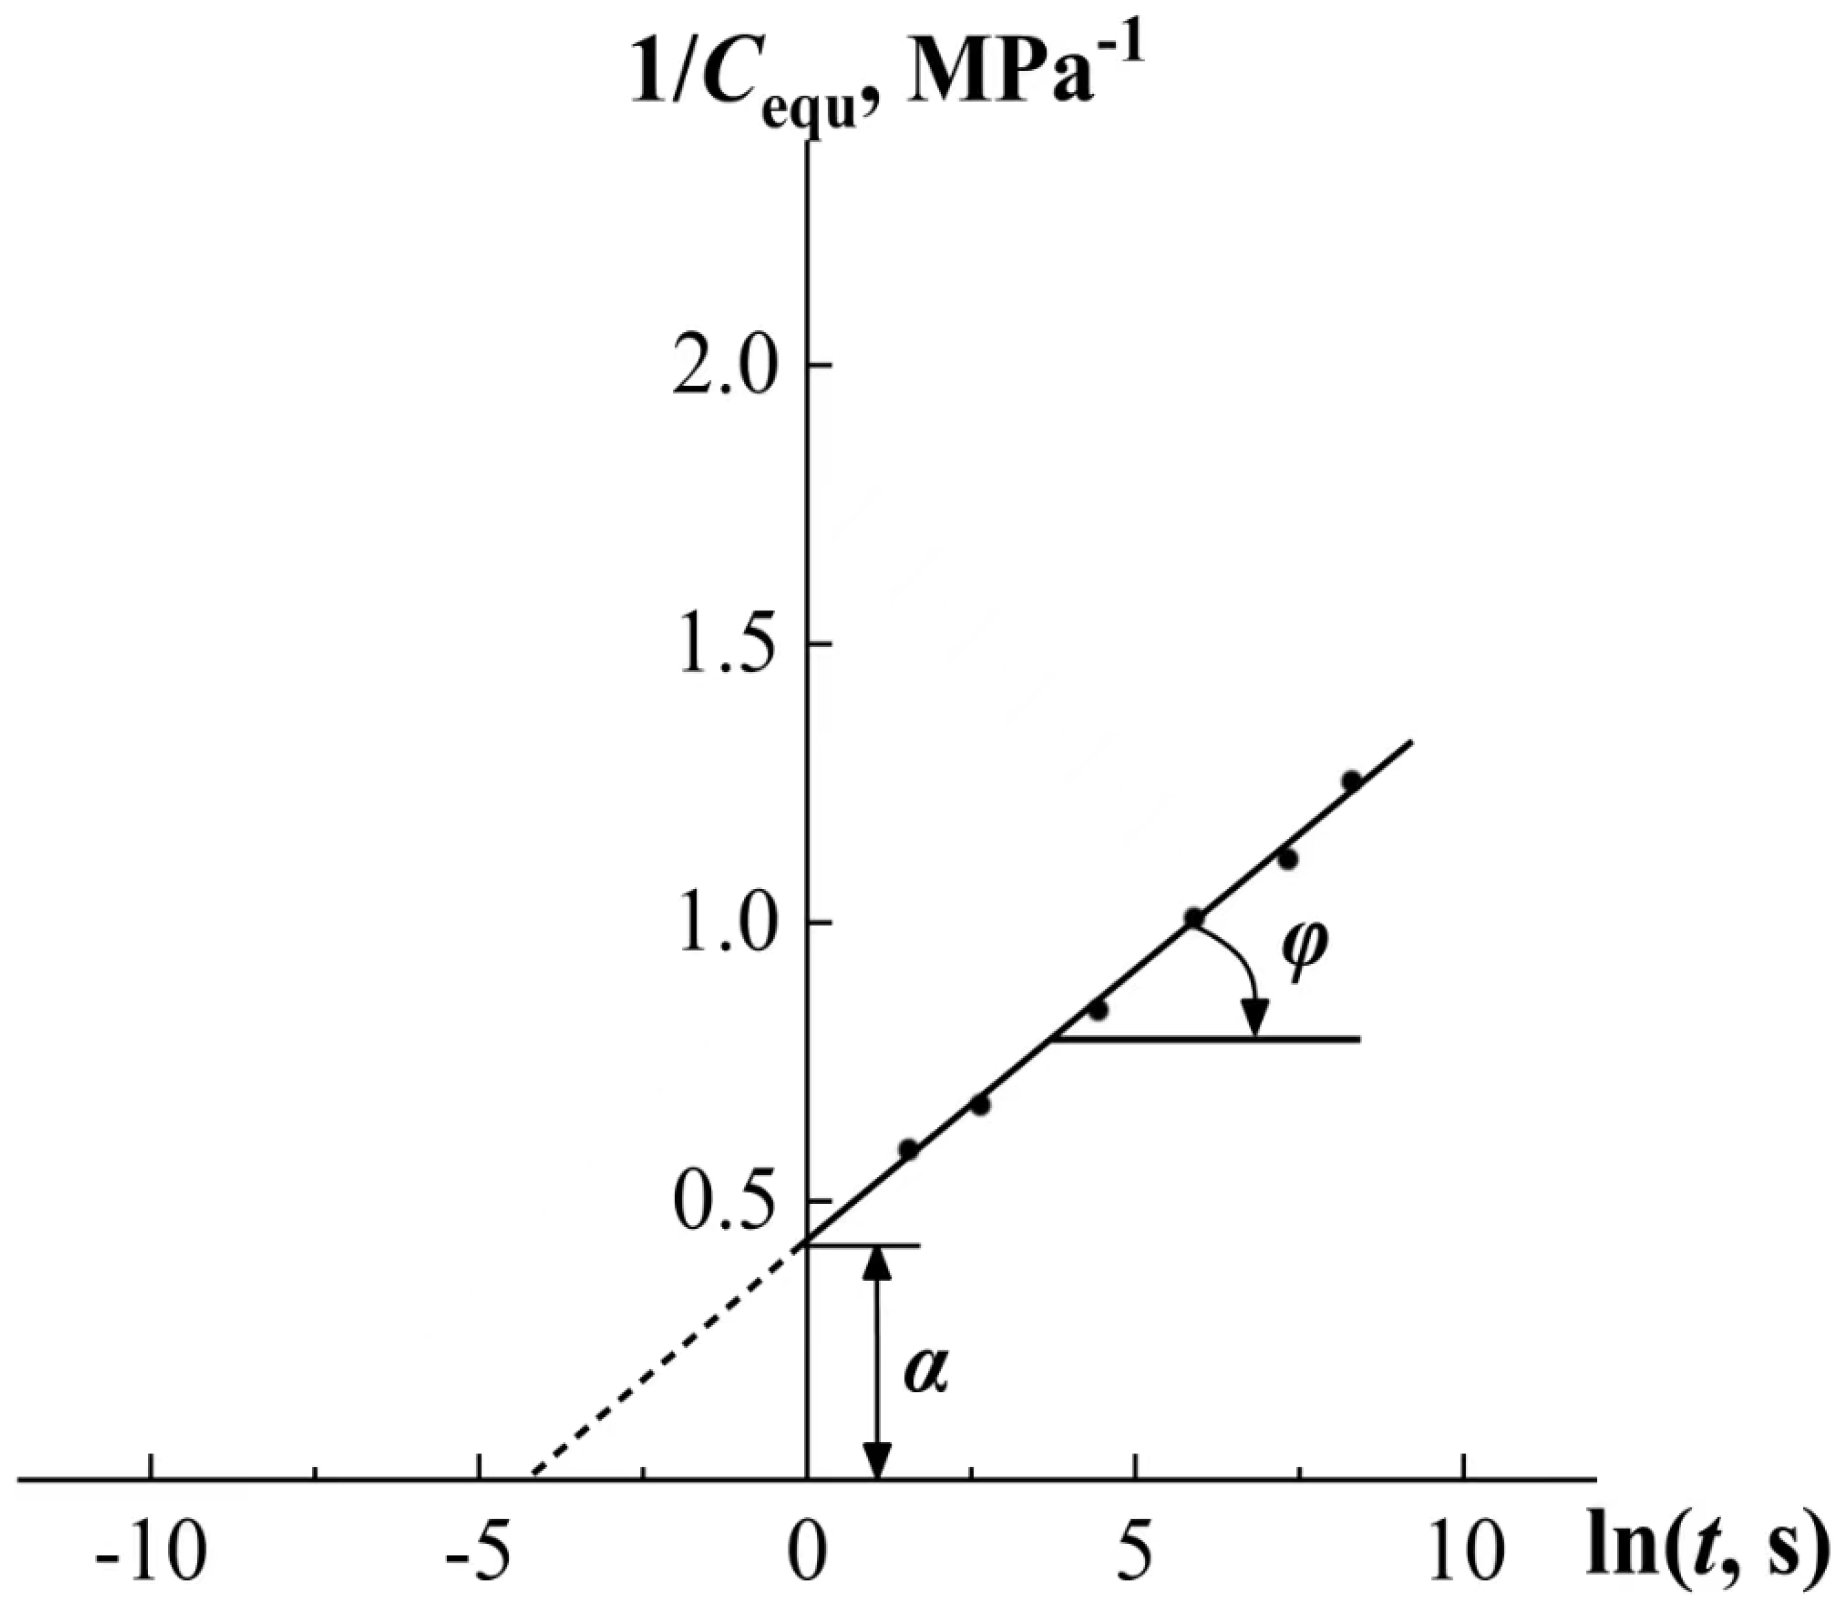
2.2. Vyalov Logarithmic Equation
Based on the long-term strength destructive equation and creep equation, Vyalov obtained the long-term strength prediction equation for isothermal conditions [9]:
where:
—the equivalent cohesive force, MPa;
—time of soil experience, s;
is a very small value of time, equal to the loading time corresponding to the instantaneous strength;
, are the parameters obtained from the experiment, ;
is the equivalent cohesive force of the soil when equals 0 s.
Taking the inverse of both sides of Equation (4) at the same time and turning it into a linear equation gives:
where , , , and ; then, Equation (5) could be rewritten as a linear equation like . Therefore, the parameters in Equation (4) could then be determined according to the slope of the line on the coordinate system and the intercept of the vertical coordinate for and , respectively. The schematic is shown in Figure 2.
Figure 2.
The schematic diagram (Vyalov) of test data arrangement of frozen soil.
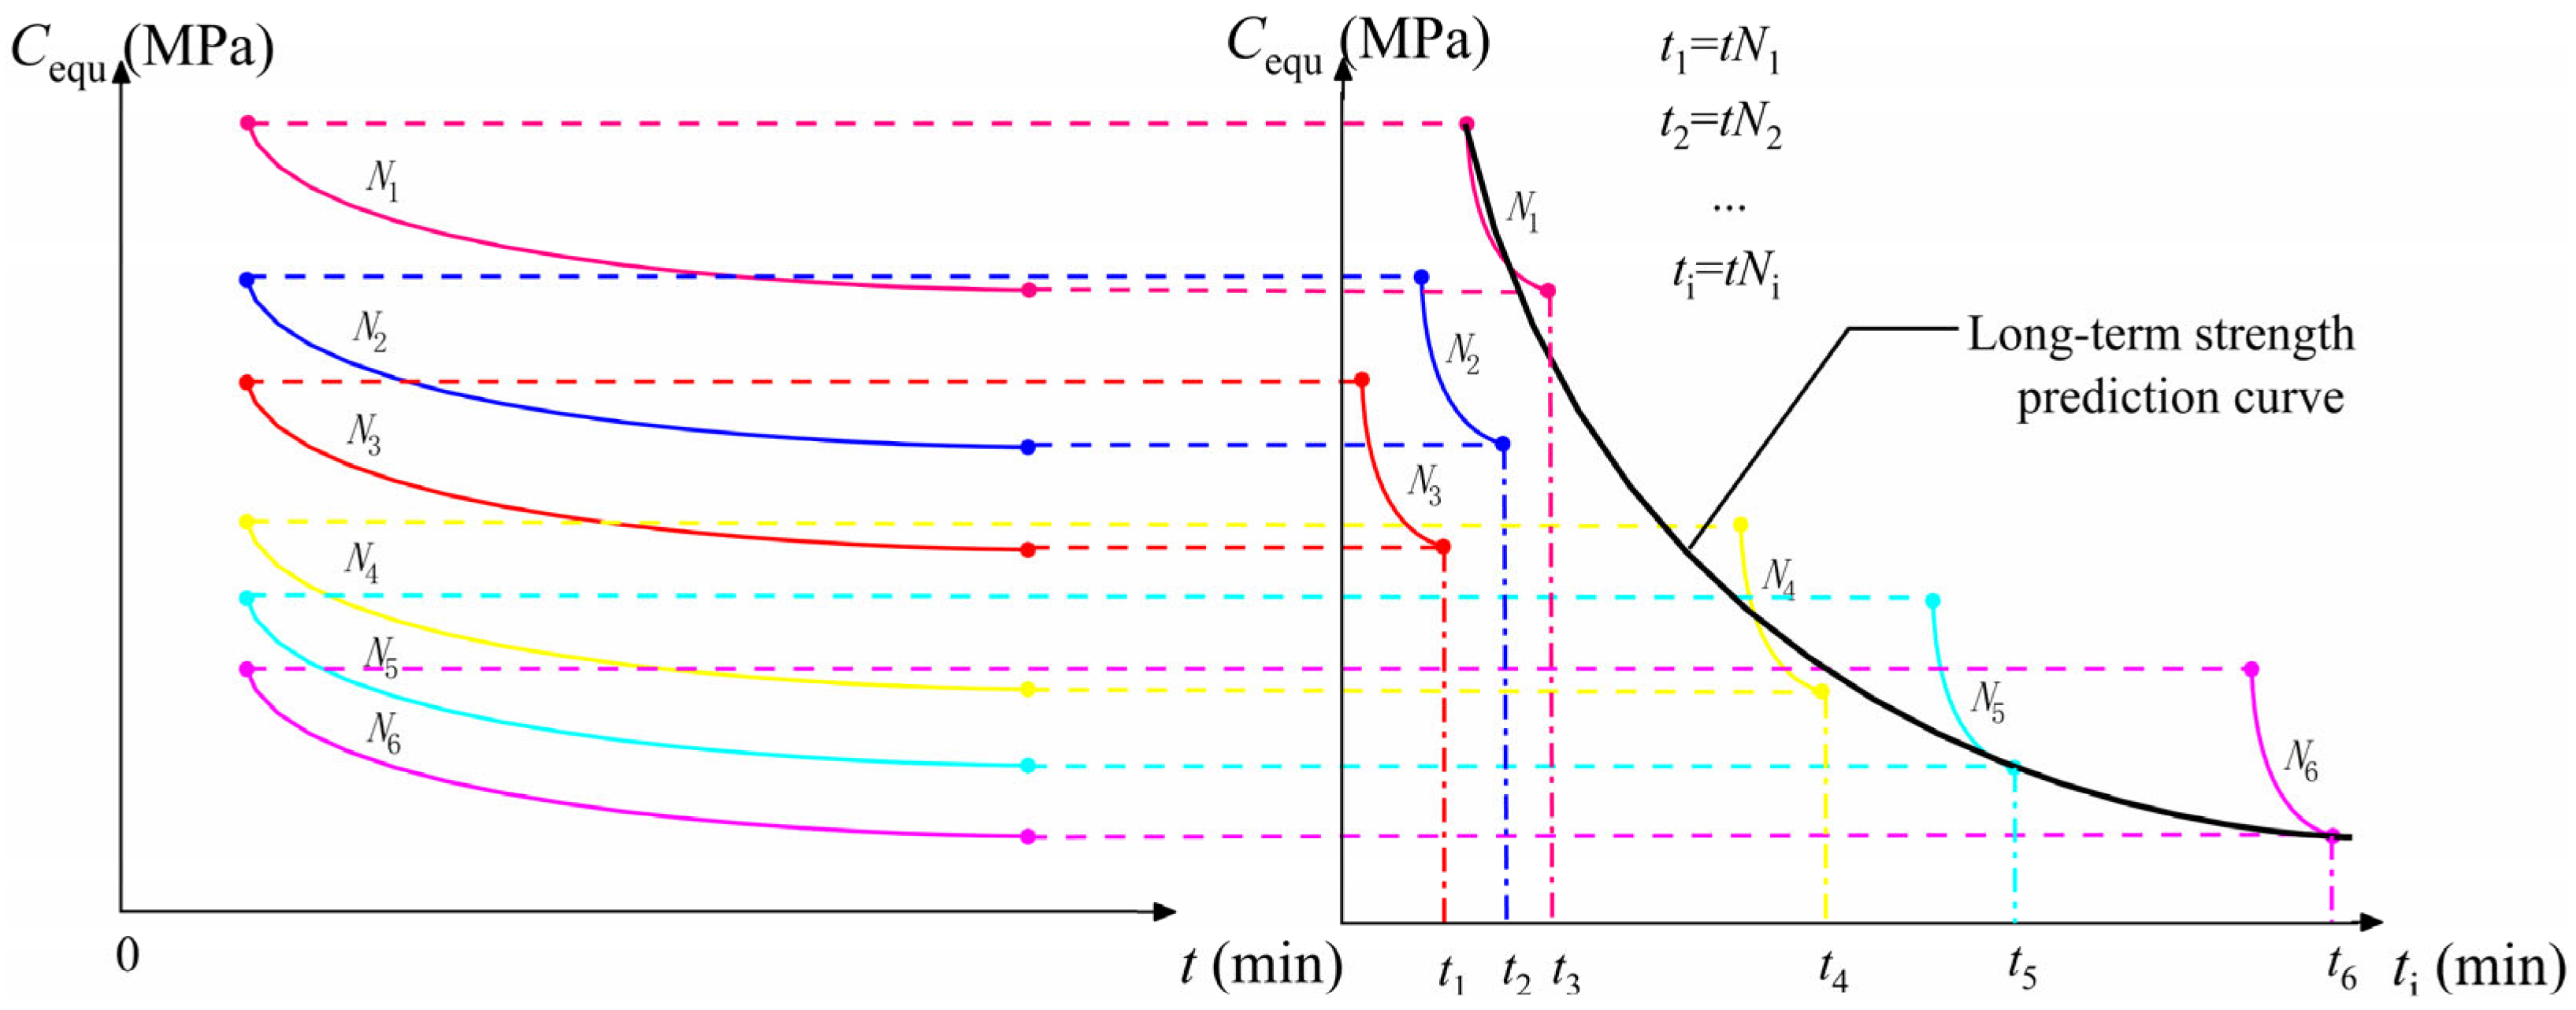
2.3. Freeze–Thaw Cycles–Time Analogy Method
The time analogy method serves as a means to establish a relationship between time and long-term strength, shedding light on the interplay between stress, strain, and time by considering the influential factors that govern the deformation process [12]. That is to say, the influence of these factors on stress and strain is similar to that of time and can be transformed into each other. During the test, the strain, when the parameter value is high (such as more freeze–thaw cycles or a higher negative temperature), can reach the same strain by prolonging the time, so these parameter values can be strengthened, and the deformation in the design service time of buildings can be predicted through the experimental data. A comprehensive explanation of the derivation process of the time analogy method can be found in the book Frozen Soil Mechanics [12], where frozen peat soil is employed as an illustrative example to demonstrate the applicability and effectiveness of the time analogy method in determining the strength of frozen soil.
In this study, the number of freeze–thaw cycles was taken as an important influencing factor, and the number of freeze–thaw cycles was converted into the time to experience the freeze–thaw, i.e., T (Times)—t (time). The conversion formula is shown in Equation (6). The normalized long-term strength equation could be obtained by normalizing the curve, which could be used to predict the long-term strength of frozen soil. Figure 3 shows the schematic diagram of the freeze–thaw cycles–time analogy method.
where t is the loading time required for deformation stability of the soil sample, Ni is the number of freeze–thaw cycles, and ti is the physical time after the conversion of the ith freezing and thawing times.
Figure 3.
The schematic diagram of freeze–thaw cycles–time analogy method.
2.4. Evaluation Indicators of Forecast Results
To evaluate the validity of the long-term intensity forecast equation, PRECISION and root mean square error (RMSE) were used to define the error of each forecast curve with respect to the measured curve [23].
where Ti, Pi are the measured and predicted values of the ith validation sample; n is the number of samples.
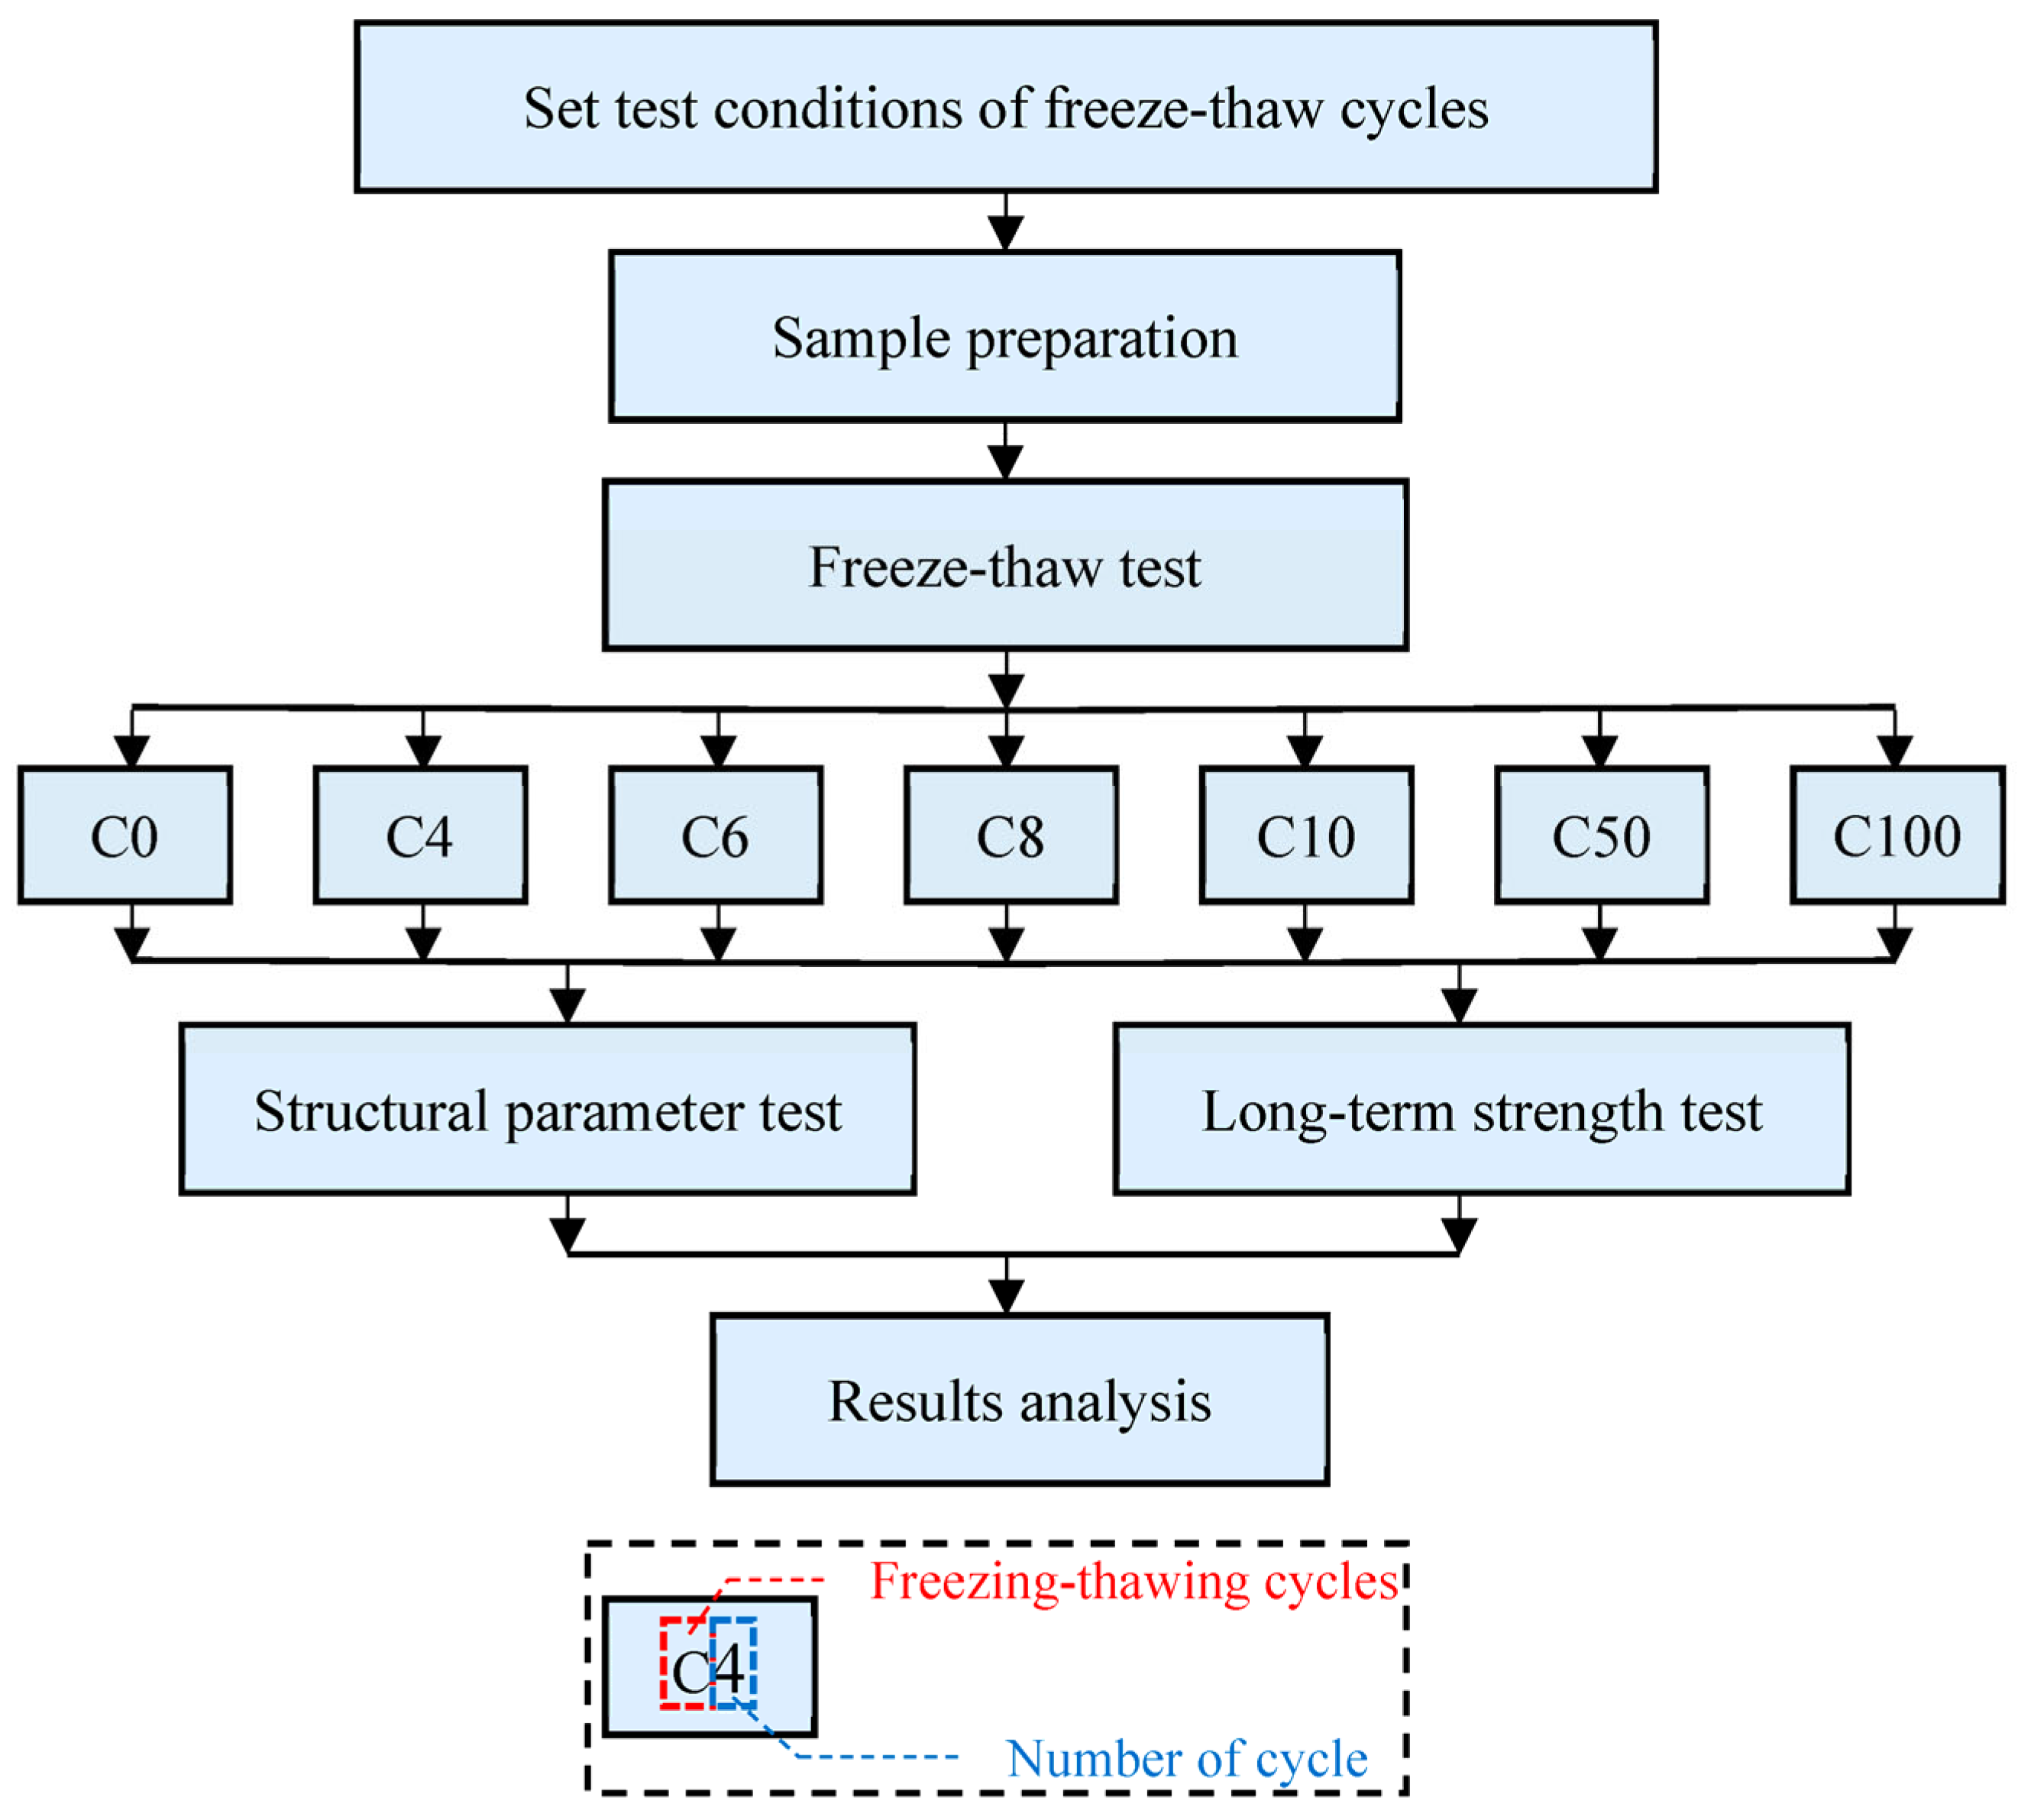
3. Sample Preparation and Testing
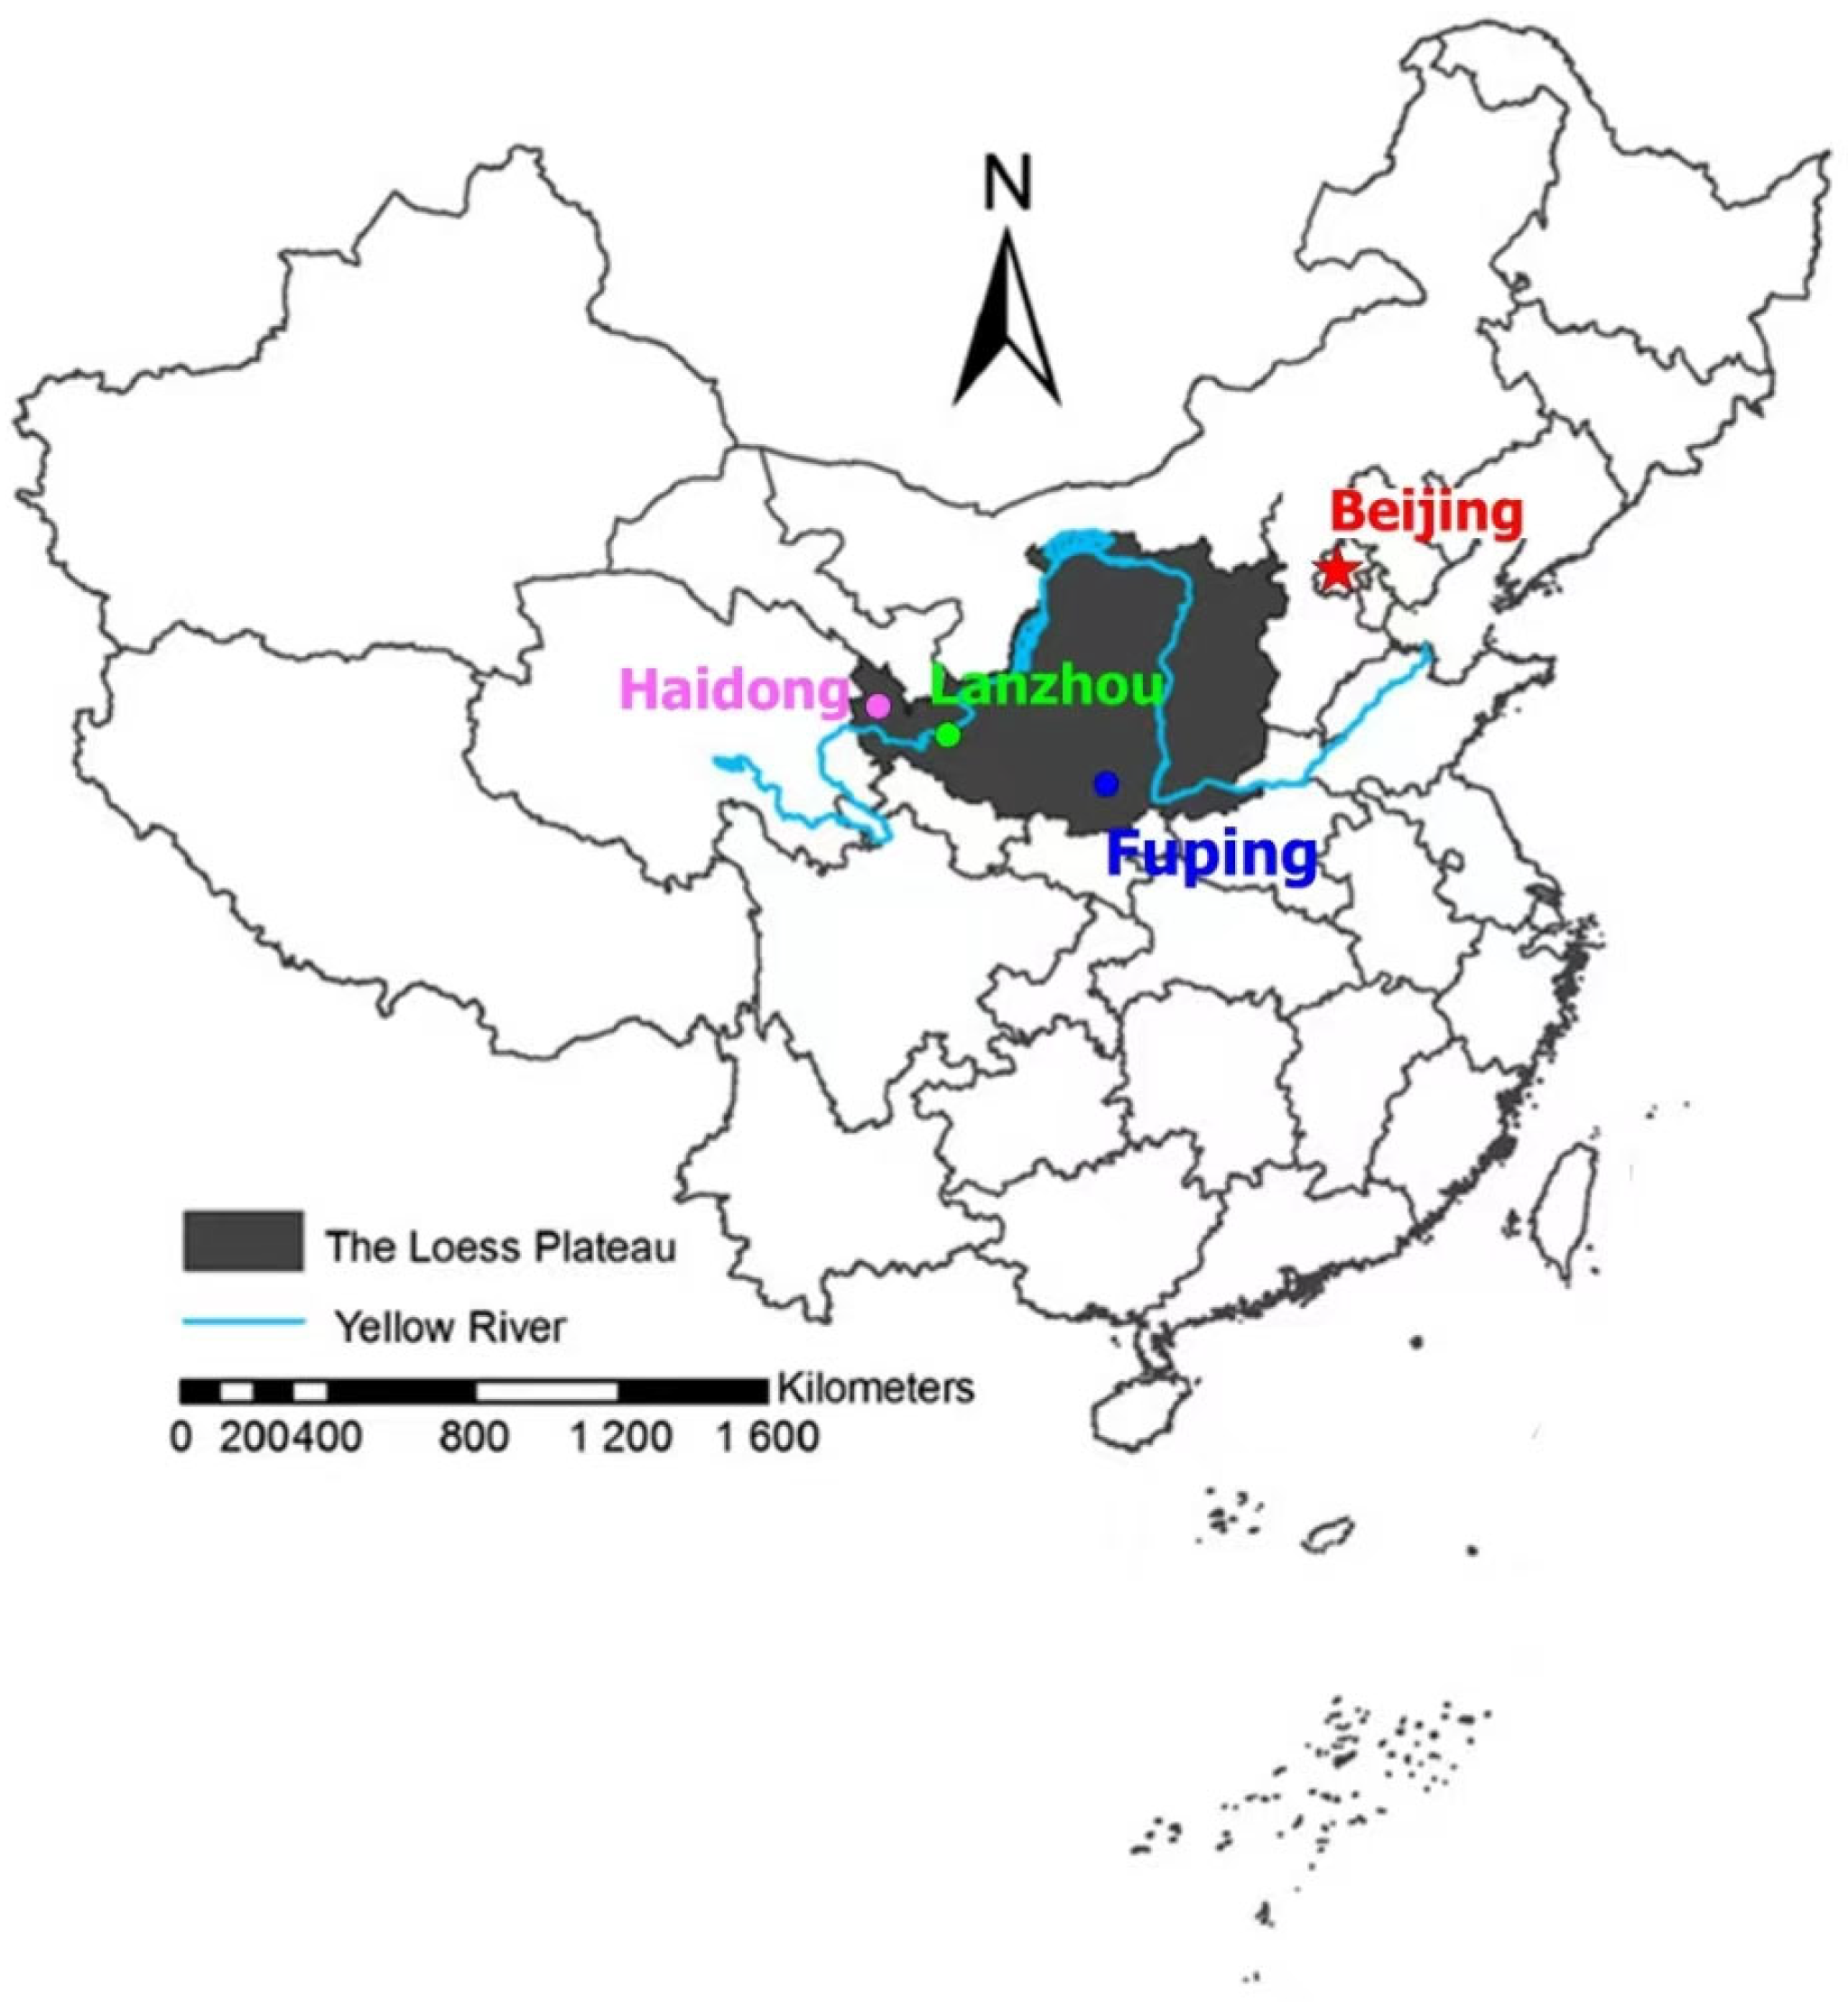
3.1. Soil Sample Preparation
Lanzhou loess, Haidong loess, and Fuping loess were selected for the experiment. The sampling location is shown in Figure 4. The preparation of soil samples met the standard preparation requirements. The air-dried soil samples were crushed and passed through a 2 mm sieve. Then, distilled water was sprayed evenly on the soil samples, they were mixed thoroughly and sealed with cling film, and they were left for 24 h to make the moisture content uniform. The soil samples were configured according to the parameters in Table 1.
Figure 4.
Test soil area map.
Table 1.
Basic physical properties of loess.
3.2. Test Method
The experimental design is shown in Figure 5 below. The soil samples were all water-saturated. During the freeze–thaw cycle, the soil samples were in a closed system and did not drain or replenish water. The prepared samples were placed into the freeze–thaw test device for 0, 4, 6, 8, 10, 50, and 100 freeze–thaw cycles. Before the test, repeated freezing and thawing tests were carried out on a single sample at the set freezing and thawing temperatures. It was found that when the temperature was set to ±20 °C and the freezing and thawing time was set to 2 h, the sample could be fully frozen and thawed. Therefore, the test freezing environment temperature was set to −20 °C, the thawing environment temperature was set to 20 °C, and the freezing and thawing time of the sample was set to 2 h. Three parallel samples were taken from each type of soil and subjected to spherical template indenter press-in tests and grain size determinations under the same conditions. The test devices are shown in Figure 6.
Figure 5.
The freeze–thaw cycle structure diagram.
Figure 6.
Test devices. (a) The freeze–thaw test device ZLHS-408-LS (Zhulan, Shanghai, China. (b) The spherical template indenter. (c) The laser grain size analyzer LS-909 (OMEC, Zhuhai, China).
4. Results
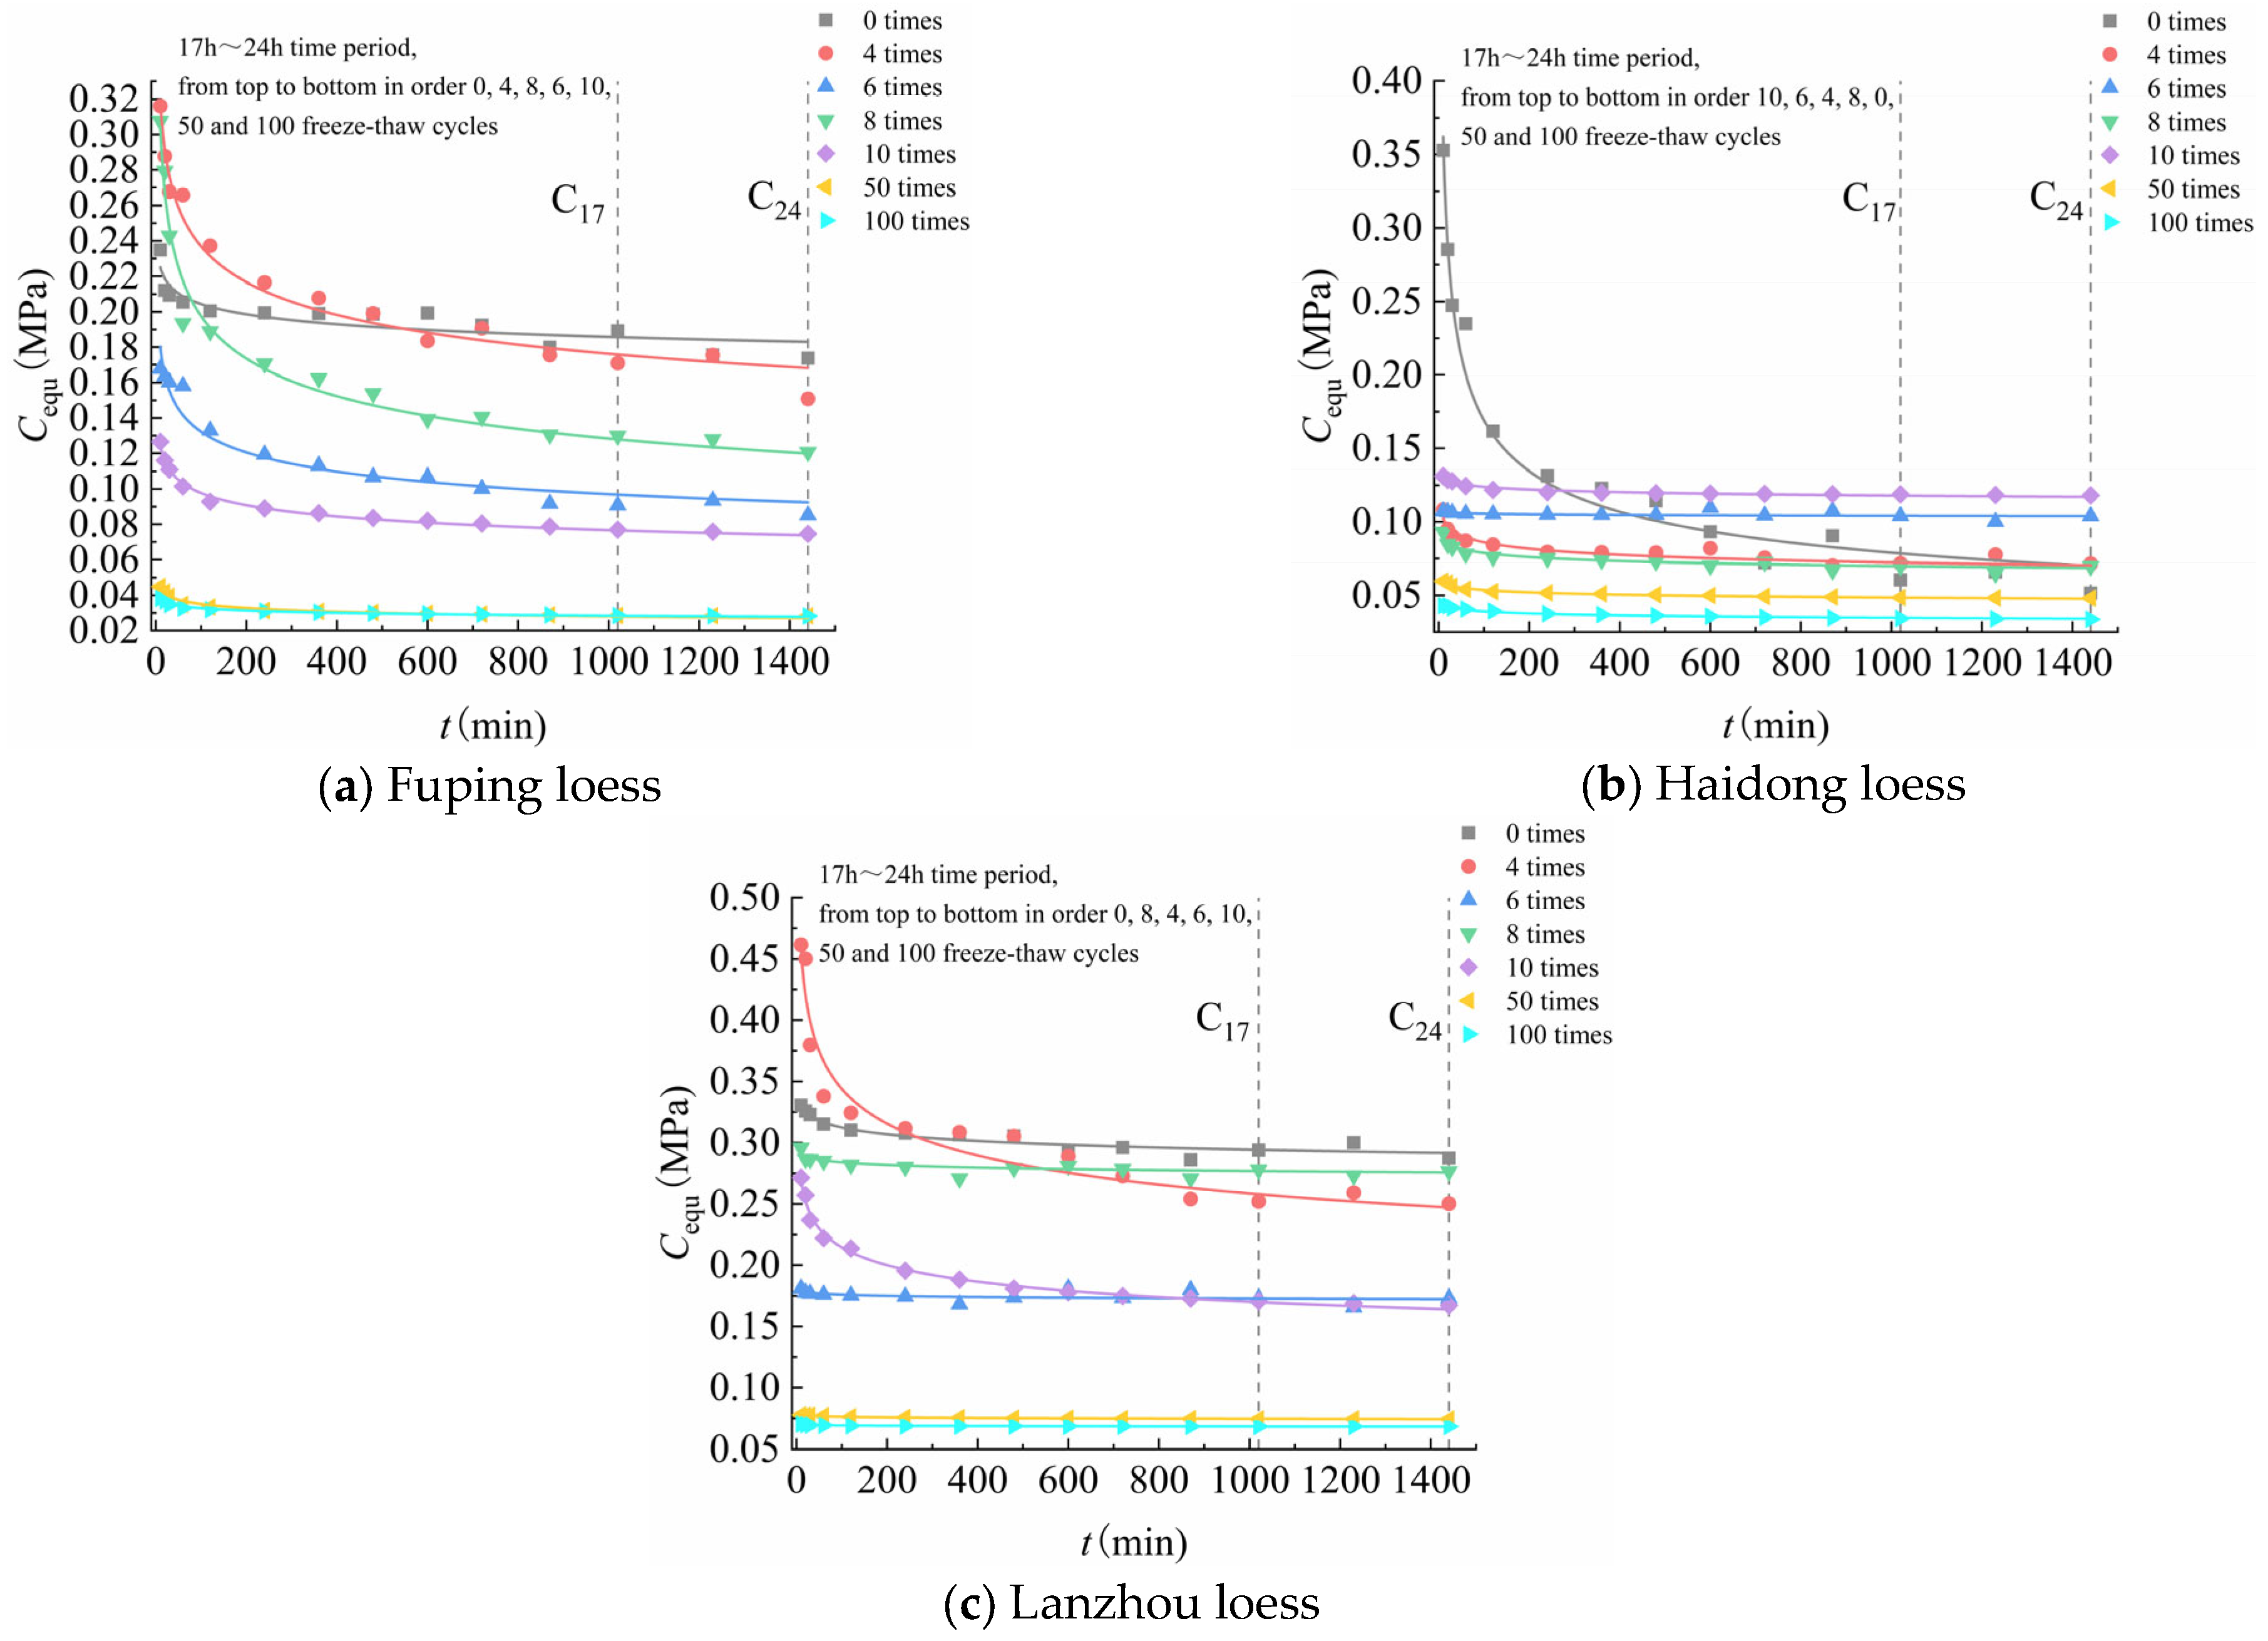
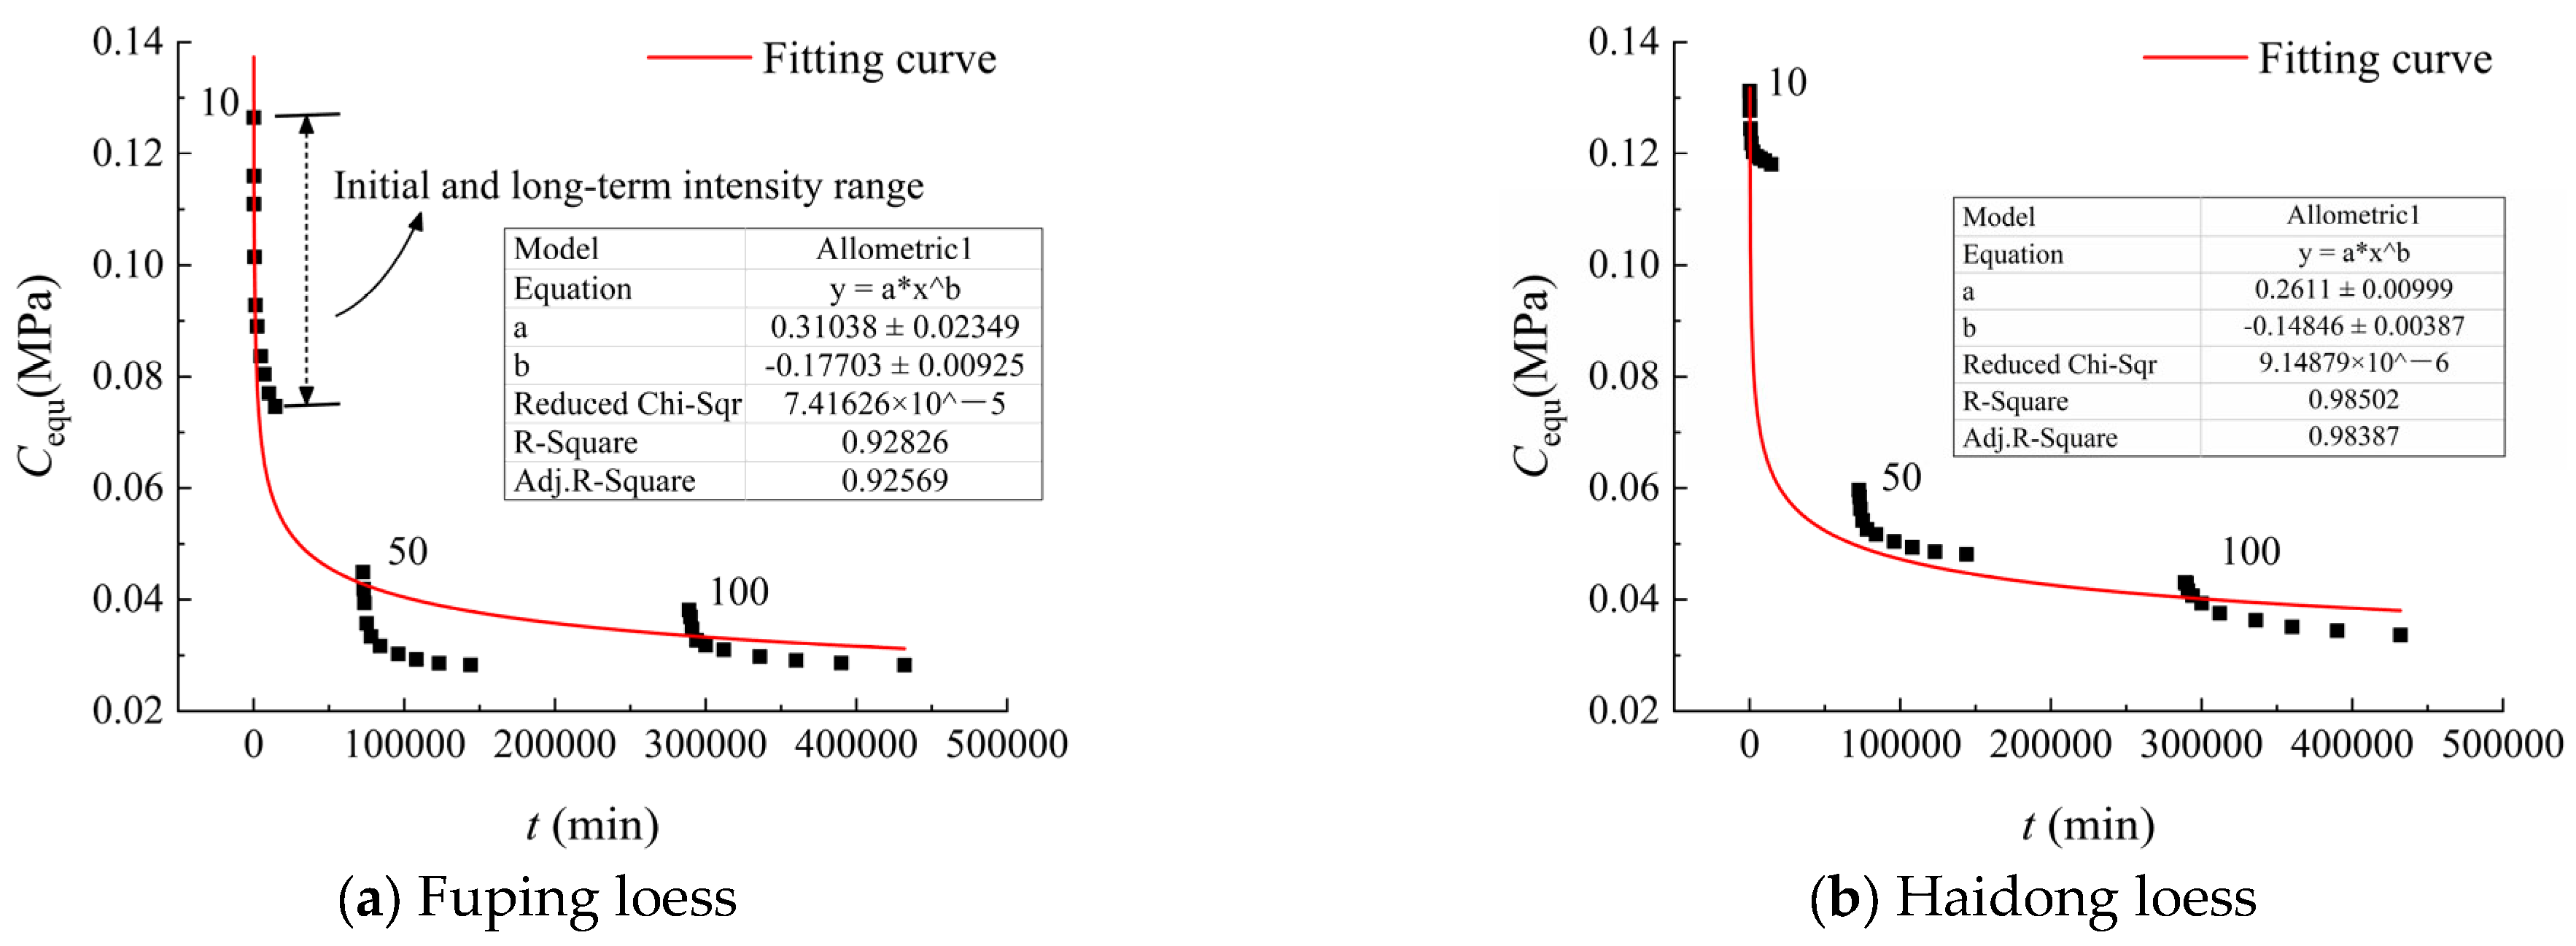
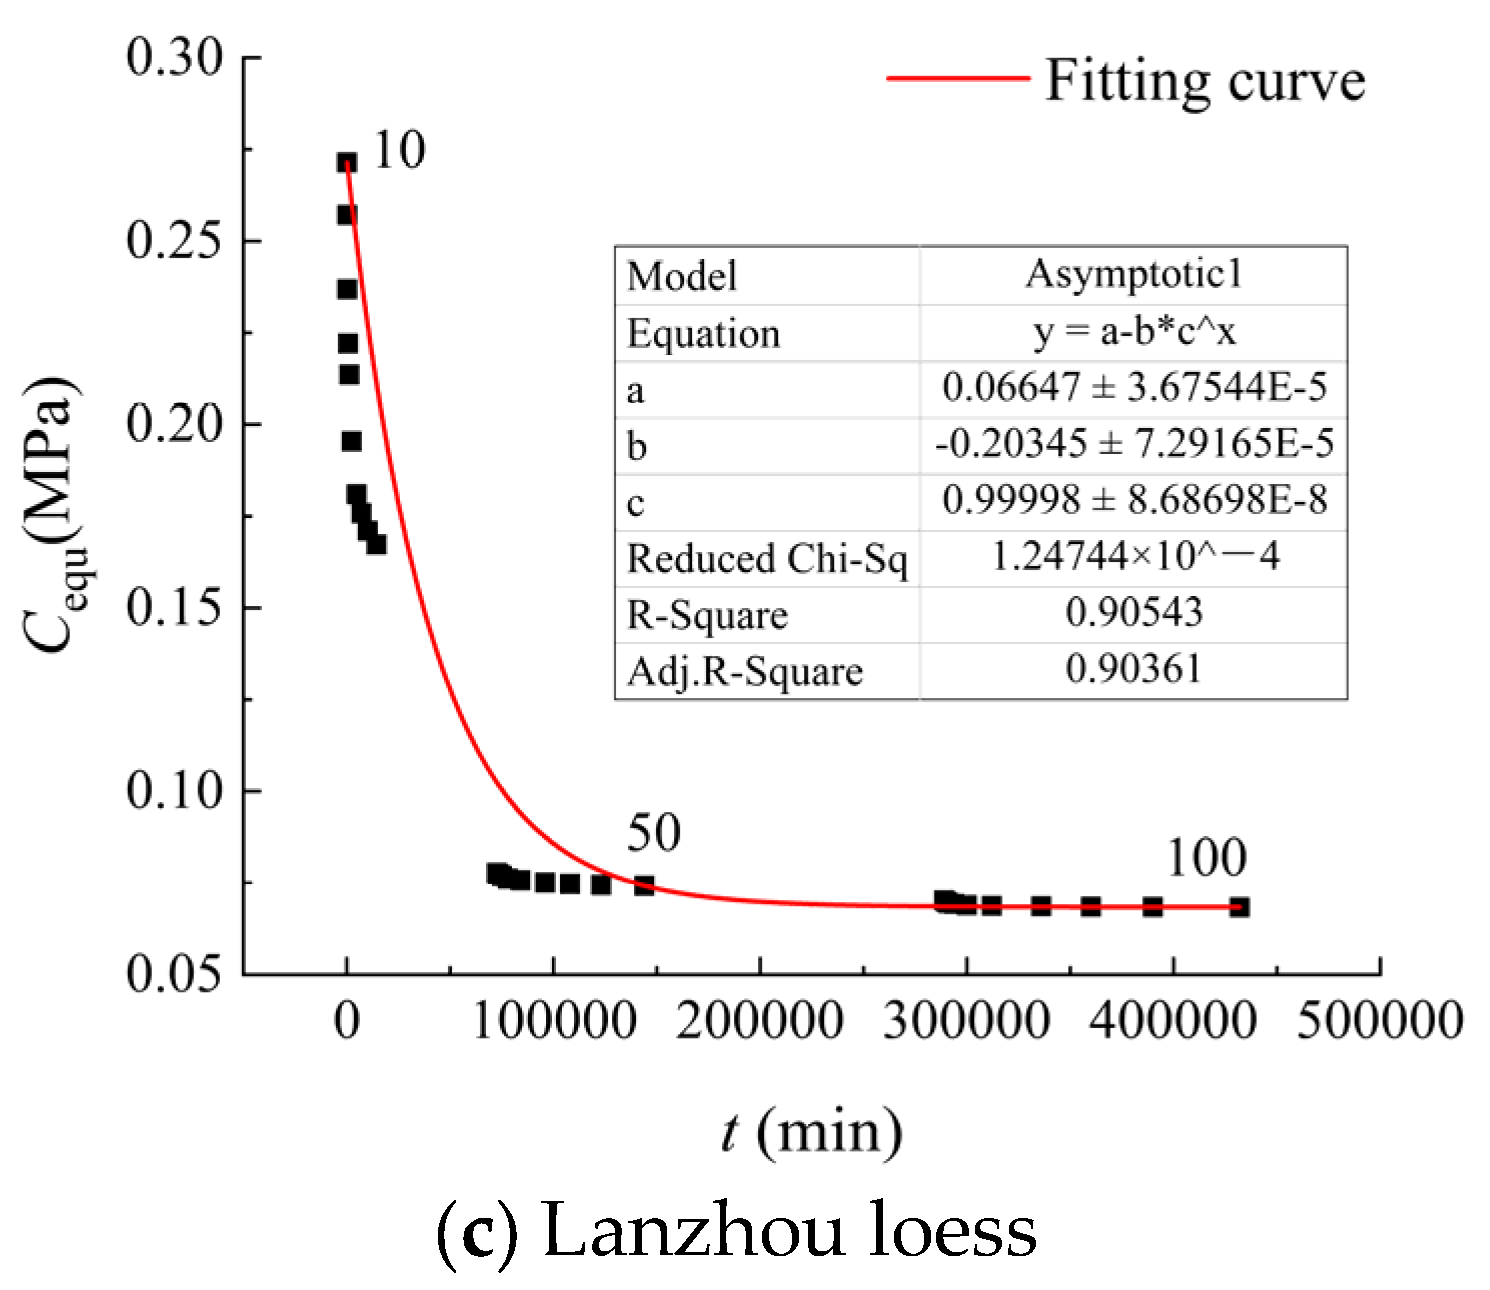
4.1. Equivalent Cohesion Test Results
The test results after 0, 4, 6, 8, 10, 50, and 100 freeze–thaw cycles are presented in Figure 7, where C represents the equivalent cohesive force and the subsequent numbers indicate the press-in time. For example, C24 represents the equivalent cohesion of a spherical template indenter after 24 h of pressing into the soil. The equivalent cohesion decreased with increasing time, while the pressing depth of the spherical template indenter increased. This phenomenon is indicative of the rheological behavior of frozen soil. As the spherical indenter sunk deeper into the soil, the stress gradually decreased, thereby promoting the stability of deformation. From Figure 7, it is observed that the rate of cohesion reduction for the three types of loess was initially high and then gradually stabilized within the time period of 17 h to 24 h. The cohesion observed during this period represents the long-term strength of the loess.
Figure 7.
Changes in equivalent cohesive force (Cequ) of frozen loess during freeze–thaw cycles.
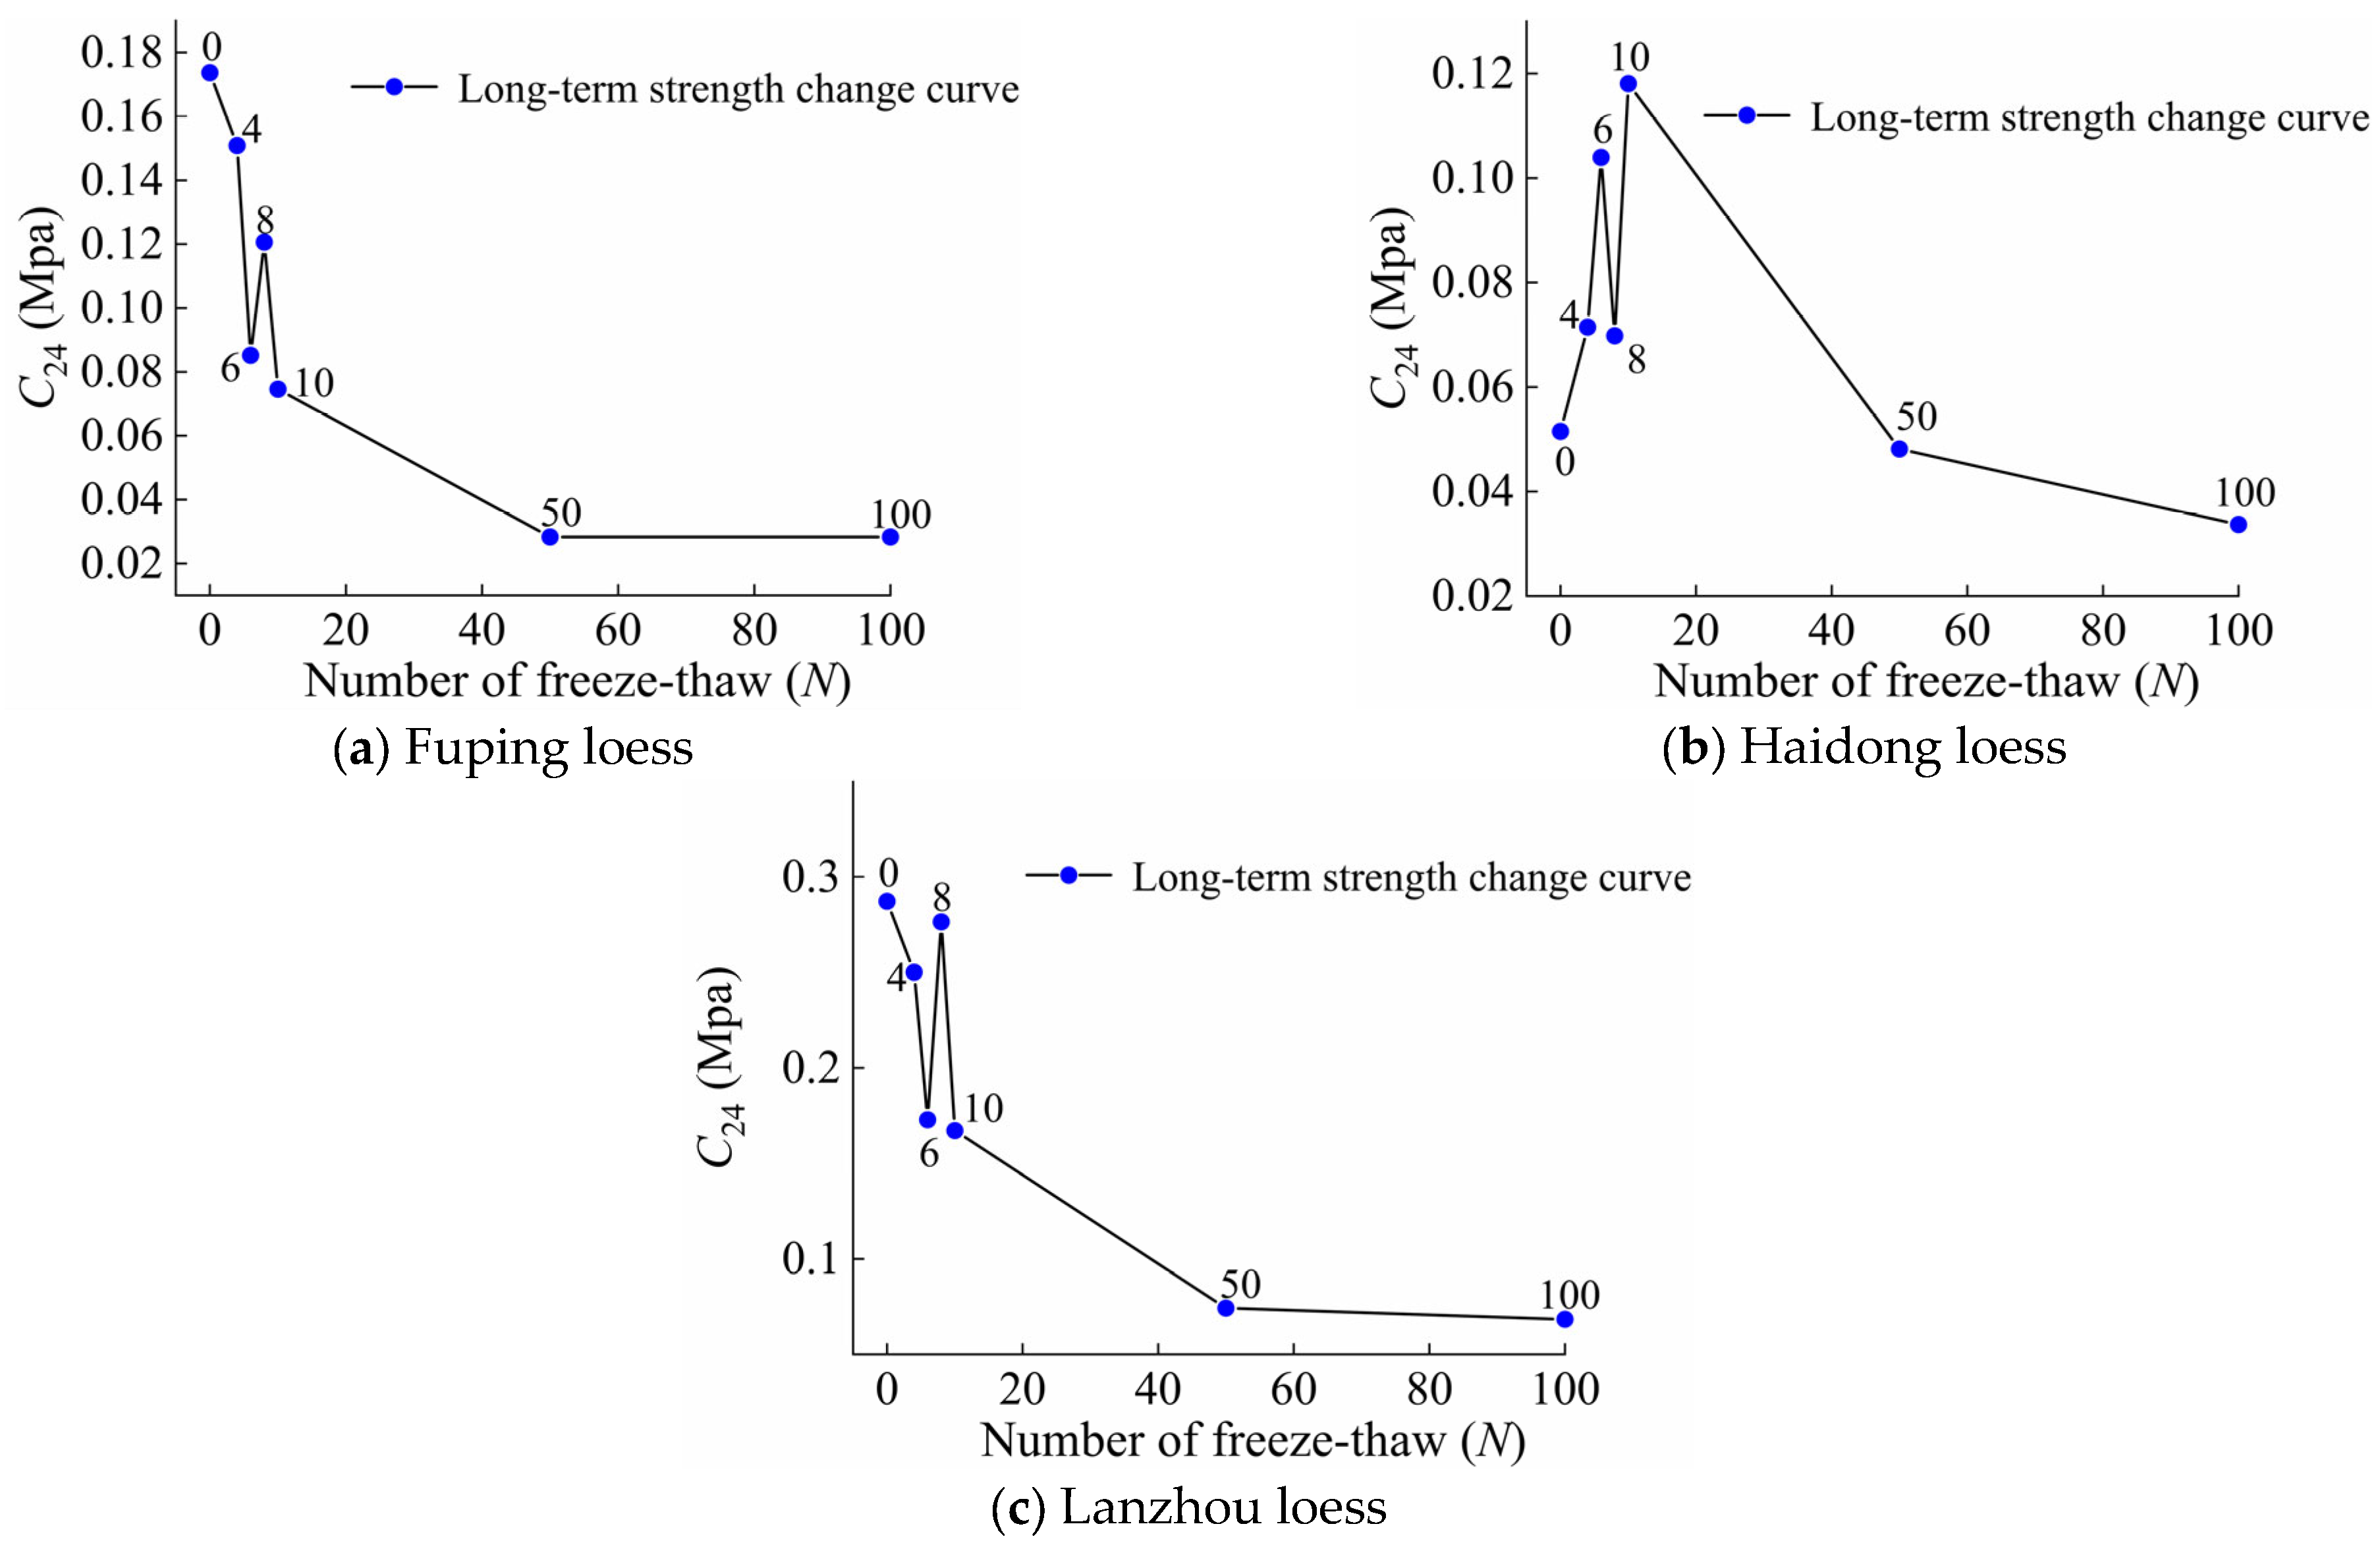
4.2. Long-Term Strength Change Rules
Figure 8 shows the long-term strength of frozen loess measured at 24 h (1440 min) after different freeze–thaw cycles. Long-term strength is a comprehensive characterization of the internal structure, mineral composition, and physical properties of frozen soil. This study observed that under repeated freezing and thawing, the long-term strength exhibited an unstable pattern during the first 10 cycles, characterized by a damping shape change. In the first 10 freeze–thaw cycles, the long-term strength of Fuping loess and Lanzhou loess was the maximum under natural sample conditions, 0.17 Mpa and 0.29 Mpa, respectively, and both reached the minimum after 10 freeze–thaw cycles, 0.07 Mpa and 0.17 Mpa, respectively. However, the long-term strength of Haidong loess was the minimum under natural sample conditions, 0.05 Mpa, and the maximum after 10 freeze–thaw cycles, 0.12 Mpa. Beyond 10 cycles, the long-term strength gradually declined and approached stability, indicating that the soil properties began to reach an equilibrium state.
Figure 8.
Changes in the long-term strength of frozen loess during freeze–thaw cycles.
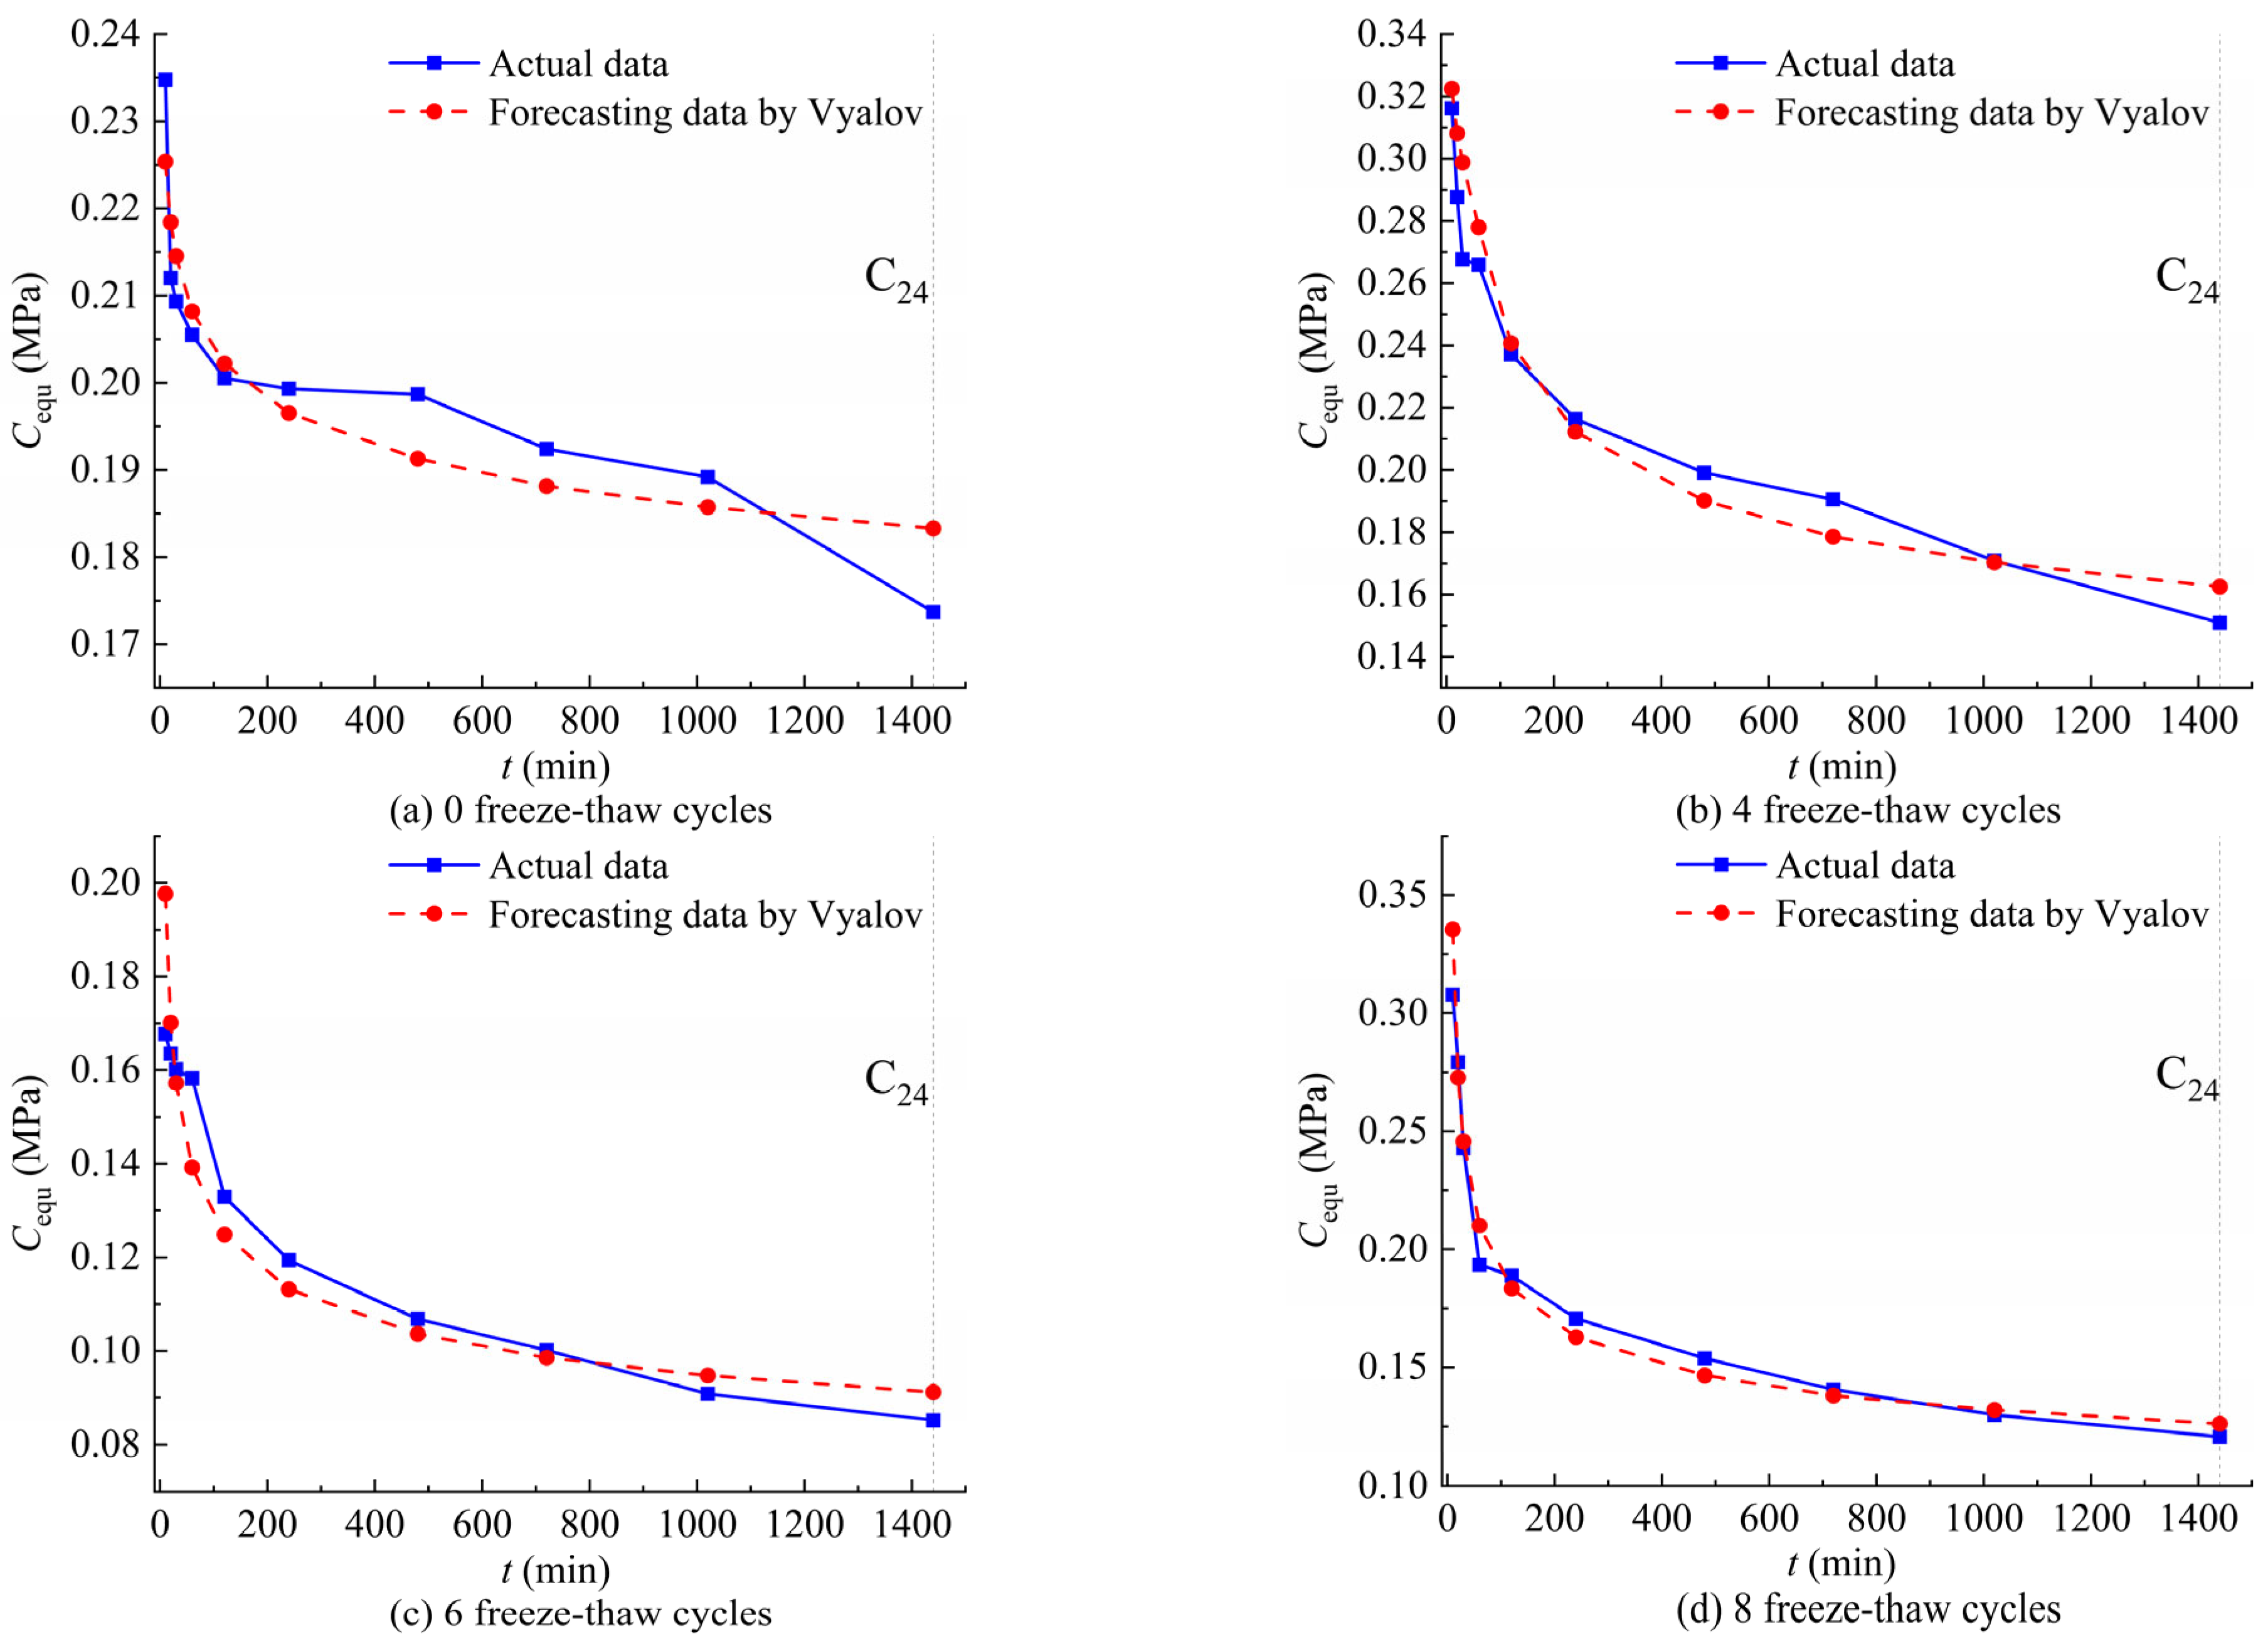
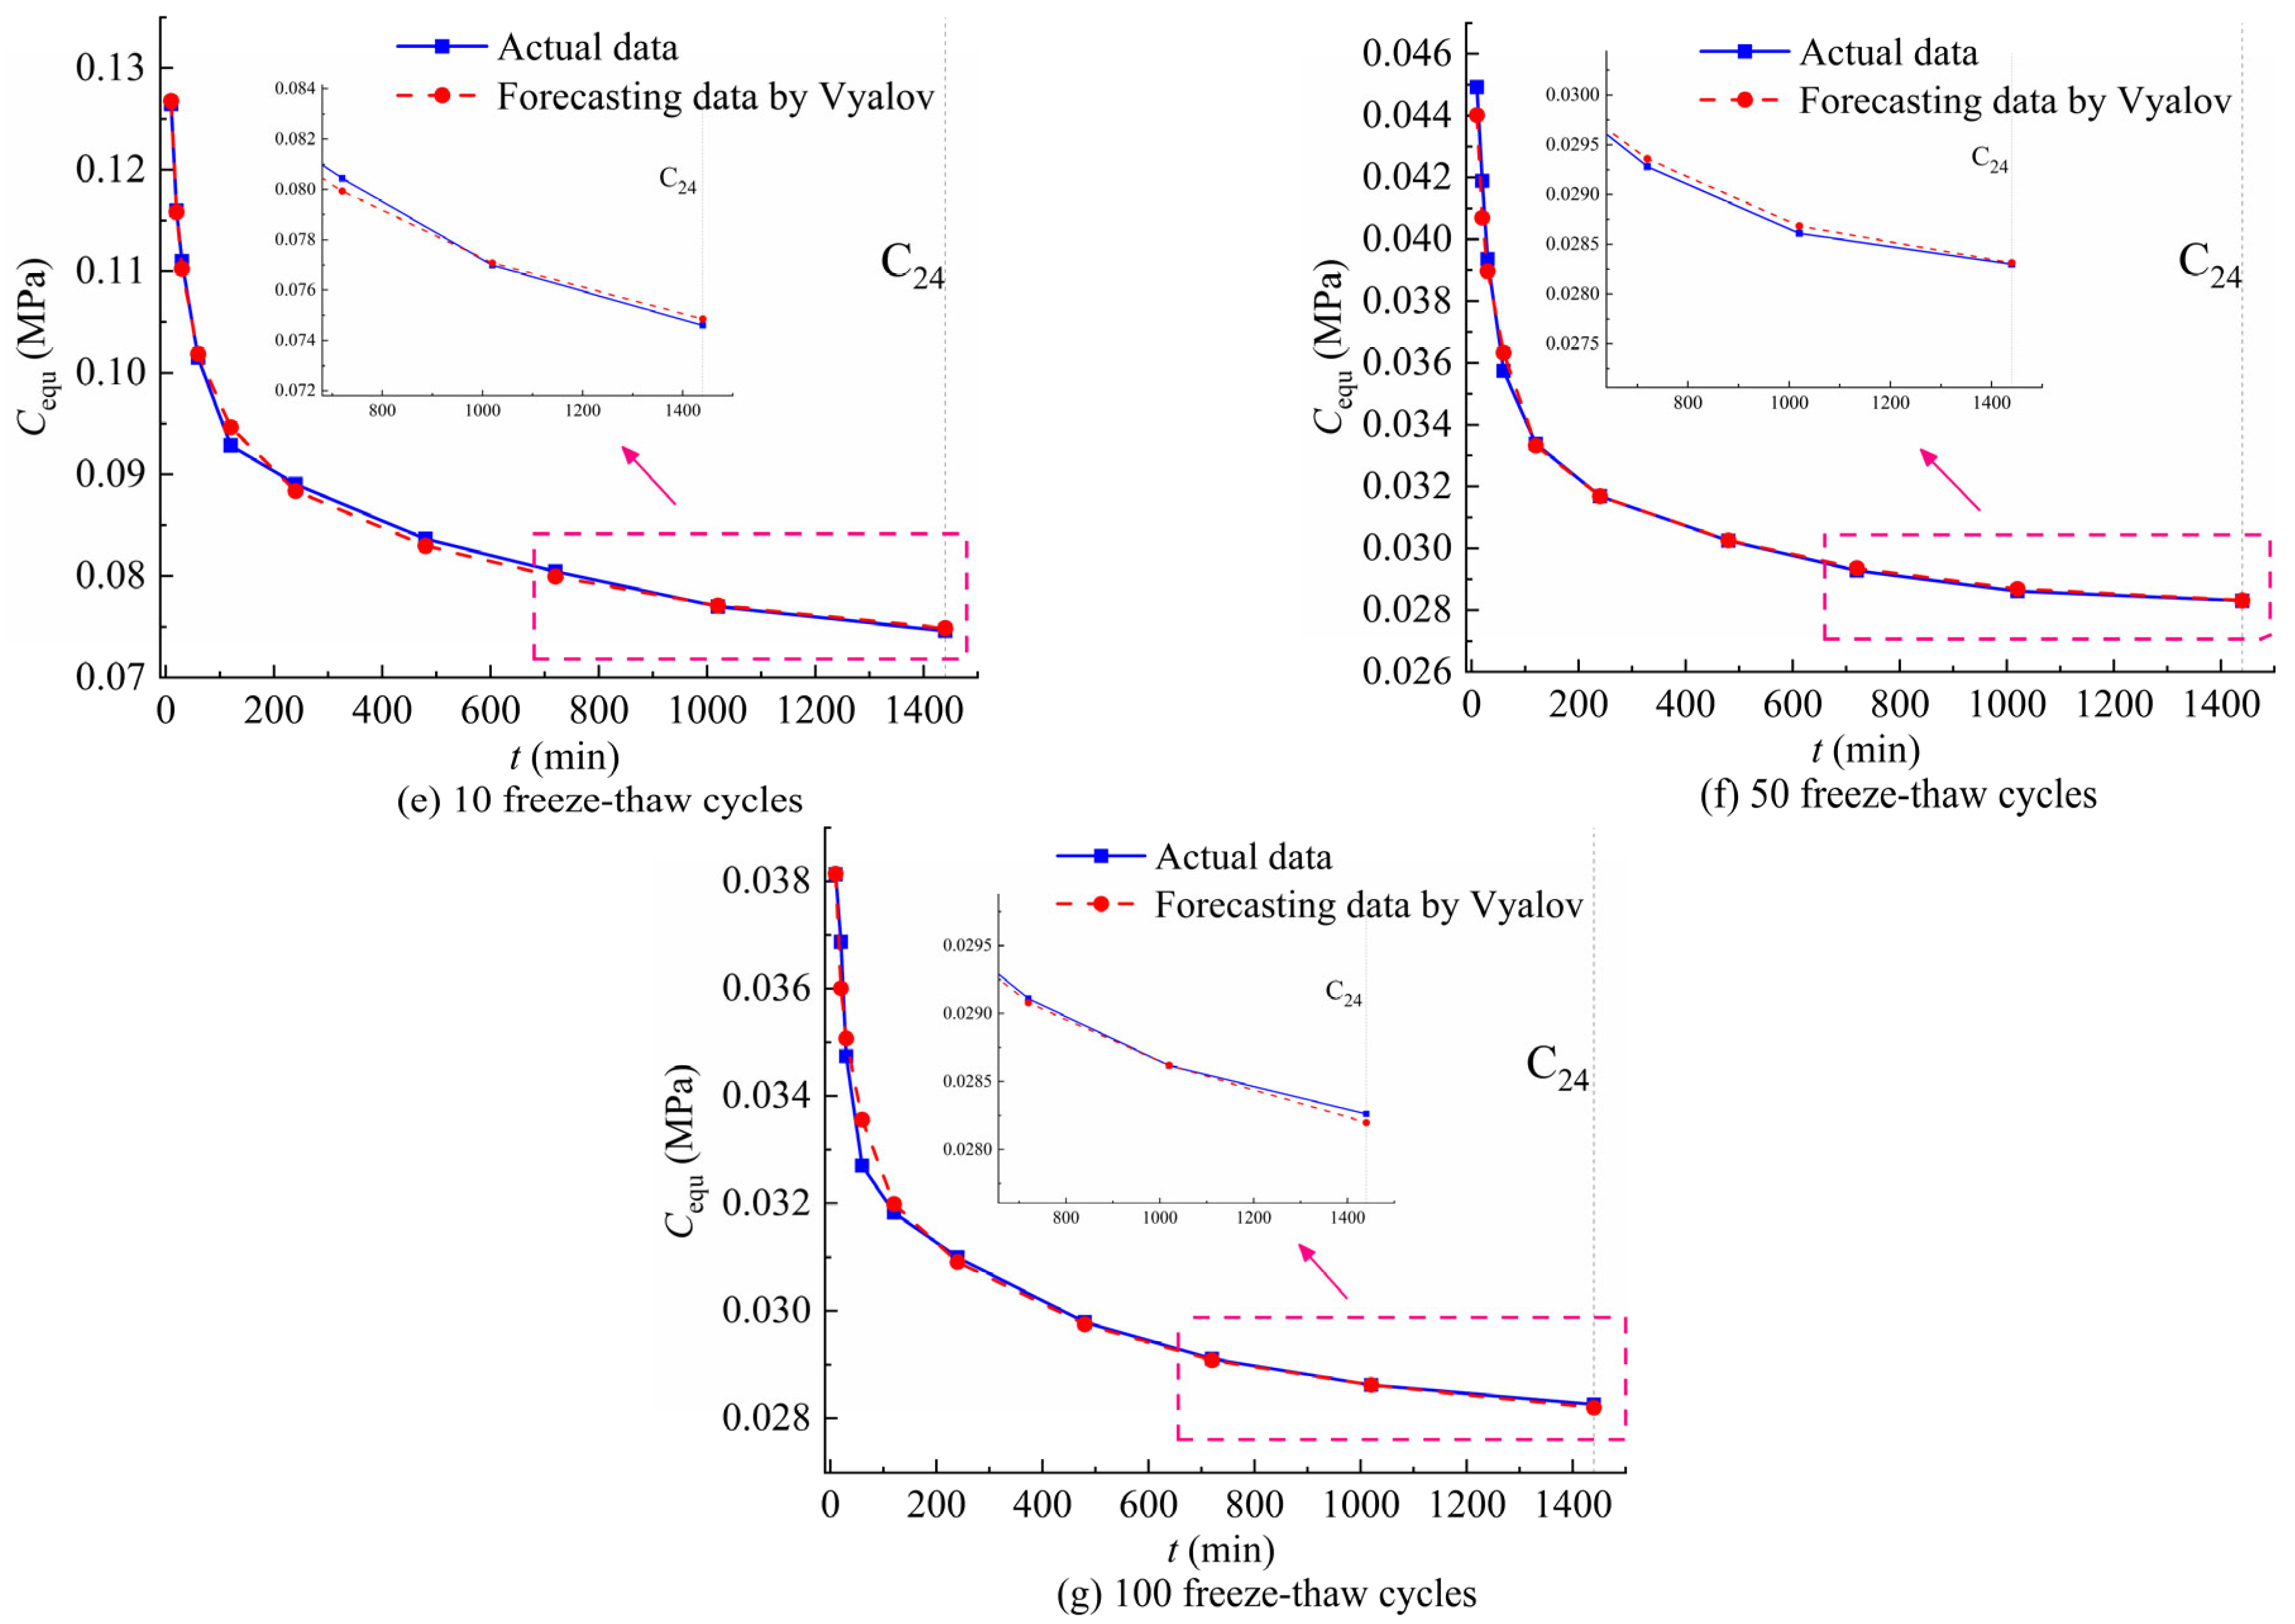
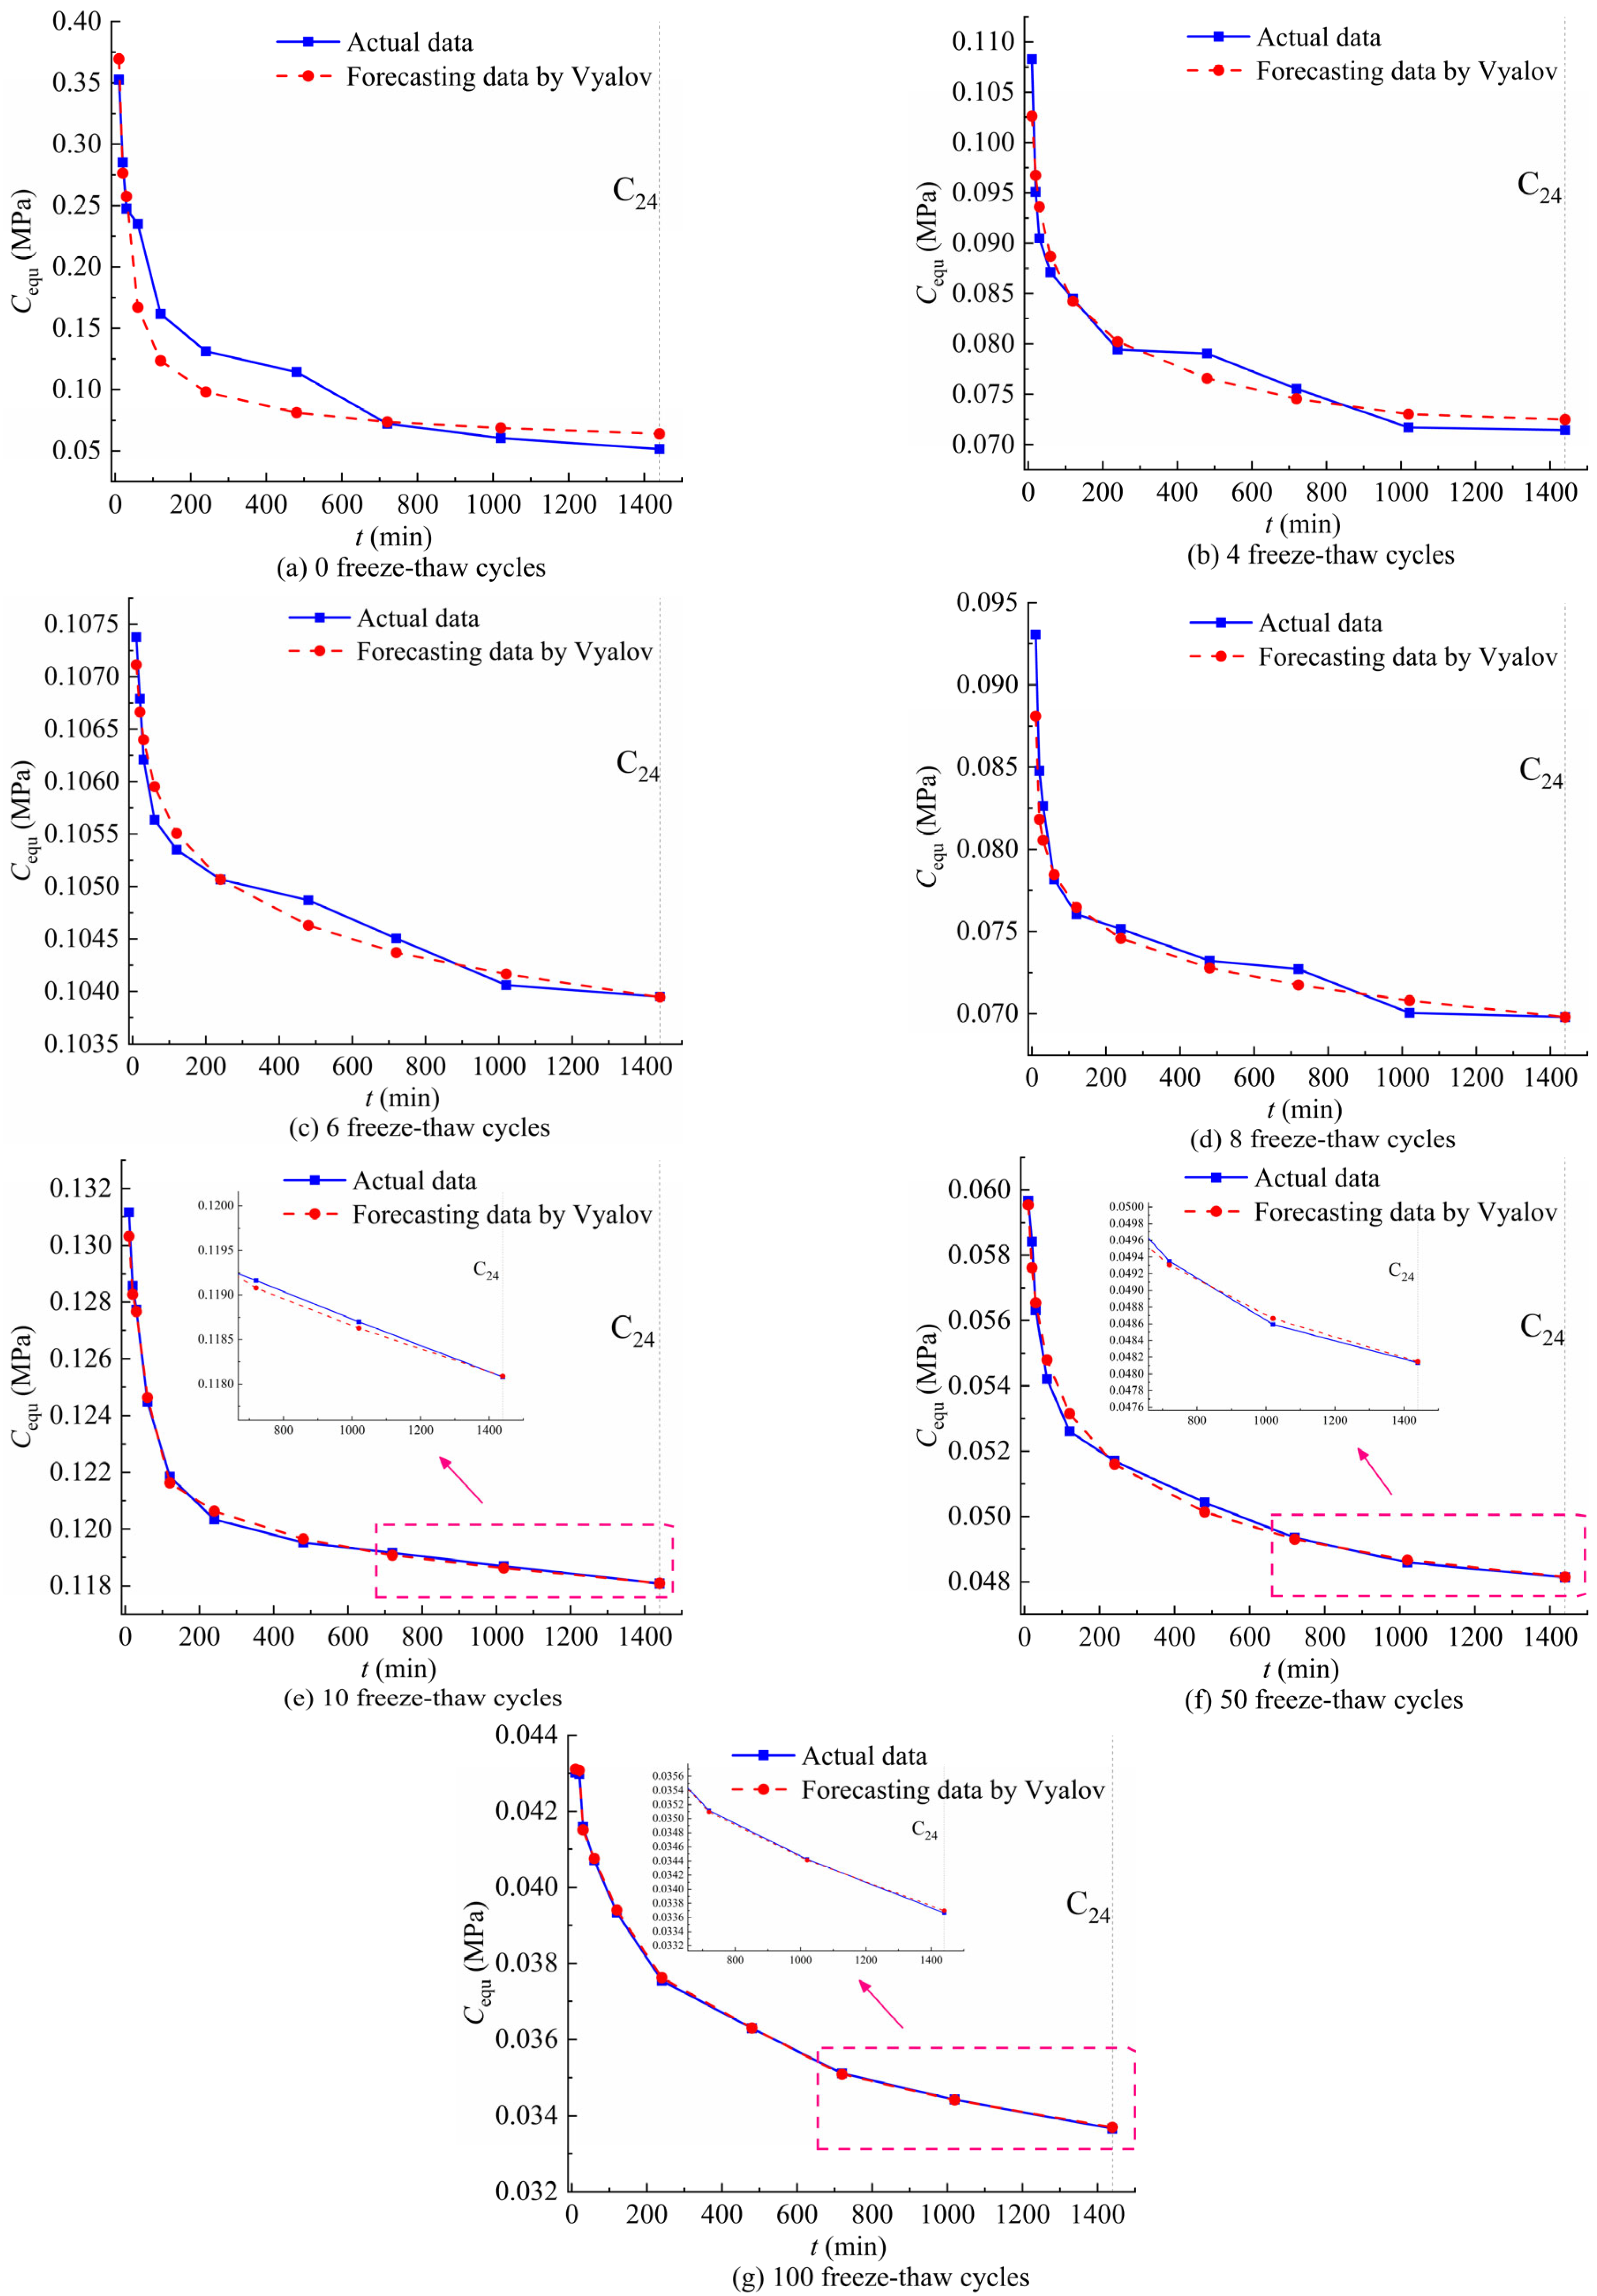
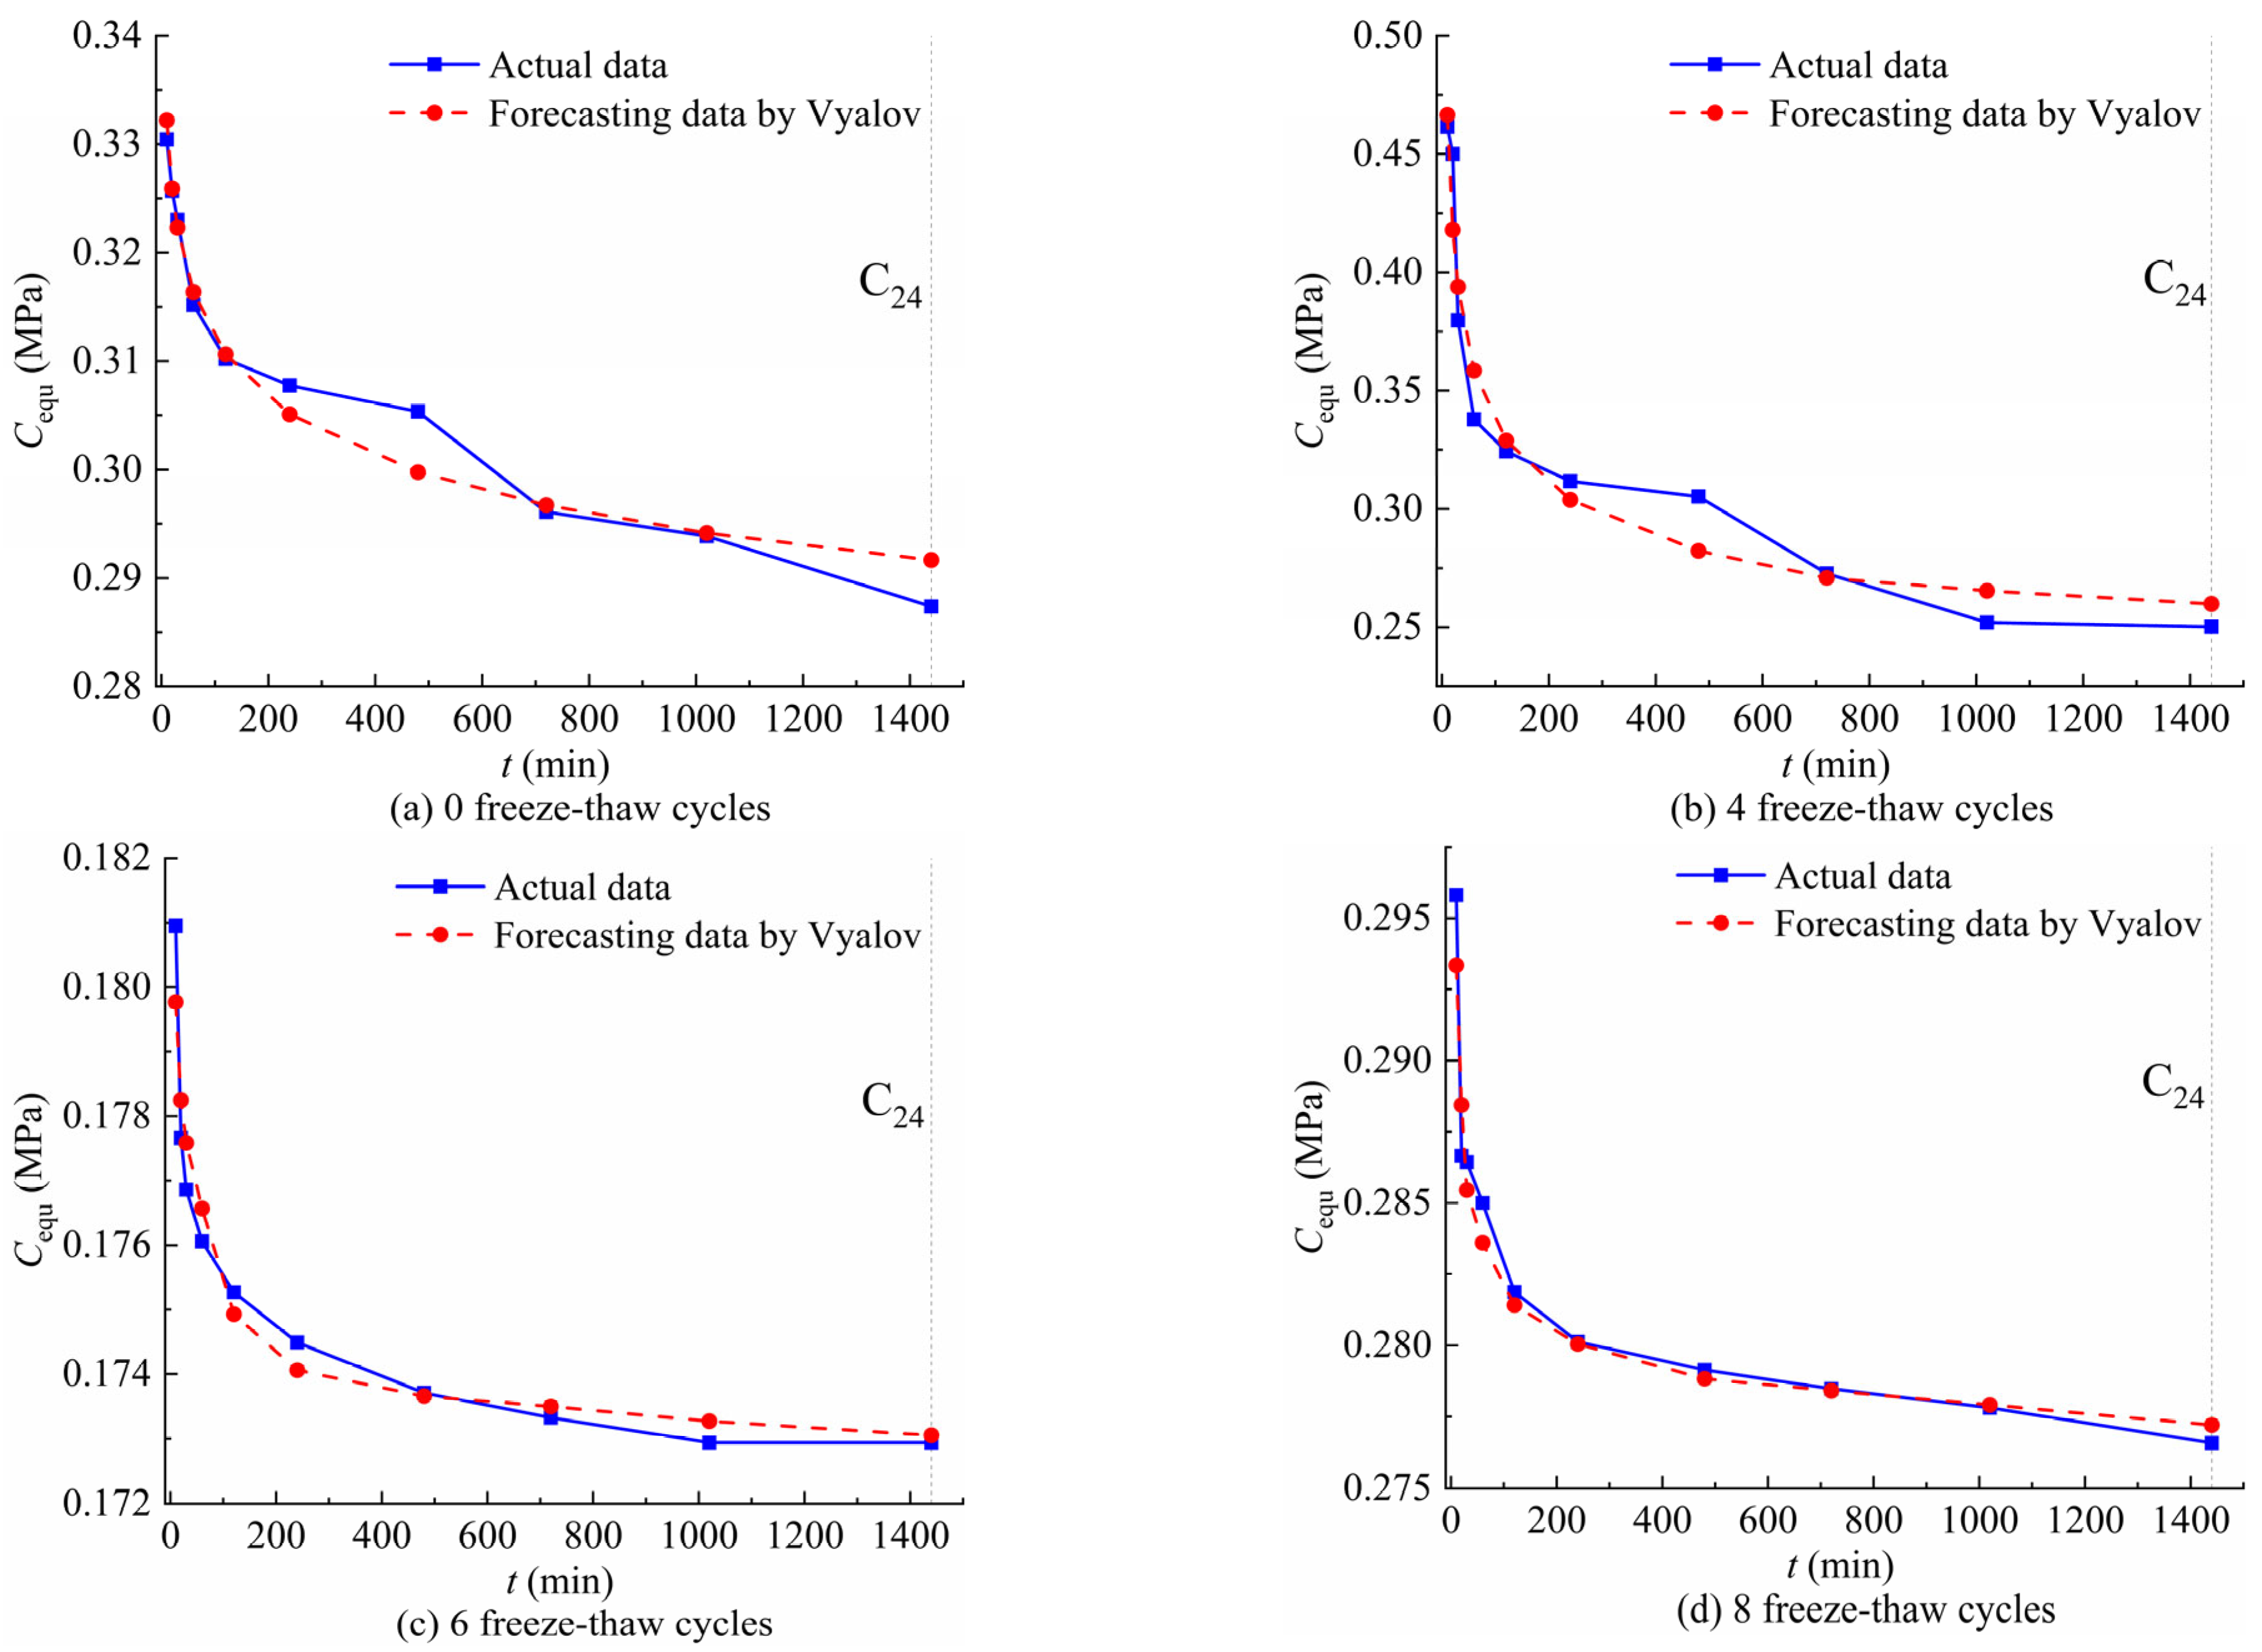
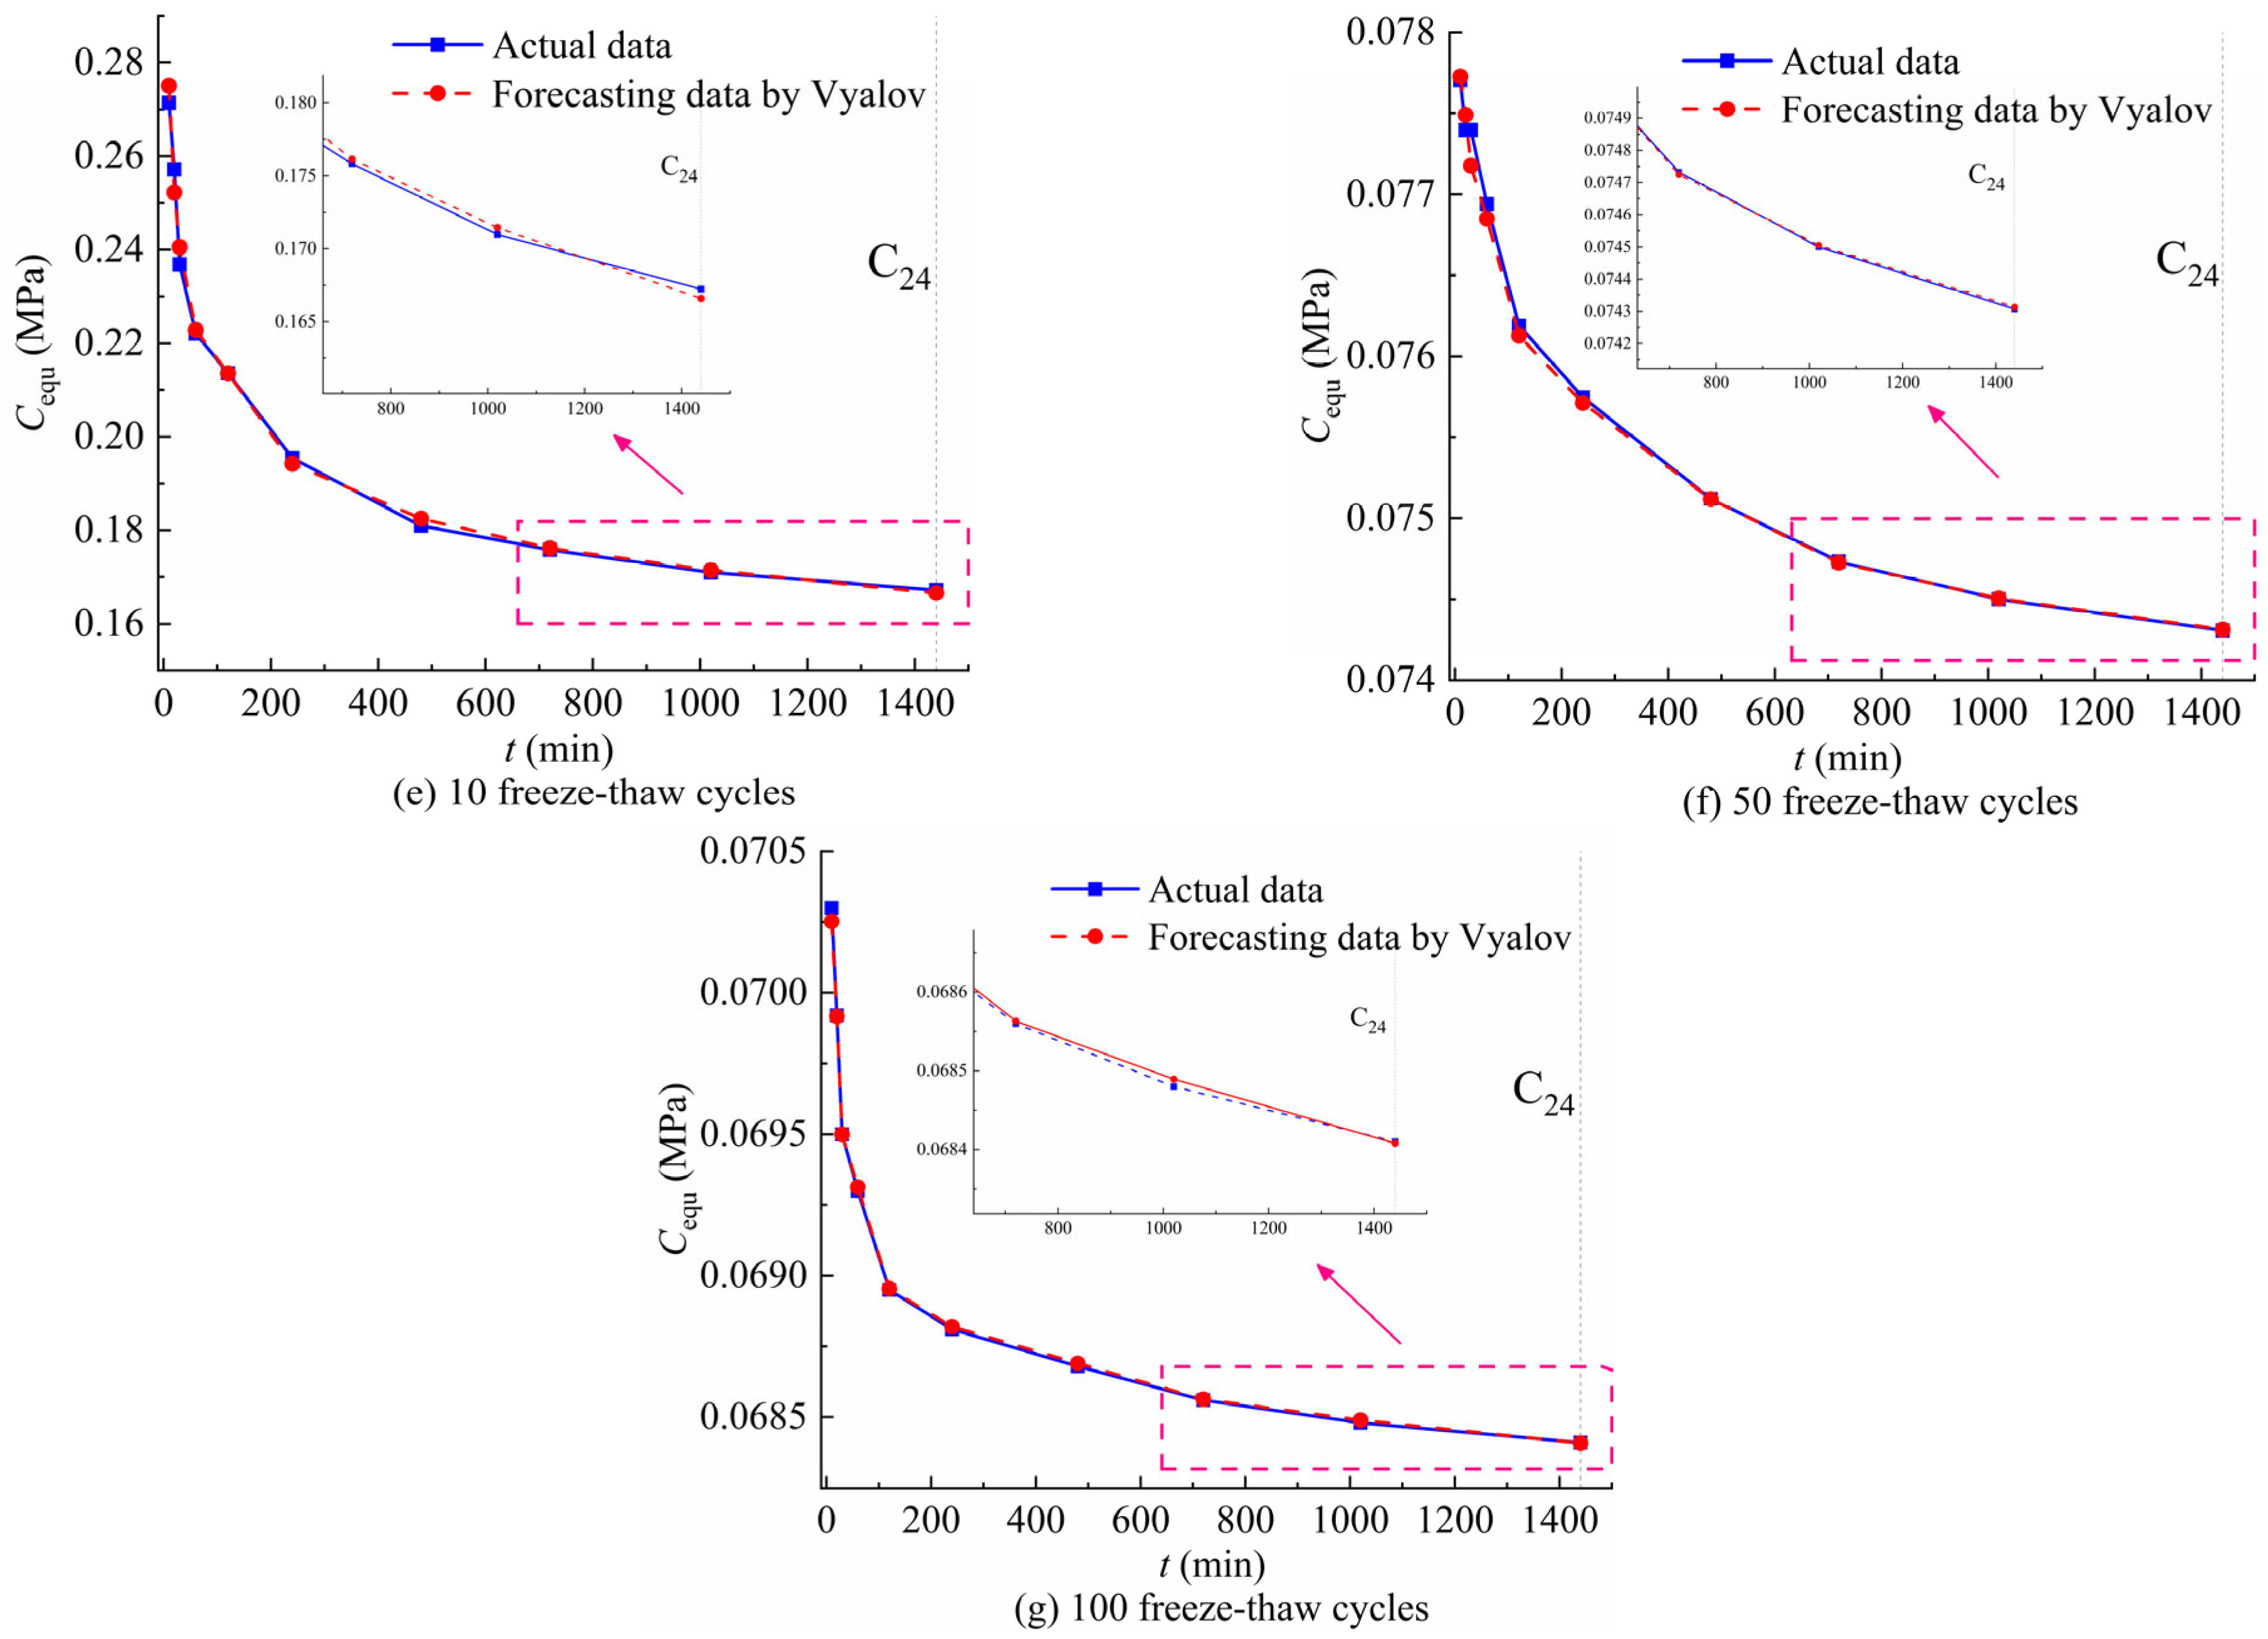
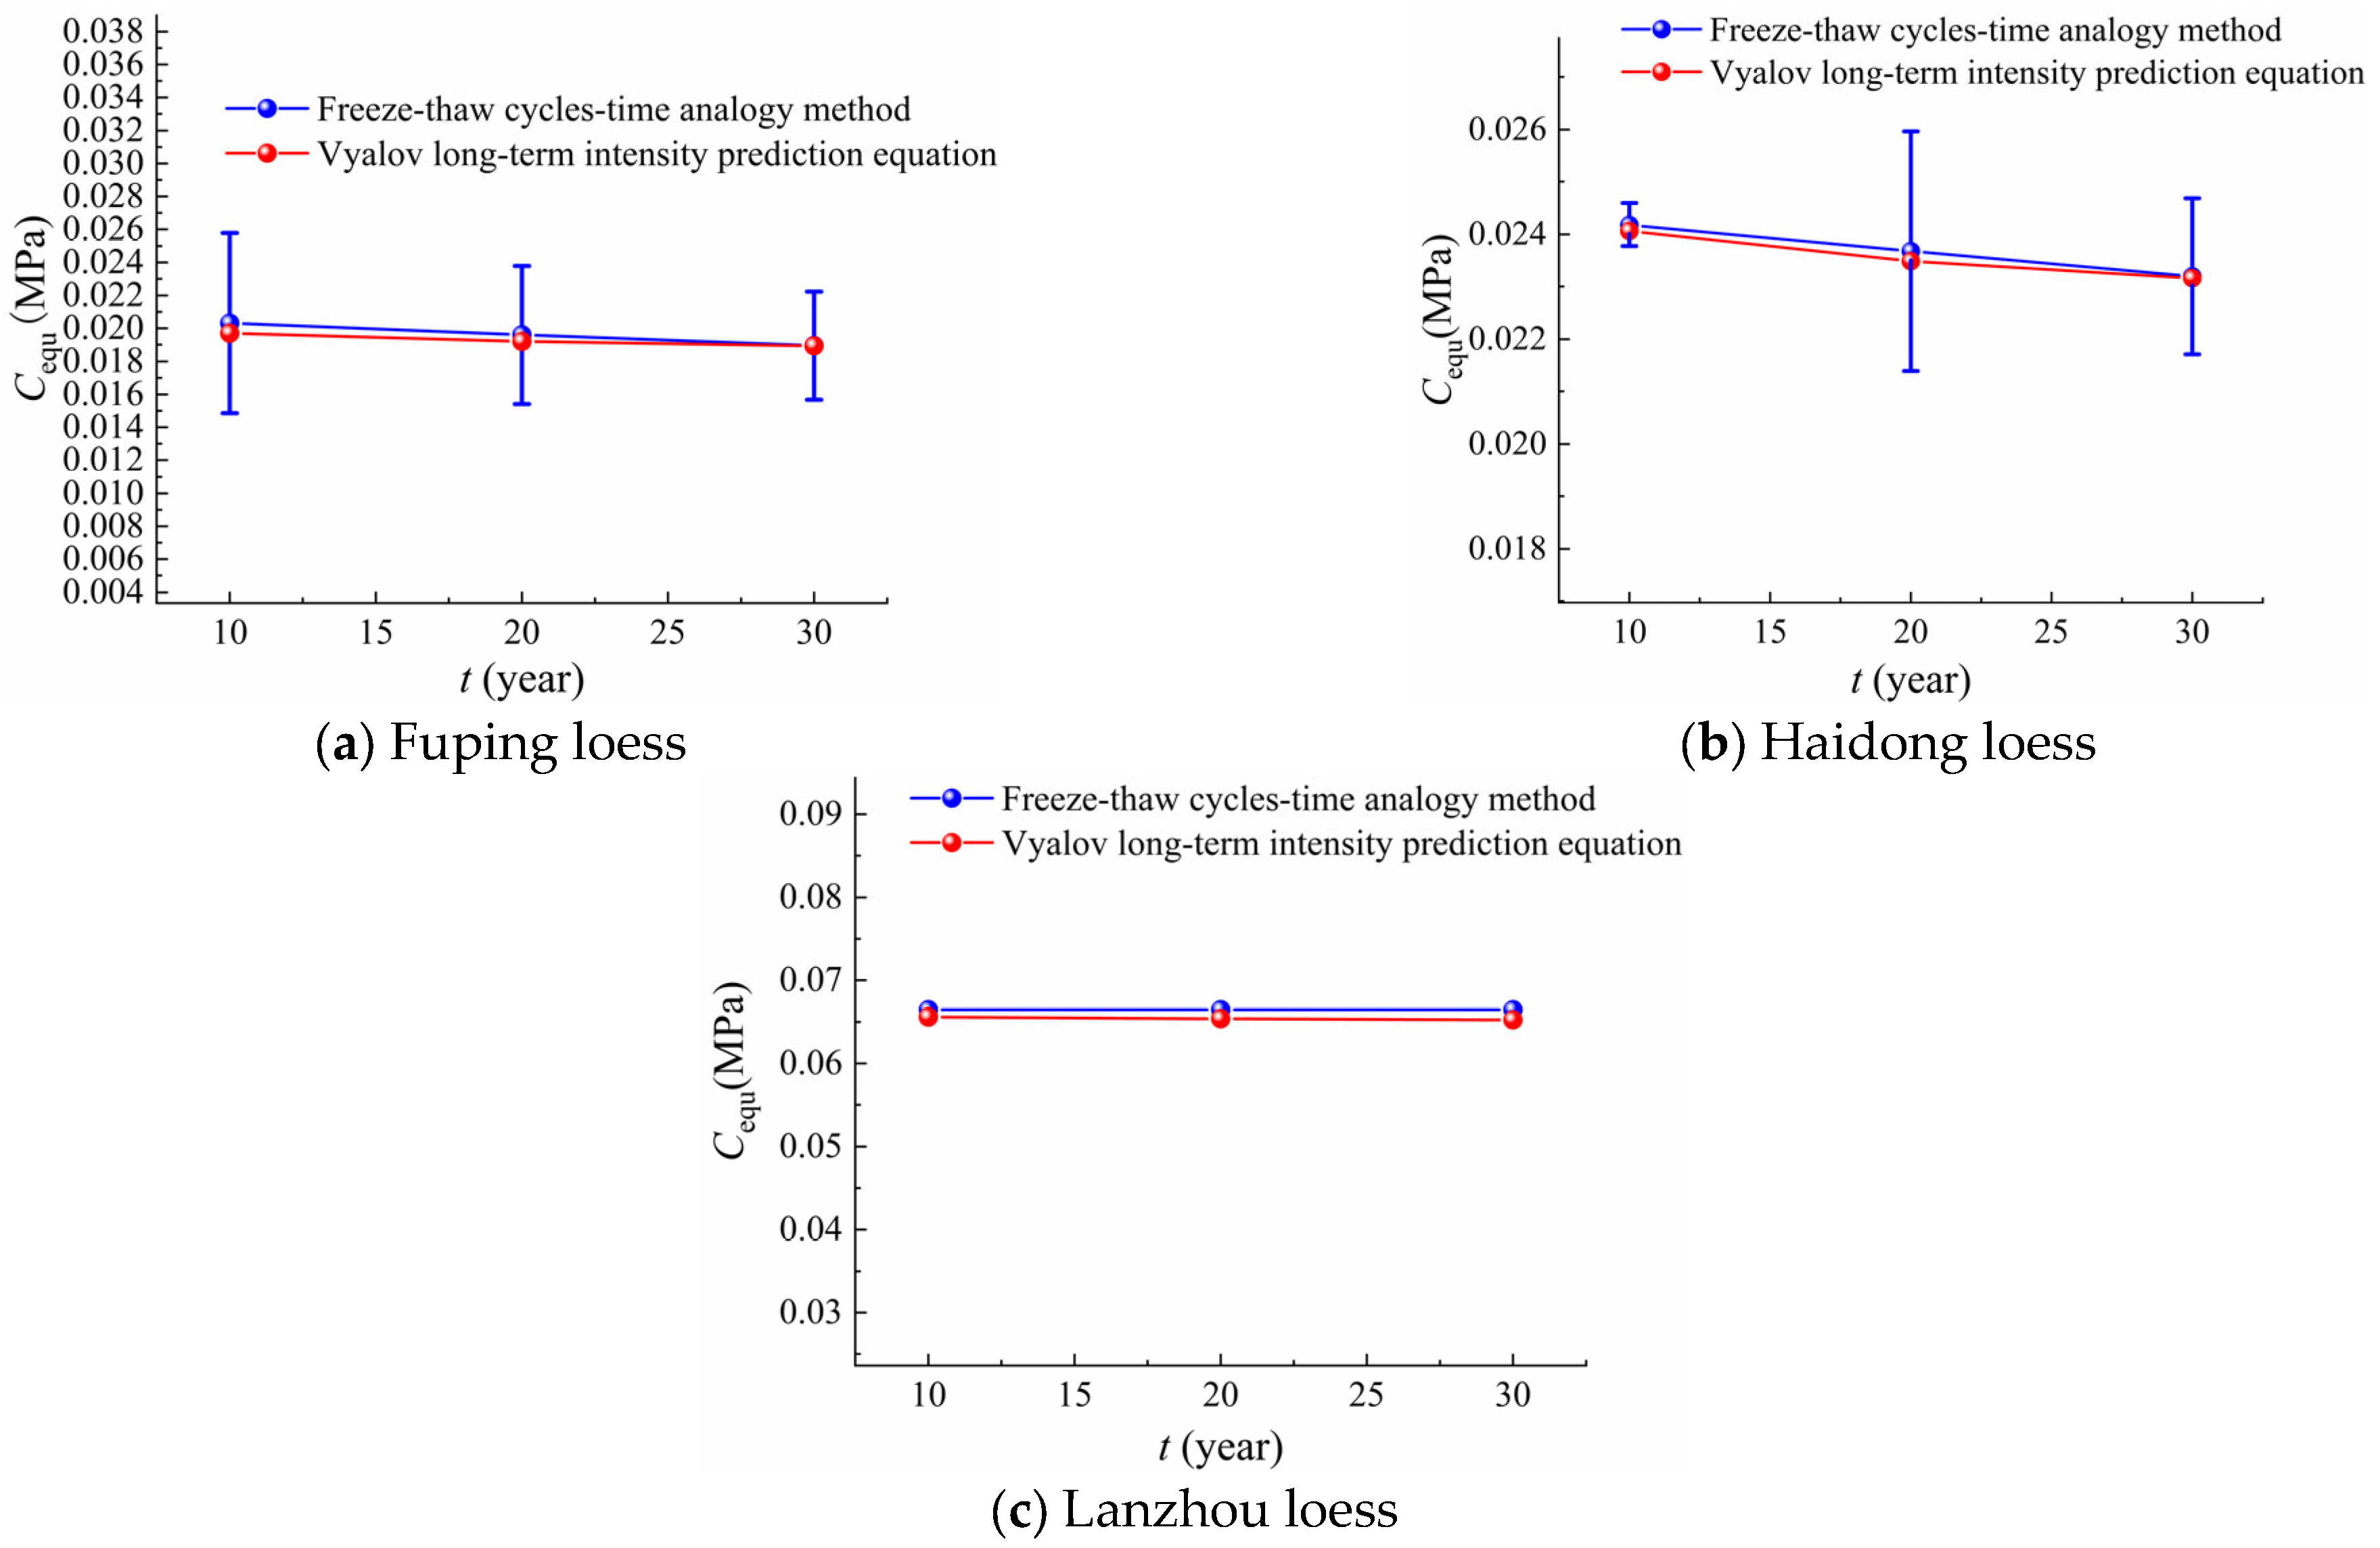
4.3. Long-Term Strength Prediction Results
The long-term strength prediction of three kinds of loess was carried out for 24 h using the Vyalov long-term strength prediction equation of Equation (4), and then the measured and predicted values were compared. The parameters employed in the prediction equation are provided in Table 2 below.
Table 2.
Parameter values of the Vyalov long-term strength prediction equation.
As depicted in Figure 9 and Table 3, it can be observed that for Fuping loess, the prediction curve of the Vyalov long-term strength prediction equation gradually approached the measured value curve from the 4th to the 10th freeze–thaw cycles. The prediction accuracy exhibited an upward trend, with the 10th freeze–thaw cycle showing the most significant improvement. During this cycle, the PRECISION increased by 2.35% and the RMSE index decreased by 91.03%. After 10 freeze–thaw cycles, the PRECISION exceeded 99.6% and all RMSE indicators were below 3.314 × 10⁻⁴. These findings indicate that the prediction curve demonstrates a favorable fitting effect with the equivalent cohesion curve, and the predicted values were in close proximity to the measured values.

Figure 9.
Fuping loess forecasting results.
Table 3.
Accuracy of prediction equations for Fuping loess under different number of freeze–thaw cycles.
As depicted in Figure 10, it is evident that during the first four freeze–thaw cycles, the prediction curve of the Vyalov long-term strength prediction equation exhibits a considerable deviation. At natural sample conditions and the initial stage of the spherical template indenter, the maximum relative error reached 28.9%. As the spherical template indenter pressed into the soil, the pore structure was disrupted, leading to significant changes in the initial strength. Consequently, the predicted strength value deviated considerably from the measured value.
Figure 10.
Haidong loess forecasting results.
From Table 4, it is evident that after the sixth freeze–thaw cycle, the PRECISION of the Vyalov long-term strength prediction equation consistently exceeded 99.19%, while the RMSE remained below 7.053 × 10⁻⁴. However, when considering Figure 10 in conjunction with the results, it becomes apparent that the prediction curve demonstrates better agreement with the measurement curve after the 10th freeze–thaw cycle.
Table 4.
Accuracy of prediction equations for Haidong loess under different number of freeze–thaw cycles.
It can be seen from Figure 11 and Table 5 that for Lanzhou loess, RMSE was the best after 10 freeze–thaw cycles, with the highest reduction of 99.94% and the lowest reduction of 63.98%. And it had obvious advantage in PRECISION, which was above 99.9%. These results highlight the accuracy and reliability of the Vyalov long-term strength prediction equation after 10 freeze–thaw cycles.

Figure 11.
Lanzhou loess forecasting results.
Table 5.
Accuracy of prediction equations for Lanzhou loess under different number of freeze–thaw cycles.
5. Discussion and Analysis
Based on the previous findings, it was observed that the long-term strength of the soil gradually decreased and reached a stabilized state after undergoing 10 freeze–thaw cycles. To gain further insights into the improved accuracy of the Vyalov long-term strength prediction equation after these cycles, it was necessary to analyze the potential influence of grain composition changes. Therefore, this study conducted grain size determinations under different freeze–thaw cycles and investigated the relationship between the parameter β of the prediction equation and the grain composition. Additionally, in order to validate the accuracy of the Vyalov long-term strength prediction equation after 10 freeze–thaw cycles, the predicted results for 10, 20, and 30 years were compared with those obtained through the freeze–thaw cycles–time analogy method.
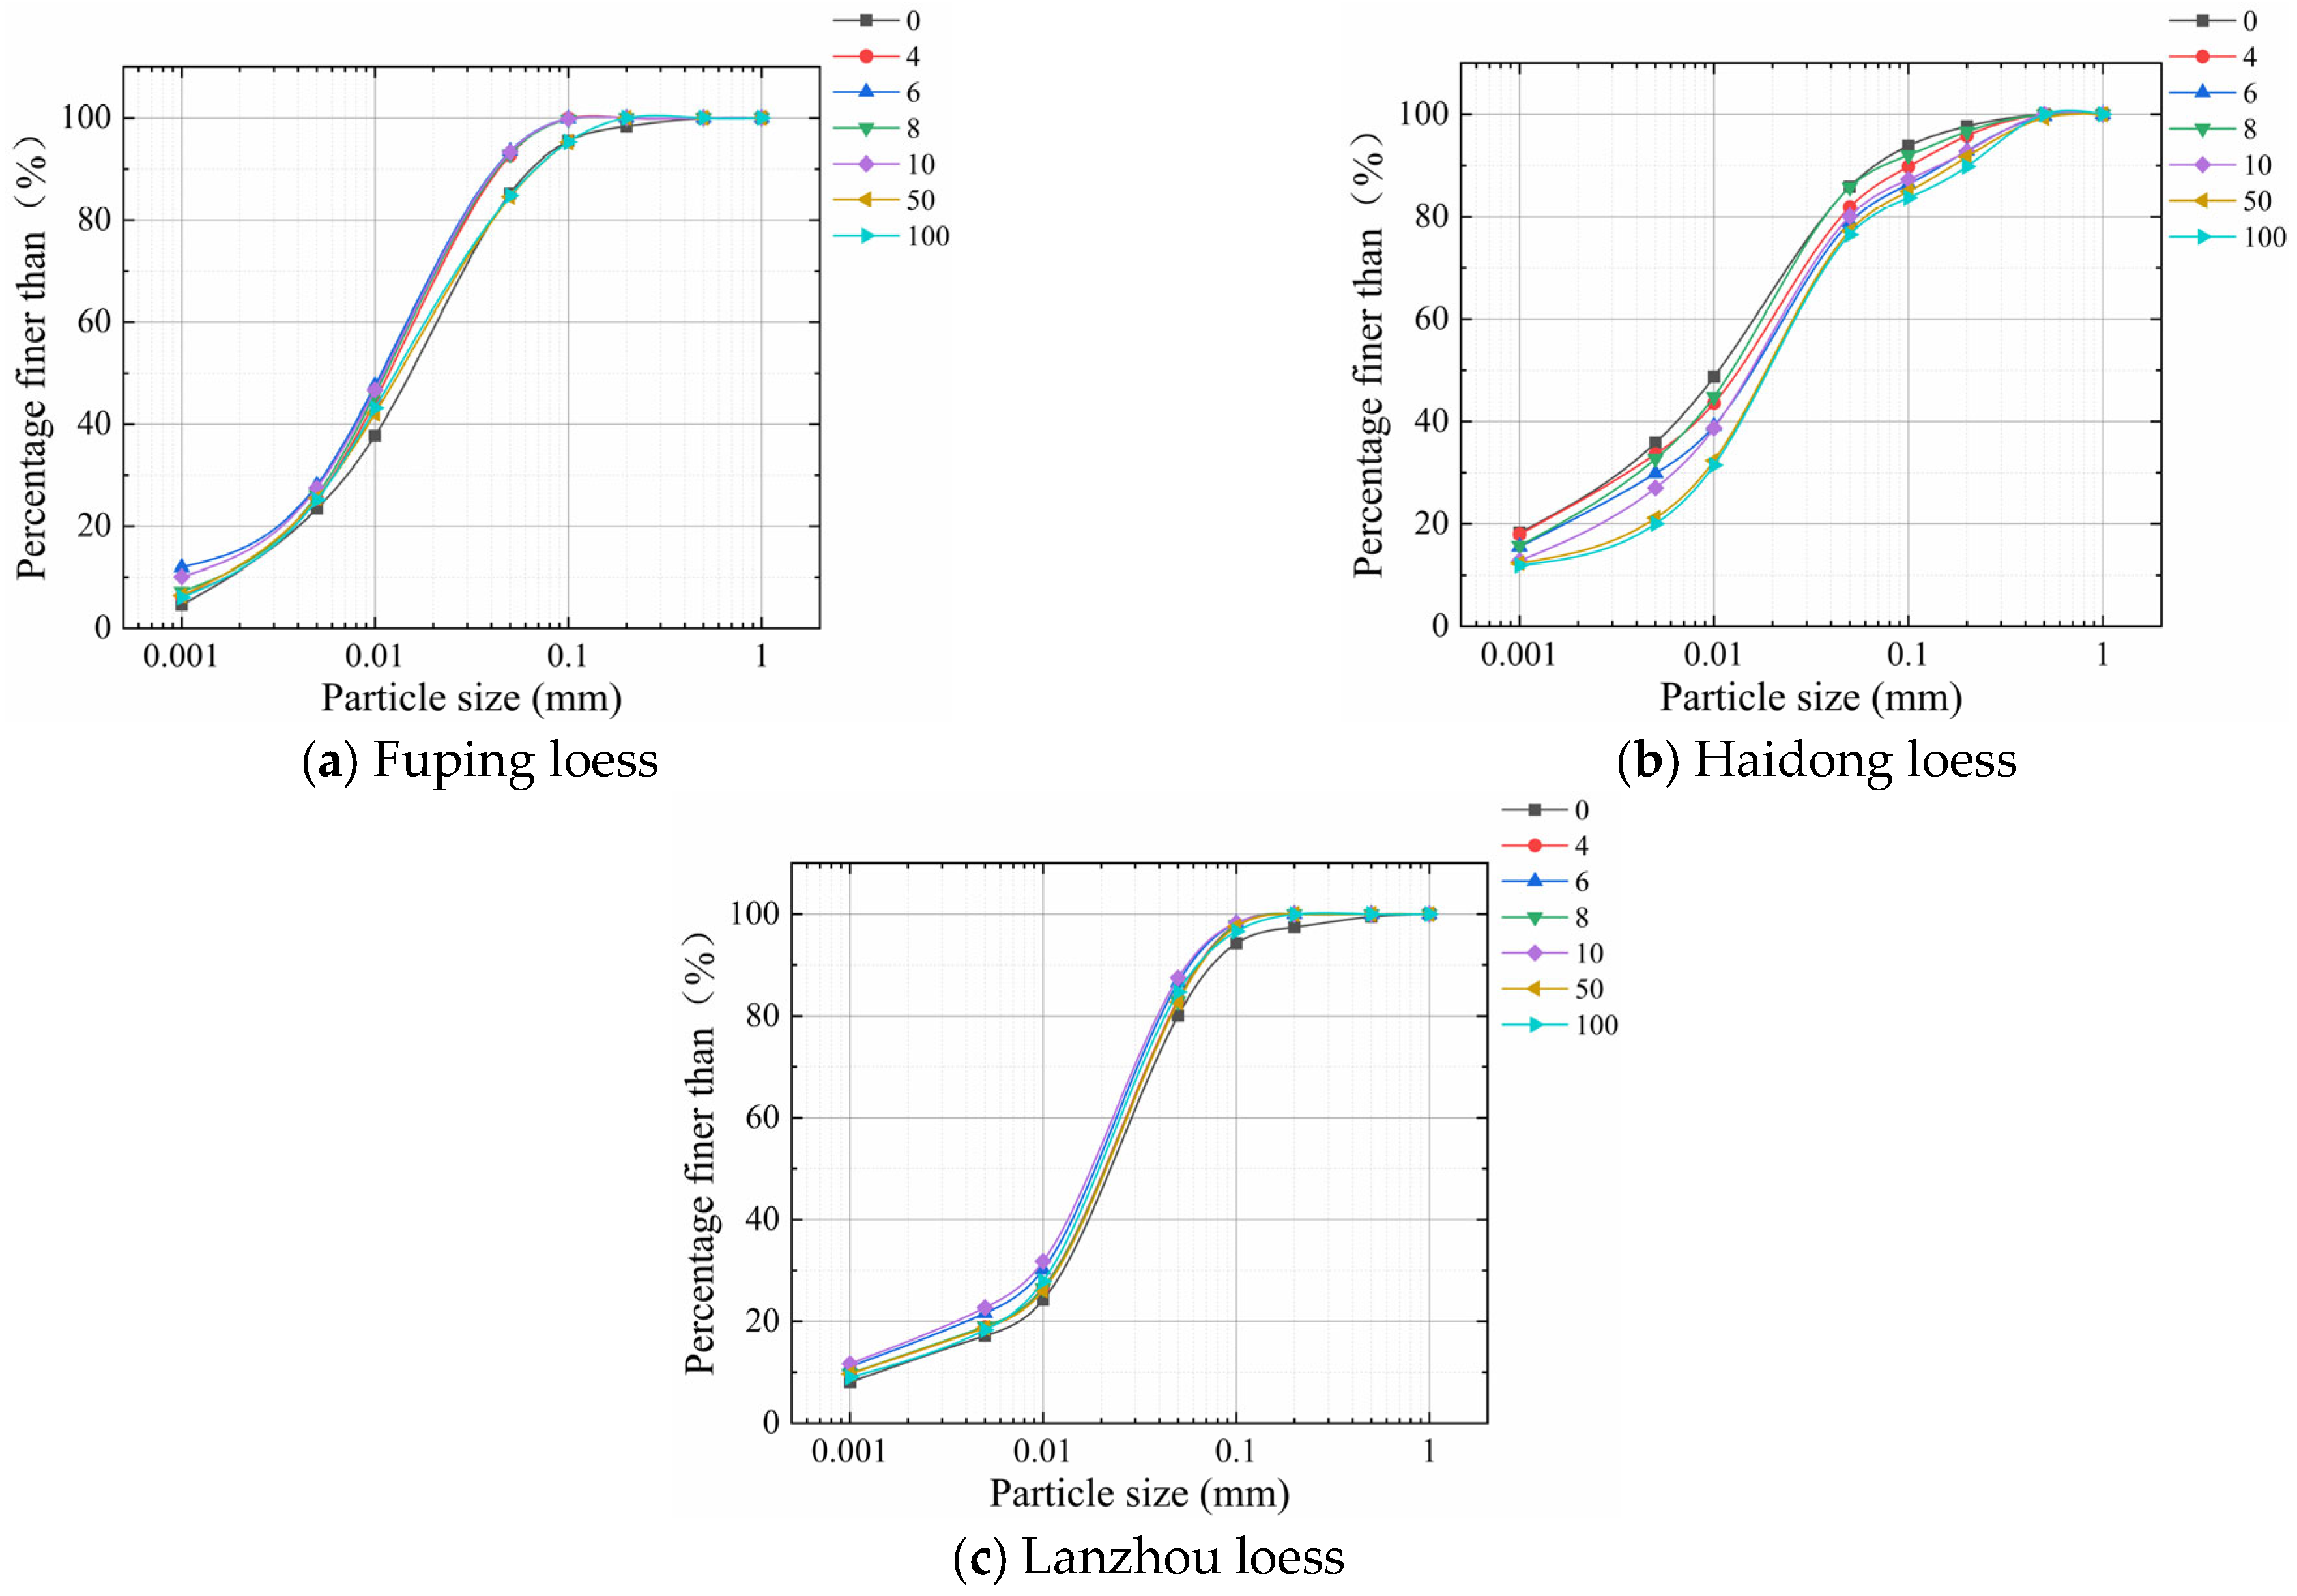
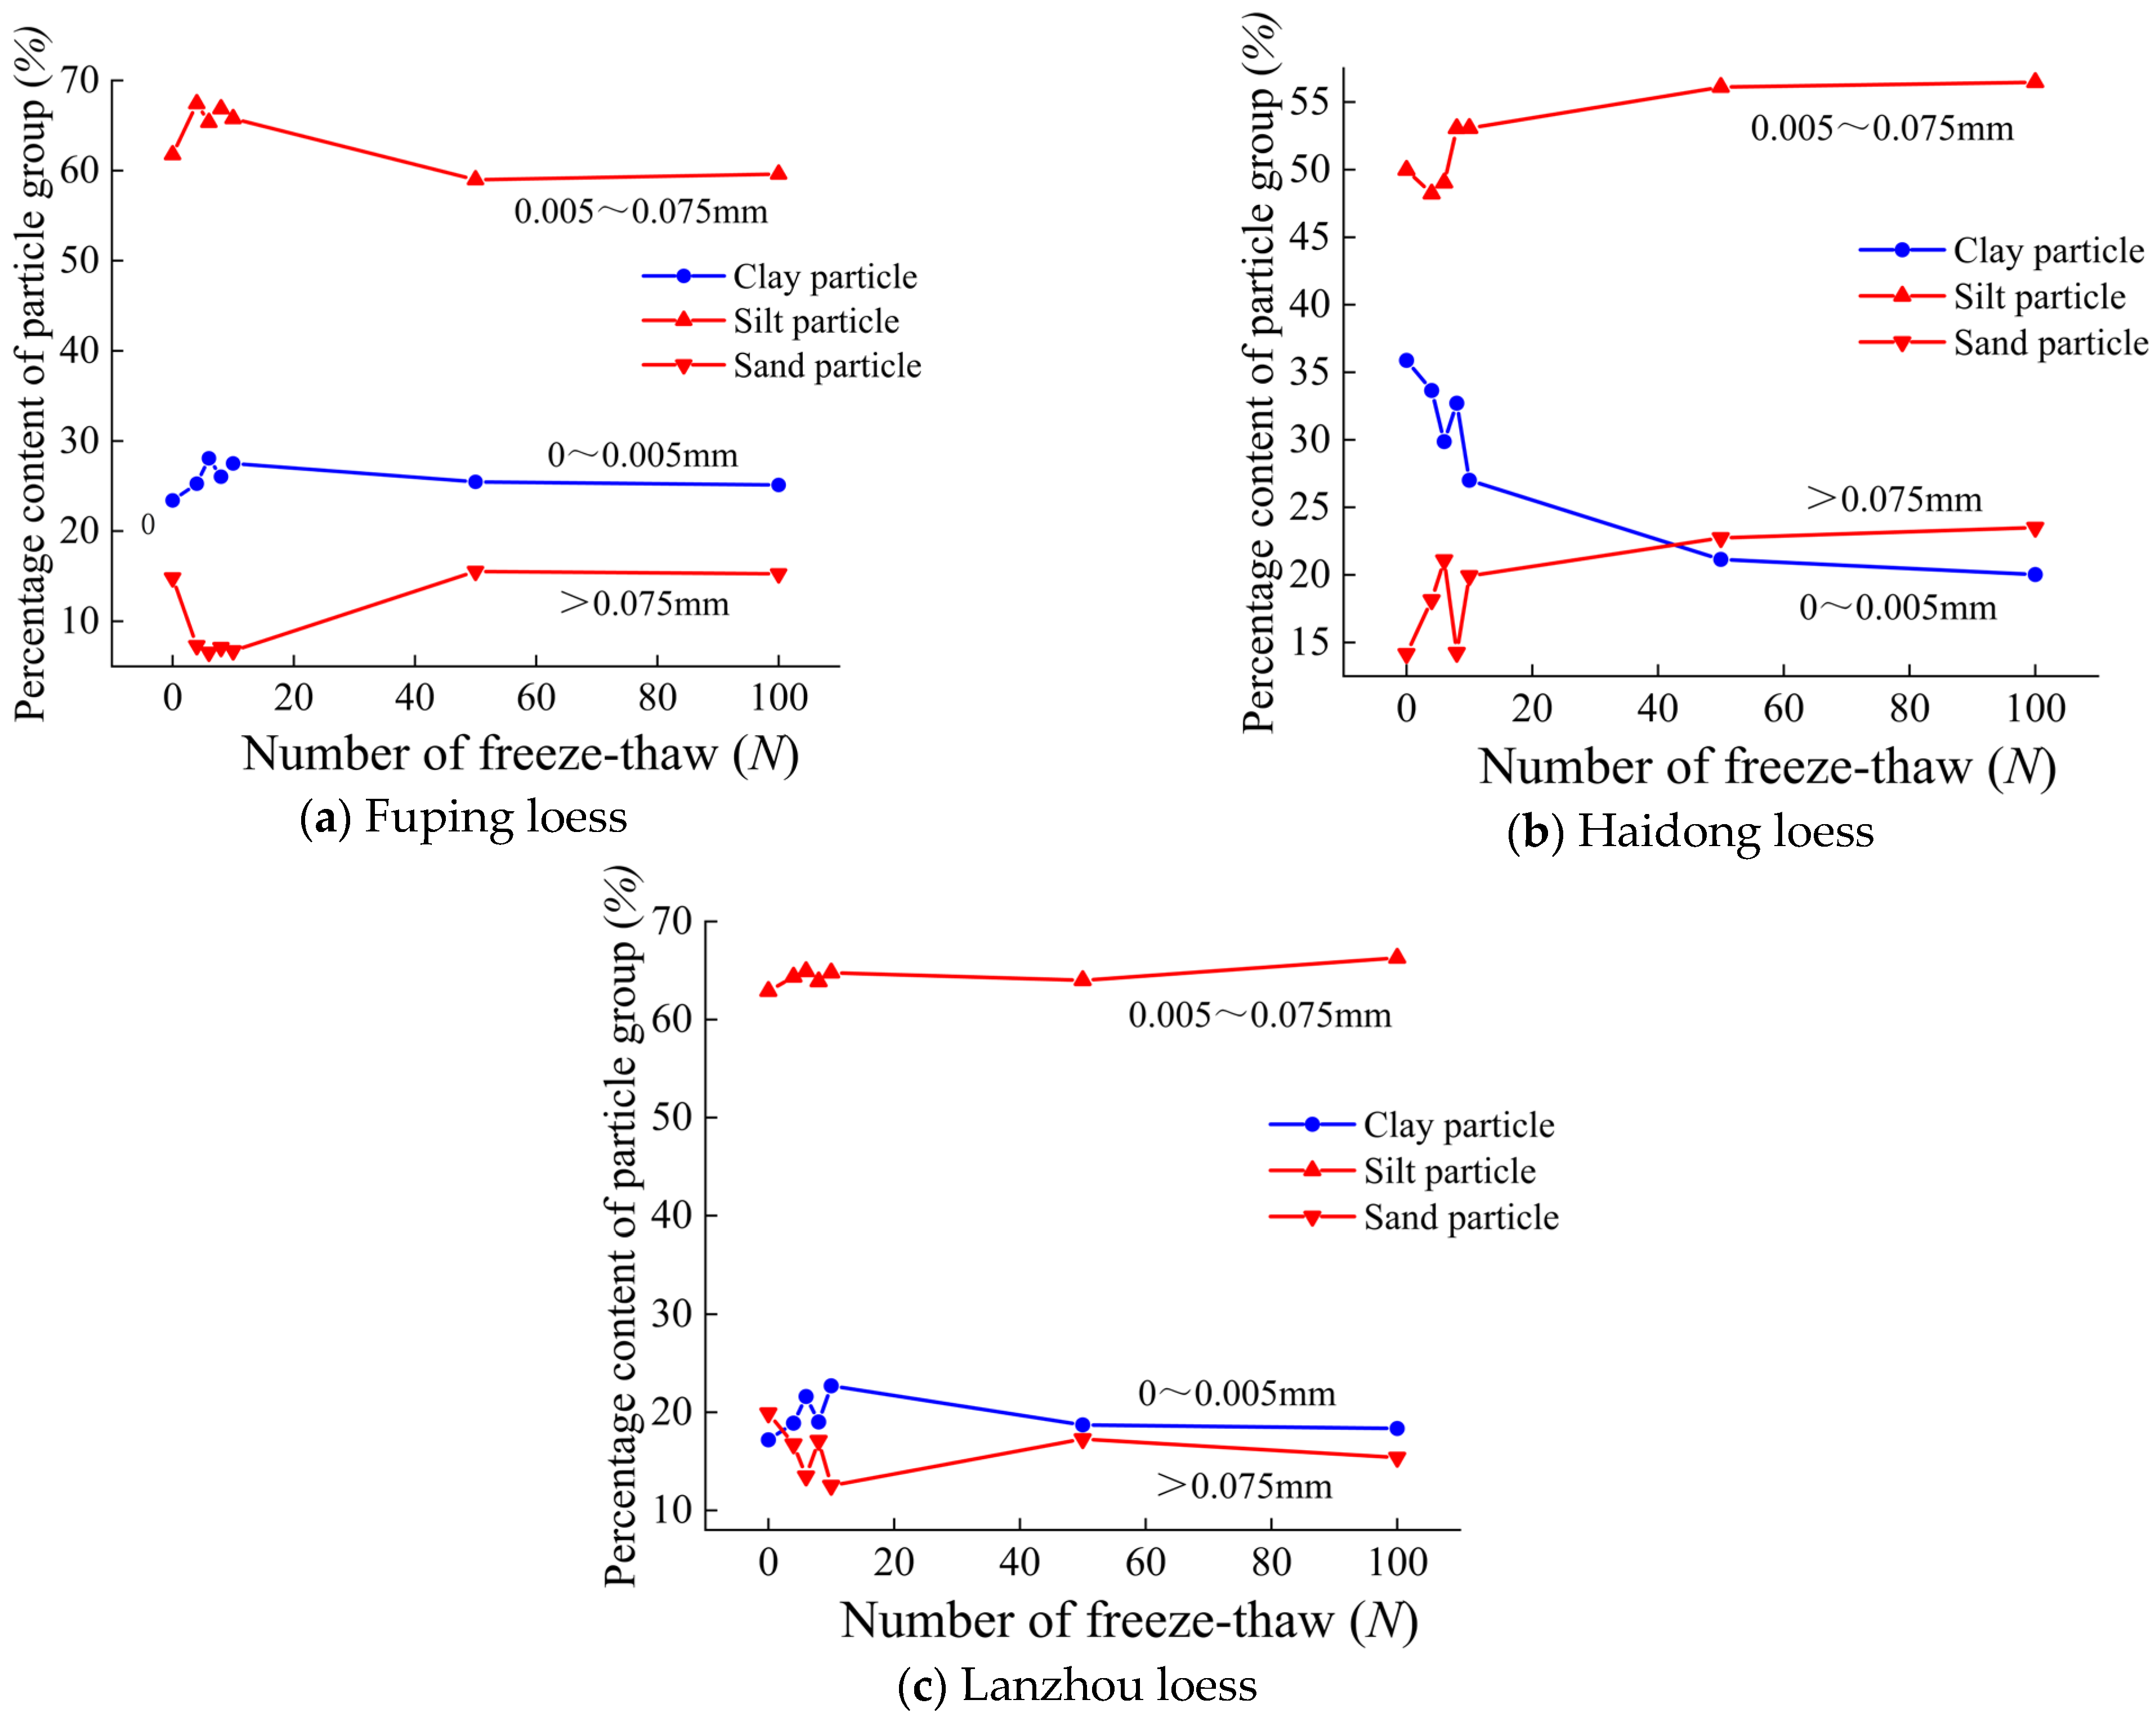
5.1. Grain Composition Change Rules
The grain size distribution curves are presented in Figure 12. To accurately characterize the variation in grain composition, the widely adopted grain group division scheme in China was utilized. Specifically, the sand grain group was defined as particles larger than 0.075 mm, the silt grain group ranged from 0.005 mm to 0.075 mm, and the clay grain group encompassed particles smaller than 0.005 mm. The distribution curves of these three grain groups in the frozen loess are illustrated in Figure 13. It can be observed that during the initial 10 freeze–thaw cycles, the content of the three grain groups underwent continuous changes. In the case of Fuping and Lanzhou loess, the content of clay grains (0–0.005 mm) exhibited a gradual increase during the first six freeze–thaw cycles, while the content of sand grains (>0.075 mm) demonstrated a decreasing trend. Conversely, Haidong Yellow soil displayed an opposite trend. After 50 freeze–thaw cycles, the clay content in all three types of loess gradually decreased steadily, while the silt content tended to increase.
Figure 12.
Grain size distribution curves of the loess.
Figure 13.
Grain group content change diagram.
The experimental results demonstrate that the changes occurring in frozen loess during the initial 10 freeze–thaw cycles are highly unstable, with frequent occurrences of grain aggregation and fracturing [24,25]. However, after 10 freeze–thaw cycles, as the number of cycles increases, the grain composition tends to stabilize, and the grain size exhibits minimal changes. At this stage, a new skeleton structure begins to form in the soil [26]. The Vyalov long-term strength prediction equation is derived from the perspectives of both the dynamic theory and deformation hardening theory. The onset of transformation is considered as the failure time, which is significantly influenced by both the strength of shear stress and the average normal stress. Therefore, prior to 10 freeze–thaw cycles, the soil with an unstable structure contributes to larger prediction errors.
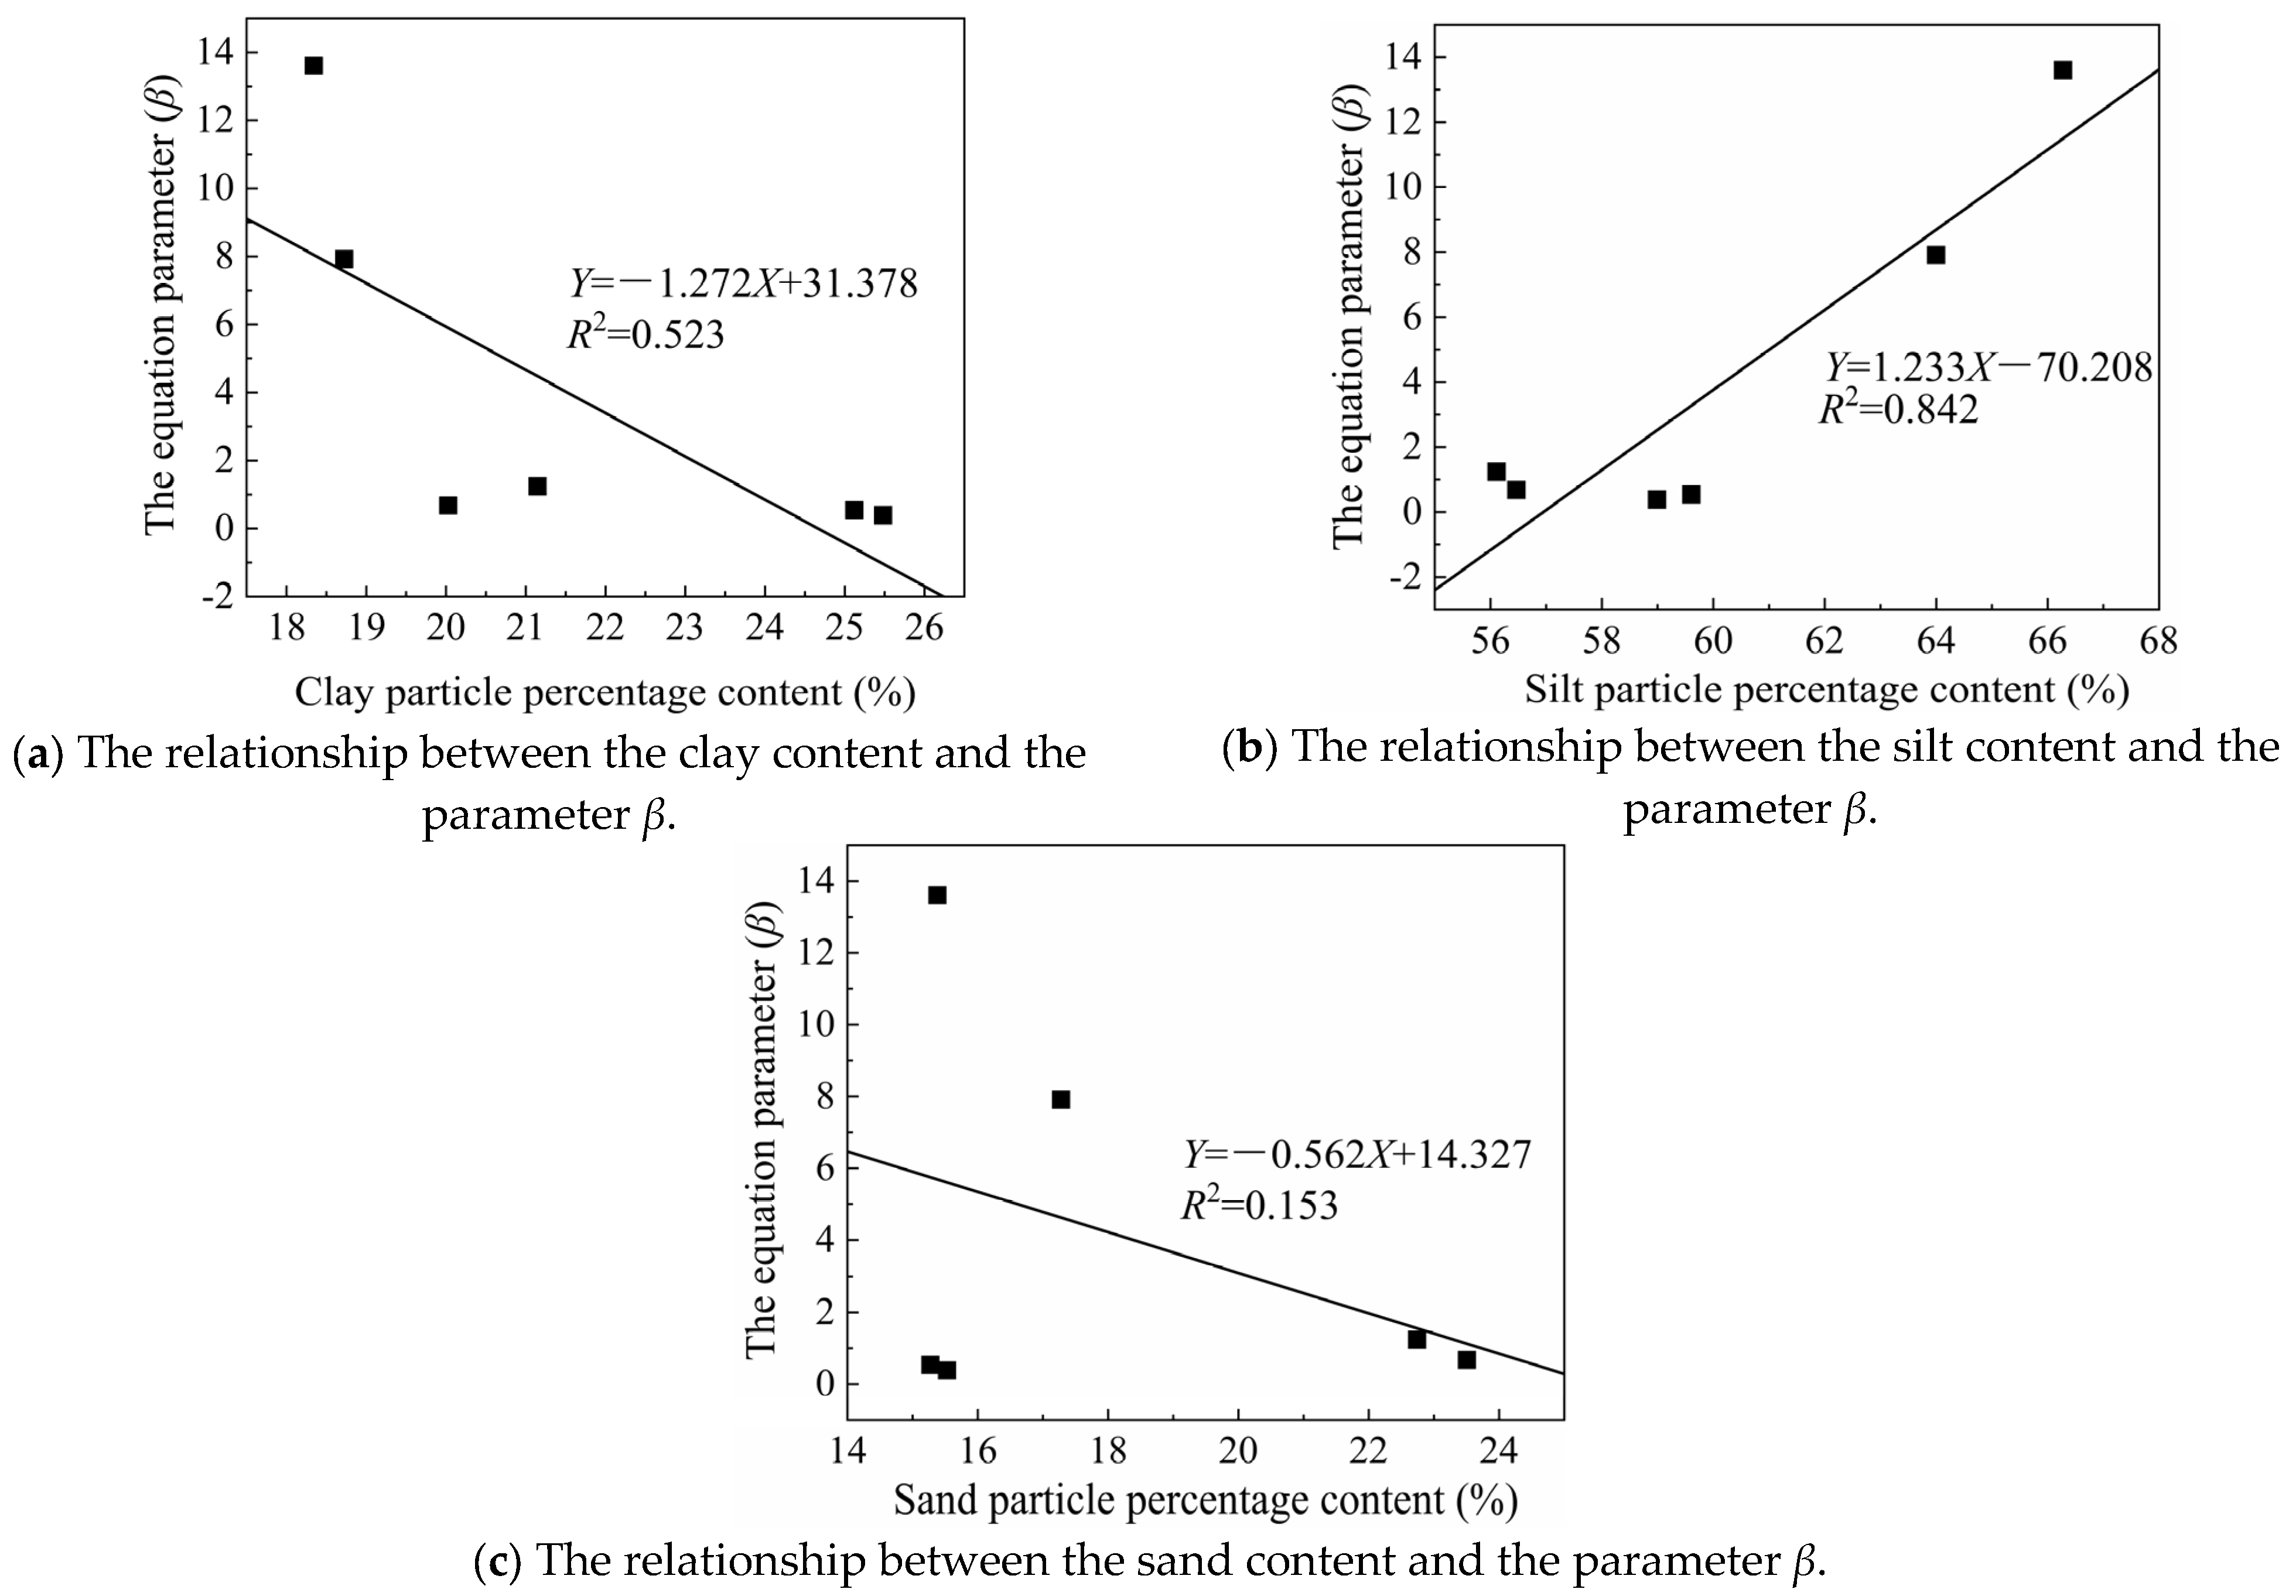
5.2. Correlation Analysis
From the correlations of the clay grain content, silt grain content, and sand grain content with the parameter β of the long-term strength prediction equation in Figure 14, the following is shown: a real negative correlation with the clay grain, a highly significant positive correlation with the silt grain, and a slightly negative correlation with the sand grain. Consequently, after 50 freeze–thaw cycles, the impact of silt grains in loess on the parameter β of the prediction equation is significantly more influential compared to the clay and sand grains.
Figure 14.
Correlation between grain group content and parameter β after 50 freeze–thaw cycles.
5.3. Freeze–Thaw Cycles–Time Analogy Method
From the previous text, it is known that the long-term strength changes under the first 10 freeze–thaw times were very drastic, so the long-term strength data after the 10th time were used for fitting. The fitting results are shown in Figure 15.

Figure 15.
Fitting diagram of freeze–thaw cycles–time analogy method.
The presence of deviations in the fitting curve introduces potential errors in the prediction results. In order to assess the accuracy of the Vyalov long-term strength prediction equation, Figure 16 presents the long-term strength predictions for the three types of loess after 10, 20, and 30 years using both the Vyalov equation and the freeze–thaw cycles–time analogy method. It can be observed that, within an acceptable range of error, the results obtained from both methods exhibit a relatively close agreement. This further validates the accuracy of the Vyalov long-term strength prediction equation after 10 freeze–thaw cycles.
Figure 16.
Comparison of two long-term strength prediction methods.
6. Conclusions
(1) In the first 10 cycles of freezing and thawing, the long-term strength change curve of frozen loess was in a damping form. After 10 freeze–thaw cycles, a new equilibrium structure was formed in the soil due to repeated freeze–thaw action, so the long-term strength gradually decreased, and particularly after 50 freeze–thaw cycles, the long-term strength tended to be stable.
(2) For loess, it is recommended to use the Vyalov long-term strength prediction equation to predict its long-term strength changes after undergoing 10 freeze–thaw cycles.
(3) The parameter β was an important parameter of Vyalov’s long-term strength prediction equation, and the silt content in loess played a decisive role in the value of the equation parameter β. Therefore, the prediction equation can be evaluated and analyzed based on the silt content in loess.
(4) The comparison of the prediction results between the freeze–thaw cycles–time analogy method and the long-term strength prediction equation showed that the two methods had similar prediction results in long-term forecasts such as 10, 20, and 30 years, further proving the feasibility of using the long-term strength prediction equation after 10 freeze–thaw cycles.
Author Contributions
Conceptualization, C.X. and J.Z.; methodology, L.Y.; software, X.M.; validation, X.M.; formal analysis, X.M.; investigation, C.X.; resources, Z.Z.; data curation, Z.Z.; writing—original draft preparation, J.F.; writing—review and editing, J.F.; visualization, J.F.; supervision, J.F.; project administration, J.F.; funding acquisition, Z.Z. All authors have read and agreed to the published version of the manuscript.
Funding
This research was funded by [Heilongjiang Transportation Investment Group Co., Ltd] grant number [JT-100000-ZC-FW-2021-0129] and [Science & Technology Fundamental Resources Investigation Program] grant number [2022FY100702] and [Key Research and Development Program guidance project of Heilongjiang Province] grant number [GZ20220095, GZ20220052].
Acknowledgments
The authors greatly appreciate the support of the following research grants: (a) Heilongjiang Transportation Investment Group Co., Ltd. (JT-100000-ZC-FW-2021-0129); (b) Science & Technology Fundamental Resources Investigation Program (2022FY100702); and (c) Key Research and Development Program guidance project of Heilongjiang Province (GZ20220095, GZ20220052).
Conflicts of Interest
The authors declare no conflict of interest.
References
- Hu, S.; Qiu, H.; Wang, N.; Cui, Y.; Cao, M.; Wang, J.; Wang, X. The influence of terrain on loess landslides in Loess Plateau. Acta Geogr. Sin. 2021, 76, 2697–2709. [Google Scholar]
- Li, G.; Ma, W. Progress and prospects of the research on collapsibility of compacted loess in seasonally frozen ground regions. J. Glaciol. Geocryol. 2014, 36, 934r943. (In Chinese) [Google Scholar]
- Wang, Z.J.; Pan, J.Y.; Zhou, P.; Wu, G.H. Influence of freezing and thawing on collapsibility of loess. Chin. J. Undergr. Space Eng. 2016, 12, 1710–1716. (In Chinese) [Google Scholar]
- Zhu, S.N.; Yin, Y.P.; Wang, W.P.; Wei, Y.J.; Shao, H.; Huang, Z.; Zhuang, M.; Shi, A. Mechanism of freeze-thaw loess landslide in Yili River Valley, Xinjiang. Acta Geosci. Sin. 2019, 2, 339–349. (In Chinese) [Google Scholar]
- Huang, Z.; Zhang, D.; Pitilakis, K.; Tsinidis, G.; Huang, H.; Zhang, D.; Argyroudis, S. Resilience assessment of tunnels: Framework and application for tunnels in alluvial deposits exposed to seismic hazard. Soil Dyn. Earthq. Eng. 2022, 162, 107456. [Google Scholar] [CrossRef]
- Zhang, T.; Li, H.; Hu, C.; Zhen, X.; Xu, Z.; Xue, Y. Review and prospect of the effects of freeze-thaw on soil geotechnical properties. Sci. Cold Arid. Reg. 2021, 13, 349–356. [Google Scholar]
- Shi, Q.; Yang, P.; Zhang, Y. Adfreezing strength at the interface between frozen soil and structure: Research status and prospect. J. Glaciol. Geocryol. 2017, 39, 1298–1306. [Google Scholar]
- Wu, Z.W.; Ma, W. Strength and Creep of Frozen Soil; Lanzhou University Press: Lanzhou, China, 1994; pp. 74–78. (In Chinese) [Google Scholar]
- Vyalov, S.S. Rheological Properties and Bearing Capacity of Frozen Soils; USA Cold Regions Research Engineering Laboratory, Translator; USSR Academy Science Press: Moscow, Russia, 1965; p. 74. [Google Scholar]
- Roman, L.T. Effect of salinity on the failure kinetics of permafrost. Soil Mech. Found. Eng. 2007, 44, 182–185. [Google Scholar] [CrossRef]
- Lu, X.; Chen, X.; Chen, X. Risk prevention and control of artificial ground freezing (AGF). Chin. J. Geotech. Eng. 2021, 43, 2308–2314. [Google Scholar]
- Roman, L.T. Frozen Soil Mechanics; Zhang, C.-Q.; Zhang, Z., Translators; Science Press: Beijing, China, 2016. [Google Scholar]
- Roman, L.T.; Krivov, D.N. Prediction of long-term strength for frozen soils of the Bolshezemelnaya Tundra. Soil Mech. Found. Eng. 2009, 46, 180–185. [Google Scholar] [CrossRef]
- Chen, X.; Zhang, Z.; Ma, W.; Li, D.; Du, W.; Yao, X. Study on Applicability of Long-term Strength Prediction Equations for Three Frozen Soils. J. Hunan Univ. 2018, 45, 133–139. [Google Scholar]
- Zhou, H. Changes in Long-Term Strength of Frozen Loess under Freeze-Thaw Cycles. Master’s Thesis, Lanzhou University, Lanzhou, China, 2015. [Google Scholar]
- Zhang, Z.; Roman, L.T.; Ma, W.; Feng, W.; Zhao, S. The freeze-thaw cycles-time analogy method for forecasting long-term frozen soil strength. Measurement 2016, 92, 483–488. [Google Scholar] [CrossRef]
- Petrik, J.; Mikloš, V.; Tompoš, T. The influence of the ball on the Brinell hardness Tester calibration. Mapan–J. Metrol. Soc. India 2008, 23, 197–205. [Google Scholar]
- Ma, S. Experiment Study on Shear Strength of Frozen Soils; Professional Papers on Permafrost Studies of Qinghai-Xizang Plateau; Science Press: Beijing, China, 1983; pp. 106–111. [Google Scholar]
- Chamberlain, E.; Groves, C.; Perham, R. The mechanical behaviour of frozen earth materials under high pressure triaxial test conditions. Geotechnique 1972, 22, 469–483. [Google Scholar] [CrossRef]
- Tsytovich, H.A. Mechanics of Frozen Ground; Zhang, C.Q.; Zhu, Y.L., Translators; Science Press: Beijing, China, 1973. (In Chinese) [Google Scholar]
- Ignatova, O.I.; Bondarenko, G.I.; Trufanov, A.N. Publication of Gost 12248-2010 “Soils. Methods for laboratory determination of strength and deformability characteristics”. Soil Mech. Found. Eng. 2012, 49, 115–118. [Google Scholar] [CrossRef]
- Zaretskii, Y.K. SS Vyalov’s role in the establishment and development of soil rheology. Soil Mech. Found. Eng. 2010, 47, 175–179. [Google Scholar] [CrossRef]
- Xu, H.; Pan, P.; Ning, J.; Zang, H.; Ouyang, X.; Xiang, Y.; Wu, Z.; Guo, R.; Gui, R.; Yang, W. Remote sensing estimation of forest aboveground biomass based on multiple linear regression and neural network model. J. Northeast. For. Univ. 2018, 46, 63–67. [Google Scholar]
- Chamberlain, E.J. Physical changes in clays due to frost action and their effect on engineering structures. In Proceedings of the Frost in Geotechnical Engineering, Saariselka, Finland, 13–15 March 1989. [Google Scholar]
- Fang, J.; Chen, X.; Xu, A.; Zhang, Z. Experimental study of the influence of freezing-thawing cycles on physical and mechanical properties of Qinghai-Tibet red clay. J. Glaciol. Geocryol. 2018, 40, 62–69. [Google Scholar]
- Xu, J.; Wang, Z.; Ren, J.; Yuan, J. Experimental research on permeability of undisturbed loess during the freeze-thaw process. J. Hydraul. Eng. 2016, 47, 1208–1217. [Google Scholar]
Disclaimer/Publisher’s Note: The statements, opinions and data contained in all publications are solely those of the individual author(s) and contributor(s) and not of MDPI and/or the editor(s). MDPI and/or the editor(s) disclaim responsibility for any injury to people or property resulting from any ideas, methods, instructions or products referred to in the content. |
© 2023 by the authors. Licensee MDPI, Basel, Switzerland. This article is an open access article distributed under the terms and conditions of the Creative Commons Attribution (CC BY) license (https://creativecommons.org/licenses/by/4.0/).