Article

The Environmental Impacts of Bar Soap Production: Uncovering Sustainability Risks with LCA Analysis

1
Department of Mechanical Engineering, Rao Birender Singh State Institute of Engineering and Technology, Zainabad, Rewari 23411, India
2
Department of Mechanical Engineering, Malaviya National Institute of Technology Jaipur, Jaipur 302017, India
3
Department of Mechanical Engineering, Amity School of Engineering and Technology, Amity University, Noida 201313, India
4
Sustainable Manufacturing Systems Centre, School of Aerospace, Transport & Manufacturing, Cranfield University, Cranfield MK43 0AL, UK
*
Authors to whom correspondence should be addressed.
Sustainability 2023, 15(12), 9287; https://doi.org/10.3390/su15129287
Submission received: 3 April 2023 / Revised: 4 June 2023 / Accepted: 5 June 2023 / Published: 8 June 2023

Abstract

:
Washing bar soap is widely used and vital in everyday life, especially in developing countries where demand is increasing due to population expansion. However, the production and use of washing bar soap have negative impacts on the environment, and the sustainability of soap packaging is also a concern. This research focuses on measuring the environmental effects of the production phase of washing bar soap while accounting for the differences in soap consumption across brands and consumer behavior during the use phase. The research aims to quantify the ecological burden caused by the production and use of 1 kg of bar soap through a Life Cycle Assessment (LCA) that follows ISO 14040 and 14044 standards. This study also addresses the resource-intensive aspect of soap packaging, particularly plastic packaging, and offers sustainability solutions through circular economy principles. GaBi v8.0 software is used to evaluate various environmental performance indicators, and the results show that eutrophication has the highest burden on the environment compared to other categories. This study highlights the importance of consumer behavior in reducing the environmental impact of washing bar soap, as the use stage of washing bar soap has the most significant impact in most categories.

1. Introduction

Washing bar soap is a commonly used consumer product and an integral part of daily life. With the increase in population and its impact on the supply chain of fast-moving consumer goods, the demand for washing bar soap has seen a significant rise, particularly in developing nations. In India, handwashing continues to be the most common method for washing clothes, accounting for a substantial 74% of laundry-care sales [1]. However, the usage of bar soap poses a challenge in regions with water scarcity, such as the Indian state of Rajasthan, as it is highly water-intensive [2].
While a previous study assessed the environmental impact of washing machines, bar soaps are still predominantly used in households in heavily populated countries such as India [3]. Moreover, the laundry process heavily relies on consumer behavior and the type of fabric. The soap market in India alone was estimated at USD 2.9 billion in FY2020 and is projected to surpass USD 4.4 billion by FY2026, primarily driven by the emphasis on consistent hygiene and the growing spending power of customers [4]. The outbreak of the COVID-19 pandemic has further escalated the intensity of washing and prompted government agencies to promote hygiene measures [5]. The global soap market is also expected to witness substantial growth, with Asian countries leading the market, followed by Europe and North America, projecting a value of USD 40 billion by 2025 [6,7].
However, despite the growing demand and significance of washing bar soap, there is currently a dearth of available studies or databases on its production in India. Therefore, it becomes imperative to evaluate the sustainability of washing bar soap production in the Indian context and suggest measures for improvement. To address this critical gap, it is essential to create Life Cycle Inventory (LCI) datasets and apply the Life Cycle Assessment (LCA) methodology in India. This study aims to assess the environmental impacts of the entire manufacturing value chain of bar soap, including its use phase, in accordance with the ISO 14040:2006 and ISO 14044:2006 standards [8,9]. The GaBi version 8.0 software will be employed to comprehensively evaluate environmental performance indicators, such as primary energy demand, global warming potential, blue water consumption, human toxicity, air emissions, effluent discharge, and waste generation. This study seeks to identify and evaluate the environmental impacts of bar soap throughout its life cycle, encompassing the procurement of raw materials, production, packaging, distribution, use, and disposal stages. Furthermore, this study aims to highlight and discuss the stages with the most significant environmental impacts.
The estimation of environmental impacts in soap bar/detergent production exhibits considerable variability and uncertainty. Variability arises from factors such as agricultural and bio-based input systems, which are naturally susceptible to local climate conditions. Additionally, uncertainties in impact estimates can be attributed to inventory factors, processing technologies, geographical factors, scale, methodological aspects, modeling approaches, analysis software, function units, locations, assessment impact categories, and system boundaries. Such variability and uncertainty make impact estimation highly variable. A comprehensive understanding of this variability is exemplified by Table 1, which presents the latest research works in the field of LCA of soap bar/detergent and reflects the wide range of results obtained [9].
Sustainable manufacturing (SM) has emerged as a marketing strategy aimed at reducing pollution and simultaneously meeting consumer needs. SM involves the creation of environmentally friendly goods and services through processes and frameworks that safeguard the safety and well-being of all stakeholders, preserve ecosystems, and minimize the adverse effects of the manufacturing industry on the planet [14]. Sustainability poses one of the most significant challenges as the world’s needs continue to expand. Consequently, it has garnered interest from various sectors and academic disciplines, including SM, sustainable additive manufacturing, LCA, sustainable waste management, green technology, Industry 4.0, carbon footprint, sustainable machining, and green fluids [15,16,17,18,19,20,21,22].
The manufacturing industry faces intense pressure due to the rising global population, increasing consumer expectations, and the need to maintain a high standard of living. Manufacturing operations consume substantial amounts of natural resources and have a significant impact on the environment [23]. To mitigate harm, authorities have imposed limits on hazardous emissions. Furthermore, as more people become aware of eco-friendly alternatives and seek products with a competitive edge in the market, the production of environmentally friendly goods is on the rise [24,25].
The period of technological civilization has been reached or approached by the majority of nations worldwide, leading to immense material wealth, rapid economic and social progress, and unprecedented productivity gains. However, this industrialization period has also resulted in significant greenhouse gas emissions, posing a serious threat to environmental diversity and global environmental degradation [26]. Sustainable development has faced challenges during this industrialization period due to the rapid expansion of economic activity and resource consumption. Numerous international organizations have vigorously urged nations to take immediate action to minimize the release of carbon dioxide and greenhouse gases, recognizing the threats these emissions pose to life’s continued existence and the detrimental effects they can have on humankind [27].
In India, being a highly cost-sensitive market, local companies offering inexpensive soaps dominate a significant market share. According to a report published in March 2017 by The Economic Times, a leading Indian newspaper, big FMCG brands such as Hindustan Unilever, Procter and Gamble, and Nirma have lost considerable market share to local players since 2014 [1]. This trend raises concerns, as companies that prioritize affordability may prioritize profitability over sustainability [28]. Limited literature is available that highlights the environmental impacts throughout the life cycle of soap, including its chemical constituents and packaging.
Packaging design modifications have been found to reduce the environmental impact of products [29]. However, there is a lack of literature on the factors influencing retailers’ efforts to improve product packaging. The study by Gustavo, Jr. et al. [29] indicates that financial benefits for supermarkets and suppliers serve as the primary motivators for packaging redesign, resulting in ecological benefits as well. Furthermore, Giagnorio et al. [11] observed that detergent manufacture significantly impacts the environment, particularly in relation to other impact categories. The contribution of detergents to the overall impacts of laundry processes is crucial, and addressing detergent use and release is vital for reducing the ecological burdens of the laundering industry. The addition of membrane arrangements to current laundry systems shows promising environmental advancements, with potential reductions of up to 50% in total impacts. Therefore, assessing the environmental impacts of bar soap and considering the use of renewable energy sources, such as biofuels, in water-intensive processes are essential sustainability considerations [30].
According to Patel et al. [31], a partial Life Cycle Inventory (LCI) revealed that in 1996, fossil CO2 emissions from significant surfactant production in Germany accounted for 1.5 million tonnes, only a small percentage of the total chemical industry emissions of 125 million tonnes, including feedstock energy equivalents. However, other research suggests that the cleaning process contributes to 60–80% of a surfactant’s overall CO2 emissions during its life cycle. Lowering washing temperatures in Germany alone could reduce emissions by up to 40% during the usage period, while energy savings could potentially decrease CO2 emissions by 25–30% throughout the product’s life cycle. Such potential reductions in emissions are more significant than the saving potential resulting from completely replacing petroleum-based chemical surfactants, which is estimated to be approximately 20%. Furthermore, Mohanraj et al. [32] studied the relationship between the washing temperature and the overall energy used during the complete washing process. They concluded that lower washing temperatures reduced energy consumption while maintaining efficient cleaning performance.
In conclusion, the life cycle of bar soap, from its production to its use and disposal, has significant environmental impacts. Assessing and understanding these impacts is crucial for developing strategies and practices that promote sustainable soap manufacturing. This study aims to fill the research gap by conducting a comprehensive LCA of bar soap in the Indian context, evaluating its environmental performance throughout the entire value chain. The findings will contribute to the knowledge base on sustainable manufacturing practices, enabling soap manufacturers to make informed decisions and take necessary measures to minimize environmental harm. The next section will present the methodology used for conducting the life cycle assessment of bar soap production and its associated environmental impacts.

2. Data Collection and Assumptions

The research focused on soap produced by a well-known soap manufacturer based in Jaipur, Rajasthan, which requested anonymity. The soap is sold as a 170 g bar or as a pack of six 1-kg bars wrapped in polythene packs. The primary ingredient is a sodium salt derived from vegetable palm oil, with water, sodium silicate, sodium chloride, a dye for color, and fragrance as other ingredients.

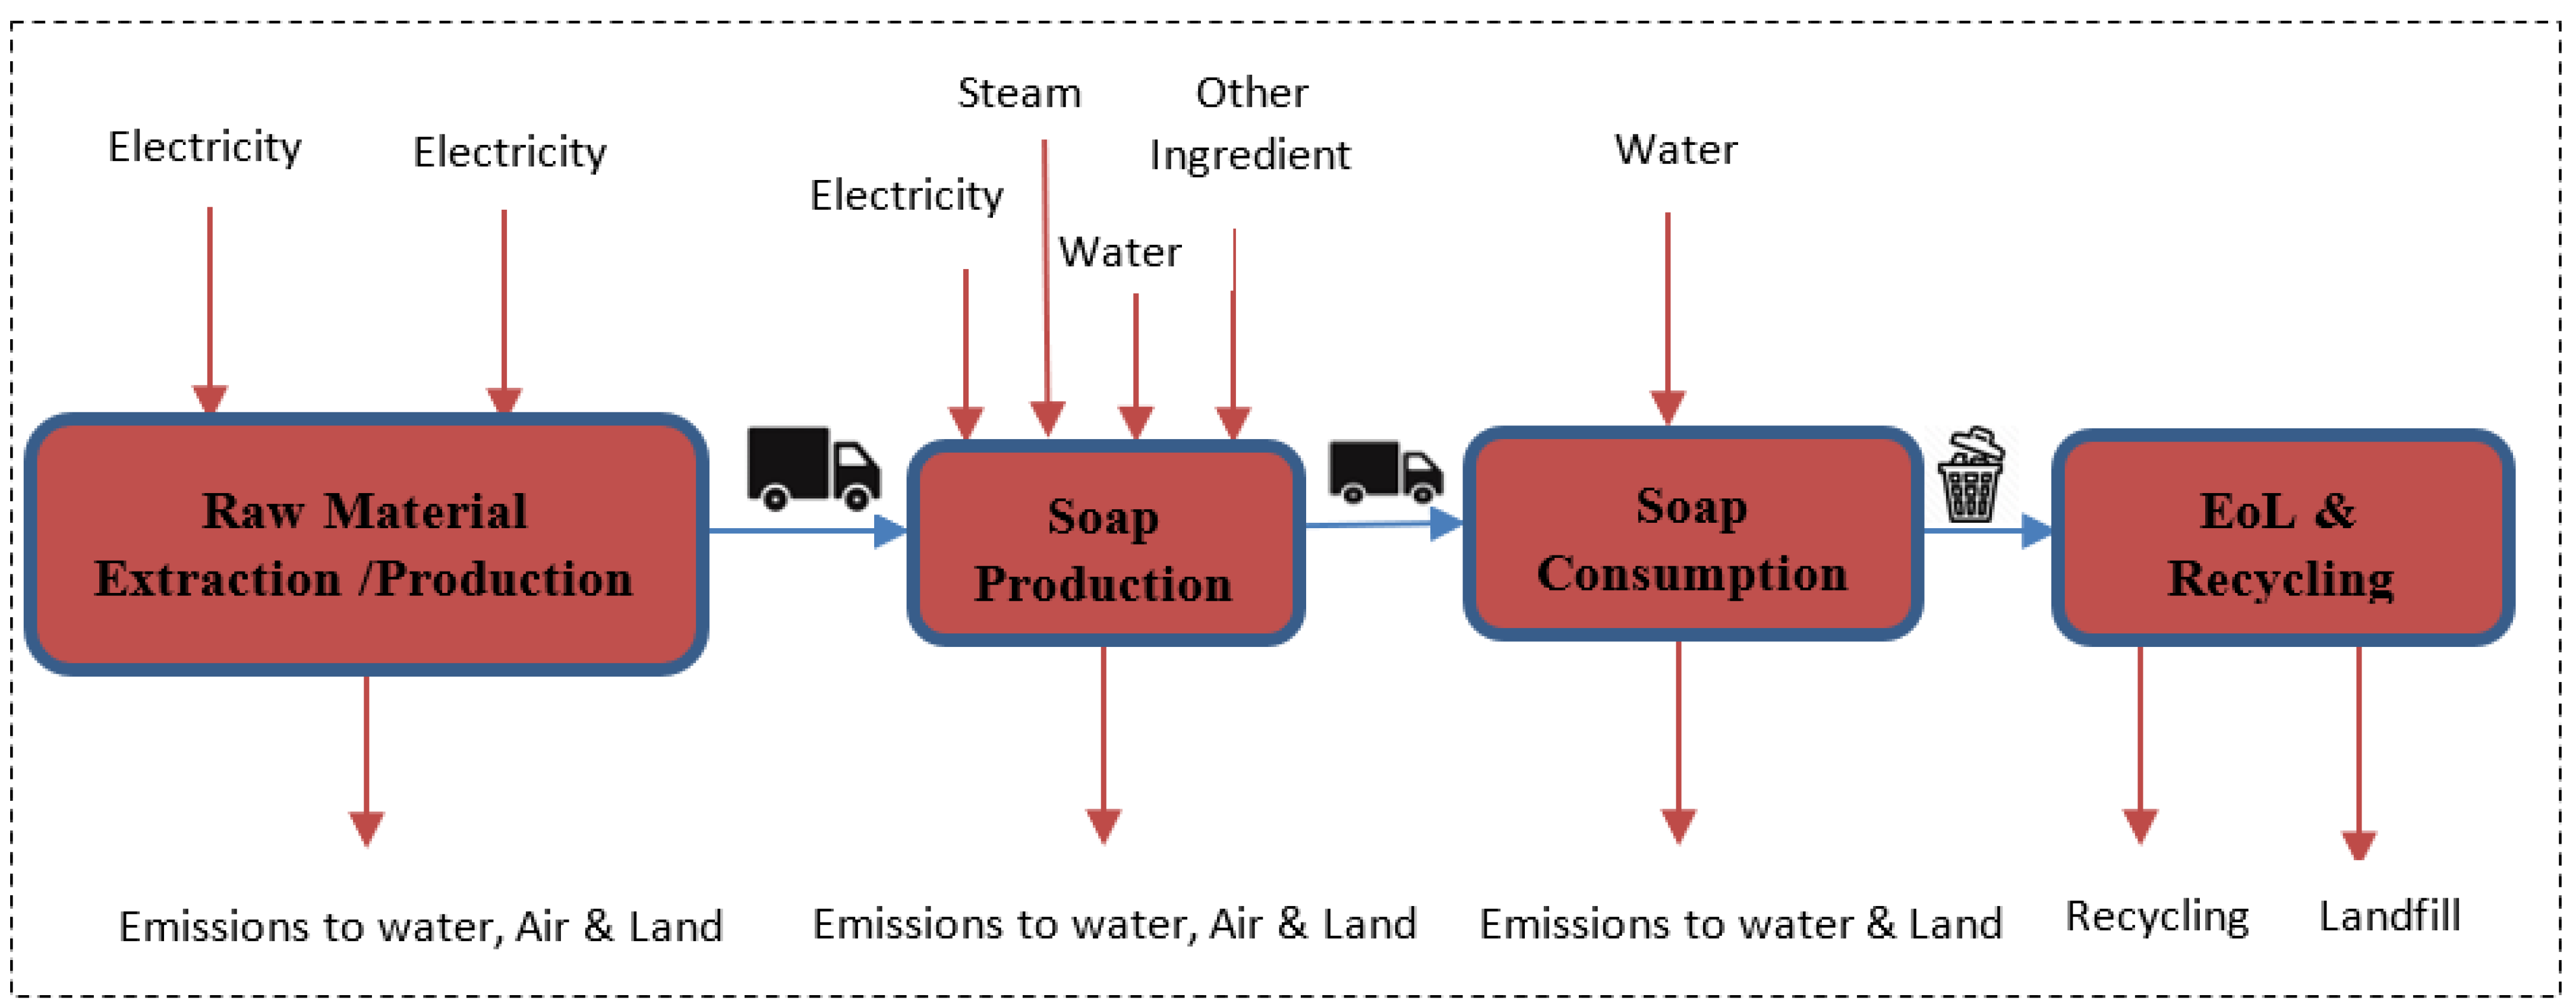
2.1. Product Life Cycle

Various environmental indicators related to soap were quantified by using a product LCI obtained from the soap manufacturer. The functional unit used for evaluation was one kilogram of soap, and the analysis focused on the different stages of the product’s life cycle, which are presented in Table 2.

2.2. Saponification

In the soap production or the saponification process, esters of fatty acids are hydrolyzed, and the resulting soap is present in a colloidal form. It is precipitated by the addition of normal salt, i.e., sodium chloride. Only soaps made of sodium and potassium salts are soluble in water and are therefore used for cleaning purposes. The data obtained from the soap manufacturing industry were checked and balanced using the theory of saponification reaction [32].

2.3. Manufacturing and Distribution

The soap bar is produced in multiple stages, as explained in subsequent sections. The distribution of manufactured soap is approximately within a 200 km radius from the manufacturing plant. The manufacturing by-product, crude glycerol, is sent for refining and is not considered within the system boundary of the analysis.

2.4. Product Use and Disposal

Eventually, the soap is consumed by consumers for laundry cleaning. This is an intense water-consuming process, and the water is usually provided by a local supplier. The grey water produced after laundry cleaning is typically dumped either in landfills or nearby water bodies through gutters. The polyethylene packaging used for wrapping bar soap is generally discarded and goes to the landfill. To determine the amount of soap consumed, a sample population was surveyed, and it was found that, on average, 5.67 gm of soap is consumed per kg of cloth, and water consumption is equivalent to 0.9 m3 for a complete month. However, these data are sample values, and in reality they may differ, as the washing process is entirely dependent on consumers’ behavior. Furthermore, since the grey water contents are unknown, the data fed into the software use the analysis conducted by Mohamed et al. [33].

3. Methodology

The LCA of the bar soap is carried out as per the ISO 14040/44, 2006 [8,9] with the help of mid-point CML methodology. In this study, a functional unit is one kilogram of a washing bar soap during production. In the case of use phase impact assessment, the functional unit changes, and it is calculated as the amount of soap required to completely wash a given weight of stained clothes. The methodology used for impact calculation is CML 2016. As LCA is a scientific methodology standardized for the systematic analysis of mass and energy flows associated with the life cycle of a product, service, or manufacturing process system, the methodology used in this study follows the ISO 14040, 2006 [8] framework of LCA. To conduct the analysis, a boundary or perimeter was established, and is illustrated in Figure 1.
The system boundary and geographical scope include the production/extraction of raw materials for the bar soap, procurement of raw materials, production of washing bar soaps, packaging of bar soaps, distribution of bar soaps in the market, use phase in private households (washing process), end-of-life of soap packets, and background processes such as freshwater and electricity supply. Exclusions are the infrastructure and establishments of the production facility, human labor, in-plant transportation of materials, delivery of the product to the consumer, recovery of used products including energy recovery, and environmental impacts of wastewater treatment.

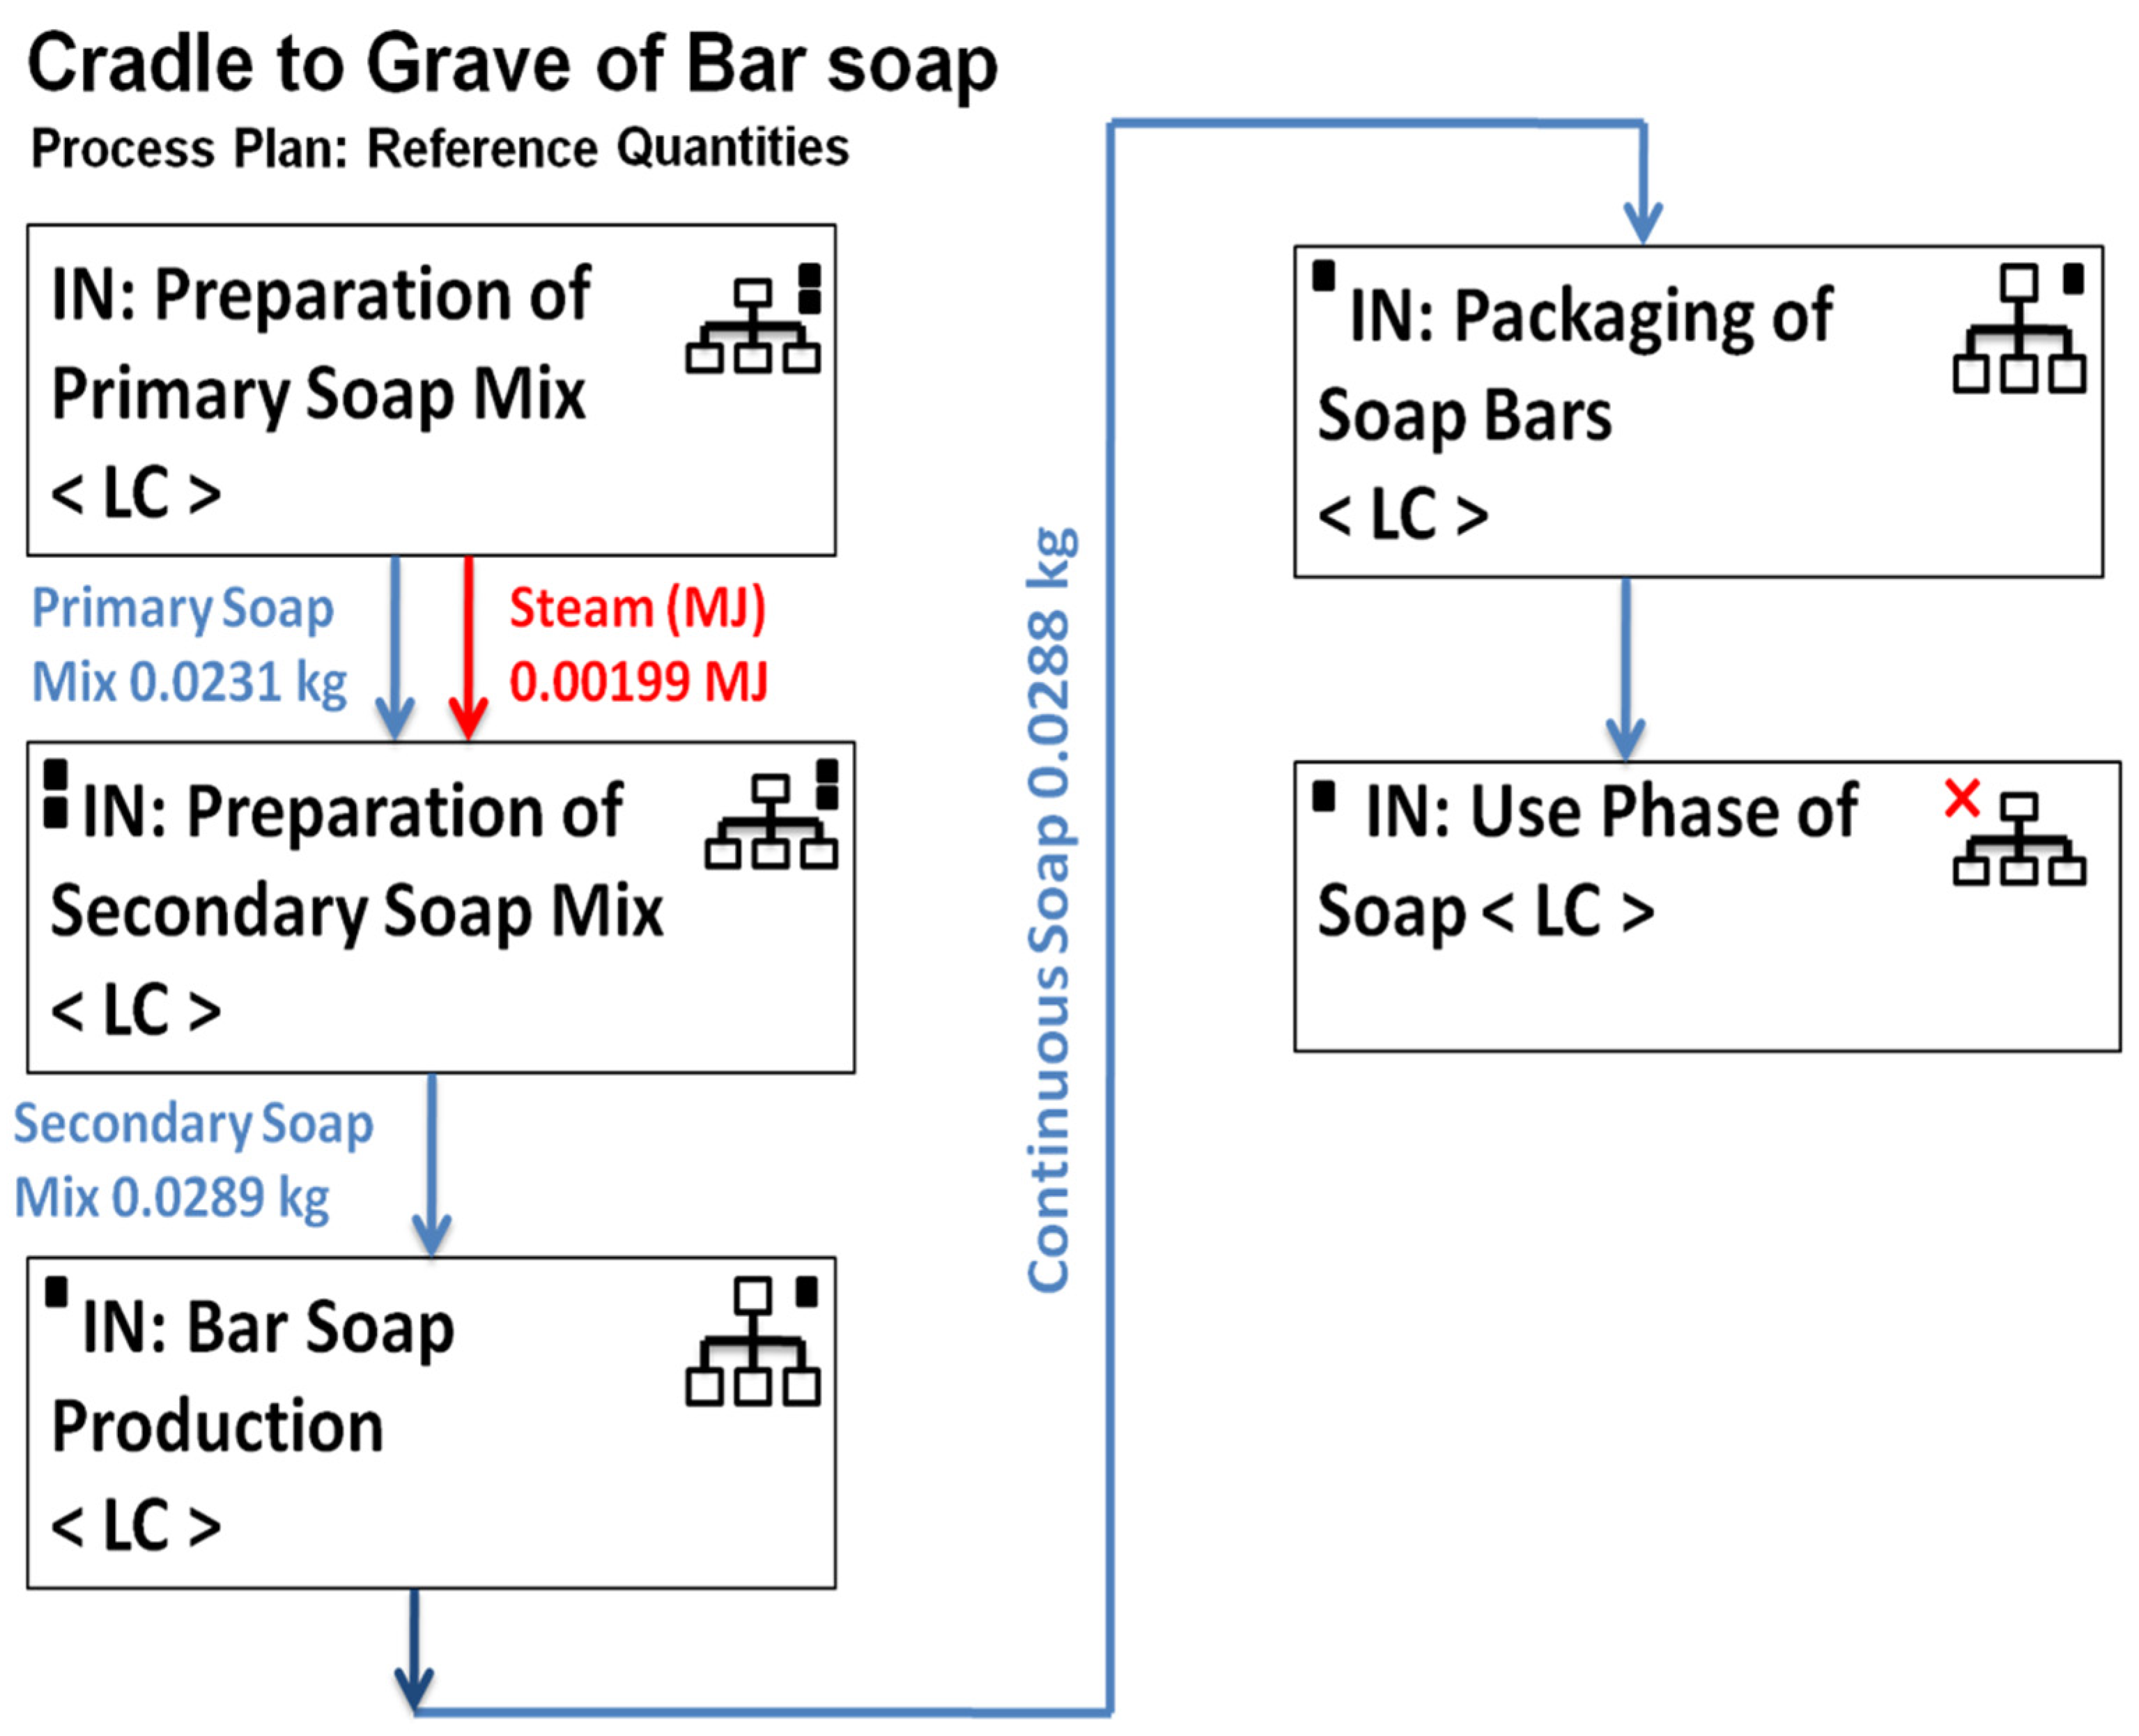
3.1. Manufacturing Process

Soap production involves various stages of processes. In this study, soap is manufactured in four stages: preparation of primary soap mix, preparation of secondary soap mix, continuous soap production, and packing of produced bar soaps.
In the primary soap mix production stage, caustic soda, also known as lye, at 50% concentration v/v is mixed with blended acid oil and fats, which is a by-product of the vegetable oil refining process [34]. The mixture is regularly blended with the addition of water to achieve the desired consistency. Then the mixture is heated by a stream of hot steam at 150 °C passing through the heat exchanger, partially processing the soap mixture for the next stage of production.
After 24 h of curing, this mix is added to Sodium Silicate, which gives firmness to the soap; common salt, which separates out the glycerol from the mix; water, to give the desired moisture level and flowability during further processes; fragrance; and dyes to obtain the desired trade color. The precipitated glycerol (after adding the common salt) is crude in nature, and pure glycerin is sent for extraction.
This mixture is dropped directly over a floater (a cylindrical rotating drum inside which water circulates, hence acting as a heat exchanger). The floater is accompanied by a knife-edge plate that helps spread the mixture over the floater, reducing the temperature. Further, it is passed through a die, which makes the noodles that are then passed over a three-roll mill, which makes thin sheets of soap. The rolled soap is then passed through a die, making a continuous soap ready to be cut into pieces and packaged.

3.2. Life Cycle Inventory

The complete LCI is presented in Table 2. Initially, a thorough understanding of the saponification process was obtained. Subsequently, a questionnaire was prepared to collect data for each stage/process of production, in accordance with the established system boundary. The questionnaire for data collection was reviewed and revised to ensure that it covered all necessary inputs and outputs, and that data positions were accurately interpreted and reported in a consistent and complete manner. Once the data were collected in the questionnaire, essential checks were conducted on the mass and energy balances. In instances where information was incomplete, estimations were made based on data from the literature, and this was incorporated into the dataset.

3.3. Modeling on Software

To gather information for this study, a questionnaire was prepared and given to the soap manufacturing plant due to the lack of information available in the literature. The questionnaire was designed to collect input and output data, and only material flows greater than 1% of the total mass flow or greater than 1% of the total primary energy input were included in the system and model used to calculate elementary flows. The quality of the data used in this study is crucial for achieving the intended application and ensuring the reliability of the study. The LCI data quality for modeling the life cycle stages of washing bar soaps was evaluated based on ISO 14044 [9]. Primary data were used where possible, and the GaBi version 8 professional database was used for upstream LCA data. A model was then prepared using the GaBi software based on the LCI, and the cradle-to-grave LCA model of washing bar soap is illustrated in Figure 2.

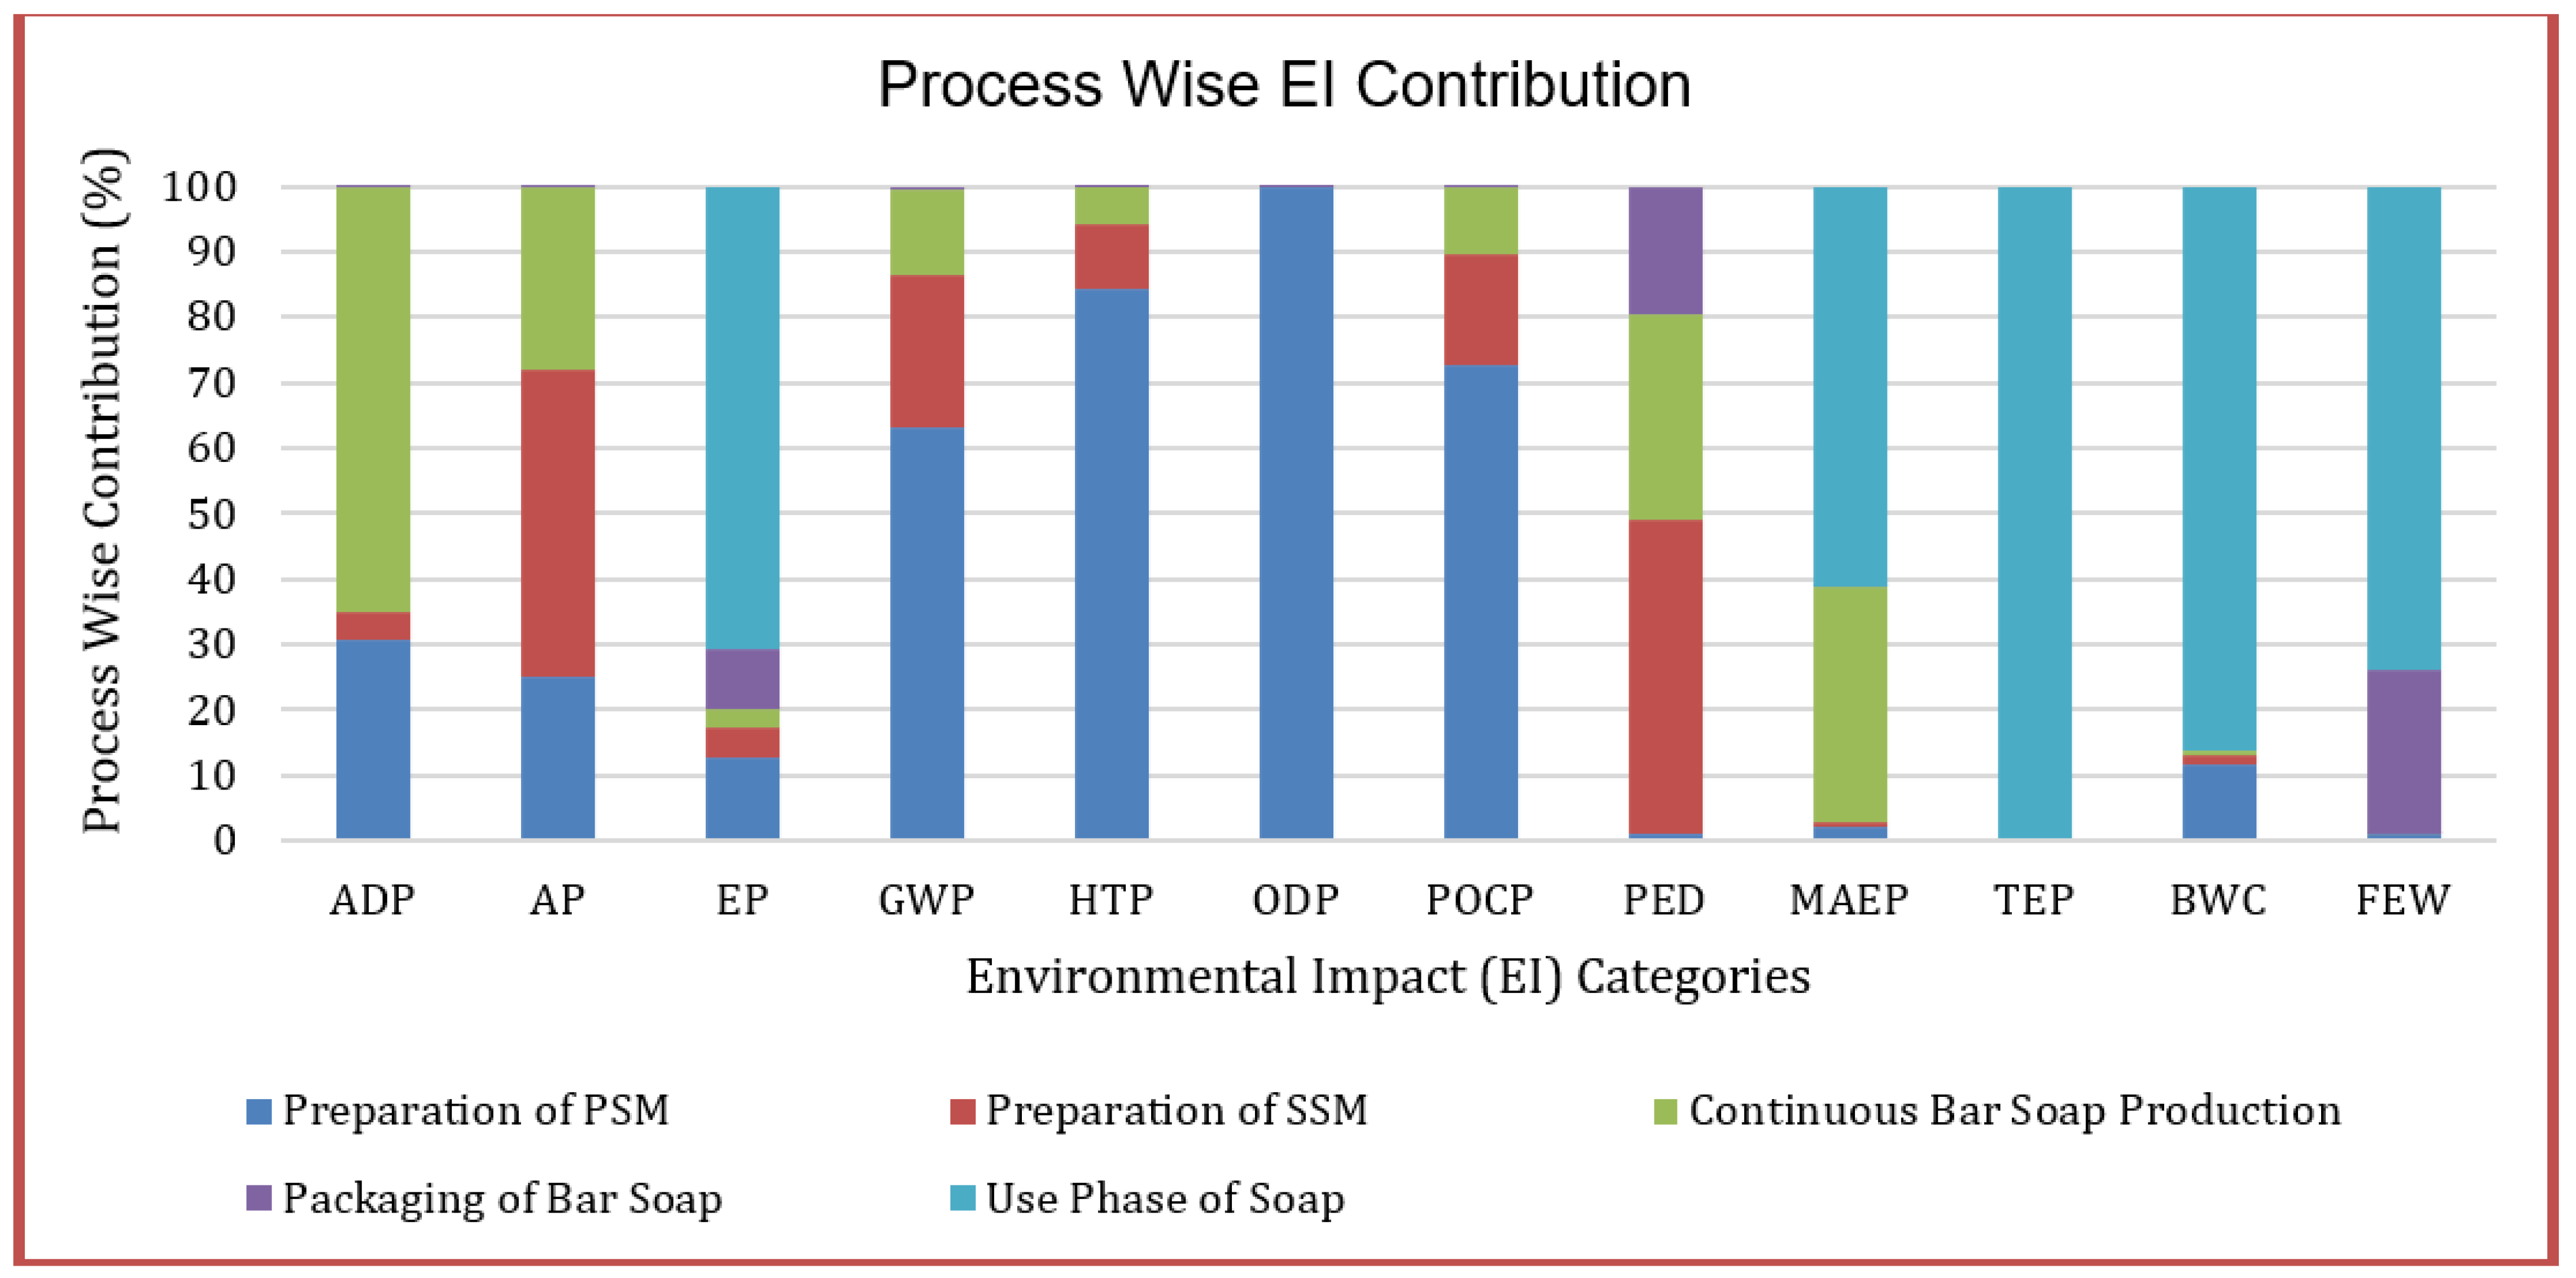
4. Results and Discussion

Table 3 shows the life cycle environmental impacts of washing bar soap production, packaging, and use phases based on the results obtained from GaBi v8.0. The chart is followed by a detailed discussion highlighting hotspots. It is important to note that the impact values shown in Table 3 are for 1 kg of soap production and consumption. Figure 3 illustrates the contribution of each subsystem to one kg of washing bar soap production. It can be observed that subsystems such as preparation of PSM and preparation of SSM have the most significant impact on environmental indicators such as ODP, TEP, HTP, BWC, EP, FE, and GWP.

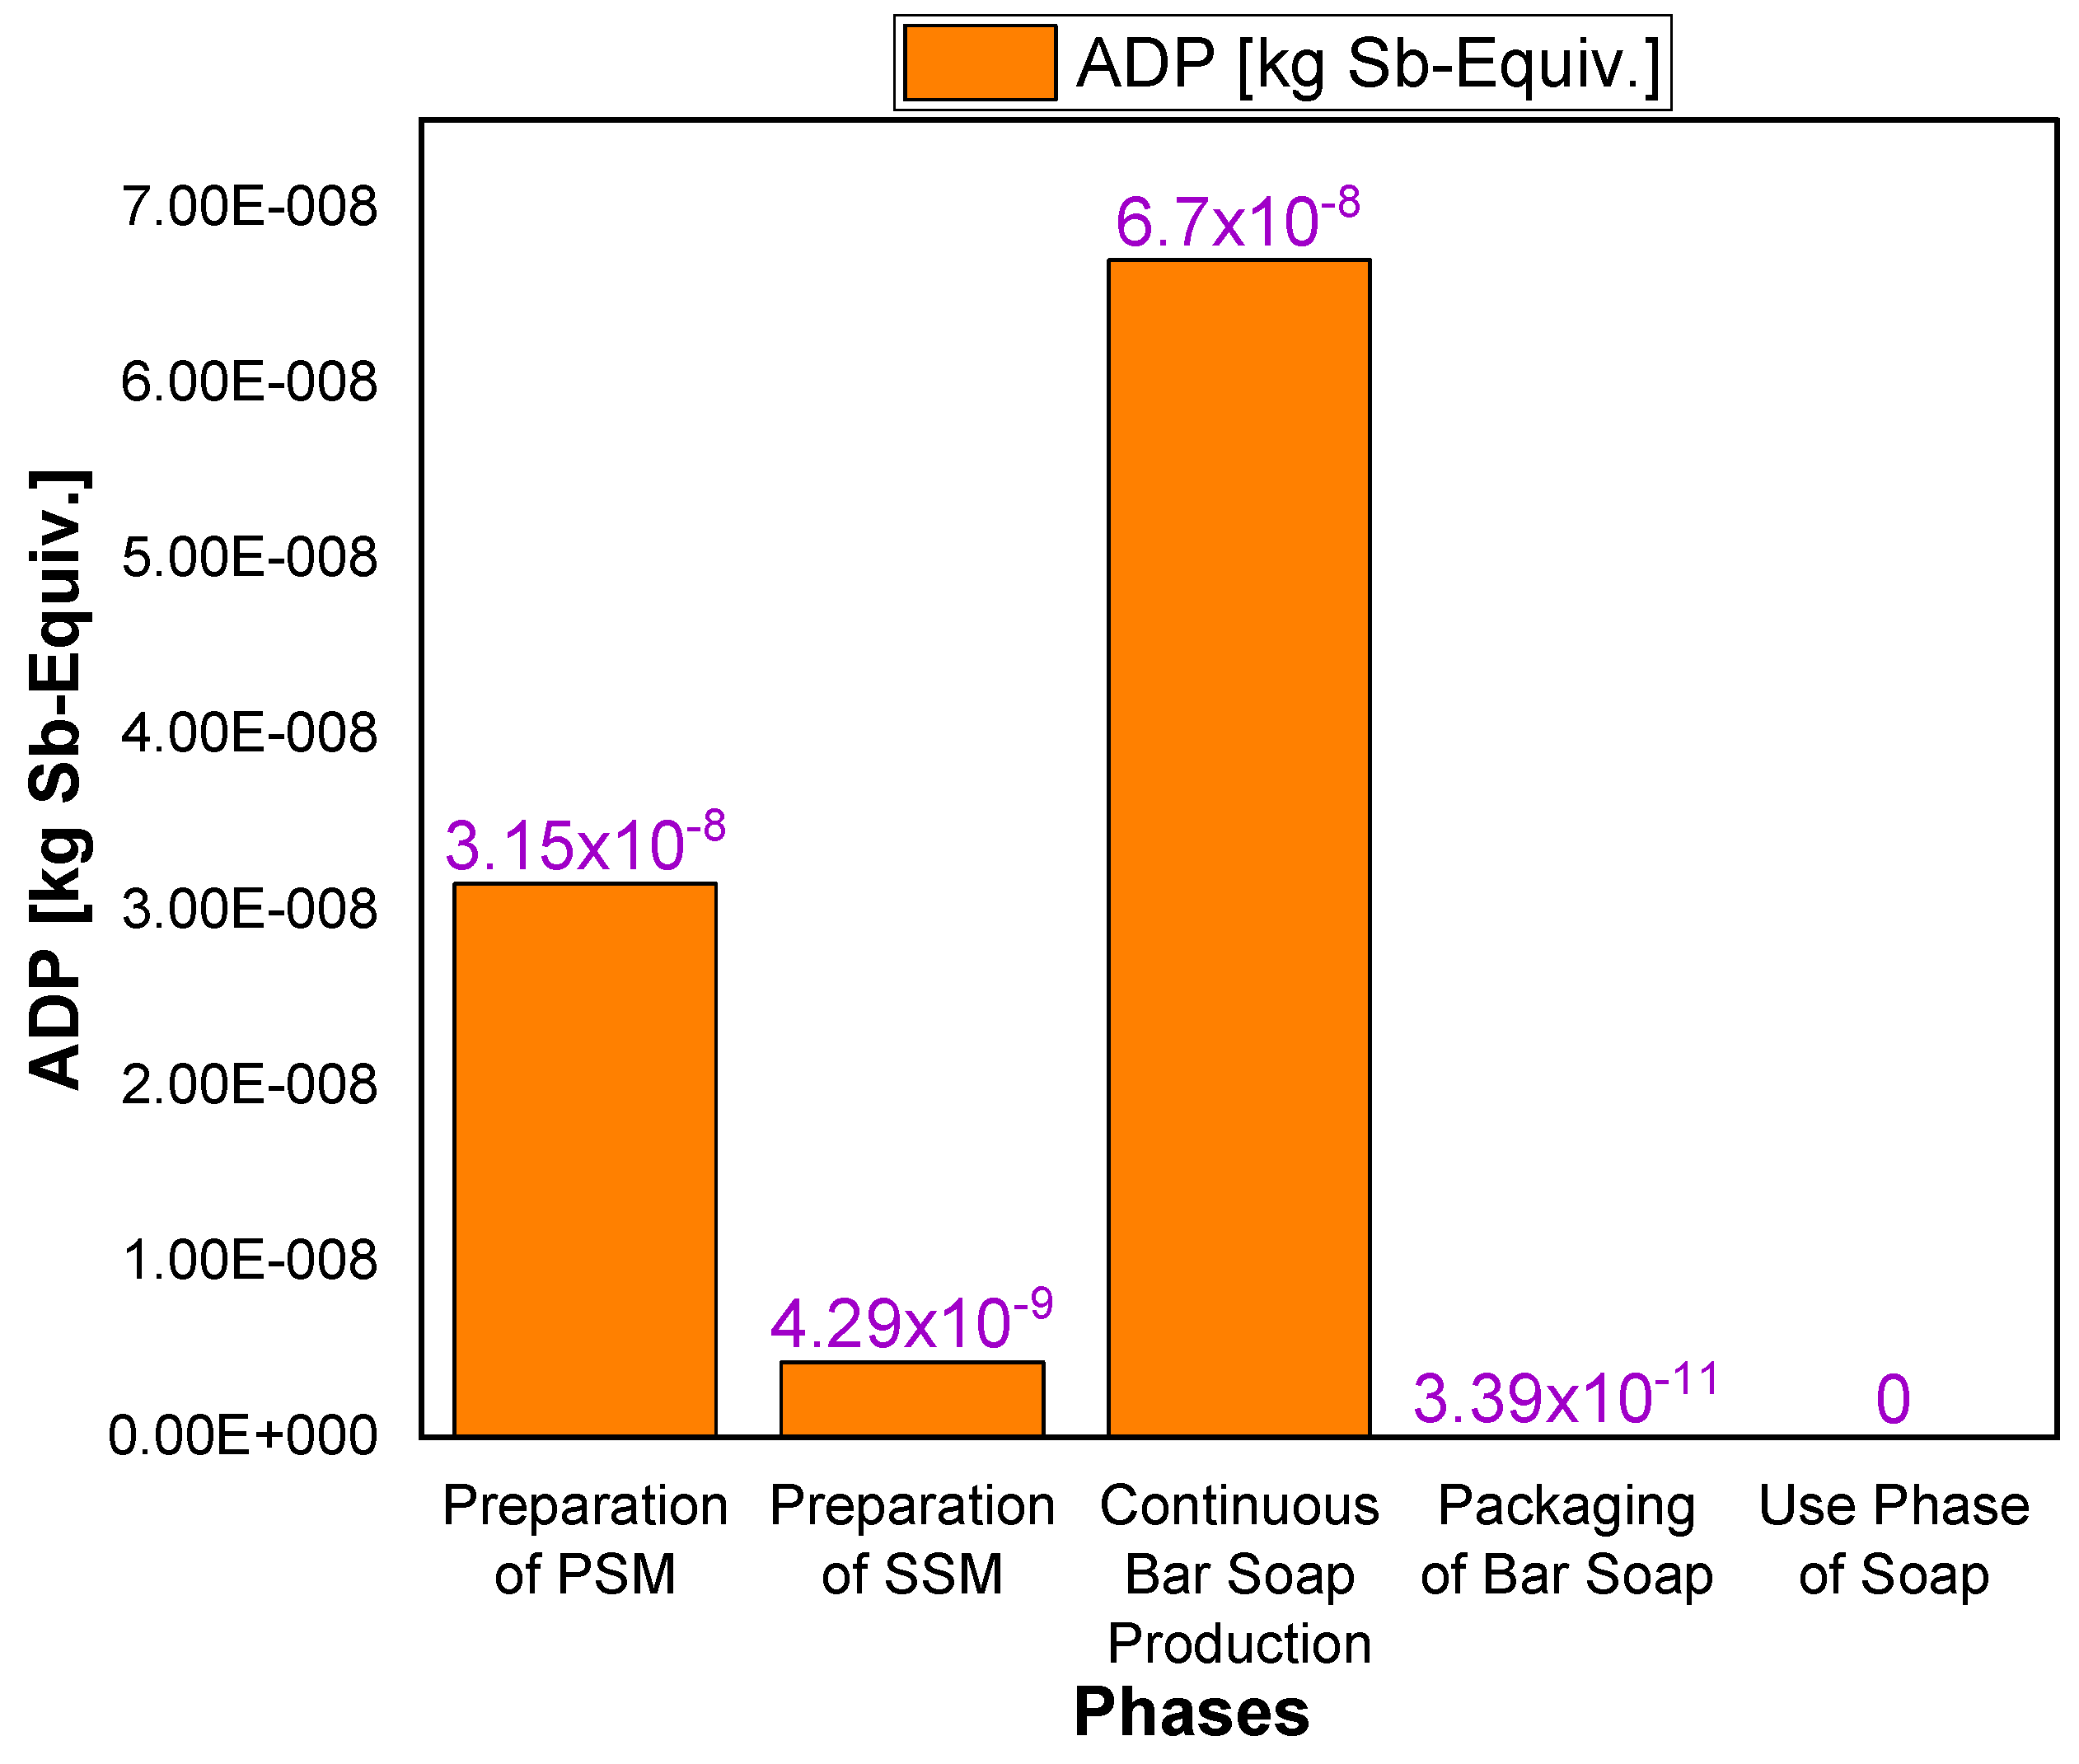
4.1. Abiotic Depletion Potential

The method used to estimate abiotic resource usage includes the extraction of metals, scarce minerals, and fossil fuels. The total impact of the antimony equivalent (Sb-Eq) is 10.28 × 10⁻⁸ kg, with the majority contributed during the continuous bar soap production phase, as shown in Table 3. In contrast, the packaging phase has the least impact on ADP, with a value of 3.39 × 10⁻¹¹, which is a thousand times smaller than that of continuous bar soap production, as illustrated in Figure 4. The use phase does not have an impact on ADP as the use of soap mainly leads to eutrophication in the waterbody.

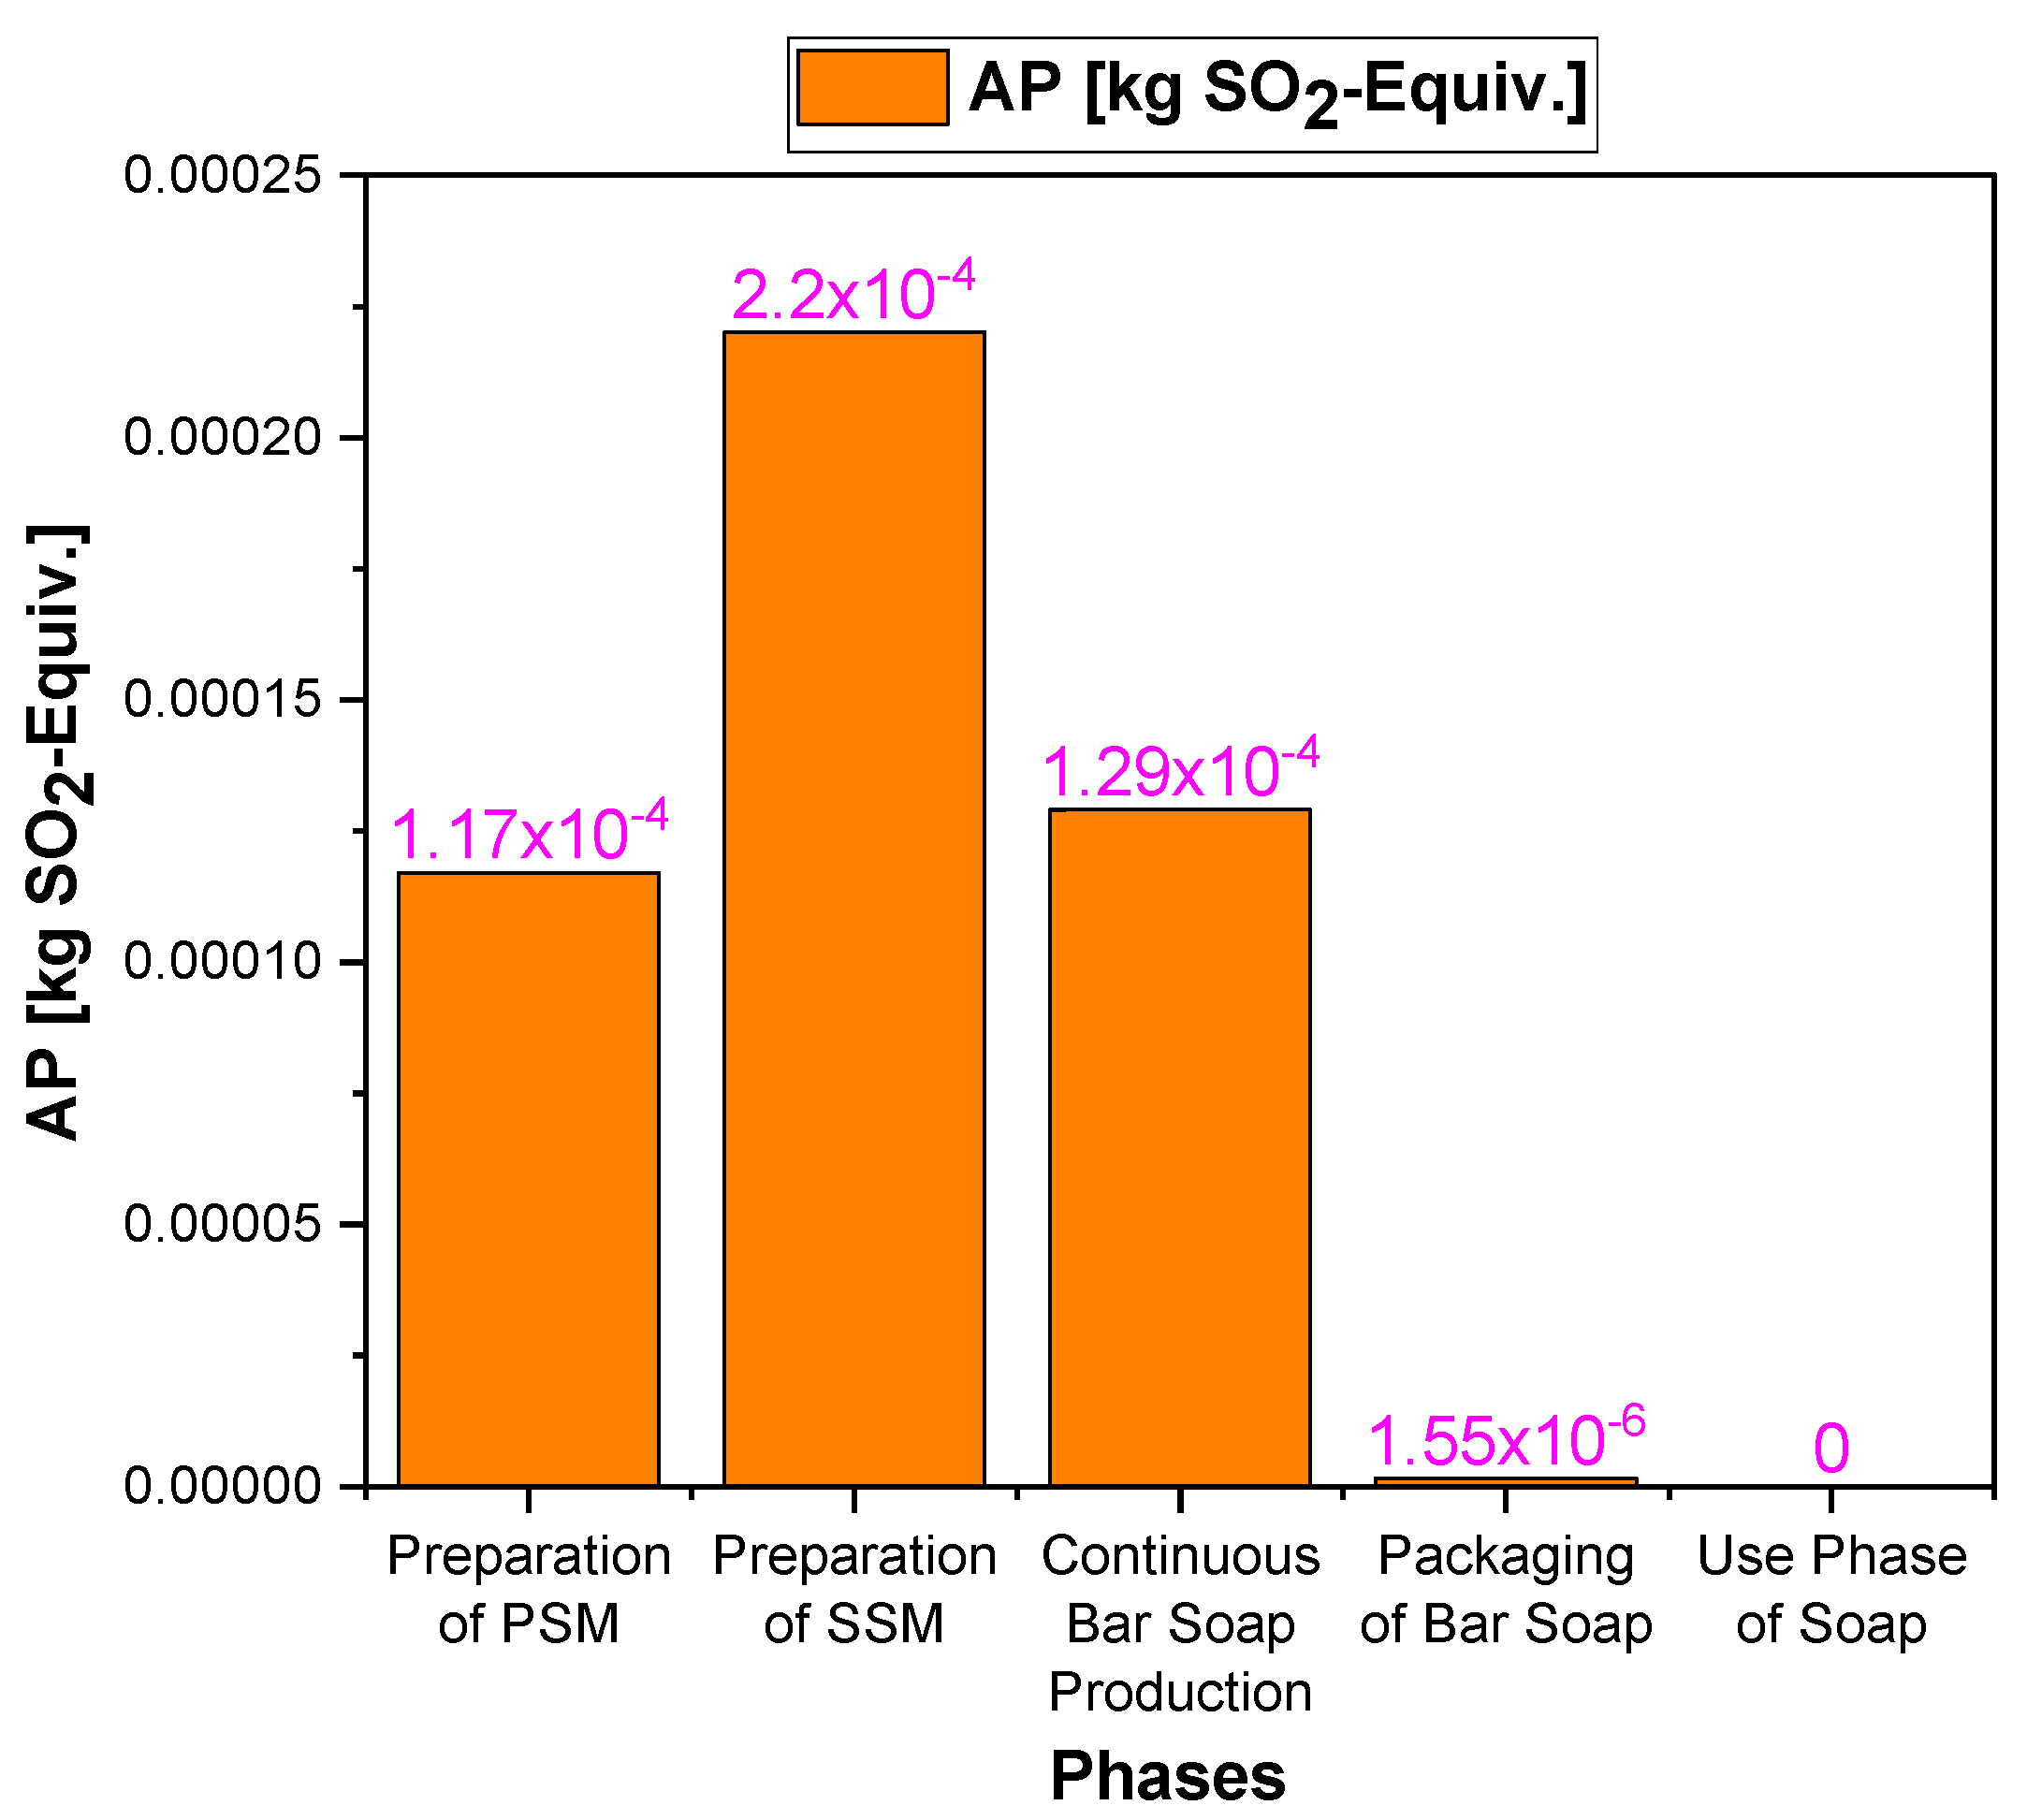
4.2. Acidification Potential

AP refers to the release of acidic gases or emissions that can react with moisture in the air, soil, or water, changing the pH of natural ecosystems and man-made environments. The main sources of acidifying agents are agriculture and fossil fuel combustion, with SO2, NOx, and ammonia being the primary agents. Acidification potential is determined by the contributions of SO2, NOx, HCl, NH3, and HF to the formation of H+ ions, and it is measured in kg SO2 equivalents. The value for this impact category is 4.68 × 10⁻⁴-g SO2-Equiv, with the major contribution coming from the preparation of the secondary soap phase (~47%) and continuous bar production process (27.56%). Again, no measurable effect seems to be generated during the use phase. Figure 5 shows the acidification potential (AP) in each subsystem.

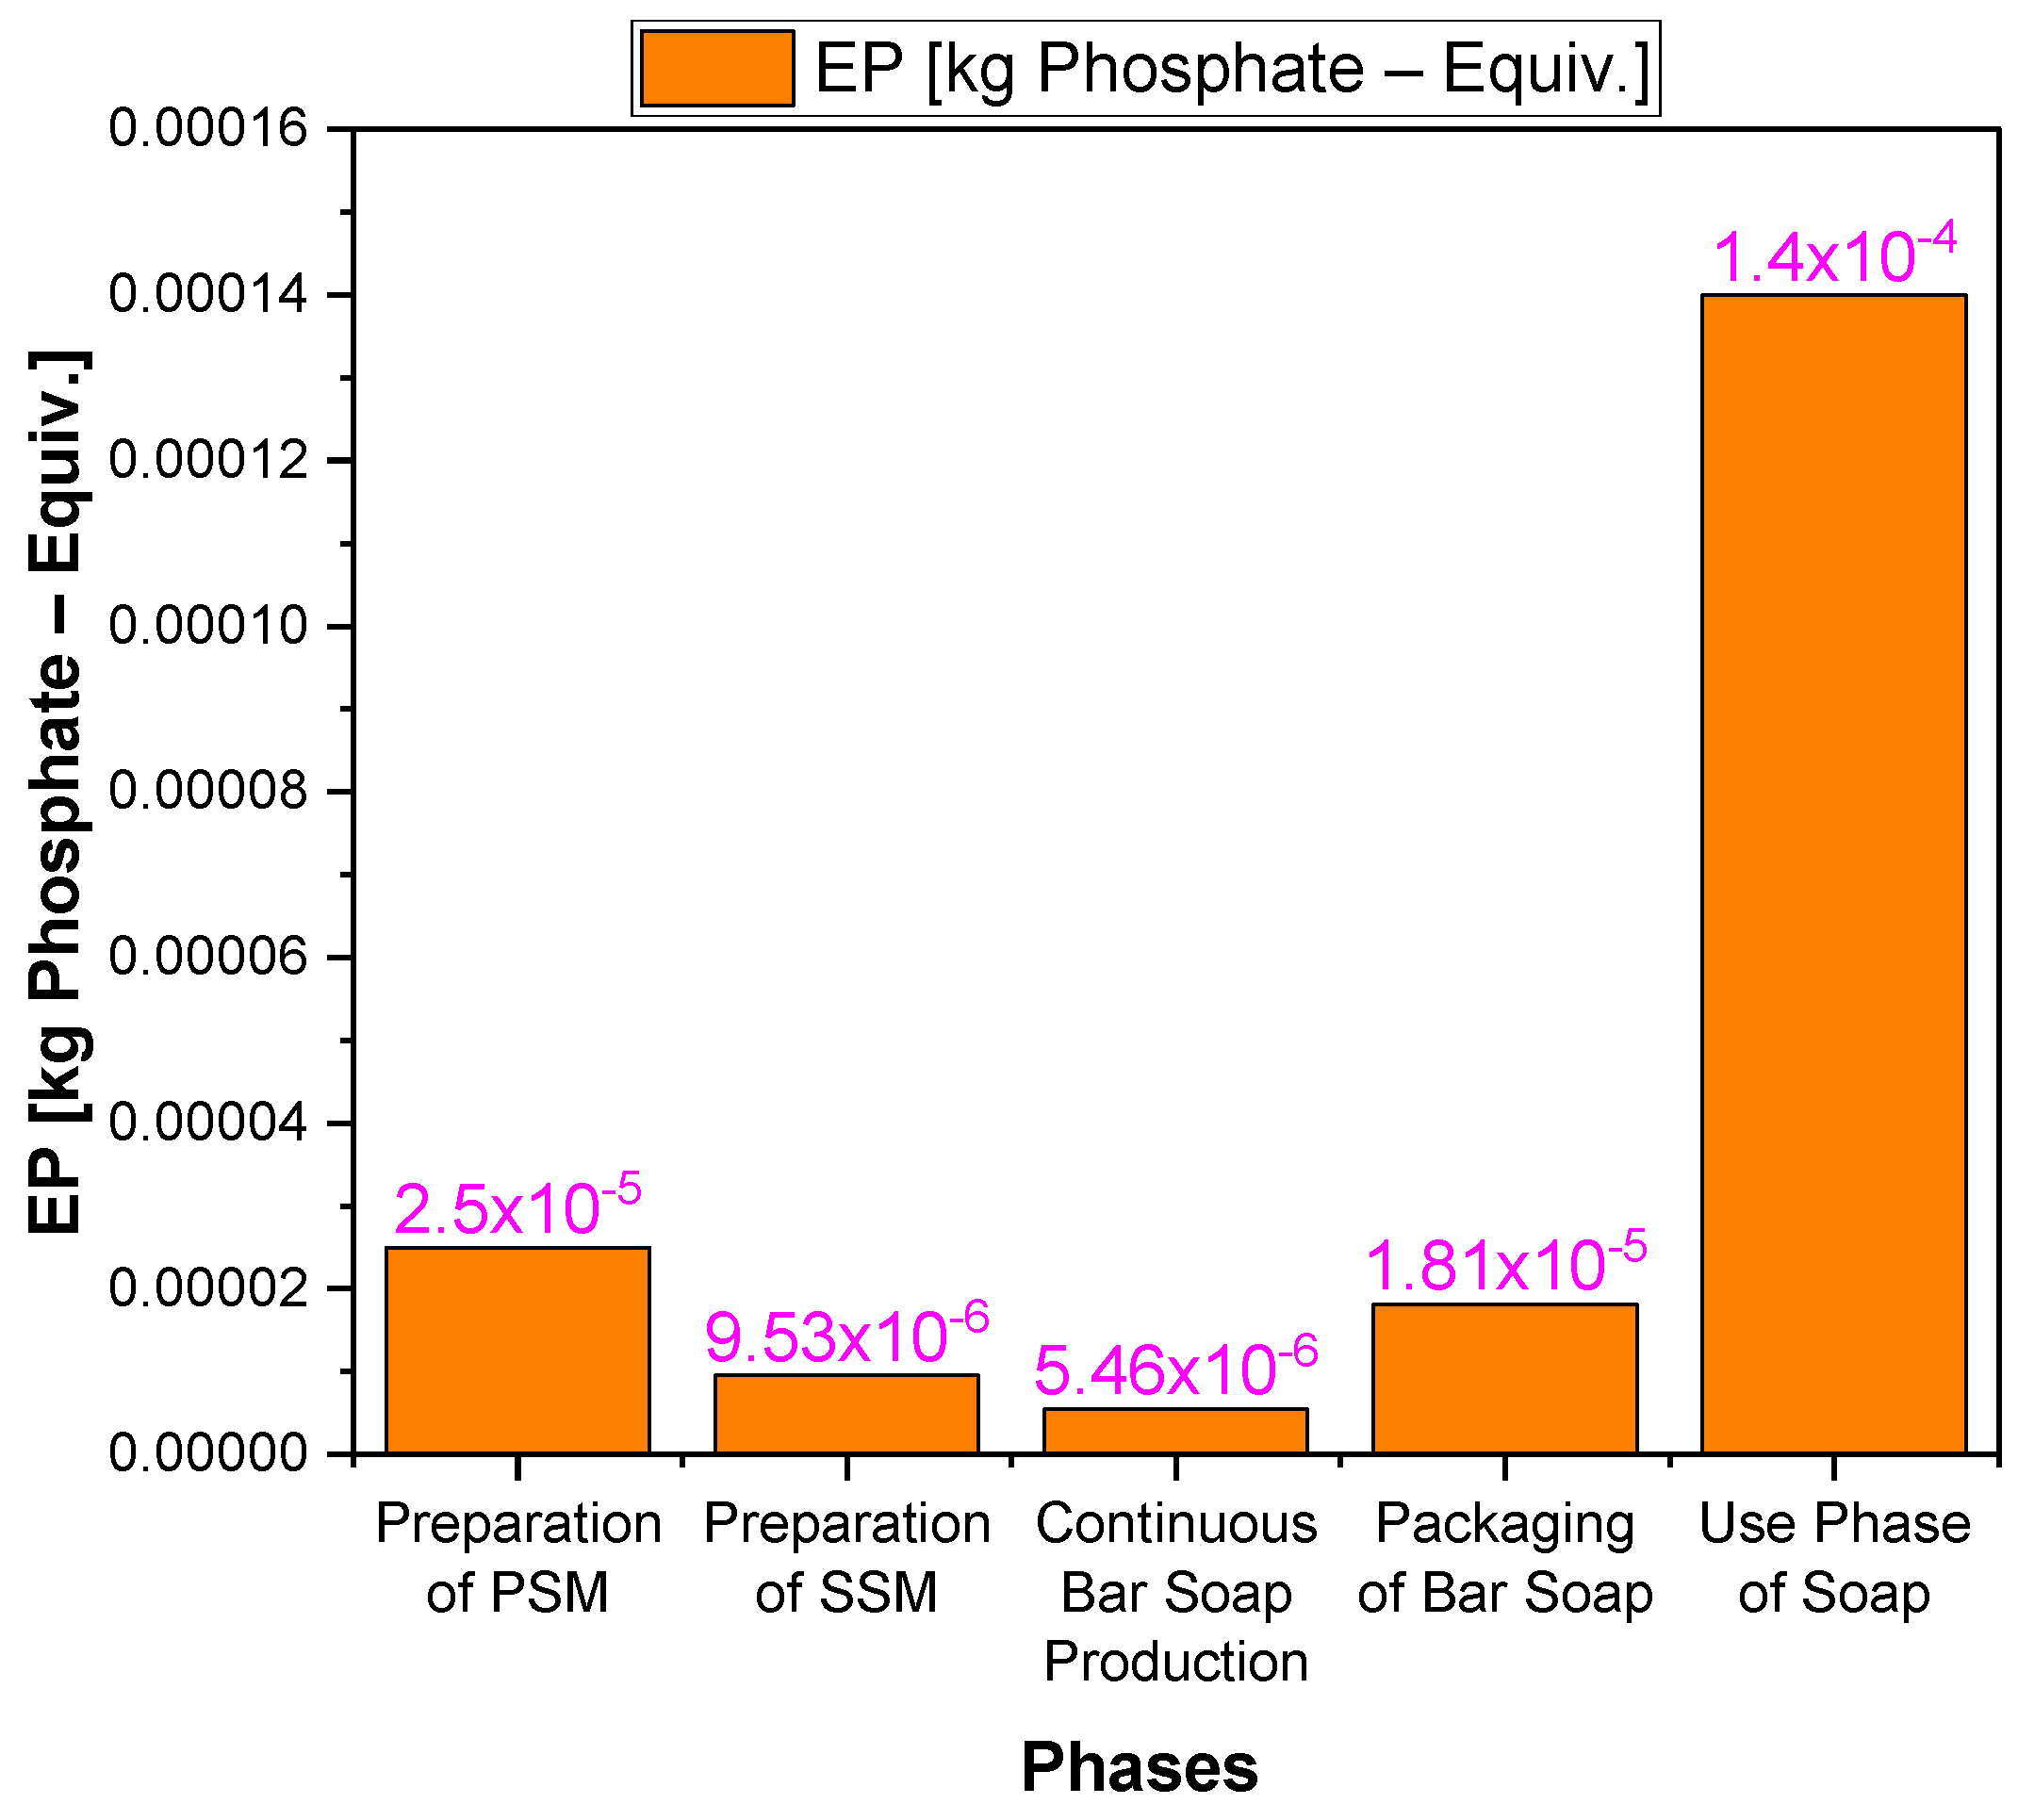
4.3. Eutrophication Potential

EP is the result of essential nutrients being released into the water, air, and soil. Nitrates and phosphates are necessary for life, but excessive levels of nutrients in aquatic environments can cause algae to grow rapidly, reduce oxygen levels underwater, and harm local water sources and habitats. Over-fertilization of soil is associated with increased biomass growth and changes in the composition of organisms within the ecosystem. The results of eutrophication potential are expressed in kg phosphate (PO43-) equivalents (Gabi, 2012), and the total for this study is 1.83 × 10⁻⁴ kg Phosphate-Equivalent. The major contributors to eutrophication potential are the use phase of bar soap (76.5%) and the preparation of primary soap mix (13.67%). This is because greywater is produced during the use phase, which contributes to eutrophication. Figure 6 illustrates the EP in each subsystem.

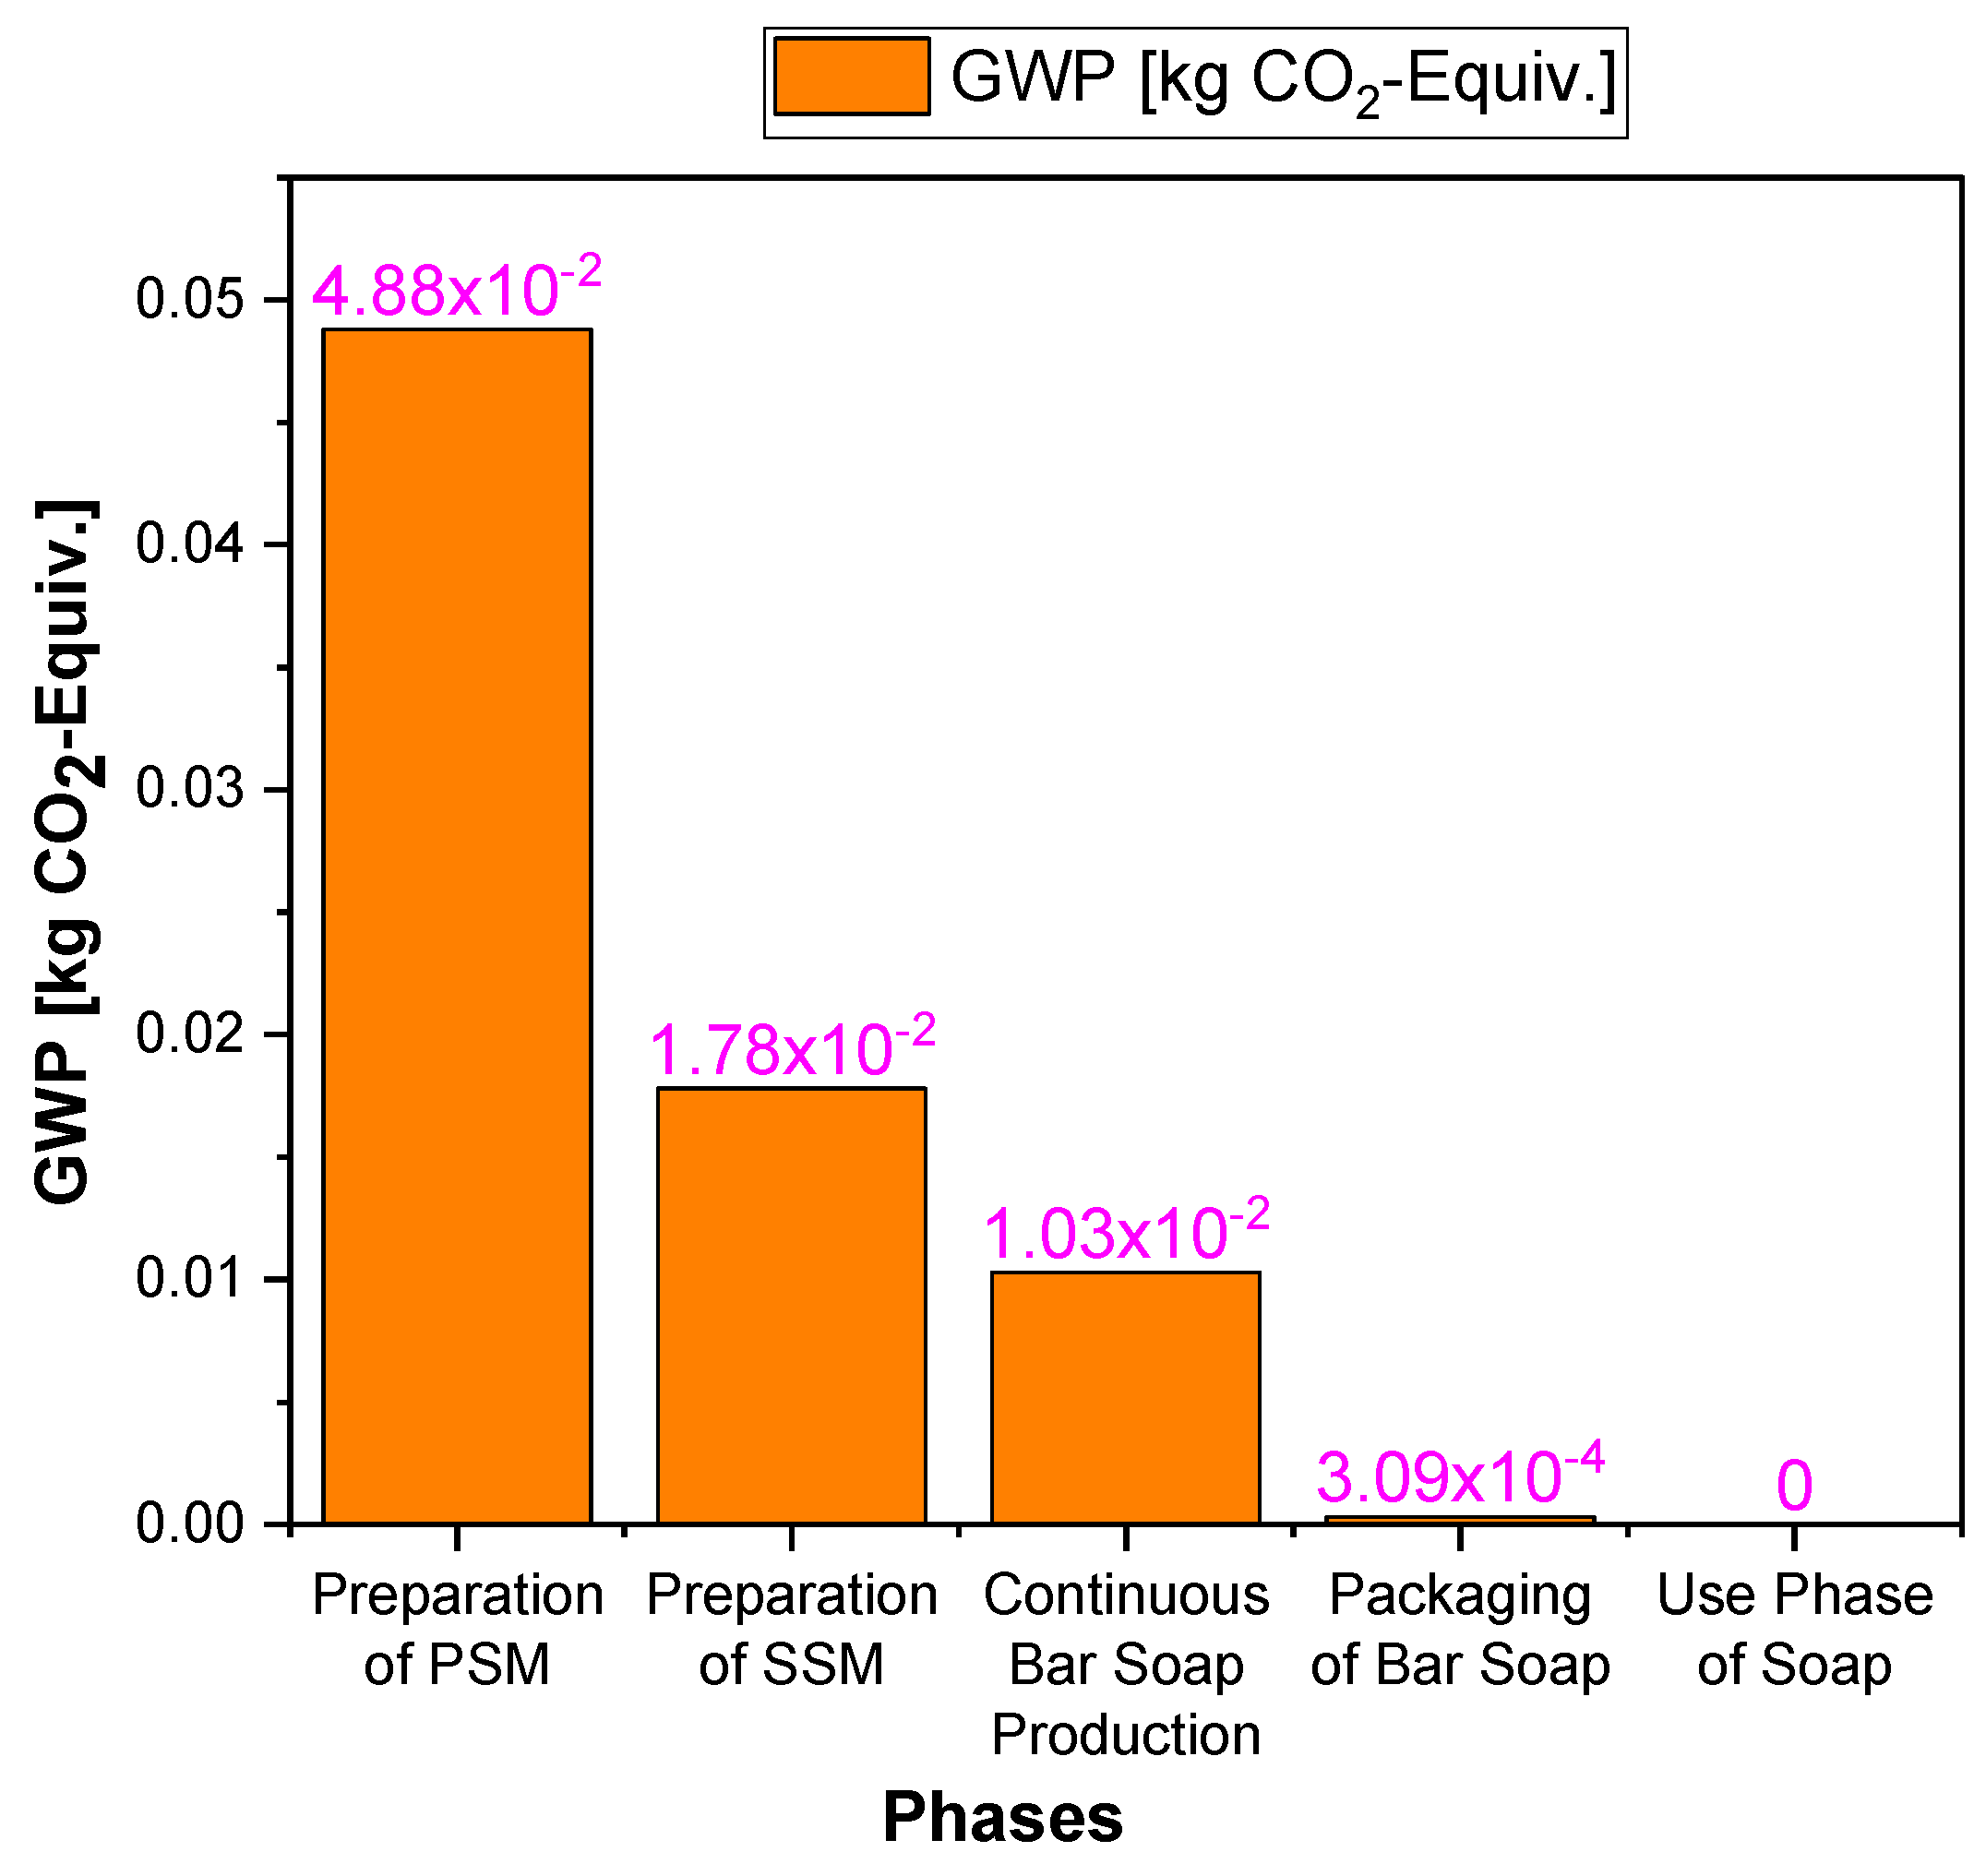
4.4. Global Warming Potential

GWP is the sum of the emissions of CO2 and other greenhouse gases (N2O, CH4, and VOCs) into the atmosphere. It estimates the combined impacts of these gases on the global environment and is expressed in kg CO2 equivalents, spanning a time horizon of 100 years (Gabi, 2012). Figure 7 shows that a total of 7.71 × 10⁻² kg CO2-Equivalent is created during the production and use phase of bar soap, with the major contribution coming from the primary soap production of bar soap, accounting for 58.16%. It is evident that the production of PSM consumes a lot of heat via steam, hence having a higher GWP value than other processes.

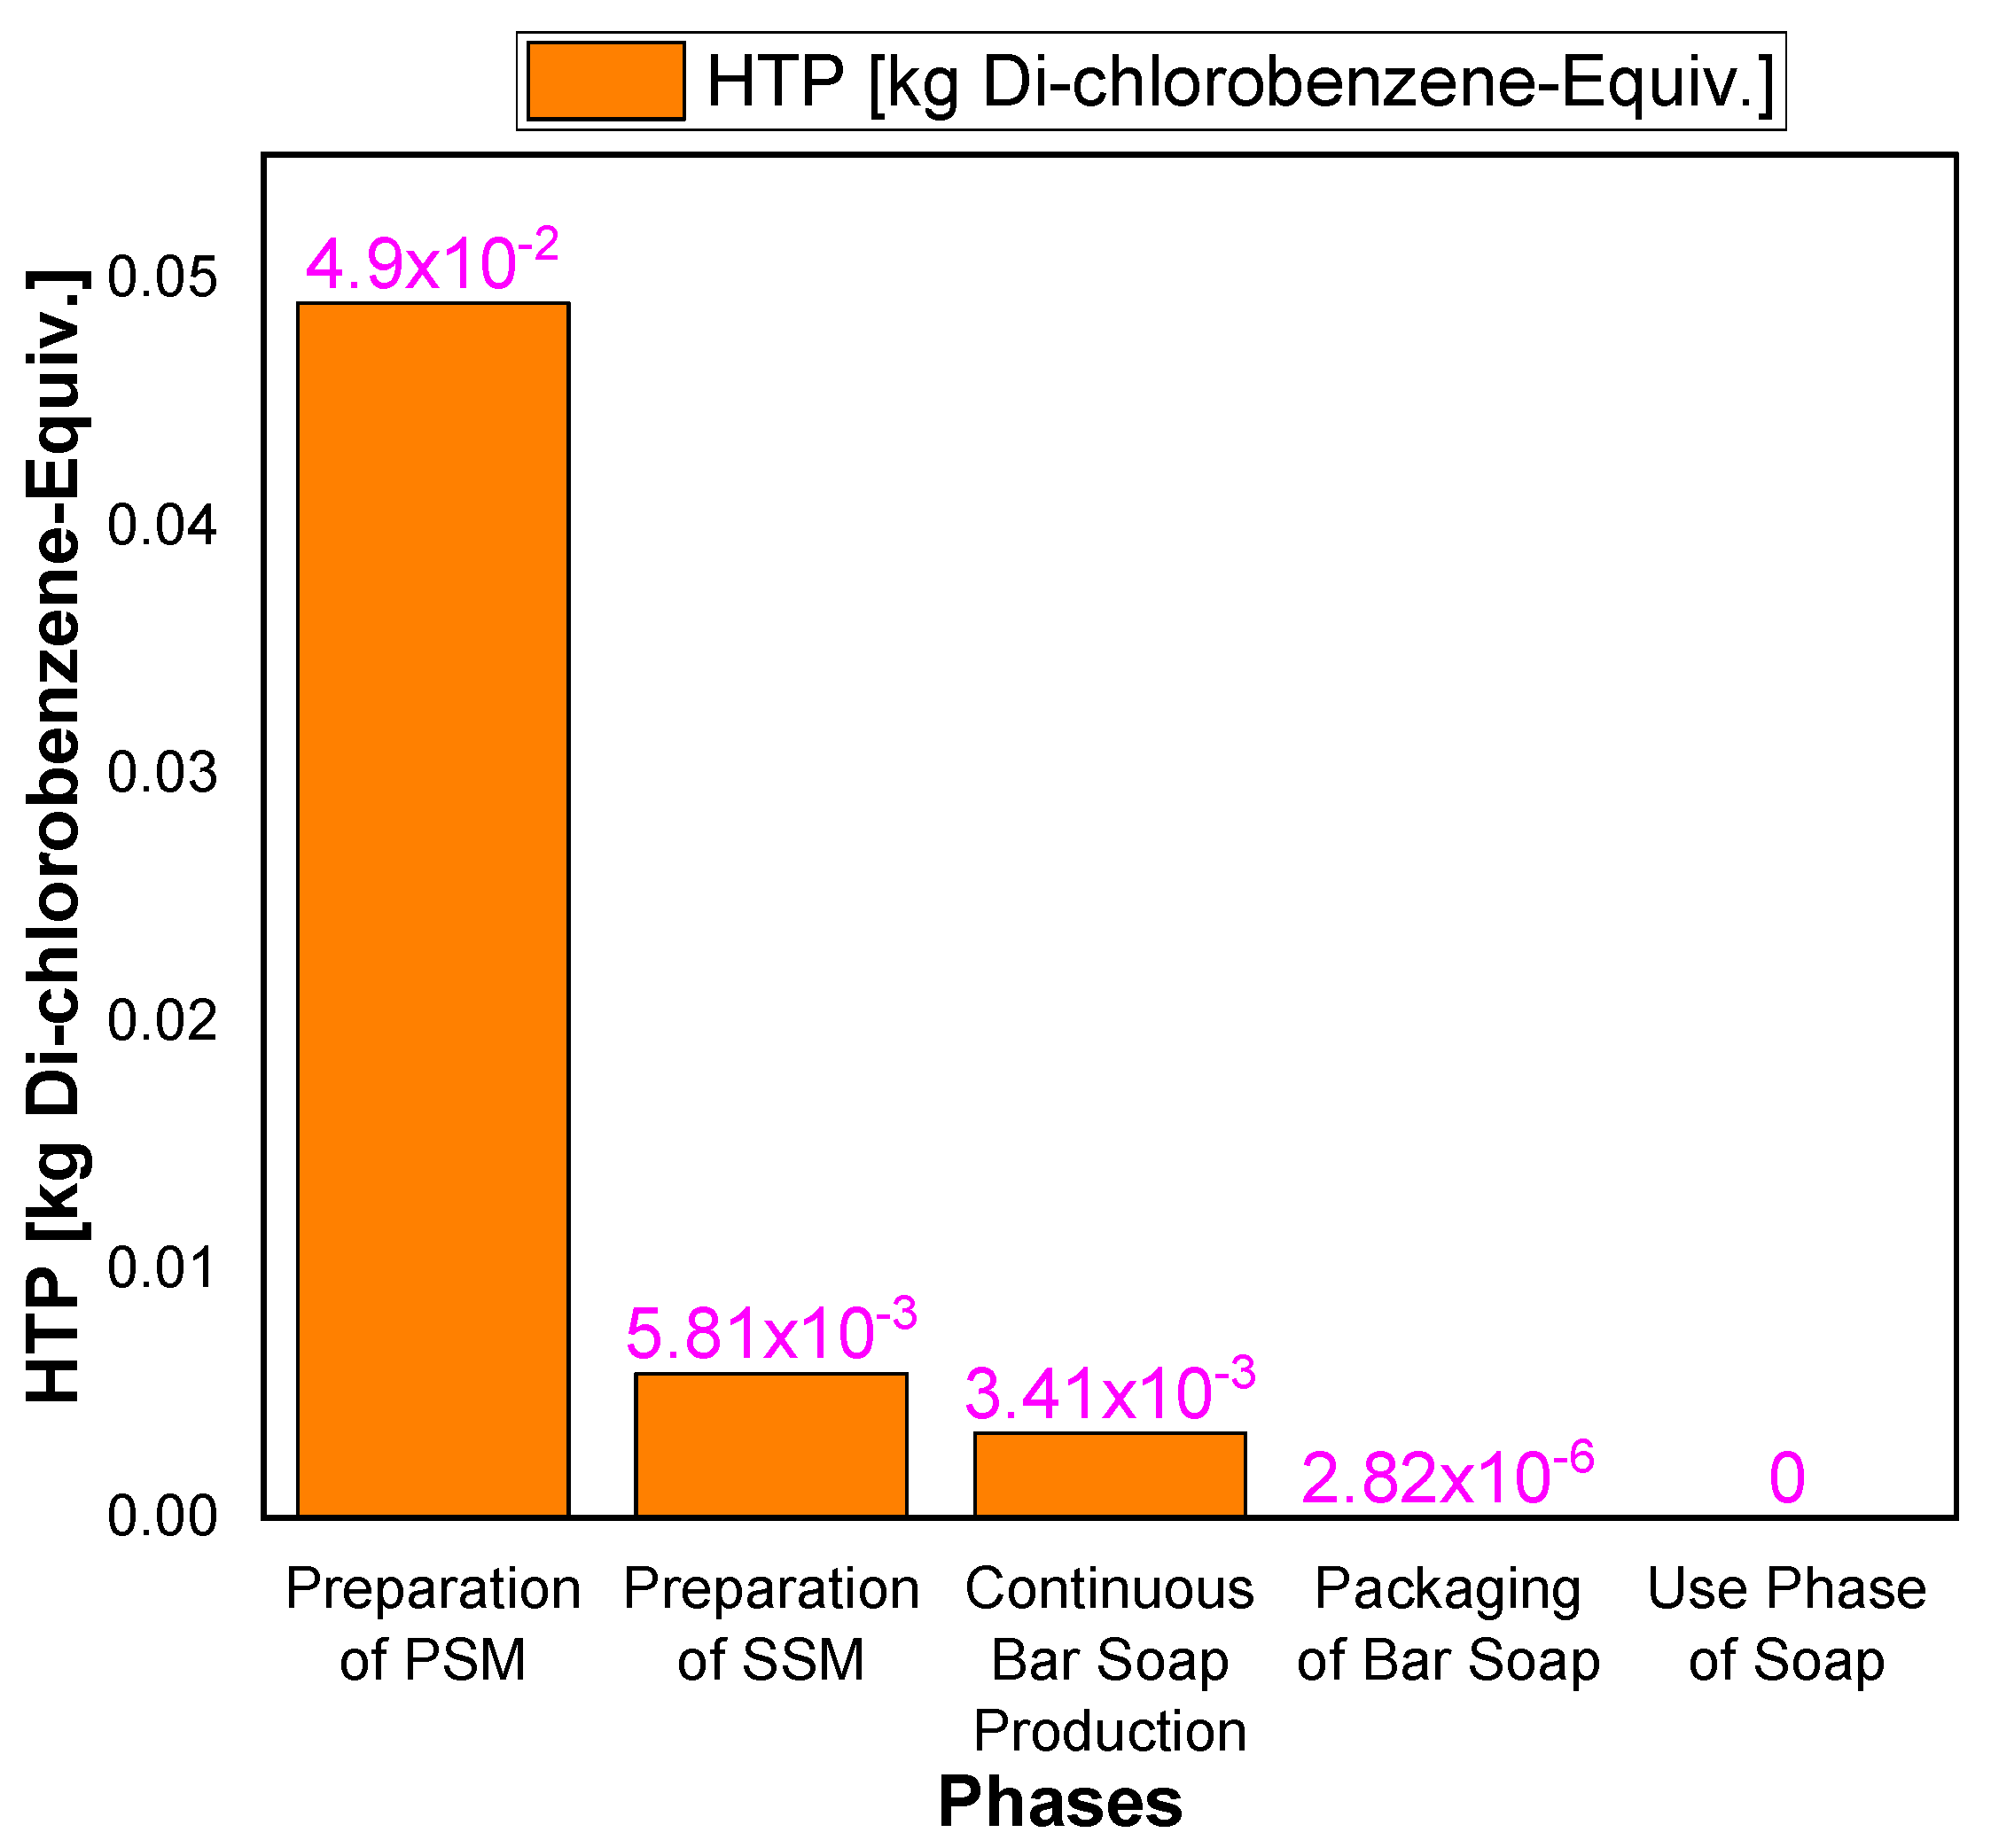
4.5. Human Toxicity Potential

HTP is a quantified measure that takes into account both the intrinsic toxicity of a chemical compound and its potential dosage, representing the potential danger of a chemical unit released into the atmosphere. It is used in a life cycle assessment (LCA) or the toxic release inventory (TRI) to determine the weight and average emissions as a reference compound. Emissions can be assessed in terms of benzene equivalence for carcinogens and toluene equivalents for non-carcinogens (Gabi, 2012). This parameter is important as it signifies the potential threat to human health in a comparative manner. It can be seen from Figure 8 that the total HTP is 5.83 × 10⁻² kg DCB equivalent, with PSM production alone contributing 4.90 × 10⁻² (84.05%) kg DCB equivalent. It is also observed that PSM production has a higher impact value in many of the environmental indicators.

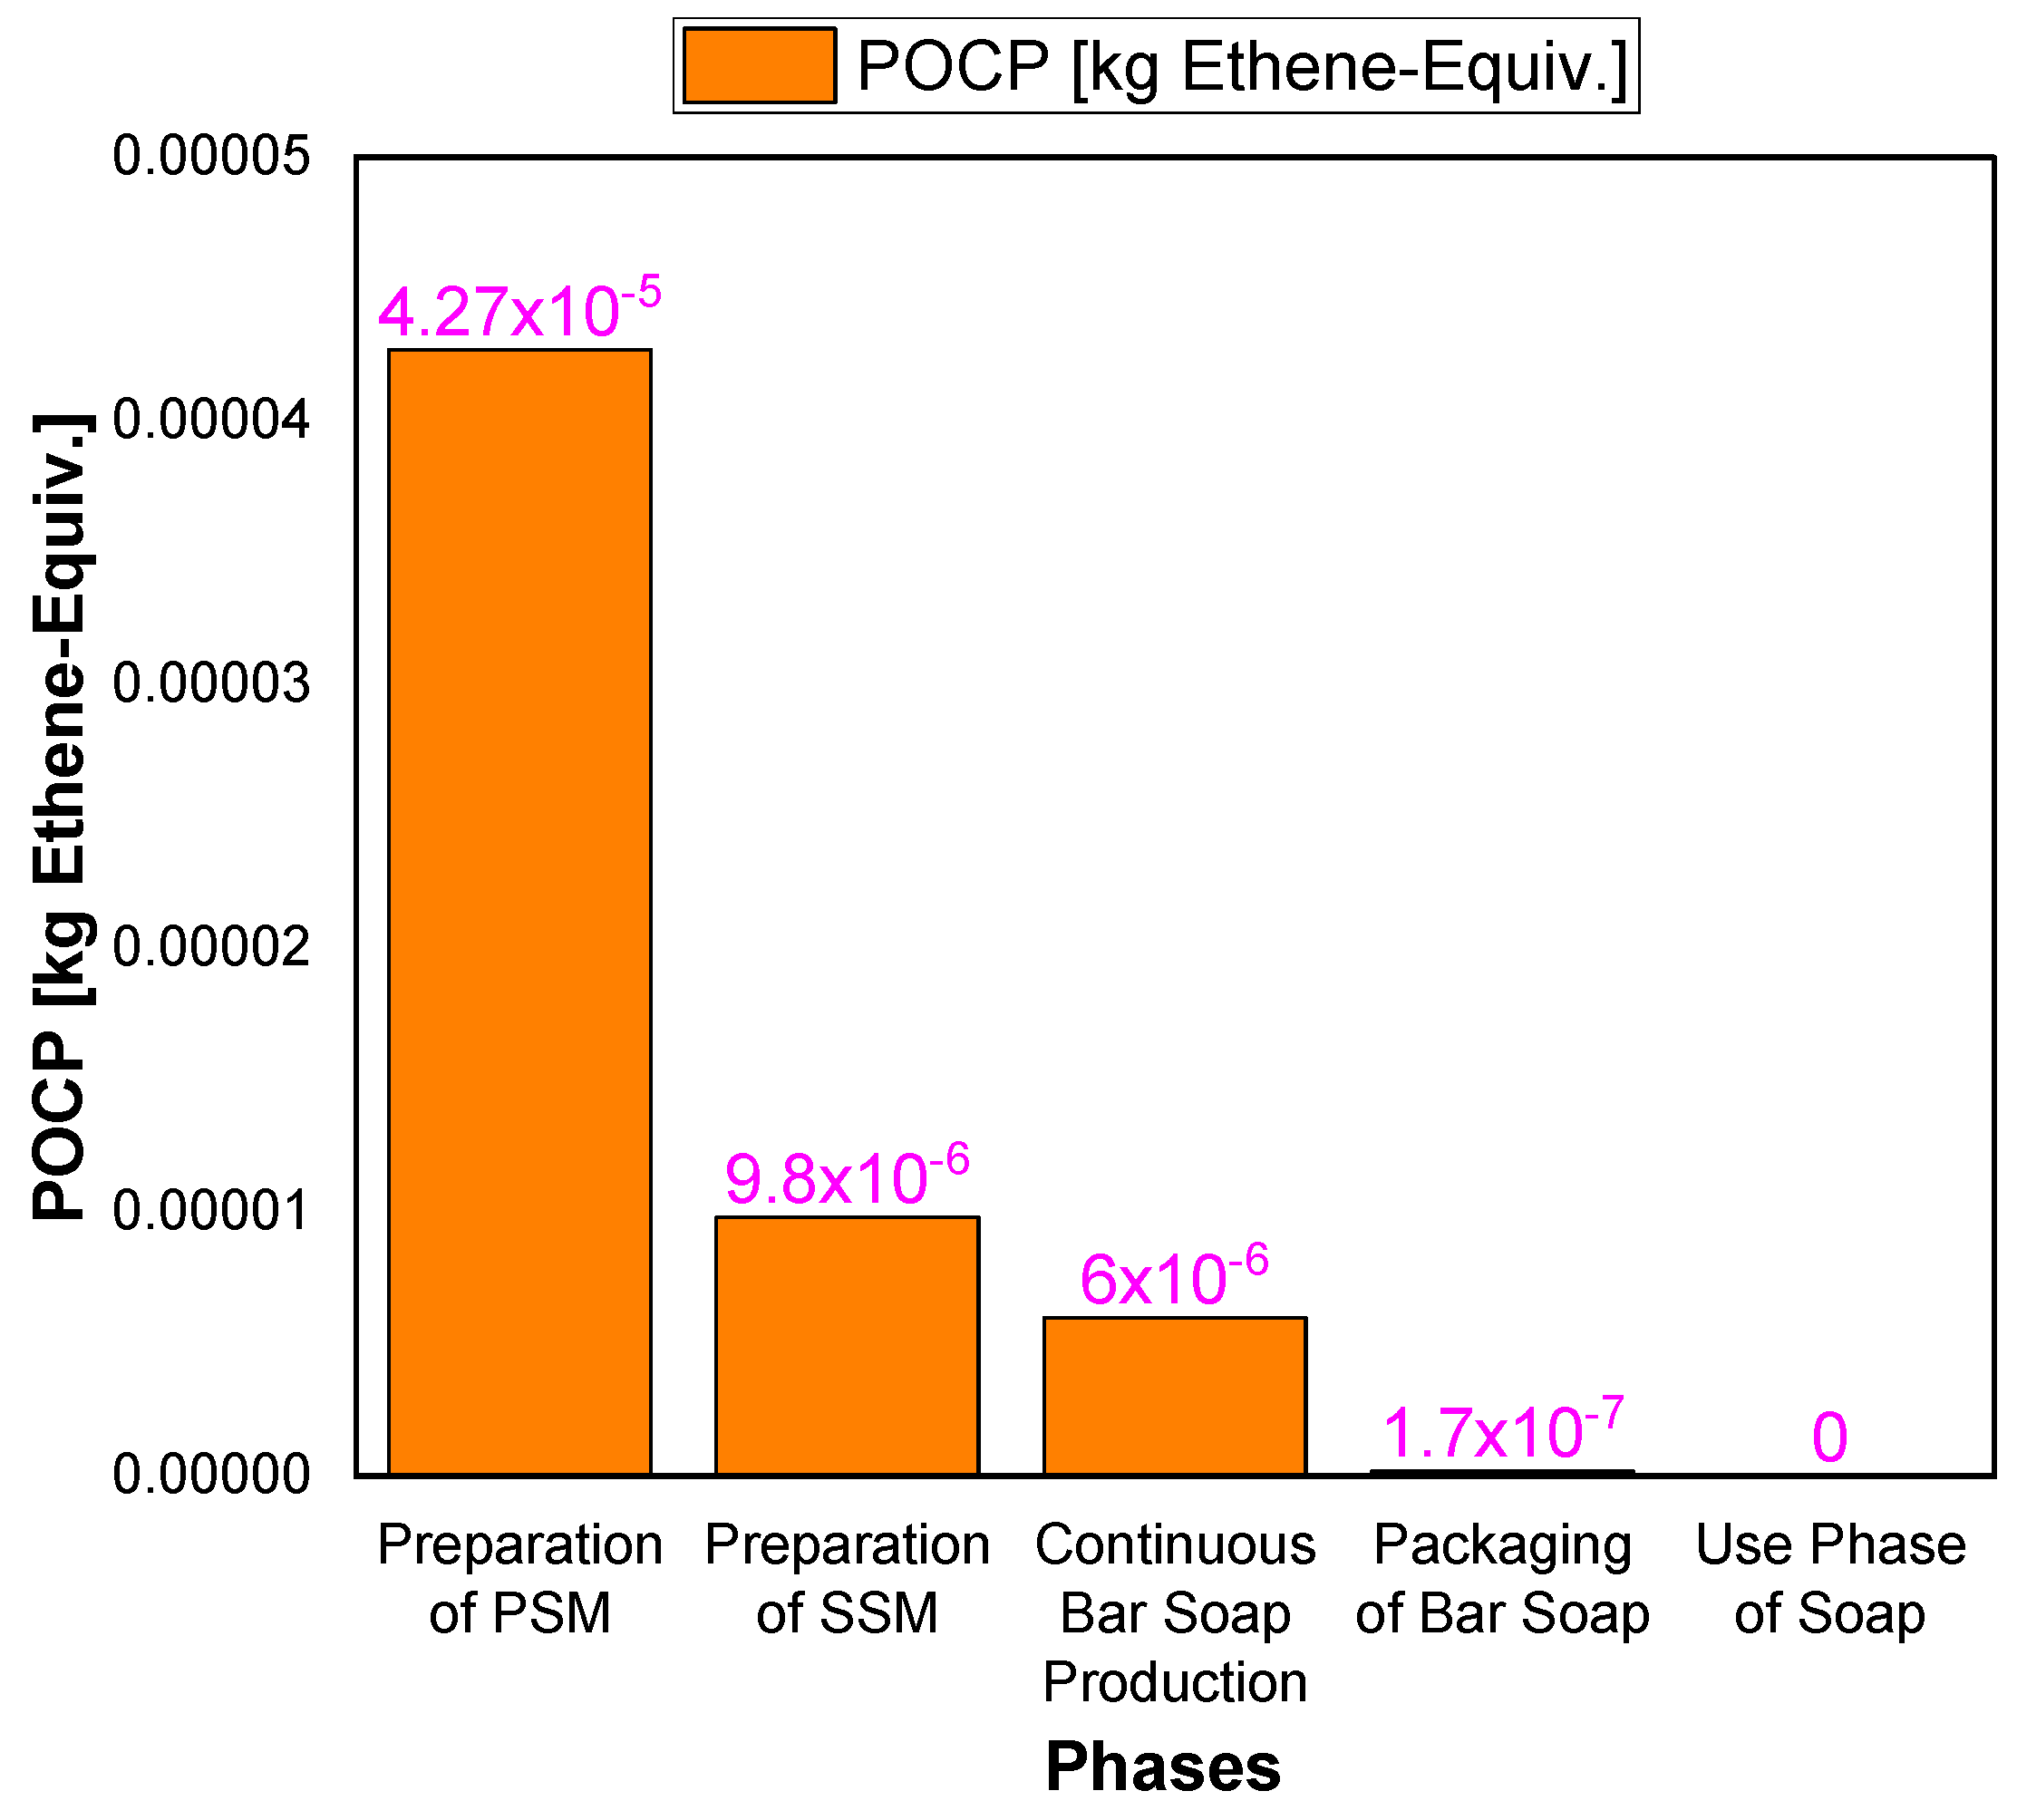
4.6. Photochemical Ozone Creation Potential

POCP is a measure of the potential for volatile organic compounds (VOCs) to contribute to photochemical ozone formation at the local level. Ground-level ozone, which has an impact on flora and fauna, is generated through photochemical oxidation, a reaction that occurs when NOx and VOCs are exposed to UV radiation. POCP is expressed in kg ethylene (C2H4) equivalents (Gabi, 2012). Once again, it is observed that the production of PSM is mainly responsible for POCP, accounting for a total of 4.27 × 10⁻⁵ kg ethene equivalent, which is 72.87% of the total 5.86 × 10⁻⁵ kg ethene equivalent. Figure 9 shows the photochemical ozone creation potential (POCP) in each subsystem.

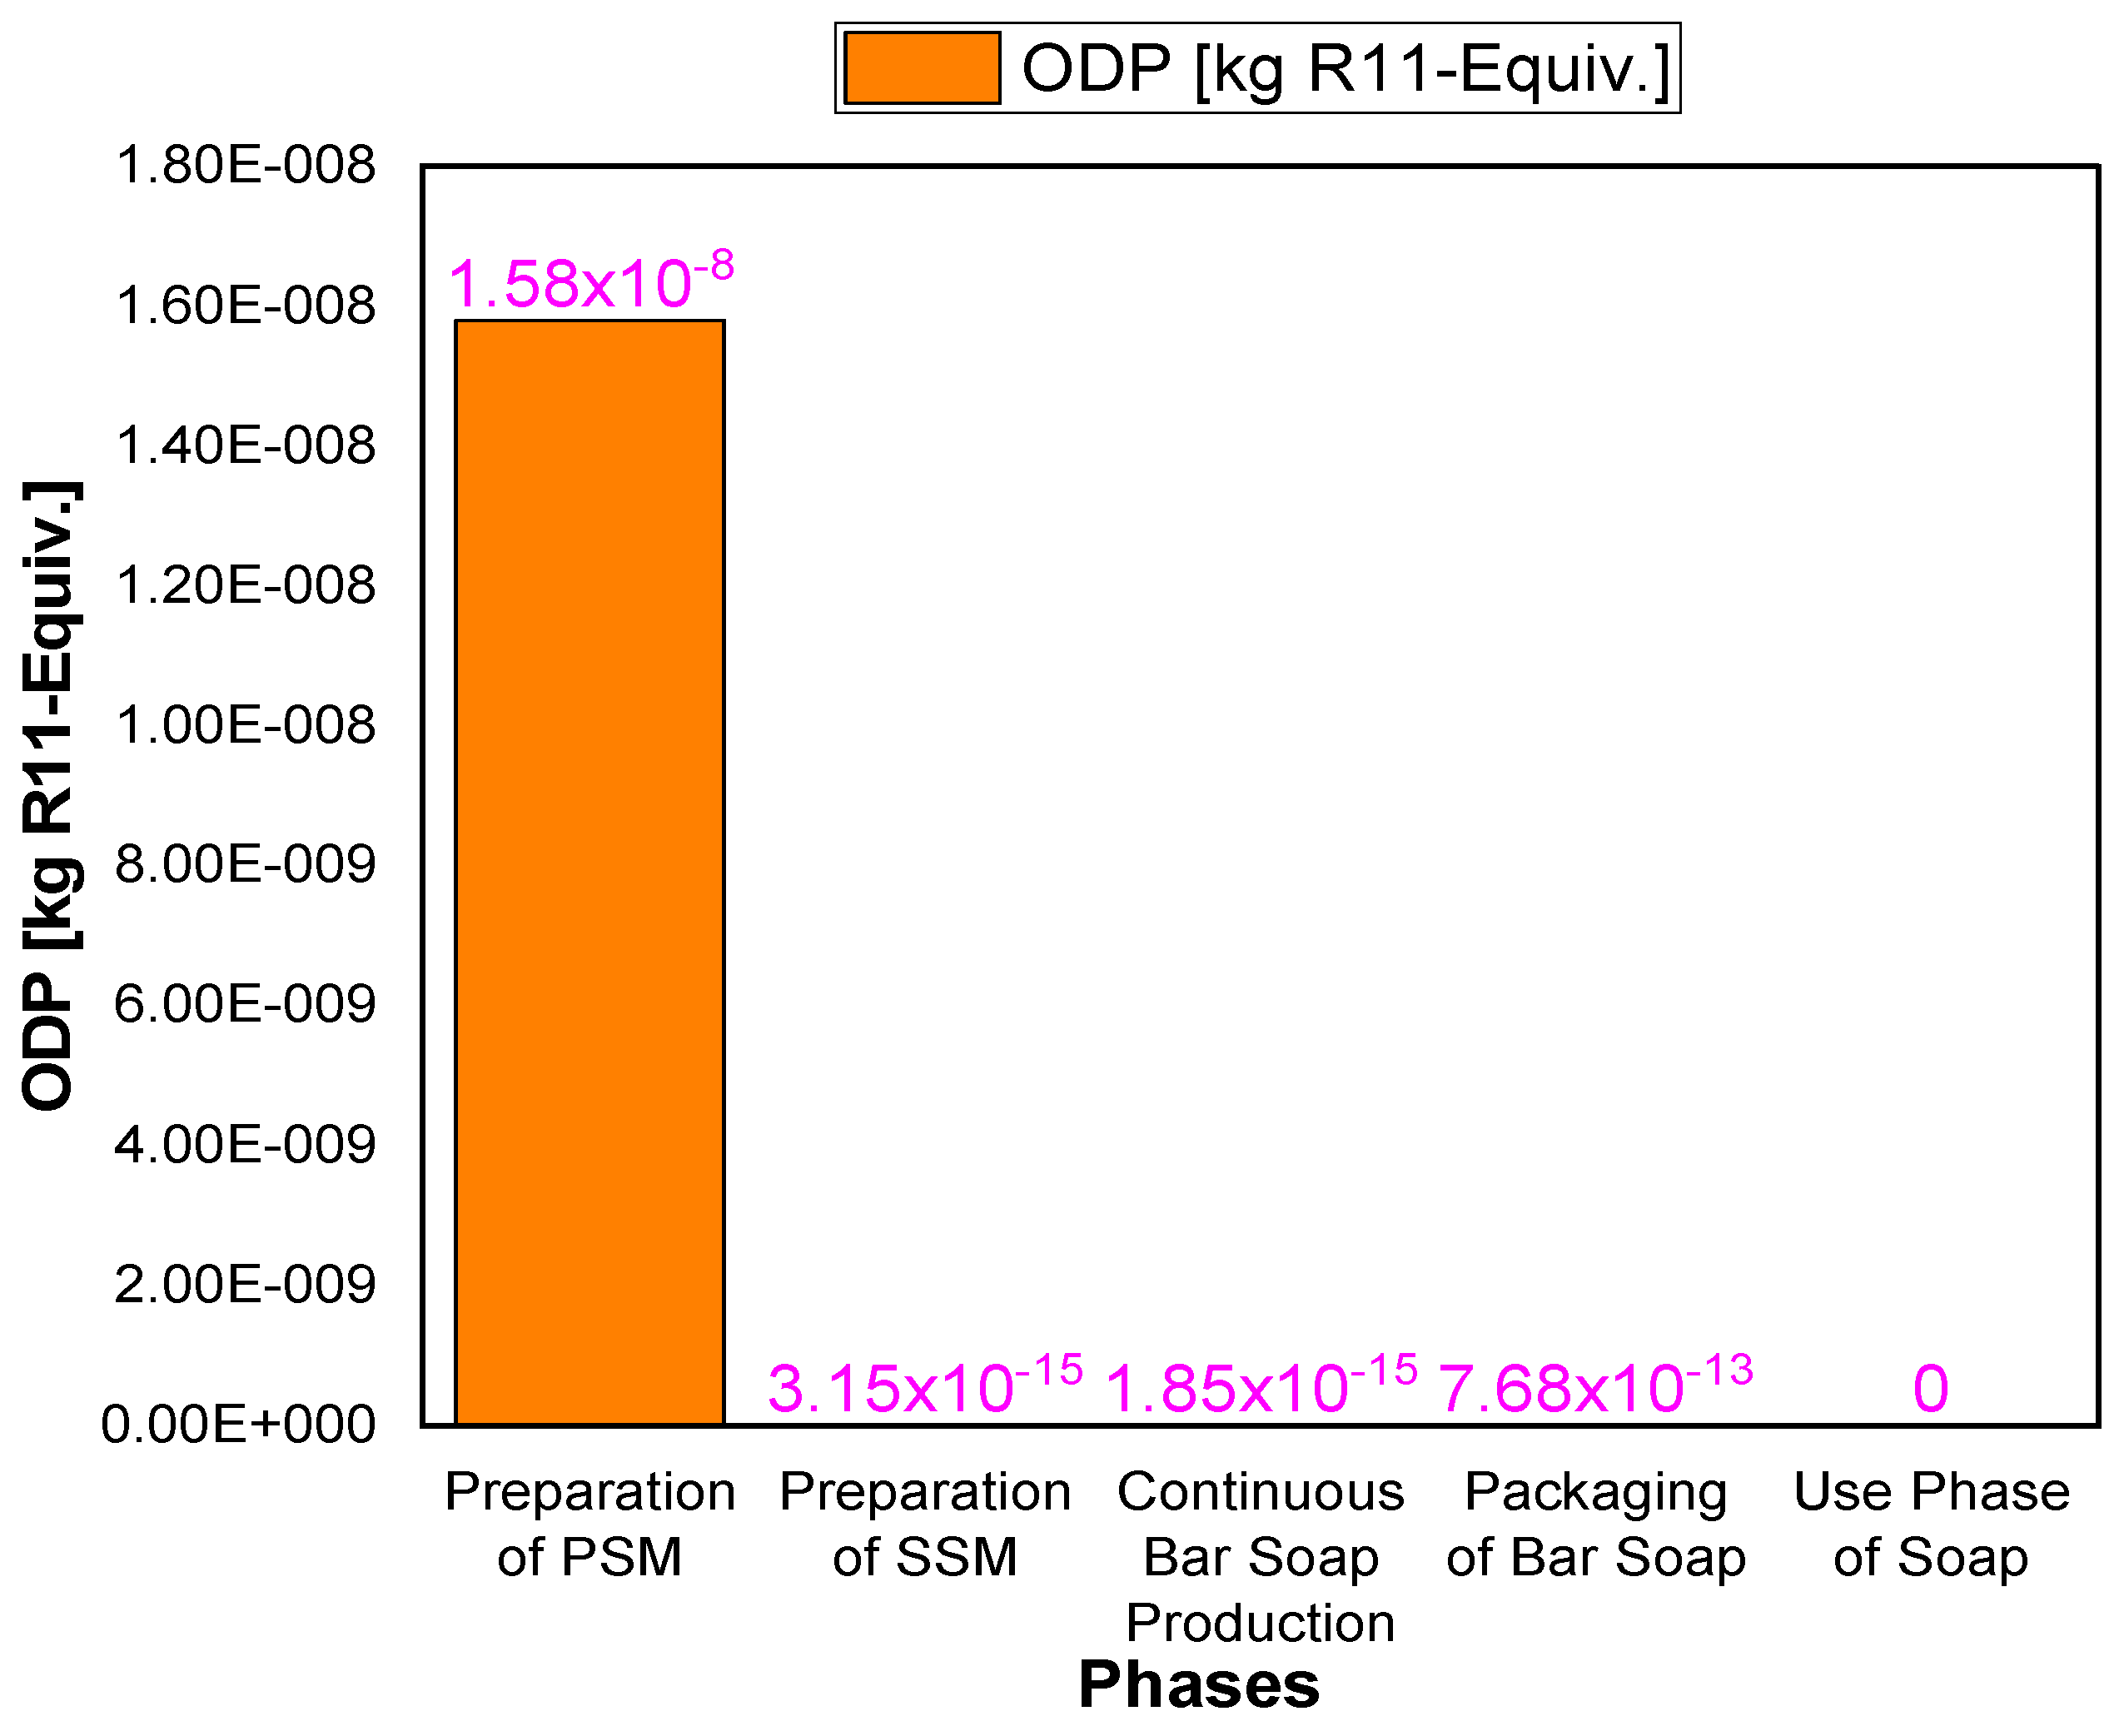
4.7. Ozone Layer Depletion Potential

The ODP is a measure of the potential for emissions to deplete the stratospheric ozone layer and increase the ultraviolet radiation reaching the Earth’s surface. Chlorofluorocarbons (CFCs) and chlorinated hydrocarbons (HCs) are the primary substances that contribute to ozone layer depletion. ODP is expressed in kg CFC-11 (or R-11) equivalents and its impact is felt globally (Gabi, 2012). Figure 10 shows the ozone layer depletion potential (ODP) in each subsystem. The results of this indicator show that the ODP impact is mainly due to PSM production, accounting for 99.99% of the total impact.

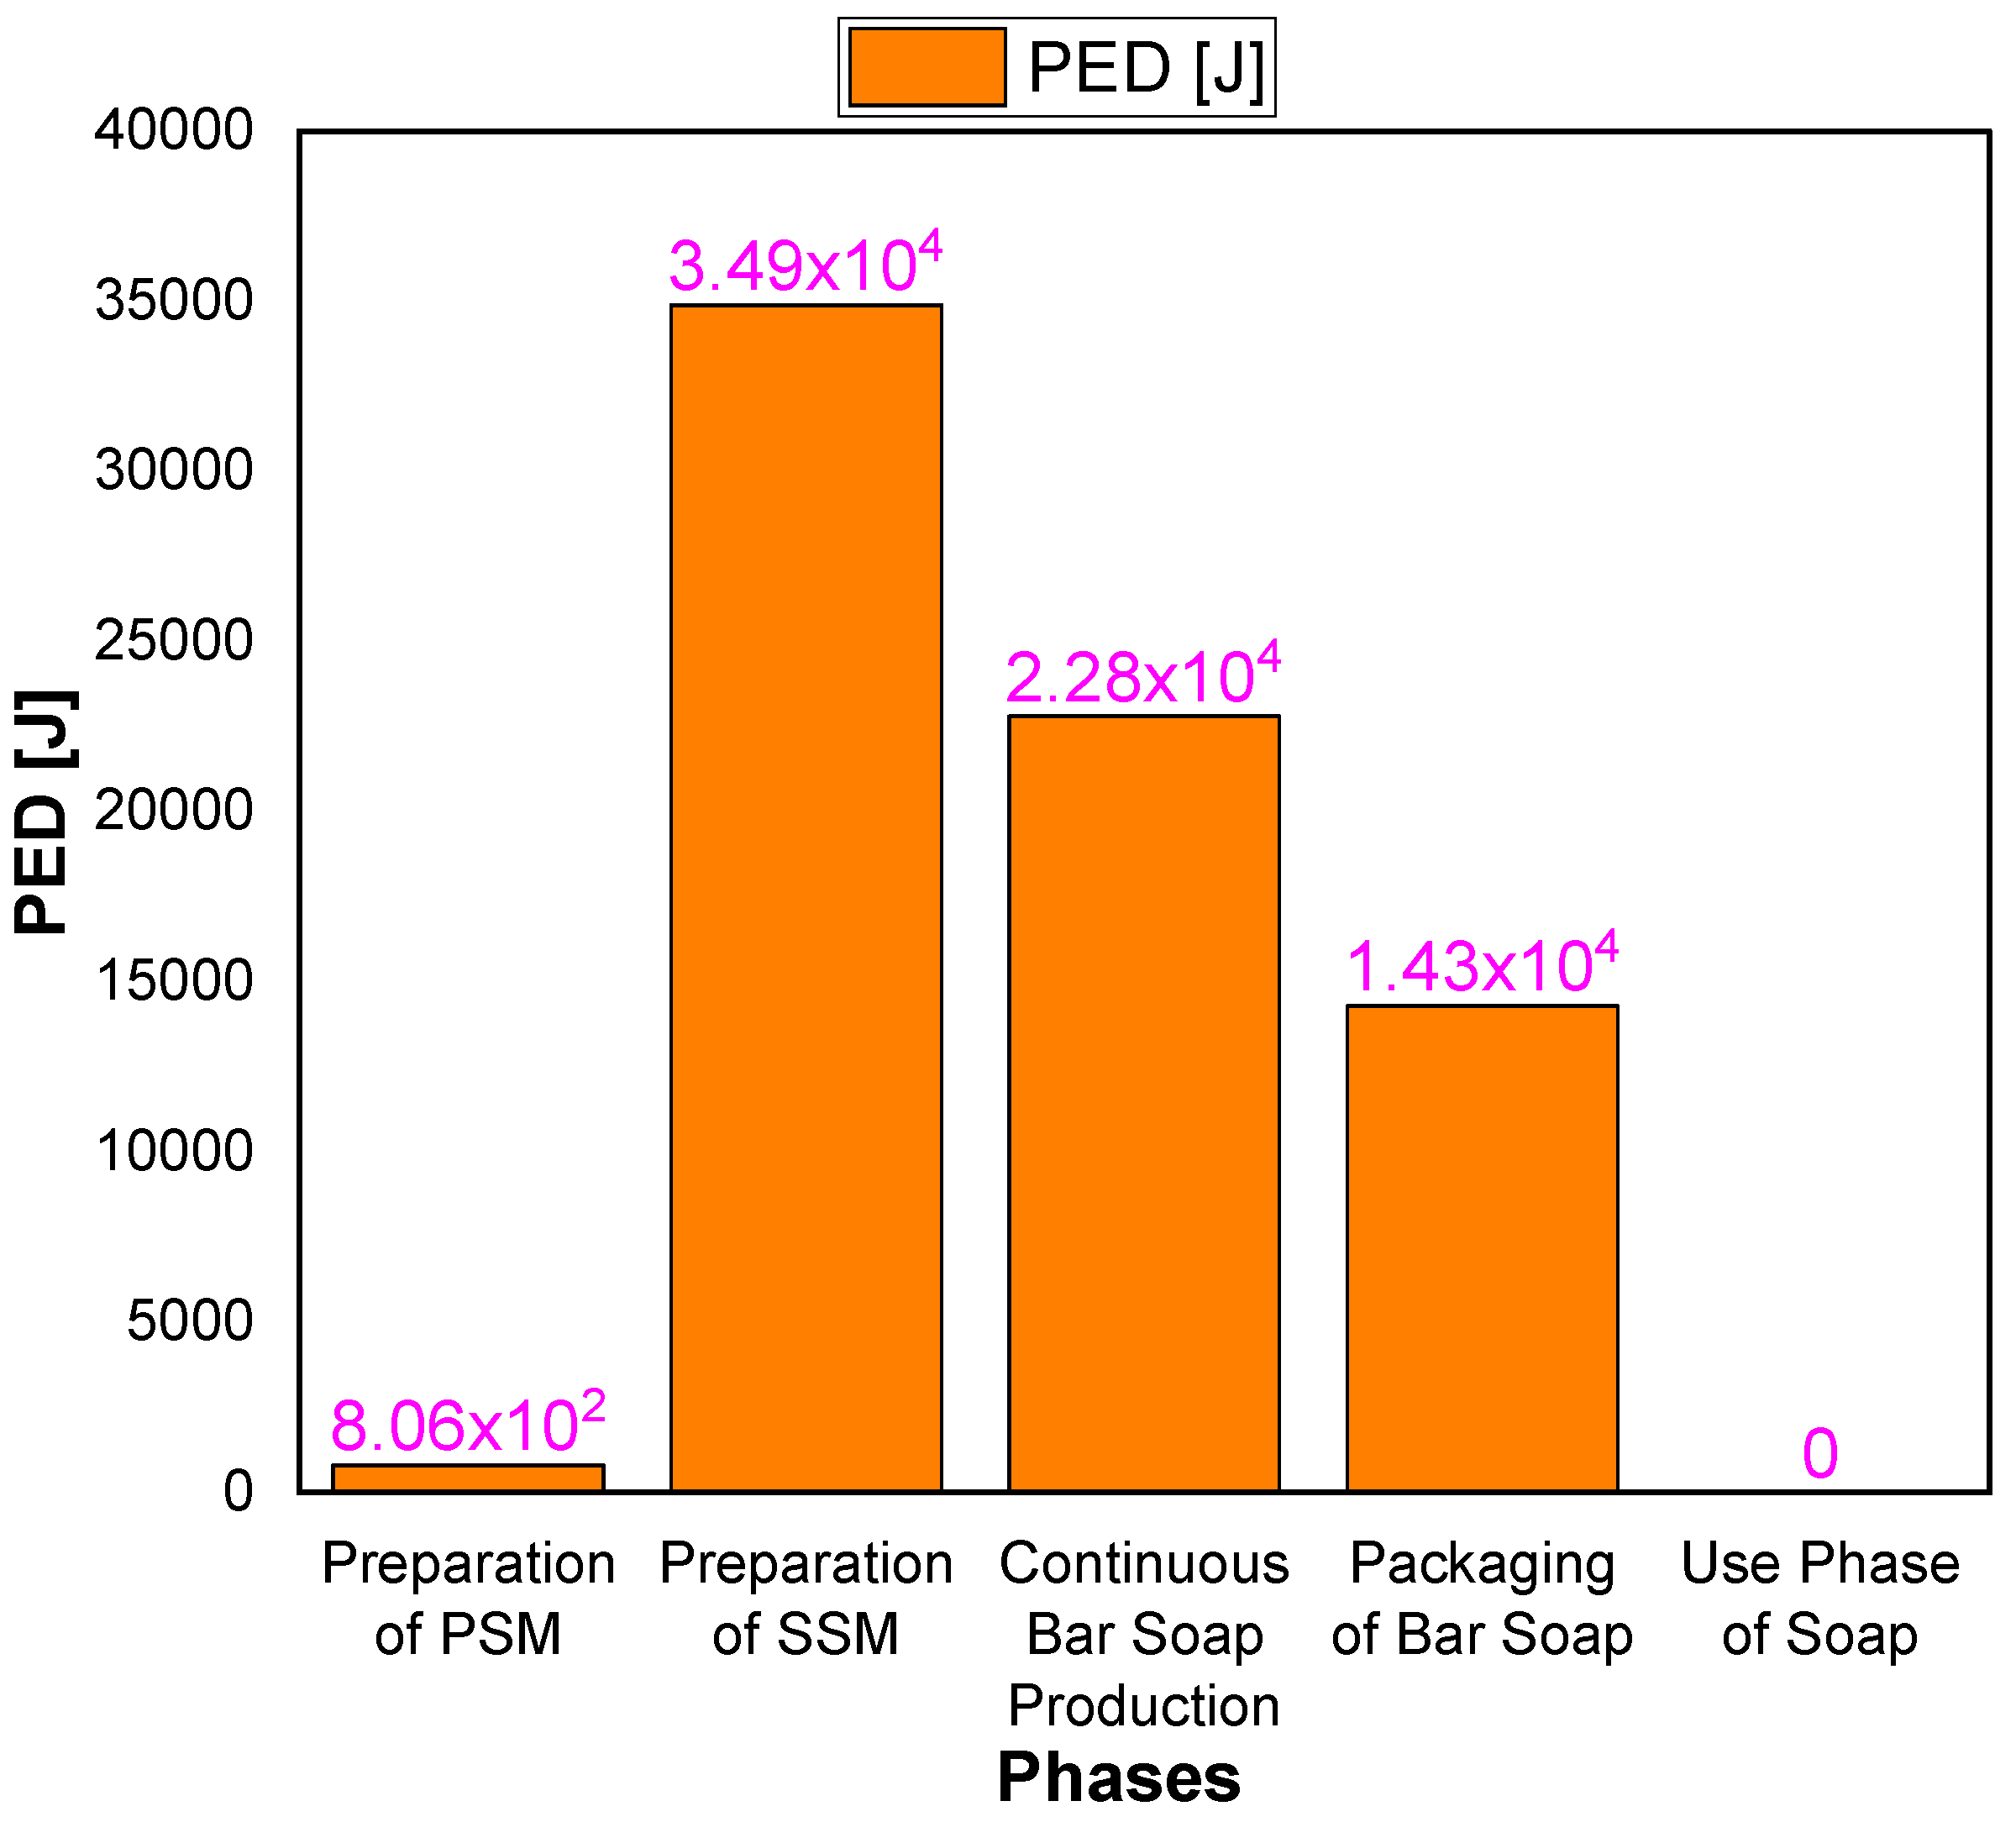
4.8. Primary Energy Demand

The PED refers to the energy supplied directly from natural sources, such as the hydrosphere, atmosphere, geosphere, and other sources, without any conversion or transformation. It encompasses both renewable and non-renewable energy sources, such as solar power, wind power, hydroelectricity, biomass, biofuels, coal, crude oil, natural gas, and uranium. The measurement of primary energy demand is expressed in mega joules (MJ) (Gabi, 2012). This indicator indirectly impacts many other environmental indicators, as primary energy is usually generated via power plants, which have their own ecological impacts. Figure 11 indicates the primary energy demand in each subsystem. In bar soap production, the preparation of SSM consumes the highest amount of energy, accounting for 3.49 × 10⁴ J (~48%) of the total PED of 7.28 × 10⁴ J. This is because the process includes powerful amalgamators.

4.9. Bluewater Consumption

As the field of freshwater impact assessment is still evolving, it is premature to suggest specific life cycle impact assessment methods. Therefore, it is recommended to measure net water consumption, also known as consumptive use, at the inventory level (Gabi, 2012). Bluewater refers to fresh surface and groundwater, such as that found in lakes, rivers, and aquifers. The highest amount of blue water consumption occurs during the use phase, with an average of 0.9 m3 equivalent based on a survey, followed by PSM production, which accounts for 1.22 × 10⁻¹ m3 equivalent.

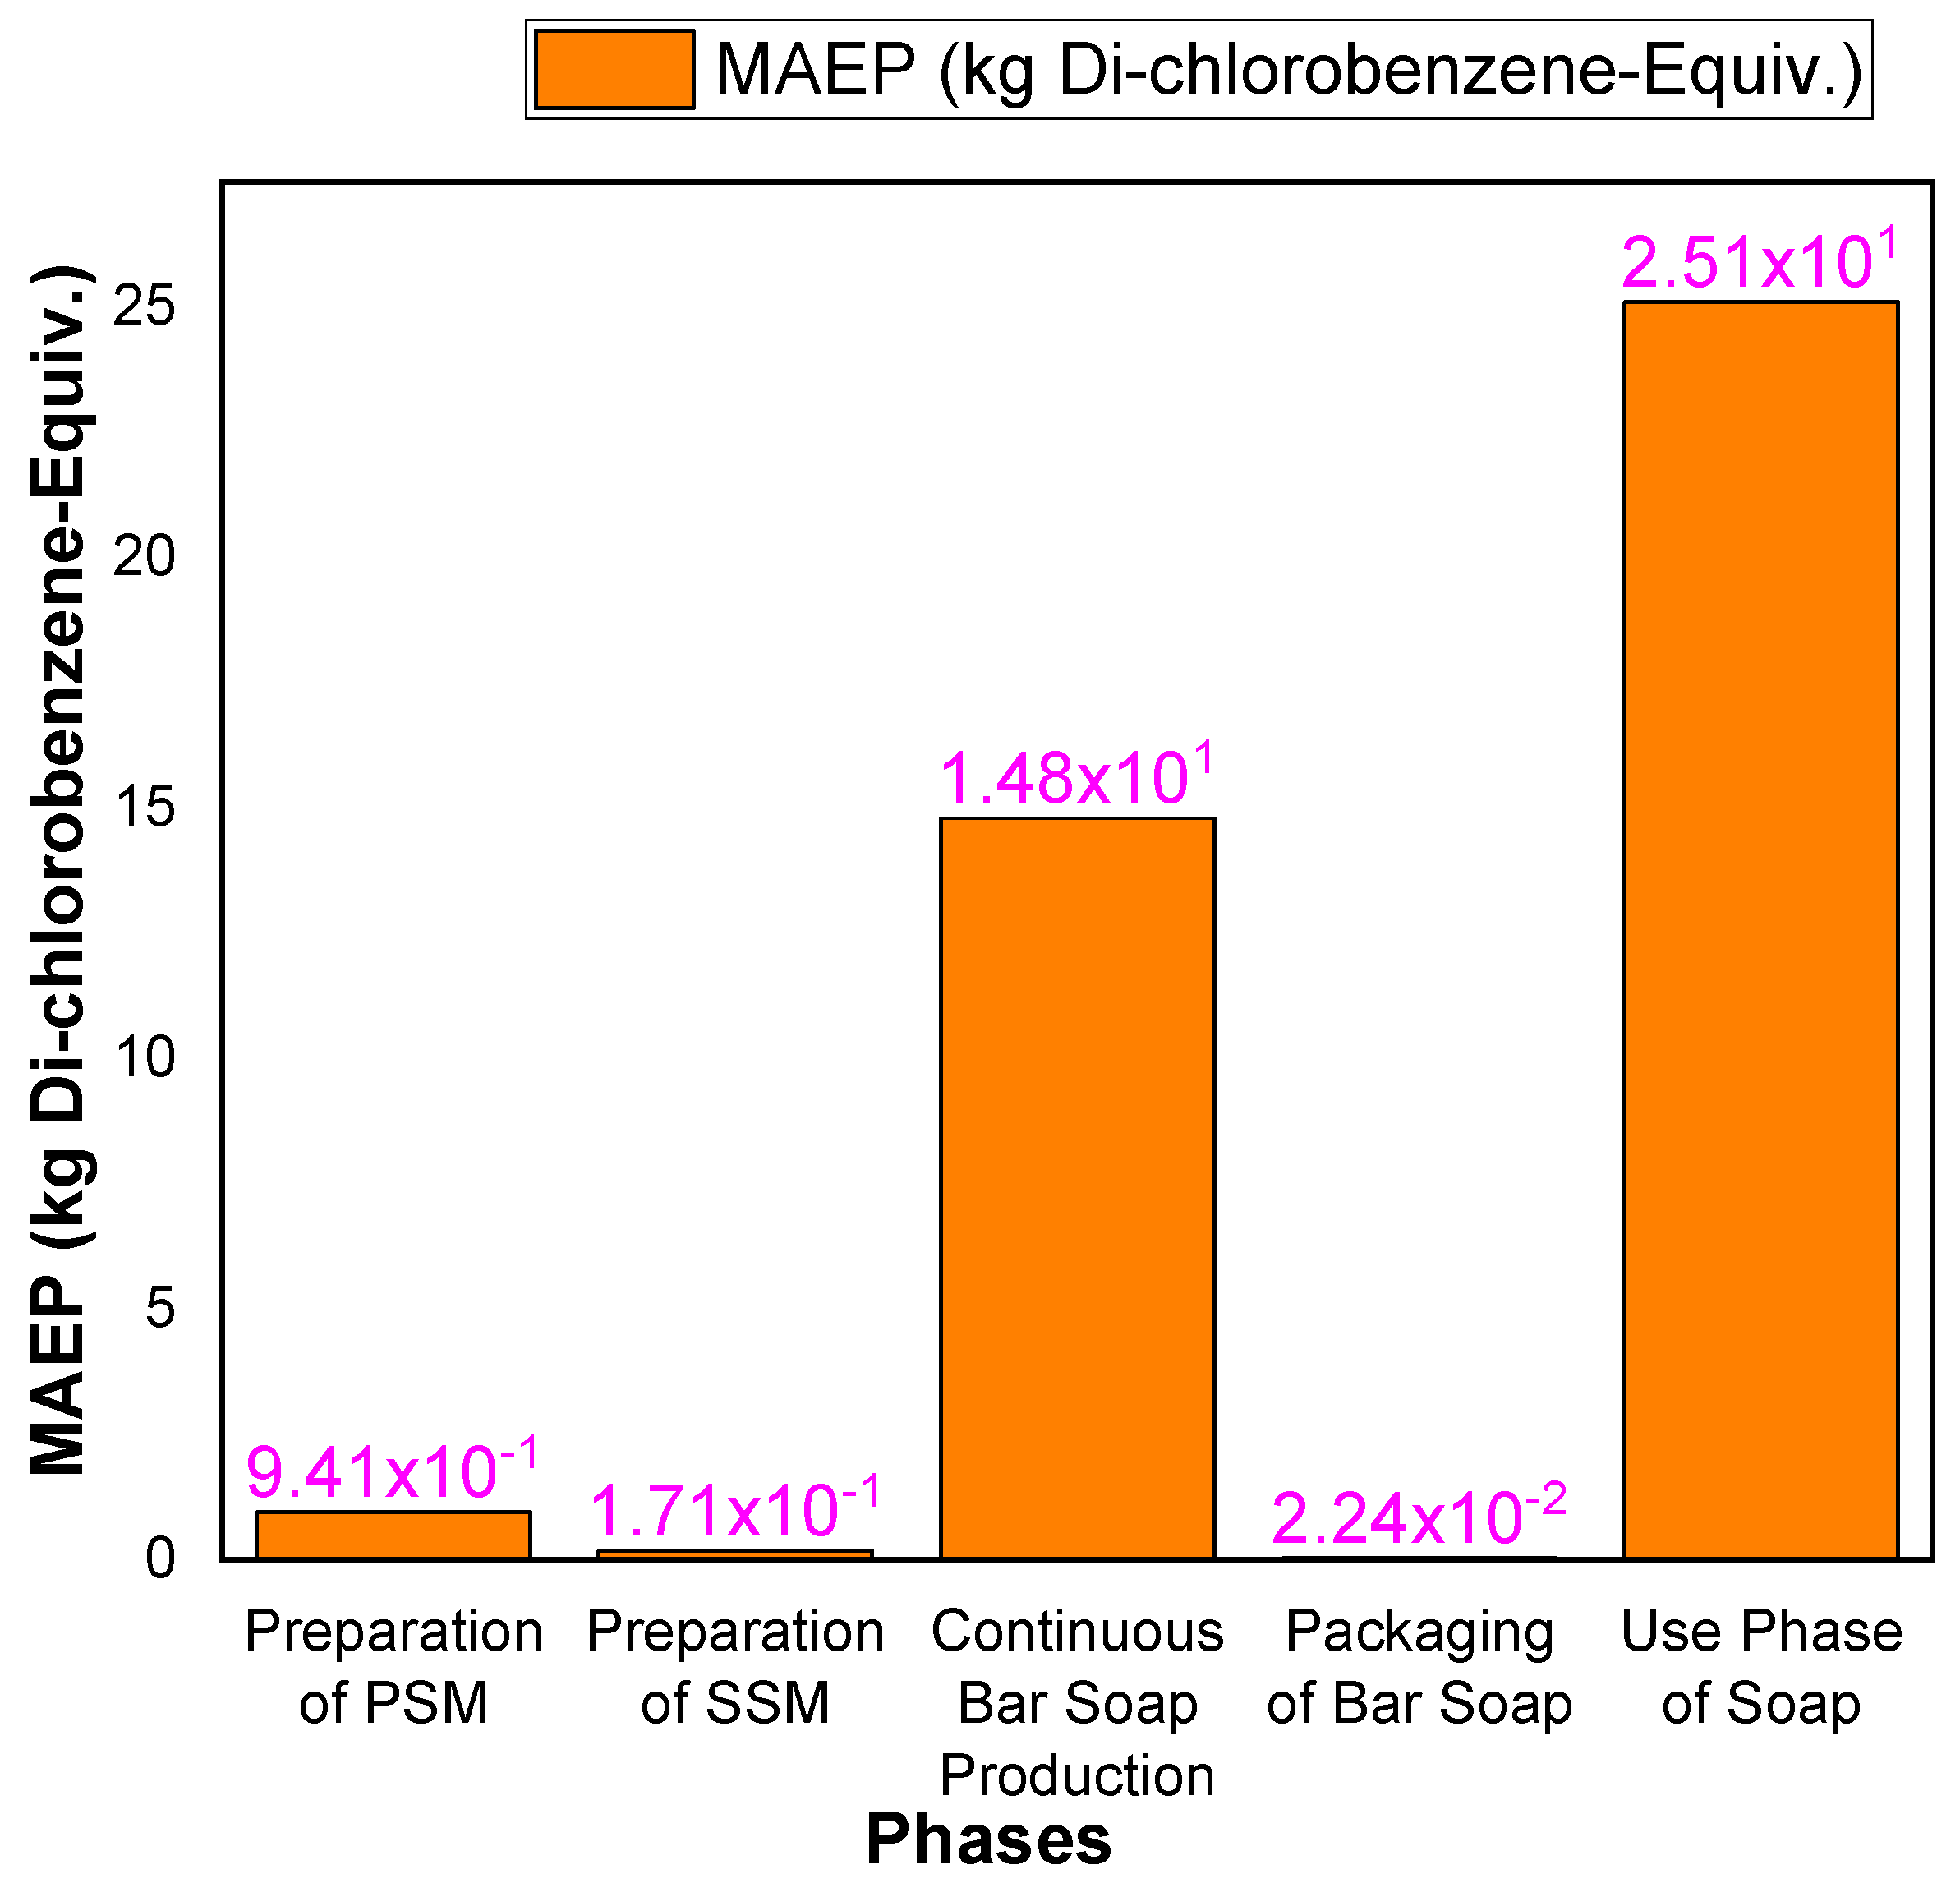
4.10. Marine Aquatic Ecotoxicity Potential

MAEP refers to the effect of harmful substances on marine aquatic ecosystems. It is characterized using the USES 2.0 methodology [35], which describes the fate, exposure, and effects of toxic substances, adapted for use in LCAs. The impact is evaluated based on an infinite time horizon, also known as MAEP [36]. Figure 12 indicates the MAEP in each subsystem. The use phase of soap is very harmful to marine life. From the analysis, it is observed that 25.1 kg DCB equivalent is generated due to the use of a single kilogram of soap. The total amount of MAEP is 41.1 kg DCB equivalent.

4.11. Terrestrial Ecotoxicity Potential

TEP measures the impact of harmful substances on terrestrial ecosystems using the USES 2.0 methodology [35], which evaluates the fate, exposure, and effects of toxic substances in LCAs. The impact is assessed over an infinite time horizon and referred to as TEP [36]. Some researchers propose using greywater from laundry for gardening, but this can also contribute to terrestrial ecotoxicity. GaBi quantifies this indicator, with the use phase accounting for 99.99% of its impact. A sustainable solution could be to reduce the amount of soap or powder detergent used.

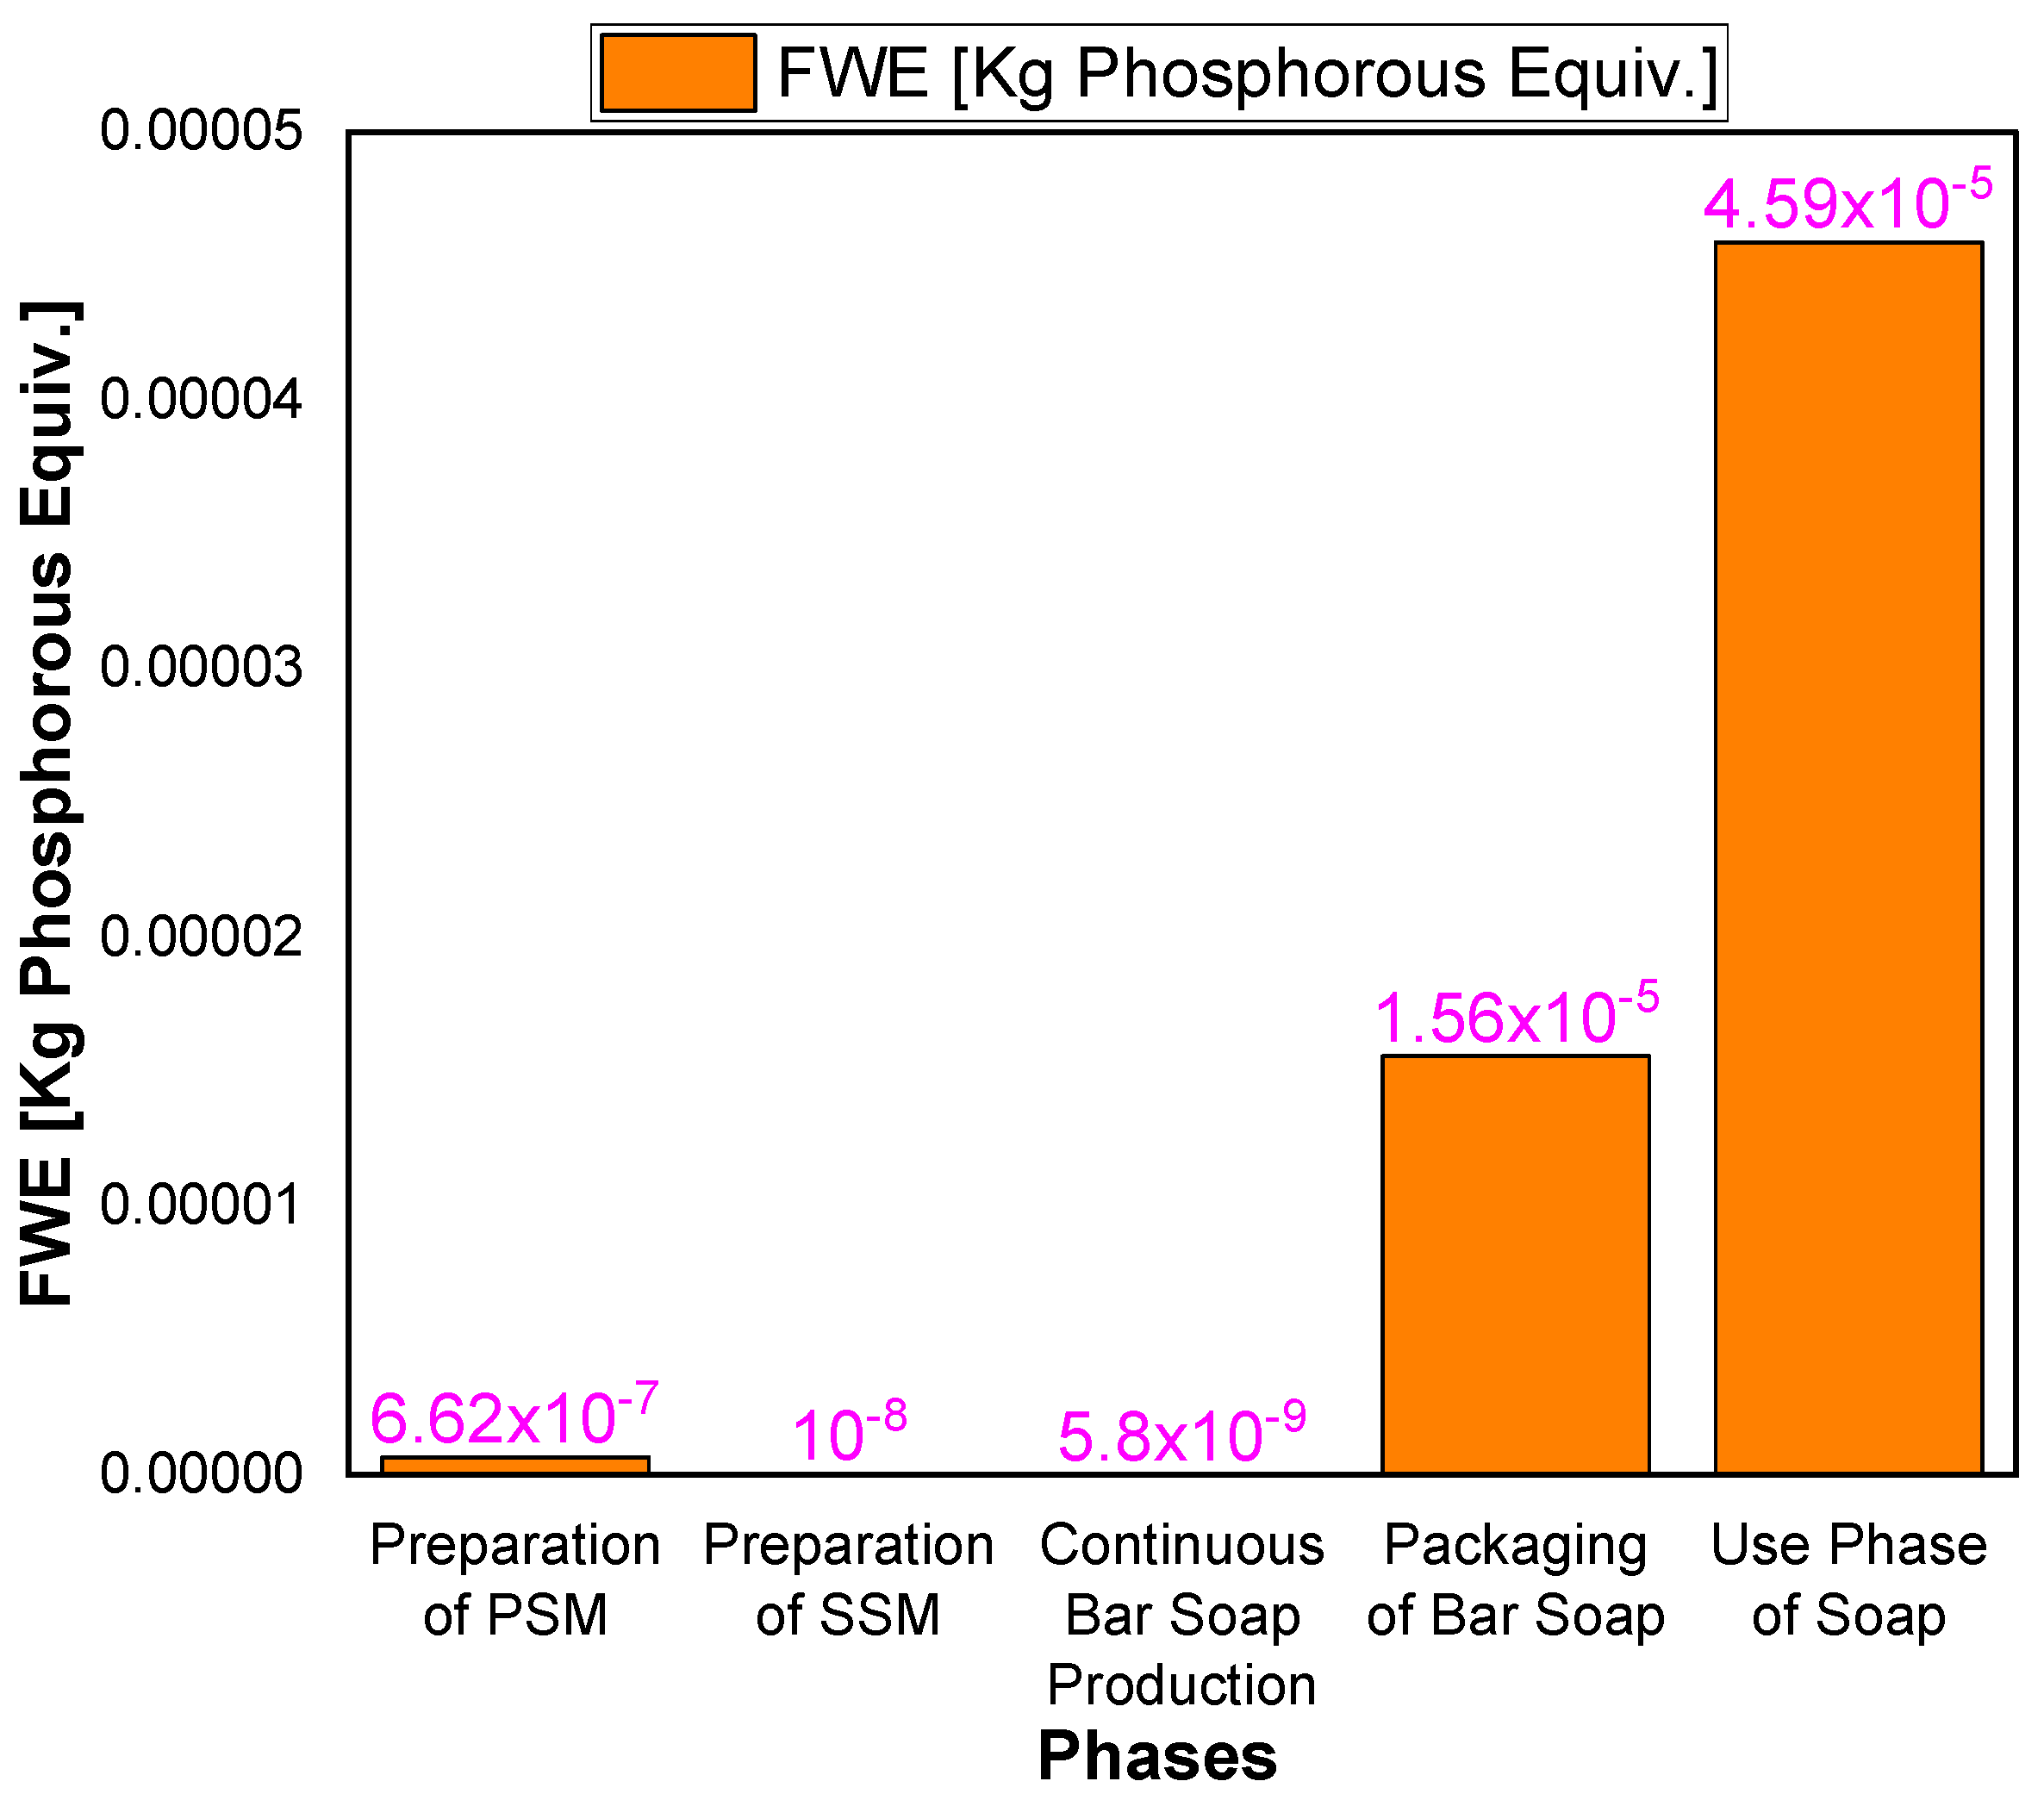
4.12. Freshwater Eutrophication

Freshwater eutrophication is the result of the inappropriate increase of macro and micronutrients, particularly nitrogen (N) and phosphorus (P), which leads to changes in species diversity and an increased production of biomass in aquatic and terrestrial ecosystems. This effect is characterized by a stoichiometric procedure applied to aquatic and terrestrial systems [36]. Figure 13 shows the freshwater eutrophication impact in each subsystem. As manual washing of laundry is highly dependent on consumer behavior, this indicator is affected by it. Therefore, the highest impact is observed in the use phase, with freshwater eutrophication of 4.59 × 10⁻⁵ kg phosphate equivalent, which represents 98.5% of the total amount generated by the use of a kilogram of soap.

5. Critical Discussion

This study quantified various environmental impacts across the identified system boundary and assessed them across different life cycle stages, ultimately identifying hotspots through the value chain of soap bar production. Eutrophication was found to have the highest burden on the environment compared to other categories. However, this study faced certain limitations, such as a lack of information on part-level data or materials, which led to carrying out the analysis one level higher or considering closed proxies of uncertain information. Nevertheless, the research ensured that the overall data quality was high and represented the actual scenario by closely monitoring data quality considerations such as completeness, timeliness, consistency, and geographical references. Some environmental impact categories showed higher values compared to others, and hotspots were identified at the process and source level for these indicators.
The global warming potential results show that a total of 7.71 × 10⁻² kg CO2-Equiv. is created during the production and use phase of bar soap, with the major contribution from primary soap production of bar soap accounting for 58.16%. A similar result on GWP was obtained by Francke and Castro [12], and they found that from a life cycle perspective, the product use phase has the most significant environmental impacts of soap bars and impacts are also variable due to consumer habits. It is evident that the production of PSM consumes a lot of heat via steam, hence having a higher GWP value than other processes. Since this case study is based in Jaipur, Rajasthan, one possible reduction technique for GWP could be the simultaneous use of solar energy to generate steam, particularly in the summer season when the atmospheric temperature reaches as high as 48 °C [12].
In terms of blue water consumption, the highest amount comes during the use phase, which is 0.9 m3 equivalent based on survey data, followed by the production of PSM with 1.22 × 10⁻¹ m3 equivalent. To reduce blue water consumption, there is a need to educate people on sustainable options available for laundry washing [12,31]. This finding makes sense because, unlike petrochemical processes, which mostly use fossil fuels to meet energy needs, compounds made from vegetable oils use renewable energy sources. This means that both energy needs and the chance of global warming go down [37].
Eutrophication is a threat to marine life, and laundry water is one of the reasons for higher eutrophication in water bodies. As previously stated, laundry washing depends a lot on consumer behavior regarding soap and detergent consumption. Therefore, it is advisable to reduce too-frequent washing of laundry, especially if not necessary [32].
Terrestrial eco toxicity potential is caused by a high sodium adsorption rate resulting from the adsorption of laundry greywater into the soil when the greywater is not channeled to gutters and instead flows over a surface. A sustainable way to reduce this effect is to properly flush greywater instead of letting it spill over the soil surface [34].
Plastic packaging impacts are unknown because of the unavailability of the disposition of wrappers of soap bars. However, it is well known that the plastic packaging either goes to the landfill or is flushed to water bodies. A recent development in technologies has introduced a circular economy concept in which wealth can be created from waste [38,39]. The production of Syngas or pyrolysis fuel from waste plastics could be an alternative to waste minimization and could reduce the burden on the environment [40]. One of the companies in Tamil Nadu (India) packs their soaps in handwoven bamboo pouches. Another in Karnataka (India) wraps their soaps in banana fiber paper. A company in Maharashtra, India, utilizes the naked packaging approach for its soap products. This approach involves covering the soap with only a thin strip of recycled paper or kora cotton that has a label. The company has adopted this method due to the long decomposition time of plastics, which results in a buildup of plastic waste in landfills and oceans [41]. The company recognizes that this plastic waste not only harms the environment but also affects the wildlife that consume it. Hence it is advisable to use recycled paper or biogenic materials for packaging or, at least for the sake of sustainable packaging, the recycling of plastics should be carried out.

6. Conclusions and Outlook

The aim of this research was to evaluate the environmental impacts associated with the entire life cycle of washing bar soap, identify critical areas in the value chain for optimization, and propose sustainability recommendations based on the study’s results. The research estimated several environmental effects throughout the system boundary that was established, evaluated the impacts at various phases of the life cycle, and eventually carried out a hotspot analysis. It was found that eutrophication had the greatest strain on the ecosystem when compared to the different categories. The present study is useful for soap manufacturer managers, policymakers, and researchers. In light of the findings of this study, managers can identify hotspots and develop strategies that minimize environmental impacts. Implications for policymakers are particularly essential as soap is a regularly used product, and a study of its environmental impact can help lawmakers to make eco-efficient and sustainable policies to ensure its long-term growth. To further expand this study, a global analysis could be conducted by considering various types of soap production including washing bar soap, bath soap, liquid detergent, and powder detergent. Future research could also explore the cradle-to-cradle system boundary and recycling benefits. Internal and external benchmarking of the value chain could be initiated, and product-specific LCAs could be performed for new generation soap products. While this study’s findings demonstrate that an environmentally conscious society and national regulations can significantly reduce the environmental impact, the most significant change required is to raise consumer awareness and initiate individual efforts to decrease their environmental footprint. Therefore, the environmental impact of washing bar soap depends largely on the behavior of the consumers. Moreover, uncertainty analysis, which is essential to ensure accurate environmental assessment, should be conducted to provide reliable research results.
Future Scope: To further expand the study, a global analysis could be conducted by considering various types of soap production, including washing bar soap, bath soap, liquid detergent, and powder detergent. Future research could also explore the cradle-to-cradle system boundary and recycling benefits. Internal and external benchmarking of the value chain could be initiated, and product-specific LCAs could be performed for new-generation soap products. For future research, many tools, such as techno-economic, LCA, energy, and exergy studies, may be utilized to examine the sustainability of soap bars across their whole value chain. Each approach of assessing sustainability has advantages and disadvantages, therefore the best method relies on the study purpose, process complexity, and required level of precision. Overall, integrated sustainability assessment methodologies have the potential to produce more trustworthy and accurate outcomes than single approaches. It is worth noting that integrated strategies can also reduce the majority of the shortcomings of isolated procedures. Exergy-based assessments, particularly when supplemented with economic and environmental variables, can provide more useful indicators than other sustainability assessment tools. Exergy-based integrated techniques (exergoeconomic, exergoenvironmental, and exergoeconoenvironmental) can offer decision-makers information that exergy, techno-economic, and LCA analyses cannot [42]. These ideas can help academics and engineers construct a soap bar value chain that is both economically and environmentally sustainable. While this study’s findings demonstrate that an environmentally conscious society and national regulations can significantly reduce environmental impacts, the most significant change required is to raise consumer awareness and initiate individual efforts to decrease their environmental footprint. Therefore, the environmental impact of washing bar soap depends largely on the behavior of the consumers. Moreover, uncertainty analysis, which is essential for proper environmental assessment, should be conducted to provide reliable research results.
Limitations: The information was gathered from the soap production plant on the basis of the prepared questionnaire because there was a lack of information accessibility from the literature. Moreover, this study faced certain limitations, such as a lack of information on part-level data or materials, which led to carrying out the analysis one level higher or considering closed proxies of uncertain information. Some limitations are:
  • The site-specific emission factor for electricity is computed based on the contribution of electricity supplied from a power plant.
  • The GaBi version 8: 2015 specific database is used for evaluating environmental emissions. The latest software database may produce variations in the results.
  • This study is based on average data. In case of individual purchase decisions, the parameters influencing the results might differ from the assumed average data.
  • The results are only valid for the geographical scope of this study (India). Different parameters strongly depend on the country or climatic conditions. Examples of those parameters are: electricity supply and consumer behavior (washing habits).
  • For road transport, country-specific pollution norms are considered.
  • The variation in consumer use of washing soap was not addressed in this study.
Implications: This study has several implications for soap manufacturer managers, policymakers, and researchers. In light of the findings of this study, managers can identify hotspots and develop strategies that minimize environmental impacts. Implications for policymakers are particularly essential, as soap is a regularly used product, and a study of its environmental impact can help lawmakers to make eco-efficient policies to ensure its long-term growth.

Author Contributions

Conceptualization, G.G., G.S.D. and S.G.; methodology, M.L.M.; software, V.C.; validation, G.S.D., M.L.M., V.C., S.G. and S.J.; formal analysis, G.G. and S.G.; investigation, G.G. and S.G.; resources, S.G.; data curation, M.L.M.; writing—original draft preparation, G.G., G.S.D., M.L.M., V.C., S.G., and S.J.; writing—review and editing, G.G., G.S.D., M.L.M., V.C., S.G. and S.J.; visualization, G.G. and S.G.; supervision, G.S.D., M.L.M., V.C., S.G. and S.J.; project administration, S.G.; funding acquisition, S.J. All authors have read and agreed to the published version of the manuscript.

Funding

This research received no external funding.

Institutional Review Board Statement

Not applicable.

Informed Consent Statement

Not applicable.

Data Availability Statement

Not applicable.

Conflicts of Interest

The authors declare no conflict of interest.

Abbreviations

LCALife Cycle Assessment
LCILife Cycle Inventory
SMSustainable manufacturing
FMCGFast-moving consumer goods
ISOInternational Organization for Standardization
CMLCentrum voor Milieukunde Leiden
Jjoule
kgkilogram
dday
ADPAbiotic Depletion
APAcidification Potential
EPEutrophication Potential
GWPGlobal Warming Potential
HTPHuman Toxicity Potential
ODPOzone Layer Depletion Potential
POCPPhotochemical Ozone Creation Potential
PEDPrimary Energy Demand
MAEPMarine Aquatic Ecotoxicity Potential
TEPTerrestrial Ecotoxicity Potential
BWCBlue Water Consumption
FEPFreshwater Eutrophication
SSMSecondary Soap Mix
PSMPrimary Soap Mix
TRItoxic release inventory
DCBDichlorobenzene
SbAntimony
VOCsvolatile organic compounds
CFCsChlorofluorocarbons
EoLEnd-of-Life

References

  1. Malviya, S. HUL, P&G, Nirma Lose Market Share to Small Local Brands. Econ. Times 2017. [Google Scholar]
  2. Singh, C.; Osbahr, H.; Dorward, P. The Implications of Rural Perceptions of Water Scarcity on Differential Adaptation Behaviour in Rajasthan, India. Reg. Environ. Chang. 2018, 18, 2417–2432. [Google Scholar] [CrossRef] [Green Version]
  3. Yuan, Z.; Zhang, Y.; Liu, X. Life Cycle Assessment of Horizontal-Axis Washing Machines in China. Int. J. Life Cycle Assess. 2016, 21, 15–28. [Google Scholar] [CrossRef]
  4. Chirani, M.R.; Kowsari, E.; Teymourian, T.; Ramakrishna, S. Environmental Impact of Increased Soap Consumption during COVID-19 Pandemic: Biodegradable Soap Production and Sustainable Packaging. Sci. Total Environ. 2021, 796, 149013. [Google Scholar] [CrossRef] [PubMed]
  5. TechSci Research. India Soap Market, by Form, by Distribution Channel, by Application, by Region, by Company, Competition, Forecast & Opportunities, FY2016–FY2026; TechSci Research: Noida, India, 2020. [Google Scholar]
  6. Talic, S.; Shah, S.; Wild, H.; Gasevic, D.; Maharaj, A.; Ademi, Z.; Li, X.; Xu, W.; Mesa-Eguiagaray, I.; Rostron, J.; et al. Effectiveness of Public Health Measures in Reducing the Incidence of COVID-19, SARS-CoV-2 Transmission, and COVID-19 Mortality: Systematic Review and Meta-Analysis. BMJ 2021, 375, e068302. [Google Scholar] [CrossRef] [PubMed]
  7. TechSci Research. Global Soaps Market, by Type (Liquid Soaps and Bar Soaps), by Distribution Channel (Modern Trade, Traditional Trade and Online), by Region, by Company, Competition, Forecast & Opportunities, 2025; TechSci Research: Noida, India, 2020. [Google Scholar]
  8. ISO 14040:2006; Environmental Management—Life Cycle Assessment—Principles and Framework. ISO: Geneva, Switzerland, 2006.
  9. ISO 14044:2006; Environmental Management—Life Cycle Assessment—Requirements and Guidelines. ISO: Geneva, Switzerland, 2006.
  10. Villota-Paz, J.M.; Osorio-Tejada, J.L.; Morales-Pinzón, T. Comparative life cycle assessment for the manufacture of bio-detergents. Environ. Sci. Pollut. Res. 2023, 30, 34243–34254. [Google Scholar] [CrossRef]
  11. Giagnorio, M.; Amelio, A.; Grüttner, H.; Tiraferri, A. Environmental Impacts of Detergents and Benefits of Their Recovery in the Laundering Industry. J. Clean. Prod. 2017, 154, 593–601. [Google Scholar] [CrossRef]
  12. Francke, I.C.M.; Castro, J.F.W. Carbon and Water Footprint Analysis of a Soap Bar Produced in Brazil by Natura Cosmetics. Water Resour. Ind. 2013, 1–2, 37–48. [Google Scholar] [CrossRef] [Green Version]
  13. Van Lieshout, K.G.; Bayley, C.; Akinlabi, S.O.; von Rabenau, L.; Dornfeld, D. Leveraging life cycle assessment to evaluate environmental impacts of green cleaning products. Procedia CIRP 2015, 29, 372–377. [Google Scholar] [CrossRef]
  14. Rosen, M.A.; Kishawy, H.A. Sustainable Manufacturing and Design: Concepts, Practices and Needs. Sustainability 2012, 4, 154–174. [Google Scholar] [CrossRef] [Green Version]
  15. Kishawy, H.; Hegab, H.; Saad, E. Design for Sustainable Manufacturing: Approach, Implementation, and Assessment. Sustainability 2018, 10, 3604. [Google Scholar] [CrossRef] [Green Version]
  16. Daraban, A.E.O.; Negrea, C.S.; Artimon, F.G.P.; Angelescu, D.; Popan, G.; Gheorghe, S.I.; Gheorghe, M. A Deep Look at Metal Additive Manufacturing Recycling and Use Tools for Sustainability Performance. Sustainability 2019, 11, 5494. [Google Scholar] [CrossRef] [Green Version]
  17. Khasreen, M.; Banfill, P.F.; Menzies, G. Life-Cycle Assessment and the Environmental Impact of Buildings: A Review. Sustainability 2009, 1, 674–701. [Google Scholar] [CrossRef]
  18. Awasthi, A.K.; Cheela, V.R.S.; D’Adamo, I.; Iacovidou, E.; Islam, M.R.; Johnson, M.; Miller, T.R.; Parajuly, K.; Parchomenko, A.; Radhakrishan, L.; et al. Zero Waste Approach towards a Sustainable Waste Management. Resour. Environ. Sustain. 2021, 3, 100014. [Google Scholar] [CrossRef]
  19. Martindale, W.; Duong, L.; Jagtap, S. Food Industry 4.0; CABI: Wallingford, UK, 2022; ISBN 9781789248425. [Google Scholar]
  20. Karwacka, M.; Ciurzyńska, A.; Lenart, A.; Janowicz, M. Sustainable Development in the Agri-Food Sector in Terms of the Carbon Footprint: A Review. Sustainability 2020, 12, 6463. [Google Scholar] [CrossRef]
  21. Salem, A.; Hopkins, C.; Imad, M.; Hegab, H.; Darras, B.; Kishawy, H.A. Environmental Analysis of Sustainable and Traditional Cooling and Lubrication Strategies during Machining Processes. Sustainability 2020, 12, 8462. [Google Scholar] [CrossRef]
  22. Sen, B.; Mia, M.; Krolczyk, G.M.; Mandal, U.K.; Mondal, S.P. Eco-Friendly Cutting Fluids in Minimum Quantity Lubrication Assisted Machining: A Review on the Perception of Sustainable Manufacturing. Int. J. Precis. Eng. Manuf.-Green Technol. 2021, 8, 249–280. [Google Scholar] [CrossRef] [Green Version]
  23. Jha, M.K.; Das, P.P.; Gupta, S.; Chaudhary, V.; Gupta, P. Complementing the Circular Economy with a Life Cycle Assessment of Sustainable Hydrogels and Their Future Prospects. In Sustainable Hydrogels; Elsevier: Amsterdam, The Netherlands, 2023; pp. 489–503. [Google Scholar]
  24. Sun, L.; Qin, L.; Taghizadeh-Hesary, F.; Zhang, J.; Mohsin, M.; Chaudhry, I.S. Analyzing Carbon Emission Transfer Network Structure among Provinces in China: New Evidence from Social Network Analysis. Environ. Sci. Pollut. Res. 2020, 27, 23281–23300. [Google Scholar] [CrossRef] [PubMed]
  25. Yip, W.S.; Zhou, H.; To, S. A Critical Analysis on the Triple Bottom Line of Sustainable Manufacturing: Key Findings and Implications. Environ. Sci. Pollut. Res. 2023, 30, 41388–41404. [Google Scholar] [CrossRef]
  26. Wen, H.; Liang, W.; Lee, C.-C. China’s Progress toward Sustainable Development in Pursuit of Carbon Neutrality: Regional Differences and Dynamic Evolution. Environ. Impact Assess. Rev. 2023, 98, 106959. [Google Scholar] [CrossRef]
  27. Wang, E.-Z.; Lee, C.-C. The Impact of Clean Energy Consumption on Economic Growth in China: Is Environmental Regulation a Curse or a Blessing? Int. Rev. Econ. Financ. 2022, 77, 39–58. [Google Scholar] [CrossRef]
  28. Ulvenblad, P.; Ulvenblad, P.; Tell, J. An Overview of Sustainable Business Models for Innovation in Swedish Agri-Food Production. J. Integr. Environ. Sci. 2019, 16, 1–22. [Google Scholar] [CrossRef] [Green Version]
  29. Gustavo, J.U.; Pereira, G.M.; Bond, A.J.; Viegas, C.V.; Borchardt, M. Drivers, Opportunities and Barriers for a Retailer in the Pursuit of More Sustainable Packaging Redesign. J. Clean. Prod. 2018, 187, 18–28. [Google Scholar] [CrossRef] [Green Version]
  30. Muthu, S.S. Environmental Impacts of the Use Phase of the Clothing Life Cycle. In Handbook of Life Cycle Assessment (LCA) of Textiles and Clothing; Elsevier: Amsterdam, The Netherlands, 2015; pp. 93–102. [Google Scholar]
  31. Patel, M.K.; Theiß, A.; Worrell, E. Surfactant Production and Use in Germany: Resource Requirements and CO2 Emissions. Resour. Conserv. Recycl. 1999, 25, 61–78. [Google Scholar] [CrossRef]
  32. Kumar, L.R.; Yellapu, S.K.; Tyagi, R.D.; Zhang, X. A Review on Variation in Crude Glycerol Composition, Bio-Valorization of Crude and Purified Glycerol as Carbon Source for Lipid Production. Bioresour. Technol. 2019, 293, 122155. [Google Scholar] [CrossRef] [PubMed]
  33. Mohamed, R.M.S.R.; Kassim, A.H.M.; Anda, M.; Dallas, S. A Monitoring of Environmental Effects from Household Greywater Reuse for Garden Irrigation. Environ. Monit. Assess. 2013, 185, 8473–8488. [Google Scholar] [CrossRef]
  34. Gaurav, G.; Kumar, V.; Bihari singh, A.; Gupta, S.; Meena, M.L.; Dangayach, G.S.; Kumar Jindal, M. Life Cycle Assessment of Extraction of Edible Oil from Mustard Seeds: A Case Study of an Oil Industry. Mater. Today Proc. 2023. [Google Scholar] [CrossRef]
  35. Huijbregts, M.A.J.; Steinmann, Z.J.N.; Elshout, P.M.F.; Stam, G.; Verones, F.; Vieira, M.D.M.; Hollander, A.; Zijp, M.; van Zelm, R. ReCiPe2016: A harmonised life cycle impact assessment method at midpoint and endpoint level. Int. J. Life Cycle Assess. 2017, 22, 138–147. [Google Scholar] [CrossRef]
  36. Guinee, J.B. Handbook on Life Cycle Assessment Operational Guide to the ISO Standards. Int. J. Life Cycle Assess. 2002, 7, 311. [Google Scholar] [CrossRef]
  37. Shafiei, S.; Salim, R.A. Non-renewable and renewable energy consumption and CO2 emissions in OECD countries: A comparative analysis. Energy Policy 2014, 66, 547–556. [Google Scholar] [CrossRef] [Green Version]
  38. Brandao, M.; Heijungs, R.; Cowie, A.R. On quantifying sources of uncertainty in the carbon footprint of biofuels: Crop/feedstock, LCA modelling approach, land-use change, and GHG metrics. Biofuel Res. J. 2022, 9, 1608–1616. [Google Scholar] [CrossRef]
  39. Lacy, P.; Rutqvist, J. Waste to Wealth: The Circular Economy Advantage; Palgrave Macmillan: London, UK, 2015; Volume 91. [Google Scholar]
  40. Vanapalli, K.R.; Samal, B.; Dubey, B.K.; Bhattacharya, J. Emissions and environmental burdens associated with plastic solid waste management. In Plastics to Energy; William Andrew Publishing: Norwich, NY, USA, 2019; pp. 313–342. [Google Scholar]
  41. Das, P.P.; Singh, A.; Mishra, M.K.; Chaudhary, V.; Gupta, S.; Gupta, P. Life Cycle Assessment and Environmental Impact of Plastic Waste. In Biodegradability of Conventional Plastics; Elsevier: Amsterdam, The Netherlands, 2023; pp. 1–16. [Google Scholar]
  42. Aghbashlo, M.; Hosseinzadeh-Bandbafha, H.; Shahbeik, H.; Tabatabaei, M. The role of sustainability assessment tools in realizing bioenergy and bioproduct systems. Biofuel Res. J. 2022, 9, 1697–1706. [Google Scholar] [CrossRef]
Figure 1. System boundary for cradle-to-grave analysis.
Sustainability 15 09287 g001
Figure 2. Cradle-to-grave LCA model of washing bar soap.
Sustainability 15 09287 g002
Figure 3. Process-wise percentage contribution of environmental impact categories in washing bar soap production.
Sustainability 15 09287 g003
Figure 4. Abiotic depletion potential (ADP elements).
Sustainability 15 09287 g004
Figure 5. Acidification potential (AP) in each subsystem.
Sustainability 15 09287 g005
Figure 6. Eutrophication potential (EP) in each subsystem.
Sustainability 15 09287 g006
Figure 7. Global warming potential (GWP) in each subsystem.
Sustainability 15 09287 g007
Figure 8. Human toxicity potential in each subsystem.
Sustainability 15 09287 g008
Figure 9. Photochemical ozone creation potential (POCP) in each subsystem.
Sustainability 15 09287 g009
Figure 10. Ozone layer depletion potential (ODP) in each subsystem.
Sustainability 15 09287 g010
Figure 11. Primary energy demand in each subsystem.
Sustainability 15 09287 g011
Figure 12. Marine aquatic ecotoxicity potential in each subsystem.
Sustainability 15 09287 g012
Figure 13. Freshwater eutrophication in each subsystem.
Sustainability 15 09287 g013
Table 1. Latest research works in the field of LCA of soap bar/detergent.
ReferenceTitleProduct/ProcessSystem Boundary Functional UnitSoftware UsedMethodology CountryImpact Categories Outcomes
[10] Villota-Paz et al., 2023Comparative life cycle assessment for the manufacture of bio-detergentsBiodegradable detergentsCradle-to-gate1 L detergentSimaPro v9ReCiPe-2016ColombiaPED GWP POCP
PED
MAEP
TEP
BWC
Liquid detergent presented better environmental performance than traditional detergents in all the impact categories, except for the fossil resource scarcity category.
[11] Giagnorio et al., 2017Environmental impacts of detergents and benefits of their recovery in the laundering industryDetergents Production and industrial washing systemsCradle-to-grave1 kg detergentSimapro v8Recipe ItalyPED and GWPThe results show that the production of detergents has a wide impact distribution, with the ecosystem being the most affected impact category.
[12] Francke and Castro 2013Carbon and water footprint analysis of a soap bar produced in Brazil by Natura CosmeticsSoap BarCradle-to-grave450 g of soapCalculation IPCC—Intergovernmental Panel on Climate ChangeLatin AmericaCarbon Footprints (CF) And Water Footprints (WF)Analysis reveals that the total for the soap bar was 741 g CO2e, while the WF was 1.581 l, 1.587 l, and 3.672 l for the green, blue, and gray components, respectively.
[13] Van Lieshout et al., 2015Leveraging Life Cycle Assessment to evaluate environmental impacts of green cleaning productsAll-purpose cleaner, hand wash, dish soap), and Ecover (dish soap)Cradle-to-grave1 kg Cleaning ProductsSimapro v8ReCiPeUSAADP
AP
EP
GWP
HTP
ODP
POCP
PED
MAEP
TEP
BWC
Results show that hand wash and dish soap, given their high percentage, significantly contribute to the product’s environmental impacts.
Table 2. Life Cycle Inventory for bar soap production.
CategoryInputsOutputs
Stage 1: Steam ProductionSubstanceAmountUnitSubstanceAmountUnit
Coal (Indonesian bituminous)0.025kgSteam (150 °C) 0.150kg
Water0.150kgAsh0.002kg
Coal Pulveriser 805.68JClinker0.002kg
Wood (Plywood, Timber)0.006kgSOx0.019kg
NOx0.004kg
Fixed Carbon By-Product 0.018kg
Other Volatile Matter0.007kg
Coal and Wood Moisture0.001kg
Stage 2:
PSM
Caustic Soda 0.130kgPrimary Soap Mix0.802kg
Acid Oil (Ester)0.600kgSteam (110 °C)0.150kg
Water 0.091kgDrain0.022kg
Steam (130 °C) 0.150kgWater Vapor0.004kg
Stage 3:
SSM
Primary Soap Mix0.802kgSecondary Soap Mix1.003kg
Sodium Silicate 0.270kgWater 0.013kg
Salt0.007kgWater Vapor0.005kg
Water0.020kgGlycerol0.077kg
Compressed Air 0.021kgSteam converted to water0.150kg
Steam (110 °C) 0.150kg
Power Blender 34,912.8J
Dye and Fragrance0.003L
Stage 4: Soap ProductionSecondary soap Mix1.004kgSolid Soap1kg
Water flow in floater0.25kgWater Vapor0.004kg
Motor to rotate Floater6042.6J
Pump2417.04J
Conveyor Motors3222.72J
Rolling mill Motors 4834.08J
Conveyor Motors3222.72J
Printing rollers’ motor805.68J
Cutter Motors1611.36J
Conveyor Motors537.12J
Packer67.14J
Cutter67.14J
Energy22,827.6J
Stage 5: PackagingPolyethylene0.005kg
Corrugated Box0.017kg
Table 3. Process-wise life cycle environmental impacts indicator of a washing bar soap.
Environmental IndicatorPreparation of PSMPreparation of SSMContinuous Bar Soap ProductionPackaging of Bar SoapUse Phase of SoapTotal
Abiotic Depletion (ADP elements) [kg Sb-Equiv.]3.15 × 10−84.29 × 10−96.70 × 10−83.39 × 10−11 1.03 × 10⁻⁷
Acidification Potential (AP) [kg SO2-Equiv.]1.17 × 10−42.20 × 10−41.29 × 10−41.55 × 10−6 4.68 × 10⁻⁴
Eutrophication Potential (EP) [kg Phosphate-Equiv.]2.50 × 10−59.53 × 10−65.46 × 10−61.81 × 10−51.40 × 10−41.98 × 10−4
Global Warming Potential (GWP) [kg CO2-Equiv.]4.88 × 10−21.78 × 10−21.03 × 10−23.09 × 10−4 7.72 × 10⁻²
Human Toxicity Potential (HTP) [kg Di-chlorobenzene-Equiv.]4.90 × 10−25.81 × 10−33.41 × 10−32.82 × 10−6 5.82 × 10⁻²
Ozone Layer Depletion Potential (ODP) [kg R11-Equiv.]1.58 × 10−83.15 × 10−151.85 × 10−157.68 × 10⁻¹³ 1.58 × 10⁻⁸
Photochemical Ozone Creation Potential (POCP) [kg Ethene-Equiv.]4.27 × 10−59.80 × 10−66.00 × 10−61.70 × 10−7 5.87 × 10⁻⁵
Primary Energy Demand (PED) [J]8.06 × 10+23.49 × 10+42.28 × 10+41.43 × 10+4 7.28 × 10+4
Marine Aquatic Ecotoxicity Potential (MAEP) [kg Di-chlorobenzene-Equiv.]9.41 × 10−11.71 × 10−11.48 × 10+12.24 × 10−22.51 × 10+14.10 × 10+1
Terrestrial Ecotoxicity Potential (TEP) [kg 1,4-DB Equiv.}1.36 × 10−67.64 × 10−74.49 × 10−73.53 × 10−102.18 × 10−12.18 × 10−1
Blue Water Consumption (BWC) [m3 Equiv.]1.22 × 10−11.44 × 10−28.47 × 10−32.43 × 10−79.00 × 10−11.04 × 10+0
Fresh water Eutrophication (FWE) [kg Phosphorous Equiv.]6.62 × 10−71.00 × 10−85.80 × 10−91.56 × 10−54.59 × 10−56.22 × 10−5
Impact ProfileLowest Highest
Disclaimer/Publisher’s Note: The statements, opinions and data contained in all publications are solely those of the individual author(s) and contributor(s) and not of MDPI and/or the editor(s). MDPI and/or the editor(s) disclaim responsibility for any injury to people or property resulting from any ideas, methods, instructions or products referred to in the content.

