1. Introduction
The phenomenon that cohesive soil disperses due to immersion is called disintegration. Disintegration is due to the imbalance of water entering the pores after the soil is submerged in water, and the imbalance of the speed of increasing the thickness of the interparticle diffusion layer, resulting in the repulsion force between particles exceeding the suction, resulting in stress concentration, and causing the soil to collapse along the maximum surface where the repulsion force exceeds the suction force. China is one of the countries with the most widely developed karst and soil caves in the world. The collapse of karst and soil caves often causes huge economic losses and casualties. In cohesive soil, the formation and development of soil cavity are closely related to the disintegration of soil. A large number of scholars have made a lot of achievements in the study of soil disintegration characteristics.
Shang ML compared the pH and oxide concentration of red clay before and after the disintegration of red clay and found through indoor model tests that the degree of disintegration of red clay increased with the decrease in the pH value of acid rain [
1]. In the study of the disintegration of granite residual soil, different scholars have explored its disintegration process through different methods, and the dry and wet cycle test of granite residual soil with different improvers was carried out; the five stages of disintegration are summarized; the disintegration of different curing agents on granite residual soil is different, and in the observation of microstructure changes, the dry and wet cycle will break the cementation effect of particles between soil bodies, weaken the connection between particles, accelerate the disintegration rate of soil masses, and dry density has little effect on the disintegration of granite residual soil, moisture content, and temperature will significantly increase the disintegration of granite residual soil [
2,
3,
4]. In the study of the disintegration of consolidated violet, the moisture content of the soil is strongly correlated with the disintegration speed, and through more detailed analysis, it is found that the disintegration of purple soil is mainly related to the dissolution of the gel material, the water absorption expansion of montmorillonite, and the thickness of electric double layer [
5]. In clay-containing rocks, different scholars use different methods to reveal the different stages of disintegration and the underlying factors of mechanical properties [
6,
7,
8,
9,
10,
11]. Water is one of the main reasons for the disintegration of soil, and the mineral composition in water is also affected. Yi Lu studied the effect of water salinity on GCL, estimating the change in matrix suction at different water salinity and given water content [
12,
13]. The interfacial creep behavior between geomembrane and geotextile was also explored [
14].
Based on the existing research results, this paper studies the disintegration of red clay in Guilin, establishes a new disintegration model, explores the disintegration of red clay in Guilin, uses mechanical sensors to carry out experiments, realizes automatic data collection and storage, improves the reliability of the results, analyzes the formation and development mechanism of soil caves, and lays a good foundation for the prevention and control of karst and soil cave collapse in Guangxi. In this paper, the disintegration characteristics and water absorption characteristics of red clay and the influence of microstructure on the disintegration of red clay were discussed by preparing red clay samples under different conditions.
2. Test Setup
2.1. Sample Preparation
The soil used in this test is taken from a construction site in Yanshan District, Guilin. The sampling depth is 1–1.5 m, and the soil sample is reddish brown. See
Table 1 for the basic physical properties of soil samples.
The disintegration test was carried out at different water contents and temperatures.
1. Disintegration test of red clay with different water content: dry density of 1.4 g/cm3. Cylindrical red clay samples with water content of 0%, 3.5%, 5.7%, 12.2%, 18.6%, and 25.1%, diameter of 9 cm and height of 7.5 cm were taken out for testing after being baked in 105 °C oven for 3D. Other samples are prepared with distilled water to the required water content.
2. Disintegration test of red clay at different temperatures: Guilin has a hot and humid climate (the maximum surface temperature in summer can reach 60 °C), and samples with water content of 0% and 5.7% are tested and compared in water temperatures of 0 °C, 15 °C, 30 °C, and 60 °C.
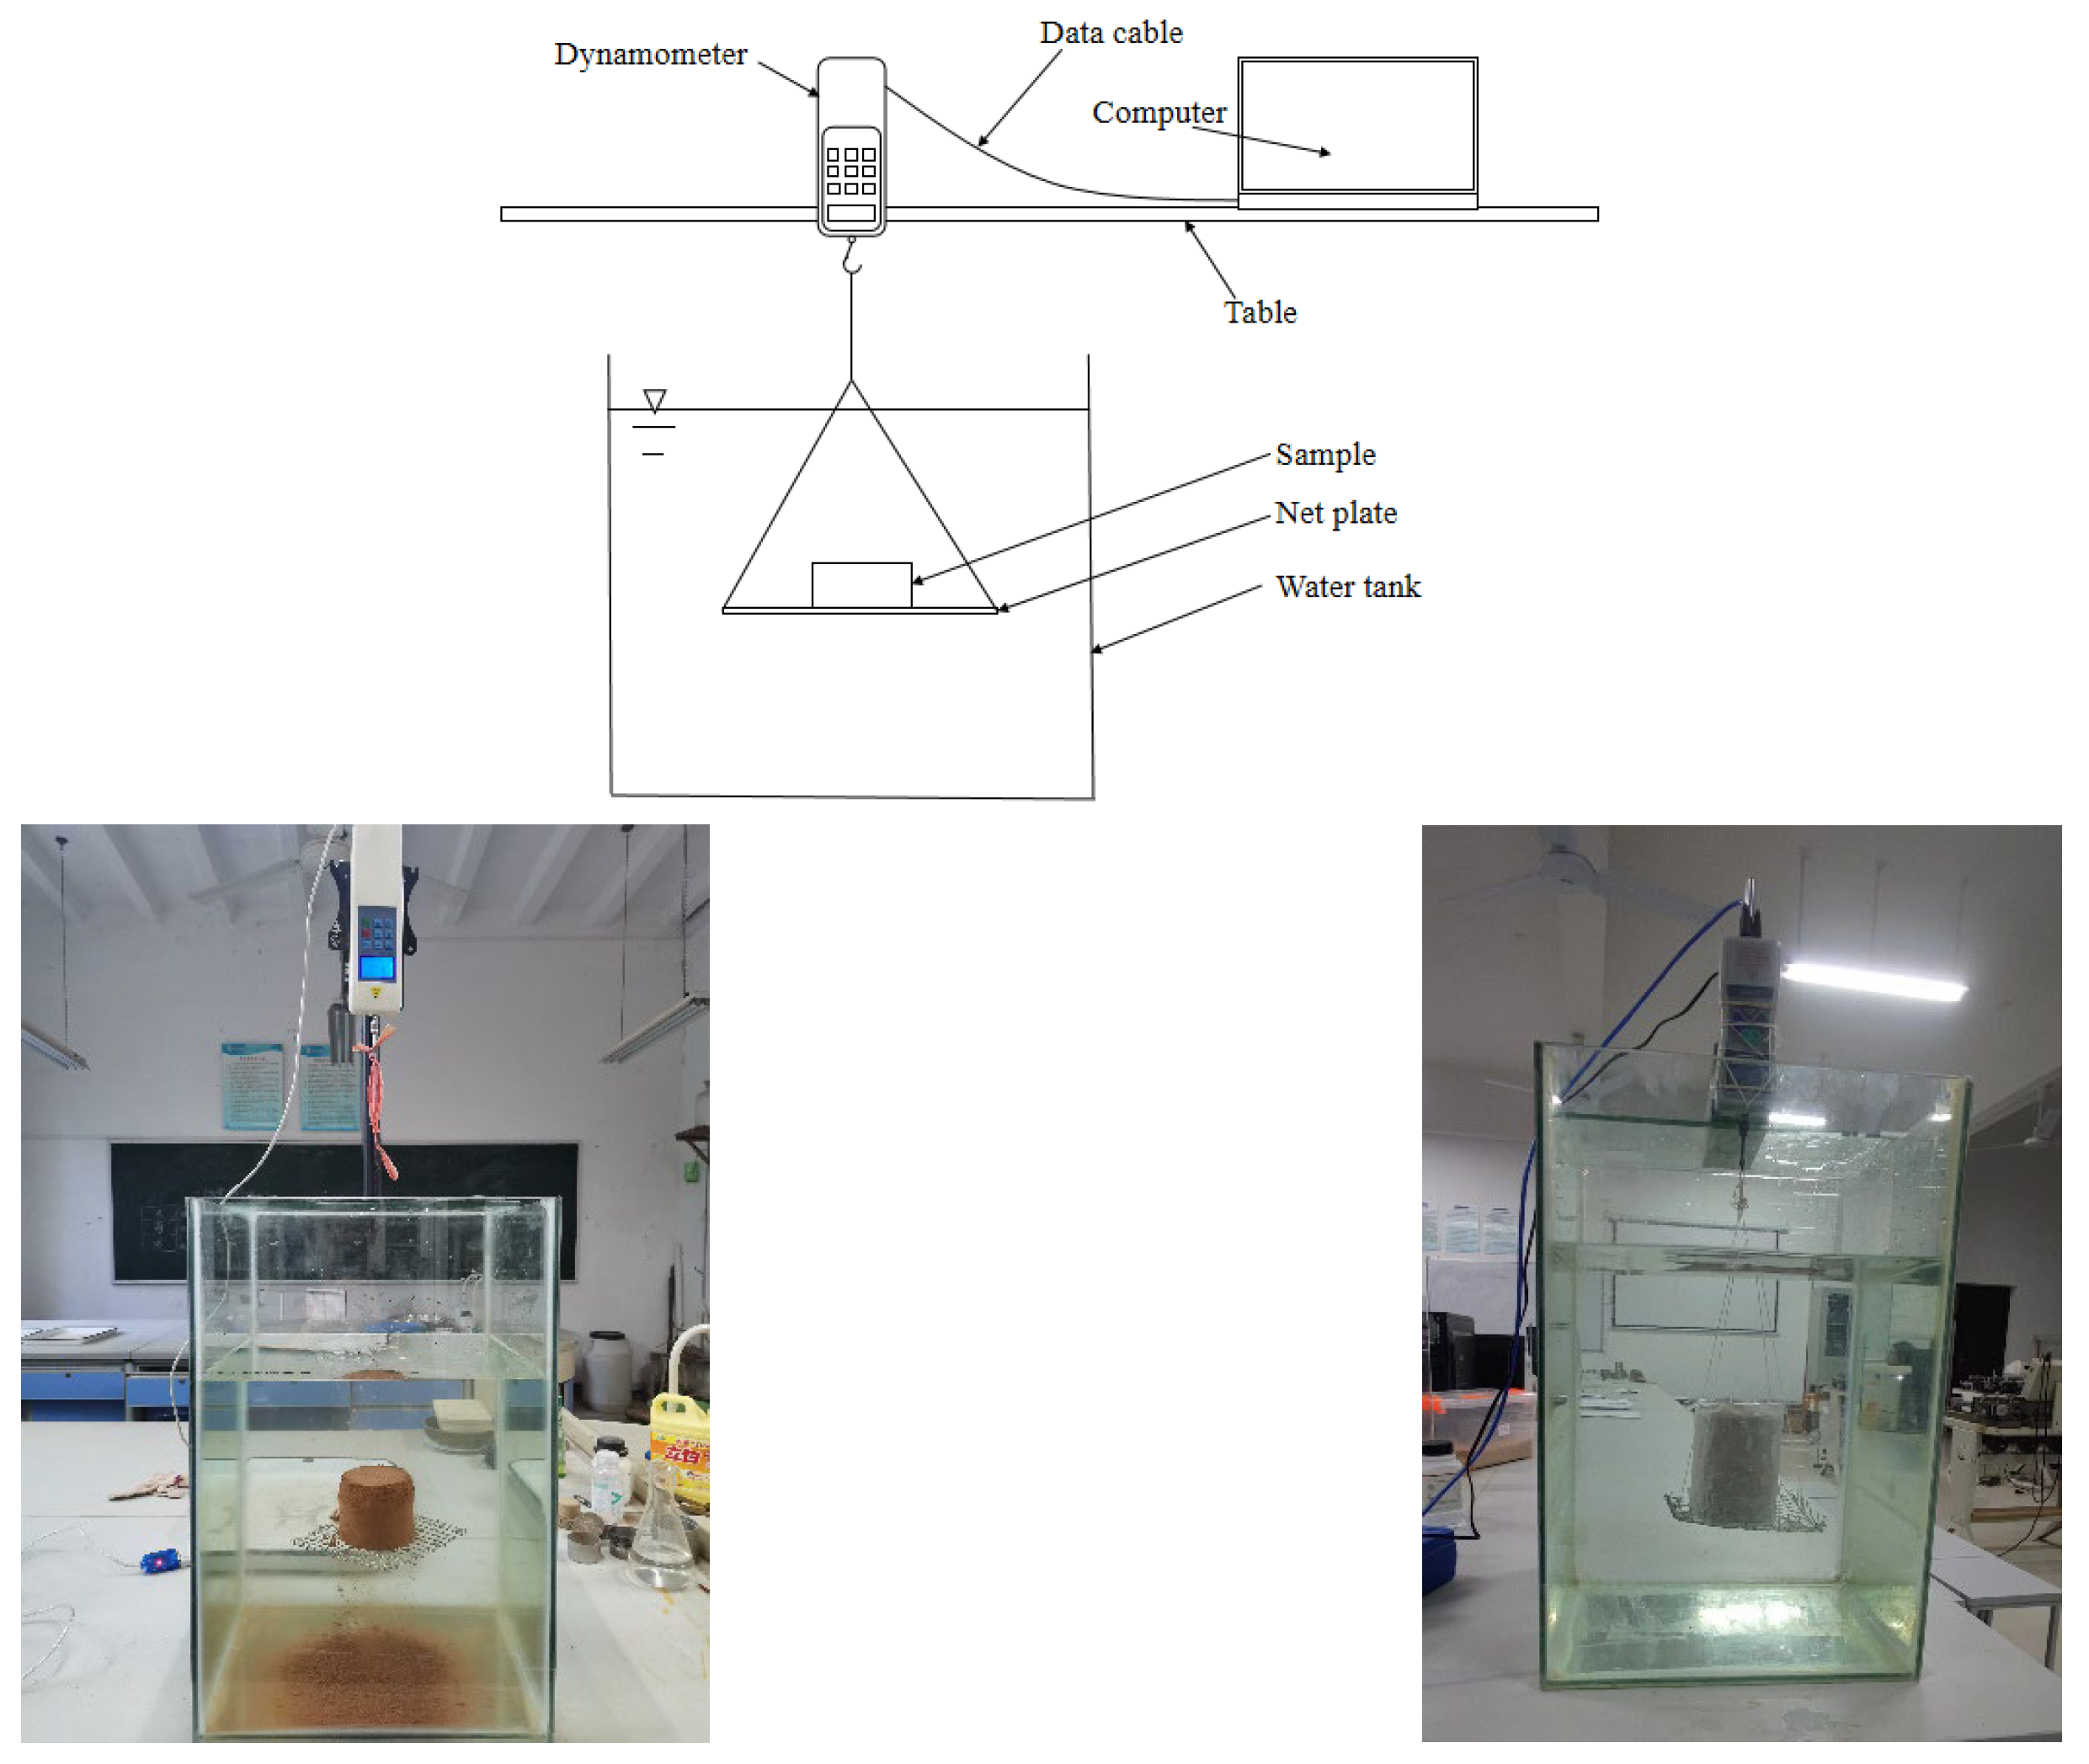
2.2. Test Instruments
Test instrument diagram as shown in
Figure 1.
Electronic balance (range 1 kg, division 0.01 g)
Electronic dynamometer, measuring range 2 kg, division 1 g
Self-made mesh plate, spacing 20 mm, size 25 cm × 32 cm
Water tank (2), size 50 cm × 35 cm × 35 cm
Stopwatch
Computer
2.3. Test Steps
Two groups of test samples were prepared for the disintegration test and water absorption test.
Before the test, place each part of the instrument in a good position, check whether the direction of the induction pointer of the dynamometer is vertical, and fix it with heavy objects or other methods after confirmation, and no longer move and touch until the end of the test. Mount the mesh plate and check whether the mesh plate is horizontal and adjusted to the appropriate height. The dynamometer and the computer are turned on and connected, the recording software is started, and they are waiting in the standby state.
The soil samples for each test must be divided into two equal parts (or three parts, with the third part reserved for later use), or two copies of each soil sample can be made at the time of sample preparation. They will be used in both parts of the water absorption test and the disintegration test in the same set of tests.
Disintegration test: weigh the sample with a balance and record it before entering the water. Record the no-load reading after the dynamometer is attached to the mesh plate and intrudes into the water. After the sample is put into water, start the stopwatch, dynamometer, and computer to collect and record data. Make records during the test. When there is no residual sample on the mesh plate, and the reading of the dynamometer does not change, the test is completed.
Water absorption test: weigh the sample with a balance and record it before entering the water. The sample is wrapped with filter paper to prevent soil particles from escaping into the water. Other operations are the same as the disintegration test. When the reading of the dynamometer is not changing, the test ends.
3. Establishment of Disintegration Model and Derivation of Disintegration Quantity Relationship
The disintegration reaction is a complex process. After the sample is immersed, the process of water or solution infiltration, pore gas discharge, and the change in the binding properties of soil particles and water can be carried out at the same time. If we start from the soil density, void ratio, saturation, and other indicators, without more assumptions, the formula will become very cumbersome. In this paper, a model will be established from a macro point of view, the disintegration test data will be corrected by the water absorption weight gain time curve, and the disintegration volume time relationship curve will be obtained.
3.1. Processing of Water Absorption Test Data
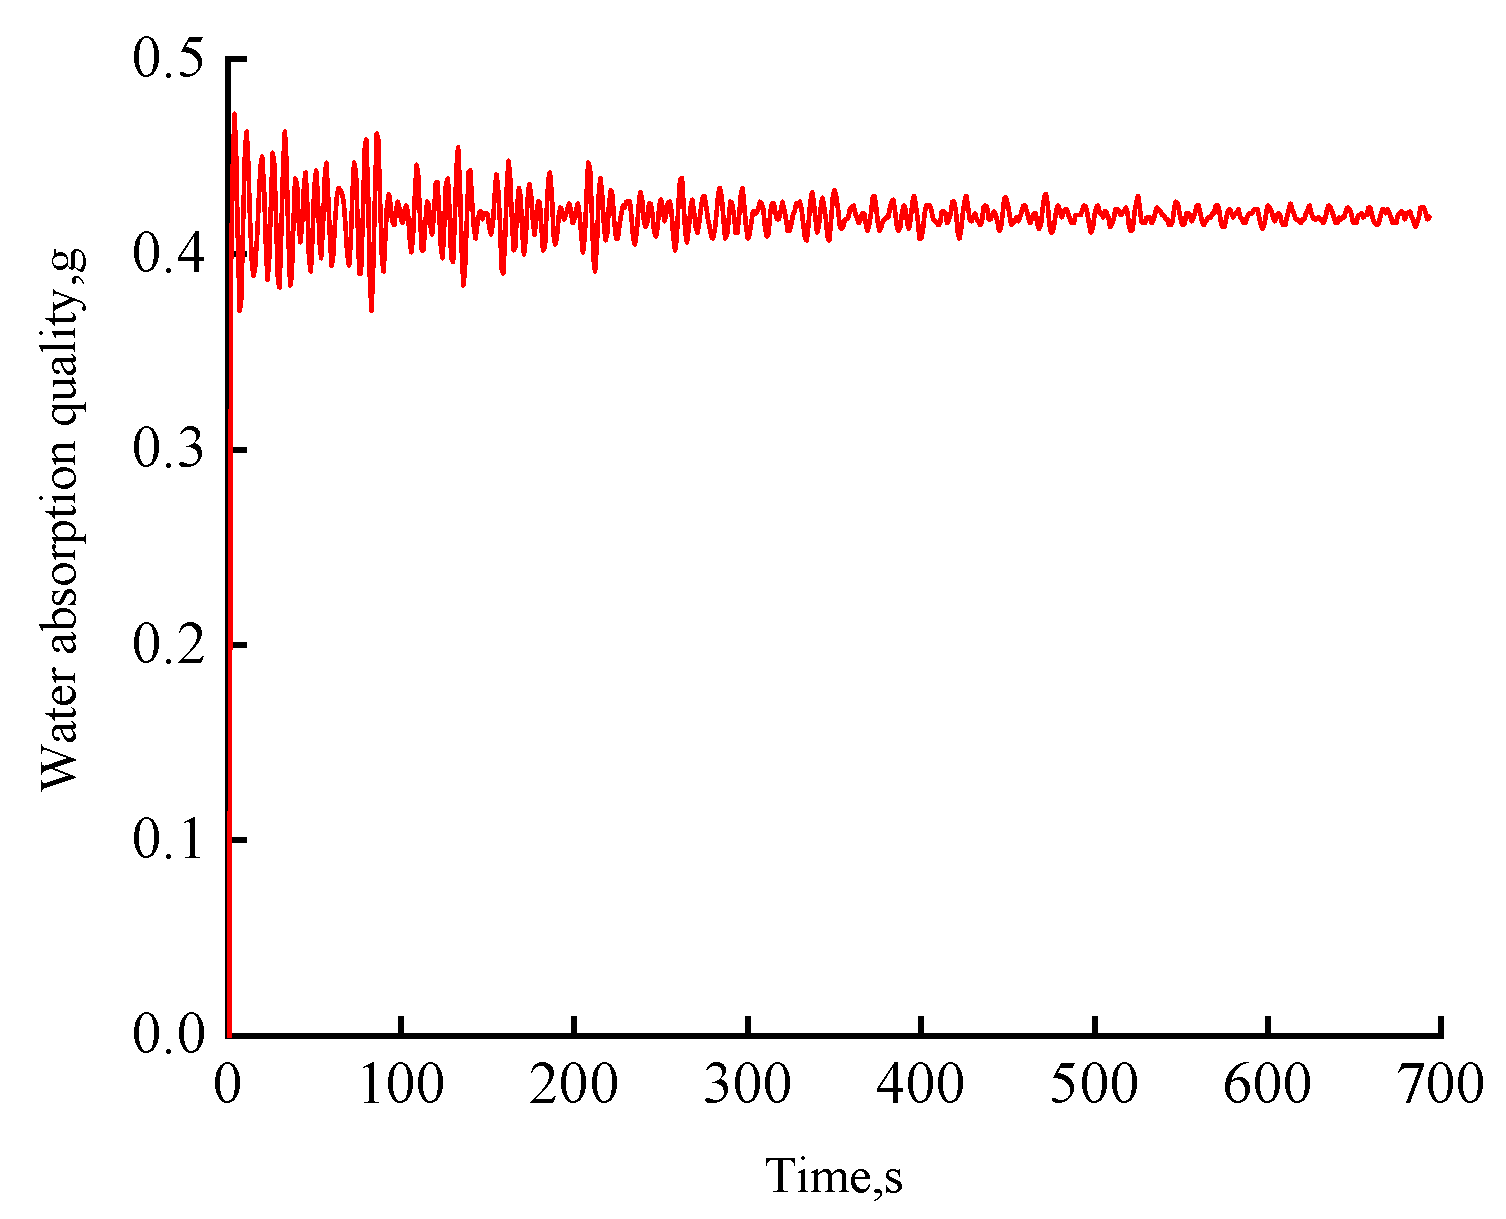
After the sample is immersed in water, the increase in its weight generally conforms to the law of fast and then slow and finally reaches a stable value.
Figure 2 shows the untreated test data of a water absorption test. When the sample is put into water, it will inevitably disturb the water, and the movement of water, in turn, interferes with the test measurement, which is shown in the figure as the oscillation up and down at the beginning of the curve.
It can be found from the figure that the fluctuation of the data has a certain regularity: the distance between the upper and lower offsets is symmetrical; that is, their average is roughly in the center. Therefore, the method of averaging can be used to obtain a complete smooth curve, including time 0. This phenomenon can also occur in the disintegration test and can be treated in the same way.
Set the dynamometer unit as g so that the vertical coordinate reading is
when
t = 0, and the reading at time
t is
, then the weight of the sample at time
t relative to time 0 is
. The theoretical weight gain corresponding to the disintegration test sample at time
t can be obtained from the mass ratio of the disintegration test sample and water absorption test sample.
where weight gain value of the sample at time
t of water absorption test;
—reading of dynamometer when water absorption test t = 0;
—dynamometer reading at time t of water absorption test;
—the weight gain value of the sample at t time of the corresponding disintegration test;
—the mass of the sample used for the water absorption test in the air;
—the mass of the sample used for the disintegration test in the air.
The unit of the above parameters is g.
Suppose the total weight gain of the sample at the end of the test, the total weight gain of the corresponding disintegration test sample is .
3.2. Pore Exhaust Disintegration Model
Basic assumptions: 1. Soil particles do not react with water or solution (including adsorption), and the solid mass and soil particle density remain unchanged before and after the test; 2. The density of water or solution remains unchanged; 3. The soil is unsaturated, and there is gas in the pores.
The tensile forces
and
on the dynamometer at the time of
t = 0 and
t are, respectively, as follows:
where:
—tensile force of Dynamometer when
t = 0, N;
—the tensile force of the dynamometer at time t, N;
—when t = 0, the mass of the solid part of the sample on the grid plate;
—the mass of the solid part of the remaining sample on the mesh plate at time t;
—soil particle density;
—the density of water or solution;
—the quality of mesh plate;
—the buoyancy of the grid plate;
—the buoyancy generated by gas in the sample when t = 0, N;
—the buoyancy generated by gas in the sample at time t, N;
—the ratio of no disintegrated sample to total sample at time t,%.
It is noted that under this assumption, the weight gain of the sample in the water absorption test can only be caused by the discharge of pore gas and the reduction of buoyancy, so is a one-to-one correspondence with in Equation (2). In addition, since the sample does not disintegrate and fall in the water absorption test, the formula in this formula includes all disintegrated and no disintegrated samples above and below the mesh plate, so in the formula (4) that needs to be multiplied by the no disintegrated percentage ().
The tensile force generated by the empty mesh plate immersed in water on the dynamometer is its gravity minus the buoyancy, so
,
is the no-load immersion reading of the mesh plate (g). If the dynamometer unit is set to grams during the test, the gravitational acceleration g in Equations (3) and (4) can be eliminated. The tensile force is still recorded as
, and Equations (3) and (4) can be written as follows:
where:
—the tensile force of dynamometer, g;
—the net plate no-load immersion reading, g.
Move the solid mass to one side of the equation, and the above two equations can be deformed as follows:
According to
, the definition
. Therefore, by dividing and simplifying the two formulas, we can get the following:
Equation (9) is the proportion of no disintegrated samples at time t.
3.3. Adsorbed Water Disintegration Model
Basic assumptions: 1. Soil particles have an adsorption effect, which can adsorb part of free water, increase the mass of the solid part, and ignore the volume change; 2. The density of water or solution remains unchanged; 3. The buoyancy of pore gas is not considered.
According to the assumed conditions, the volume of the solid part of the sample remains unchanged. If the gravity generated by the water adsorbed by soil particles is recorded separately, that is remains unchanged, and the buoyancy of the sample is still.
The tensile forces
and
on the dynamometer at the time of
t = 0 and
t are, respectively, as follows:
where
is the gravity generated by the newly added adsorbed water at time
t, and the meaning of other parameters is the same as that of Equations (3) and (4).
It is also noted that under this assumption, the weight gain of the sample in the water absorption test can only be caused by the water absorption of soil particles, which is generated by the increased adsorption of water, so is a one-to-one correspondence with in Formula (2).
After the same process as (3) and (4), Equations (10) and (11) can be written as follows:
Similarly, the formula can be obtained from
:
In the water absorption test, the process of pore gas discharge and solid soil particles obtaining adsorbed water are carried out at the same time, so the weight gain value() at time t is the product of the joint action of two factors, and Equation (9) is the soil disintegration model considering the two conditions of pore gas discharge and adsorbed water increase .
4. Test Results and Analysis
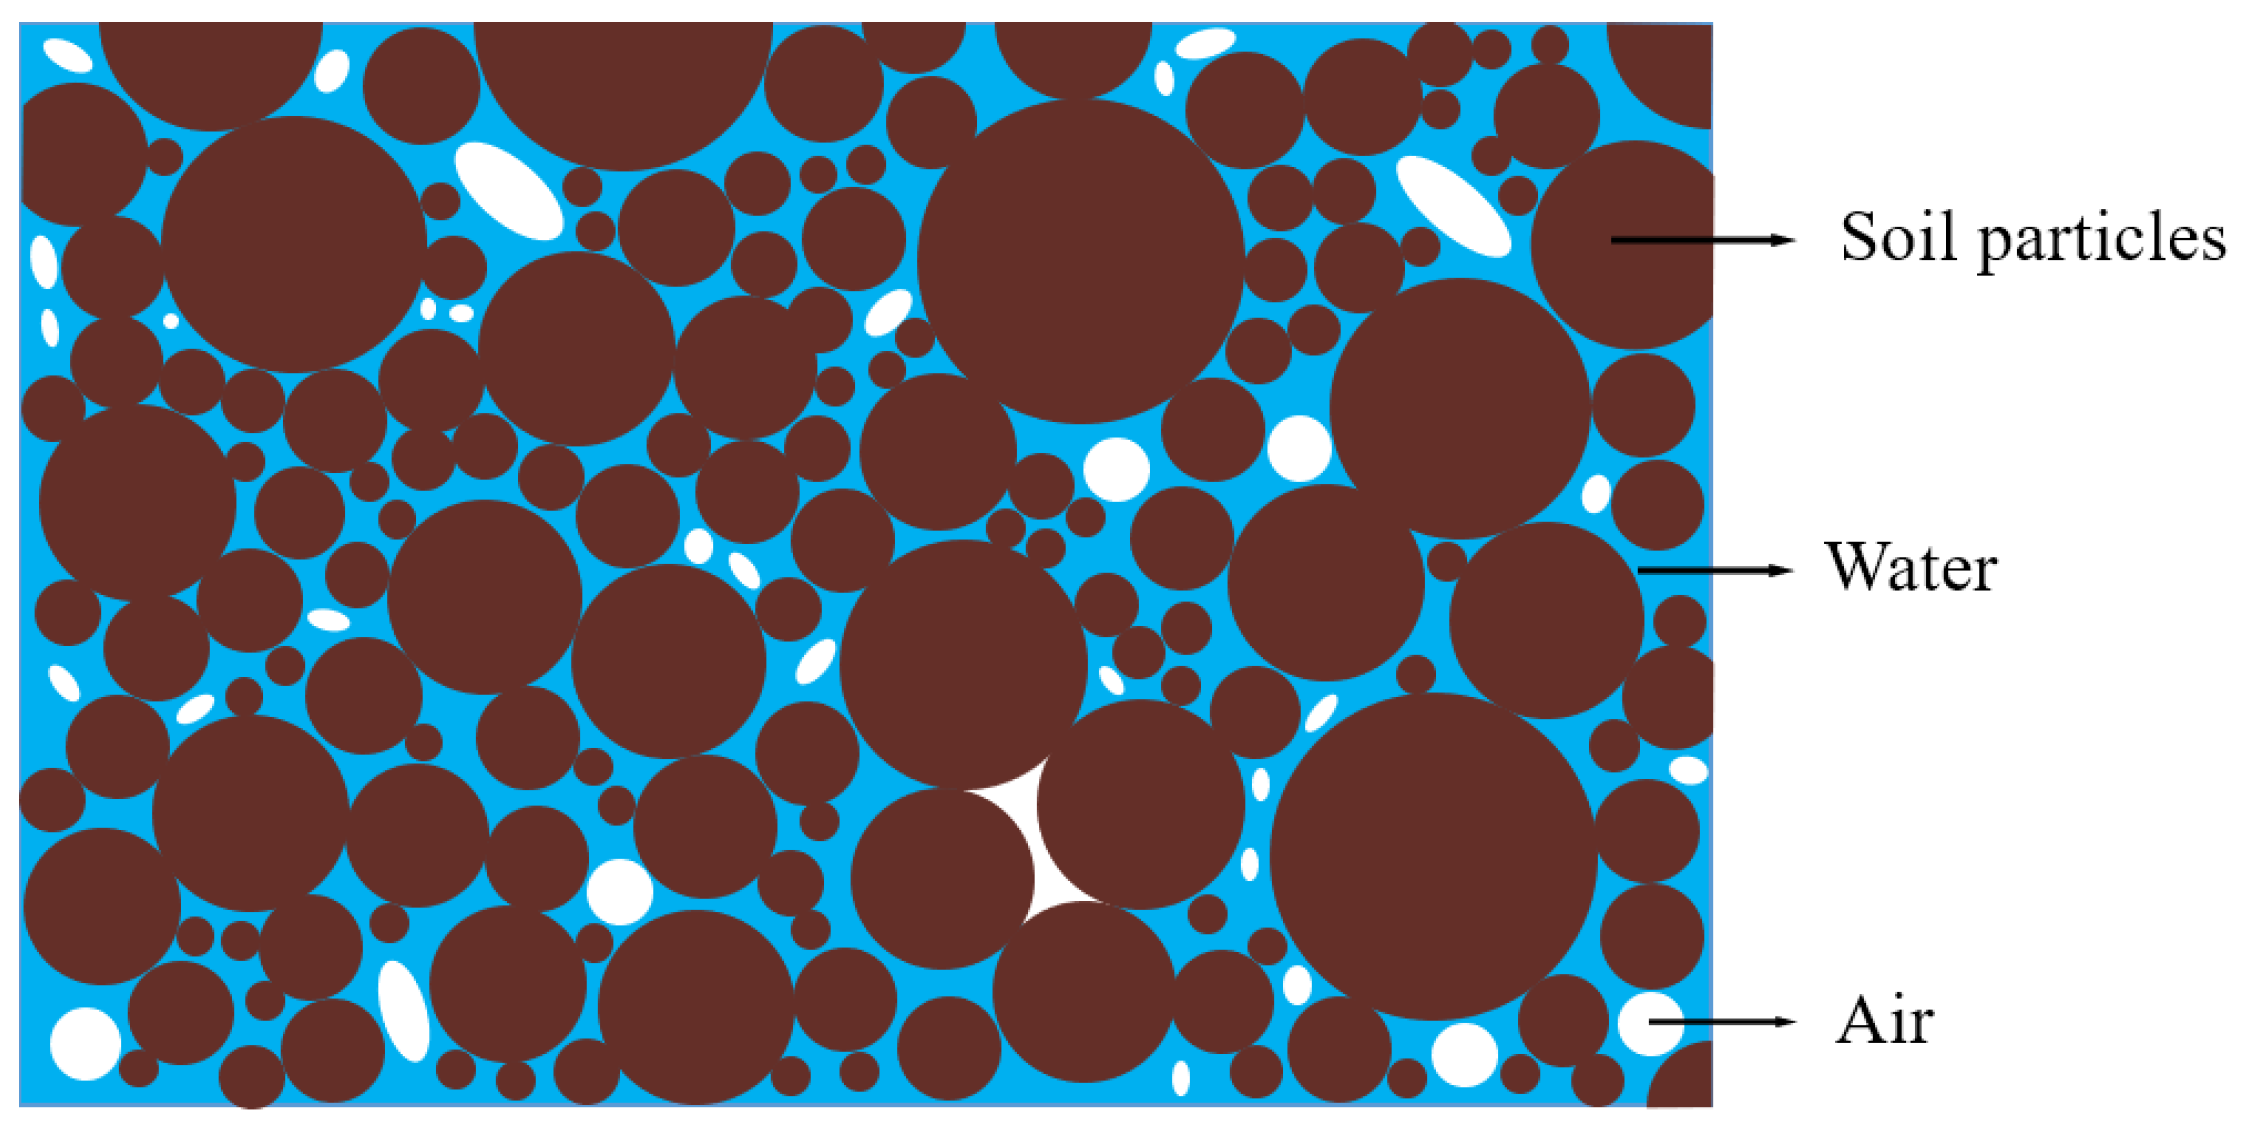
4.1. Mechanism of Soil Disintegration
The soil is composed of soil particles, water, and air. The random arrangement of soil particles separates the gas into open and closed bubbles, as shown in
Figure 3.
In the process of soil disintegration, with the invasion of external water, the open bubbles are directly discharged from the soil, and the closed bubbles are compressed and retained in the soil sample. During the extrusion of the open bubbles, there will be tension on the soil particles, dragging the soil particles down and resulting in disintegration [
15]. In the process of water intrusion, clay particles are subjected to both intermolecular forces and electrostatic repulsion of charged particles. Red clay contains kaolinite and other clay minerals, and its cations contain monovalent ions, such as Na +, which have low binding energy and high dissociation probability. After Na + ions react with water, under the action of water, the electric double layer structure on the surface of clay particles in soil particles will weaken the molecular force between particles, and the electrostatic attraction between ions dissociated from soil particles will also turn into the polar force between water molecules, and the strength is weak. On the contrary, the repulsive force between clay particles in soil particles increases, which leads to the stress imbalance of soil, resulting in stress concentration, and finally, makes the soil soften and then lose the connection function in the structure and collapse.
In addition, there is matrix suction in the soil. When water enters the pores of the soil, it first enters the small pores, and when it enters the macropores, the wet suction increases slightly because the macropores in the soil only absorb less water, while the small pores absorb more water and tend to be saturated, which greatly reduces the wet suction. Therefore, the suction between soil particles is reduced as a whole, which changes the effective stress of the soil. When water first enters the tiny pores of the soil, part of the air in the soil cannot be discharged but is compressed, and the volume becomes smaller, resulting in an increase in pore air pressure. When the pore air pressure is greater than the effective stress of the soil, the soil will collapse.
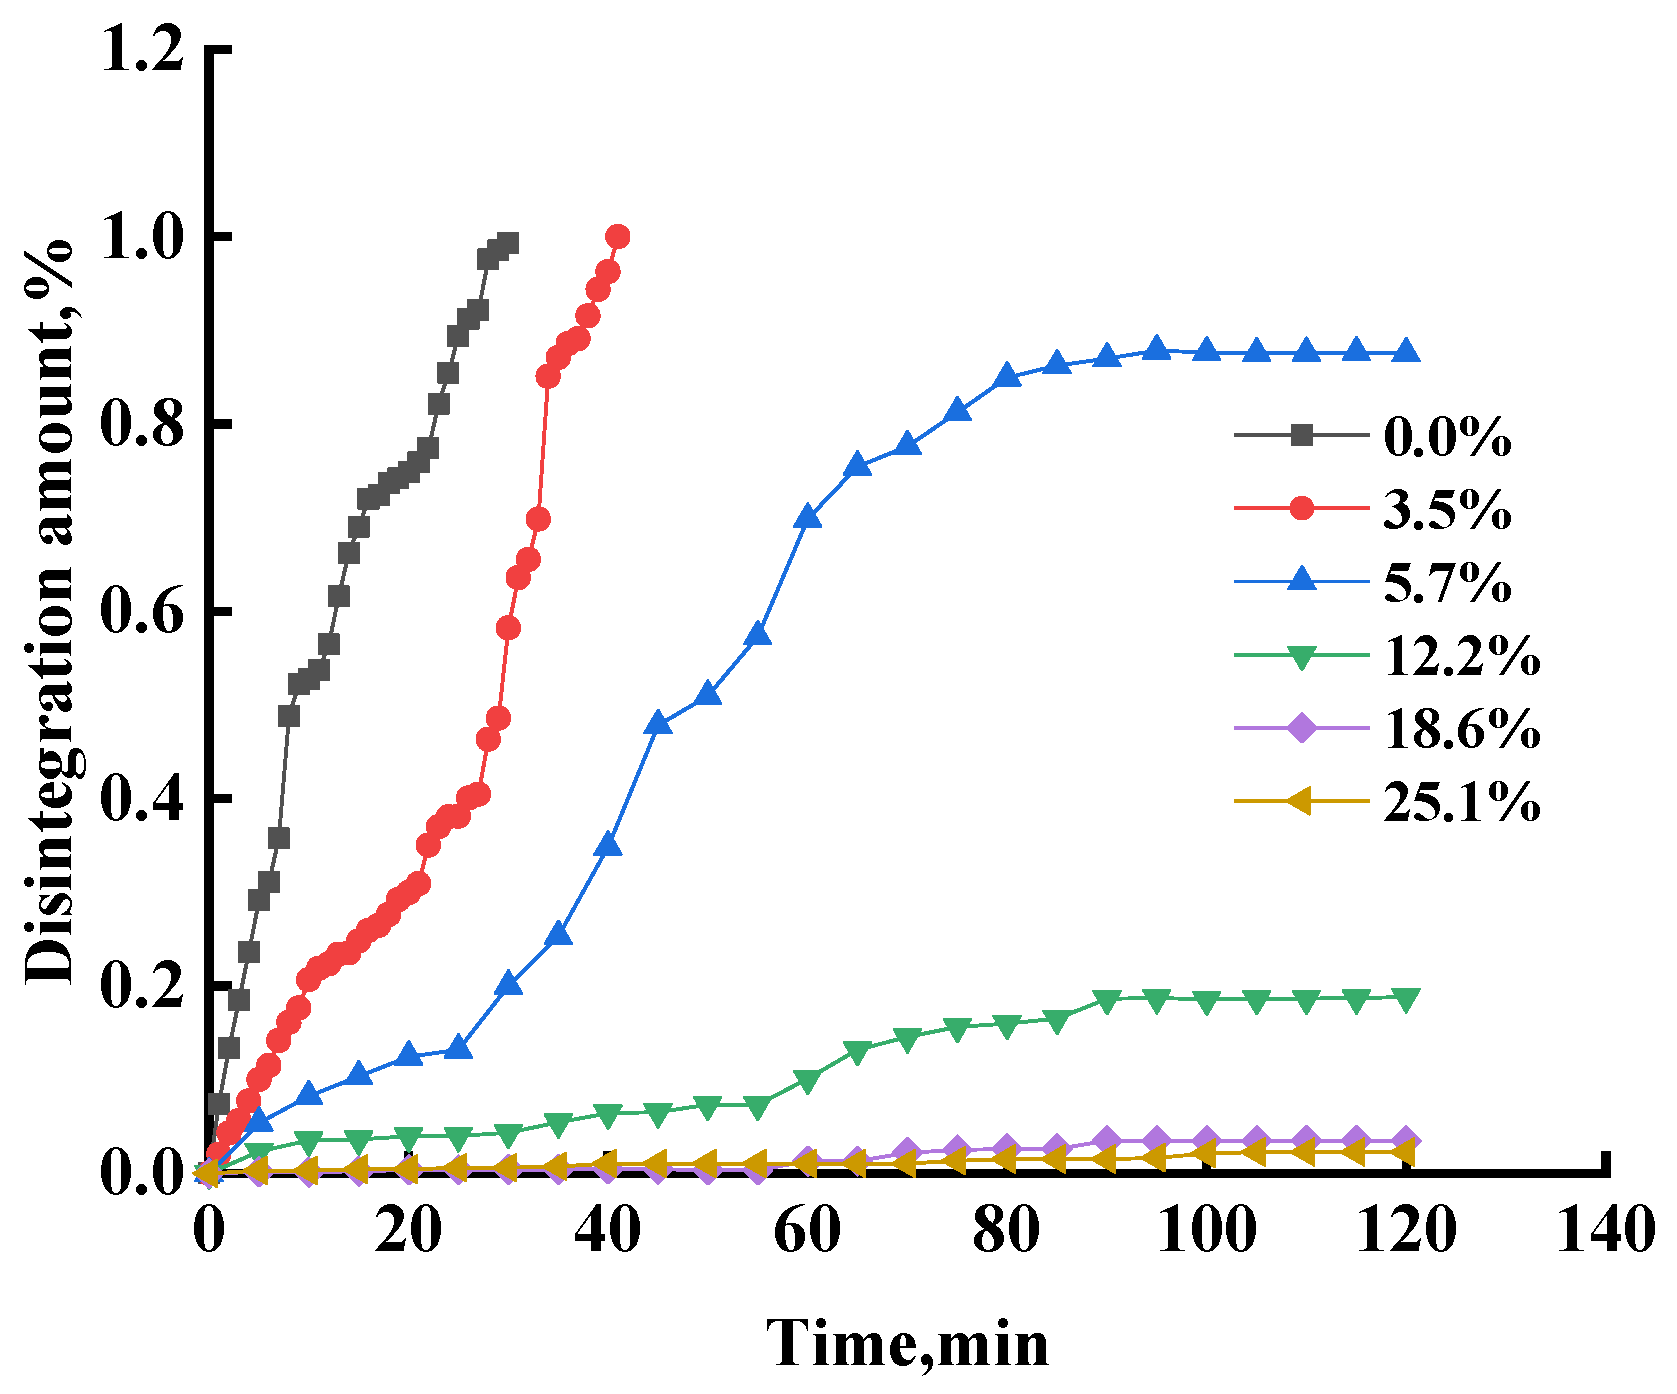
4.2. Analysis of Disintegration Characteristics of Red Clay with Different Water Content
Figure 4 shows the disintegration amount time relationship curve of red clay with different water content. With the increase in soil water content, the disintegration amount and disintegration rate of red clay decrease rapidly. When the water content is higher than 5.7%, the soil cannot complete disintegration within 2 h. With the increase in water content, the amount and rate of disintegration of red clay gradually decreased. When the water content reaches 25%, the sample basically stops disintegration.
It can be seen from
Figure 4 that the lower the water content, the more intense the disintegration. When the water content is 5.7%, the disintegration curve can be divided into three stages, “slow, sharp, and stable”, as a whole [
16], but it is not obvious when the water content is high or low. This is because the disintegration amount in the test is determined by the data sent back by the dynamometer, and the time of a single clay particle falling off the screen is random. It has certain fluctuations in the test of low water content. In the case of high water content, because the final disintegration amount is small, the increase in disintegration amount is mainly caused by the drop of several large aggregates, which is reflected in the disintegration curve as a sudden increase in a certain period of time, while most of the time, curves are relatively stable.
In the “slow” stage, the red clay is immersed in water, and the water penetrates into the pores, extruding the gas in the soil to form a small number of bubbles. There are fine particles separated on the soil surface, and the disintegration speed is slow. In the “sharp” stage, the red clay is completely immersed in water for a period of time, a large number of bubbles appear, and the red clay softens. The separation speed of red clay particles is accelerated due to the expansion force of bubbles. This stage is the main stage of disintegration, and the disintegration rate is stable. In the “stable” stage, because most disintegration is completed, there are only a few bubbles at this time, and the disintegration rate becomes low until the disintegration is completed. The incomplete disintegration of red clay is massive, and the complete disintegration is flaky [
17].
Table 2 shows the average rate of complete disintegration, the average rate of disintegration stability stage, and the final residual disintegration within 2 h of the test time for each sample.
With the decrease in soil water content, there are two reasons for the increase in disintegration rate and amount: first, when the soil with low water content is immersed in water, the shape of the soil changes sharply, and the expansion is uneven, which is conducive to disintegration; second, when the dry soil is immersed in water, the surrounding of the soil sample is immediately saturated and softened, the strength is reduced, and the water content in the soil is still low. In the process of further saturation of the soil, the bound water film gradually expands, and the air in the gap is extruded. In the process of extrusion, the surface of the soil in the saturated and softened state is damaged, and the soil mass collapses rapidly.
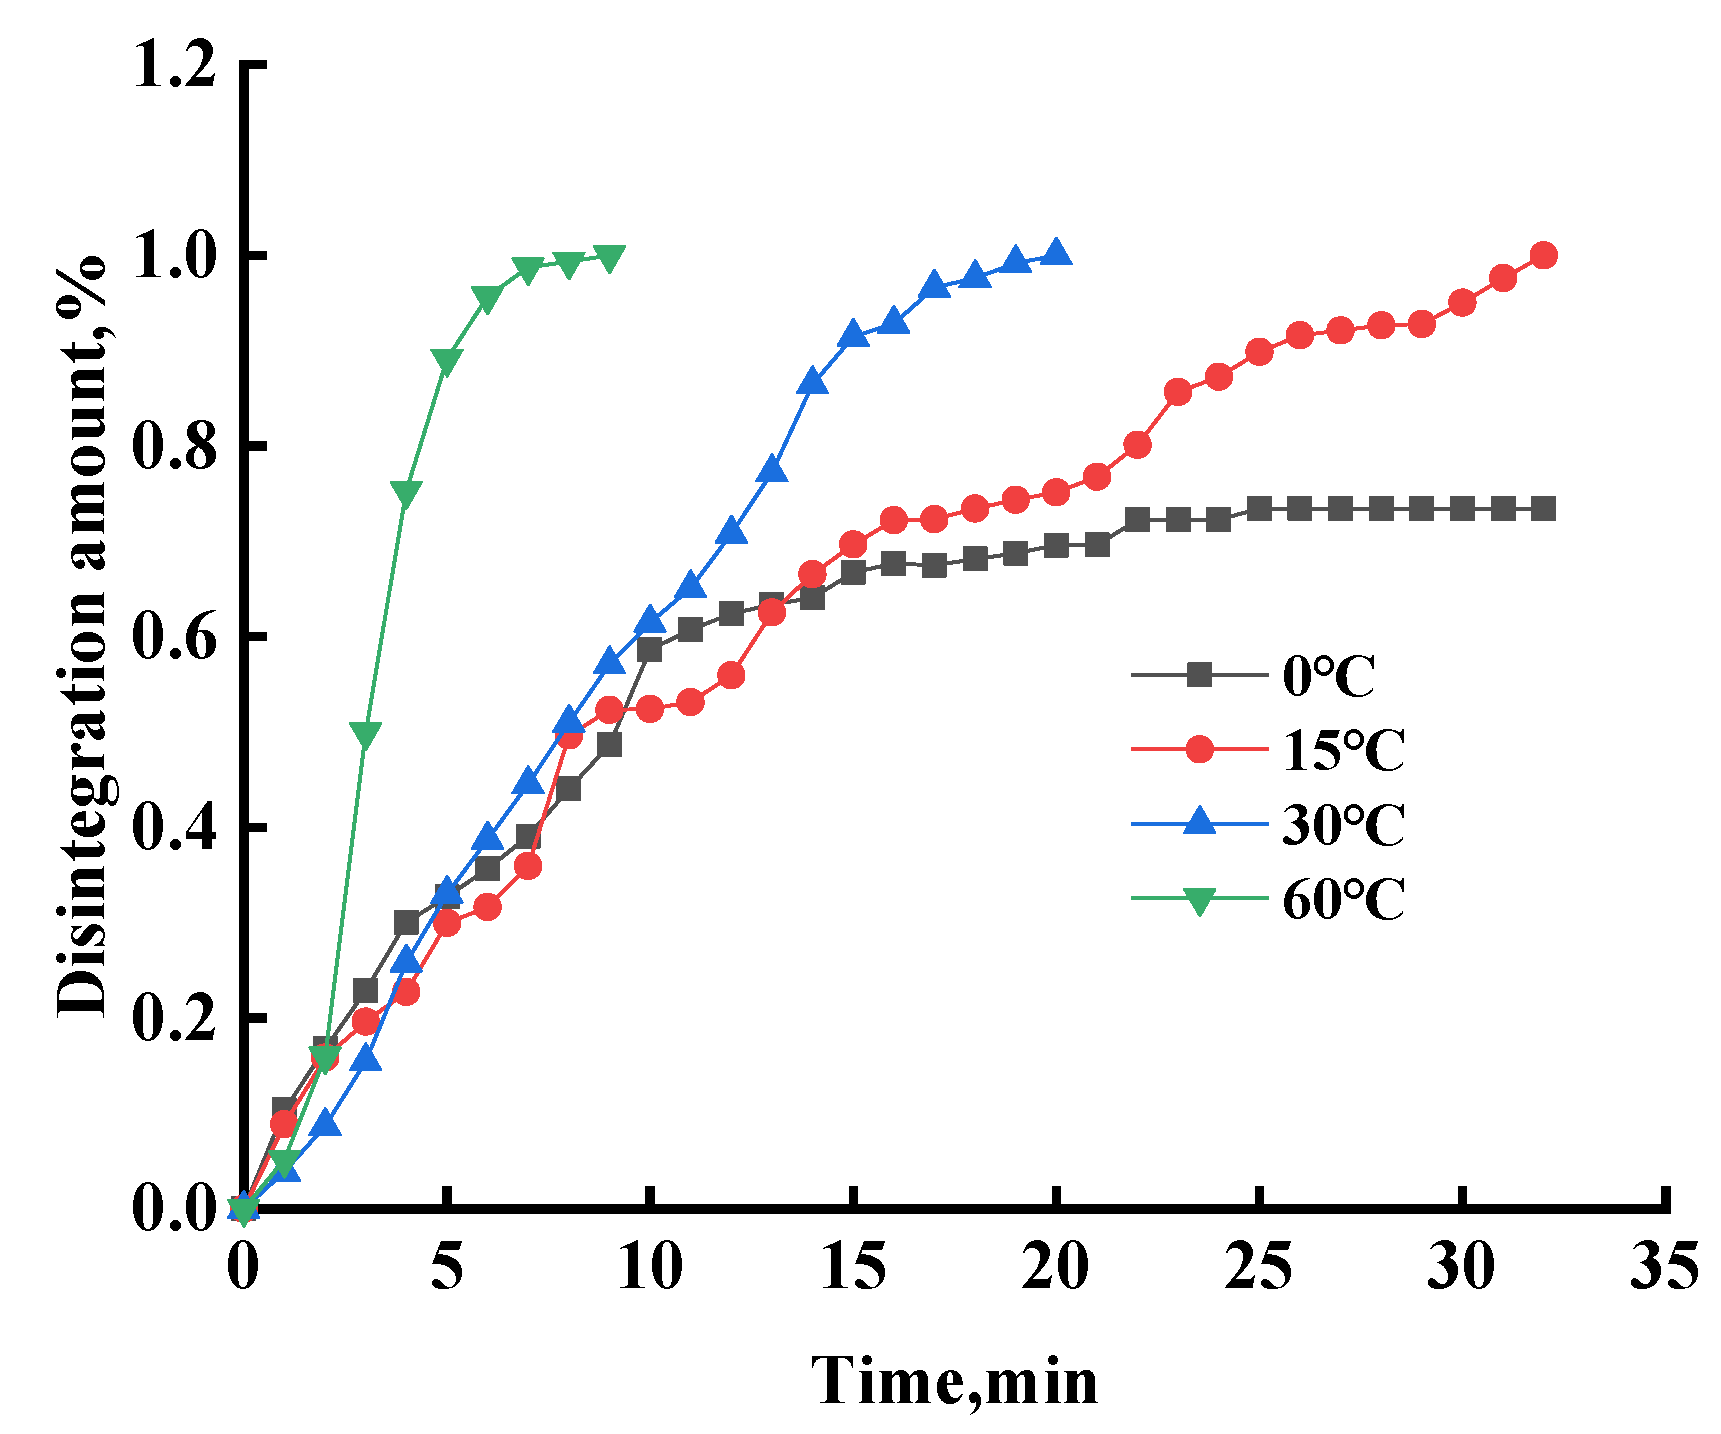
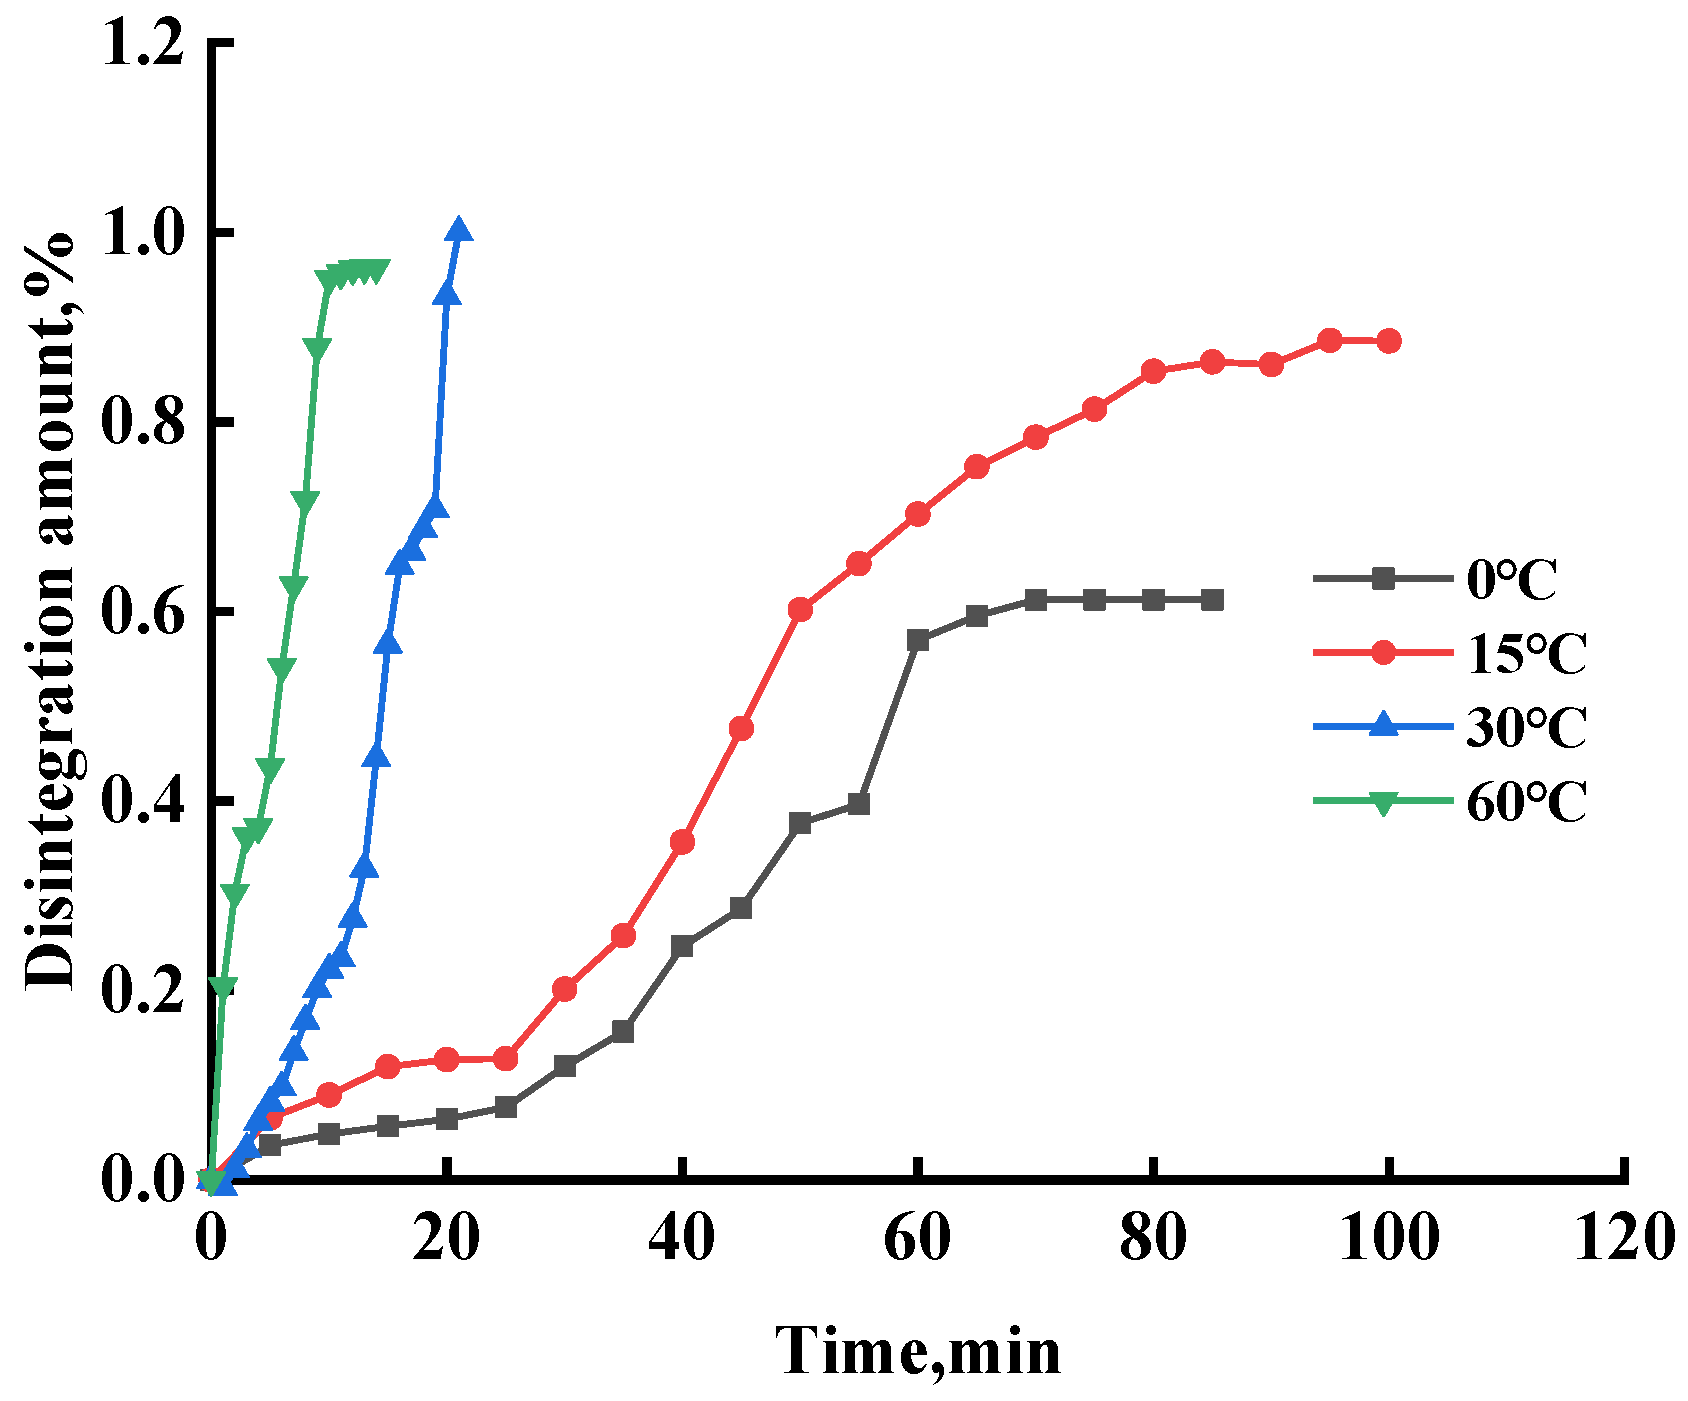
4.3. Effect of Different Temperatures on Disintegration of Red Clay
Figure 5 and
Figure 6 show the relationship of red clay samples with a water content of 0% and 5.7% at four different temperatures. Comparing the two figures, the disintegration curves at 0 °C and 15 °C are relatively close, and the disintegration is completed in a relatively short time. When the temperature becomes higher than 30 °C, the temperature will destroy the cementation between soil particles, make the soil particles fall off, and accelerate the disintegration. It indicates that there is energy exchange in the decomposition process of red clay. With the increase in water temperature, the internal energy increases, which accelerates the dissolution of red clay. The increase in water temperature also accelerates the gas emission rate of red clay [
18]. High temperature has a certain effect on the disintegration of soil, but the effect is small in the range of 0~15 °C. Therefore, in the Guilin area, the soil disintegration is relatively small in winter and prone to collapse in summer.
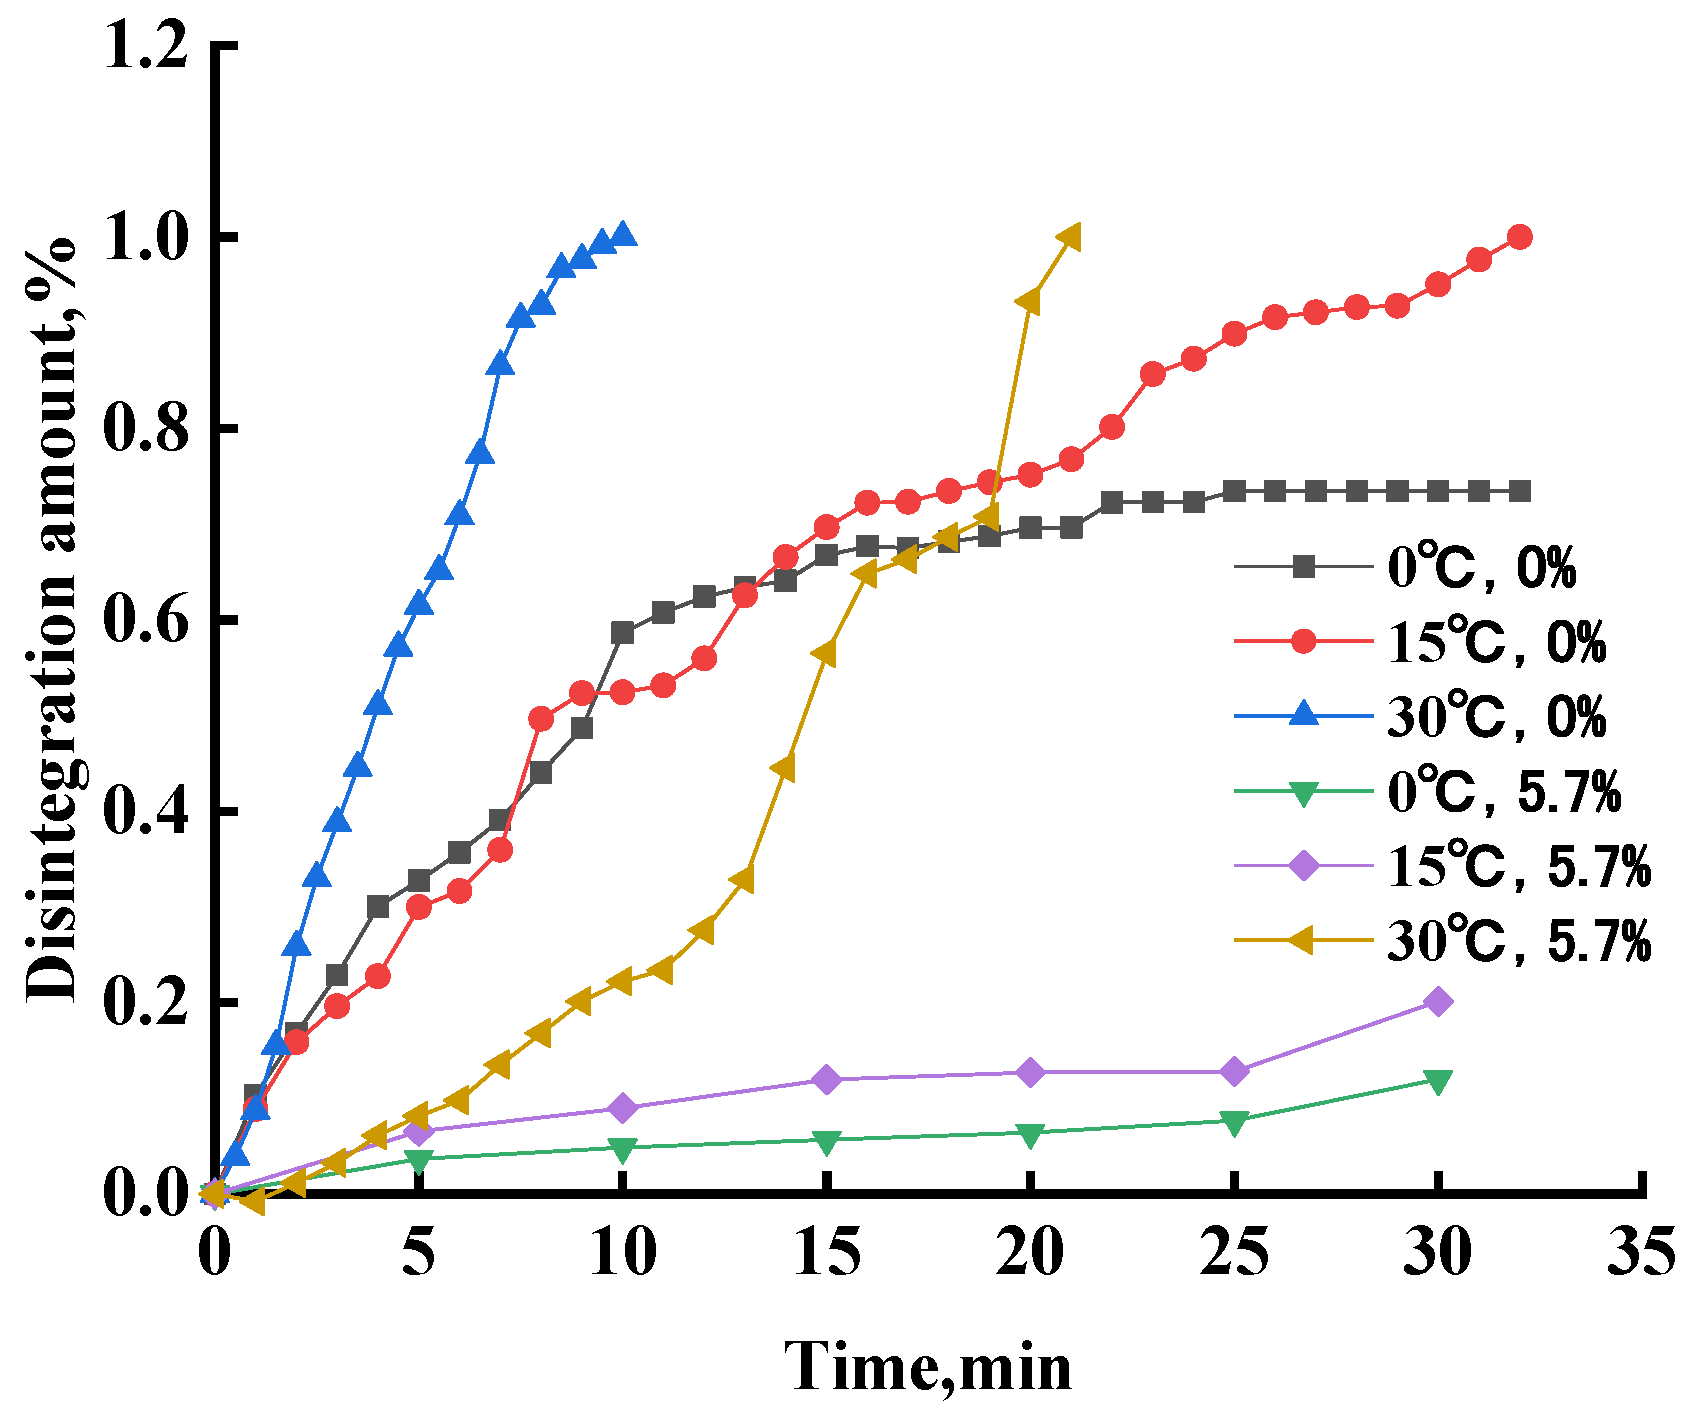
In order to further determine the main factors causing disintegration, the test results of samples with water content of 0% and 5.7% at temperatures of 0 °C, 15 °C, and 30 °C were summarized, and the disintegration time curve within 35 min was analyzed, as shown in
Figure 7.
According to
Figure 7, water content is the main factor in the disintegration of red clay. The higher the temperature is, the faster the disintegration rate is.
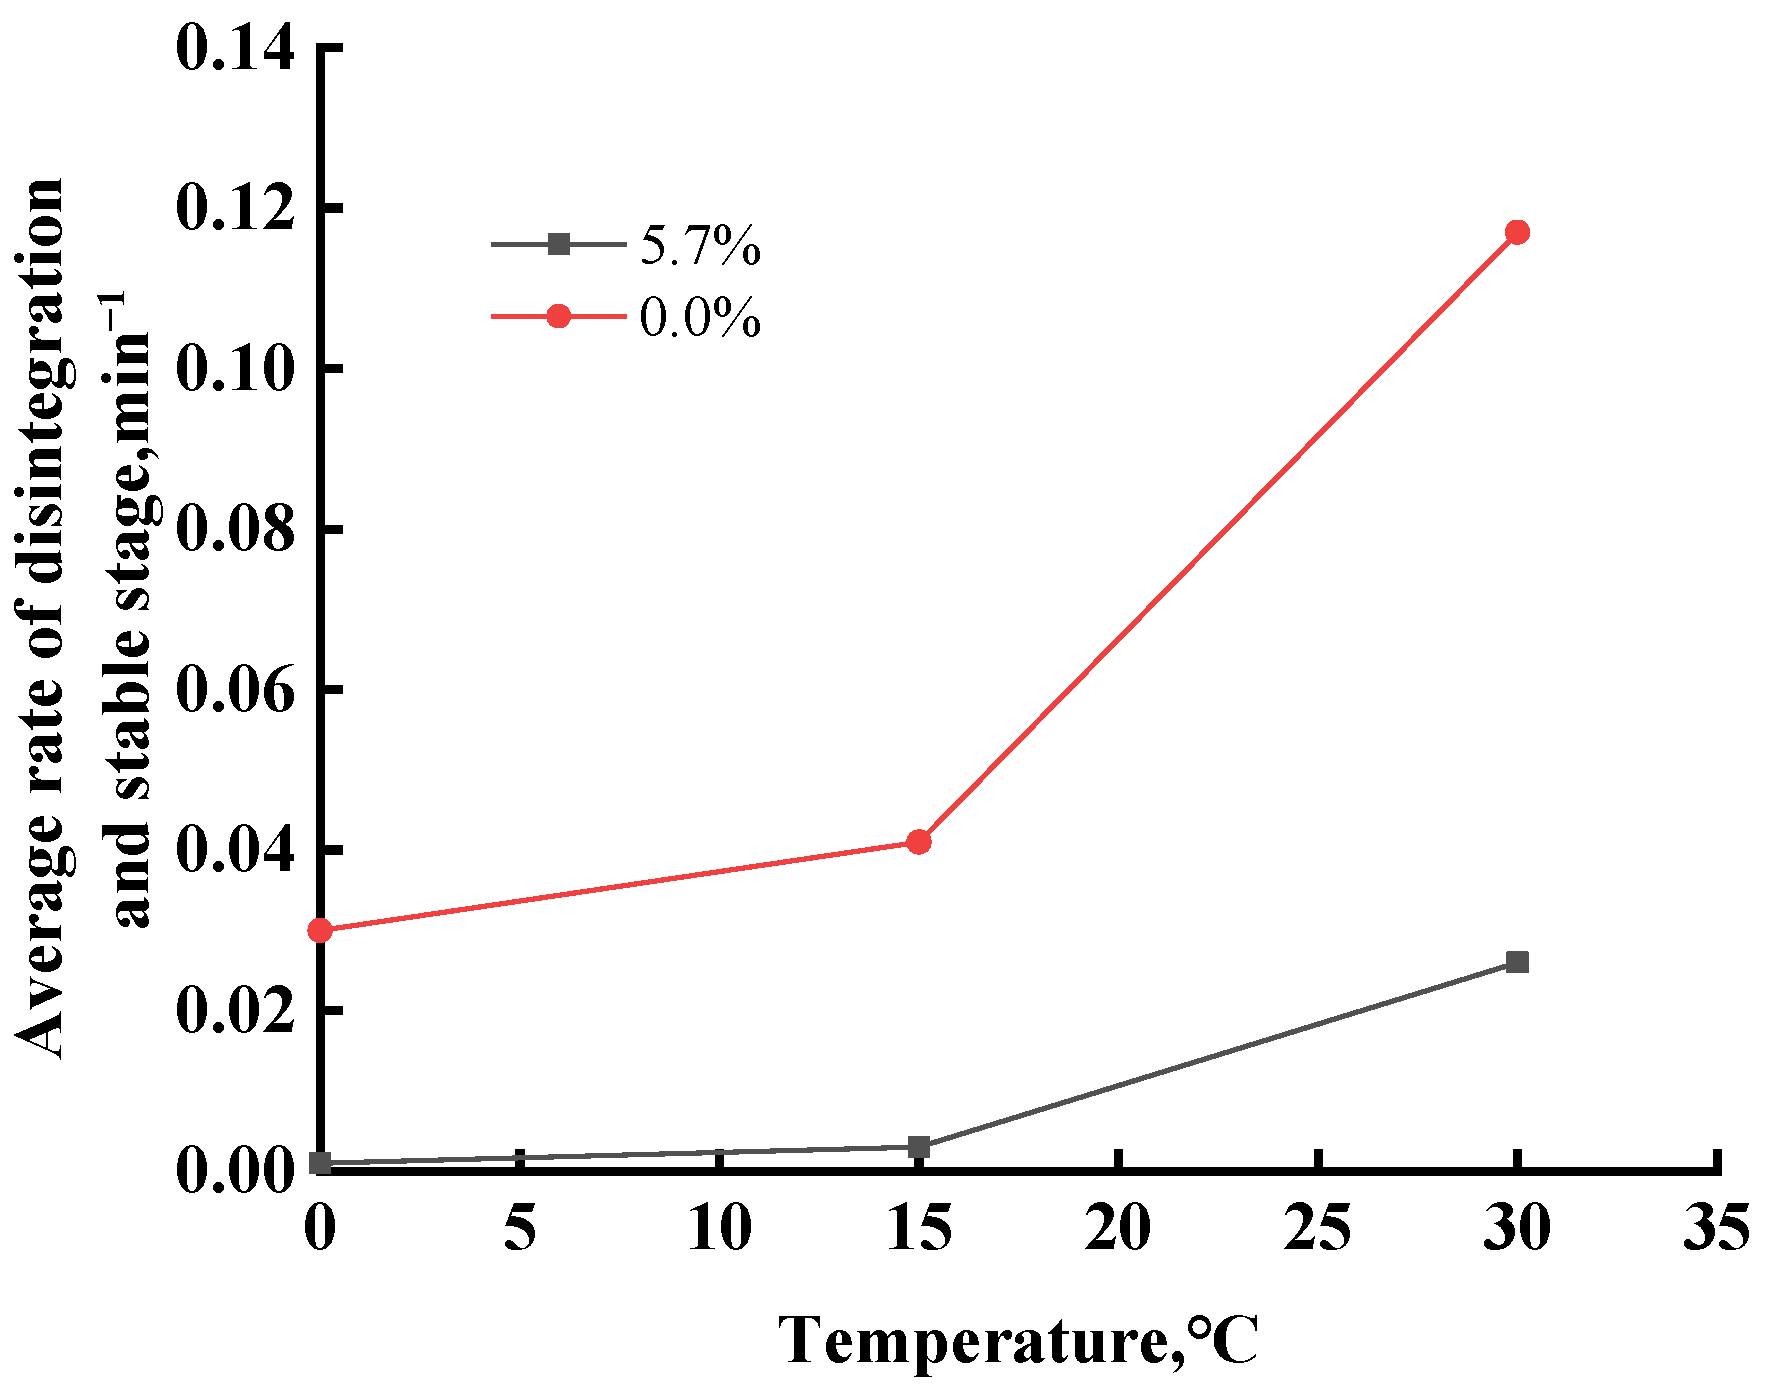
Figure 8 and
Figure 9, respectively, show the relationship between the average rate of complete disintegration and the average rate of disintegration stability stage and temperature of the two water content samples.
It can be seen from
Figure 7 and
Figure 8 that the disintegration rate changes little at 0 °C and 15 °C, but it changes significantly when the temperature increases. The disintegration rate of samples with different water content is obviously different, and the disintegration rate increases with the increase in water content. It fully shows that in the process of soil disintegration, the moisture content dominates in the low water content range (0%~5.7%).
4.4. Effect of Water Absorption on Disintegration Test of Red Clay
Water absorption, that is, the phenomenon that the reading of the dynamometer increases after the sample is immersed in water, is caused by the discharge of air from the soil voids and the conversion of some free water into bound water. The effect of water absorption is different under different water content, pore ratio, temperature, and other conditions, so it has a different influence on the disintegration of samples.
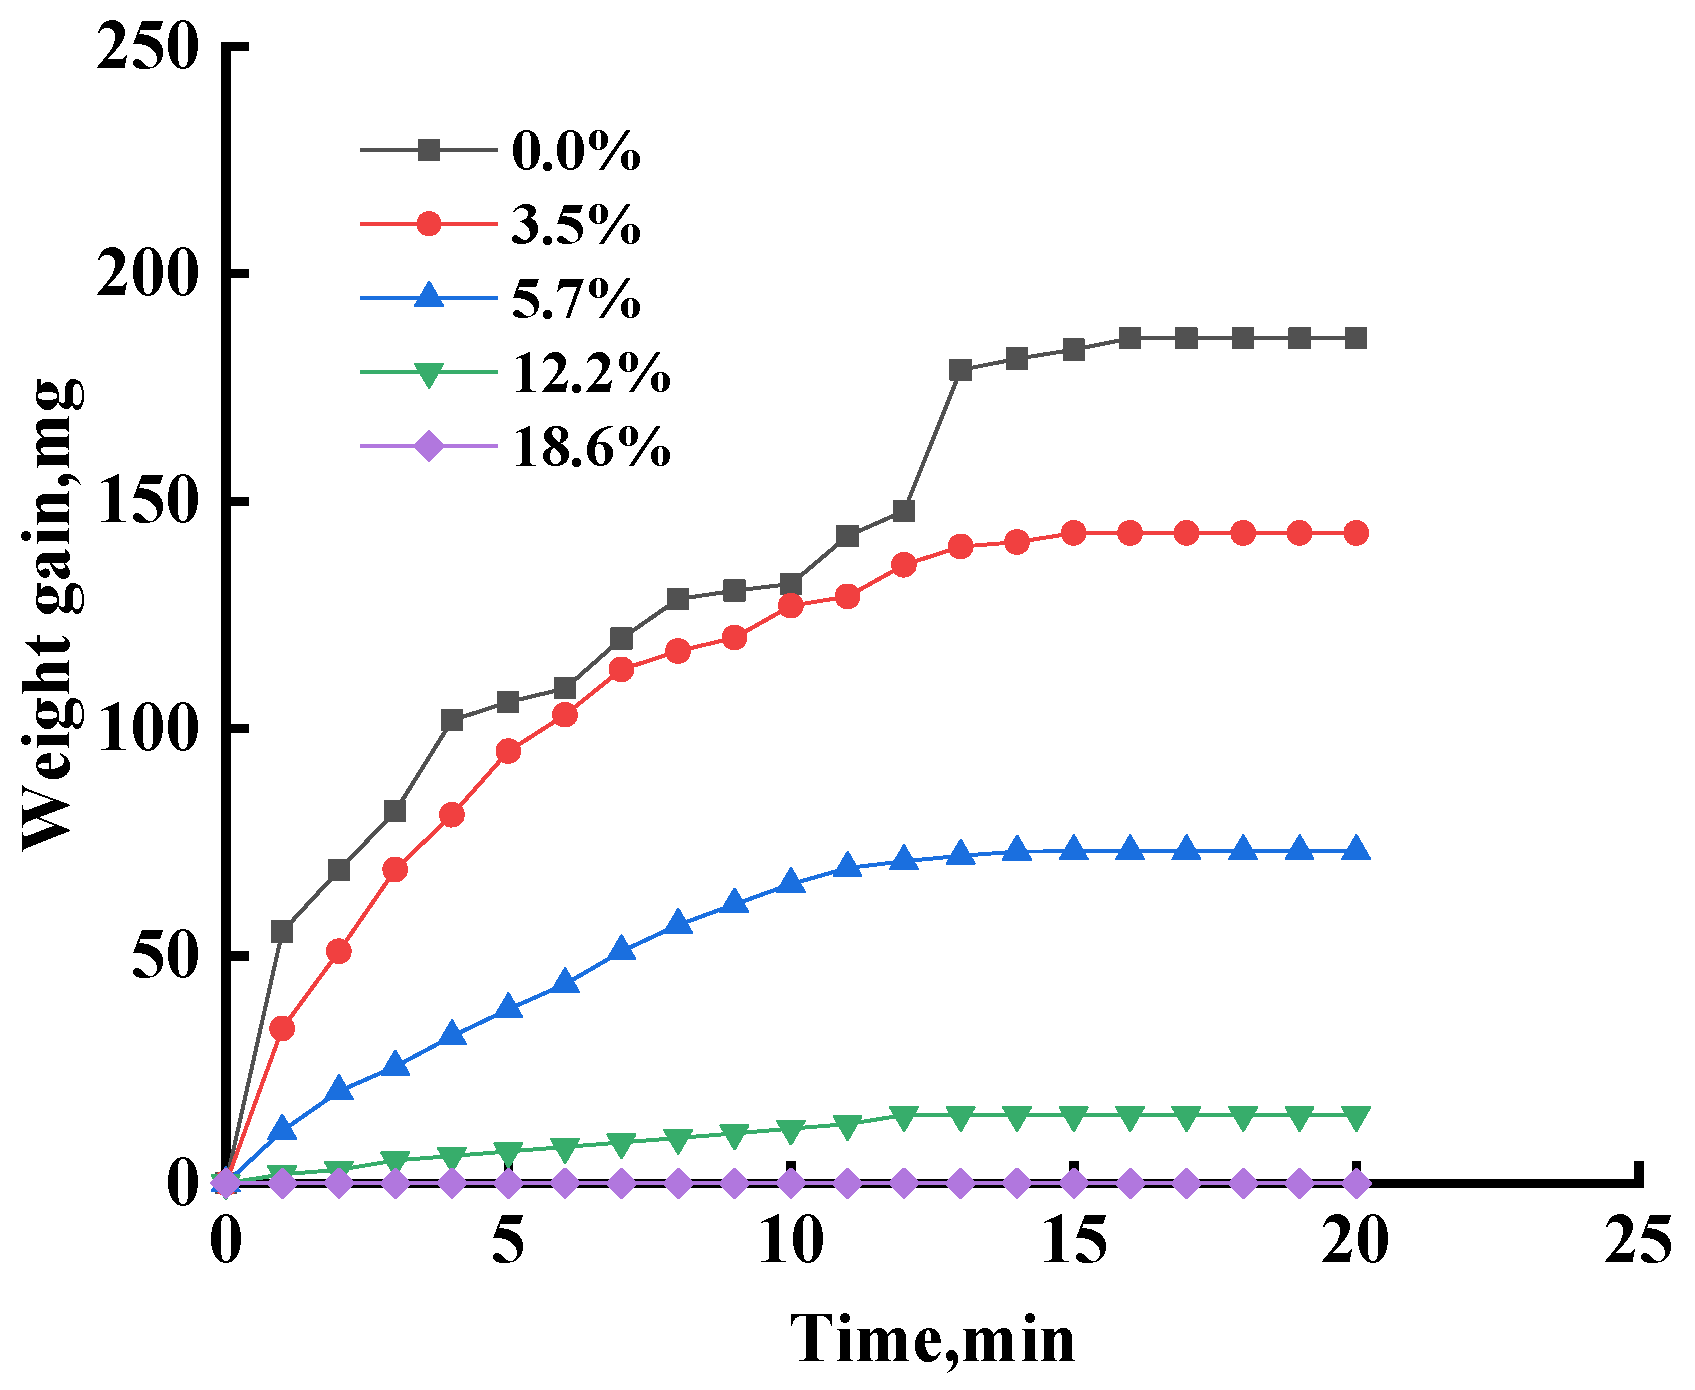
It can be seen from
Figure 10 that the drier the soil, the more intense the water absorption, the lower the moisture content, the more pores in the soil, and the more water absorption. It can be seen from the curves with a moisture content of 12.2% and 18.6% that when the moisture content reaches a certain value, the water absorption of the soil becomes quite weak; the water absorption is small, and the curve is smooth. Looking at the curve of its moisture content, it can be seen that regardless of the speed and total amount, the water absorption can be completed in about 20 min. The water absorption of soil with low moisture content can be roughly divided into three processes, the rate is faster at the beginning, then relatively slowed down, and finally, the rate is gradually stable.
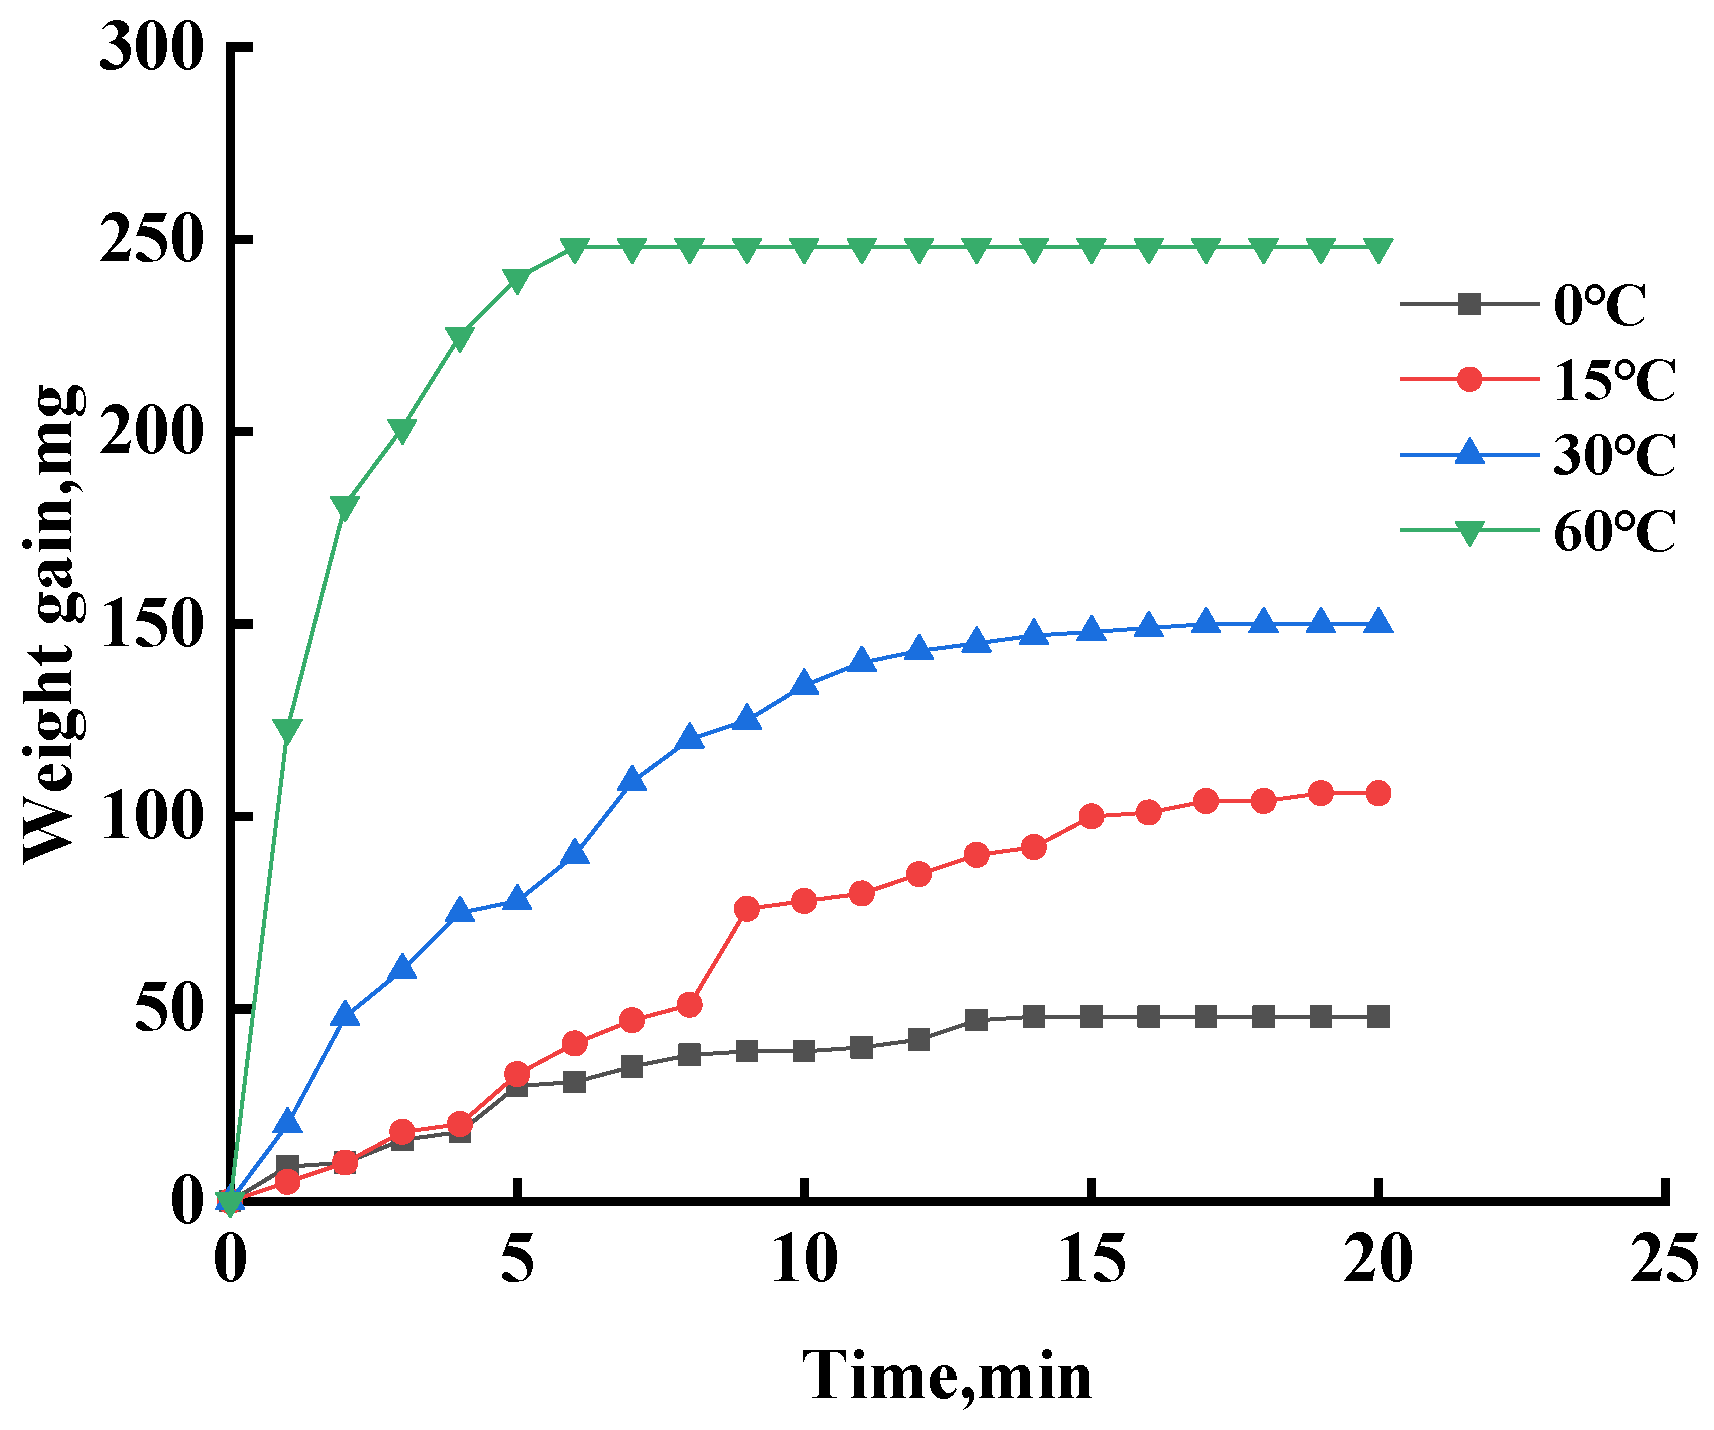
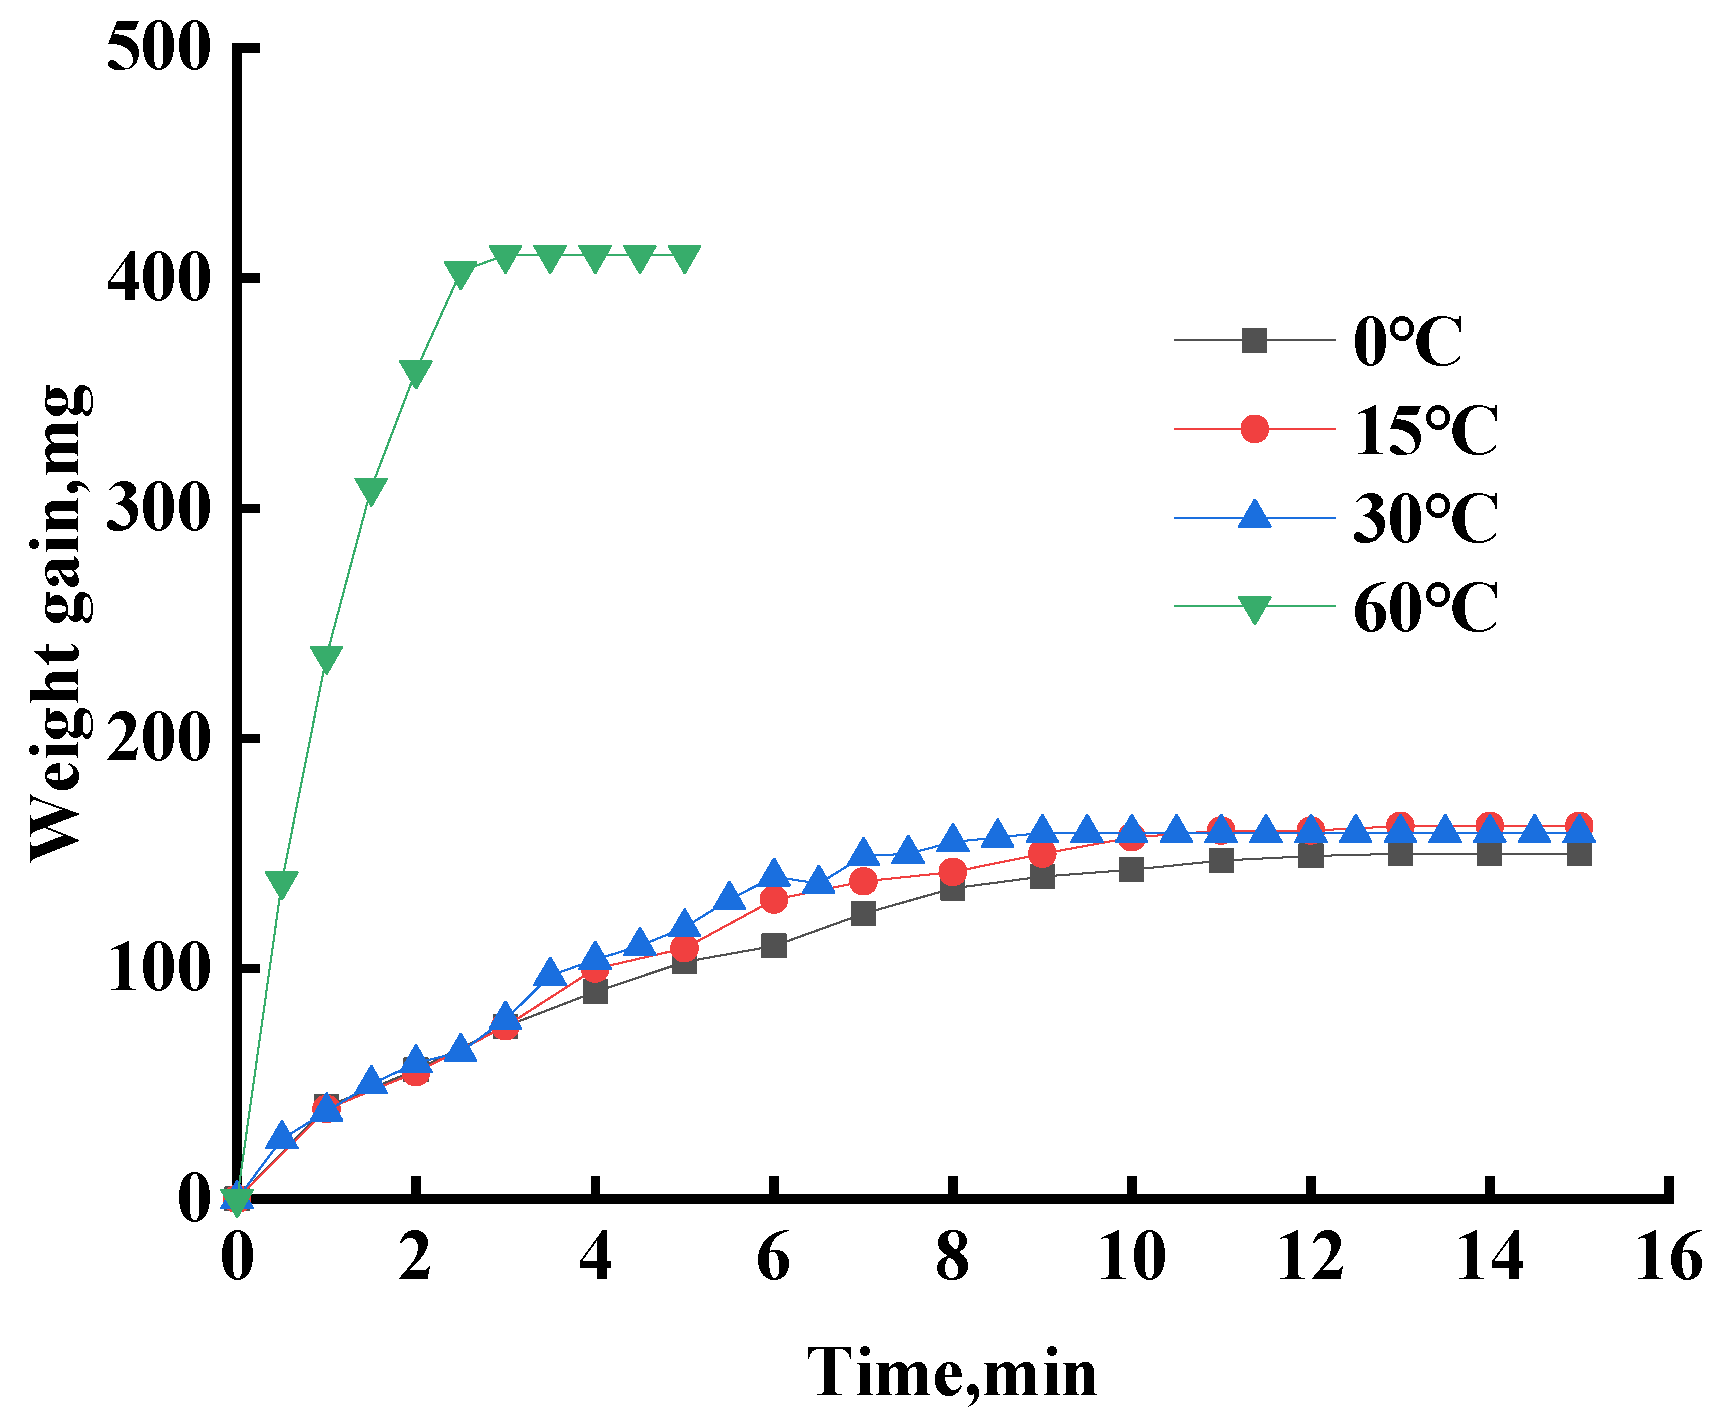
Figure 11 and
Figure 12 show the water absorption effect of red clay samples with a water content of 5.7% and 0% at different temperatures, respectively. It can be found that temperature has little effect on soil water absorption in the range of 0~30 °C. At 60 °C, the total amount of soil water absorption increases and rapidly reaches saturation. With the decrease in water content, the water absorption of each group of samples increases, indicating that the water content occupies a major position in water absorption.
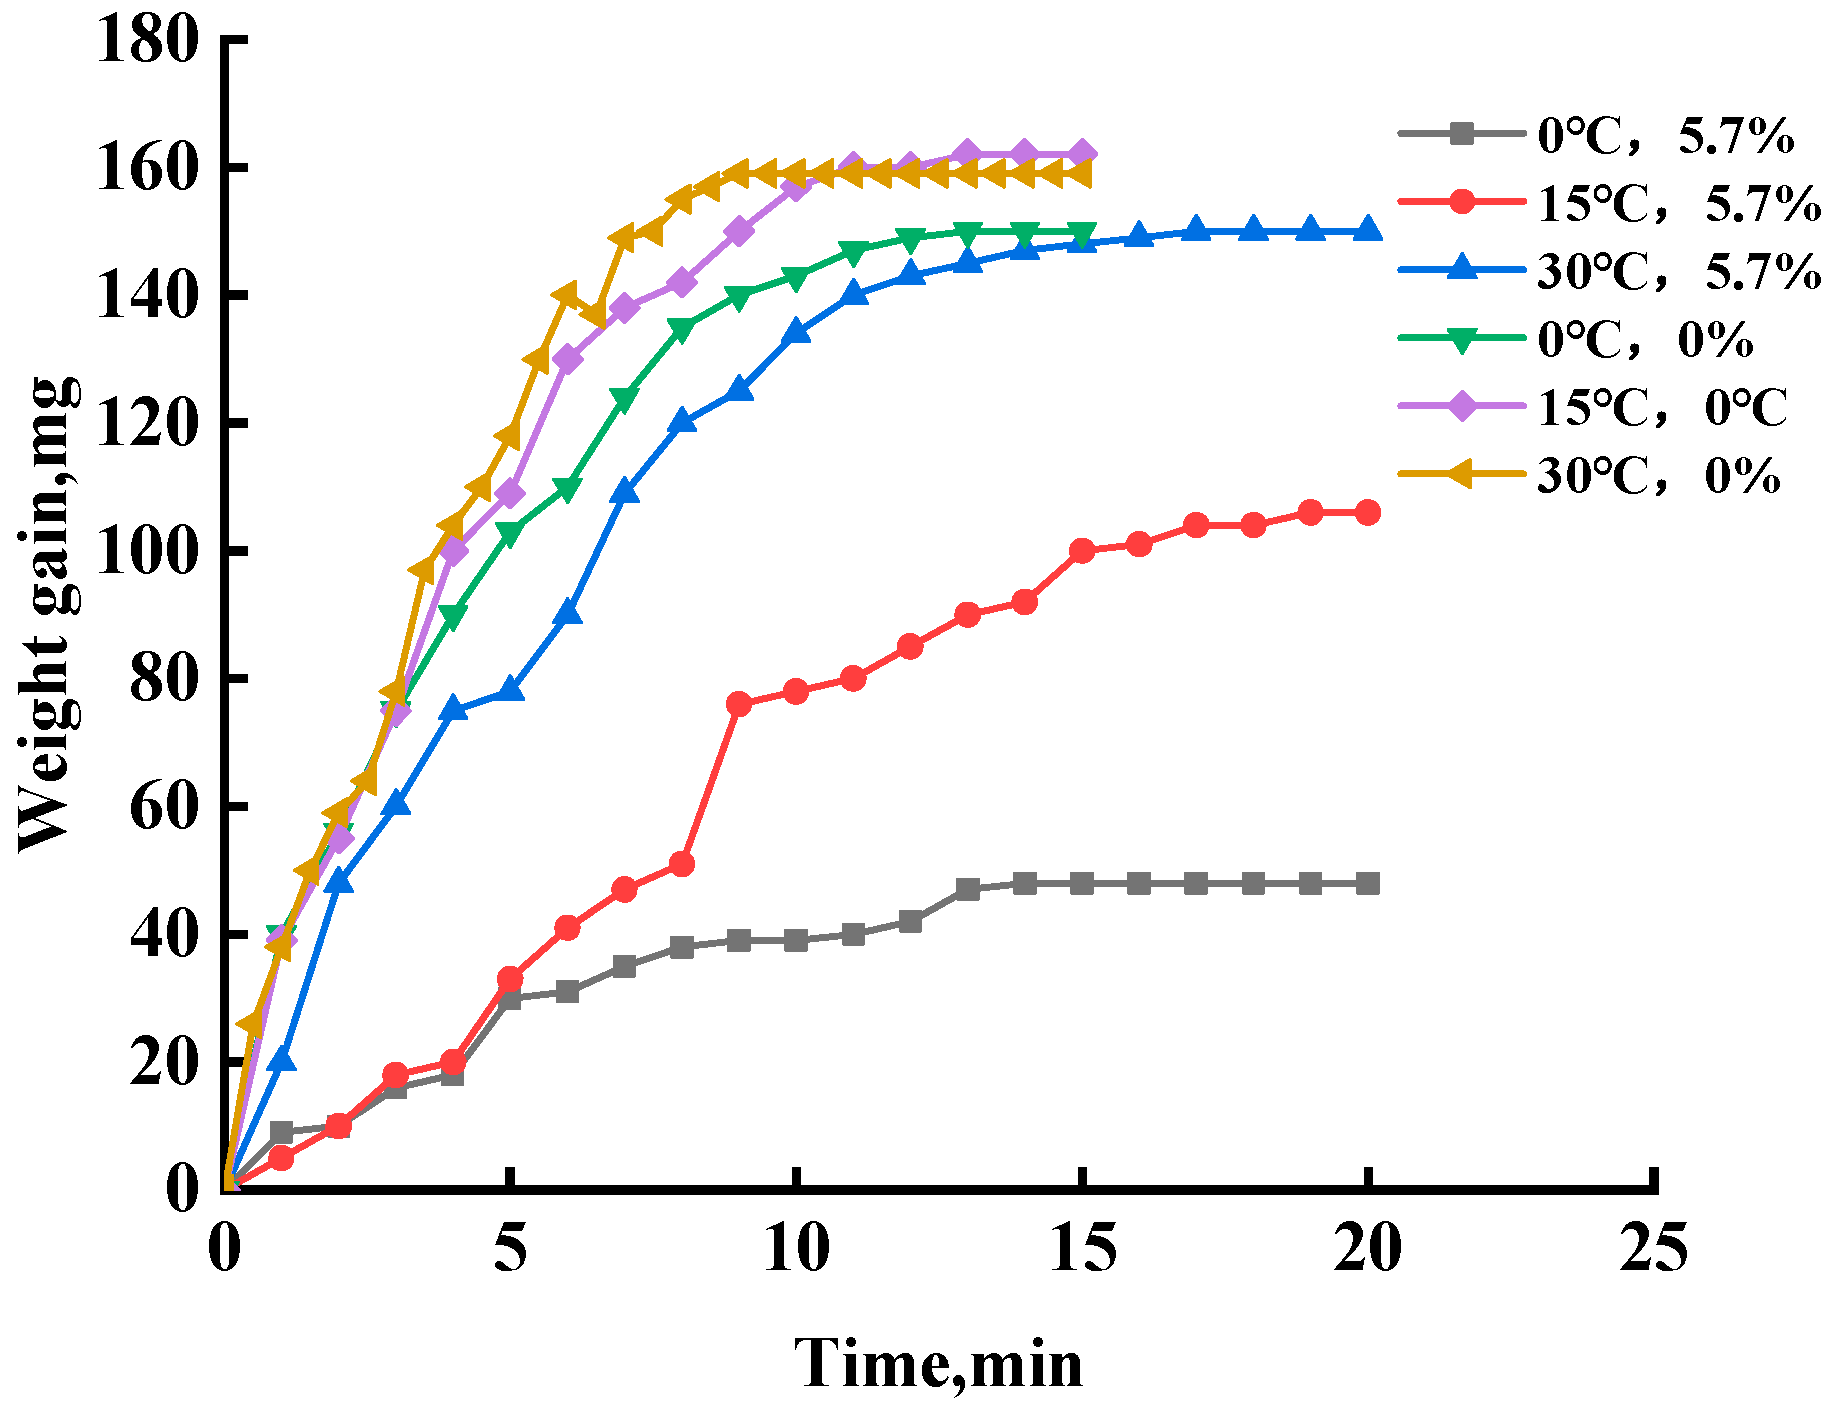
In order to further determine the main factors affecting soil water absorption, the water absorption curves of samples with 0% and 5.7% water content at 0 °C, 15 °C, 30 °C, and water temperature were compared.
It can be seen from
Figure 13 that the upper three curves are the samples with a water content of 0%, and the lower three curves are the samples with a water content of 5.7%. They are divided into two groups according to the water content. The water absorption curve of each group of samples conforms to the rule that the higher the temperature, the more water absorption. The three curves with a water content of 0% are closely fitted, and the three curves with a water content of 5.7% are relatively loose, indicating that with the increase in water content, the impact becomes smaller, and the impact of temperature on soil water absorption increases.
The second to sixth minutes are regarded as the stable stage of water absorption, and the average water absorption rate during this period is taken as the average rate of the stable stage of water absorption. The results are listed in
Table 3:
According to the data in the table, at the same temperature, the average water absorption rate of the sample with low water content is higher than that of the sample with high water content. Although the average water absorption rate also increases with the increase in temperature, its effect is not as obvious as the change in water content. Therefore, combined with
Figure 13 and
Table 3, it can be determined that water content is the main factor affecting soil water absorption. The drier the soil is, the lower the saturation is, the faster the water absorption process is, and the more water absorption is.
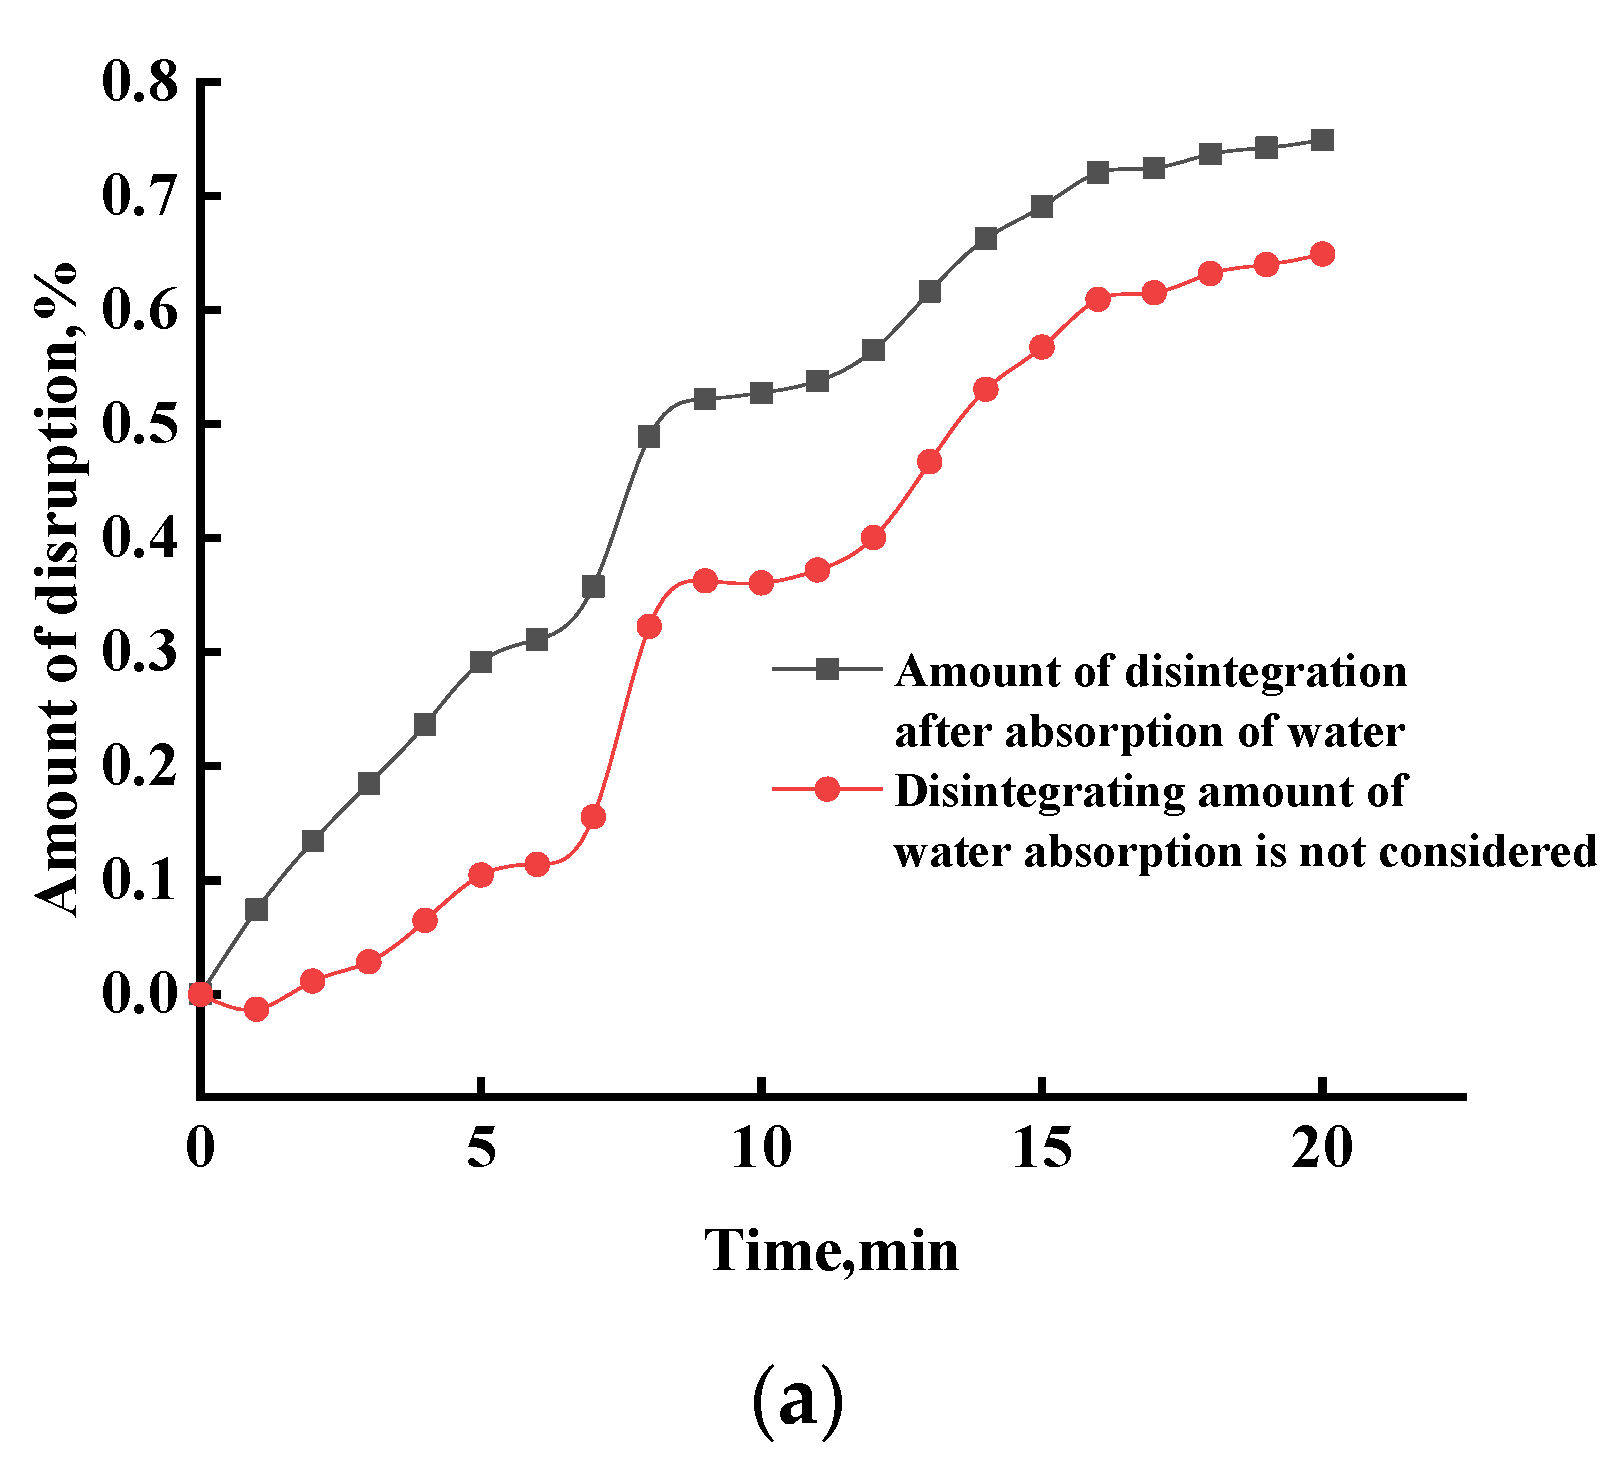
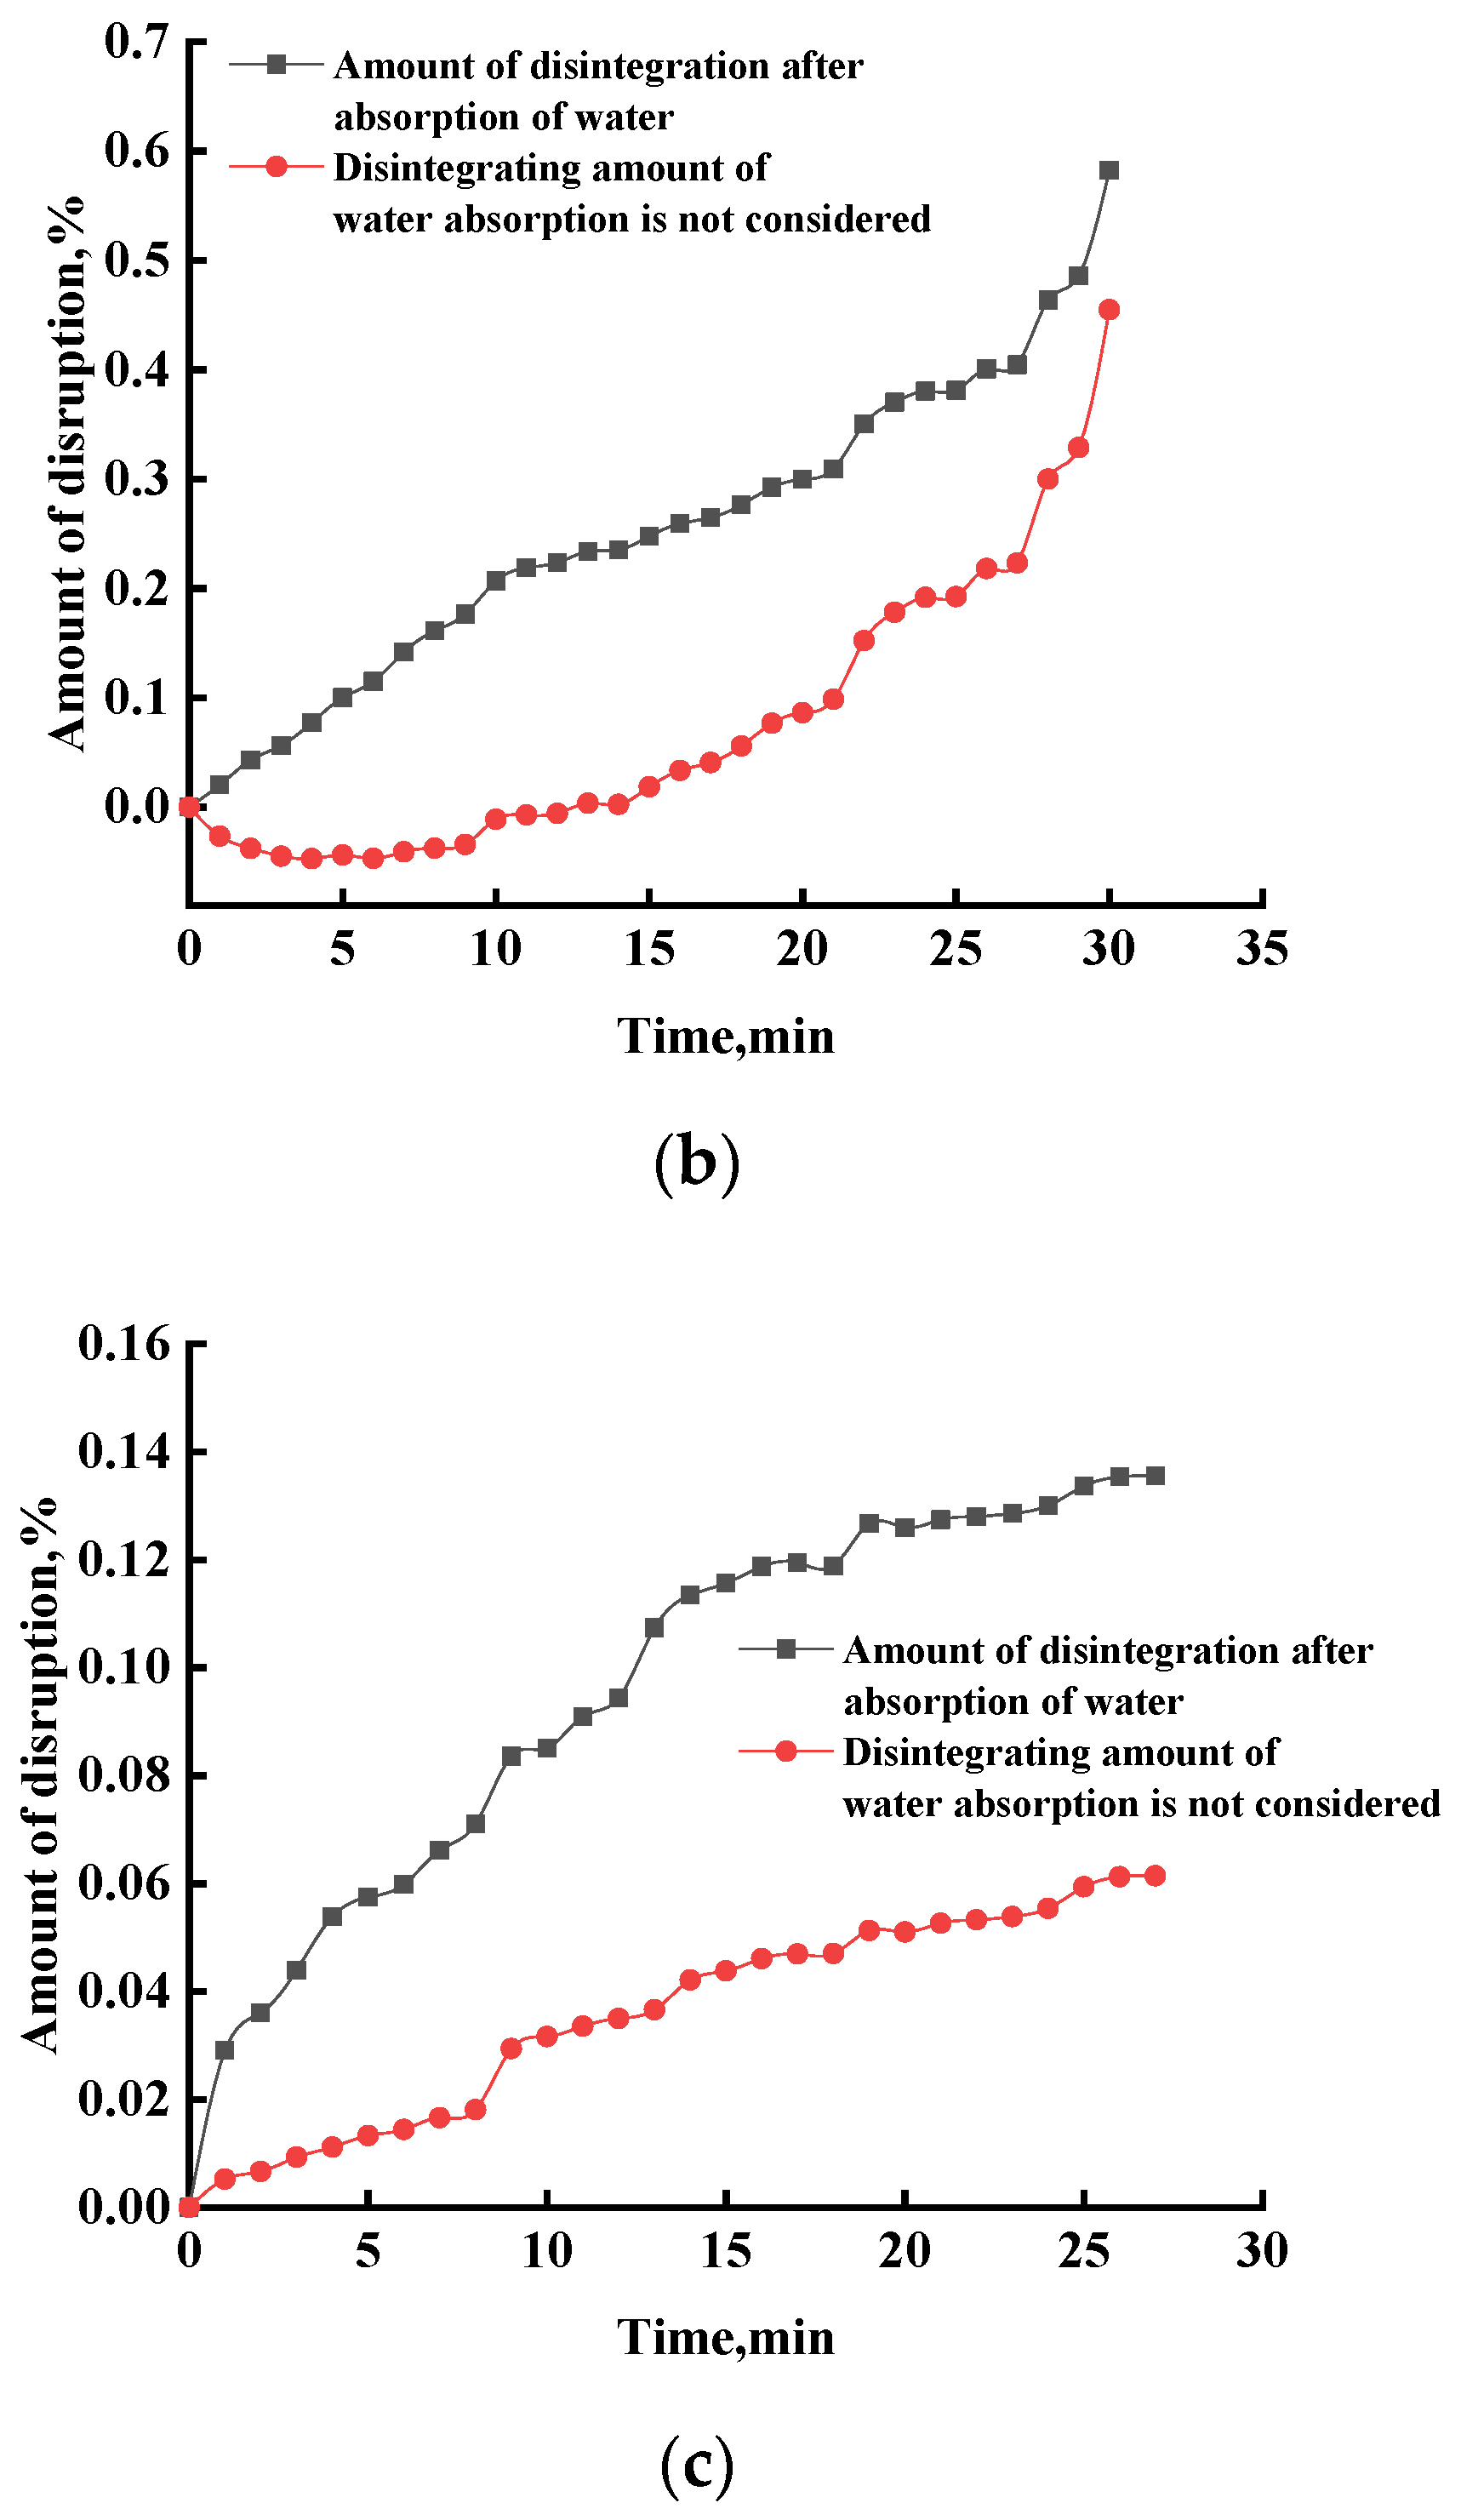
Figure 14 shows the comparison of the disintegration curve of the samples with 0%, 3.5%, and 5.7% water content at room temperature without considering the water absorption effect and the disintegration curve after the water absorption test. In most previous soil disintegration tests, the discharge of pore gases was not considered. Because the traditional volume method is used to measure the amount of disintegration, the accuracy of the instrument is often not enough, so the determination of water absorption is not only troublesome but also not accurate enough; water absorption shows different properties on different soils; for some types of soil disintegration test is not particularly important, such as for red clay. When the water content is low, the soil will absorb water violently after immersion, and a large amount of water may be absorbed by the soil within a few minutes of the initial test, but it has not yet collapsed, which is called “negative disintegration”. After 10 min, the disintegration of each sample is stable, and this stage is also within the influence range of water absorption, resulting in changes in the slope of the disintegration curve after considering water absorption. Therefore, water absorption can also affect the disintegration rate, that is, water absorption will increase the disintegration rate and disintegration amount of red clay.
4.5. Effect of Water Level Fluctuation on Disintegration
The occurrence of soil caves is closely related to the artificial extraction of groundwater. In the process of groundwater extraction, the change in water level is the key to determining the disintegration rate. The fluctuation of groundwater level makes the red clay overburden repeatedly saturated and dehydrated, resulting in disintegration, dispersion, and spalling of the overburden and downward migration, thus forming soil holes. Frequent fluctuations in groundwater level will accelerate the erosion of groundwater to the bottom of the overburden, destroy the balance, and lead to karst collapse.
In this paper, by hanging the sample in the disintegration cylinder and spraying the sample from the bottom, the dry–wet cycle conditions are artificially created to simulate the influence of groundwater level fluctuation on the disintegration of red clay.
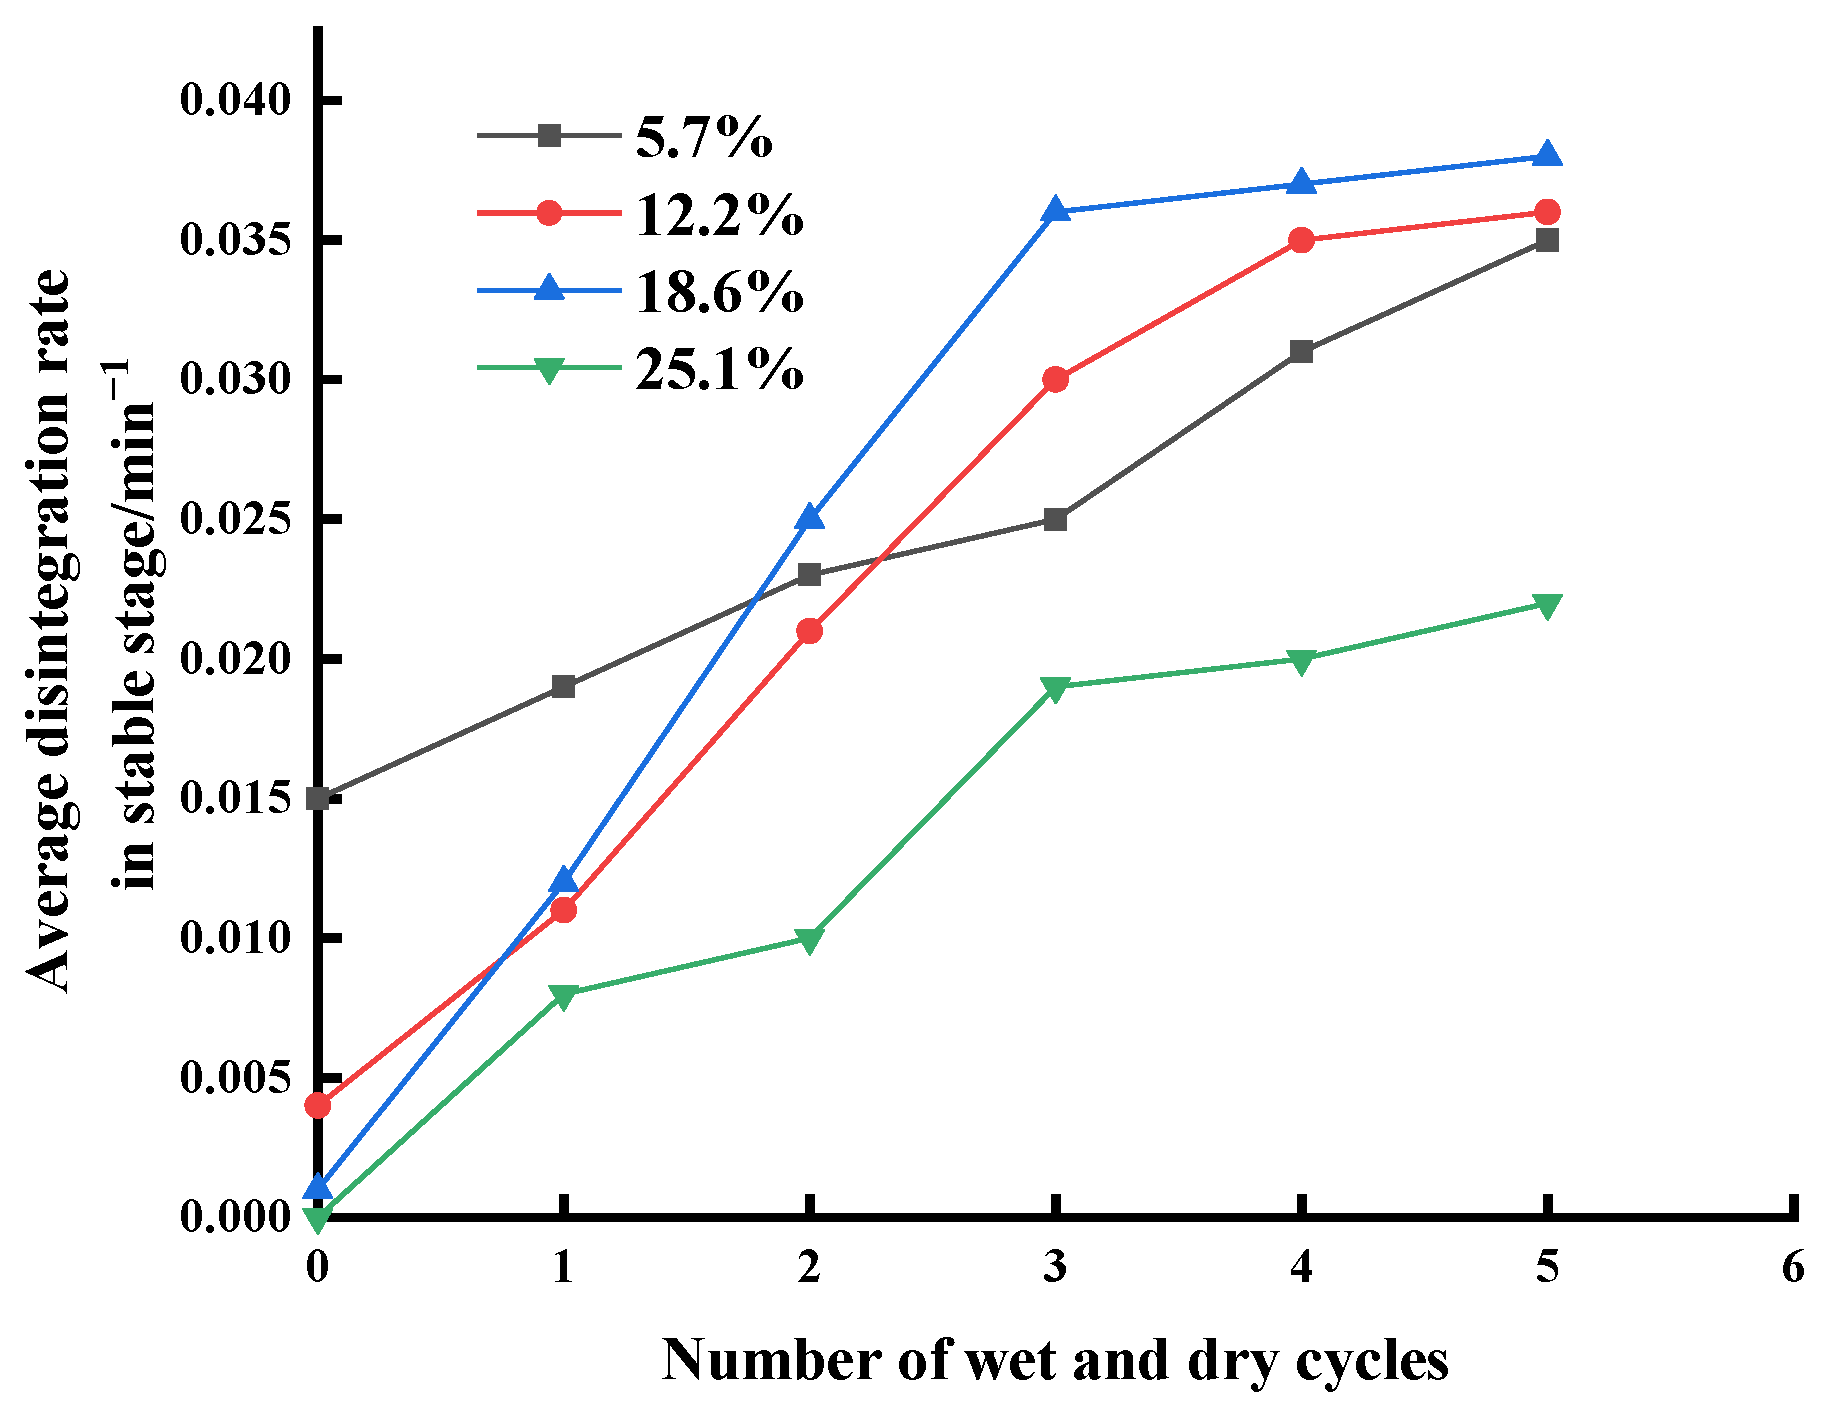
Figure 15 shows the disintegration rate relationship of samples with different initial water content after multiple drying and wetting cycles (24 h each time).
It can be seen from the figure that the fluctuation frequency of water is in direct proportion to the disintegration rate of the soil. The more dry and wet cycles, the faster the disintegration rate of the soil. This can further explain that when groundwater level fluctuates due to pumping, soil cave collapse is more likely to occur. According to the analysis of the disintegration mechanism of soil, each water loss shrinkage will lead to a large number of new cracks in the soil. When the sample is immersed in water, it is conducive to the infiltration of water and accelerates the softening and dissolution of the soil. As the solid particles in red clay are cemented by free iron oxide, the release of cations increases after the dry–wet cycle, resulting in the original cementation becoming unstable, changing the accumulation structure between soil particles, and thus affecting the disintegration of red clay.
5. Factors Affecting the Disintegration of Red Clay
5.1. Effect of Soil Composition and Structure on Disintegration
Different mineral compositions, the number of charged particles on the surface, thermodynamic potential, cation exchange capacity, and the number of permanent negative charges are different, so the thickness of the diffusion layer is also different [
19]. Montmorillonite clay usually disintegrates into fine particles, which disperse similar to clouds in the water and make the water turbid. Kaolinite usually disintegrates into small pieces and falls, and the water remains turbid [
20].
Red clay contains chemical components such as C, O, AL, SI, K, Ti, Fe, and so on. Among them, free iron oxide affects the appearance color of red clay; iron oxide cements fine soil particles into agglomerates with larger particle sizes; the denser the structure of red clay, the more iron oxide content [
21]. K
+, Na
+, and Mg
2+ are all soluble salt ions; these three substances in the soil, after immersion in water, are easy to undergo hydration reaction with water, dissolving in water to increase the pores of the soil and reduce the degree of cementation and finally, make the soil disintegrate. Calcium oxide is a cemented material with good water stability, and the calcium oxide in the soil layer is easy to lose in flowing water, so the calcium in the red clay in the natural environment is always in a state of loss, so calcium oxide can only delay the disintegration of red clay. Aluminum and silicon are the main components of the soil skeleton particles, and siliceous and aluminum cementation are water-stable minerals, both of which can improve the disintegration resistance of red clay [
22].
The structure of soil has a major effect on the disintegration. Because the permeability of soil is related to the degree of pore and fissure development, the soil with undeveloped pores and fissures generally has a slow disintegration rate. If the pores and fissures in the soil are developed after the soil is immersed in water, the water first penetrates through the macropores or fissures, causing uneven stress in the soil, resulting in the collapse of the soil along the direction of pore and fissure development. The structural state of soil also affects the bond strength of the soil. The structural connection strength of undisturbed soil and disturbed soil of red clay is different. Undisturbed soil has been compacted over a long geological time, sometimes combined with the cementation of some salts and colloids, so fine-grained soil has a certain structural connection force, so it is relatively difficult to damage. However, at the same time, during the residual process of undisturbed soil, due to the effect of various weathering agents, open structural planes and a large number of primary fissures were produced, which provided favorable conditions for the invasion and infiltration of water, and further aggravated the disintegration of soil.
The particle size composition of soil has a significant impact on the disintegration of soil, which determines the porosity and permeability of the soil, so it plays an important role in the quantitative evaluation factors of disintegration. The soil with fewer clay particles has greater water permeability; the time for the diffusion layer to reach the maximum thickness is very short, and the bonding force between particles disappears quickly, so it often collapses when soaked in water. However, the soil with high clay content has poor water permeability. When immersed in water, the thickening process of the hydration film lasts a long time, and the bonding force between particles is large, so it undergoes the process of expansion before disintegration, and the disintegration speed is slow. With the decrease in the clay content of soil particles, the disintegration speed of soil increases; that is, the disintegration of soil increases.
5.2. Effect of Microscopic Characteristics of Red Clay on Disintegration
In the study of granite residual soil, An R used X-ray CT to study the pore structure and three-dimensional characteristics of the soil and the multi-scale study of the soil under the condition of dry and wet cycles [
23,
24]. In this section, the disintegration characteristics of red clay are analyzed from a microscopic perspective by SEM test [
25], and the SEM images of different red clay samples magnified 10 000 times are compared, as shown in
Figure 16,
Figure 17,
Figure 18,
Figure 19 and
Figure 20.
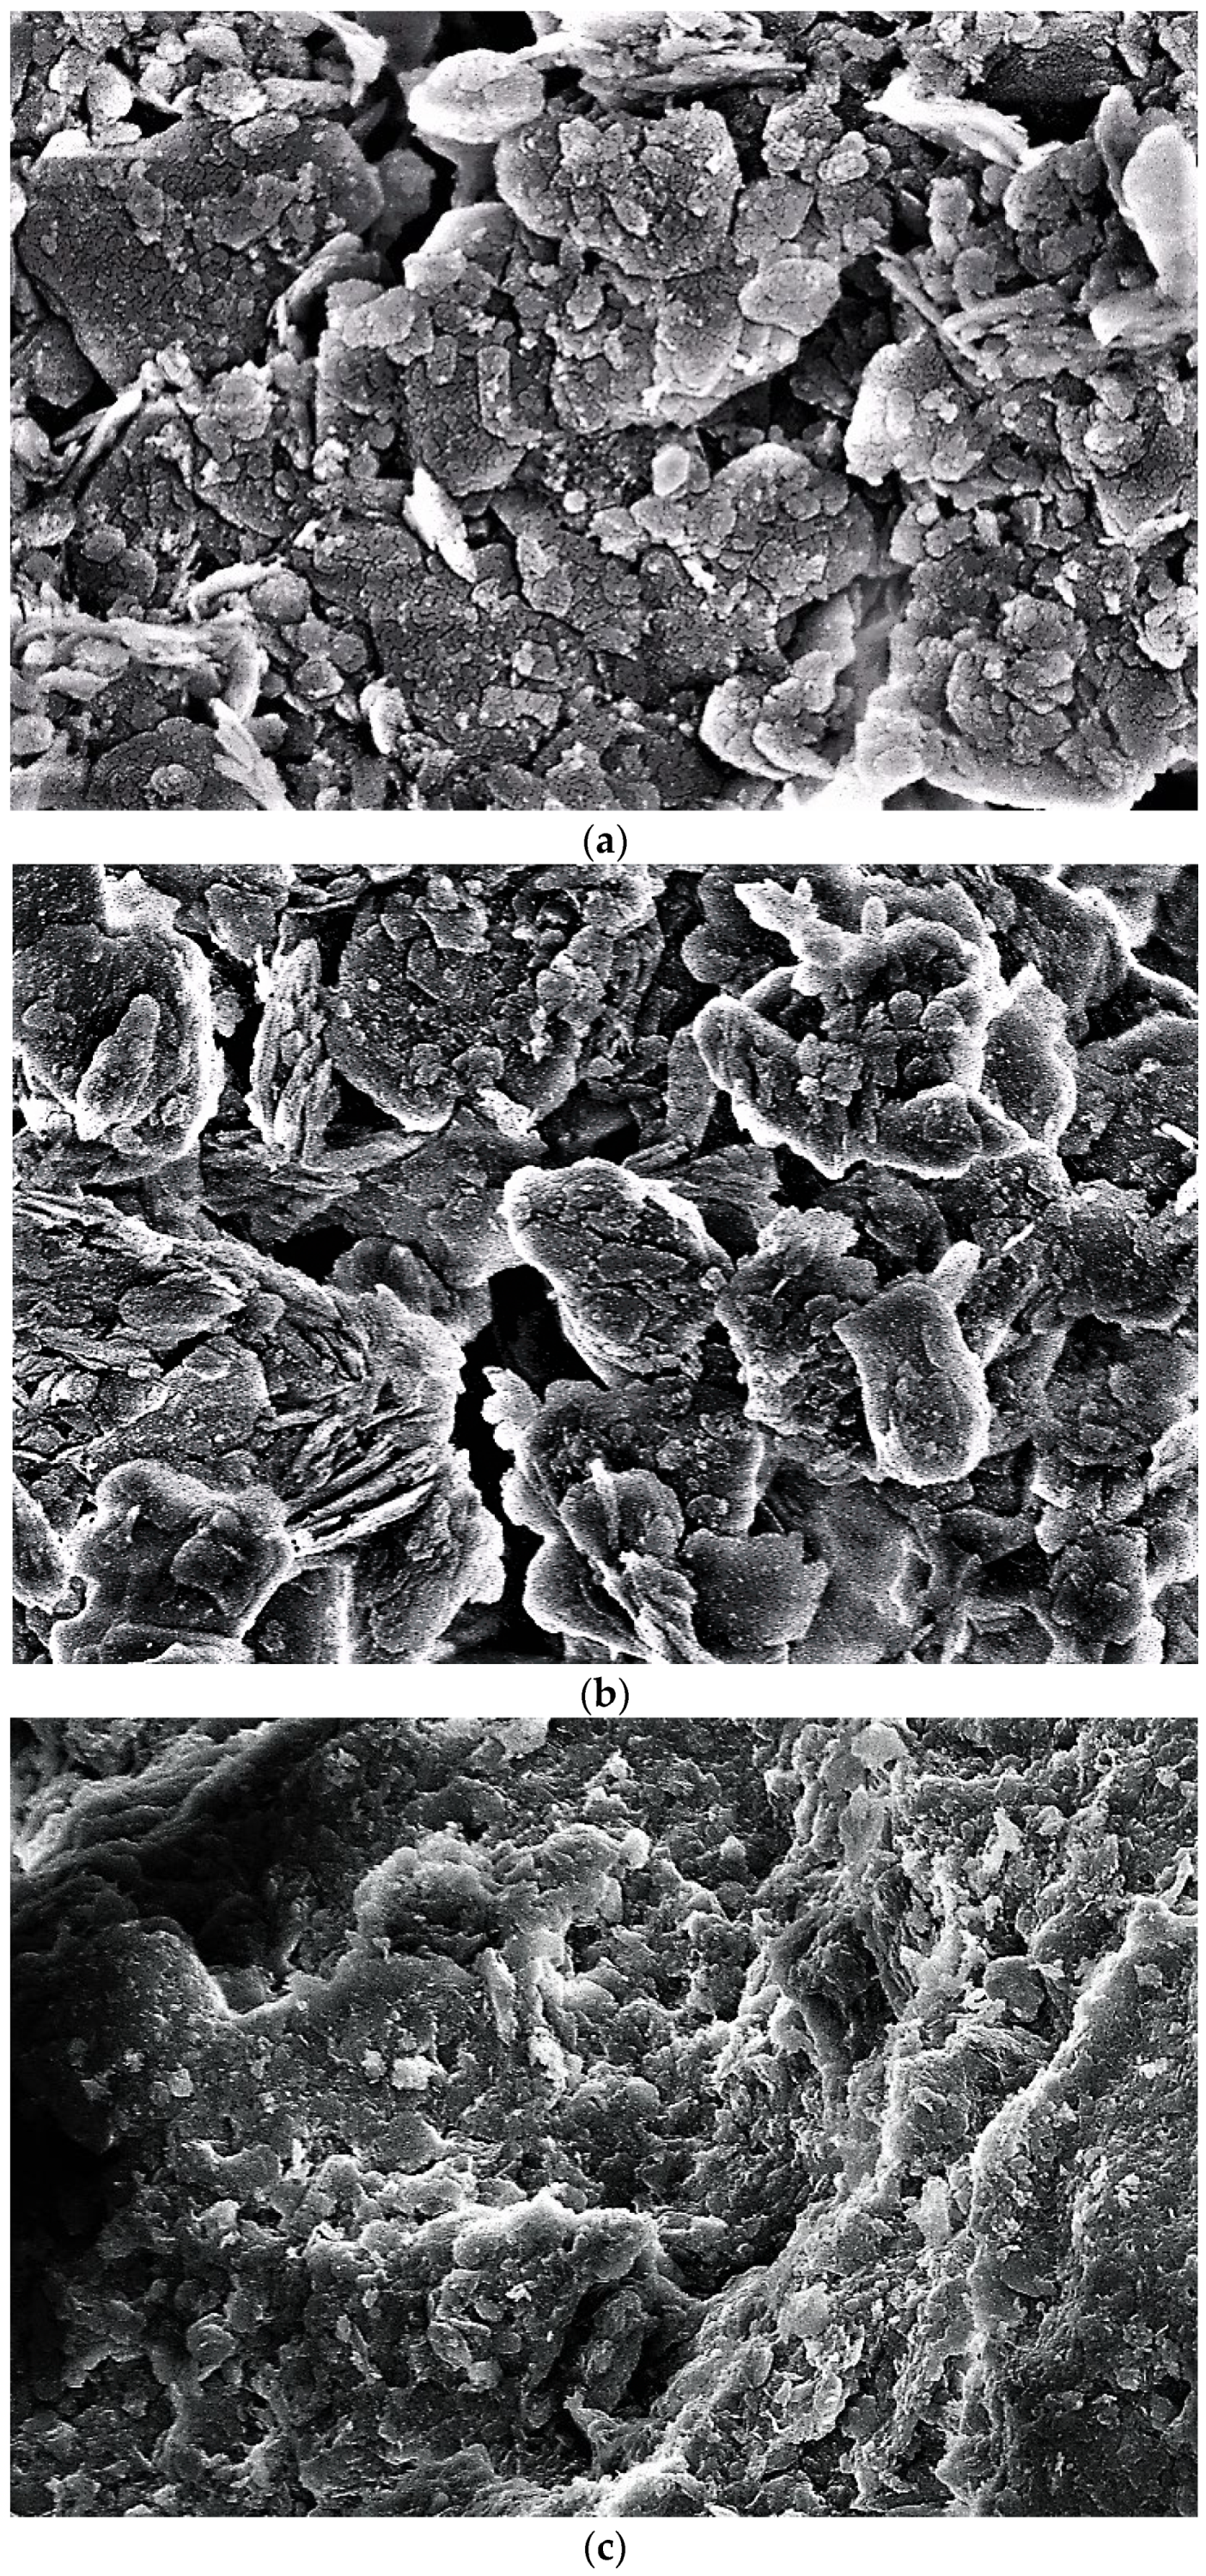
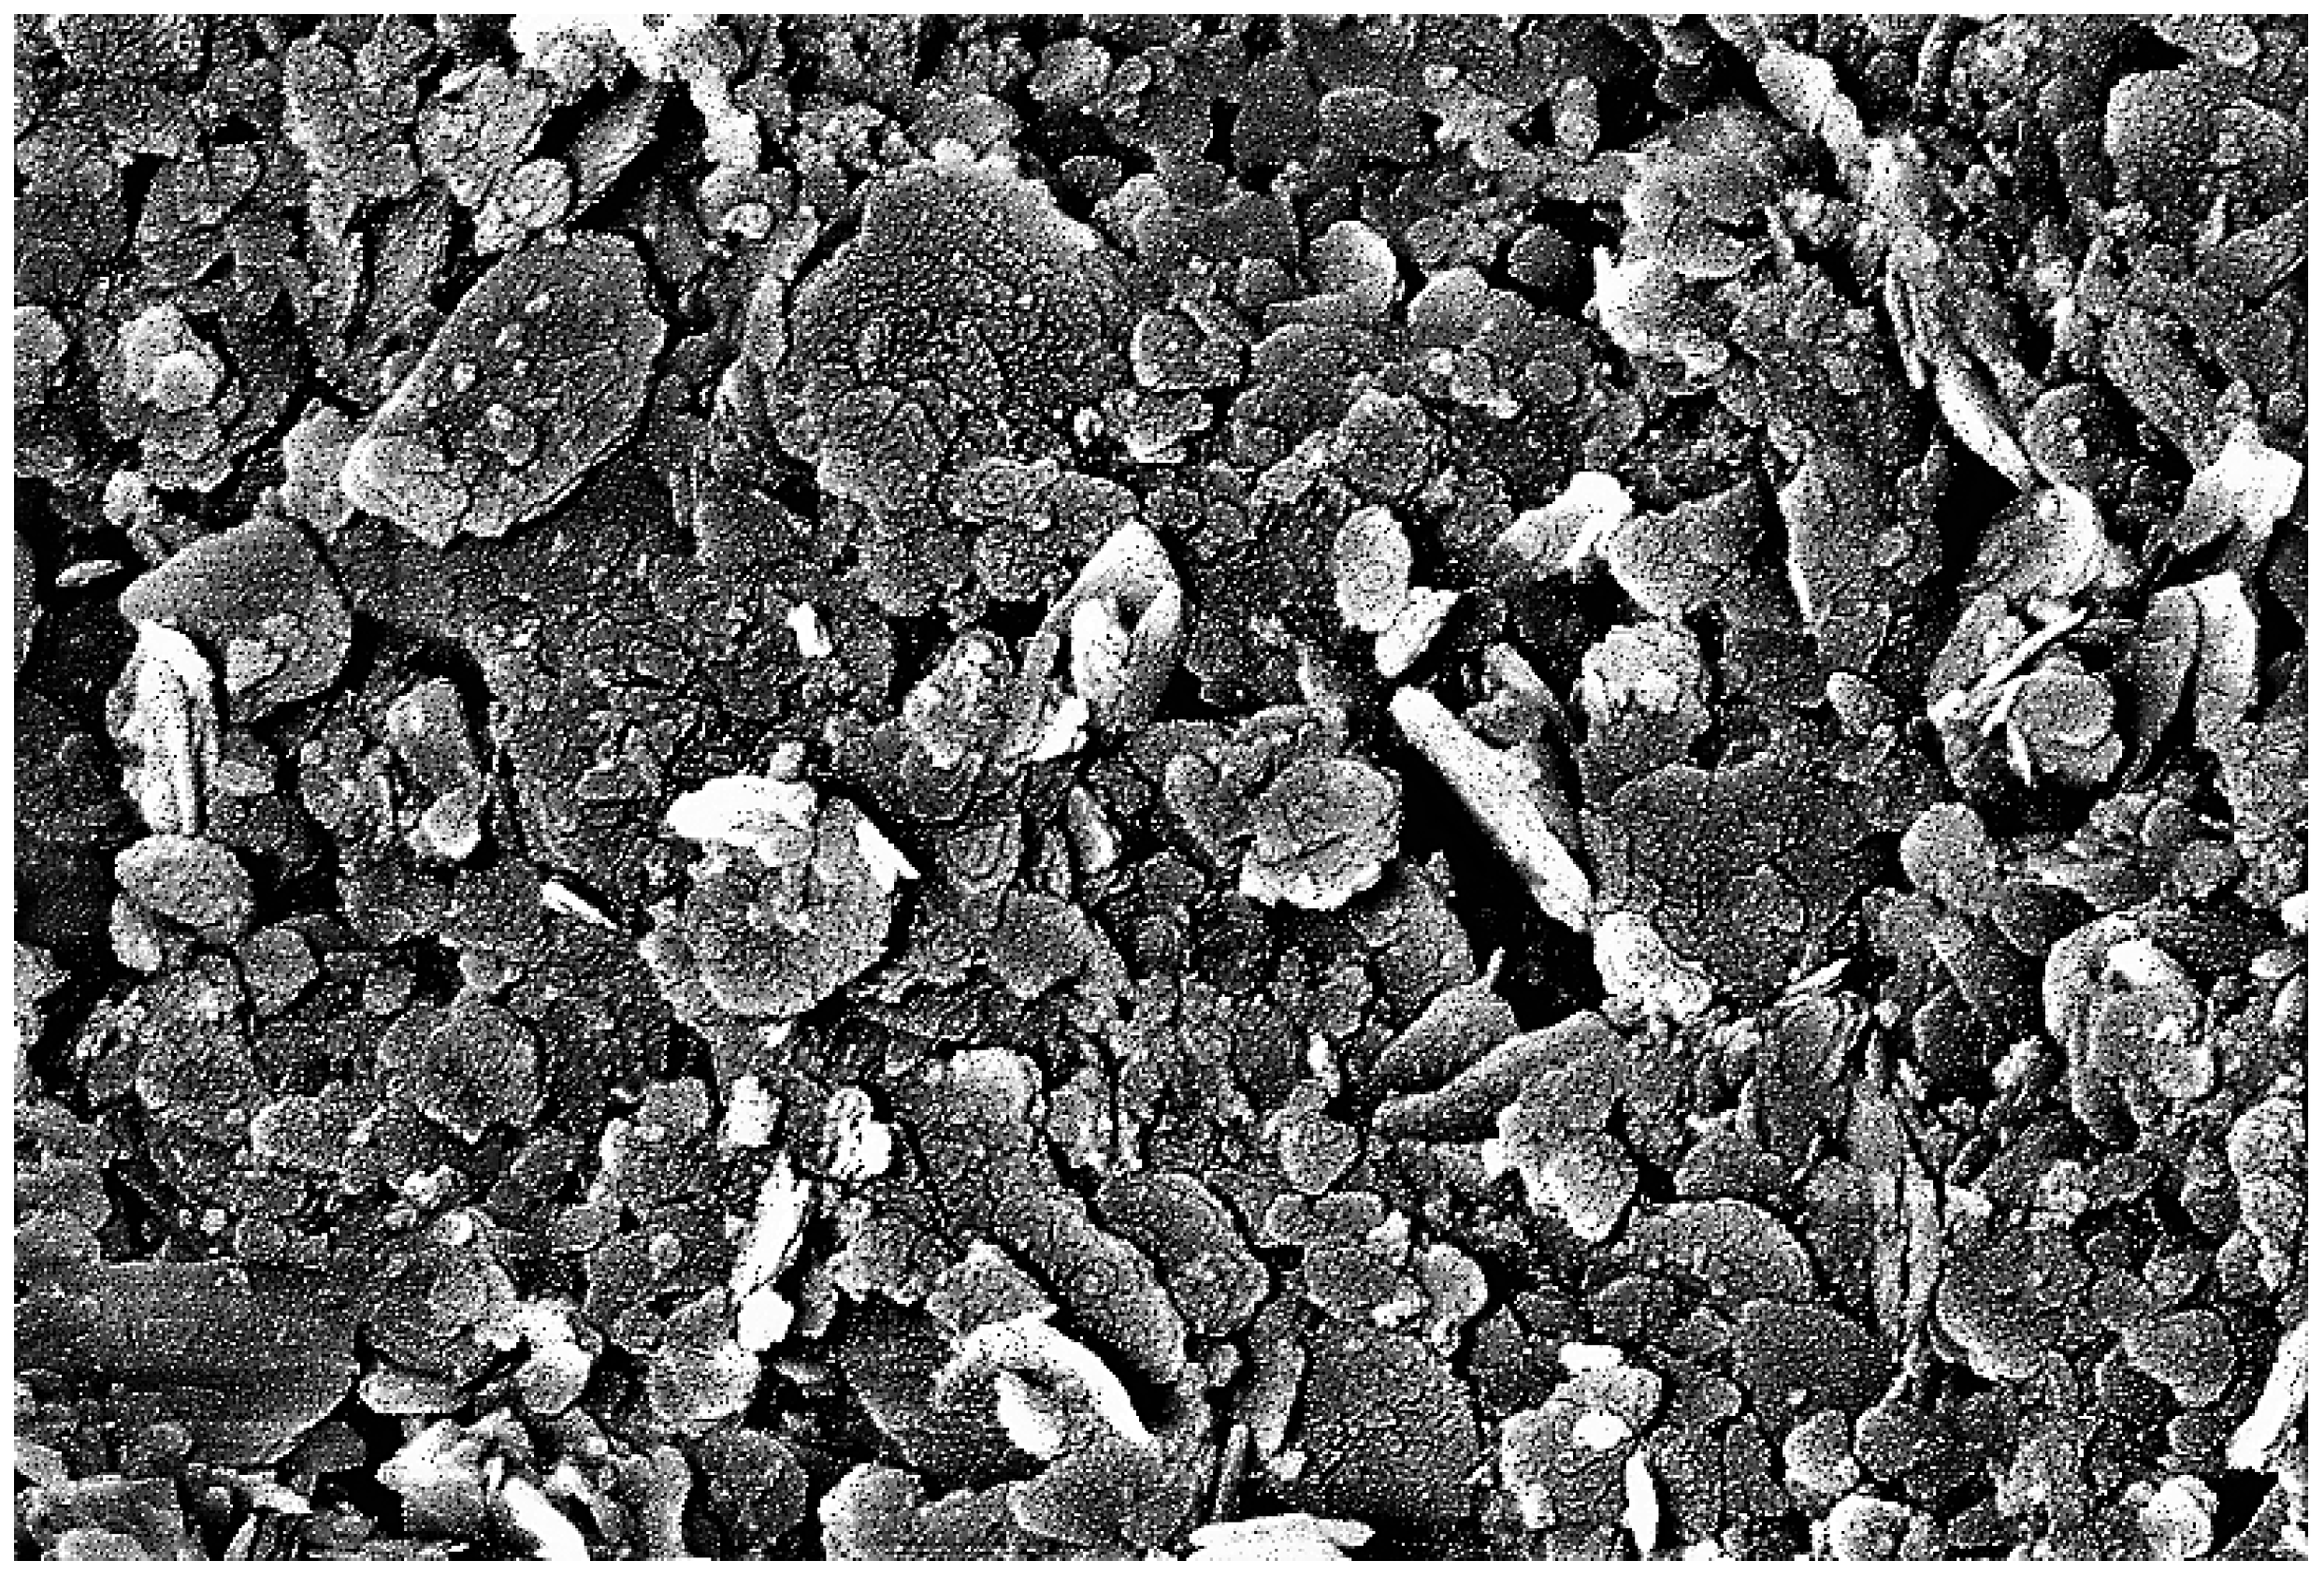
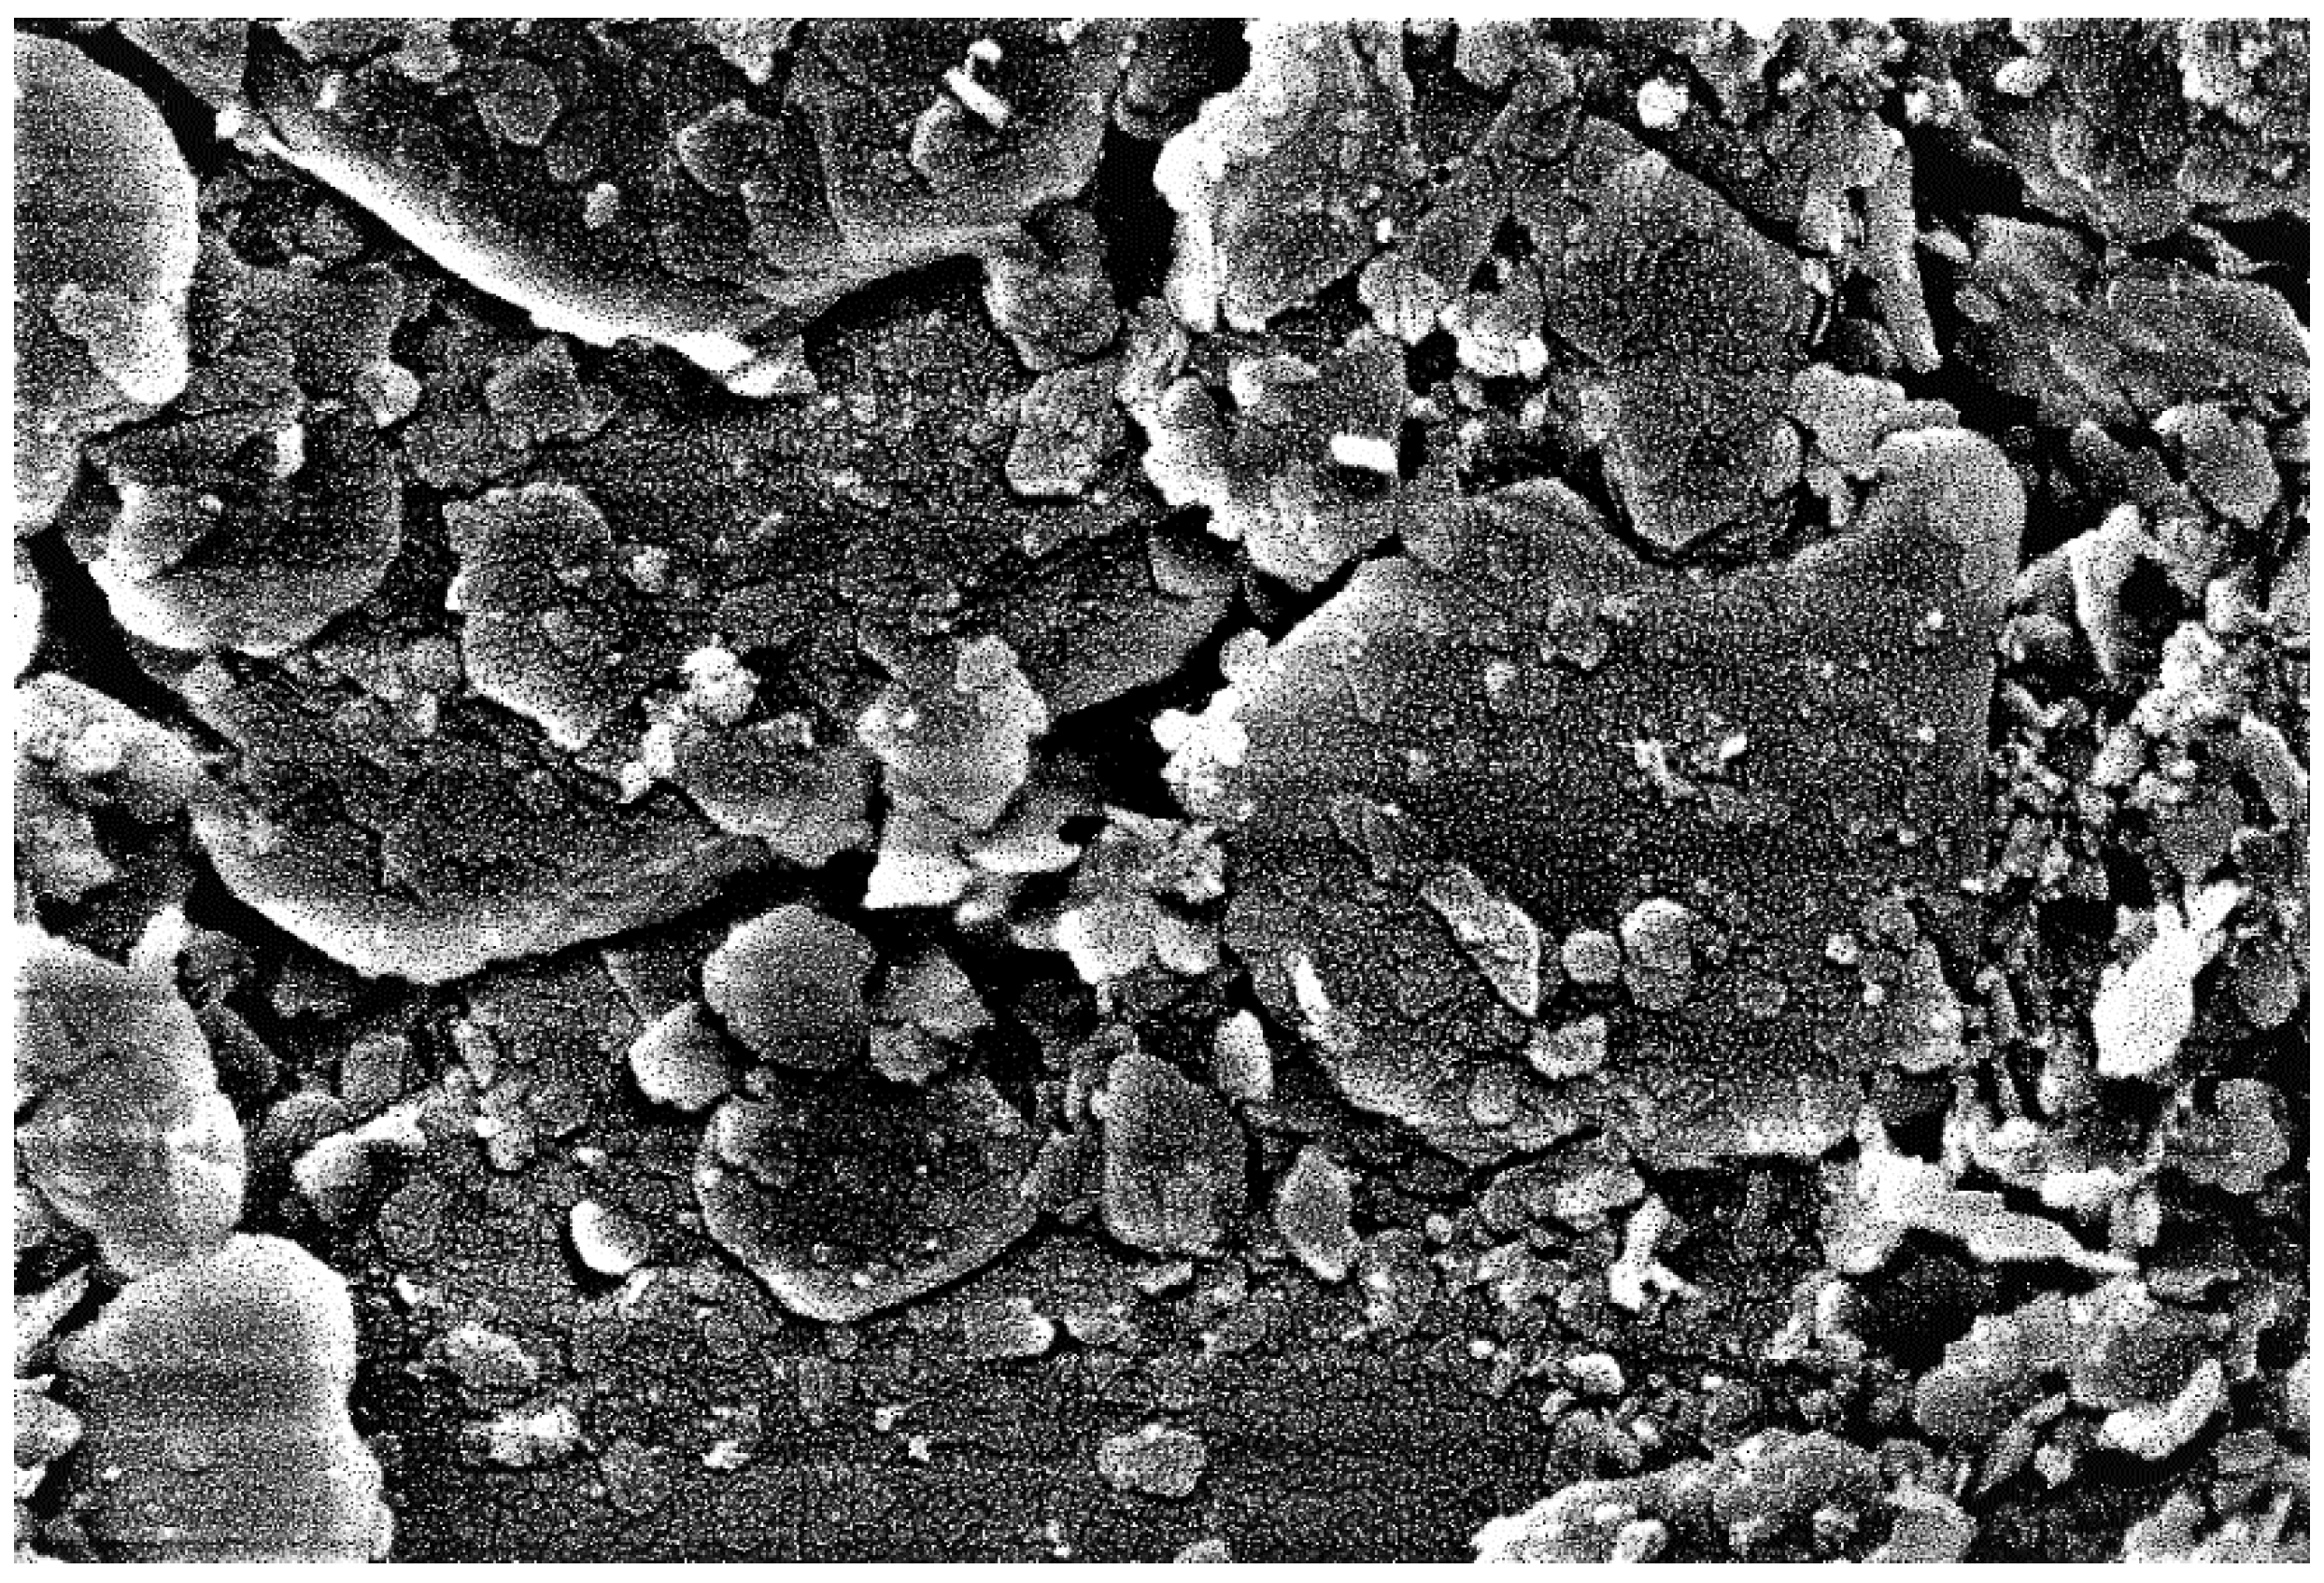
It can be seen from
Figure 16 and
Figure 17 that in naturally dried soil samples, minerals are mainly stacked in face-to-face form with different sizes, and the arrangement is relatively regular. After the drying treatment, the microstructure of the soil with 0% water content changed significantly; the soil particles curled, deformed, and turned; the soil particles were inserted randomly, and the arrangement of particles was disorderly.
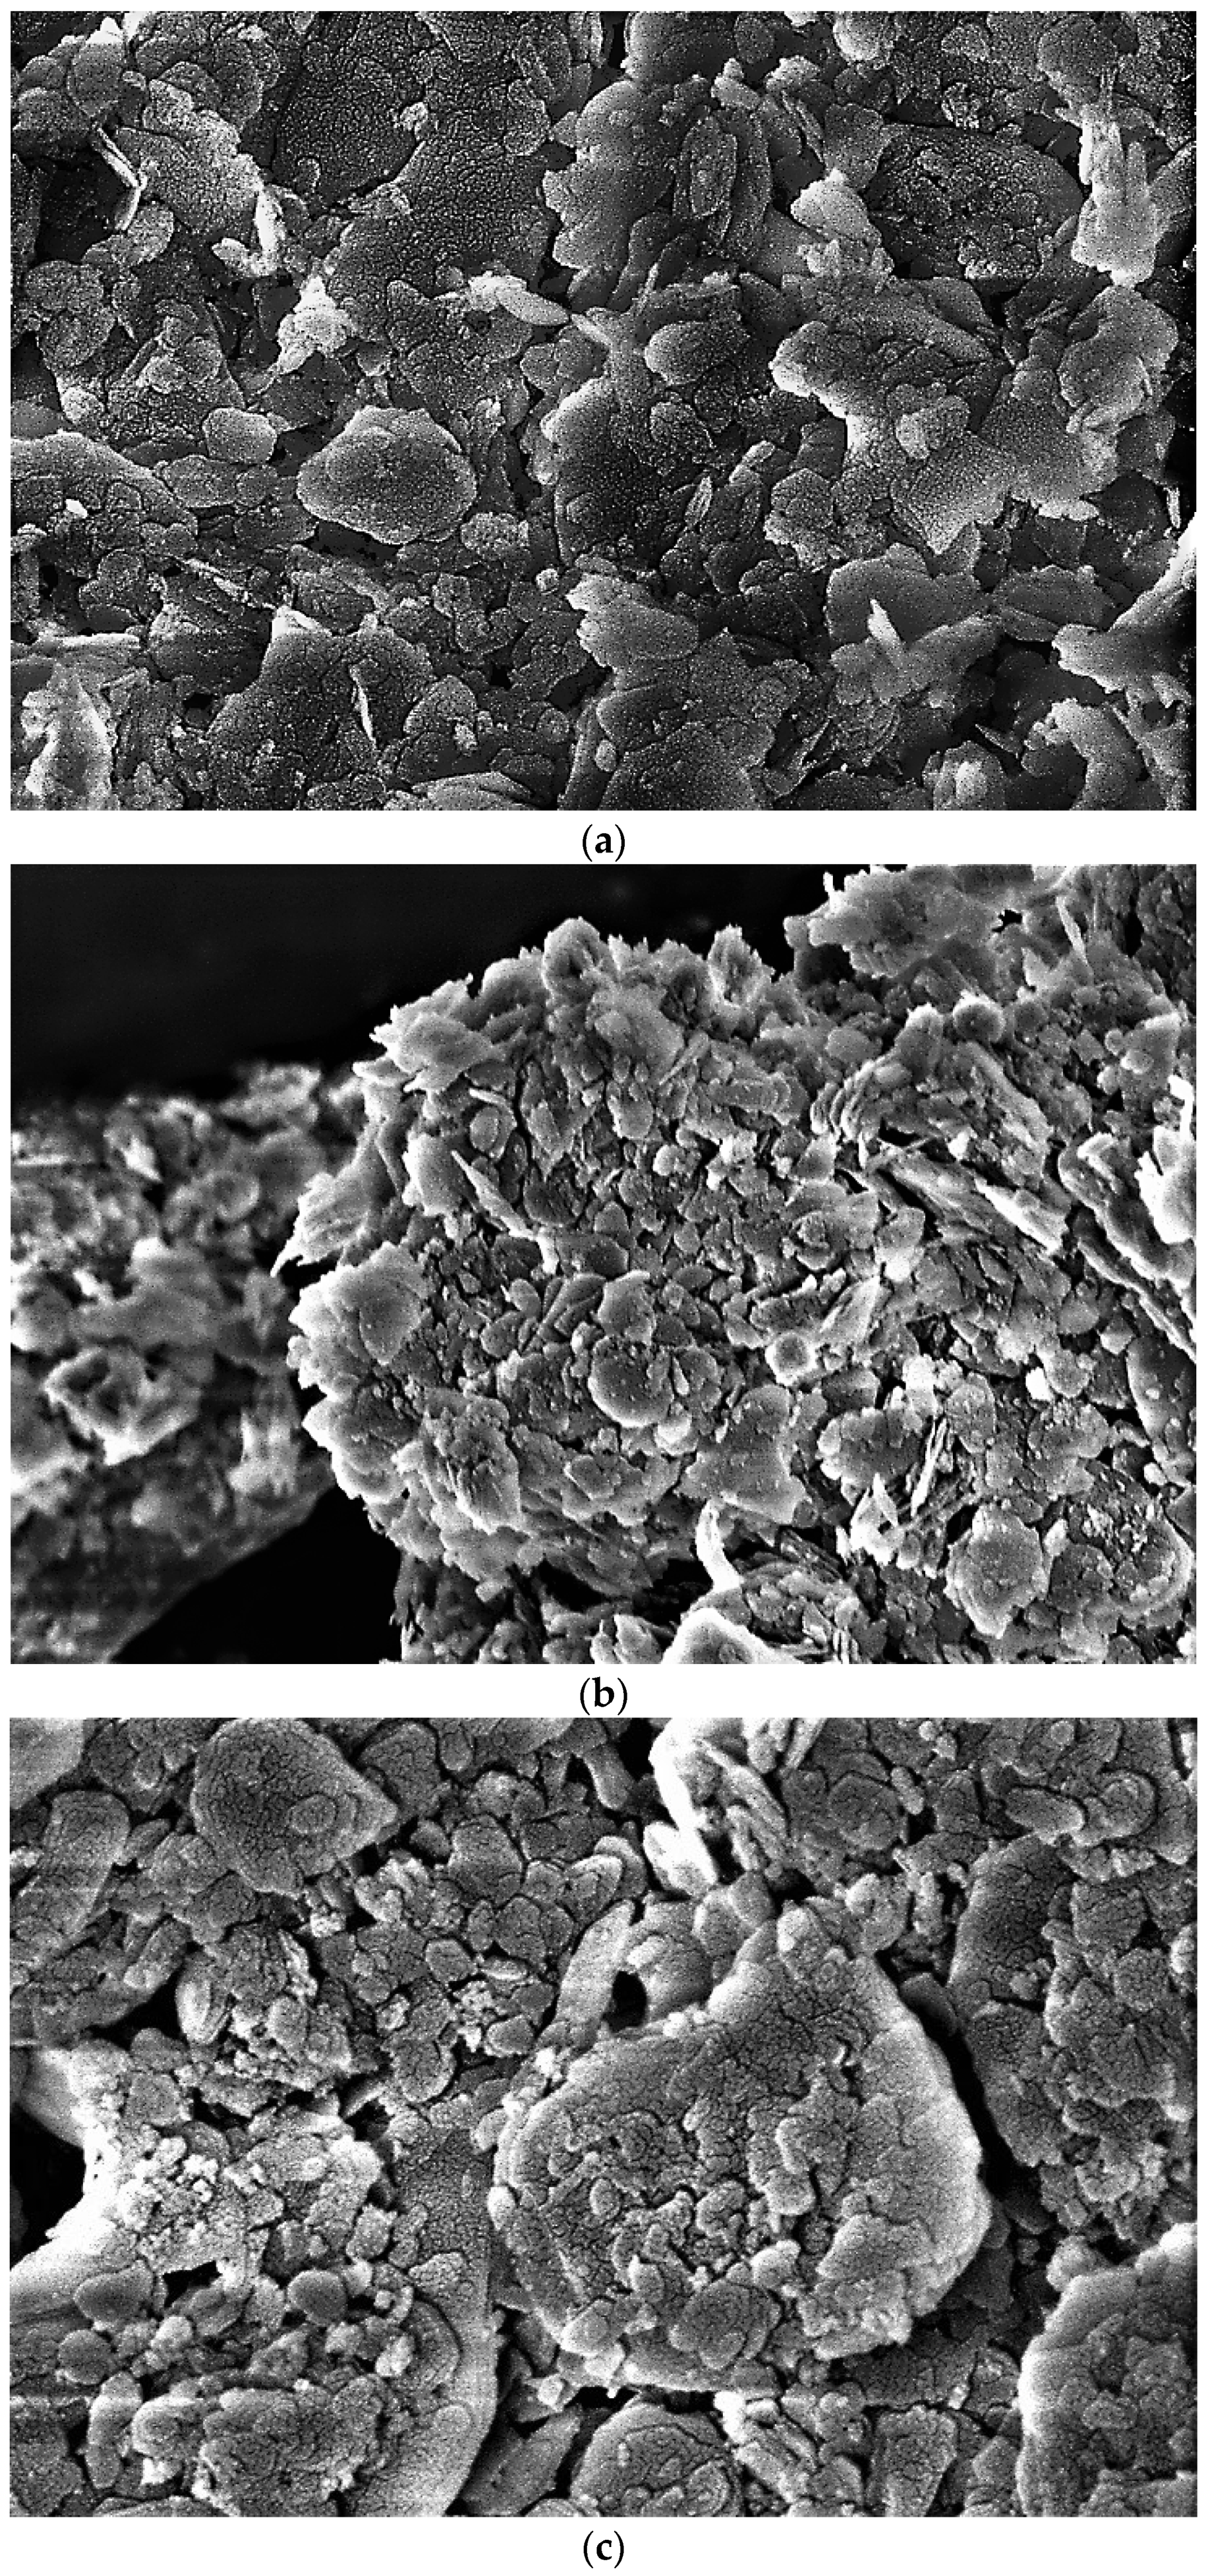
Figure 19 shows the SEM image of the sample after disintegration in 15 °C water, and
Figure 20 shows the image after disintegration in 30 °C water.
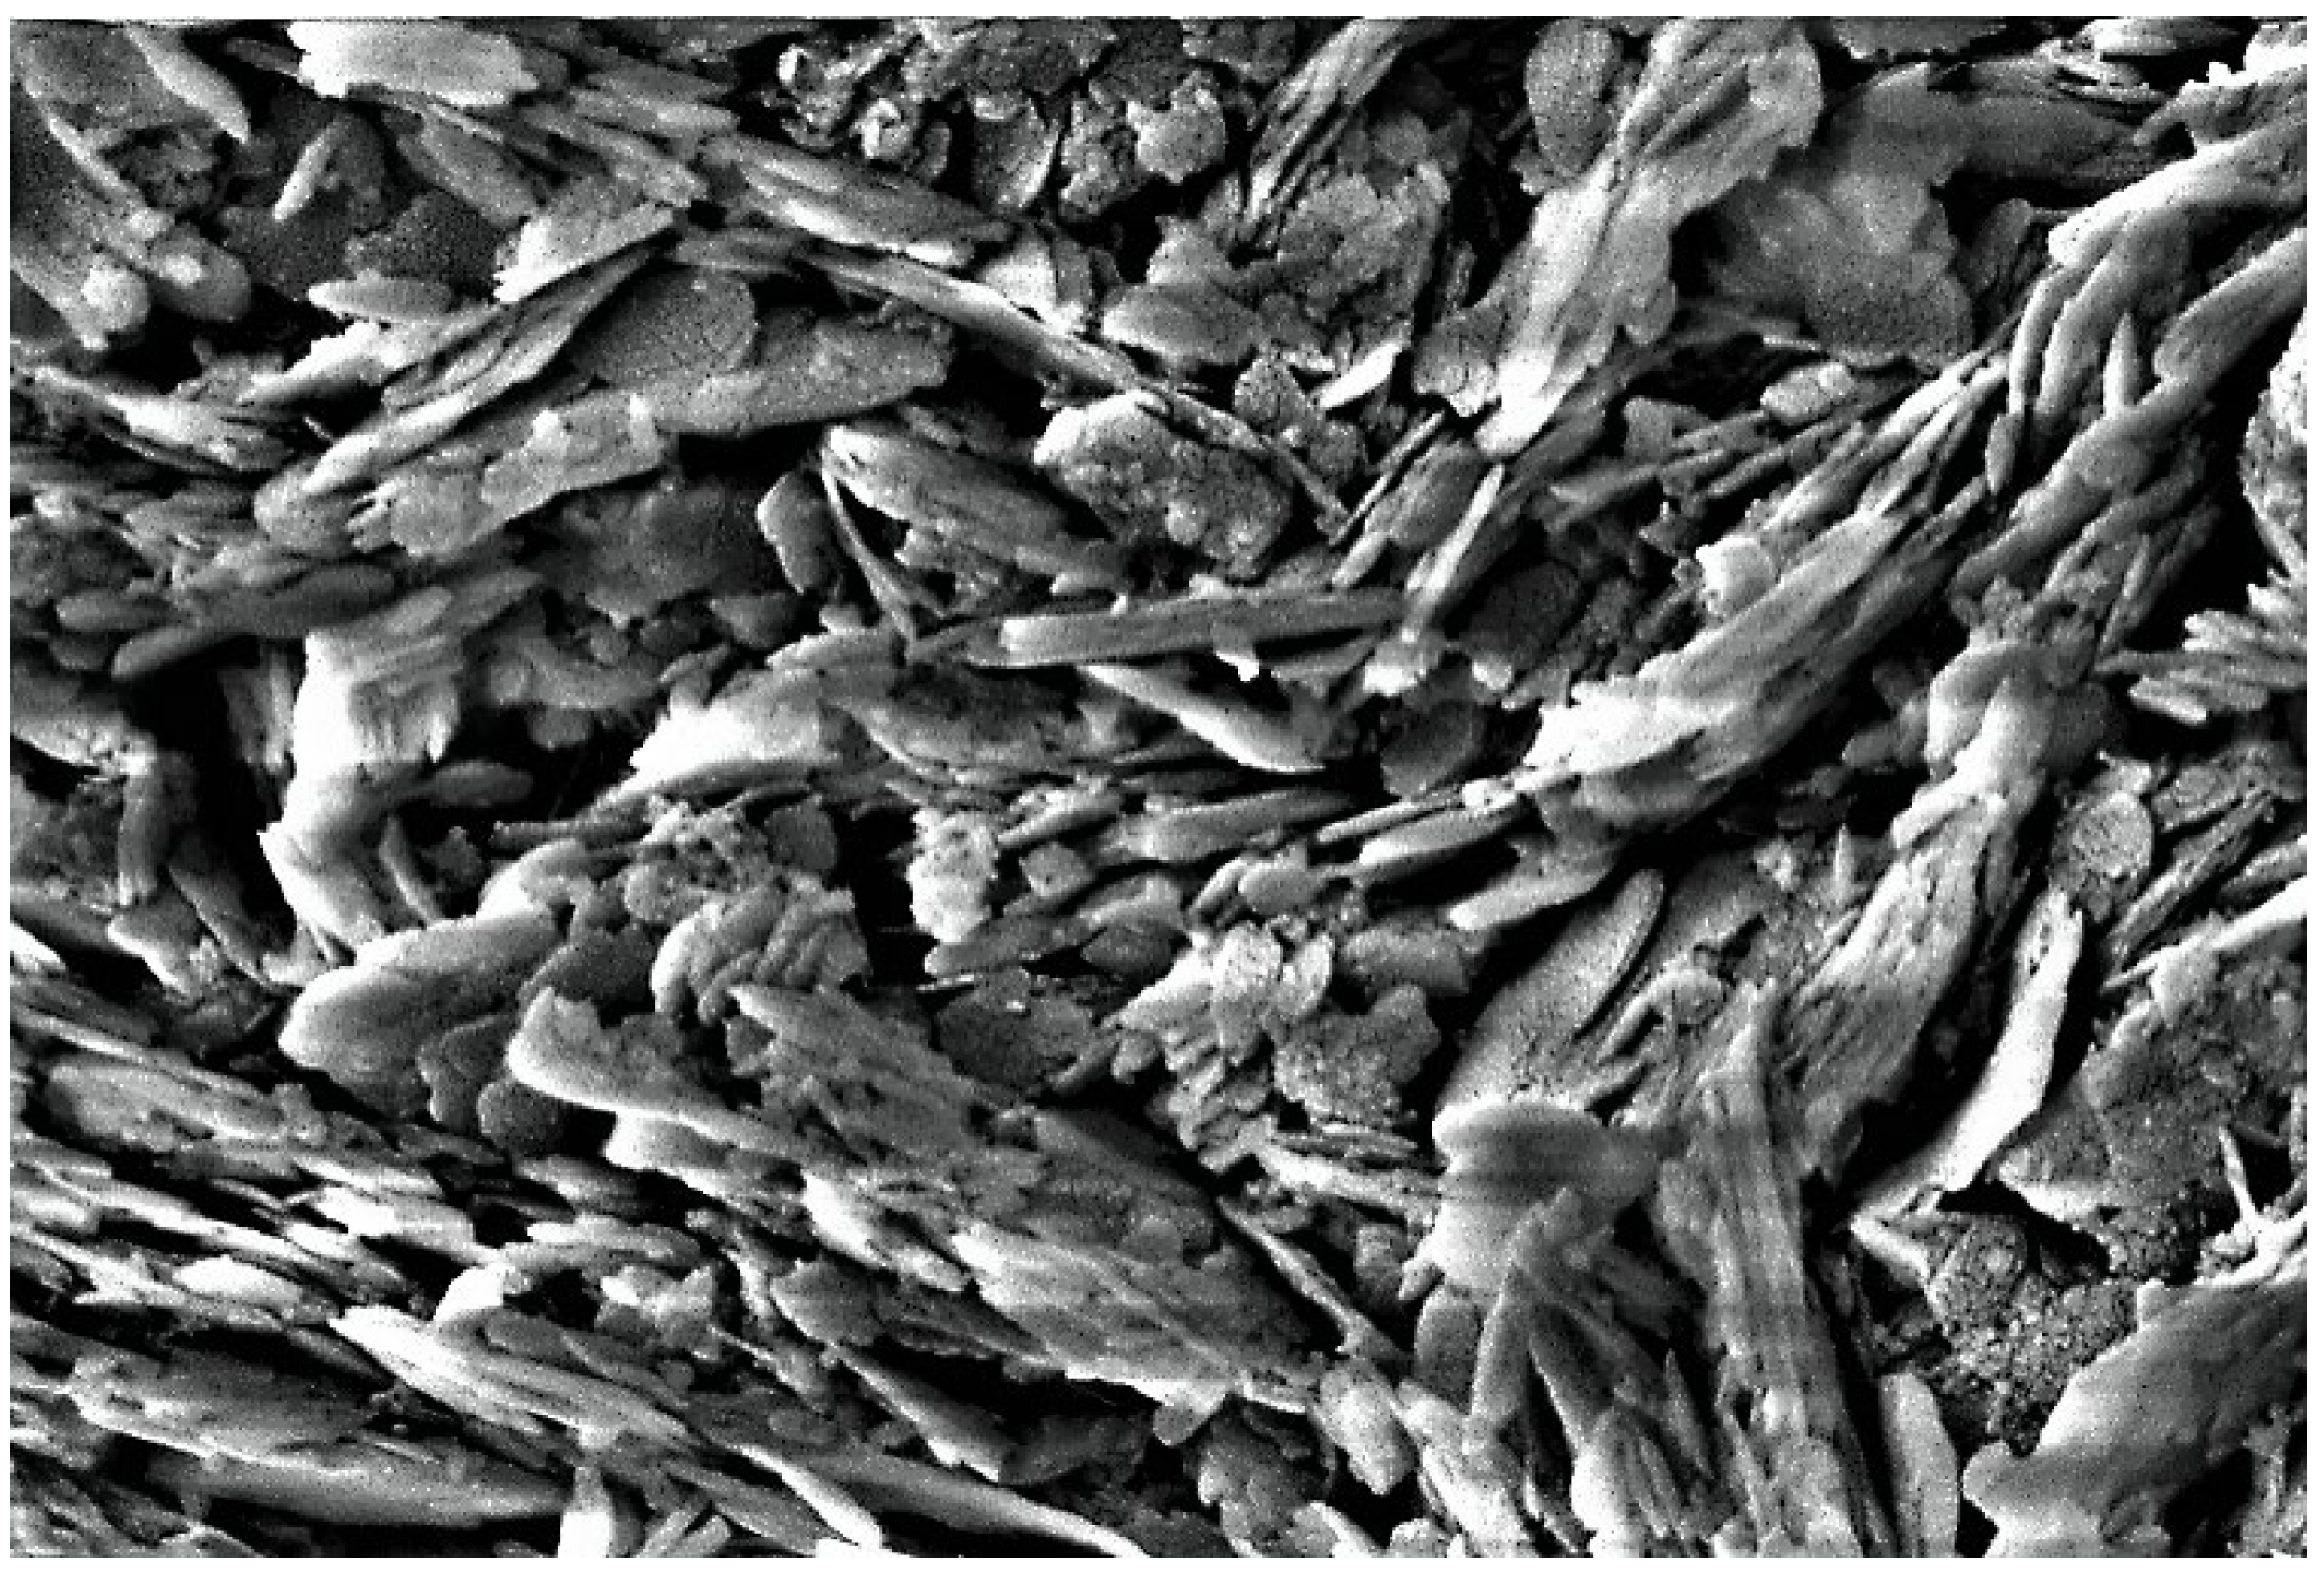
According to
Figure 18 and
Figure 19, there is no obvious difference in microstructure at different water contents, and the minerals are mainly stacked face to face. The microstructure of the samples disintegrated at different temperatures is also roughly the same, which shows that the temperature can only accelerate the reaction and has no effect on the mineral itself and its composition.


 ,
, 


