
Prediction of Compression Index from Secant Elastic Modulus and Peak Strength of High Plastic Clay Ameliorated by Agro-Synthetic Waste Fibers for Green Subgrade

 , and
, and
Abstract
:1. Introduction
- i.
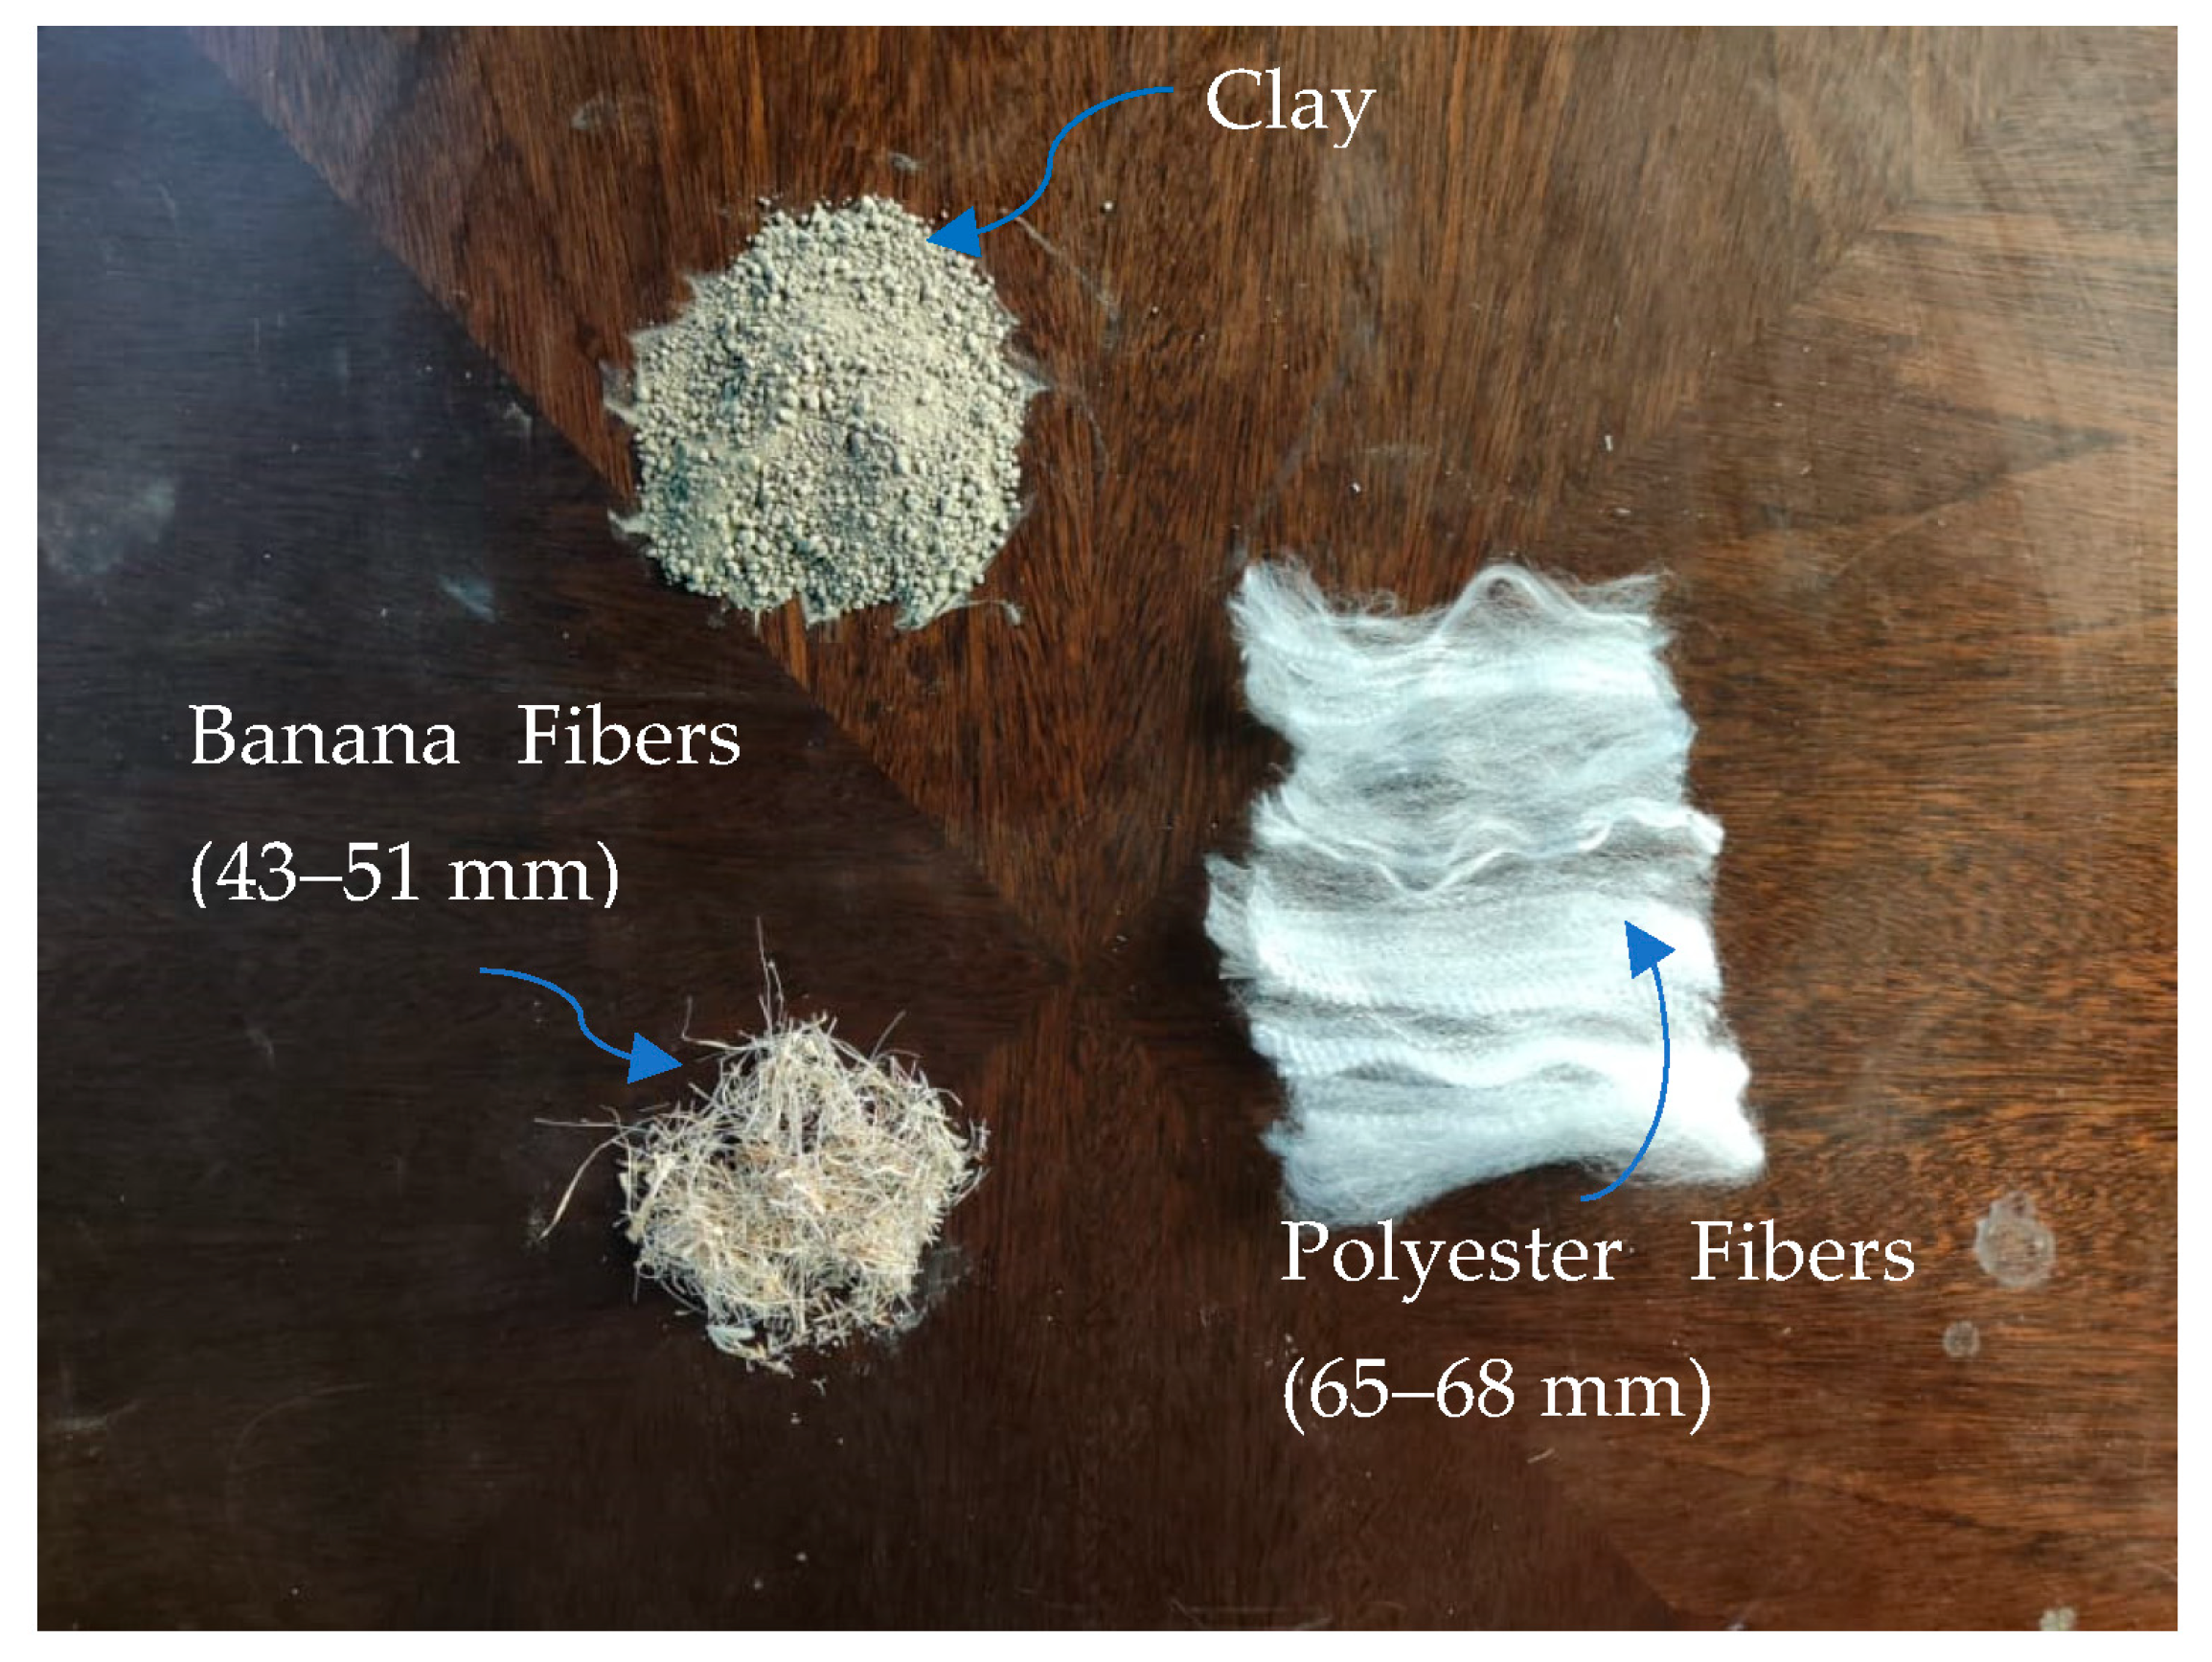
- Evaluation of optimal contents of polyester (P), banana (B), and polyester-banana (PB) combined fibers for amelioration of high plastic clay for enhancement of secant modulus (E50), peak strength (Sp), and CBR along with reduction in swell potential and compression index (Cc).
- ii.
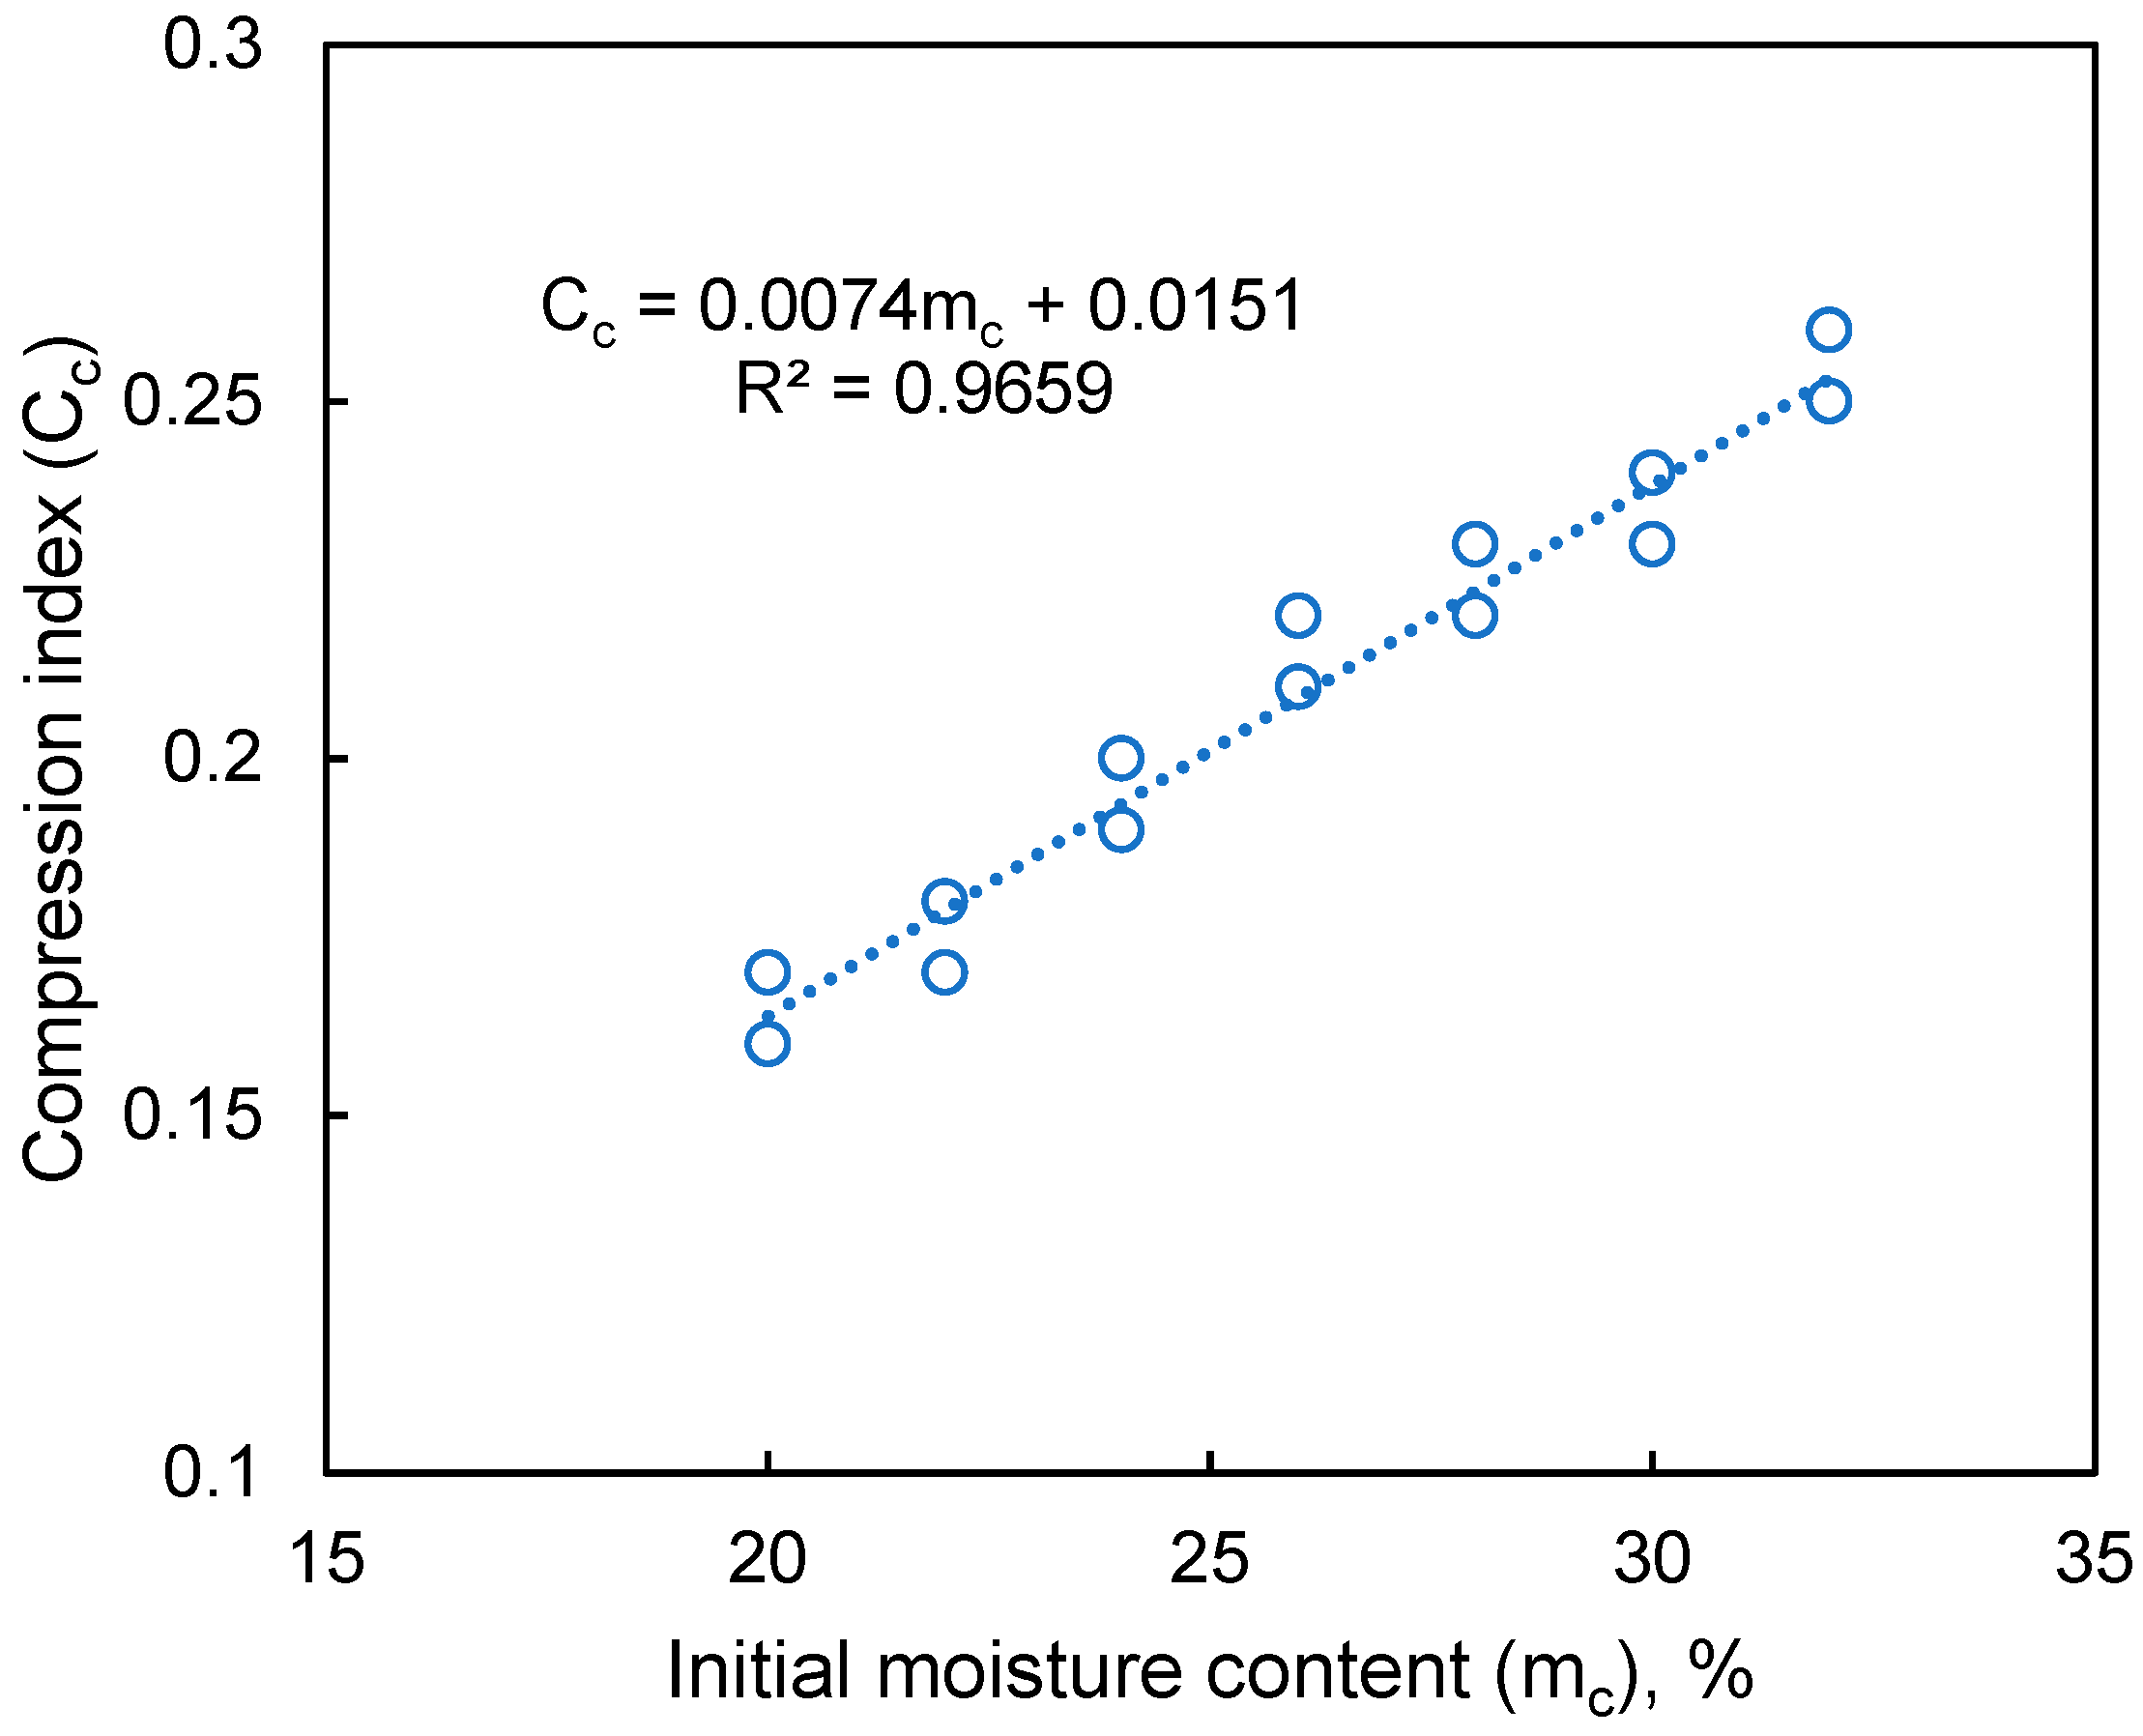
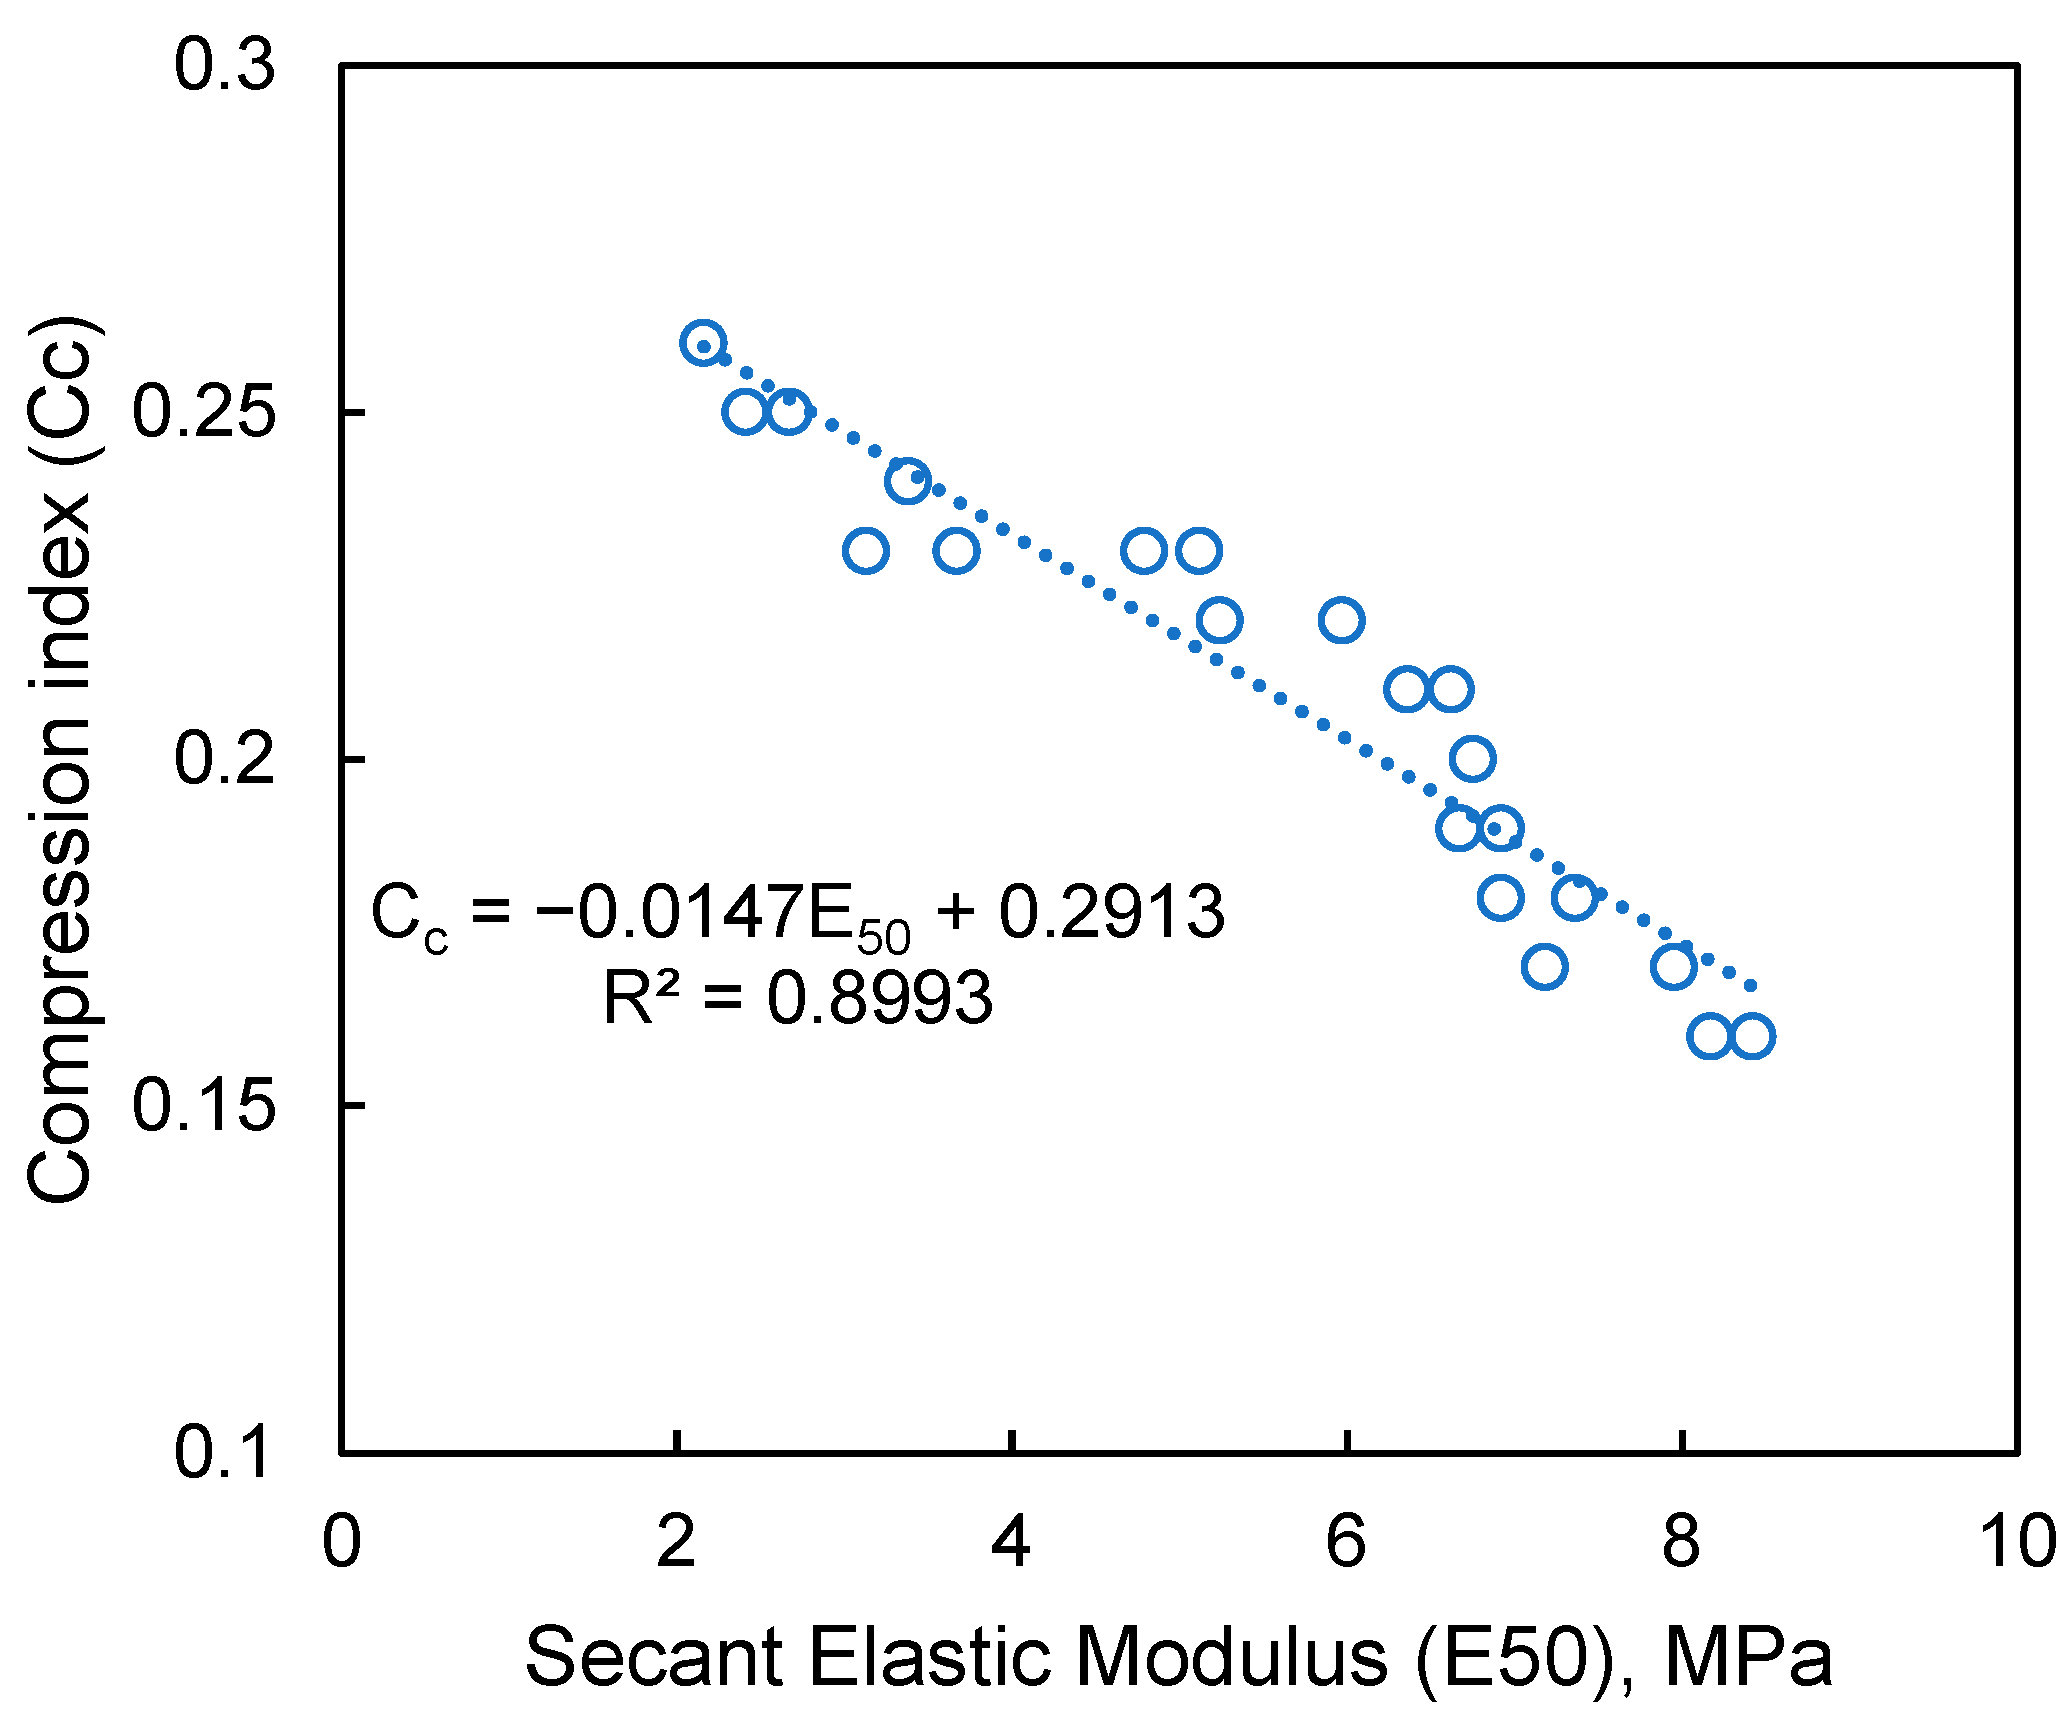
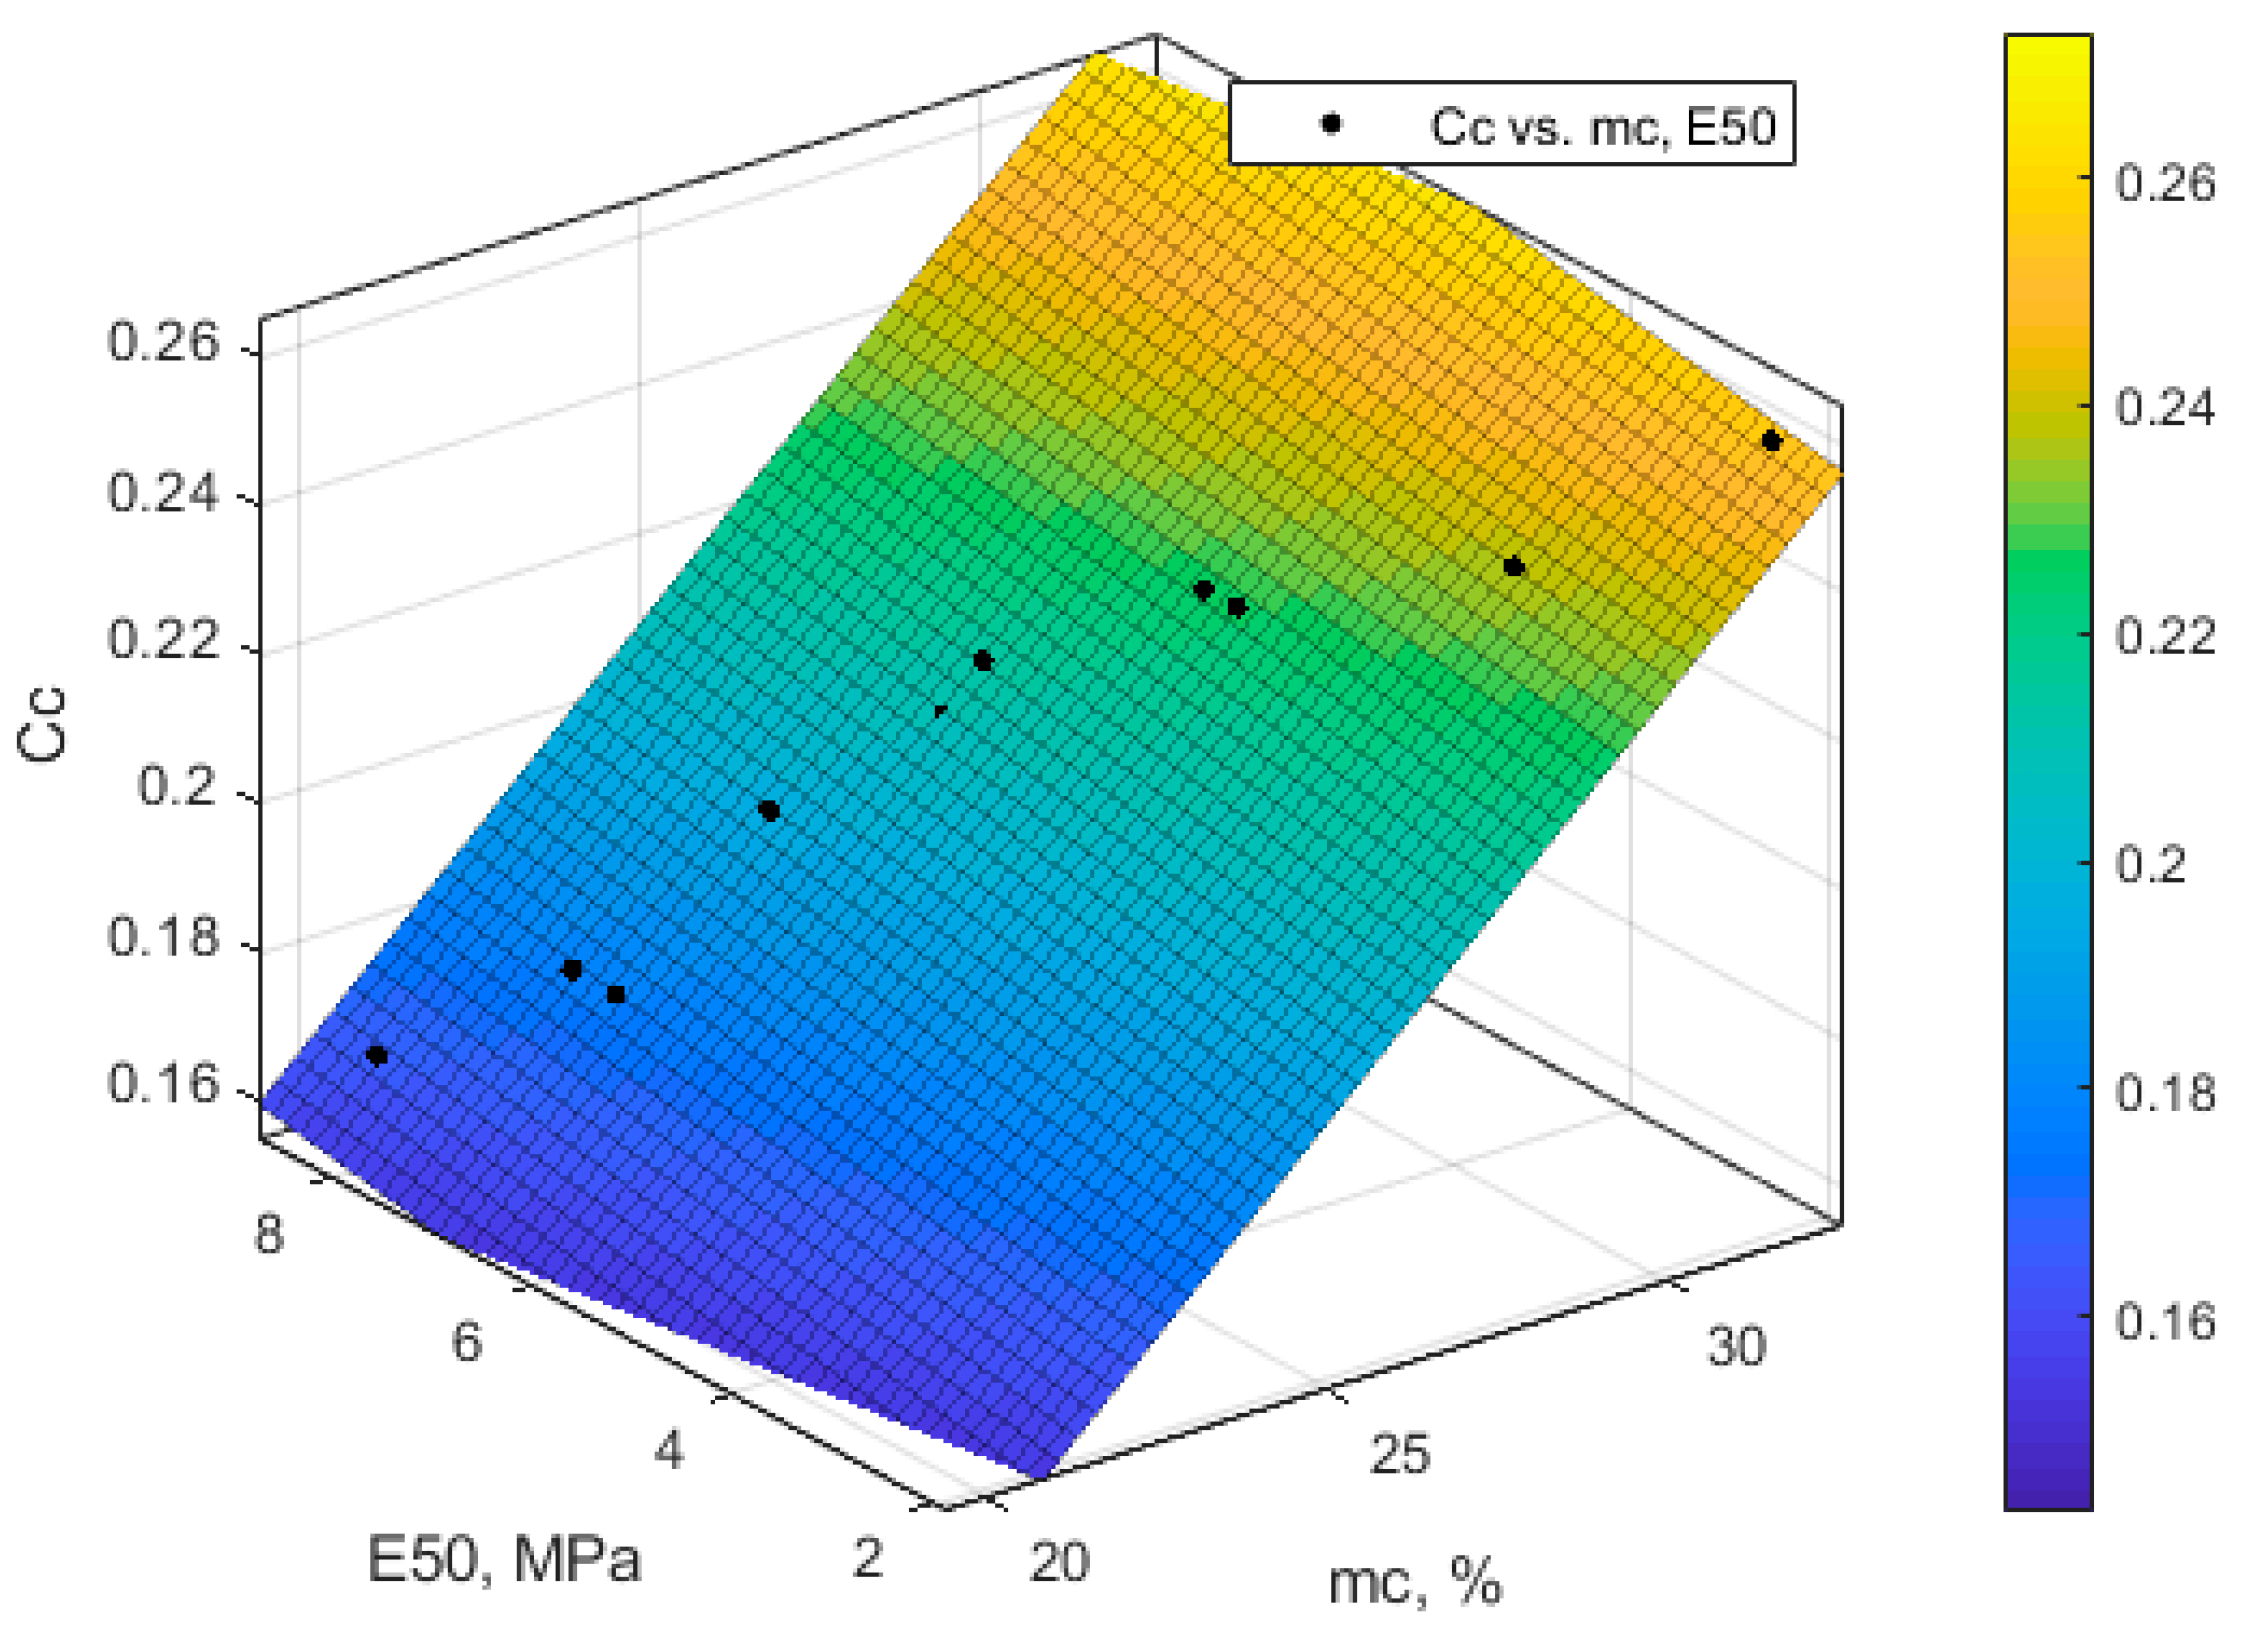
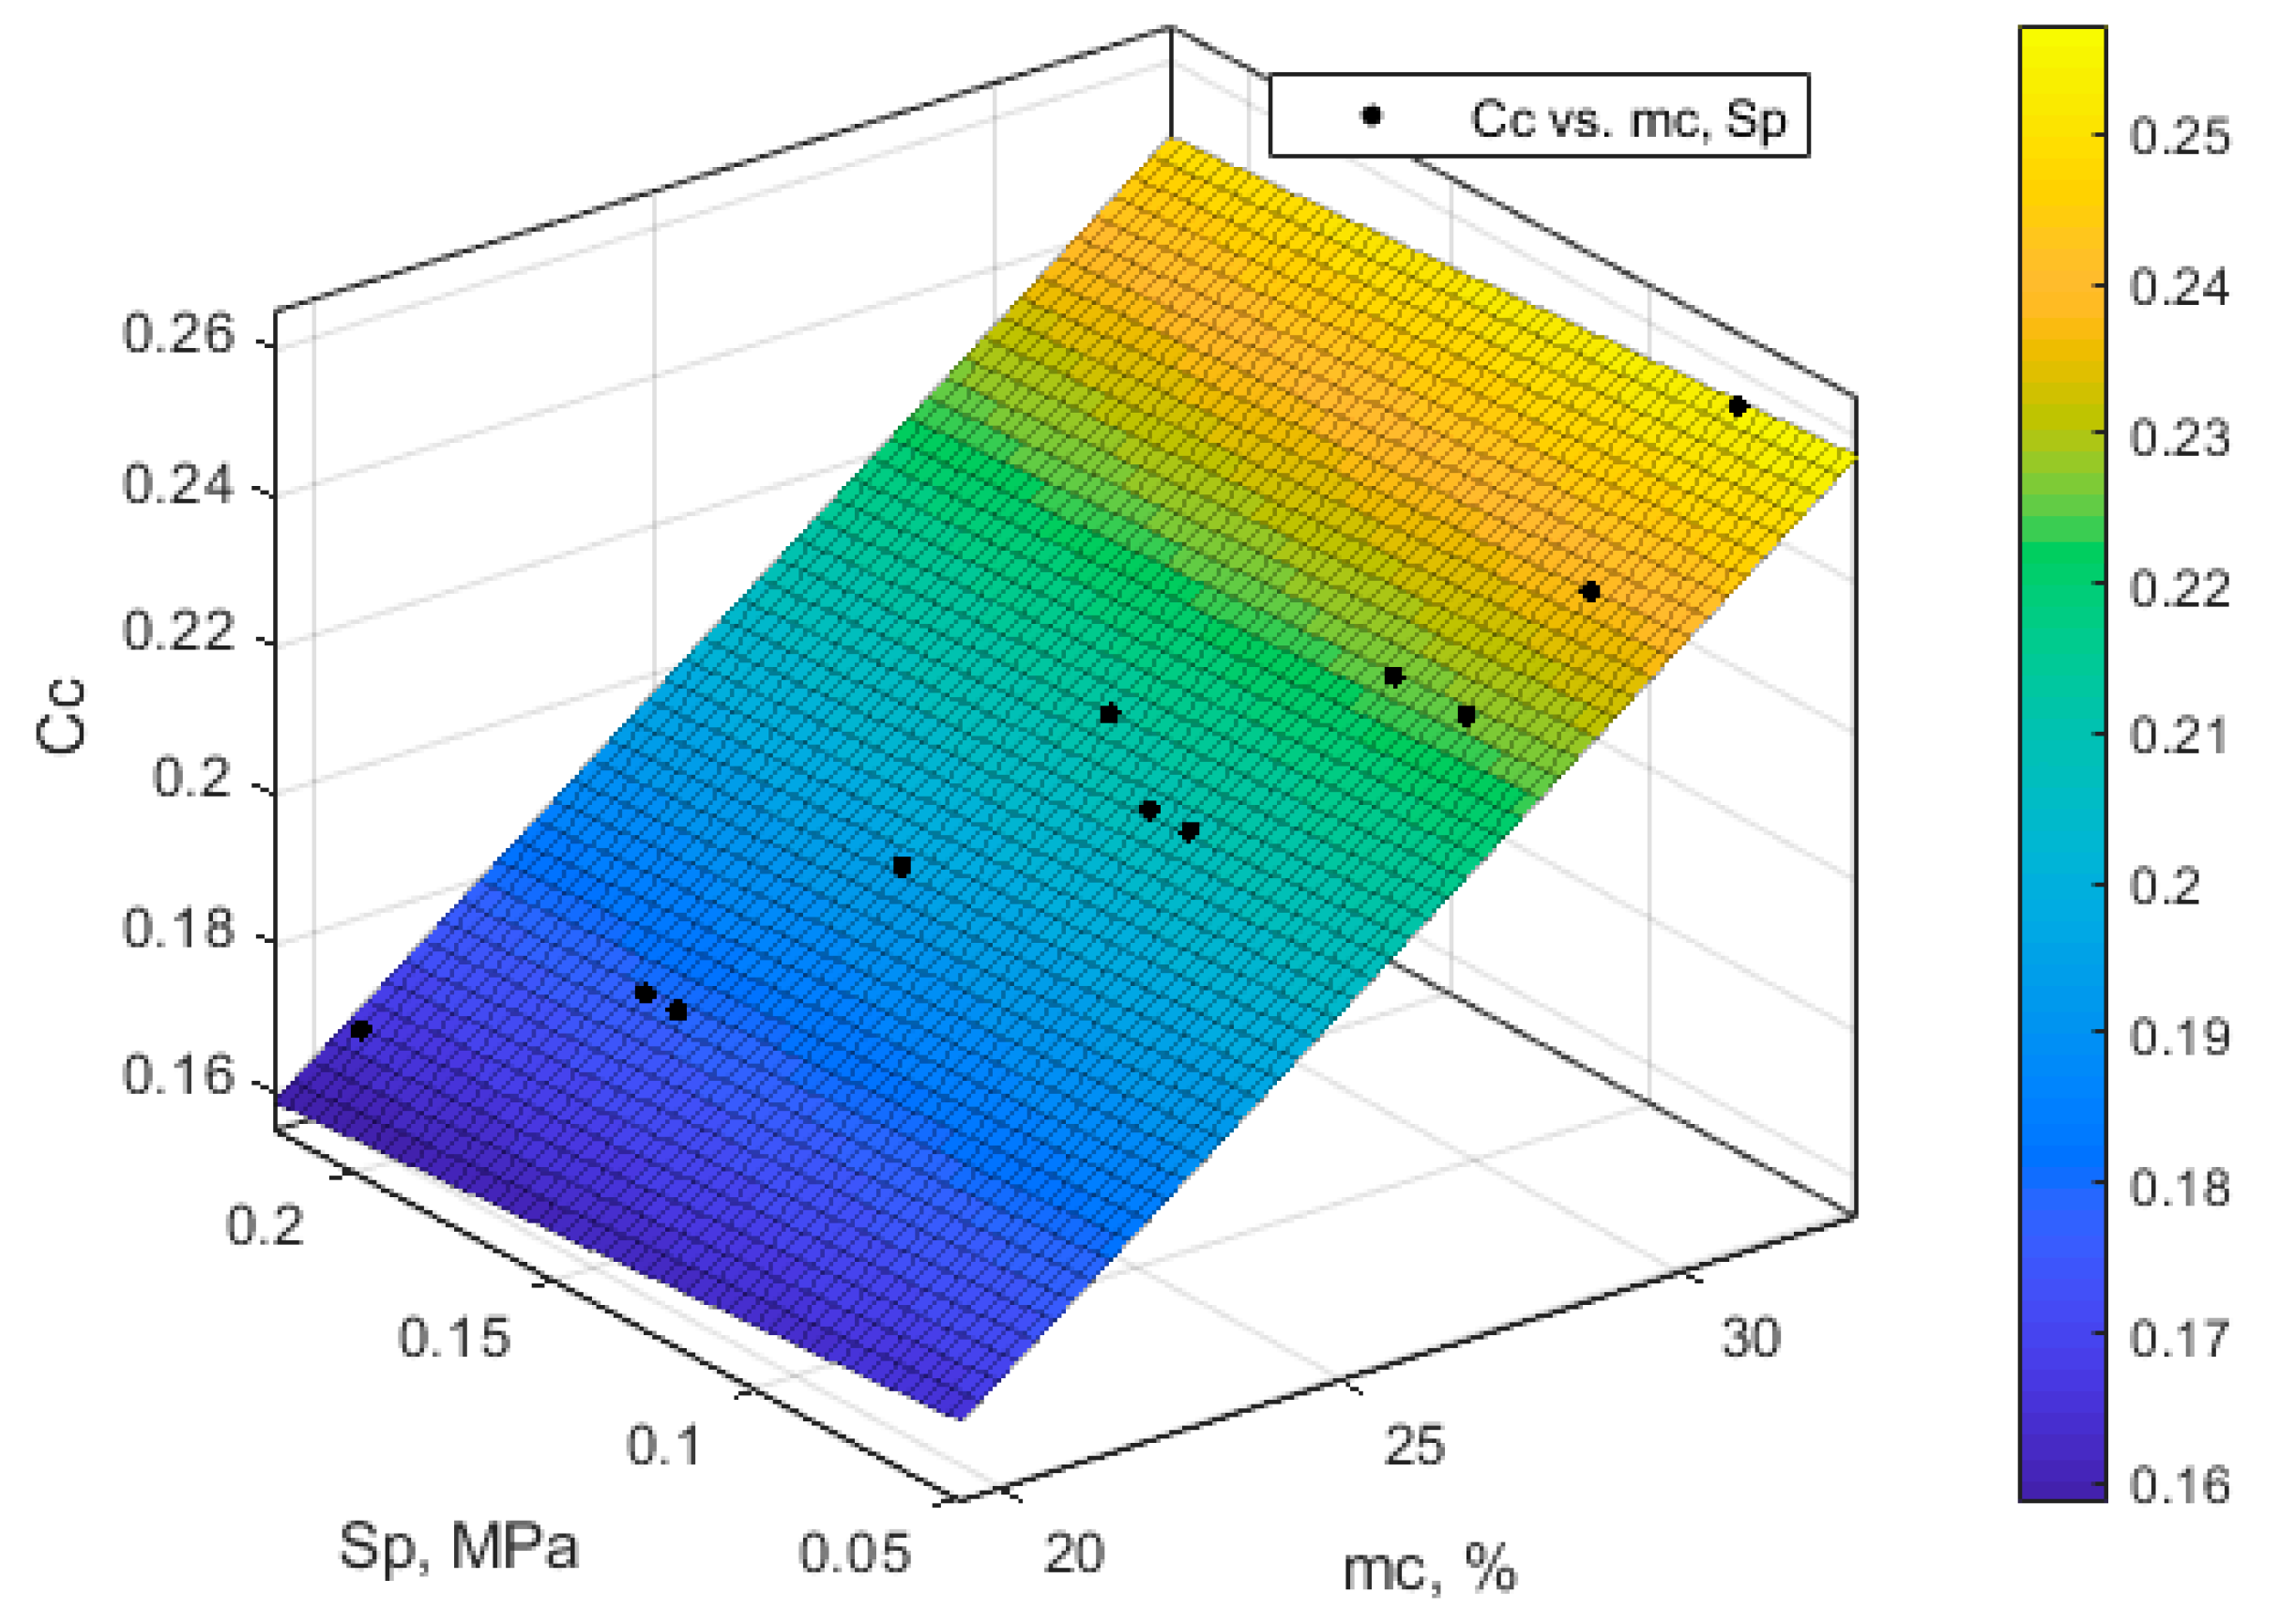
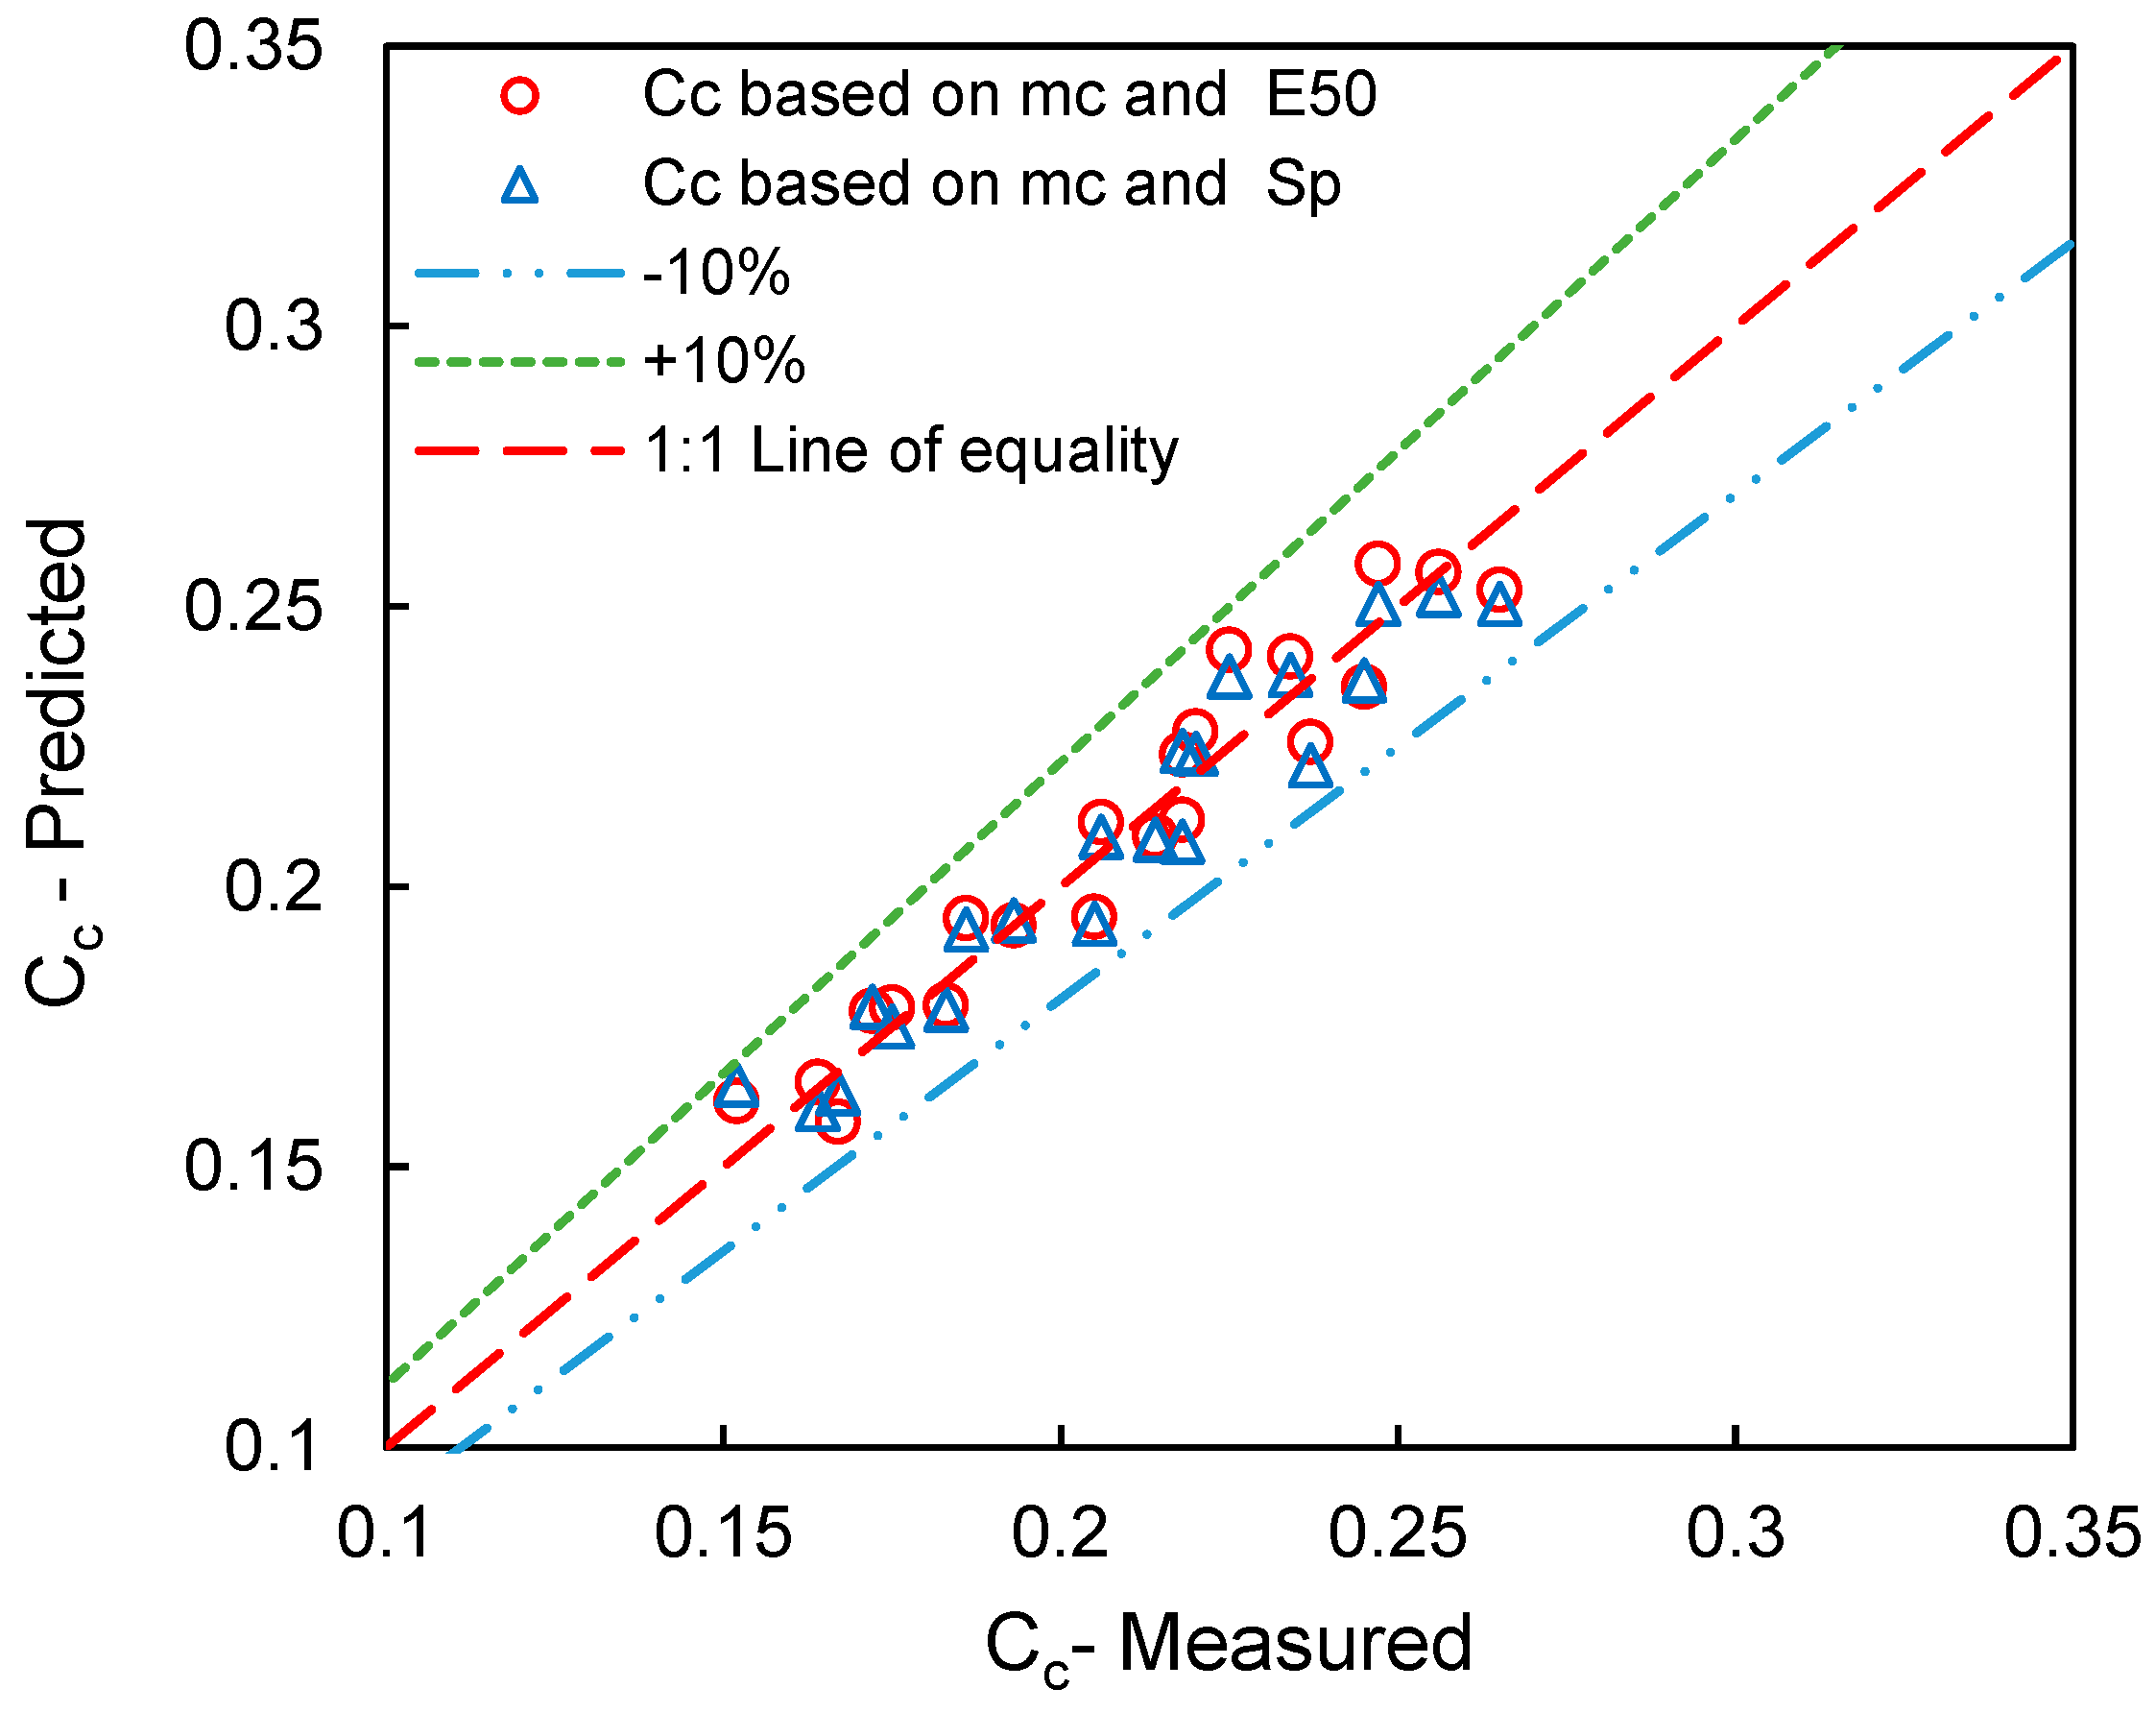
- Hydro-mechanical studies on the optimal clay-polyester-banana (CPB) mix in unsaturated and wet phases and the development of correlations of Cc versus mc, E50, and Sp.
- iii.
- Cost-benefit analysis and environmental impact of the CPB mix to achieve eco-economic green stabilization.
2. Materials and Methods
2.1. Classification Tests
2.2. Compaction and CBR Tests
2.3. Triaxial (CU) Test
2.4. Consolidation and Swell Potential Tests
2.5. Effect of Moisture on Clay-Fiber Mix
3. Results and Discussion
3.1. Classification Tests
3.2. Compaction and California Bearing Ratio Tests
3.3. Triaxial CU Test
3.4. Consolidation and Swell Potential
3.5. Composition of Clay
3.6. Prediction of Cc for CPB Mix
3.7. Cost-Benefit Analysis
3.8. Statistical Analysis
4. Conclusions
- (1)
- Results show that the optimal mix, i.e., 1.2% polyester (P) plus 0.9% banana (B) fibers in high plastic clay at OMC and ϒdmax, augmented the secant elastic modulus (E50), peak strength (Sp), and California bearing ratio (CBR) by 2.5, 2.43, and 2.7 times, respectively, whereas an increase in moisture content (mc) from 20% to 32% caused a considerable decrease in Sp from 212 kPa to 56 kPa and E50 from 8.42 MPa to 2.16 MPa.
- (2)
- It is observed that the swell potential and compression index (Cc) parameters of the optimal CPB mix are reduced by 48% and 42.8%, respectively. Enhancement in elastic-compressive characteristic ratio, i.e., E50/Cc for CP, CB, and CPB, is found to be 24.7, 17.6, and 53.7 MPa, respectively, as compared with 12.2 MPa of clay (C).
- (3)
- The data are validated by Analysis of Variance (ANOVA) and found to be in good health with no outliers, and correlations are developed for the optimal CPB mix for prediction of Cc from E50, Sp, and initial moisture content (mc) for the evaluation of the feasibility and performance of clay-fiber blends in wet seasons as follows:
Author Contributions
Funding
Institutional Review Board Statement
Informed Consent Statement
Data Availability Statement
Acknowledgments
Conflicts of Interest
References
- Khattak, M.J.; Alrashidi, M. Durability and mechanistic characteristics of fiber reinforced soil–cement mixtures. Int. J. Pavement Eng. 2006, 7, 53–62. [Google Scholar] [CrossRef]
- Mujtaba, H.; Khalid, U.; Farooq, K.; Elahi, M.; Rehman, Z.; Shahzad, H.M. Sustainable utilization of powdered glass to improve the mechanical behavior of fat clay. KSCE J. Civ. Eng. 2020, 24, 3628–3639. [Google Scholar] [CrossRef]
- Karimiazar, J.; Sharifi Teshnizi, E.; Mirzababaei, M.; Mahdad, M.; Arjmandzadeh, R. California bearing ratio of a reactive clay treated with nano-additives and cement. J. Mater. Civ. Eng. 2022, 34, 04021431. [Google Scholar] [CrossRef]
- Wang, Y.; Guo, P.; Li, X.; Lin, H.; Liu, Y.; Yuan, H. Behavior of fiber-reinforced and lime-stabilized clayey soil in triaxial tests. Appl. Sci. 2019, 9, 900. [Google Scholar] [CrossRef]
- Owino, A.O.; Hossain, Z. Correlation between one-dimensional consolidation coefficients and different basalt fiber lengths and RHA-cement contents in fiber-reinforced stabilized expansive soils. Soils Found. 2023, 63, 101351. [Google Scholar] [CrossRef]
- Karimiazar, J.; Mahdad, M.; Teshnizi, E.S.; Karimizad, N. Assessing the geotechnical properties of soils treated with cement and nano-silica additives. JOJ Sci. 2020, 2, 56–59. [Google Scholar]
- Saussaye, L.; Boutouil, M.; Baraud, F.; Leleyter, L. Infuence of sulfate and chloride ions on the geotechnical and microstructural properties of soils treated with hydraulic binders: Individual and coupling effects. Eng. Geol. 2015, 189, 98–103. [Google Scholar] [CrossRef]
- Lemos, S.G.F.P.; Almeida, M.D.S.S.; Consoli, N.C.; Nascimento, T.Z.; Polido, U.F. Field and Laboratory Investigation of Highly Organic Clay Stabilized with Portland Cement. J. Mater. Civ. Eng. 2020, 32, 04020063. [Google Scholar] [CrossRef]
- Nasiri, H.; Khayat, N.; Mirzababaei, M. Simple yet quick stabilization of clay using a waste by-product. Transp. Geotech. 2021, 28, 100531. [Google Scholar] [CrossRef]
- Galan-Marin, C.; Rivera-Gomez, C.; Petric-Gray, J. Effect of animal fibres reinforcement on stabilized earth mechanical properties. J. Biobased Mater. Bioenergy 2010, 4, 121–128. [Google Scholar] [CrossRef]
- Gu, K.; Chen, B. Research on the incorporation of untreated flue gas desulfurization gypsum into magnesium oxysulfate cement. J. Clean. Prod. 2020, 271, 122497. [Google Scholar] [CrossRef]
- Qamar, W.; Khan, A.H.; Rehman, Z.U.; Masoud, Z. Sustainable application of wool-banana bio-composite waste material in geotechnical engineering for enhancement of elastoplastic strain and resilience of subgrade expansive clays. Sustainability 2022, 14, 13215. [Google Scholar] [CrossRef]
- Medina-Martinez, C.J.; Sandoval-Herazo, L.C.; Zamora-Castro, S.A.; Vivar-Ocampo, R.; Reyes-Gonzalez, D. Natural Fibers: An Alternative for the Reinforcement of Expansive Soils. Sustainability 2022, 14, 9275. [Google Scholar] [CrossRef]
- Imran, M.A.; Nakashima, K.; Evelpidou, N.; Kawasaki, S. Durability Improvement of Biocemented Sand by Fiber-Reinforced MICP for Coastal Erosion Protection. Materials 2022, 15, 2389. [Google Scholar] [CrossRef]
- Bowles, J.E. Foundation Analysis and Design, 3rd ed.; Wiley-Interscience: Hoboken, NJ, USA, 1996. [Google Scholar]
- Bekkouche, S.R.; Benzerara, M.; Zada, U.; Muhammad, G.; Ali, Z. Use of eco-friendly materials in the stabilization of expansive soils. Buildings 2022, 12, 1770. [Google Scholar] [CrossRef]
- Owino, A.O.; Nahar, N.; Hossain, Z.; Tamaki, N. Dimensional influence of basalt fiber reinforcements on the consolidation behaviour of rice husk ash stabilized soils. Constr. Build. Mater. 2022, 339, 127686. [Google Scholar] [CrossRef]
- Marino, C.; Nucara, A.; Nucera, G.; Pietrafesa, M. Economic, energetic and environmental analysis of the waste management system of Reggio Calabria. Int. J. Heat Technol. 2017, 35, S108–S116. [Google Scholar] [CrossRef]
- Rahman, S.S.; Siddiqua, S.; Cherian, C. Sustainable applications of textile waste fiber in the construction and geotechnical industries: A retrospect. Clean. Eng. Technol. 2022, 6, 100420. [Google Scholar] [CrossRef]
- Furumoto, K.; Miki, H.; Tsuneoka, N.; Obata, T. Model test on the piping resistance of short fiber reinforced soil and its application to river levee. In Proceedings of the Geosynthetics—7th ICG, Nice, France, 22–27 September 2002. [Google Scholar]
- Tang, C.S.; Shi, B.; Cui, Y.J.; Liu, C.; Gu, K. Desiccation cracking behaviour of polypropylene fiber–reinforced clayey soil. Can. Geotech. J. 2012, 49, 1088–1101. [Google Scholar] [CrossRef]
- Mostafa, M.; Uddin, N. Experimental analysis of Compressed Earth Block (CEB) with banana fibers resisting flexural and compression forces. Case Stud. Constr. Mater. 2016, 5, 53–63. [Google Scholar] [CrossRef]
- Jahanzeb, S.; Siddique, S.H.; Hussain, D. Porosity and Fiber Orientation of Banana Fiber Nonwoven Webs Using Image Analysis Technique. J. Nat. Fibers 2021, 19, 6056–6073. [Google Scholar] [CrossRef]
- Bekraoui, N.; El Qoubaa, Z.; Chouiyakh, H.; Faqir, M.; Essadiqi, E. Banana Fiber Extraction and Surface Characterization of Hybrid Banana Reinforced Composite. J. Nat. Fibers 2022, 19, 12982–12995. [Google Scholar] [CrossRef]
- ASTM D4767-20; Standard Test Method for Consolidated Undrained Triaxial Compression Test for Cohesive Soils. Annual Book of ASTM Standards. American Society for Testing and Materials: West Conshohocken, PA, USA, 2020; Volume 4.
- Hong, Z.S.; Bian, X.; Cui, Y.J.; Gao, Y.F.; Zeng, L.L. Effect of initial water content on undrained shear behaviour of reconstituted clays. Geotechnique 2013, 63, 441–450. [Google Scholar] [CrossRef]
- Cerato, A.B.; Lutenegger, A.J. Determining intrinsic compressibility of fine-grained soils. J. Geotech. Geoenvironmental Eng. 2004, 130, 872–877. [Google Scholar] [CrossRef]
- Ng, C.W.W.; Xu, J.; Yung, S.Y. Effects of imbibition-drainage and stress ratio on anisotropic stiffness of an unsaturated soil at very small strains. Can. Geotech. J. 2009, 46, 1062–1076. [Google Scholar] [CrossRef]
- Wang, Y.; Wang, W.; Zhao, Y.; Li, N.; Luo, J.; Belete, A.M.; Ping, J. Modification Effect of Nano-Clay on Mechanical Behavior of Composite Geomaterials: Cement, Nano-Silica and Coastal Soft Soil. Materials 2022, 15, 8735. [Google Scholar] [CrossRef]
- Taha, M.M.; Feng, C.P.; Ahmed, S.H. Modification of mechanical properties of expansive soil from North China by using rice husk ash. Materials 2021, 14, 2789. [Google Scholar] [CrossRef]
- Munawar, M.; Khan, A.H.; Rehman, Z.U.; Rahim, A.; Aziz, M.; Almuaythir, S.; El Kheir, B.S.; Haider, F. Micro to Nanolevel Stabilization of Expansive Clay Using Agro-Wastes. Adv. Civ. Eng. 2023, 2023, 2753641. [Google Scholar] [CrossRef]
- Ghiyasiyan-Arani, M.; Salavati-Niasari, M. Comparative study on electrochemical hydrogen storage of nanocomposites based on S or N doped graphene quantum dots and nanostructured titanium niobate. J. Alloys Compd. 2022, 899, 163379. [Google Scholar] [CrossRef]
- Gholamrezaei, S.; Ghiyasiyan-Arani, M.; Salavati-Niasari, M.; Moayedi, H. Multidisciplinary methods (co-precipitation, ultrasonic, microwave, reflux and hydrothermal) for synthesis and characterization of CaMn3O6 nanostructures and its photocatalytic water splitting performance. Int. J. Hydrogen Energy 2019, 44, 26373–26386. [Google Scholar] [CrossRef]
- Razavi, F.S.; Sobhani, A.; Amiri, O.; Ghiyasiyan-Arani, M.; Salavati-Niasari, M. Green sol-gel auto-combustion synthesis, characterization and investigation of the electrochemical hydrogen storage properties of barium cobalt oxide nanocomposites with maltose. Int. J. Hydrogen Energy 2020, 45, 17662–17670. [Google Scholar] [CrossRef]
- Ghiyasiyan-Arani, M.; Salavati-Niasari, M. Synergic and coupling effect between SnO 2 nanoparticles and hierarchical AlV 3 O 9 microspheres toward emerging electrode materials for lithium-ion battery devices. Inorg. Chem. Front. 2021, 8, 2735–2748. [Google Scholar] [CrossRef]
- Burland, J.B. On the compressibility and shear strength of natural clays. Géotechnique 1990, 40, 329–378. [Google Scholar] [CrossRef]
- Park, H.I.; Lee, S.R. Evaluation of the compression index of soils using an artificial neural network. Comput. Geotech. 2011, 38, 472–481. [Google Scholar] [CrossRef]
- Mamunur-Rashid, M.; Samad, S.A.; Gafur, M.A.; Qadir, R.; Chowdhury, A.M. Effect of reinforcement of hydrophobic grade banana (musa ornata) bark fiber on the physicomechanical properties of isotactic polypropylene. Int. J. Polym. Sci. 2016, 2016, 9017956. [Google Scholar] [CrossRef]
- Motaleb, K.Z.M.; Mizan, R.A.; Milasius, R. Development and characterization of eco-sustainable banana fiber nonwoven material: Surface treatment, water absorbency and mechanical properties. Cellulose 2020, 27, 7889–7900. [Google Scholar] [CrossRef]
- Paul, S.A.; Boudenne, A.; Ibos, L.; Candau, Y.; Joseph, K.; Thomas, S. Effect of fiber loading and chemical treatments on thermophysical properties of banana fiber/polypropylene commingled composite materials. Compos. Part A Appl. Sci. Manuf. 2008, 39, 1582–1588. [Google Scholar] [CrossRef]
- Benitez, A.N.; Monzon, M.D.; Angulo, I.; Ortega, Z.; Hernandez, P.M.; Marrero, M.D. Treatment of banana fiber for use in the reinforcement of polymeric matrices. Measurement 2013, 46, 1065–1073. [Google Scholar] [CrossRef]
- Wang, B.; Panigrahi, S.; Tabil, L.; Crerar, W.; Sokansanj, S.; Braun, L. Modification of flax fibers by chemical treatment. In Proceedings of the CSAE/SCGR Meeting, Montreal, QC, Canada, 6–9 July 2003; pp. 3–337. [Google Scholar]
- ASTM D2487-11; Standard Practice for Classification of Soils for Engineering Purposes (Unified Soil Classification System), Annual Book of ASTM Standards. American Society for Testing and Materials: West Conshohocken, PA, USA, 2011; Volume 4.
- ASTM D1557-12; Standard Test Methods for Laboratory Compaction Characteristics of Soil Using Modified Effort, Annual Book of ASTM Standards. American Society for Testing and Materials: West Conshohocken, PA, USA, 2012; Volume 4.
- ASTM D4318-10; Standard Test Methods for Liquid Limit, Plastic Limit, and Plasticity Index of Soils, Annual Book of ASTM Standards. American Society for Testing and Materials: West Conshohocken, PA, USA, 2010; Volume 4.
- ASTM D854-14; Standard Test Methods for Specific Gravity of Soil Solids by Water Pycnometer. Annual Book of ASTM Standards. American Society for Testing and Materials: West Conshohocken, PA, USA, 2014; Volume 4.
- Hong, Z.S.; Yin, J.; Cui, Y.J. Compression behaviour of reconstituted soils at high initial water contents. Geotechnique 2010, 60, 691–700. [Google Scholar] [CrossRef]
- Yetimoglu, T.; Salbas, O. A study on shear strength of sands reinforced with randomly distributed discrete fibers. J. Geotext. Geomembr. 2003, 21, 103–110. [Google Scholar] [CrossRef]
- Ferreira da Costa, L.; Lucena, L.C.; Lucena, A.E.; Grangeiro de Barros, A. Use of Banana fibers in SMA mixtures. J. Mater. Civ. Eng. 2020, 32, 04019341. [Google Scholar] [CrossRef]
- ASTM D6913-2009; Standard Test Methods for Particle-Size Distribution (Gradation) of Soil Using Sieve Analysis, Annual Book of ASTM Standards. American Society for Testing and Materials: West Conshohocken, PA, USA, 2009; Volume 4.
- ASTM D7928-21; Standard Test Methods for Particle-Size Distribution (Gradation) of Fine-Grained Soils Using the Sedimentation (Hydrometer) Analysis, Annual Book of ASTM Standards. American Society for Testing and Materials: West Conshohocken, PA, USA, 2021; Volume 4.
- ASTM D7263-21; Standard Test Method for Laboratory Determination of Density and Unit Weight of Soil Specimens. Annual Book of ASTM Standards. American Society for Testing and Materials: West Conshohocken, PA, USA, 2016; Volume 4.
- ASTM D2216-19; Test Methods for Laboratory Determination of Water (Moisture) Content of Soil and Rock by Mass. Annual Book of ASTM Standards. American Society for Testing and Materials: West Conshohocken, PA, USA, 2019; Volume 4.
- ASTM D1883-16; Standard Test Method for California Bearing Ratio (CBR) of Laboratory-Compacted Soils, Annual Book of ASTM Standards. American Society for Testing and Materials: West Conshohocken, PA, USA, 2016; Volume 4.
- Yang, S.R.; Huang, W.H.; Tai, Y.T. Variation of resilient modulus with soil suction for compacted subgrade soils. Transp. Res. Rec. 2005, 1913, 99–106. [Google Scholar] [CrossRef]
- ASTM D2435-04; Standard Test Methods for One-Dimensional Consolidation Properties of Soils Using Incremental Loading. Annual Book of ASTM Standards. American Society for Testing and Materials: West Conshohocken, PA, USA, 2004; Volume 4.
- ASTM D4546-03; Standard Test Methods for One-Dimensional Swell or Settlement Potential of Cohesive Soils. Annual Book of ASTM Standards. American Society for Testing and Materials: West Conshohocken, PA, USA, 2003; Volume 4.
- Ashiq, S.Z.; Akbar, A.; Farooq, K.; Kazmi, S.M.S.; Munir, M.J. Suitability assessment of marble, glass powders and poly-propylene fibers for improvement of Siwalik clay. Sustainability 2022, 14, 2314. [Google Scholar] [CrossRef]


| Property/Constituent | Value |
|---|---|
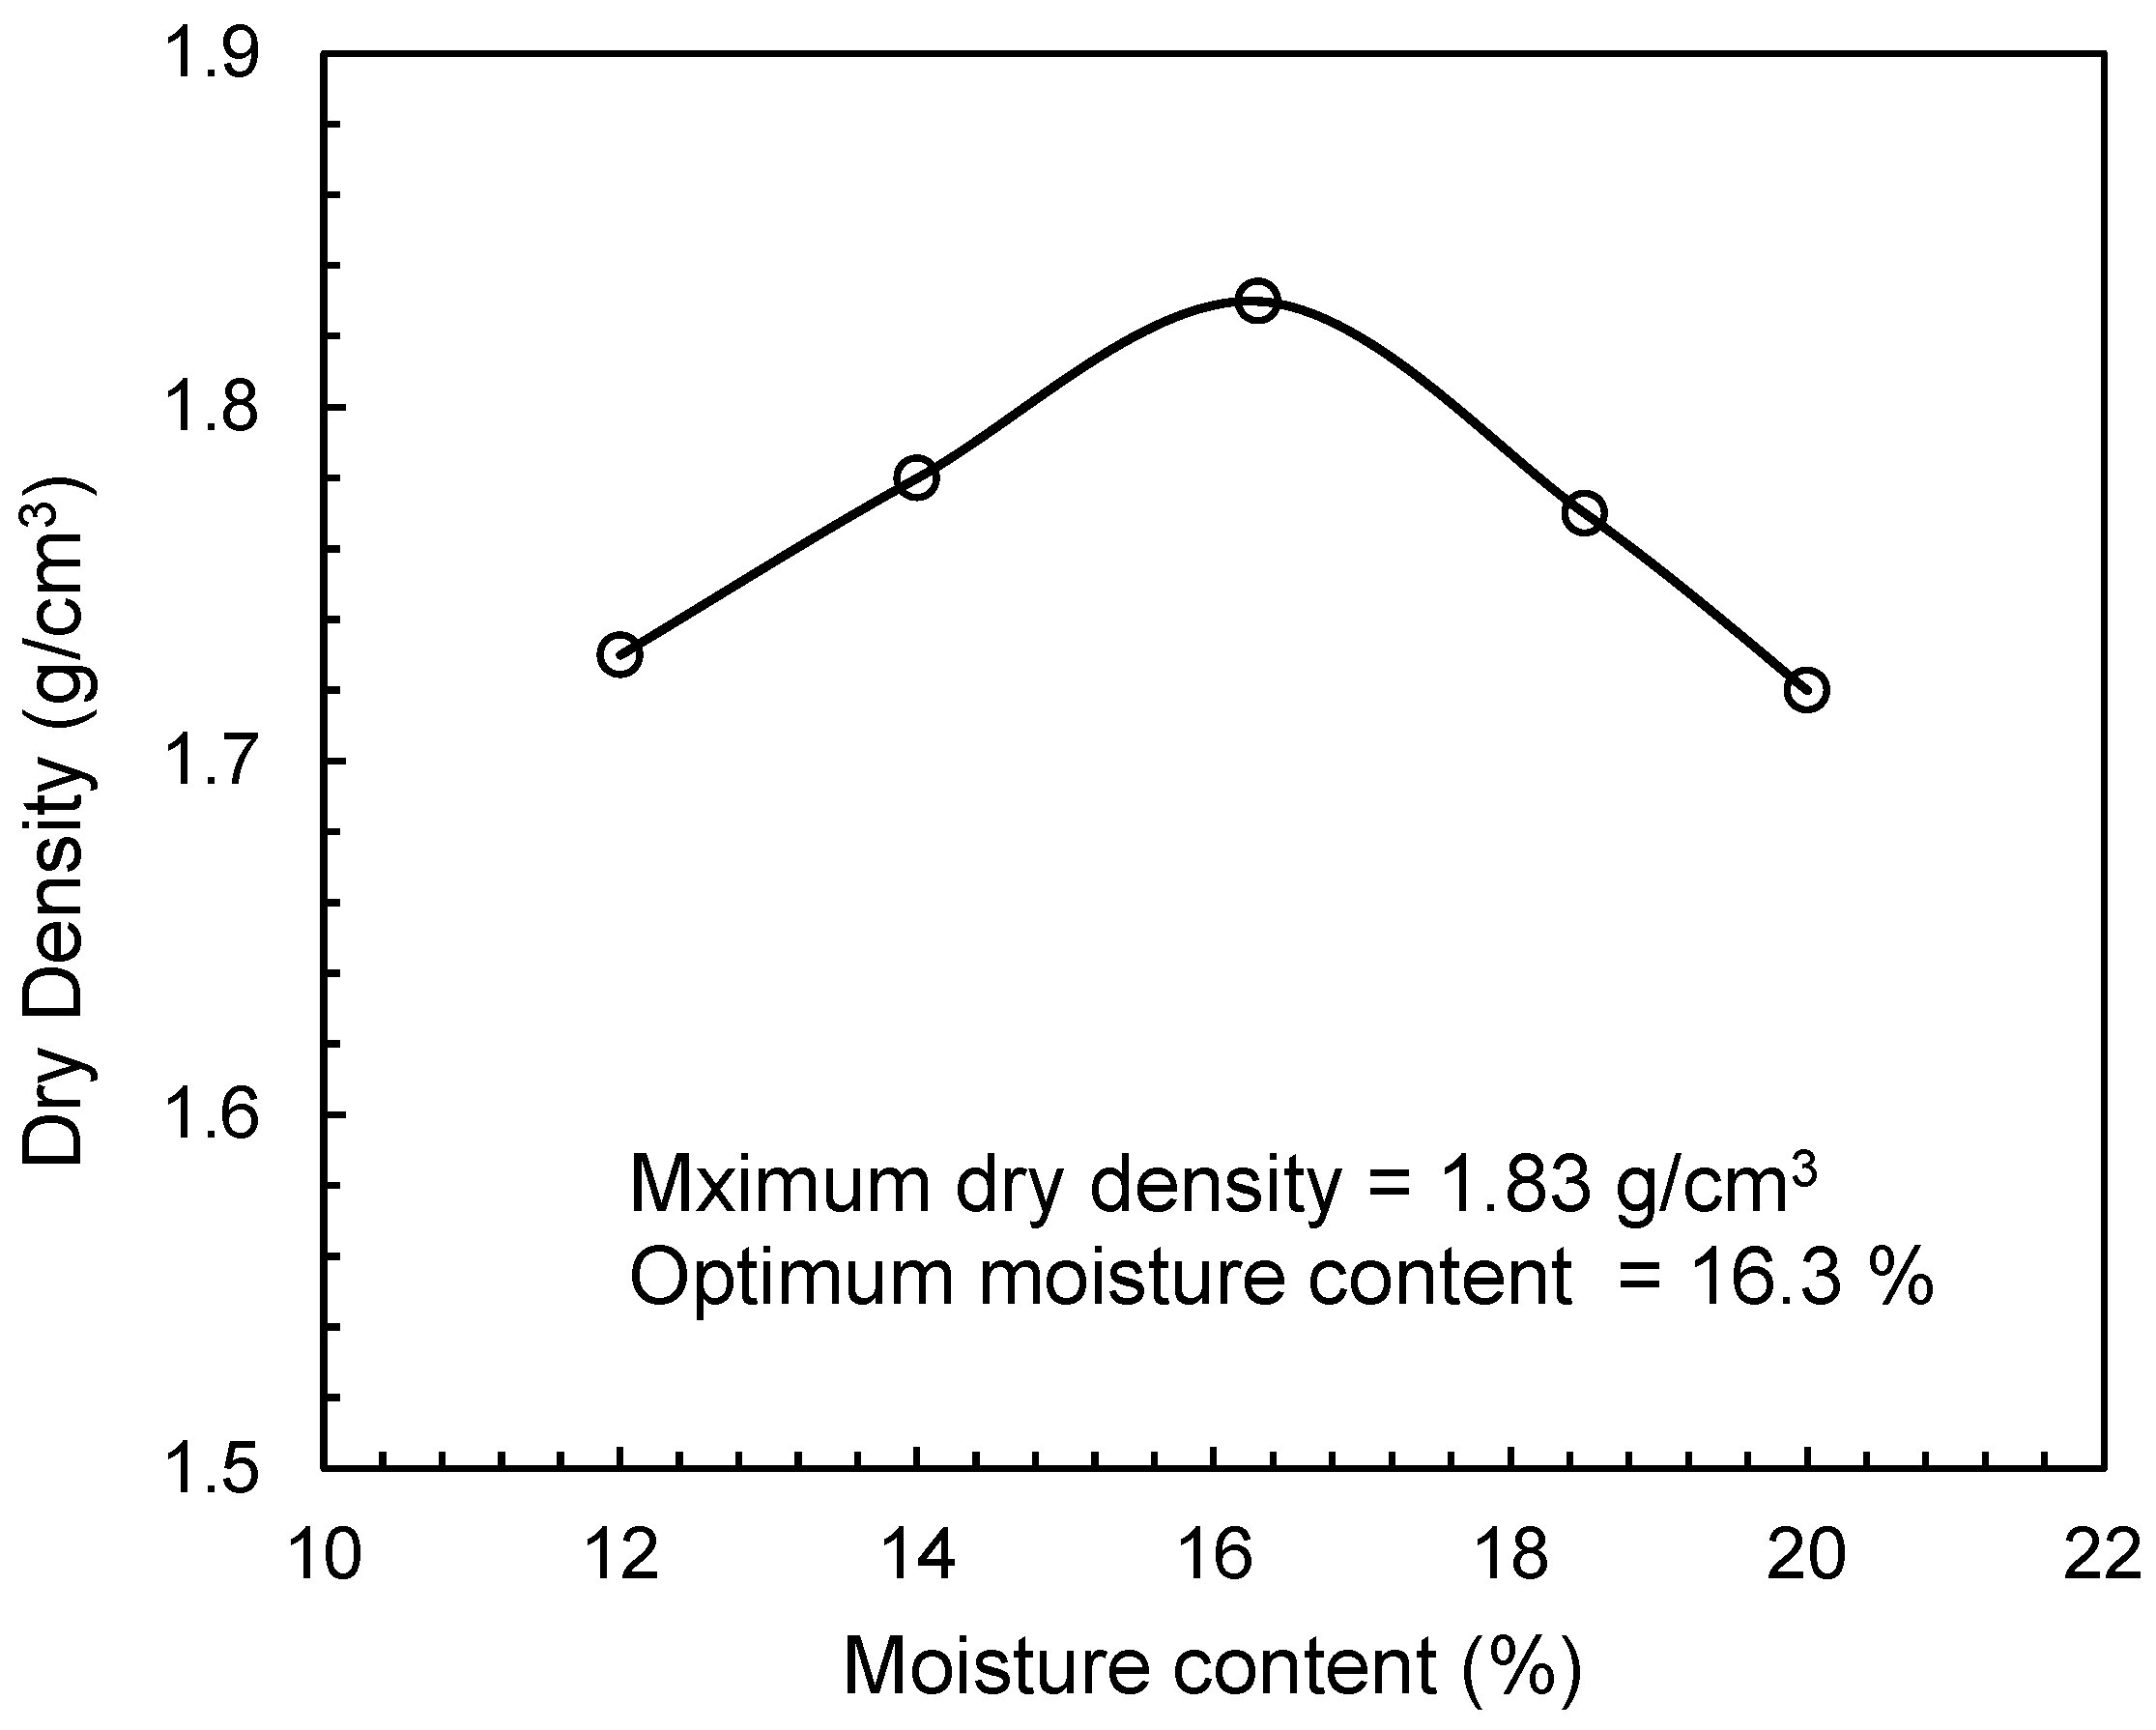
| Maximum dry density (g/cm3) [44] | 1.83 |
| Optimum moisture content (%) [44] | 16.3 |
| Plasticity index (%) [45] | 34 |
| Specific gravity (Gs) [46] | 2.70 |
| Clay (%) | 64 |
| Silt (%) | 34 |
| Sand (%) | 2 |
| Property | Value |
|---|---|
| Luster | Bright |
| Melting point | 277 °C |
| Ultimate tensile strength (103 N/mm2) | 0.35–0.76 |
| Density (g/cm3) | 1.41 |
| Ultimate strain (%) | 6.5–7.1 |
| Specific gravity | 1.29 |
| Length (mm) | 65–68 |
| Colour | white/brown |
| Moisture (%) | 11–13 |
| Elasticity (breaking extension), % | 39.1 |
| Strength (Tenacity), Dry | 4.5 gm/den |
| Strength (Tenacity), Wet | 0.69 × (dry strength) |
| Constituent/Property | Value |
|---|---|
| Diameter (mm) | 0.138–0.289 |
| Natural moisture content (%) | 62 |
| Elongation at break (%) | 1.65–3.48 |
| Cellulose content (%) | 73 |
| Density (g/cm3) | 1.12 |
| Length (mm) | 43–51 |
| Ultimate strain (%) | 3.4–4.8 |
| Specific gravity | 1.14 |
| Colour | Brown |
| Sr No. | Clay/Fiber Mixtures | Triaxial (Consolidated Undrained) | Compression Index (Cc) | E50/Cc (MPa) | Soaked CBR (%) | ||
|---|---|---|---|---|---|---|---|
| E50 (MPa) | Sp (MPa) | E50/Sp | |||||
| 1 | Clay (C) | 3.44 | 0.108 | 31.85 | 0.28 | 12.29 | 3.1 |
| 2 | C + 0.4% P | 3.87 | 0.125 | 30.96 | 0.27 | 14.33 | 4.1 |
| 3 | C + 0.8% P | 4.41 | 0.168 | 26.25 | 0.27 | 16.33 | 4.6 |
| 4 | C + 1.2% P | 5.93 | 0.209 | 28.37 | 0.24 | 24.71 | 5.1 |
| 5 | C + 1.6% P | 4.48 | 0.177 | 25.31 | 0.27 | 16.59 | 4.7 |
| 6 | C + 0.3% B | 3.57 | 0.107 | 33.36 | 0.27 | 13.22 | 3.4 |
| 7 | C + 0.6% B | 3.72 | 0.137 | 27.15 | 0.26 | 14.31 | 4.2 |
| 8 | C + 0.9% B | 4.40 | 0.178 | 24.72 | 0.25 | 17.60 | 4.7 |
| 9 | C + 1.2% B | 3.84 | 0.149 | 25.77 | 0.26 | 14.77 | 4.3 |
| Sr No. | Clay/Fiber Mixtures | Triaxial (Consolidated Undrained) | Compression Index (Cc) | E50/Cc (MPa) | Soaked CBR (%) | ||
|---|---|---|---|---|---|---|---|
| E50 (MPa) | Sp (MPa) | E50/Sp | |||||
| 1 | C + 0.4% P + 0.3% B | 5.96 | 0.217 | 28.62 | 0.25 | 24.84 | 5.4 |
| 2 | C + 0.4% P + 0.6% B | 6.12 | 0.228 | 27.54 | 0.24 | 26.17 | 5.5 |
| 3 | C + 0.4% P + 0.9% B | 6.25 | 0.236 | 27.84 | 0.23 | 28.57 | 6.1 |
| 4 | C + 0.4% P + 1.2% B | 6.11 | 0.230 | 26.57 | 0.23 | 26.57 | 5.7 |
| 5 | C + 0.8% P + 0.3% B | 6.37 | 0.227 | 28.06 | 0.22 | 28.95 | 5.9 |
| 6 | C + 0.8% P + 0.6% B | 6.59 | 0.234 | 28.16 | 0.21 | 31.38 | 6.4 |
| 7 | C + 0.8% P + 0.9% B | 6.82 | 0.239 | 28.54 | 0.20 | 34.10 | 6.8 |
| 8 | C + 0.8% P + 1.2% B | 6.76 | 0.224 | 30.18 | 0.21 | 32.19 | 6.0 |
| 9 | C + 1.2% P + 0.3% B | 7.27 | 0.235 | 29.28 | 0.19 | 36.21 | 6.5 |
| 10 | C + 1.2% P + 0.6% B | 7.65 | 0.241 | 29.63 | 0.18 | 39.67 | 6.9 |
| 11 | C + 1.2% P + 0.9% B | 8.60 | 0.263 | 32.70 | 0.16 | 53.75 | 8.4 |
| 12 | C + 1.2% P + 1.2% B | 8.36 | 0.251 | 33.31 | 0.18 | 46.44 | 8.0 |
| 13 | C + 1.5% P + 0.3% B | 7.11 | 0.231 | 30.78 | 0.19 | 37.42 | 7.1 |
| 14 | C + 1.6% P + 0.6% B | 7.25 | 0.239 | 30.33 | 0.20 | 36.25 | 7.8 |
| 15 | C + 1.6% P + 0.9% B | 7.37 | 0.246 | 29.96 | 0.20 | 36.85 | 7.9 |
| 16 | C + 1.6% P + 1.2% B | 6.92 | 0.223 | 31.03 | 0.21 | 32.95 | 6.8 |
| Constituents | Percentage, % |
|---|---|
| SiO2—Silica | 47.1 |
| Al2O3—Aluminium Oxide | 15.3 |
| Fe2O3—Ferric Oxide | 9.2 |
| MgO—Magnesium Oxide | 5.1 |
| CaO—Calcium Oxide | 13.6 |
| K2O—Potassium Oxide | 0.6 |
| Na2O—Sodium Oxide | 2.7 |
| Other | 6.4 |
| Sr. No. | Statistics | mc, % | E50 (MPa) | Sp (MPa) | Cc |
|---|---|---|---|---|---|
| 1 | F | 387.913 | 219.615 | 188.056 | 93.952 |
| 2 | p | 2.5 × 10⁻¹⁶ | 5.3 × 10⁻¹³ | 4.2 × 10⁻¹² | 2.6 × 10⁻¹⁰ |
Disclaimer/Publisher’s Note: The statements, opinions and data contained in all publications are solely those of the individual author(s) and contributor(s) and not of MDPI and/or the editor(s). MDPI and/or the editor(s) disclaim responsibility for any injury to people or property resulting from any ideas, methods, instructions or products referred to in the content. |
© 2023 by the authors. Licensee MDPI, Basel, Switzerland. This article is an open access article distributed under the terms and conditions of the Creative Commons Attribution (CC BY) license (https://creativecommons.org/licenses/by/4.0/).
Share and Cite
Zubair, A.; Farooq, Z.; Farooq, K.; Masoud, Z.; Mujtaba, H.; Mohamed, A. Prediction of Compression Index from Secant Elastic Modulus and Peak Strength of High Plastic Clay Ameliorated by Agro-Synthetic Waste Fibers for Green Subgrade. Sustainability 2023, 15, 15871. https://doi.org/10.3390/su152215871
Zubair A, Farooq Z, Farooq K, Masoud Z, Mujtaba H, Mohamed A. Prediction of Compression Index from Secant Elastic Modulus and Peak Strength of High Plastic Clay Ameliorated by Agro-Synthetic Waste Fibers for Green Subgrade. Sustainability. 2023; 15(22):15871. https://doi.org/10.3390/su152215871
Chicago/Turabian StyleZubair, Ayesha, Zainab Farooq, Khalid Farooq, Zubair Masoud, Hassan Mujtaba, and Abdullah Mohamed. 2023. "Prediction of Compression Index from Secant Elastic Modulus and Peak Strength of High Plastic Clay Ameliorated by Agro-Synthetic Waste Fibers for Green Subgrade" Sustainability 15, no. 22: 15871. https://doi.org/10.3390/su152215871
APA StyleZubair, A., Farooq, Z., Farooq, K., Masoud, Z., Mujtaba, H., & Mohamed, A. (2023). Prediction of Compression Index from Secant Elastic Modulus and Peak Strength of High Plastic Clay Ameliorated by Agro-Synthetic Waste Fibers for Green Subgrade. Sustainability, 15(22), 15871. https://doi.org/10.3390/su152215871