Article

Applicability of Industry 4.0 Technologies in the Reverse Logistics: A Circular Economy Approach Based on COmprehensive Distance Based RAnking (COBRA) Method

1
Department of Biological and Environmental Sciences and Technologies, University of Salento, Via Monteroni snc, 73100 Lecce, Italy
2
Department of Innovation Engineering, University of Salento, Via Monteroni snc, 73100 Lecce, Italy
3
Logistics Department, Faculty of Transport and Traffic Engineering, University of Belgrade, VojvodeStepe 305, 11000 Belgrade, Serbia
4
Department of Technology Management and Economics, Chalmers University of Technology, 41296 Gothenburg, Sweden
*
Author to whom correspondence should be addressed.
Sustainability 2022, 14(9), 5632; https://doi.org/10.3390/su14095632
Submission received: 17 March 2022 / Revised: 4 May 2022 / Accepted: 5 May 2022 / Published: 7 May 2022
(This article belongs to the Special Issue New Trends in Sustainable Supply Chain and Logistics Management)

Abstract

:
The logistics sector plays one of the most important roles in the supply chain with the aim of providing a fast, flexible, safe, economical, efficient, and environmentally acceptable performance of freight transport flows. In addition, the popularization of the concept of a circular economy (CE) used to retain goods, components, and materials at their highest usability and value at all times, illustrates the importance of the adequate performance of reverse logistics (RL) processes. However, traditional RL is unable to cope with the requirements of modern supply chains and requires the application of Industry 4.0 technologies, which would make it more efficient. The main aim of this study was to evaluate the applicability of various Industry 4.0 technologies in the RL sector in order to point out the most applicable ones. To solve the defined problem, a novel multi-criteria decision making (MCDM) model was defined by combining the best—worst method (BWM) to obtain the criteria weights, and the newly developed comprehensive distance-based ranking (COBRA) method to rank the technologies. Another aim of the study was to validate the newly established method. The results indicated that the most applicable technologies were the Internet of Things, cloud computing, and electronic—mobile marketplaces. These technologies will have a significant impact on the development of RL and the establishment of CE systems, thus bringing about all the related positive effects.

1. Introduction

With the spreading of the circular economy (CE) paradigm, the related environmental, social, and economic challenges have gained space in the agenda of decision makers [1], highlighting the fundamental role of the supply chain. The latter is defined as the set of all activities and processes involved in the production of goods, from raw materials to final customers, including every stage and the entire flow [2].
The CE and supply chain paradigms have been synthesized within the concept of a closed-loop supply chain (CLSC). CLSCs simultaneously consider both forward and reverse flows and strive to establish, implement, and control a system aimed at maximizing the extraction of values from different types and volumes of return flows throughout the entire life cycle [3,4].
This study focuses on the logistics (intended as the organization), planning, control, and the realization of the flow of goods from the point of origin—through production, distribution, and point of sale—to the end consumers, with the aim of meeting the market demands with minimal costs and minimal investment [2]. Generally, logistics is seen as the framework which encompasses all systems and processes enabling the movement of material and non-material flows.
Following the functional decomposition in terms of flows, logistics can be divided into two distinctive parts. The first part is forward logistics, which includes the flows of raw materials procurement, product development and manufacturing, and distribution to the end consumers. The second one is known as reverse logistics (RL) and includes the backflows of returns and recalls, which can be resold, reused, repaired, refurbished or remanufactured, and waste, which can be recycled or disposed. From an operational perspective, RL requires the management of inventories of returned products or disposed materials, while from a circular perspective, RL represents an opportunity to reduce a business’s environmental impacts.
Since Industry 4.0 solutions are identified as disruptive factors in the field of CLSC towards cleaner production processes [5,6], businesses need to accelerate the implementation of CE and new technologies to meet their sustainability goals [7].
The opportunities and potential of Industry 4.0 for both the circular economy and logistics have rarely been investigated simultaneously [8]. Technologies introduce significant innovation solutions which can allow logistics service providers to address new challenges, to redesign the traditional supply chain, to seek competitiveness, and to shift towards the digital era.
The extent of this study covers the RL—the reverse flows supply chain management (SCM)—whose operability can make the overall CLSC more efficient [9]. By combining the paradigms of Industry 4.0 and CE in a specific research scope, this study attempts to evaluate the applicability of Industry 4.0 technologies in RL through the development of a novel multi-criteria decision making (MCDM) model based on a new comprehensive distance-based ranking (COBRA) method. Accordingly, one of the main aims of the study is to validate the developed method and the established MCDM model to solve this type of problem.
Innovative Industry 4.0 technologies support economic, social, and environmental sustainability. They enable companies to operate more efficiently and achieve a competitive advantage in the market [10]. They generate changes in the labor market and contribute to the creation of new jobs and new profiles of workers [11]. Through the modernization of the production and service sector, they contribute to the overall economic development of the region and the areas in which they are applied [12]. They also significantly reduce negative environmental effects, primarily caused by production and transport processes [13]. Therefore, it is clear that Industry 4.0 technologies have a significant impact on the achievement of the goals of different stakeholders. However, the connection between Industry 4.0 technologies and stakeholders is mutually dependent. Due to the importance that these technologies hold for stakeholders, stakeholders influence and dictate the development of Industry 4.0 technologies. As these technologies differ in relation to the degree of the impact and scope of the effects they generate, it is logical that not all technologies have the same priority for development. Accordingly, another aim of this study is to evaluate and rank the different technologies of Industry 4.0 in order to identify those that are most applicable in the field of RL and thus provide the most positive effects for the widest set of stakeholders. The ultimate goal is to identify technologies that should be focused on specifically, that should be stimulated, and to which the resources and efforts for further development and implementation should be directed.
The results of this study indicate that the most applicable Industry 4.0 technologies in the area of RL are the Internet of Things, cloud computing, and the E/M marketplace. The study contributes to the body of literature with its systematic overview of the possible applications of the Industry 4.0 technologies in RL, the establishment of the framework for making a decision on the application of various Industry 4.0 technologies, the definition of a unique set of evaluation criteria, and the development of a novel MCDM method.
The remainder of this study is organized as follows: Section 2 presents the theoretical background of the study with a focus on RL, the role of Industry 4.0 technologies in logistics, and an overview of MCDM methods. Section 3 illustrates the novel MCDM model based on a newly established method for the evaluation and the final ranking of the alternatives. Section 4 presents a case study application, the main results, and their validation, while Section 5 discusses them. Section 6 concludes by giving suggestions for future research.

2. Background

2.1. Reverse Logistics

For the past few decades, the global population, as well as living standards, have continuously been growing, and with them has grown the consumption of a wide variety of products [14]. In addition, consumer habits have been changing due to the expansion of internet use, electronic commerce, and more liberal returns policies, among other reasons [15]. This has led to significant amounts of leftover materials and products being returned and disposed of, thus raising a number of questions concerning the environment, sustainability, regulations, resource conservation, and social awareness [16]. The concept of RL is developed and applied with the aim of providing solutions to these aforementioned problems.
There are many definitions of RL in the literature. Initially, RL was conceived to maximize ecological and financial value while simultaneously eliminating the maximum amount of waste [17]. It was later updated to include efficient product flow and information, contrary to the traditional supply chains [14]. According to the standard and most widely accepted definition, RL is a type of SCM whose goal is to optimize the backward flows of goods from the point of consumption to the point of origin in order to efficiently and effectively plan, implement, and control the proper disposal of materials, final products, and inventories, or recapture their value through resale, refurbishing, repairing, remanufacturing, or recycling [18,19].
Due to the growing importance of the relationship between environmental and economic impacts [20], RL is seen as the unifier of profit and cost optimization with environmentally friendly principles and rules [16]. RL immediately affects the financial performance of any firm by optimizing processes and activities that have an impact on environmental circumstances, such as the reduction of waste and the preservation of resources [21,22]. Pollution prevention activities can improve environmental performance, which has a favorable impact on industrial and commercial activities [23]. As a result, environmental considerations, such as waste disposal, greenhouse gas emissions, and energy usage during manufacturing, are considered the most critical priority for the development of RL [24]. With the world’s population rising and natural resources decreasing, RL will soon become a necessity for all businesses [14].
Recently, it has become unimaginable to speak about RL without mentioning circular economy (CE). CE can be defined as a restorative and regenerative industrial economy that aims to preserve the usability and value of finished goods, components, and raw materials at all times [25]. Unlike the “take, make, discard” linear economy model, CE strives to reduce the use of finite resources and raw materials in product manufacturing, thus becoming a promising option for conceiving sustainable development [26]. RL is strongly embedded in the CE paradigm. They share the same sustainability requirements [27] and technical principles based on the restoration and circularity of materials [28]. RL enables circularity by retaining the backflows within the supply chain to extract the value of materials [29]. The integration of sustainability principles with CE is a research area that ensures waste and resource conservation, material recovery, and the mitigation of negative environmental effects in the comprehensive development of RL systems and CLSC [30]. Significant support for this integration is provided by digitalization achieved through the application of various technologies that comprise the foundation of the Industry 4.0 framework [31,32,33]. Due to its continuous development, CE has recently become the subject of numerous studies, the most important of which dealing with identifying of metrics for its evaluation and performance assessment [34,35].
On the other hand, RL specifically has recently been the subject of research, mainly dealing with network design, implementation decisions, 3PL service providers, facility location, routing, consumer behavior, hybrid manufacturing, and performance management [14]. However, the research dealing with RL has failed to keep up with modern trends brought about by the new industrial revolution, i.e., Industry 4.0, and the changes and possibilities it has generated. The possibilities of applying Industry 4.0 technologies in RL have remained largely unexplored. Based on the effects achieved in other branches in which these technologies have so far found wider application, it is more than obvious that there is significant room for research not yet explored. Keeping this in mind, this study tries to fill the gap in exploring the application of Industry 4.0 technologies in RL.

2.2. Industry 4.0 Technologies in Logistics

The term Industry 4.0, first used in a high-tech strategic project from 2011 [36], nowadays primarily denotes the fourth industrial revolution. However, there is a dispute among scholars on what this term actually represents. Some authors define it as the “application of new technologies and concepts in the organization of the value chain” (e.g., [37]); some as the “complex solution created in the sphere of common interest of engineering, computer science and management” (e.g., [38]); and still others as the “smart networking of machines and processes in the industry using information and communication technologies” (e.g., [39]). Common in all Industry 4.0 definitions is the cohesion of computer networks with the real-life physical processes through the application of advanced technologies such as the Internet of Things (IoT), blockchain, electronic and mobile marketplaces, cloud computing (CC), big data and data mining, artificial intelligence (AI), autonomous vehicles (AV) and automated guided vehicles (AGV), and augmented reality (AR), thus forming a cyber-physical System (CPS) [40].
Many authors have raised the question of whether Industry 4.0 is a revolution or an evolution, since most of the above-listed technologies already existed in some form before its beginning [38,41]. Industry 4.0 can be seen as an innovative concept since it has enabled the connection of already known solutions, applications, and technologies in a complex network of interdependent elements. Whether Industry 4.0 represents a revolution or an evolution, it has created a new framework for social, political, economic, and environmental actions [42].
Industry 4.0 set the stage for the creation of a smart framework based on technologies and applications enabling easy communication and connections between various objects [43]. This made the objects more autonomous and responsive to the environment and enabled them to learn how to improve their performance [44]. The main prerequisites to achieve this are the availability of real-time information, the ability to diverge from the best technique to perform the process at any point, the flexibility to adapt the products or services to uncertain user requirements, and the ability to undertake processes that add value by combining diverse types of data [40]. The development of the Industry 4.0 paradigm enables the reduction of manufacturing costs, improves logistics services quality, and enables more efficient energy (and other limited resources) utilization. It also increases the levels of economic competitiveness by creating opportunities for the establishment of new business models and strategies by employing advanced technologies for the planning and management of business processes across the entire value chain, thereby creating new jobs and professions [40]. Industry 4.0 is primarily viewed as a notion that dramatically alters manufacturing processes, although its implications span a wide range of human endeavors, including manufacturing, trade, health, agriculture, and logistics, among others [42].
New logistical requirements have been created as a result of a new industrial paradigm. As a result, Logistics 4.0 is becoming more widely recognized as a concept that is inextricably linked to Industry 4.0, with which it shares the same aims, values, expectations, and operational settings [41]. Logistics 4.0, according to Jeschke [45], is an inherent aspect of Industry 4.0, which refers to the implementation of various Industry 4.0 technologies in logistics. Similarly, Barreto et al. [46] define Logistics 4.0 as the implementation of logistics processes through the use of innovative technologies and applications initiated by the development of CPS. Logistics 4.0, according to Timm and Lorig [47], is a “shift from hardware-oriented to software-oriented logistics”. Winkelhaus and Grosse [48] defined Logistics 4.0 as a logistics system that allows for the long-term fulfillment of unique client requirements while reducing costs and advancing industry and trade through the use of digital technology. After an extensive literature review, some of the most recent research of the application of Industry 4.0 technologies in logistics has been identified and presented in Table 1. Although there is plenty of research investigating the application of Industry 4.0 technologies in the field of logistics, in general, there is no research dealing with the overview of these technologies in the RL sector. There is also research dealing with the applicability evaluation of the Industry 4.0 technologies in various fields (e.g., [49,50,51], as well as in the field of logistics (e.g., [10]), but again there is no such research in the field of RL. In addition, all previous research only considers several Industry 4.0 technologies and does not evaluate them by comprehensively taking into account a greater number of criteria. These are all research gaps which this study endeavors to fill.

2.3. Literature Review on MCDM Methods

The research field of MCDM has grown exponentially, especially in the last decade. More than fifty MCDM methods can be found in the literature, but the total number is practically impossible to determine since every month or two a new method emerges. However, not all the methods find their wider application among the researchers or practitioners. They all have some advantages and disadvantages, but a wider application depends on their suitability in solving a particular problem and the amount of resources (human, financial, temporal etc.) needed for their application. There are no methods that are better or worse, just ones that are more (or less) suited to the problem needed to be solved and the resources available. Some of the most known and most used MCDM methods are presented in Table 2. Each method belongs to one of the following groups [80]: scoring (additive) methods (S), distance-based methods (DB), pairwise comparison methods (PC), and outranking methods (O).
From the MCDM methods listed above, the distance-based methods, such as TOPSIS, VIKOR, CODAS, EDAS, MOORA, WASPAS, and MARCOS, are especially emphasized since the method developed in this study also belongs to this group of methods. All of these methods have in common the logic behind the ranking of the alternatives, based on the various types of distances of the alternatives from the reference alternative (ideal, anti-ideal, average, etc.).
The TOPSIS method ranks the alternatives regarding the shortest geometric distances of the alternatives from the positive-ideal and negative-ideal solutions. The main advantages of this method are its clarity, coherence, accuracy, adaptability, and mathematical plainness [107]. However, it has certain limitations. The relative performance used for ranking is based on the simple aggregation of the distances from the positive and negative ideal solutions without considering their importance. Moreover, striving to approach the positive ideal solution, while moving away from the negative ideal solution, is not always the best-case scenario [108]. The TOPSIS method is very well known and broadly used in various fields, such as selecting green suppliers [109], selecting waste-to-energy technology [110], evaluating the profitability of green infrastructure [111], and vehicle routing [112].
The VIKOR method has a similar logic to the TOPSIS method: it evaluates the alternatives in relation to all criteria and ranks them according to the utility, regret, and unified (so-called VIKOR) measures of distances from the ideal and nadir solutions. However, the main advantage of the VIKOR over the TOPSIS method is that it proposes a compromising solution using an advantage rate which ensures that the best-ranked alternative is the closest to the ideal solution, which is not necessarily the case with the TOPSIS method [113,114]. The VIKOR method has also evidenced wide applications in various fields, with some of the most recent being the investigation of last mile delivery sustainability [115], the selection of logistics service providers [116], and the evaluation of a construction companies’ performance [117].
Unlike the TOPSIS and VIKOR methods, EDAS ranks the alternatives based on their positive and negative distances from the average solution in each criterion. The main advantage of the EDAS method is its high efficiency, or the possibility of obtaining high-quality results with less computation in relation to the previously mentioned methods [118]. EDAS is a relatively young method, but it has already garnered a wide applications in various fields. Some of the more recent applications include analyzing the barriers to RL [119], optimal industrial robot selection [120], and the ranking of renewable energy sources [121].
The MOORA method, instead, ranks the alternatives in relation to their square root ratio distances from the reference point. Similar to the EDAS method, the main feature of the MOORA method is that it requires less computational time to carry out mathematical calculations [122]. In addition, it is very simple to understand, easy to apply, provides stable results, and requires no extra parameters, such as parameter v in the VIKOR method [123]. Some of the most recent applications of the MOORA method include the evaluation of the logistics performance index values of transition economies countries [124], the potential mapping of minerals in green fields [125], and renewable energies projects selection [126].
The CODAS method ranks the alternatives by combining two types of distances, Euclidian and Taxicab, of the alternatives from the negative ideal solution in each criterion. In comparison to the other distance-based methods, CODAS has a higher degree of accuracy achieved through the application of two types of distances in the evaluation process [127]. It is also one of the new methods, but despite its recent development, it has been applied in various fields to select a logistics service provider [128], evaluate and select the tanker vehicle [129], and select the prospect hospital sites [130].
The WASPAS method is a combination of the weighted sum model and the weighted product model. The WASPAS method is characterized by its high reliability with the process parameter settings obtained from the existing combinations of data, without the need for additional evaluations by the decision makers [131,132]. Due to its simplicity, it has recently found a wide application in various fields including, but not limited to, the evaluation of goods distribution scenarios in the city [133], the sustainability assessment of renewable and conventional energy sources [134], and the selection of processes for aluminum separation from waste cables [135].
The MARCOS method ranks the alternatives using a compromising solution based on utility functions that aggregate the distances from ideal and anti-ideal solutions. The MARCOS method is characterized by its ability to effectively structure and optimize even the larger problems, obtain more accurate solutions by calculating the utility degree, which takes into consideration both the ideal and the anti-ideal solutions in the initial stages of the decision matrix construction, and provide reliable, realistic, and stable solutions even in the environment of the dynamically changing evaluation scales [93,136]. This is the youngest of all previously mentioned methods, but it has immediately attracted a lot of attention and it has already been applied in various fields. It has been applied to assess drone-based city logistics concepts [137], evaluate safety at the railway crossings [138], and evaluate information and communication technology development [139].
As previously stated, what these methods have in common is the way in which they rank the alternatives based on some form of distance from some reference point. It is difficult to say which of these methods is better than the others or, in other words, whether it is better to calculate distances from the ideal, anti-ideal, both the ideal and anti-ideal, or average solutions, or whether it is better to use Euclidean or Manhattan distances. So far, the literature has not defined the method which ranks the alternatives based on the integration of several types of distances from various reference points, which is exactly the research gap this study tries to address. Accordingly, a new comprehensive method (COBRA) has been developed in this study to combine all the advantages of the previously mentioned distance-based methods, eliminating the need to discuss according to which distance and in relation to which solution the alternatives should be ranked. The motives for developing a new MCDM, in general, are to establish a method that is more precise, more credible, more consistent, more comprehensible, easier to use, and less complex. In addition to some of the previous reasons, the main reason for establishing the COBRA method in this study is to make the decision making process more comprehensive, more extensive, and more reliable.

3. Methodology

This study proposes a novel MCDM model based on the newly established COBRA method, which is used for the evaluation and final ranking of the alternatives. The model also includes the BWM method used to obtain the criteria weights. The conceptual representation of the proposed model is presented in Figure 1.
The model consists of the four main steps:
Step 1: Define the structure of the decision-making problem by identifying the alternatives and the set of criteria relevant for their evaluation.
Step 2: Define the evaluation scale. Evaluations of the criteria and alternatives can be quantitative or qualitative. Quantitative evaluations can be generalized and take the qualitative form, which cannot be done the other way around. Having this in mind, the qualitative evaluation scale is more general and universally applicable. In addition, the qualitative scale better suits the nature of human thought, i.e., decision-makers feel more comfortable giving the descriptive (linguistic) evaluations. Based on the above, the general form of the proposed model implies the application of the qualitative scale by using linguistic terms and their corresponding numerical values. In this study, a nine-point scale, presented in Table 3, was used for the evaluations. Decision makers evaluate the criteria and the alternatives using the linguistic terms which are then transformed into the numerical values suitable for the MCDM model.
Step 3: Calculate the criteria weights by applying the BWM method [99].
Step 4: Rank the alternatives using the novel COBRA method.
The last two steps consist of multiple sub-steps which are explained in more detail in the following subsections.

3.1. BWM Method

The BWM method is based on the pairwise comparisons of the identified best and worst criteria in relation to all the other criteria relevant to the considered problem. The weights (importance, values) of the criteria have been determined by solving the maximin problem. Unlike the other pairwise comparison methods (the most-known of which are AHP and ANP), the BWM method requires less data (pairwise comparisons), has a higher degree of consistency, provides more reliable results, minimizes violation, enables less total deviation, minimizes duplication, and has a higher compliance in relation to the other MCDM methods [99,140]. The BWM method is widely applied in the literature to solve various problems. Some of the most recent applications are for logistics service provider selection [141], cloud computing service selection [142], and the evaluation of the service level of bike-sharing companies [143].
To obtain the criteria weights using the BWM method it is necessary to apply the following sub-steps:
Step 3.1: Identify the best criterion B and the worst criterion W (e.g., least desirable, least important).
Step 3.2: Evaluate the preferences ( e b j ) of the best criterion ( B ) over all the other criteria ( j ) using the scale established in Table 3. The result is the vector of Best-to-Others evaluations denoted as: E b = ( e b 1 , e b 2 , , e b m ) where e b j indicates the preference of the best criterion B over criterion j .
Step 3.3: Evaluate the preferences ( e j w ) of all criteria ( j ) over the worst criterion ( W ) using the scale established in Table 3. The result is the vector of Others-to-Worst evaluations denoted as: E w = ( e 1 w , e 2 w , , e m w ) where e j w indicates the preference of the criterion j over the worst criterion W .
Step 3.4: Calculate the criteria weights w j by solving the linear programming problem:
min ξ   ,  
subject to:
| w b e b j w j | ξ   ,     j = 1 , , m   ,  
| w j e j w w w | ξ   ,   j = 1 , , m   ,  
j = 1 m w j = 1   ,  
w j 0   ,     j = 1 , , m   ,  
The obtained results indicate the consistency of the comparison. The closer the value of ξ is to zero, the higher the consistency.

3.2. COmprehensive Distance Based RAnking—COBRA Method

The newly established COBRA method, used in this study to obtain the final ranking of the alternatives, consists in several sub-steps:
Step 4.1: Establish the evaluations a i j of the alternatives i   ( i = 1 , , n ) in relation to criteria j   ( j = 1 , , m ) , thus forming the decision matrix A :
A = [ ( a 11 a 1 m a n 1 a n m ) ]   ,  
where n is the total number of criteria, and m is the total number of the alternatives taken into consideration.
Step 4.2: Form the normalized decision matrix Δ :
Δ = [ α i j ] n × m   ,  
where
α i j = a i j max i   a i j   ,  
Step 4.3: Form the weighted normalized decision matrix Δ w in the following way:
Δ w = [ w j × α i j ] n × m   ,  
where w j is the relative weight of criterion j .
Step 4.4: For each criterion function determine the positive ideal ( P I S j ), negative ideal ( N I S j ) and average solution ( A S j ) in the following way:
P I S j = max i ( w j × α i j )   ,     j = 1 , , m         z a       j J B P I S j = min i ( w j × α i j )   ,     j = 1 , , m         z a       j J C   ,  
N I S j = min i ( w j × α i j )   ,     j = 1 , , m         z a       j J B N I S j = max i ( w j × α i j )   ,     j = 1 , , m         z a       j J C   ,  
A S j = i = 1 n ( w j × α i j ) n   ,     j = 1 , , m         z a       j J B ,   J C   ,  
where J B is the set of benefit and J C the set of cost criteria.
Step 4.5: For each alternative determine the distances from the positive ideal ( d ( P I S j ) ) and negative ideal ( d ( N I S j ) ) solutions, as well as the positive ( d ( A S j + ) ) and negative ( d ( A S j ) ) distances from the average solution in the following way:
d ( S j ) = d E ( S j ) + σ × d E ( S j ) × d T ( S j )   ,     j = 1 , , m   ,  
where S j represents any solution ( P I S j , N I S j or A S j ), σ is the correction coefficient obtained in the following way:
σ = max i   d E ( S j ) i min i   d E ( S j ) i   ,  
d E ( S j ) i and d T ( S j ) i denote the Euclidian and Taxicab distances, respectively, which are for the positive ideal solution obtained as follows:
d E ( P I S j ) i = j = 1 m ( P I S j w j × α i j ) 2   ,     i = 1 , , n   ,     j = 1 , , m   ,  
d T ( P I S j ) i = j = 1 m | P I S j w j × α i j |   ,     i = 1 , , n   ,     j = 1 , , m   ,  
for the negative ideal solution obtained as follows:
d E ( N I S j ) i = j = 1 m ( N I S j w j × α i j ) 2   ,     i = 1 , , n   ,     j = 1 , , m   ,  
d T ( N I S j ) i = j = 1 m | N I S j w j × α i j |   ,     i = 1 , , n   ,     j = 1 , , m   ,
for the positive distance from the average solution obtained as follows:
d E ( A S j ) i + = j = 1 m τ + ( A S j w j × α i j ) 2   ,     i = 1 , , n   ,     j = 1 , , m   ,  
d T ( A S j ) i + = j = 1 m τ + | A S j w j × α i j |   ,     i = 1 , , n   ,     j = 1 , , m   ,  
τ + = { 1       i f       A S j < w j × α i j 0       i f       A S j > w j × α i j   ,  
and for the negative distance from the average solution obtained as follows:
d E ( A S j ) i = j = 1 m τ ( A S j w j × α i j ) 2   ,     i = 1 , , n   ,     j = 1 , , m   ,  
d T ( A S j ) i = j = 1 m τ | A S j w j × α i j |   ,   i = 1 , , n   ,     j = 1 , , m   ,  
where
τ = { 1       i f       A S j > w j × α i j 0       i f       A S j < w j × α i j   ,
Step 4.6: Rank the alternatives according to the increasing values of the comprehensive distances ( d C i ) obtained using:
d C i = d ( P I S j ) i d ( N I S j ) i d ( A S j ) i + + d ( A S j ) i 4   ,   1 = 1 , , n   ,  

4. Applicability Evaluation of Industry 4.0 Technologies in Reverse Logistics

The case study discussed in this paper implies the evaluation and ranking of Industry 4.0 technologies to identify those which have the highest chances for a wide application within the RL sector. The technologies represent the alternatives that could be evaluated in terms of various criteria, thus making this an MCDM problem. The problem is solved using a model based on the new COBRA method, thus proving its applicability.

4.1. Industry 4.0 Technologies Applicable in Reverse Logistics

Winkelhaus and Grosse [48] established an integrated structure which unifies the concepts of logistics and Industry 4.0. The structure consists of three main dimensions, namely external, technological, and logistics. The external dimension is defined by globalization, requirements for sustainable development, the reduction of the product life cycle, the growth of the consumer society, and a change in the paradigm of the user’s requirements, such as higher personalization and customization of products, and especially by the establishment and a wider acceptance of the Industry 4.0 philosophy [48,144]. The technological dimension includes various Industry 4.0 technologies, such as IoT, AI, AR, AV, AGV, and CC, thus enabling the change of paradigm, generating the transformation of traditional logistics operations [48,144]. The logistics dimension is the most complex one and consists of three sub-dimensions, namely human factors, competencies, and functions. Human factors, such as social interplay, skills, knowledge, subjectivity, motivation, and physical constraints have a significant impact on the performance of logistics activities. The management of these activities within the main logistics systems, namely order processing, packaging, warehousing, inventories, and transport within the entire supply chain, are seen as the competencies [145,146]. Their main role is to enable the performance of the main logistics functions concerning the material flows, that is, the procurement, production, distribution, and reverse logistics [146]. In light of this subject, the remainder of this paper will be focused on this last function. The aim is to identify the most applicable technologies of Industry 4.0 in the RL sector that will be adopted as the alternatives in this study. These technologies and their potential application are described in more detail below.
Internet of Things (T1), also referred to as “embedded internet” or “pervasive computing”, is used as a hypernym for various aspects of the internet and network integration with the physical world to provide communication and connections, in space and time, between all elements of the system [42,147]. This technology has found its wide application in the field of logistics [148]. Naturally, RL is one of the sub-areas of logistics in which the IoT has found possibilities for a wide application. It can be used to establish a system for acquiring information about different products promptly and accurately to overcome the uncertainty of all product attributes [149]. The upgraded system can track, collect, monitor, and analyze the data in real-time, thus creating databases that support the decision making process [150]. IoT can be used to establish a Kanban-based control system suitable for signaling the time and quantity of waste collection and managing a vast number of collection points over greater geographical distances [151]. IoT can also be used to develop a reverse supply chain management (SCM) system which integrates various IoT communication protocols and standards into a cloud-based environment and uses embedded sensors for the collection of data necessary for inventories optimization [152]. The system implies the establishment of a diverse IoT network enabling power and a cost-efficient SCM system. Another application of the IoT in RL is for the evaluation of design alternatives for the products at the end of their life cycle, such as determining the conditions of returned products and deciding whether they should be disassembled, remanufactured, recycled, or disposed [153].
Automated guided vehicles (T2), also referred to as “self-guided vehicles”, imply the transportation and materials handling system remotely or self-controlled by the help of magnets, radio waves, lasers, and cameras [154]. They are mainly used in logistics for the horizontal or vertical displacement of the load, transshipment, manipulation, storage/retrieval, and order-picking [42]. Having this in mind, AGVs can be used to perform the aforementioned activities within waste collection points, RL terminals, recycling (manufacturing) facilities, disposal facilities, or waste incineration facilities [155,156,157,158,159].
Autonomous vehicles (T3) can adapt, learn, and operate themselves without little, if not any, human intervention, using the ability to sense their surrounding environment, make independent decisions, and move safely through it. Unlike AGVs, with which they are often identified, they do not use a predefined fixed route, but, instead, can make independent decisions using advanced algorithms [42]. Their potential application in the RL sector is associated with their application in logistics in general. They can be used to perform both short and long-haul transport. Road and airborne AVs are primarily used to make the first/last-mile deliveries in short-haul transport [160,161]. In addition, the application of rail and waterborne AVs is also possible in long-haul transport to connect various facilities in the RL network [162,163].
Artificial Intelligence (T4) is the capacity of computers to behave in a way which requires intelligence and discernment, which are the features usually attributed to humans [164]. The possibilities of applying AI in RL are very broad. It can be applied for making decisions about RL network design, vehicle routing, product collection, transportation, disposal rules, warehousing, return forecasting, sorting, inspection and processing, as well as for selecting the alternatives to recycling, reassembly, and remanufacturing [165,166]. AI has also enabled the development of some other intelligent technologies, such as AmI, AR, and VR. Although each of these technologies has its specifics and potential, the possible applications within the area of RL have already been covered by the listed applications of the AI; therefore, they will not be further considered as separate alternative technologies in this study.
Big data (T5) refers to the sets of data with such a volume and complexity that traditional data processing software solutions are unable to collect, manage, and process them in a reasonable amount of time [167]. To make such a large volume of complex data valuable, it is necessary to apply advanced analytical tools, collectively called Data mining, to identify current patterns and trends and anticipate future changes [168]. Since these technologies are interconnected and achieve the best results by joint application, they are considered in this study as one alternative. Big data and Data mining can be applied in the field of logistics wherever large amounts of data useful for the improvement of the logistics service quality are being created [169]. In the area of RL, these technologies can be applied to the establishment of a decision framework for successful RL implementation [170], decision making (strategic and tactical), the estimation of the remanufacturing performance [171], the planning of the RL network—specifically the planning of collection points for multiple products and the connections between them [172], predicting product returns and estimating the return quality [173], predicting other reverse activities, avoiding returns, speeding up repair, and preparing for recycling behaviors [174].
Blockchain (T6) technology implies that the database is composed of multiple smaller bases (blocks) containing information on digital transactions which are mutually connected, thus forming chains [175]. Since the blocks are inextricably linked thanks to the code, any change in the data on the performed transactions, including their deletion, addition, and any other type of misconduct, is not possible. This makes the technology perfect for enabling secure transactions of any kind. In the RL sector, blockchain can be applied to develop the system of smart contracting between all players in the RL network, thus preventing any potential fraudulent behavior and providing support to consumers when selecting a suitable payment program [176]. It can also be used to establish trust, traceability, and transparency in RL processes such as recycling, redistributing, and remanufacturing [177]. In fact, it enables the establishment of a framework that integrates supplier relationship management with customer relationship management as a means of building trust in a trustless environment [178].
Management and support to logistics processes and activities dealing with resource planning, warehousing, inventories, data and information exchange, transport, and packaging, require advanced software solutions [42]. These systems have been in use for a long time, but with the development of the Industry 4.0 philosophy and Cloud Computing (T7) technology, the importance and application of these systems are growing exponentially. CC is seen as a provider of shared computer resources (hardware and software) and as a service for a wider group of heterogeneous users [179]. The application of the aforementioned systems for the management of RL processes in the environment of CC technology creates the framework for the establishment of a RL management system in the cloud [180,181].
With the development and wider application of the Internet, new platforms for electronic trade called e-marketplaces have emerged [182]. The advancement of mobile devices (phones, tablets, notebooks, etc.) has made the e-marketplaces evolve into m-marketplaces. Both platforms were developed and used long before the establishment of the Industry 4.0 concept. However, with the technological and communication revolution brought by the development of smart mobile devices using advanced technologies such as wi-fi (wireless fidelity), NFC (near-field communication), WiMAX (Worldwide Interoperability for Microwave Access), and 5G networks, M-marketplaces have simply flourished.
The E/M-marketplaces (T8) have a significant impact on the logistics market. They have integrated the logistics service markets within them and have formed an inseparable alliance that forces customers to buy the logistics service when purchasing the products. In RL, E/M-marketplace platforms enable the defragmentation of the RL market and thus facilitate the redistribution of returns to the market. It also enables the establishment of the return aggregators, the providers of which handle returns from many different users, thus bringing together suppliers and customers, facilitating the direct contact between various stakeholders within the RL chain [183]. The effects are a real-time identification of the reverse flow requirements, great visibility in the entire RL chain, the automation of the procurement of returns, the creation of value through high throughput and minimal transaction costs, the effective control of the volume of returns, and the minimization of returns uncertainty factors [183,184].
3D printing (T9) is a modern technology used in the manufacturing of three-dimensional objects using the successive application of material layers [185]. This technology has significantly affected the logistics sector as the final production can now be shifted much closer to the point of purchase and consumption. This means that, in RL, part of the reverse flows that includes recyclable materials—which can be used for 3D printing—could be redirected to local 3D printing facilities instead of landfills or recycling centers [186,187]. This would reduce transport costs, the number of vehicles needed to collect and transport the returned flows, the number of vehicle-kilometers traveled, and thus all the negative effects of freight transport. On the other hand, businesses that are dependent on production material could use this collecting system to establish a reliable and uninterrupted supply, independent of raw material suppliers [188].
Advanced robotics (T10) refers to the application of robots, machines that perform the work usually conducted by people. The main reasons for the application of robots are their high efficiency, flexibility, reliability, and precision. In addition to these, one of the main reasons for their application in logistics is the lack of a workforce, especially for the repetitive and simple tasks which can be easily completed by robots [189]. Until recently robots were mostly immobile, senseless, and unaware of their surroundings and relatively unintelligent [189]. With the technological advancement brought by Industry 4.0, they became “smarter” and able to “see”, “think”, move freely on their own while interacting with the environment, thus becoming capable of performing more complex logistics operations [189]. In RL, robots can be used for collection and transportation [155], as well as for classification, dismantling, storage and retrieval [190] of the returned products within various facilities of the RL networks.

4.2. Criteria for the Technology Applicability Evaluation

The criteria for the evaluation of the applicability of Industry 4.0 technologies in RL are inspired by the criteria used in other research [191,192,193,194,195,196,197,198]. However, the set of criteria established for this study is unique and developed exclusively by the authors for the specific investigated problem. The validity of the criteria was confirmed through roundtables with experts from the field of RL and Industry 4.0, other members of academia and practitioners (logistics service providers), other stakeholders, public administrators, and residents. In total, sixteen criteria were defined and grouped into three main categories. The overview of the criteria identified as relevant for the technology evaluation is presented in the following Table 4.
Degree of development (C1) considers the level to which the technology has been developed, i.e., whether it is in the phase of an idea, concept, pilot, or real life application. Technologies in the later phases of development are more likely to be considered when planning or developing potential RL solutions/scenarios.
Possibility of integration (modularity) (C2) implies the compatibility and likelihood of cooperation between the Industry 4.0 technologies themselves, as well as with the other former and current technologies, concepts, and organizations. Highly compatible and modular technologies are much more favorable for real-life applications.
Complexity of implementation (C3) refers to the amount of effort needed to implement the technology, which includes finding the appropriate workforce, training and education, software and hardware development, and the development and implementation of various accompanying systems. Technologies requiring less effort are more favorable.
Possibility of standardization (C4) discusses the prospect of the certain technological aspects, such as processes, procedures, or equipment to be standardized. Standardized technologies are more likely to find a wider application.
Adaptability (C5) implies the possibility of modification and/or enhancement of the technology to adapt to the changes in the business environment. Highly adaptable technologies provide much more application comfort.
Safety (C6) refers to the degree to which the technology affects, either positively or negatively, the wellbeing of the persons involved in the processes (workers, residents). Technologies that improve peoples’ safety are much more desirable for their application.
Labor market impact (C7) implies the effect the technology has on the job creation or reduction. Most of the Industry 4.0 technologies imply a certain level of automation and digitalization which reduce the need for manual labor and thus the number of jobs. On the other hand, new technologies create new types of jobs and can increase employment. Technologies that achieve a positive balance regarding job creation/reduction are more favorable.
Environmental impact (C8) investigates the effects of technology on the environment in terms of greenhouse gas, noise, vibrations, particle emissions, waste generation, the occupation of public spaces, and several others. Technologies that mitigate the negative environmental effects of RL operations are more favorable.
Cultural framework (C9) refers to the traditions, value systems, and way of living, doing business and caring for the environment. Not all technologies are equal in terms of cultural acceptance by the people affected by them. Technologies that demand more radical changes in people’s habits in any aspect of their lives tend to be much less favorable.
Political framework (C10) refers to the actions undertaken by the administrations on various levels (city, state, country) aimed at promoting or degrading certain technologies. The results of these actions are seen in the form of development strategies, plans, incentives, or subsidies. The administration’s support for certain technology leads to a wider application.
Regulatory framework (C11) encompasses the legal mechanisms that exist on various levels (local, national, and international) and form a legal background, thus operating as a pre-requisite for technology application. Certain technologies are much more demanding regarding this criterion and are thus less favorable.
Investment costs (C12) include the costs of equipment, software, technology development, and implementation. Technologies which require more investments, particularly in the initial phases of the implementation, are less favorable.
Energy consumption efficiency (C13) refers to the protection of the limited energy resources, that is, the use of the alternative energy resources, use of renewable energy, less energy consumption, and a better energy utilization. Technologies that enable more efficient energy consumption are much more favorable.
Security (C14) refers to the vulnerability of the technology regarding the interception, theft, manipulation, or deletion of the data needed for the technology operation. Most of the Industry 4.0 technologies exchange a large amount of highly sensitive data and are thus more or less sensitive to their abuse. The potential consequences of this abuse determine the level of technology acceptance.
Organizational readiness (C15) determines the number of changes within the organization, such as the changes in the business procedures and operations needed for the achievement of the technology’s full potential. Technologies that require more changes are less favorable.
Logistics service quality (C16) refers to the impact of the technology on the reliability, flexibility, availability, accuracy, visibility, and traceability of the freight transportation flows in RL operations. The technologies that are better in terms of the aforementioned characteristics are much more favorable.

4.3. Application of the Model and Results

The first step of the model defined in Section 3 is the definition of the problem structure. This structure is established by introducing the various Industry 4.0 technologies as the alternatives and multiple criteria for their evaluation described in Section 4.1 and Section 4.2, respectively. For the evaluation of the criteria and alternatives, the scale defined in Table 3 is used.
The third step of the proposed model was the evaluation of the criteria to obtain their weight. The criteria evaluations were carried out through the discussion groups with experts in the field of logistics, representatives of the logistics service providers, users of these services (shippers and receivers of goods), public administration, and residents. They were presented with the background of the problem discussed within this study and asked to express their opinions regarding the criteria weights. They were asked to pinpoint the best and the worst criteria, namely, the criteria that have the most and the least impact on their applicability and to evaluate all the other criteria in relation to these two using the linguistic evaluations given in Table 3. The criteria indicated in most of the evaluations as being the best/worst were selected as such (Step 3.1). The evaluations of the preference of the best criterion over all the other criteria, which had the highest frequency in the population of respondents, were adopted as the representative evaluations (Step 3.2). The same procedure was followed for the evaluations of all the other criteria in relation to the worst one (Step 3.3). By solving the linear programming problem (1) subject to (2)–(5), the criteria weights are obtained (Step 3.4). The best and the worst criteria, their preference in relation to all the other criteria, as well as the final weights of the criteria obtained by using the BWM method, are presented in Table 5.
Following the same procedure as with the criteria evaluations, the most frequent evaluations by the respondents, regarding the applicability of the Industry 4.0 technologies in RL in relation to the defined criteria, were adopted as the representative evaluations, thus forming the decision matrix A (6) (Step 4.1). These representative evaluations are presented in Table 6.
The linguistic evaluations transformed into numerical values by the relations given in Table 3 were normalized using the Equations (7) and (8), thus providing the values for the normalized decision matrix Δ (Step 4.2). Using the criteria weights presented in Table 3, and by applying the Equation (9), the weighted normalized decision matrix was formed Δ w (Step 4.3). By using Equations (10)–(12), the positive ideal ( P I S j ), negative ideal ( N I S j ), and average solutions ( A S j ) were obtained for each criterion function. Afterward, for each alternative, the distances from the positive ideal solution ( d ( P I S j ) ) were obtained by applying Equations (13)–(16). Distances from the negative ideal solution ( d ( N I S j ) ) were obtained by applying Equations (13), (14), (17) and (18). Positive distances from the average solution ( d ( A S j + ) ) were obtained using Equations (13), (14), and (19)–(21), and negative distances from the average solution ( d ( A S j ) ) were obtained by applying Equations (13), (14), and (22)–(24). The final ranking of the technologies was obtained by arranging the values of the comprehensive distances ( d C i ) of each technology, obtained by applying Equation (25) in increasing order. The results obtained by applying the new COBRA method for ranking the applicability of the Industry 4.0 technologies in RL are presented in Table 7.

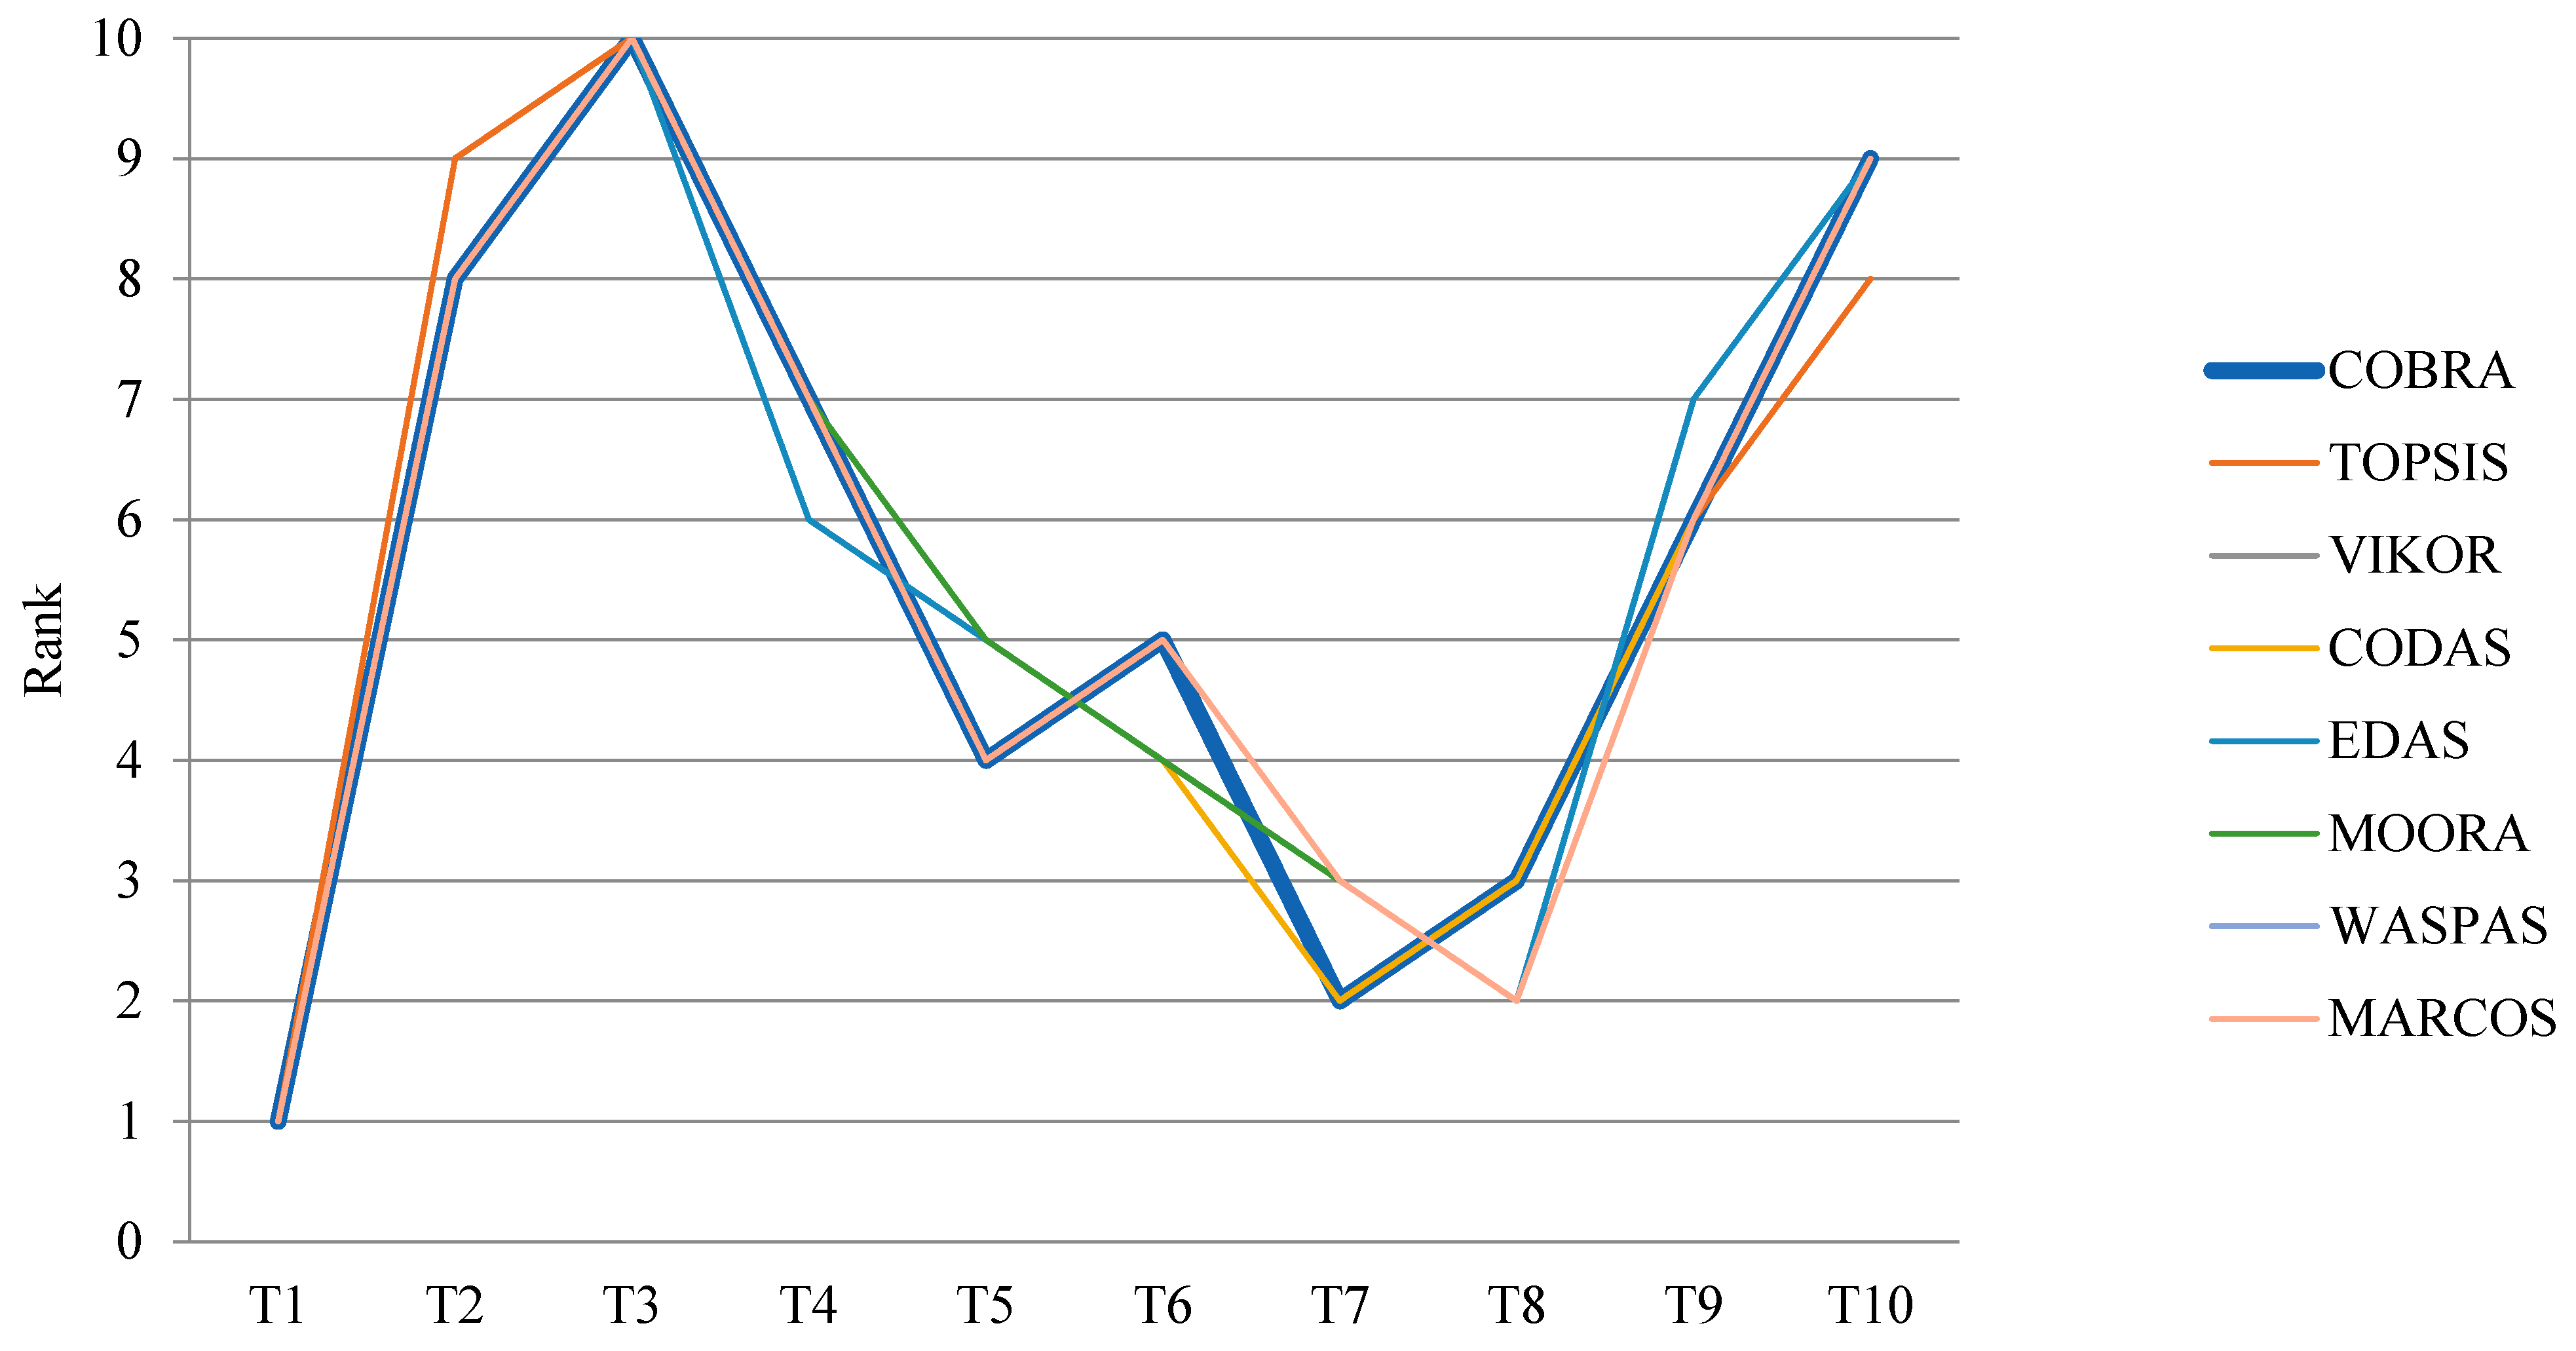
4.4. Validation of Results

In order to validate the results obtained by applying the newly developed COBRA method, the same problem was solved with some other, most often used distance-based MCDM methods, such as TOPSIS, VIKOR, CODAS, EDAS, MOORA, WASPAS, and MARCOS. The obtained results are presented in Table 8 and Figure 2.
It can be seen that all methods provide similar results. To quantify this similarity, a Spearman’s rank correlation coefficient was used, and the results are presented in Table 9. The average Spearman correlation coefficient for all MCDM methods was above 0.97728, and for the COBRA method it was 0.98334. This indicates a very high degree of conformity of COBRA with other MCDM methods, which points to the conclusion that the newly established method is very much applicable and competitive with the other methods.

4.5. Sensitivity Analysis

In addition to the basic scenario (Sc.0), which included the results obtained in Section 4.3, five more scenarios were defined in which some of the model parameters were changed to investigate the eventual changes in the results and the final ranking of the technologies. In Sc.1, all criteria were assigned the same weight. In Sc.2, Sc.3, and Sc.4, one of the three criteria with the highest weight value, namely C12, C3, and C16, were excluded. In Sc.5, all three criteria with the highest value were excluded. The results and the final rankings of the technologies obtained are presented in Table 10. The comparisons between the scenarios’ results are presented in Figure 3. It can be seen that there are no significant changes in the final ranking of the technologies. T1 is ranked as the best one, and T10 as the worst one in all scenarios. The other technologies record minor oscillations but without meaningful significance. Based on the conducted sensitivity analysis, it can be concluded that the obtained solution in Section 4.3 is stable enough to be adopted as the final one.

5. Discussion

The results of this study suggest that the most applicable Industry 4.0 technologies in RL are IoT, cloud computing, and an E/M-marketplace. IoT is considered the base technology for the establishment of the cyber-physical system and the main initiator of Industry 4.0 development. It is reasonably the best-ranked technology, since it initiates, stimulates, or accelerates the development of the other Industry 4.0 technologies. Cloud computing provides a great opportunity for companies and organizations to increase their adaptability and business stability, as well as to reduce the costs, especially under the new reality imposed by the COVID-19 pandemic. It significantly underpins the world’s economy, global supply chains, and remote workforce activities. The COVID-19 pandemic, in addition to all the other factors such as the exponential increase of online retailers, the number of mobile devices, and the people with access to the internet, had a significant impact on the E/M marketplaces as well. As the past two years illustrate, somewhere between 19–52% of people in selected European countries shopped online more often than in the previous years [199]. The application of these technologies will have a significant impact on the development of a circular economy and all the positive effects it brings, such as the reduction of costs, the creation of additional value, a decrease in risk, and a completion of the product life cycle and more. The applications of the Industry 4.0 technologies in RL have been investigated in the literature individually. However, there is no research so far that comprehensively analyzes and ranks various Industry 4.0 technologies in the RL sector in relation to their applicability. The literature also lacks studies that are systemically dealing with the Industry 4.0 technologies in general, and trying to structure them in any way.
To solve the defined problem a novel method named COBRA was developed in this study. The method belongs to the family of distance-based MCDM methods. Pairwise methods require a significant number of comparisons to obtain the solution. On the other hand, outranking methods usually use complex problem structure representation. Therefore, the main advantages of the distance-based methods over these groups of methods are less complexity in the decision-making process and considerably less resources (time, human, financial, etc.) needed to make a decision. The scoring method, on the other hand, represents simple methods that use basic arithmetical operations to arrive at the solution. However, they are unable to capture the nature of the more complex problems under consideration.
The main characteristics of some of the most known and most used distance-based MCDM methods are listed in Section 2.3. The main advantage of the COBRA method over these methods, as the name suggests, is its comprehensiveness. The alternatives are ranked according to the comprehensive distances of each alternative from the three types of solutions, namely positive ideal, negative ideal, and average solutions, unlike the other distance-based methods which rank the alternatives using two such solutions at most. In addition, COBRA uses both Euclidian and taxicab distance measurements to calculate distances for all of these solutions, which ensures a higher reliability of the obtained solution. Two types of distance measurements also allow for a fine differentiation between the distance values which could otherwise be close and thus insufficiently reliable for making a decision. The main advantage of the COBRA method, at the same time, indicates its main disadvantage, which is its complexity. In addition to three types of solutions, it also requires obtaining four groups of distances, namely the distance from the positive ideal solution, the distance from the negative ideal solution, the positive distance from the average solution, and the negative distance from the average solution, as the combinations of two different types of distance measurements, as well as the comprehensive distances which integrate all of the above. Accordingly, the method requires more resources, time in particular, to obtain the results. However, despite these disadvantages, Spearman’s correlation index proved that the COBRA method provides solid results and has a high degree of conformity with the other, most often used MCDM methods. It is worth noting that COBRA even has a higher degree of conformity than TOPSIS, which is by far the most used distance-based MCDM method.
One of the main theoretical implications of this study is that it gives a comprehensive overview of the Industry 4.0 technology applications in the RL sector, which serves as the conception for some future possible applications. By doing so, on the one hand it broadens the space for the potential application of Industry 4.0 technologies, and on the other it introduces the RL sector to the environment of modern technologies, bringing it into a new technological era. Another important theoretical implication of the study is the development of a novel MCDM method, which enriches the family of MCDM methods and the multi-criteria analysis field in general. The new COBRA method can be used in various fields to solve all sorts of MCDM problems.
As for the practical implications of the study, the main one is the establishment of a framework that can be used as a tool by the experts, decision makers, policy creators, and practitioners in general working in the RL sector, to make decisions about implementing an Industry 4.0 technology in their core business processes. Another practical implication is the identification of the most promising Industry 4.0 technologies in terms of their applicability in RL, thus setting the course for their further development and application.

6. Conclusions

This study evaluated and ranked the Industry 4.0 technologies regarding their applicability in RL activities and processes. Ten main technologies, which can be applied in RL, are identified as alternatives and they are evaluated according to a set of 16 points of criteria. For the evaluation and ranking, a novel MCDM model is defined which uses the BWM method for the establishment of the criteria weights and a newly developed COBRA method for ranking the alternatives. As the result, IoT is identified as the most applicable Industry 4.0 technology, followed by cloud computing and the E/M marketplace. The least applicable technology is autonomous vehicles. The COBRA method is validated by comparing the results of its application with the results of other most well-known and used distance-based MCDM methods. The results showed that it has very a high degree of conformity, thus proving its competitiveness with the other methods.
This study contributes to the existing body of literature by providing a systematic overview of the possible applications of the Industry 4.0 technologies in RL and logistics in general. In doing so, it establishes the framework for deciding on the application of the various Industry 4.0 technologies for performing processes and activities in the RL sector. This includes defining the unique set of criteria for the evaluation of Industry 4.0 technology applicability and developing the new distance-based MCDM method, namely COBRA. Possible future research directions are numerous. One potential avenue is the establishment and evaluation of possible scenarios for RL operations based on the application and combination of Industry 4.0 technologies for performing various activities and processes. Considering the above, another future research direction could be the integration of these scenarios with the scenarios of the last-mile deliveries in the city, i.e., the establishment of the integrated first/last-mile delivery scenarios. The evaluation of these scenarios would imply the involvement of all stakeholders and the analysis of their aims and requests, as well as finding a compromising solution acceptable to all of them. Another class of future research could consider the newly developed MCDM method. The COBRA method could be used to solve any MCDM problem in various fields of research. The method could also be expanded to the environment of intuitive or interval sets (e.g., fuzzy, rough, grey). It could also be combined with other MCDM methods in its conventional form, or the intuitive or interval environment to create new hybrid MCDM models.

Author Contributions

Conceptualization, M.K., G.P.A., P.P.M., S.T. and V.R.; methodology, M.K., G.P.A. and P.P.M.; software, M.K.; validation, M.K., G.P.A., P.P.M. and S.T.; formal analysis, M.K., G.P.A., P.P.M., S.T. and V.R.; investigation, M.K., G.P.A., P.P.M. and S.T.; writing—original draft preparation, M.K., G.P.A., P.P.M., S.T. and V.R.; writing—review and editing, M.K., G.P.A., P.P.M., S.T. and V.R.; visualization, M.K.; supervision, M.K., G.P.A. and P.P.M. All authors have read and agreed to the published version of the manuscript.

Funding

This research received no external funding.

Institutional Review Board Statement

Not applicable.

Informed Consent Statement

Not applicable.

Data Availability Statement

All data associated with a paper can be found within the paper.

Conflicts of Interest

The authors declare no conflict of interest.

References

  1. Geissdoerfer, M.; Savaget, P.; Bocken, N.M.; Hultink, E.J. The Circular Economy–A new sustainability paradigm? J. Clean. Prod. 2017, 143, 757–768. [Google Scholar] [CrossRef] [Green Version]
  2. CLM—Council of Logistics Management. Supply Chain Management Terms and Glossary. 2013. Available online: https://cscmp.org/CSCMP/Academia/SCM_Definitions_and_Glossary_of_Terms/CSCMP/Educate/SCM_Definitions_and_Glossary_of_Terms.aspx?hkey=60879588-f65f-4ab5-8c4b-6878815ef921 (accessed on 22 December 2021).
  3. Guide, V.D.R., Jr.; Van Wassenhove, L.N. OR FORUM—The evolution of closed-loop supply chain research. Oper. Res. 2009, 57, 10–18. [Google Scholar] [CrossRef]
  4. Govindan, K.; Soleimani, H.; Kannan, D. Reverse logistics and closed-loop supply chain: A comprehensive review to explore the future. Eur. J. Oper. Res. 2015, 240, 603–626. [Google Scholar] [CrossRef] [Green Version]
  5. Tjahjono, B.; Esplugues, C.; Ares, E.; Pelaez, G. What does industry 4.0 mean to supply chain? Procedia Manuf. 2017, 13, 1175–1182. [Google Scholar] [CrossRef]
  6. Mastos, T.D.; Nizamis, A.; Terzi, S.; Gkortzis, D.; Papadopoulos, A.; Tsagkalidis, N.; Ioannidis, D.; Votis, K.; Tzovaras, D. Introducing an application of an industry 4.0 solution for circular supply chain management. J. Clean. Prod. 2021, 300, 126886. [Google Scholar] [CrossRef]
  7. Manavalan, E.; Jayakrishna, K. A review of Internet of Things (IoT) embedded sustainable supply chain for industry 4.0 requirements. Comput. Ind. Eng. 2019, 127, 925–953. [Google Scholar] [CrossRef]
  8. Birkel, H.S.; Müller, J.M. Potentials of Industry 4.0 for Supply Chain Management within the Triple Bottom Line of Sustainability–A Systematic Literature Review. J. Clean. Prod. 2020, 289, 125612. [Google Scholar] [CrossRef]
  9. Agnusdei, G.P.; Gnoni, M.G.; Tornese, F. Modelling and Simulation Tools for Integrating Forward and Reverse Logistics: A Literature Review. In Proceedings of the 31st European Modeling and Simulation Symposium (EMSS), Lisbon, Portugal, 18–20 September 2019; pp. 317–326. Available online: https://www.cal-tek.eu/proceedings/i3m/2019/emss/045/pdf.pdf (accessed on 10 January 2022).
  10. Merdin, D.; Ersöz, F. Evaluation of the applicability of Industry 4.0 processes in businesses and supply chain applications. In Proceedings of the 3rd International Symposium on Multidisciplinary Studies and Innovative Technologies (ISMSIT), Ankara, Turkey, 11–13 October 2019; pp. 1–10. [Google Scholar]
  11. Grodek-Szostak, Z.; Siguencia, L.O.; Szelag-Sikora, A.; Marzano, G. The impact of industry 4.0 on the labor market. In Proceedings of the 61st International Scientific Conference on Information Technology and Management Science of Riga Technical University (ITMS), Riga, Latvia, 15–16 October 2020; pp. 1–5. [Google Scholar]
  12. Maresova, P.; Soukal, I.; Svobodova, L.; Hedvicakova, M.; Javanmardi, E.; Selamat, A.; Krejcar, O. Consequences of industry 4.0 in business and economics. Economies 2018, 6, 46. [Google Scholar] [CrossRef] [Green Version]
  13. Oláh, J.; Aburumman, N.; Popp, J.; Khan, M.A.; Haddad, H.; Kitukutha, N. Impact of Industry 4.0 on environmental sustainability. Sustainability 2020, 12, 4674. [Google Scholar] [CrossRef]
  14. Prajapati, H.; Kant, R.; Shankar, R. Bequeath life to death: State-of-art review on reverse logistics. J. Clean. Prod. 2019, 211, 503–520. [Google Scholar] [CrossRef]
  15. Bernon, M.; Cullen, J. An integrated approach to managing reverse logistics. Int. J. Logist. Res. Appl. 2007, 10, 41–56. [Google Scholar] [CrossRef]
  16. Kazancoglu, Y.; Ekinci, E.; Mangla, S.K.; Sezer, M.D.; Kayikci, Y. Performance evaluation of reverse logistics in food supply chains in a circular economy using system dynamics. Bus. Strategy Environ. 2021, 30, 71–91. [Google Scholar] [CrossRef]
  17. Mimouni, F.; Abouabdellah, A.; Mharzi, H. Study of the reverse logistics’ break-even in a direct supply chain. Int. Rev. Model. Simul. 2015, 8, 277–283. [Google Scholar] [CrossRef]
  18. Ilgin, M.A.; Gupta, S.M. Environmentally conscious manufacturing and product recovery (ECMPRO): A review of the state of the art. J. Environ. Manag. 2010, 91, 563–591. [Google Scholar] [CrossRef]
  19. Rogers, D.S.; Tibben-Lembke, R.S. Going Backwards: Reverse Logistics Trends and Practices; Reverse Logistics Executive Council: Pittsburgh, PA, USA, 1999. [Google Scholar]
  20. Czerny, A.; Letmathe, P. Eco-efficiency: GHG reduction related environmental and economic performance. The case of the companies participating in the EU Emissions Trading Scheme. Bus. Strategy Environ. 2017, 26, 791–806. [Google Scholar] [CrossRef]
  21. Le, T.T. Performance measures and metrics in a supply chain environment. Uncertain Supply Chain Manag. 2020, 8, 93–104. [Google Scholar] [CrossRef]
  22. Mutingi, M. Developing green supply chain management strategies: A taxonomic approach. J. Ind. Eng. Manag. 2013, 6, 525–546. [Google Scholar] [CrossRef] [Green Version]
  23. Kanashiro, P. Can environmental governance lower toxic emissions? A panel study of US high-polluting industries. Bus. Strategy Environ. 2020, 29, 1634–1646. [Google Scholar] [CrossRef]
  24. Bazan, E.; Jaber, M.Y.; Zanoni, S. A review of mathematical inventory models for reverse logistics and the future of its modeling: An environmental perspective. Appl. Math. Model. 2016, 40, 4151–4178. [Google Scholar] [CrossRef]
  25. Bernon, M.; Tjahjono, B.; Ripanti, E.F. Aligning retail reverse logistics practice with circular economy values: An exploratory framework. Prod. Plan. Control 2018, 29, 483–497. [Google Scholar] [CrossRef]
  26. MacArthur, E. Towards the circular economy. J. Ind. Ecol. 2013, 3, 23–44. [Google Scholar]
  27. Merli, R.; Preziosi, M.; Acampora, A. How do scholars approach the circular economy? A systematic literature review. J. Clean. Prod. 2018, 178, 703–722. [Google Scholar] [CrossRef]
  28. Prieto-Sandoval, V.; Jaca, C.; Ormazabal, M. Towards a consensus on the circular economy. J. Clean. Prod. 2018, 179, 605–615. [Google Scholar] [CrossRef]
  29. Dhakal, M.; Smith, M.H.; Newbery, R. Secondary market: A significant aspect in reverse logistics and sustainability. Int. J. Soc. Sustain. Econ. Soc. Cult. Context 2016, 12, 24–35. [Google Scholar] [CrossRef]
  30. Islam, M.T.; Huda, N. Reverse logistics and closed-loop supply chain of Waste Electrical and Electronic Equipment (WEEE)/E-waste: A comprehensive literature review. Resour. Conserv. Recycl. 2018, 137, 48–75. [Google Scholar] [CrossRef]
  31. Sassanelli, C.; Rosa, P.; Terzi, S. Supporting disassembly processes through simulation tools: A systematic literature review with a focus on printed circuit boards. J. Manuf. Syst. 2021, 60, 429–448. [Google Scholar] [CrossRef]
  32. Chiappetta Jabbour, C.J.; Fiorini, P.D.C.; Ndubisi, N.O.; Queiroz, M.M.; Piato, É.L. Digitally-enabled sustainable supply chains in the 21st century: A review and a research agenda. Sci. Total Environ. 2020, 725, 138177. [Google Scholar] [CrossRef]
  33. Rosa, P.; Sassanelli, C.; Urbinati, A.; Chiaroni, D.; Terzi, S. Assessing relations between Circular Economy and Industry 4.0: A systematic literature review. Int. J. Prod. Res. 2020, 58, 1662–1687. [Google Scholar] [CrossRef] [Green Version]
  34. Vinante, C.; Sacco, P.; Orzes, G.; Borgianni, Y. Circular economy metrics: Literature review and company-level classification framework. J. Clean. Prod. 2021, 288, 125090. [Google Scholar] [CrossRef]
  35. Sassanelli, C.; Rosa, P.; Rocca, R.; Terzi, S. Circular Economy performance assessment methods: A systematic literature review. J. Clean. Prod. 2019, 229, 440–453. [Google Scholar] [CrossRef]
  36. Kagermann, H.; Lukas, W.D.; Wahlster, W. Industrie 4.0: Mit dem Internet der Dinge auf dem Weg zur 4. Industriellen Revolution. 2011. Available online: http://www.wolfgang-wahlster.de/ (accessed on 14 December 2021). (In German).
  37. Hofmann, E.; Rüsch, M. Industry 4.0 and the current status as well as future prospects on logistics. Comput. Ind. 2017, 89, 23–34. [Google Scholar] [CrossRef]
  38. Götz, M.; Gracel, J. Przemysłczwartejgeneracji (Industry 4.0)—wyzwaniadlabada´n w konteksciemiedzynarodowym. Kwartalnik Naukowy Uczelni Vistula 2017, 51, 217–235. (In Polish) [Google Scholar]
  39. BMBF—Bundesministerium für Bildung und Forschung. Plattform Industrie 4.0: 10-Punkteplan für Industrie 4.0 Handlungsempfehlungen der Plattform Industrie 4.0/ 2017. Available online: https://www.plattform-i40.de/ (accessed on 14 December 2021). (In German).
  40. Glistau, E.; Machado, N.I.C. Industry 4.0, Logistics 4.0 and Materials—Chances and Solutions. Mater. Sci. Forum. 2019, 919, 307–314. [Google Scholar] [CrossRef]
  41. Kostrzewski, M.; Varjan, P.; Gnap, J. Solutions Dedicated to Internal Logistics 4.0. In Sustainable Logistics and Production in Industry 4.0; Grzybowska, K., Awasthi, A., Sawhney, R., Eds.; Springer Nature Switzerland AG: Cham, Switzerland, 2020; pp. 243–262. [Google Scholar] [CrossRef]
  42. Krstić, M.; Tadić, S.; Zečević, S. Technological solutions in logistics 4.0. Ekon. Preduzeća 2021, 69, 385–401. [Google Scholar] [CrossRef]
  43. Bahrin, M.A.K.; Othman, M.F.; Nor, N.H.; Azli, M.F.T. Industry 4.0: A Review on Industrial Automation and Robotic. J. Teknol. 2016, 78, 137–143. [Google Scholar] [CrossRef] [Green Version]
  44. Lee, J.; Kao, H.A.; Yang, S. Service innovation and smart analytics for Industry 4.0 and big data environment, Product Services Systems and Value Creation. Procedia CIRP 2014, 16, 3–8. [Google Scholar] [CrossRef] [Green Version]
  45. Jeschke, S. Logistics 4.0—Artificial Intelligence and Other Modern Trends in Transport and Logistics. XIII Forum of Polish Logistics Managers POLISH LOGISTICS; Center for Innovation Management and Transfer of Technology in Warsaw, University of Technology: Warsaw, Poland, 2016. [Google Scholar]
  46. Barreto, L.; Amaral, A.; Pereira, T. Industry 4.0 implications in logistics: An overview. Procedia Manuf. 2017, 13, 1245–1252. [Google Scholar] [CrossRef]
  47. Timm, I.J.; Lorig, F. Logistics 4.0—A Challenge for Simulation. In Proceedings of the 2015 Winter Simulation Conference, Huntington Beach, CA, USA, 6–9 December 2015; Yilmaz, L., Chan, W.K.V., Moon, I., Roeder, T.M.K., Macal, C., Rossetti, M.D., Eds.; IEEE: Piscataway, NJ, USA, 2015; pp. 3118–3119. [Google Scholar] [CrossRef]
  48. Winkelhaus, S.; Grosse, E.H. Logistics 4.0: A systematic review towards a new logistics system. Int. J. Prod. Res. 2020, 58, 18–43. [Google Scholar] [CrossRef]
  49. Ng, T.C.; Lau, S.Y.; Ghobakhloo, M.; Fathi, M.; Liang, M.S. The Application of Industry 4.0 Technological Constituents for Sustainable Manufacturing: A Content-Centric Review. Sustainability 2022, 14, 4327. [Google Scholar] [CrossRef]
  50. Narula, S.; Puppala, H.; Kumar, A.; Frederico, G.F.; Dwivedy, M.; Prakash, S.; Talwar, V. Applicability of industry 4.0 technologies in the adoption of global reporting initiative standards for achieving sustainability. J. Clean. Prod. 2021, 305, 127141. [Google Scholar] [CrossRef]
  51. Javaid, M.; Haleem, A.; Vaishya, R.; Bahl, S.; Suman, R.; Vaish, A. Industry 4.0 technologies and their applications in fighting COVID-19 pandemic. Diabetes Metab. Syndr. Clin. Res. Rev. 2020, 14, 419–422. [Google Scholar] [CrossRef] [PubMed]
  52. Ding, Y.; Jin, M.; Li, S.; Feng, D. Smart logistics based on the internet of things technology: An overview. Int. J. Logist. Res. Appl. 2021, 24, 323–345. [Google Scholar] [CrossRef]
  53. Golpîra, H.; Khan, S.A.R.; Safaeipour, S. A review of logistics internet-of-things: Current trends and scope for future research. J. Ind. Inf. Integr. 2021, 22, 100194. [Google Scholar] [CrossRef]
  54. Tsang, Y.P.; Wu, C.H.; Lam, H.Y.; Choy, K.L.; Ho, G.T. Integrating Internet of Things and multi-temperature delivery planning for perishable food E-commerce logistics: A model and application. Int. J. Prod. Res. 2021, 59, 1534–1556. [Google Scholar] [CrossRef]
  55. Popescu, G.H.; Petreanu, S.; Alexandru, B.; Corpodean, H. Internet of Things-based real-time production logistics, cyber-physical process monitoring systems, and industrial artificial intelligence in sustainable smart manufacturing. J. Self-Gov. Manag. Econ. 2021, 9, 52–62. [Google Scholar] [CrossRef]
  56. Rey, A.; Panetti, E.; Maglio, R.; Ferretti, M. Determinants in adopting the Internet of Things in the transport and logistics industry. J. Bus. Res. 2021, 131, 584–590. [Google Scholar] [CrossRef]
  57. Vural, C.A.; Roso, V.; Halldórsson, Á.; Ståhle, G.; Yaruta, M. Can digitalization mitigate barriers to intermodal transport? An exploratory study. Res. Transp. Bus. Manag. 2020, 37, 100525. [Google Scholar] [CrossRef]
  58. Li, J.; Rombaut, E.; Vanhaverbeke, L. A systematic review of agent-based models for autonomous vehicles in urban mobility and logistics: Possibilities for integrated simulation models. Comput. Environ. Urban Syst. 2021, 89, 101686. [Google Scholar] [CrossRef]
  59. Willems, L. Understanding the Impacts of Autonomous Vehicles in Logistics. The Digital Transformation of Logistics: Demystifying Impacts of the Fourth Industrial Revolution. In The Digital Transformation of Logistics: Demystifying Impacts of the Fourth Industrial Revolution; Sullivan, M., Kern, J., Eds.; The Institute of Electrical and Electronics Engineers, Inc.: Piscataway, NJ, USA, 2021; pp. 113–127. [Google Scholar] [CrossRef]
  60. Abosuliman, S.S.; Almagrabi, A.O. Routing and scheduling of intelligent autonomous vehicles in industrial logistics systems. Soft Comput. 2021, 25, 11975–11988. [Google Scholar] [CrossRef]
  61. Liu, J.; Liu, Z.; Zhang, H.; Yuan, H.; Manokaran, K.B.; Maheshwari, M. Multi-sensor information fusion for IoT in automated guided vehicle in smart city. Soft Comput. 2021, 25, 12017–12029. [Google Scholar] [CrossRef]
  62. Niranjan, K.; Narayana, K.S.; Rao, M.N. Role of Artifical Intelligence in Logistics and Supply Chain. In Proceedings of the 2021 International Conference on Computer Communication and Informatics (ICCCI), Coimbatore, India, 27–29 January 2021; Available online: https://ieeexplore.ieee.org/abstract/document/9402625 (accessed on 11 January 2022).
  63. Liu, C.; Park, E.M.; Jiang, F. Examining effects of context-awareness on ambient intelligence of logistics service quality: User awareness compatibility as a moderator. J. Ambient Intell. Humaniz. Comput. 2020, 11, 1413–1420. [Google Scholar] [CrossRef]
  64. Moshood, T.D.; Nawanir, G.; Sorooshian, S.; Okfalisa, O. Digital Twins Driven Supply Chain Visibility within Logistics: A New Paradigm for Future Logistics. Appl. Syst. Innov. 2021, 4, 29. [Google Scholar] [CrossRef]
  65. Rejeb, A.; Keogh, J.G.; Leong, G.K.; Treiblmaier, H. Potentials and challenges of augmented reality smart glasses in logistics and supply chain management: A systematic literature review. Int. J. Prod. Res. 2021, 59, 3747–3776. [Google Scholar] [CrossRef]
  66. Silva, N.; Barros, J.; Santos, M.Y.; Costa, C.; Cortez, P.; Carvalho, M.S.; Gonçalves, J.N. Advancing logistics 4.0 with the implementation of a big data warehouse: A demonstration case for the automotive industry. Electronics 2021, 10, 2221. [Google Scholar] [CrossRef]
  67. Pujiarto, B.; Hanafi, M.; Setyawan, A.; Imani, A.N.; Prasetya, E.R. A Data Mining Practical Approach to Inventory Management and Logistics Optimization. Int. J. Inform. Inf. Syst. 2021, 4, 112–122. [Google Scholar] [CrossRef]
  68. Rejeb, A.; Rejeb, K.; Simske, S.; Treiblmaier, H. Blockchain Technologies in Logistics and Supply Chain Management: A Bibliometric Review. Logistics 2021, 5, 72. [Google Scholar] [CrossRef]
  69. Yi, H. A secure logistics model based on blockchain. Enterp. Inf. Syst. 2021, 15, 1002–1018. [Google Scholar] [CrossRef]
  70. Alakaş, H.M.; Eren, T. Integrated Systems and Utilization in Logistics. In Logistics 4.0 and Future of Supply Chains; İyigün, İ., Görçün, Ö.F., Eds.; Springer: Singapore, 2022; pp. 171–190. [Google Scholar]
  71. Chaising, S.; Haasis, H.D. Cloud computing for logistics and procurement services for SMEs and raw material suppliers. Int. J. Logist. Syst. Manag. 2021, 38, 459–474. [Google Scholar] [CrossRef]
  72. Fu, D.; Hu, S.; Zhang, L.; He, S.; Qiu, J. An intelligent cloud computing of trunk logistics alliance based on blockchain and big data. J. Supercomput. 2021, 77, 13863–13878. [Google Scholar] [CrossRef]
  73. Wu, J.; Wang, Y. Distribution of the emergency supplies in the COVID-19 pandemic: A cloud computing based approach. Math. Probl. Eng. 2021, 2021, 5972747. [Google Scholar] [CrossRef]
  74. Ellawala, N.H.; Sachitra, K.M.V. E-Marketplace in the Agricultural Sector in Sri Lanka: Challenges in Adoption. Asian J. Agric. Extension, Econ. Sociol. 2021, 39, 44–58. [Google Scholar] [CrossRef]
  75. Tamas, P.; Illes, B.; Banyai, T.; Toth, A.B.; Akylbek, U.; Skapinyecz, R. Intensifying Cross-border Logistics Collaboration Opportunities Using a Virtual Logistics Center. J. Eng. Res. Rep. 2020, 13, 1–7. [Google Scholar] [CrossRef]
  76. Bayraktar, A.N. 3D Printing and Logistics. In Logistics 4.0 and Future of Supply Chains; İyigün, İ., Görçün, Ö.F., Eds.; Springer: Singapore, 2022; pp. 63–82. [Google Scholar]
  77. Demir, E.; Eyers, D.; Huang, Y. Competing through the last mile: Strategic 3D printing in a city logistics context. Comput. Oper. Res. 2021, 131, 105248. [Google Scholar] [CrossRef]
  78. Mayershofer, C.; Fottner, J. Towards an Artificial Perception Framework for Autonomous Robots in Logistics. In Advances in Automotive Production Technology–Theory and Application; Weißgraeber, P., Heieck, F., Ackermann, C., Eds.; Springer Vieweg: Berlin/Heidelberg, Germany, 2021; pp. 407–415. [Google Scholar] [CrossRef]
  79. Mu, F.; Liu, C. Design and Research of Intelligent Logistics Robot based on STM32. Recent Adv. Electr. Electron. Eng. 2021, 14, 44–51. [Google Scholar] [CrossRef]
  80. Penadés-Plà, V.; García-Segura, T.; Martí, J.V.; Yepes, V. A review of multi-criteria decision-making methods applied to the sustainable bridge design. Sustainability 2016, 8, 1295. [Google Scholar] [CrossRef] [Green Version]
  81. Dalkey, N.C.; Helmer, O. An experimental application of the Delphi method to the use of experts. Manag. Sci. 1963, 9, 458–467. [Google Scholar] [CrossRef]
  82. Fishburn, P.C. Additive Utilities with Incomplete Product Sets: Application to Priorities and Assignments. Oper. Res. 1967, 15, 537–542. [Google Scholar] [CrossRef]
  83. Miller, D.W.; Starr, M.K. Executive Decisions and Operations Research; Prentice-Hall: Hoboken, NJ, USA, 1969. [Google Scholar]
  84. Zavadskas, E.; Kaklauskas, A. Determination of an Efficient Contractor by Using the New Method of Multicriteria Assessment. In International Symposium for the Organization and Management of Construction: Managing construction information; Retik, A., Langford, D.A., Eds.; Taylor & Francis: Oxfordshire, UK, 1996; pp. 94–104. [Google Scholar]
  85. Zavadskas, E.K.; Turskis, Z. A new additive ratio assessment (ARAS) method in multicriteria decisiondskas, E. Technol. Econ. Dev. Econ. 2010, 16, 159–172. [Google Scholar] [CrossRef]
  86. Hwang, C.L.; Yoon, K. Multiple Attribute Decision Making: Methods and Applications; Springer: New York, NY, USA, 1981. [Google Scholar]
  87. Opricovic, S. Multicriteria Optimization of Civil Engineering Systems; Faculty of Civil Engineering: Belgrade, Serbia, 1998. [Google Scholar]
  88. Brauers, W.K.; Zavadskas, E.K. The MOORA method and its application to privatization in a transition economy. Control Cybern. 2006, 35, 445–469. [Google Scholar]
  89. Brauers, W.K.M.; Zavadskas, E.K. Project Management by MULTIMOORA as an Instrument for Transition Economies. Technol. Econ. Dev. Econ. 2010, 16, 5–24. [Google Scholar] [CrossRef]
  90. Zavadskas, E.K.; Turskis, Z.; Antucheviciene, J.; Zakarevicius, A. Optimization of Weighted Aggregated Sum Product Assessment. Elektron. Elektrotech. 2012, 122, 3–6. [Google Scholar] [CrossRef]
  91. Ghorabaee, K.M.; Zavadskas, E.K.; Olfat, L.; Turskis, Z. Multi-criteria inventory classification using a new method of evaluation based on distance from average solution (EDAS). Informatica 2015, 26, 435–451. [Google Scholar] [CrossRef]
  92. Ghorabaee, K.M.; Zavadskas, E.K.; Turskis, Z.; Antucheviciene, J. A new combinative distance-based assessment (CODAS) method for multi-criteria decision-making. Econ. Comput. Econ. Cybern. Stud. Res. 2016, 50, 25–44. [Google Scholar]
  93. Stević, Ž.; Pamučar, D.; Puška, A.; Chatterjee, P. Sustainable supplier selection in healthcare industries using a new MCDM method: Measurement of alternatives and ranking according to COmpromise solution (MARCOS). Comput. Ind. Eng. 2020, 140, 106231. [Google Scholar] [CrossRef]
  94. Saaty, T.L. The Analytic Hierarchy Process; McGraw-Hill: New York, NY, USA, 1980. [Google Scholar]
  95. Costa, C.B.E.; Vansnick, J.C. MACBETH—An interactive path towards the construction of cardinal value functions. Int. Trans. Oper. Res. 1994, 1, 489–500. [Google Scholar] [CrossRef]
  96. Saaty, T.L. Decision Making with Dependence and Feedback: The Analytic Network Process; RWS Publications: Pittsburgh, PA, USA, 1996. [Google Scholar]
  97. Hansen, P.; Ombler, F. A new method for scoring additive multin, P.; Ombl value models using pairwise rankings of alternatives. J. Multi-Criteria Decis. Anal. 2008, 15, 87–107. [Google Scholar] [CrossRef]
  98. Keršuliene, V.; Zavadskas, E.K.; Turskis, Z. Selection of rational dispute resolution method by applying new stepulien weight assessment ratio analysis (SWARA). J. Bus. Econ. Manag. 2010, 11, 243–258. [Google Scholar] [CrossRef]
  99. Rezaei, J. Best-worst multi-criteria decision-making method. Omega 2015, 53, 49–57. [Google Scholar] [CrossRef]
  100. Pamučar, D.; Stević, Ž.; Sremac, S. A new model for determining weight coefficients of criteria in mcdm models: Full consistency method (FUCOM). Symmetry 2018, 10, 393. [Google Scholar] [CrossRef] [Green Version]
  101. Roy, B. Classement et choixenprésence de points de vue multiples (la méthode ELECTRE). Rev. Fr. Inform. Rech. Opér. 1968, 8, 57–75. (In French) [Google Scholar] [CrossRef]
  102. Brans, J.P. L’ingénierie de la Décision: Élaborationd’instrumentsd’aide à la Décision. La Méthode PROMETHEE; Presses de l’Université Laval, Université Laval, Faculté des sciences de l’administration: Québec, QC, Canada, 1982. (In French) [Google Scholar]
  103. Ginevičius, R. A new determining method for the criteria weights in multicriteria evaluation. Int. J. Inf. Technol. Decis. Mak. 2011, 10, 1067–1095. [Google Scholar] [CrossRef]
  104. Krylovas, A.; Zavadskas, E.K.; Kosareva, N.; Dadelo, S. New KEMIRA method for determining criteria priority and weights in solving MCDM problem. Int. J. Inf. Technol. Decis. Mak. 2014, 13, 1119–1133. [Google Scholar] [CrossRef]
  105. Pamučar, D.; Ćirović, G. The selection of transport and handling resources in logistics centers using Multi-Attributive Border Approximation area Comparison (MABAC). Expert Syst. Appl. 2015, 42, 3016–3028. [Google Scholar] [CrossRef]
  106. Hatefi, M.A. Indifference threshold-based attribute ratio analysis: A method for assigning the weights to the attributes in multiple attribute decision making. Appl. Soft Comput. 2019, 74, 643–651. [Google Scholar] [CrossRef]
  107. Roszkowska, E. Multi-criteria decision making models by applying the TOPSIS method to crisp and interval data. Mult. Criteria Decis. Mak. 2011, 6, 200–230. [Google Scholar]
  108. Opricovic, S.; Tzeng, G.H. Compromise solution by MCDM methods: A comparative analysis of VIKOR and TOPSIS. Eur. J. Oper. Res. 2004, 156, 445–455. [Google Scholar] [CrossRef]
  109. Çalık, A. A novel Pythagorean fuzzy AHP and fuzzy TOPSIS methodology for green supplier selection in the Industry 4.0 era. Soft Comput. 2021, 25, 2253–2265. [Google Scholar] [CrossRef]
  110. Alao, M.A.; Popoola, O.M.; Ayodele, T.R. Selection of waste-to-energy technology for distributed generation using IDOCRIW-Weighted TOPSIS method: A case study of the City of Johannesburg, South Africa. Renew. Energy 2021, 178, 162–183. [Google Scholar] [CrossRef]
  111. Zeng, J.; Lin, G.; Huang, G. Evaluation of the cost-effectiveness of Green Infrastructure in climate change scenarios using TOPSIS. Urban For. Urban Gree. 2021, 64, 127287. [Google Scholar] [CrossRef]
  112. Micale, R.; Marannano, G.; Giallanza, A.; Miglietta, P.P.; Agnusdei, G.P.; La Scalia, G. Sustainable vehicle routing based on firefly algorithm and TOPSIS methodology. Sustain. Futures 2019, 1, 100001. [Google Scholar] [CrossRef]
  113. Caterino, N.; Iervolino, I.; Manfredi, G.; Cosenza, E. A comparative analysis of decision making methods for the seismic retrofit of rc buildings. In Proceedings of the 14th World Conference on Earthquake Engineering, Beijing, China, 12–17 October 2008; Available online: http://wpage.unina.it/iuniervo/papers/09-01-0168.pdf (accessed on 10 January 2022).
  114. Opricovic, S.; Tzeng, G.H. Extended VIKOR method in comparison with outranking methods. Eur. J. Oper. Res. 2007, 178, 514–529. [Google Scholar] [CrossRef]
  115. Krstić, M.; Tadić, S.; Kovač, M.; Roso, V.; Zečević, S. A Novel Hybrid MCDM Model for the Evaluation of Sustainable Last Mile Solutions. Math. Probl. Eng. 2021, 2021, 5969788. [Google Scholar] [CrossRef]
  116. Wang, C.N.; Nguyen, N.A.T.; Dang, T.T.; Lu, C.M. A compromised decision-making approach to third-party logistics selection in sustainable supply chain using fuzzy AHP and fuzzy VIKOR methods. Mathematics 2021, 9, 886. [Google Scholar] [CrossRef]
  117. Lam, W.S.; Lam, W.H.; Jaaman, S.H.; Liew, K.F. Performance evaluation of construction companies using integrated entropy–fuzzy VIKOR model. Entropy 2021, 23, 320. [Google Scholar] [CrossRef] [PubMed]
  118. He, Y.; Lei, F.; Wei, G.; Wang, R.; Wu, J.; Wei, C. EDAS method for multiple attribute group decision making with probabilistic uncertain linguistic information and its application to green supplier selection. Int. J. Comput. Intell. 2019, 12, 1361–1370. [Google Scholar] [CrossRef] [Green Version]
  119. U-Dominic, C.M.; Orji, I.J.; Okwu, M. Analyzing the Barriers to Reverse Logistics (RL) Implementation: A Hybrid Model Based on IF-DEMATEL-EDAS. Sustainability 2021, 13, 876. [Google Scholar] [CrossRef]
  120. Rashid, T.; Ali, A.; Chu, Y.M. Hybrid BW-EDAS MCDM methodology for optimal industrial robot selection. PLoS ONE 2021, 16, e0246738. [Google Scholar] [CrossRef]
  121. Mukul, E.; Güler, M.; Büyüközkan, G. Evaluation of Clean Energy Alternatives with Hesitant Fuzzy Linguistic MCDM Methods. In INFUS 2021: Intelligent and Fuzzy Techniques for Emerging Conditions and Digital Transformation; Kahraman, C., Cebi, S., Onar, S.C., Oztaysi, B., Tolga, A.C., Sari, I.U., Eds.; Springer: Cham, Switzerland, 2021; pp. 325–332. [Google Scholar]
  122. Chakraborty, S. Applications of the MOORA method for decision making in manufacturing environment. Int. J. Adv. Manuf. 2011, 54, 1155–1166. [Google Scholar] [CrossRef]
  123. Attri, R.; Grover, S. Decision making over the production system life cycle: MOORA method. Int. J. Syst. Assur. Eng. Manag. 2014, 5, 320–328. [Google Scholar] [CrossRef]
  124. Ulutaş, A.; Karaköy, Ç. Evaluation of LPI Values of Transition Economies Countries with a Grey MCDM Model. In Handbook of Research on Applied AI for International Business and Marketing Applications; Christiansen, B., Škrinjarić, T., Eds.; IGI Global: Hershey, PA, USA, 2021; pp. 499–511. [Google Scholar] [CrossRef]
  125. Feizi, F.; Karbalaei-Ramezanali, A.A.; Farhadi, S. FUCOM-MOORA and FUCOM-MOOSRA: New MCDM-based knowledge-driven procedures for mineral potential mapping in greenfields. SN Appl. Sci. 2021, 3, 358. [Google Scholar] [CrossRef]
  126. Petrov, I. Renewable energies projects selection: Block criteria systematization with AHP and Entropy-MOORA methods in MCDM. E3S Web Conf. 2021, 327, 02004. [Google Scholar] [CrossRef]
  127. Karagoz, S.; Deveci, M.; Simic, V.; Aydin, N.; Bolukbas, U. A novel intuitionistic fuzzy MCDM-based CODAS approach for locating an authorized dismantling center: A case study of Istanbul. Waste Manag. Res. 2020, 38, 660–672. [Google Scholar] [CrossRef] [PubMed]
  128. Ulutas, A. A grey hybrid model to select the optimal third-party logistics provider. S. Afr. J. Ind. Eng. 2021, 32, 171–181. [Google Scholar] [CrossRef]
  129. Gorcun, O.F.; Senthil, S.; Küçükönder, H. Evaluation of tanker vehicle selection using a novel hybrid fuzzy MCDM technique. Decis. Mak. Appl. Manag. Eng. 2021, 4, 140–162. [Google Scholar] [CrossRef]
  130. Zandi, I.; Pahlavani, P.; Bigdeli, B. Combining CRITIC Objective Weighting Method with CODAS and VIKOR Methods for Selecting Prospect Hospital Sites (Case Study: District 5 of Tehran). Geogr. Urban Space Devel. 2021, 7, 41–63. (In Iranian) [Google Scholar] [CrossRef]
  131. Zolfani, H.S.; Aghdaie, M.H.; Derakhti, A.; Zavadskas, E.K.; Varzandeh, M.H.M. Decision making on business issues with foresight perspective; an application of new hybrid MCDM model in shopping mall locating. Expert Syst. Appl. 2013, 40, 7111–7121. [Google Scholar] [CrossRef]
  132. Zavadskas, E.K.; Chakraborty, S.; Bhattacharyya, O.; Antucheviciene, J. Application of WASPAS method as an optimization tool in non-traditional machining processes. Inf. Technol. Control 2015, 44, 77–88. [Google Scholar] [CrossRef] [Green Version]
  133. Simić, V.; Lazarević, D.; Dobrodolac, M. Picture fuzzy WASPAS method for selecting last-mile delivery mode: A case study of Belgrade. Eur. Transp. Res. Rev. 2021, 13, 43. [Google Scholar] [CrossRef]
  134. Saraswat, S.K.; Digalwar, A.K.; Yadav, S.S. Sustainability Assessment of Renewable and Conventional Energy Sources in India Using Fuzzy Integrated AHP-WASPAS Approach. J. Mult.-Valued Log. Soft Comput. 2021, 37, 335–362. [Google Scholar] [CrossRef]
  135. Sokolović, J.; Stanujkić, D.; Štirbanović, Z. Selection of process for aluminium separation from waste cables by TOPSIS and WASPAS methods. Miner. Eng. 2021, 173, 107186. [Google Scholar] [CrossRef]
  136. Stanković, M.; Stević, Ž.; Das, D.K.; Subotić, M.; Pamučar, D. A new fuzzy MARCOS method for road traffic risk analysis. Mathematics 2020, 8, 457. [Google Scholar] [CrossRef] [Green Version]
  137. Kovač, M.; Tadić, S.; Krstić, M.; Bouraima, M.B. Novel Spherical Fuzzy MARCOS Method for Assessment of Drone-Based City Logistics Concepts. Complexity 2021, 2021, 2374955. [Google Scholar] [CrossRef]
  138. Blagojević, A.; Kasalica, S.; Stević, Ž.; Tričković, G.; Pavelkić, V. Evaluation of safety degree at railway crossings in order to achieve sustainable traffic management: A novel integrated fuzzy MCDM model. Sustainability 2021, 13, 832. [Google Scholar] [CrossRef]
  139. Torkayesh, A.E.; Torkayesh, S.E. Evaluation of information and communication technology development in G7 countries: An integrated MCDM approach. Technol. Soc. 2021, 66, 101670. [Google Scholar] [CrossRef]
  140. Guo, S.; Zhao, H. Fuzzy best-worst multi-criteria decision-making method and its applications. Knowl. -Based Syst. 2017, 121, 23–31. [Google Scholar] [CrossRef]
  141. Sarabi, E.P.; Darestani, S.A. Developing a decision support system for logistics service provider selection employing fuzzy MULTIMOORA & BWM in mining equipment manufacturing. Appl. Soft Comput. 2021, 98, 106849. [Google Scholar] [CrossRef]
  142. Mostafa, A.M. An MCDM Approach for Cloud Computing Service Selection Based on Best-Only Method. IEEE Access 2021, 9, 155072–155086. [Google Scholar] [CrossRef]
  143. Liang, X.; Chen, T.; Ye, M.; Lin, H.; Li, Z. A hybrid fuzzy BWM-VIKOR MCDM to evaluate the service level of bike-sharing companies: A case study from Chengdu, China. J. Clean. Prod. 2021, 298, 126759. [Google Scholar] [CrossRef]
  144. Lasi, H.; Kemper, H.G.; Fettke, P.; Feld, T.; Hoffmann, M. Industry 4.0. Bus. Inf. Syst. Eng. 2014, 4, 239–242. [Google Scholar] [CrossRef]
  145. Islam, D.M.Z.; Meier, J.F.; Aditjandra, P.T.; Zunder, T.H.; Pace, G. Logistics and Supply Chain Management. Res. Transp. Econ. 2013, 41, 3–16. [Google Scholar] [CrossRef]
  146. Gudehus, T.; Kotzab, H. ComprehensiveLogistics; Springer: Berlin/Heidelberg, Germany, 2009. [Google Scholar]
  147. Lu, Y.; Papagiannidis, S.; Alamanos, E. Internet of things: A systematic review of the business literature from the user and organisational perspectives. Technol. Forecast. Soc. Chang. 2018, 136, 285–297. [Google Scholar] [CrossRef] [Green Version]
  148. Kim, S.; Kim, S. A multi-criteria approach toward discovering killer IoT application in Korea. Technol. Forecast. Soc. Chang. 2016, 102, 143–155. [Google Scholar] [CrossRef]
  149. Gu, Y.; Liu, Q. Research on the application of the internet of things in reverse logistics information management. Int. J. Ind. Eng. Manag. 2013, 6, 963–973. [Google Scholar] [CrossRef] [Green Version]
  150. Mboli, J.S.; Thakker, D.; Mishra, J.L. An Internet of Things-enabled decision support system for circular economy business model. Softw.-Pract. Exp. 2020, 52, 772–787. [Google Scholar] [CrossRef]
  151. Thürer, M.; Pan, Y.H.; Qu, T.; Luo, H.; Li, C.D.; Huang, G.Q. Internet of Things (IoT) driven kanban system for reverse logistics: Solid waste collection. J. Intell. Manuf. 2019, 30, 2621–2630. [Google Scholar] [CrossRef]
  152. Garrido-Hidalgo, C.; Olivares, T.; Ramirez, F.J.; Roda-Sanchez, L. An end-to-end internet of things solution for reverse supply chain management in industry 4.0. Comput. Ind. 2019, 112, 103127. [Google Scholar] [CrossRef]
  153. Joshi, A.D.; Gupta, S.M. Evaluation of design alternatives of End-Of-Life products using internet of things. Int. J. Prod. Econ. 2019, 208, 281–293. [Google Scholar] [CrossRef]
  154. Jünemann, R.; Schmidt, T. Materialflußsysteme: Systemtechnische Grundlagen; Springer: Berlin/Heidelberg, Germany, 2020. (In German) [Google Scholar]
  155. Sathiya, V.; Chinnadurai, M.; Ramabalan, S.; Appolloni, A. Mobile robots and evolutionary optimization algorithms for green supply chain management in a used-car resale company. Environ. Dev. Sustain. 2021, 23, 9110–9138. [Google Scholar] [CrossRef]
  156. Ubare, V.; Soundattikar, S.A.; Tech, M. Design and Development of Automated Guided Vehicle for Collection, Sorting and Disposal of Metal Chips in Mechanical Workshop. Int. J. Trend Innov. Res. 2020, 2, 1–5. [Google Scholar]
  157. Sambhi, S.; Dahiya, P. Reverse vending machine for managing plastic waste. Int. J. Syst. Assur. Eng. Manag. 2020, 11, 635–640. [Google Scholar] [CrossRef]
  158. Hardai, I.; Illés, B.; Bányai, Á. Efficiency improvement of reverse logistics in industry 4.0 environment. In Solutions for Sustainable Development; Tóthné, K.S., Jármai, K., Voith, K., Eds.; CRC Press: Boca Raton, FL, USA, 2019; pp. 169–177. [Google Scholar]
  159. Kutila, M.; Viitanen, J.; Vattulainen, A. Scrap metal sorting with colour vision and inductive sensor array, paper presented. In Proceedings of the International Conference on Computational Intelligence for Modelling, Control and Automation and International Conference on Intelligent Agents, Web Technologies and Internet Commerce (CIMCA-IAWTIC’06), Vienna, Austria, 28–30 November 2005; pp. 725–729. Available online: https://ieeexplore.ieee.org/document/1631224 (accessed on 10 January 2022).
  160. Berman, D. Transforming Urban Logistics: Our Investment in Gatik. 2019. Available online: https://medium.com/innovationendeavors/transforming-urban-logistics-our-investment-in-gatik-ai-70732fc6a831 (accessed on 11 November 2021).
  161. Fowler, V.; Medlin, D.B.; Vannoy, S.A. Reverse Logistics: Scenarios Related to Drone Deliveries and Returns. In Proceedings of the Appalachian Research in Business Symposium, East Tennessee State University, Richmond, VA, USA, 22–23 March 2018; pp. 54–58. Available online: https://encompass.eku.edu/cgi/viewcontent.cgi?article=1340&context=fs_research#page=56 (accessed on 10 January 2022).
  162. Christensen, J. Reverse Logistics: How to Manage E-Commerce Returns with Automation. 2021. Available online: https://hub.seegrid.com/blog/reverse-logistics-how-to-manage-ecommerce-returns-with-automation (accessed on 11 November 2021).
  163. Le Moigne, R. Reverse Logistics, the Circular Economy Weakest Link. 2020. Available online: https://www.renewablematter.eu/articles/article/reverse-logistics-the-circular-economy-weakest-link (accessed on 11 November 2021).
  164. Copeland, B.J. Artificial Intelligence; Encyclopædia Britannica, Inc.: Chicago, IL, USA, 2020. [Google Scholar]
  165. Wilson, M.; Paschen, J.; Pitt, L. The circular economy meets artificial intelligence (AI): Understanding the opportunities of AI for reverse logistics. Manag. Environ. Qual. 2021, 33, 9–25. [Google Scholar] [CrossRef]
  166. Xing, B.; Gao, W.J.; Battle, K.; Marwala, T.; Nelwamondo, F.V. Artificial Intelligence in Reverse Supply Chain Management. In Proceedings of the Twenty-First Annual Symposium of the Pattern Recognition Association of South Africa, Stellenbosch, South Africa, 22–23 November 2010; Available online: https://arxiv.org/ftp/arxiv/papers/1012/1012.4046.pdf (accessed on 11 January 2021).
  167. Wu, X.; Zhu, X.; Wu, G.; Ding, W. Data mining with big data. IEEE Trans. Knowl. Data Eng. 2014, 26, 97–107. [Google Scholar] [CrossRef]
  168. Clifton, C. Data Mining; Encyclopædia Britannica, Inc.: Chicago, IL, USA, 2019. [Google Scholar]
  169. Ghosh, D. Big Data in Logistics and Supply Chain Management—A rethinking step. In Proceedings of the International Symposium on Advanced Computing and Communication (ISACC), Silchar, India, 14–15 September 2015; pp. 168–173. Available online: https://ieeexplore.ieee.org/abstract/document/7377336 (accessed on 10 January 2021).
  170. Pushpamali, N.N.C.; Agdas, D.; Rose, T.M. A review of reverse logistics: An upstream construction supply chain perspective. Sustainability 2019, 11, 4143. [Google Scholar] [CrossRef] [Green Version]
  171. Bag, S.; Luthra, S.; Mangla, S.K.; Kazancoglu, Y. Leveraging big data analytics capabilities in making reverse logistics decisions and improving remanufacturing performance. Int. J. Logist. Manag. 2021, 32, 742–765. [Google Scholar] [CrossRef]
  172. Govindan, K.; Gholizadeh, H. Robust network design for sustainable-resilient reverse logistics network using big data: A case study of end-of-life vehicles. Transp. Res. E Logist. Transp. Rev. 2021, 149, 102279. [Google Scholar] [CrossRef]
  173. Nguyen, T.; Li, Z.H.O.U.; Spiegler, V.; Ieromonachou, P.; Lin, Y. Big data analytics in supply chain management: A state-of-the-art literature review. Comput. Oper. Res. 2018, 98, 254–264. [Google Scholar] [CrossRef] [Green Version]
  174. Yang, H.L.; Wang, C.S. Integrated framework for reverse logistics. In New Trends in Applied Artificial Intelligence; Okuno, H.G., Ali, M., Eds.; Springer: Berlin/Heidelberg, Germany, 2007; pp. 501–510. [Google Scholar] [CrossRef] [Green Version]
  175. Pilkington, M. Blockchain Technology: Principles and Applications. In Research Handbook on Digital Transformations; Olleros, F.X., Zhegu, M., Eds.; Edward Elgar Publishing: Cheltenham, UK, 2016; pp. 1–39. [Google Scholar]
  176. Shih, D.H.; Huang, F.C.; Chieh, C.Y.; Shih, M.H.; Wu, T.W. Preventing Return Fraud in Reverse Logistics—A Case Study of ESPRES Solution by Ethereum. J. Theor. Appl. Electron. Commer. Res. 2021, 16, 121. [Google Scholar] [CrossRef]
  177. Centobelli, P.; Cerchione, R.; Del Vecchio, P.; Oropallo, E.; Secundo, G. Blockchain technology for bridging trust, traceability and transparency in circular supply chain. Inf. Manag. 2021, 2021, 103508. [Google Scholar] [CrossRef]
  178. Farouk, M.; Darwish, S.M. Reverse Logistics Solution in e-Supply Chain Management by Blockchain Technology. Egypt. Comp. Sci. J. 2020, 44, 22–34. [Google Scholar]
  179. Mell, P.; Grance, T. The NIST Definition of Cloud Computing: Recommendations of the National Institute of Standards and Technology; U.S. Department of Commerce, National Institute of Standards and Technology: Gaithersburg, MD, USA, 2011.
  180. Li, J.Q.; Wang, J.D.; Pan, Q.K.; Duan, P.Y.; Sang, H.Y.; Gao, K.Z.; Xue, Y. A hybrid artificial bee colony for optimizing a reverse logistics network system. Soft Comput. 2017, 21, 6001–6018. [Google Scholar] [CrossRef]
  181. Dos Santos, R.F.; Marins, F.A.S. Integrated model for reverse logistics management of electronic products and components. Procedia Comput. Sci. 2015, 55, 575–585. [Google Scholar] [CrossRef] [Green Version]
  182. Eng, T.Y. The role of e-marketplaces in supply chain management. Ind. Mark. Manag. 2004, 33, 97–105. [Google Scholar] [CrossRef]
  183. Kokkinaki, A.; Zuidwijk, R.; van Nunen, J.; Dekker, R. Information and communication technology enabling reverse logistics. In Reverse Logistics; Dekker, R., Fleischmann, M., Inderfurth, K., Van Wassenhove, L.N., Eds.; Springer: Berlin/Heidelberg, Germany, 2004; pp. 381–405. [Google Scholar] [CrossRef]
  184. Yang, Y.; Hao-yu, W. Mechanism of Logistics Information in reverse tracking system under e-commerce. In Proceedings of the IEEE International Conference on Service Operations, Logistics and Informatics, Beijing, China, 10–12 July 2011; pp. 177–181. [Google Scholar] [CrossRef]
  185. Mckinnon, A.C. The Possible Impact of 3D Printing and Drones on Last-Mile Logistics: An Exploratory Study. Built Environ. 2016, 42, 617–629. [Google Scholar] [CrossRef]
  186. Strong, D.; Kay, M.; Wakefield, T.; Sirichakwal, I.; Conner, B.; Manogharan, G. Rethinking reverse logistics: Role of additive manufacturing technology in metal remanufacturing. J. Manuf. Technol. Manag. 2020, 31, 124–144. [Google Scholar] [CrossRef]
  187. Santander, P.; Sanchez, F.A.C.; Boudaoud, H.; Camargo, M. Closed loop supply chain network for local and distributed plastic recycling for 3D printing: A MILP-based optimization approach. Resour. Conserv. Recycl. 2020, 154, 104531. [Google Scholar] [CrossRef] [Green Version]
  188. Królikowski, T.; Strulak-Wójcikiewicz, R.; Nikończuk, P.; Zmuda-Trzebiatowski, P.; Deja, A. Small-lot Production with Additive Production Using Reverse Logistics and IT Solutions in COVID-19 Era. Eur. Res. Stud. 2020, 23, 569–579. [Google Scholar] [CrossRef]
  189. DHL. Robotics in Logistics: A DPDHL Perspective on Implications and Use Cases for the Logistics Industry; DHL Customer Solutions & Innovation: Troisdorf, Germany, 2016. [Google Scholar]
  190. Alvarez, E.; Renteria, A. Collaborative robots in e-waste management. Procedia Manuf. 2017, 11, 55–62. [Google Scholar] [CrossRef] [Green Version]
  191. Kumar, A.; Agrawal, R.; Wankhede, V.A.; Sharma, M.; Mulat-Weldemeskel, E. A framework for assessing social acceptability of industry 4.0 technologies for the development of digital manufacturing. Technol. Forecast. Soc. Chang. 2022, 174, 121217. [Google Scholar] [CrossRef]
  192. Jamwal, A.; Agrawal, R.; Sharma, M.; Kumar, V.; Kumar, S. Developing A sustainability framework for Industry 4.0. Procedia CIRP 2021, 98, 430–435. [Google Scholar] [CrossRef]
  193. Chang, S.C.; Chang, H.H.; Lu, M.T. Evaluating Industry 4.0 Technology Application in SMEs: Using a Hybrid MCDM Approach. Mathematics 2021, 9, 414. [Google Scholar] [CrossRef]
  194. Mahdiraji, A.H.; Zavadskas, K.E.; Skare, M.; Kafshgar, R.F.Z.; Arab, A. Evaluating strategies for implementing industry 4.0: A hybrid expert oriented approach of BWM and interval valued intuitionistic fuzzy TODIM. Econ. Res.-Ekon. Istraz. 2020, 33, 1600–1620. [Google Scholar] [CrossRef]
  195. Kaya, I.; Erdoğan, M.; Karaşan, A.; Özkan, B. Creating a road map for industry 4.0 by using an integrated fuzzy multicriteria decision-making methodology. Soft Comput. 2020, 24, 17931–17956. [Google Scholar] [CrossRef]
  196. Sriram, R.M.; Vinodh, S. Analysis of readiness factors for Industry 4.0 implementation in SMEs using COPRAS. Int. J. Qual. Reliab. Manag. 2020, 38, 1178–1192. [Google Scholar] [CrossRef]
  197. Moktadir, M.A.; Ali, S.M.; Kusi-Sarpong, S.; Shaikh, M.A.A. Assessing challenges for implementing Industry 4.0: Implications for process safety and environmental protection. Process Saf. Environ. Prot. 2018, 117, 730–741. [Google Scholar] [CrossRef]
  198. Si, J.; Marjanovic-Halburd, L.; Nasiri, F.; Bell, S. Assessment of building-integrated green technologies: A review and case study on applications of Multi-Criteria Decision Making (MCDM) method. Sustain. Cities Soc. 2016, 27, 106–115. [Google Scholar] [CrossRef]
  199. Statista. Available online: https://www.statista.com/statistics/1189076/covid-19-e-commerce-growth-europe-country/ (accessed on 9 December 2021).
Figure 1. Conceptual framework of the MCDM model.
Sustainability 14 05632 g001
Figure 2. Comparison of COBRA with most used distance based MCDM methods.
Sustainability 14 05632 g002
Figure 3. Sensitivity analysis.
Sustainability 14 05632 g003
Table 1. Review of applicable Industry 4.0 technologies in logistics.
TechnologyLiterature Sources
Internet of Things (IoT)[52,53,54,55,56,57]
Autonomous and Automated Guided Vehicles (AV and AGV)[58,59,60,61]
Artificial (and Ambient) Intelligence (AI and AmI) and Augmented (and Virtual) reality (AR and VR)[62,63,64,65]
Big data (BD) and Data mining (DM)[57,66,67]
Data security and Blockchain (BC)[57,68,69]
Management systems (MS) and Cloud Computing (CC)[57,70,71,72,73]
Electronic Marketplace and Mobile Marketplace (E/M Marketplace)[74,75]
3D printing[76,77]
Advanced robotics[78,79]
Table 2. Most known and most used MCDM methods.
NameAcronymSourcesGroup
“Delphi”/[81]S
“Weighted Sum Model”WSM[82]
“Weighted Product Model”WPM[83]
“Complex Proportional Assessment”COPRAS[84]
“Additive Ratio Assessment”ARAS[85]
“Technique for Order of Preference by Similarity to Ideal Solution”TOPSIS[86]DB
“VIšeKriterijumska Optimizacija I Kompromisno Rešenje”VIKOR[87]
“Multi-Objective Optimization by
*Ratio Analysis (plus the full MULTIplicative form)”
(MULTI)MOORA[88,89]
“Weighted Aggregated Sum Product Assessment”WASPAS[90]
“Evaluation based on Distance from Average Solution”EDAS[91]
“Combinative Distance-based Assessment”CODAS[92]
“Measurement of Alternatives and Ranking according to Compromise Solution”MARCOS[93]
“Analytic Hierarchy Process”AHP[94]PC
“Measuring Attractiveness through a Categorical-Based Evaluation Technique”MACBETH[95]
“Analytical Network Process”ANP[96]
“Potentially All Pairwise RanKings of all possible Alternatives”PAPRIKA[97]
“Step-wise Weight Assessment Ratio Analysis”SWARA[98]
“Best—worst Method”BWM[99]
“FUll Consistency Method”FUCOM[100]
“ÉLimination et Choix Traduisant la REalité”ELECTRE[101]O
“Preference Ranking Organization METHod for Enrichment of Evaluations”PROMETHEE[102]
“Factor Relationship”FARE[103]
“Kemeny Median Indicator Ranks Accordance”KEMIRA[104]
“Multi-Attributive Border Approximation area Comparison”MABAC[105]
“Indifference Threshold-based Attribute Ratio Analysis”ITARA[106]
Table 3. Evaluation scale.
Linguistic EvaluationAbbreviationNumerical Value
NoneN1
Very LowVL2
LowL3
Fairly LowFL4
MediumM5
Fairly HighFH6
HighH7
Very HighVH8
Extremely HighEH9
Table 4. Criteria for the evaluation of the Industry 4.0 technology applicability in RL.
Criteria GroupCriterion
TechnologicalC1—Degree of development
C2—Possibility of integration (modularity)
C3—Complexity of implementation
C4—Possibility of standardization
C5—Adaptability
Socio-politicalC6—Safety
C7—Labor market impact
C8—Environmental impact
C9- Cultural framework
C10—Political framework
C11—Regulatory framework
Economic-operationalC12—Implementation costs
C13—Energy consumption efficiency
C14—Security
C15—Organizational readiness
C16—Logistics service quality
Table 5. Criteria weights obtained by using the BWM method.
CriterionBest/WorstBest over Other e b j Other over Worst e j w w j
C1 L3H70.082
C2 FL4FH60.061
C3 VL2VH80.123
C4 EH9N10.027
C5 VH8VL20.031
C6 H7L30.035
C7 FH6FL40.041
C8 M5M50.049
C9CWEH9/10.018
C10 H7L30.035
C11 FL4FH60.061
C12CB/1EH90.202
C13 M5M50.049
C14 H7L30.035
C15 EH9N10.027
C16 VL2VH80.123
Table 6. Evaluations of the technologies in relation to the criteria.
T1T2T3T4T5T6T7T8T9T10
C1HVHVLLMHFHEHFLM
C2EHVLLHHVHHMFLVL
C3HLVLFLVHHVHVHFHL
C4MHFHVLMFHFHFHLM
C5VHVLLFHVHEHFHFHFLVL
C6HFHLFHLFLMMMEH
C7VHLMFLHVHFHLLN
C8HLFHFHVLVLVLFLFHVL
C9FLFHLLMVHHEHFHL
C10FHMMHMMHVHMFL
C11HVHVLFLHFHEHVHHVH
C12HVLNFLHVHVHHML
C13VHHFHHHVLVLHFHM
C14FLFLVLFHFHEHFHFHMFL
C15FHMLFHHVHHFHMFL
C16EHMFHHVHMVHVHML
Table 7. The results of COBRA method application for ranking the Industry 4.0 technologies.
T1T2T3T4T5T6T7T8T9T10
d(PIS)0.0470.2100.2540.1540.0720.0880.0680.0590.1320.211
d(NIS)0.2360.0940.0630.1250.2230.2320.2470.2320.1430.082
d(AS+)0.0760.0260.0150.0230.0660.0830.0870.0730.0160.017
d(AS)0.0050.0990.1350.0520.0180.0340.0270.0100.0300.094
dC−0.0650.0470.0780.014−0.050−0.048−0.060−0.0590.0010.051
Rank18107452369
Table 8. Comparison of COBRA with most used distance based MCDM methods.
T1T2T3T4T5T6T7T8T9T10
COBRA18107452369
TOPSIS19107453268
VIKOR18107453269
CODAS18107542369
EDAS18106543279
MOORA18107543269
WASPAS18107453269
MARCOS18107453269
Table 9. Spearman correlation test for the distance based MCDMs.
COBRATOPSISVIKORCODASEDASMOORAWASPASMARCOS
COBRA1.000000.975760.987880.987880.963640.975760.987880.98788
TOPSIS 1.000000.987880.963640.963640.975760.987880.98788
VIKOR 1.000000.975760.975760.987881.000001.00000
CODAS 1.000000.975760.987880.975760.97576
EDAS 1.000000.987880.975760.97576
MOORA 1.000000.987880.98788
WASPAS 1.000001.00000
MARCOS 1.00000
Table 10. Sensitivity analysis.
T1T2T3T4T5T6T7T8T9T10
Sc.0dC−0.0650.0470.0780.014−0.050−0.048−0.060−0.0590.0010.051
Rank18107452369
Sc.1dC−0.0340.0140.0350.007−0.015−0.021−0.015−0.0260.0080.029
Rank18106435279
Sc.2dC−0.0430.0160.0380.008−0.027−0.011−0.025−0.0370.0060.036
Rank18107354269
Sc.3dC−0.0600.0400.0680.010−0.040−0.043−0.051−0.0490.0040.044
Rank18107542369
Sc.4dC−0.0580.0450.0800.018−0.046−0.054−0.056−0.055−0.0040.042
Rank19107542368
Sc.5dC−0.026−0.0010.0240.006−0.004−0.008−0.003−0.0180.0060.013
Rank16107435289
Publisher’s Note: MDPI stays neutral with regard to jurisdictional claims in published maps and institutional affiliations.

