Article

A Comparison of Functional Fillers—Greenhouse Gas Emissions and Air Pollutants from Lignin-Based Filler, Carbon Black and Silica

1
Bioenergy Systems Department, DBFZ Deutsches Biomasseforschungszentrum Gemeinnützige GmbH, 04347 Leipzig, Germany
2
Biorefineries Department, DBFZ Deutsches Biomasseforschungszentrum Gemeinnützige GmbH, 04347 Leipzig, Germany
3
Helmholtz Centre for Environmental Research—UFZ, 04318 Leipzig, Germany
*
Author to whom correspondence should be addressed.
Sustainability 2022, 14(9), 5393; https://doi.org/10.3390/su14095393
Submission received: 30 March 2022 / Revised: 25 April 2022 / Accepted: 26 April 2022 / Published: 29 April 2022
(This article belongs to the Section Air, Climate Change and Sustainability)

Abstract

:
The transformation from a fossil-based economy to a sustainable and circular bioeconomy is urgently needed to achieve the climate targets of the Paris Agreement, reduce air pollution and ensure a long-term competitive economy. Due to its carbonaceous and aromatic basic components, lignin has the potential for material valorization within bioeconomy. So far, lignin produced in the pulp and paper industry has mainly been used internally to generate thermal process energy, as it is difficult to extract it from biomass in a pure and unaltered form. The valorization of lignin to improve the economics of pulp mills is a current aim of the industry. Hydrothermal treatment (HTT) of a partial flow from the lignin stream to produce a functional filler for use in polymer blends is one valorization option. The environmental assessment of the lignin-based HTT filler, conducted using life cycle assessment (LCA), shows that substitution of the conventional fillers carbon black and silica could be associated with significant reductions in greenhouse gas emissions and air pollutants. Depending on the allocation methodology and the reference filler considered, approx. 5 kg CO2 eq./kg filler, 80–93% SO2 emissions, 27–79% PM emissions, and 88–98% PAH emissions can be saved.

1. Introduction

Efficient, sustainable and circular use of biological resources in line with the United Nations Sustainable Development Goals [1] and replacing the use of finite and fossil resources is central to the success of the global, European and national bioeconomy [2,3,4]. This transformation is necessary to achieve the climate targets of the Paris Agreement [5], to contribute to the reduction of pollutant emissions and, at the same time, to ensure a long-term competitive economy [2,3]. The chemical industry, as a very important and energy-intensive sector, also needs to be further transformed towards a bio-based circular economy. This sector, among others, shows a significant potential of carbon sequestration in durable products (e.g., biopolymers) and the substitution of fossil resources [2].
Due to its carbonaceous and aromatic basic components, lignin has a potential for material valorization within the chemical and bio-based industry [6,7]. Currently, lignin accounts for 1% of the bio-based feedstocks for plastics/polymers [8]. So far, lignin produced in the pulp and paper industry has mainly been used internally in order to produce thermal process energy [9]. Since lignin is a by-product of paper mills, process optimization mainly focused on the qualitative and quantitative yields of cellulose [10]. The valorization of lignin to improve the economics of the process is a current aim of the industry [9]. The main problem of lignin processing is the difficulty to extract it from biomass in a pure and unaltered form and, moreover, derivatives that can be obtained from lignin can also be extracted more cheaply from petrochemical processes [11].
Since at most pulp mill and biorefinery sites, excess energy is produced by burning the lignin, a partial flow of lignin can also be upgraded to bio-based fillers via hydrothermal treatment (HTT) and thus be used for material purposes [12]. HTT is a wet, relatively low-temperature (180–350 °C) process working with autogenous pressures slightly above the water saturation pressure. The first experiments were conducted by Bergius in 1913 in order to produce coal from cellulose [13]. The underlying reaction mechanisms of the treatment process such as hydrolysis, condensation, dehydration, and decarboxylation were examined by Titirici et al. [14], Sevilla and Fuertes [15,16] and Funke and Ziegler [17]. To date, HTT is a powerful method for waste management; however, utilization of HTT char is so far mostly focusing on energetic options. The use of hydrothermally treated lignin as a reinforcing filler was not yet examined.
In this study, functional fillers have been developed via HTT of lignin for further application in polymer blends used, e.g., in car tires or window sealings. This could replace conventional fillers such as carbon black or silica, which are based on finite and fossil resources and are accordingly associated with emissions that are harmful to the climate and health. Lignin for direct application as a functional filler is mentioned in the literature as a substitute for industrial carbon black [18,19,20,21]. However, no sufficient reinforcing effect of lignin has been found so far. The challenge in developing such a lignin-based filler is to create a particle size and structure comparable to carbon black and thus to achieve a comparable or better reinforcing effect in polymer applications. These properties can be achieved by a hydrothermal treatment due to the reduction of functional groups of the lignin producing a relatively non-reactive and thermally stable char with a higher surface area compared to unprocessed lignin [22].
In addition, HTT of biomass such as sewage sludge, green or food waste, and agricultural residues has already been environmentally assessed several times by means of life cycle assessment (LCA). Most of these studies involved the treatment of these wet biomasses for better handling and storage for subsequent energy production [23,24,25,26,27,28,29,30,31,32]. Publications on HTT’s LCA of processing organic waste or residues for material use are scarce [33,34]. There are also only a few publications where an LCA of organic biopolymers based on lignin has been carried out [35,36,37]. However, these biopolymers were not produced via the HTT process. In Haylock and Rosentrater [38], different biomasses have been considered as raw materials for bio-based fillers. However, only the possibility of using lignin is mentioned here, as other biomasses such as dried distillers grains with solubles (DDGS), hemp, rice husks, and wood pulp have been investigated in detail by means of LCA. A detailed environmental assessment of lignin-based fillers produced via HTT as a basis for biopolymer blends has not yet been conducted, to our knowledge.
Behind this background, the aim of this study was to compare the lignin-based HTT filler with the conventional finite-resource-based fillers carbon black and silica by means of LCA. The hypothesis is that there is a potential environmental benefit if both conventional reference fillers are substituted by the HTT filler. Within this comparison, the greenhouse gas (GHG) emissions are considered with priority in the context of the urgent need for climate protection. In addition, air emissions such as sulphur dioxide (SO2), nitrogen oxide (NOx), polycyclic aromatic hydrocarbons (PAH) and particulate matter (PM) emissions are also determined, as these are also under discussion due to their potentially negative air pollution and health impacts. The comparison between the lignin-based HTT filler and the conventional reference filler carbon black and silica focuses only on the production of the filler (cradle-to-gate). The use of it in polymer blends, e.g., for car tires or sealings, and the end of life phase are not taken into account. It is known that each filler is produced in a specially modified way for its later application and then mixed individually into polymers blends. Therefore it probably cannot be replaced one-to-one at will. However, in this paper the results of 1 kg of each filler shall be compared in a simplified manner in order to obtain an initial trend with regard to environmental impacts.

2. Methods

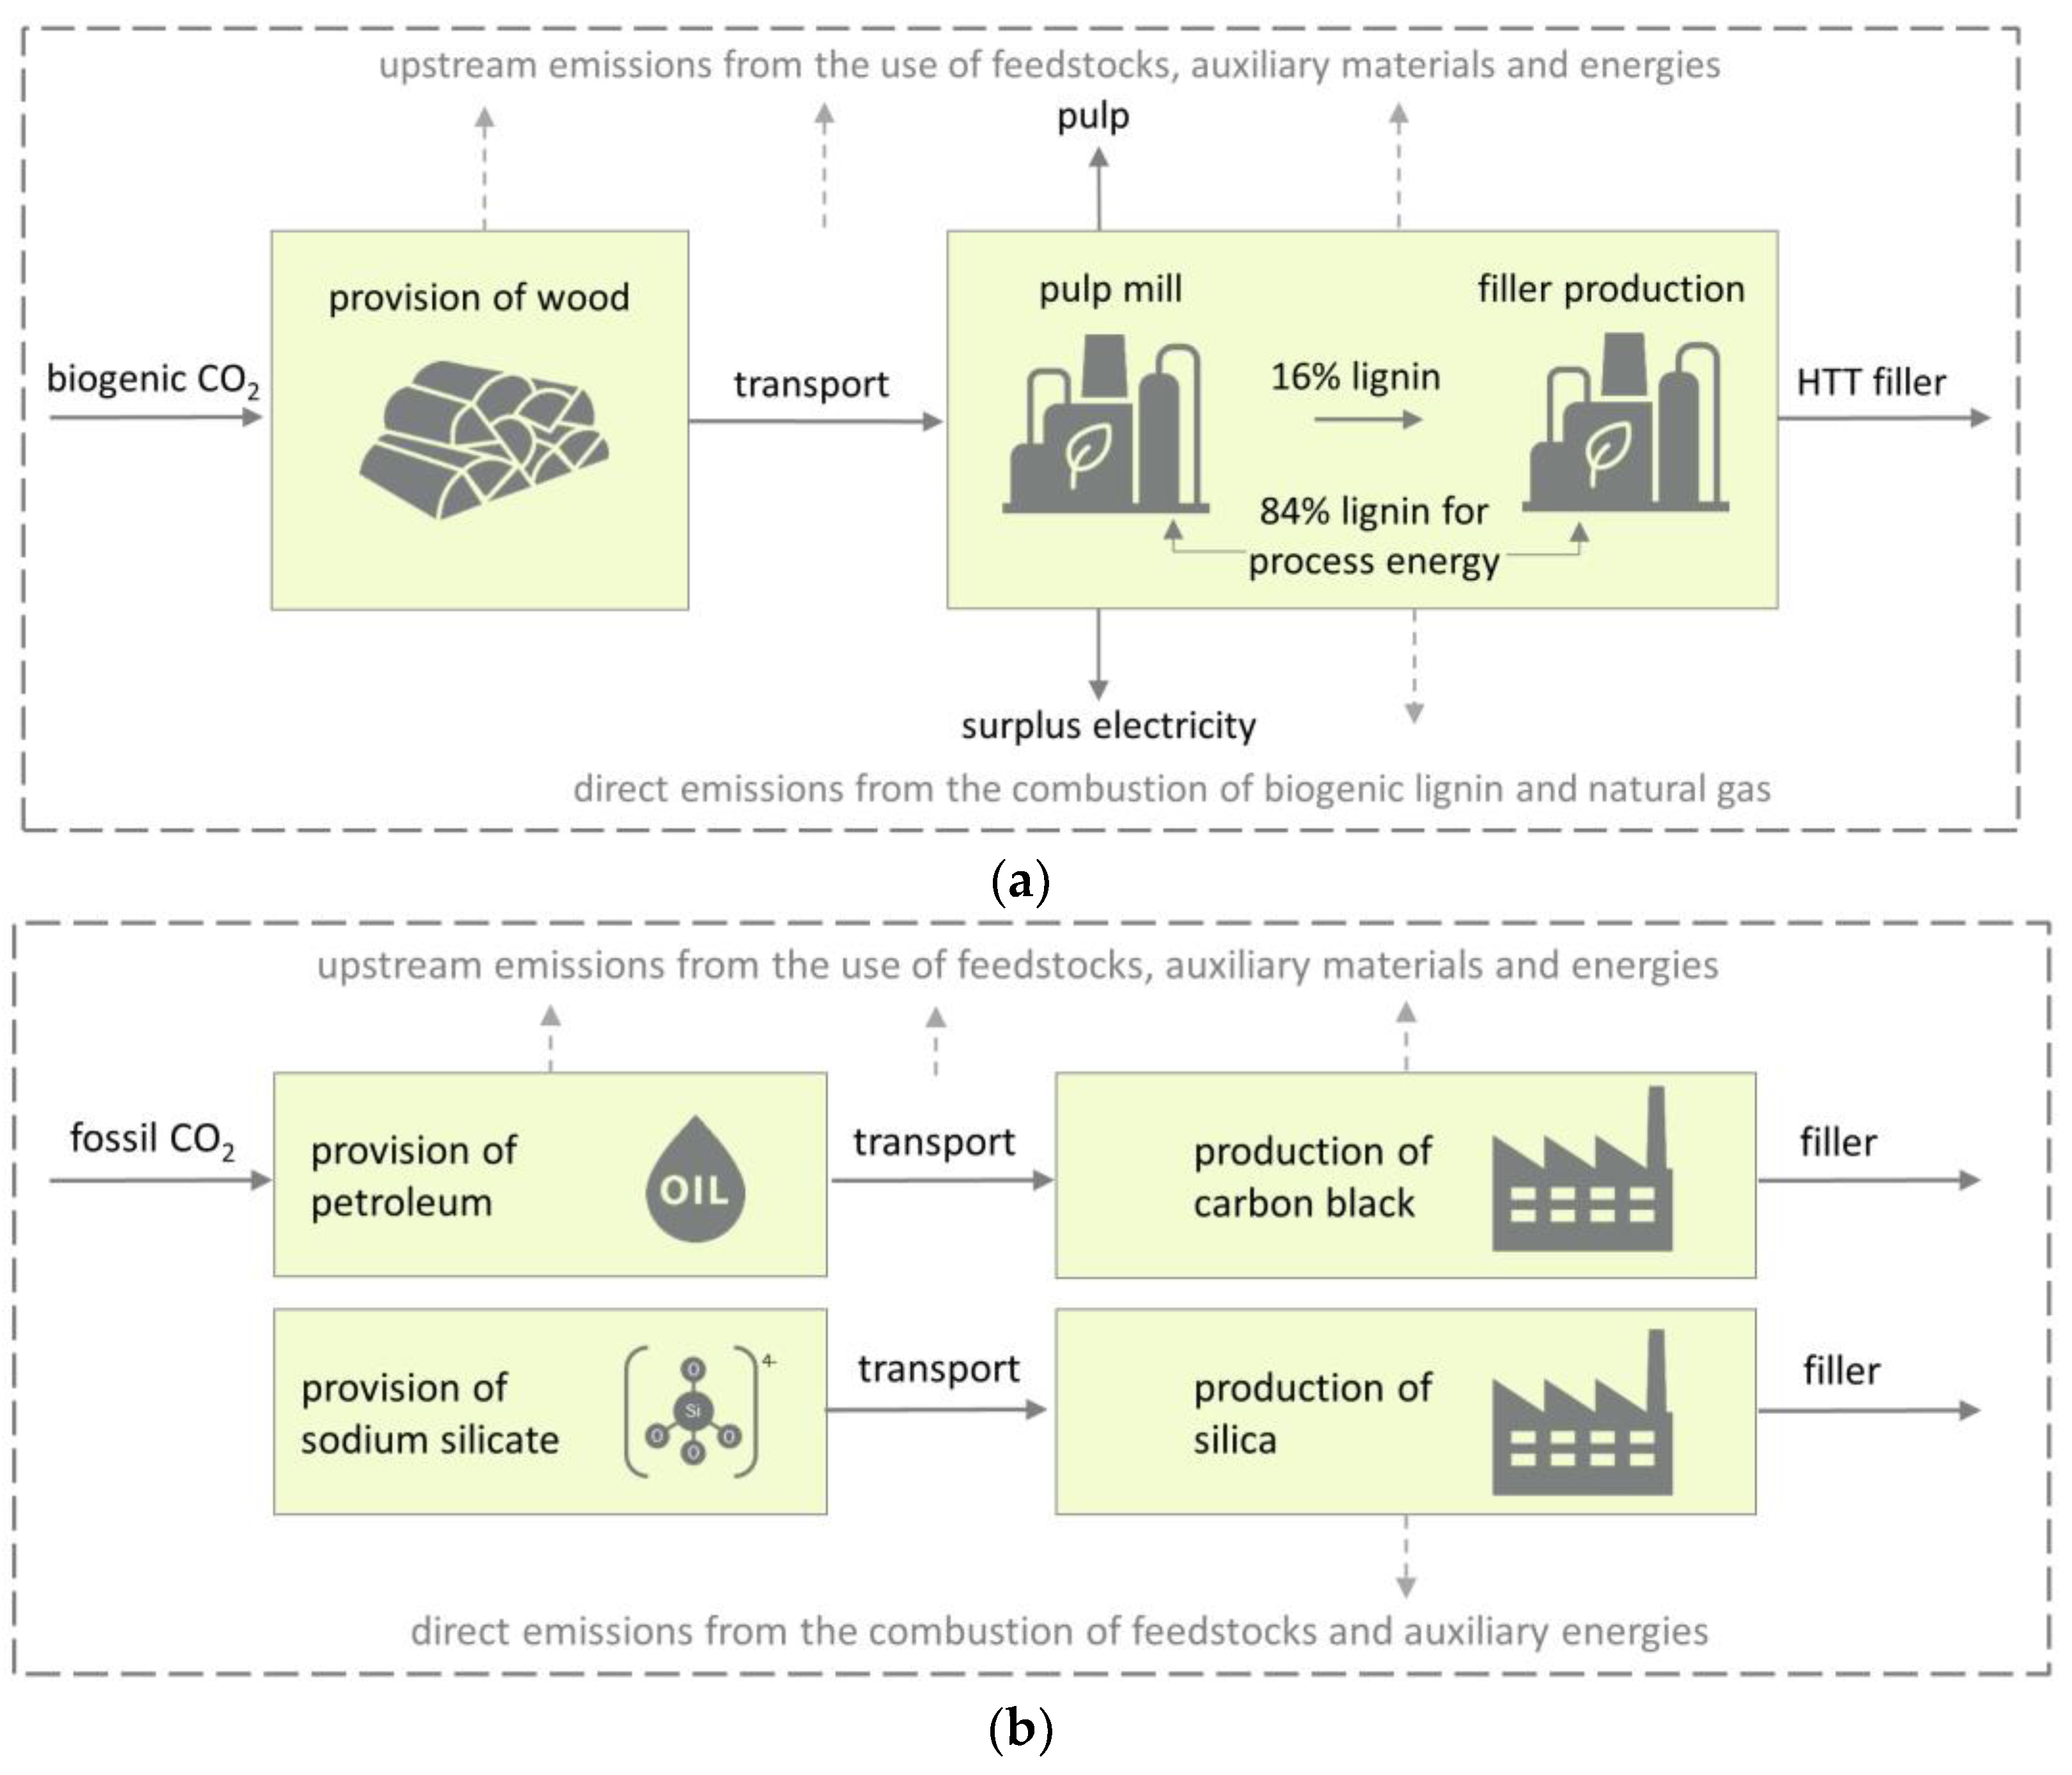
2.1. Process Chain of Lignin-Based HTT Filler Production

The investigated process chain of HTT filler production is shown in Figure 1. It is based on an existing plant of a pulp mill in Germany into which filler production could potentially be integrated. It includes the supply of the pulp mill with the feedstocks spruce and pine logs as well as wood chips, including their transport from an assumed constant distance of 100 km to the pulp mill, the pulp mill itself and the integrated filler production at the pulp mill site. The application in polymers, their use and end of life phase are excluded, as in this study the investigations of blending the fillers and their use in tires or sealings could not be finished, but are part of further research work.
The following process steps within the defined process chain are assumed: at an integrated pulp mill, wood and wood chips are broken down into their components using the so-called Kraft process [39]. This essentially requires process energy, caustic soda and sulfur compounds. To feed the caustic soda back into the process, quicklime is used, which is produced in a small natural gas-fired rotary kiln on site. Direct fossil CO2 emissions are emitted via the natural gas combustion. The Kraft process essentially results in two partial streams: pulp and lignin. The pulp undergoes further processing steps and then leaves the production system as a product. Lignin is used to generate the required process energy at the production site. Since the lignin quantities even produce surplus energy, a partial stream of lignin can be used as feedstock for HTT-based filler production to produce a high-value material instead of the energy surplus. This means that approx. 84 m% of the lignin is used for energy provision and approx. 16 m% is extracted for filler production. Even with this concept, surplus electricity not consumed at the site remains, which is fed into the power grid and also leaves the production system under consideration as a creditable product.
At the pulp and filler production site, CO2, CO, SO2, NOx and PM emissions are emitted directly into the atmosphere due to the combustion of the lignin for process energy generation and the combustion of the natural gas. According to the plant operator, PAHs could not be detected in the existing process. The use or application phase of the HTT filler in polymer blends and end of life phase is excluded due to missing data at the moment, as already mentioned before. Thus, a cradle-to-gate assessment is conducted.
In addition to the direct GHG and air pollutant emissions from the combustion of lignin and natural gas mentioned above, the upstream emissions from the supply and production of the wood/wood chips, the transport and the auxiliary materials and energies used in the production plant are also taken into account. The CO2 that was absorbed from the atmosphere and sequestered by the wood as part of a relative short-term carbon cycle is considered as well (see Figure 1). It is called biogenic CO2 [40] (see Section 2.3).
To ensure the comparability of the cradle-to-gate emissions between the lignin-based HTT filler and the conventional reference products silica and carbon black, analogous system boundaries and process chain definitions are needed. This means that the reference filler production including the upstream processes are considered, whereas the application into polymer blends, their use phase and end of life are excluded. Here, again, the upstream emissions from the raw materials, auxiliary materials and energies used and the direct emissions at the filler production site of the reference fillers carbon black and silica are considered.
Similar to the lignin-based filler production chain, the CO2 that was absorbed from plants for the formation of petroleum thousands to millions of years before is included as well. It is called fossil CO2 [40]. Within the silica production chain there is no comparable carbon input (see Section 2.3 and Figure 1).

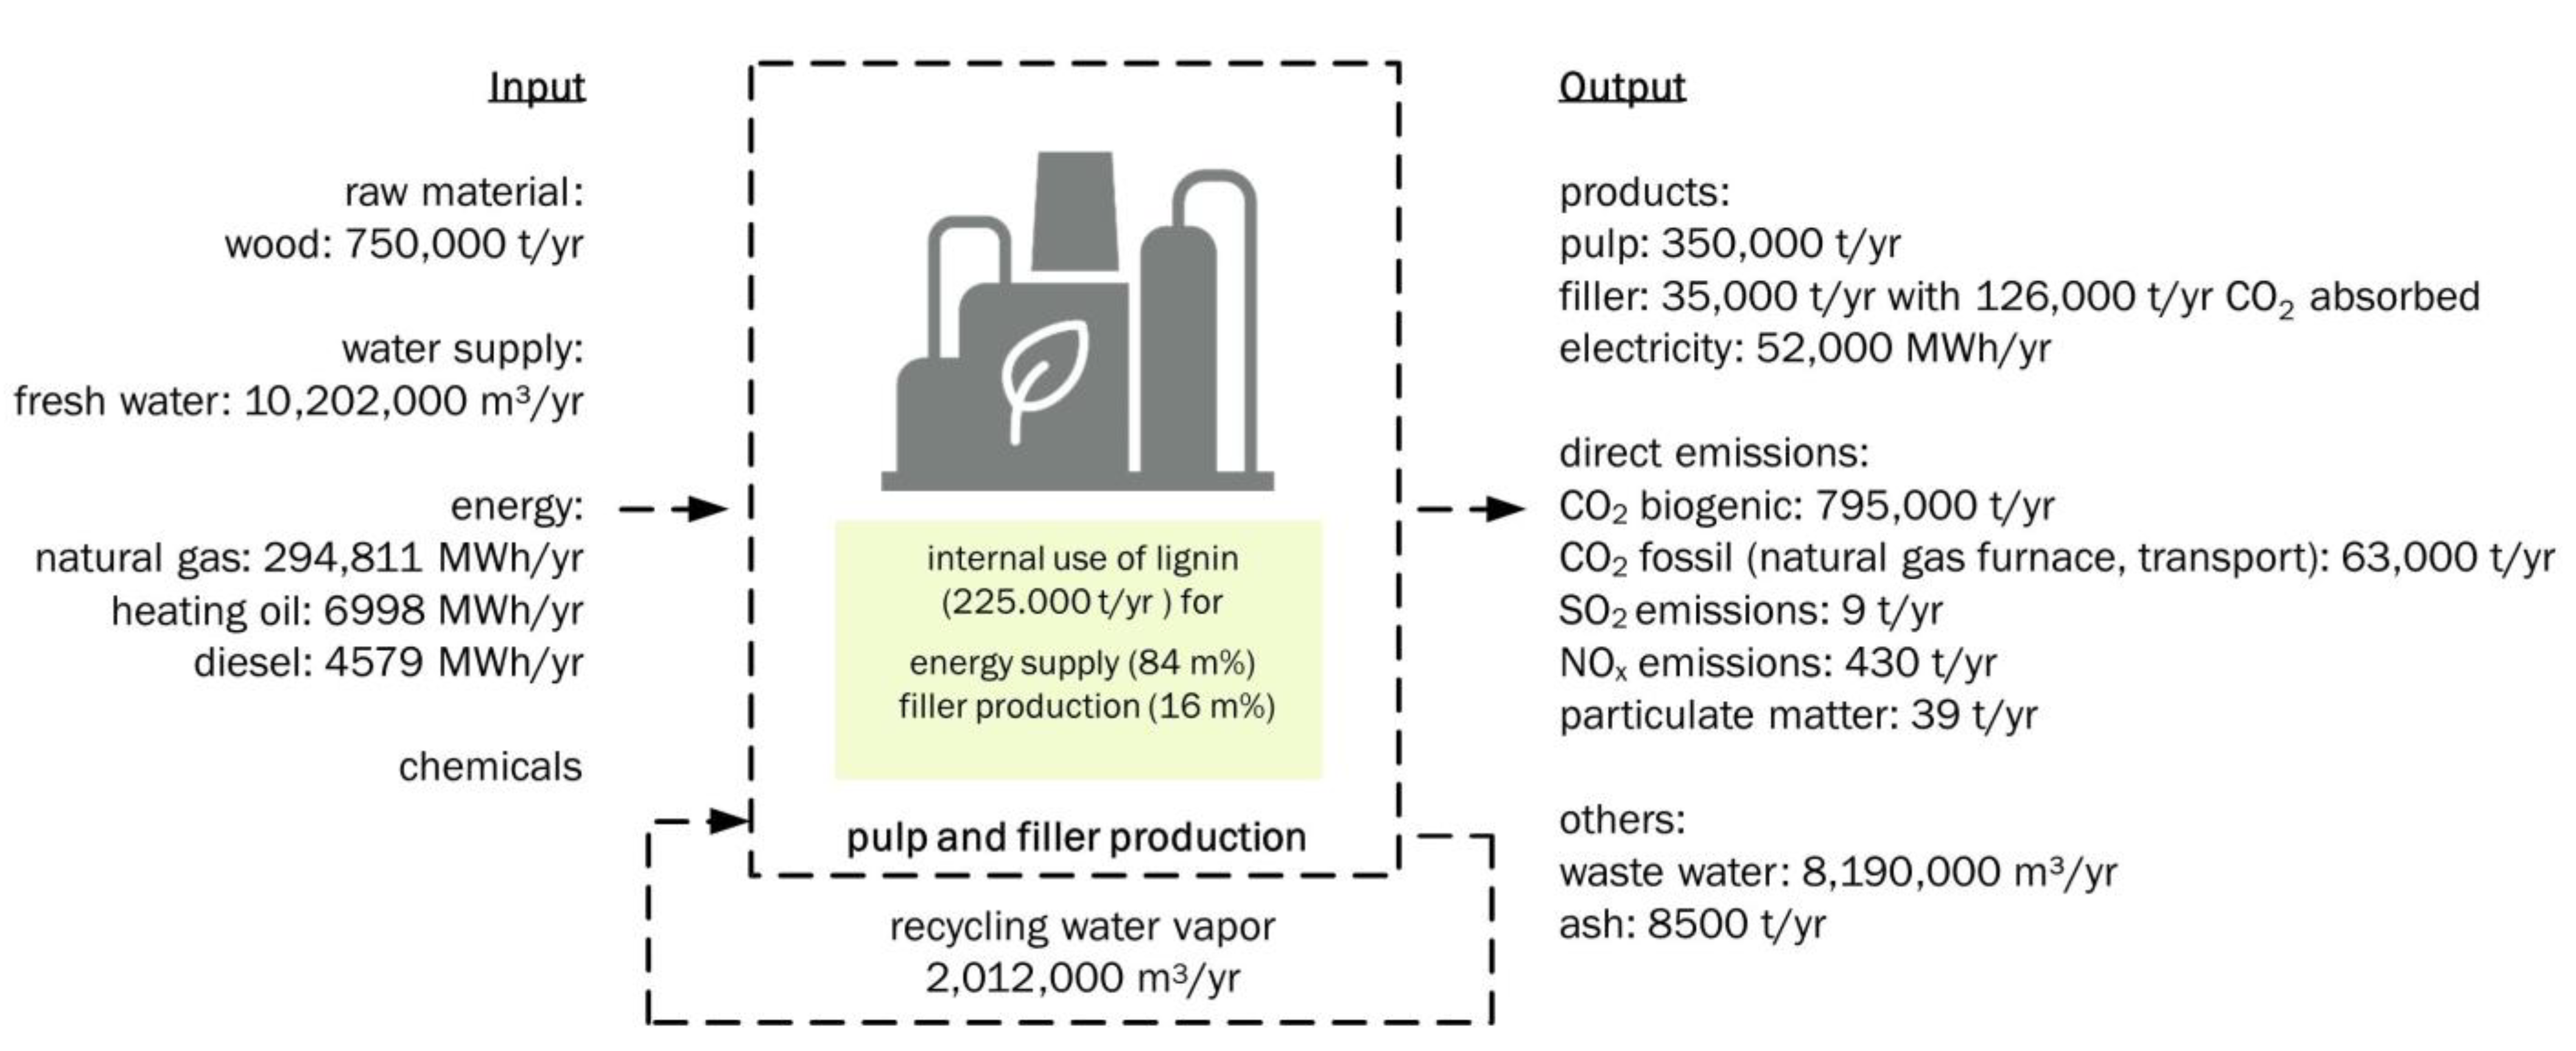
2.2. Mass and Energy Balancing

Mass and energy balances are based on the process chain definition and system boundaries given in Figure 1 [38]. The process of the integrated production site itself is considered as a black box, so that only input and output flows are considered and internal flows are not represented. Dedicated information was requested for the energy flows as well as the input and output mass flows. Further information, such as the origin of the heat source and efficiency, as well as specifications for the individual entries of the mass balance are also listed. The inputs and outputs of material and energy flows along the HTT filler production chain are associated with environmental impacts. Therefore, mass and energy balancing is a prerequisite for the environmental assessment of the value chains. No mass and energy balances have been drawn up for the reference systems. Their environmental impacts are taken from the ecoinvent database [8] and other literature [9,10].

2.3. Carbon Accounting of Feedstocks and Products

This study does not include a separate carbon accounting as part of the mass and energy balancing. However, in order to illustrate the difference between the biogenic HTT filler and the petroleum-based carbon black within the cradle-to-gate approach, the carbon flow is explained as follows:
In a short-circuited biogenic carbon cycle, plants absorb CO2 from the atmosphere during photosynthesis and the carbon is incorporated into their biomass. The biomass (here wood) is broken down into pulp and lignin stream and further processed to bleached pulp and filler in the integrated plant. The carbon remains fixed in the products. When the filler is used in tires and later combusted or rotted at the end of their life, the same amount of CO2 is emitted as in the wood previously absorbed from the atmosphere. As the lifetime of a tire is short, this biogenic carbon cycle is assumed to be closed over a relative short period of time and does not cause any significant delayed or additional climate impacts. The biogenic CO2 is thus considered climate-neutral. This is also the case for the internal combustion of lignin for process energy provision. It has to be mentioned that this only applies to CO2 emissions, not for non-CO2 emissions such as carbon monoxide. In this study, however, due to the cradle-to-gate approach, the complete carbon cycle is not balanced. Until the ‘gate’ of filler production, the biogenic carbon remains fixed in the filler. According to Pawelzik et al. [40] a credit is awarded for the carbon storage in the product in these cases.
By contrast, the formation of petroleum from plants, the use of petroleum to produce carbon black, its use in a tire and its subsequent assumed combustion close a carbon cycle lasting a thousand to a million years. CO2 is thus described as fossil. In the case of combustion, it is additionally added to the current atmosphere and has an impact on the climate. Therefore, no credit can be awarded for the carbon that is stored in the carbon black filler within cradle-to-gate assessment. The silica filler is a silicon oxide and thus free of carbon.

2.4. Data and Assumption

For the LCA of the HTT filler and the comparison with the conventional reference fillers, production data and data from the upstream processes are needed for both the HTT filler product system and the reference product system.
The data of all input and output streams of the HTT filler product system were provided by the cooperation partner from the pulp and paper industry. They originated from the plant location of a pulp mill at which filler production could potentially be integrated. This data were prepared by DBFZ in a mass and energy balance in Microsoft Excel and were then used for the life cycle inventory within the LCA. The mass and energy balance data ere mapped as a process chain model using the LCA software Umberto LCA+ 10.0.3 [41]. The emission data associated with the substances/materials and the energy used along the process chain were taken from the ecoinvent database 3.6 [42,43], which is integrated in the Umberto software. The credit for the carbon storages within HTT filler production system was determined stoichiometrically via an oxidation equation of the carbon content of the HTT filler (see Table S3 of the Supplementary Materials).
In contrast to the LCA of HTT filler production, there is no separate balancing of the reference filler productions. The GHG emission factor as well as the SO2, NOx, PAH and PM emissions of carbon black and silica were taken from the datasets “carbon black production” and “activated silica production” of the ecoinvent database 3.6 [8]. The main methodological characteristics of the ecoinvent datasets and the emissions associated with carbon black and silica are summarized in the Supplementary Materials Table S1. Furthermore, a GHG emission factor for carbon black from the sustainability report of the carbon black manufacturer Orion [44] was taken into account. In addition, for better insight, only the direct emissions of SO2, NOx, PAH and PM at the carbon black and silica production plant sites are listed separately in Table S2 of the Supplementary Materials. Two sources were used for this—the ecoinvent database and the European Commission (EC) reference document, which contains reference values of the best available technique in Europe [45].

2.5. Balancing of GHG Emissions and Air Pollutants

The methodology of life cycle assessment, which is standardized in the ISO standards 14040/14044 [46,47], was used to balance the GHG emissions and the air pollutants SO2, NOx, PAH and PM. This balancing is based on the developed mass and energy balance including all input and output flows into and from the integrated filler production and their associated emissions taken from ecoinvent database (see Section 2.2 and Section 2.4). To assess whether the substitution of conventional fillers based on finite resources by the lignin-based HTT filler is accompanied by reductions in GHG emissions and air pollutants, the LCA results of the HTT filler were compared to the emissions of the conventional fillers carbon black and silica. Carbon black and silica thus serve as reference products. As already described in the introductory chapter, the LCA results of the same amount of filler were compared, although assuming that depending on the intended function of the filler in the later application, the fillers probably cannot be substituted one-to- one. However, it is a first approach to obtain a trend regarding the GHG, SO2, NOx, PM and PAH emissions. According to the evaluation system ‘IPCC 2013’, the following greenhouse gases are taken into account for the calculation of global warming potentials: fossil carbon dioxide, fossil carbon monoxide, chloroform, dinitrogen monoxide, ethane, methane, nitrogen fluoride and sulfur hexafluoride. Characterization factors are needed to convert these climate-relevant gases to the indicator value of CO2 equivalents. These factors are defined in the evaluation system of ‘IPCC 2013’ as well. Accordingly, fossil CO2, for example, has a characterization factor of 1, methane of 28 and nitrous oxide of 265 [48]. Biogenic CO2 that is here emitted by combusting lignin for energy provision is considered climate-neutral according to the IPCC evaluation system and as described above. Thus, the CO2 emissions from the combustion of the bio-based lignin are considered to be zero. The biogenic carbon stored in the HTT filler is credited. Here, we assume that the amount of biogenic CO2, determined via oxidation equation of biogenic carbon content within the filler, corresponds to the same amount that was absorbed from the atmosphere and bound in the wood used for the filler production (see Section 2.3 and Table S3 of the Supplementary Materials). Thus, the credit corresponds to the amount of this CO2 quantity.
The SO2, NOx, PAH and PM emissions from the upstream process chain and as direct emissions do not require any further conversion. They can be taken directly from the life cycle inventory results. For PM emissions, particles < 2.5 μm, between 2.5 and 10 μm and >10 μm were considered. PAHs are listed as one group of substances within the ecoinvent inventory lists. They are not further differentiated. The functional unit to which the assessed GHG, SO2, NOx, PAH and PM emissions potentially released along the considered process chain refer is 1 kg of the filler. At the same time, it serves as a unit of comparison between the HTT filler and the reference fillers carbon black and silica.
The emissions occurring within the defined system boundary (see Figure 1) had to be divided between the valuable products pulp, filler and surplus electricity coming from the integrated pulp and filler plant using an allocation methodology. While the emissions between pulp and filler are allocated on the basis of their physical properties, the entire production system is credited for feeding the lignin-based surplus electricity into the German power grid by the amount of the emissions saved from Germany’s conventional electricity production. The credit is then split into pulp and filler according to the same physical property. Since the strong influence of the choice of the allocation method is known from the literature [49], three different allocation methods between pulp and filler are applied in this study: (i) allocation according to dry matter (DM), (ii) allocation according to the lower heating value (LHV) of the dry matter and (iii) according to carbon content (C content). The different allocation factors are listed in Table 1. The credit for feeding surplus electricity into the German grid is 0.551 kg CO2 eq. per kWh of electricity fed into the grid [43].

3. Results

3.1. Mass and Energy Balancing

The data were submitted by a cooperation partner for a pulp mill with integrated filler production. By agreement with the cooperation partners, no statements on the use of chemicals are published, but they were included in the calculation.
Figure 2 lists the balanced flows. The process chain is described in detail in Section 2.1. The mass and energy balance is carried out with a black box consideration of the production process. The carbon accounting described in Section 2.3 is included.

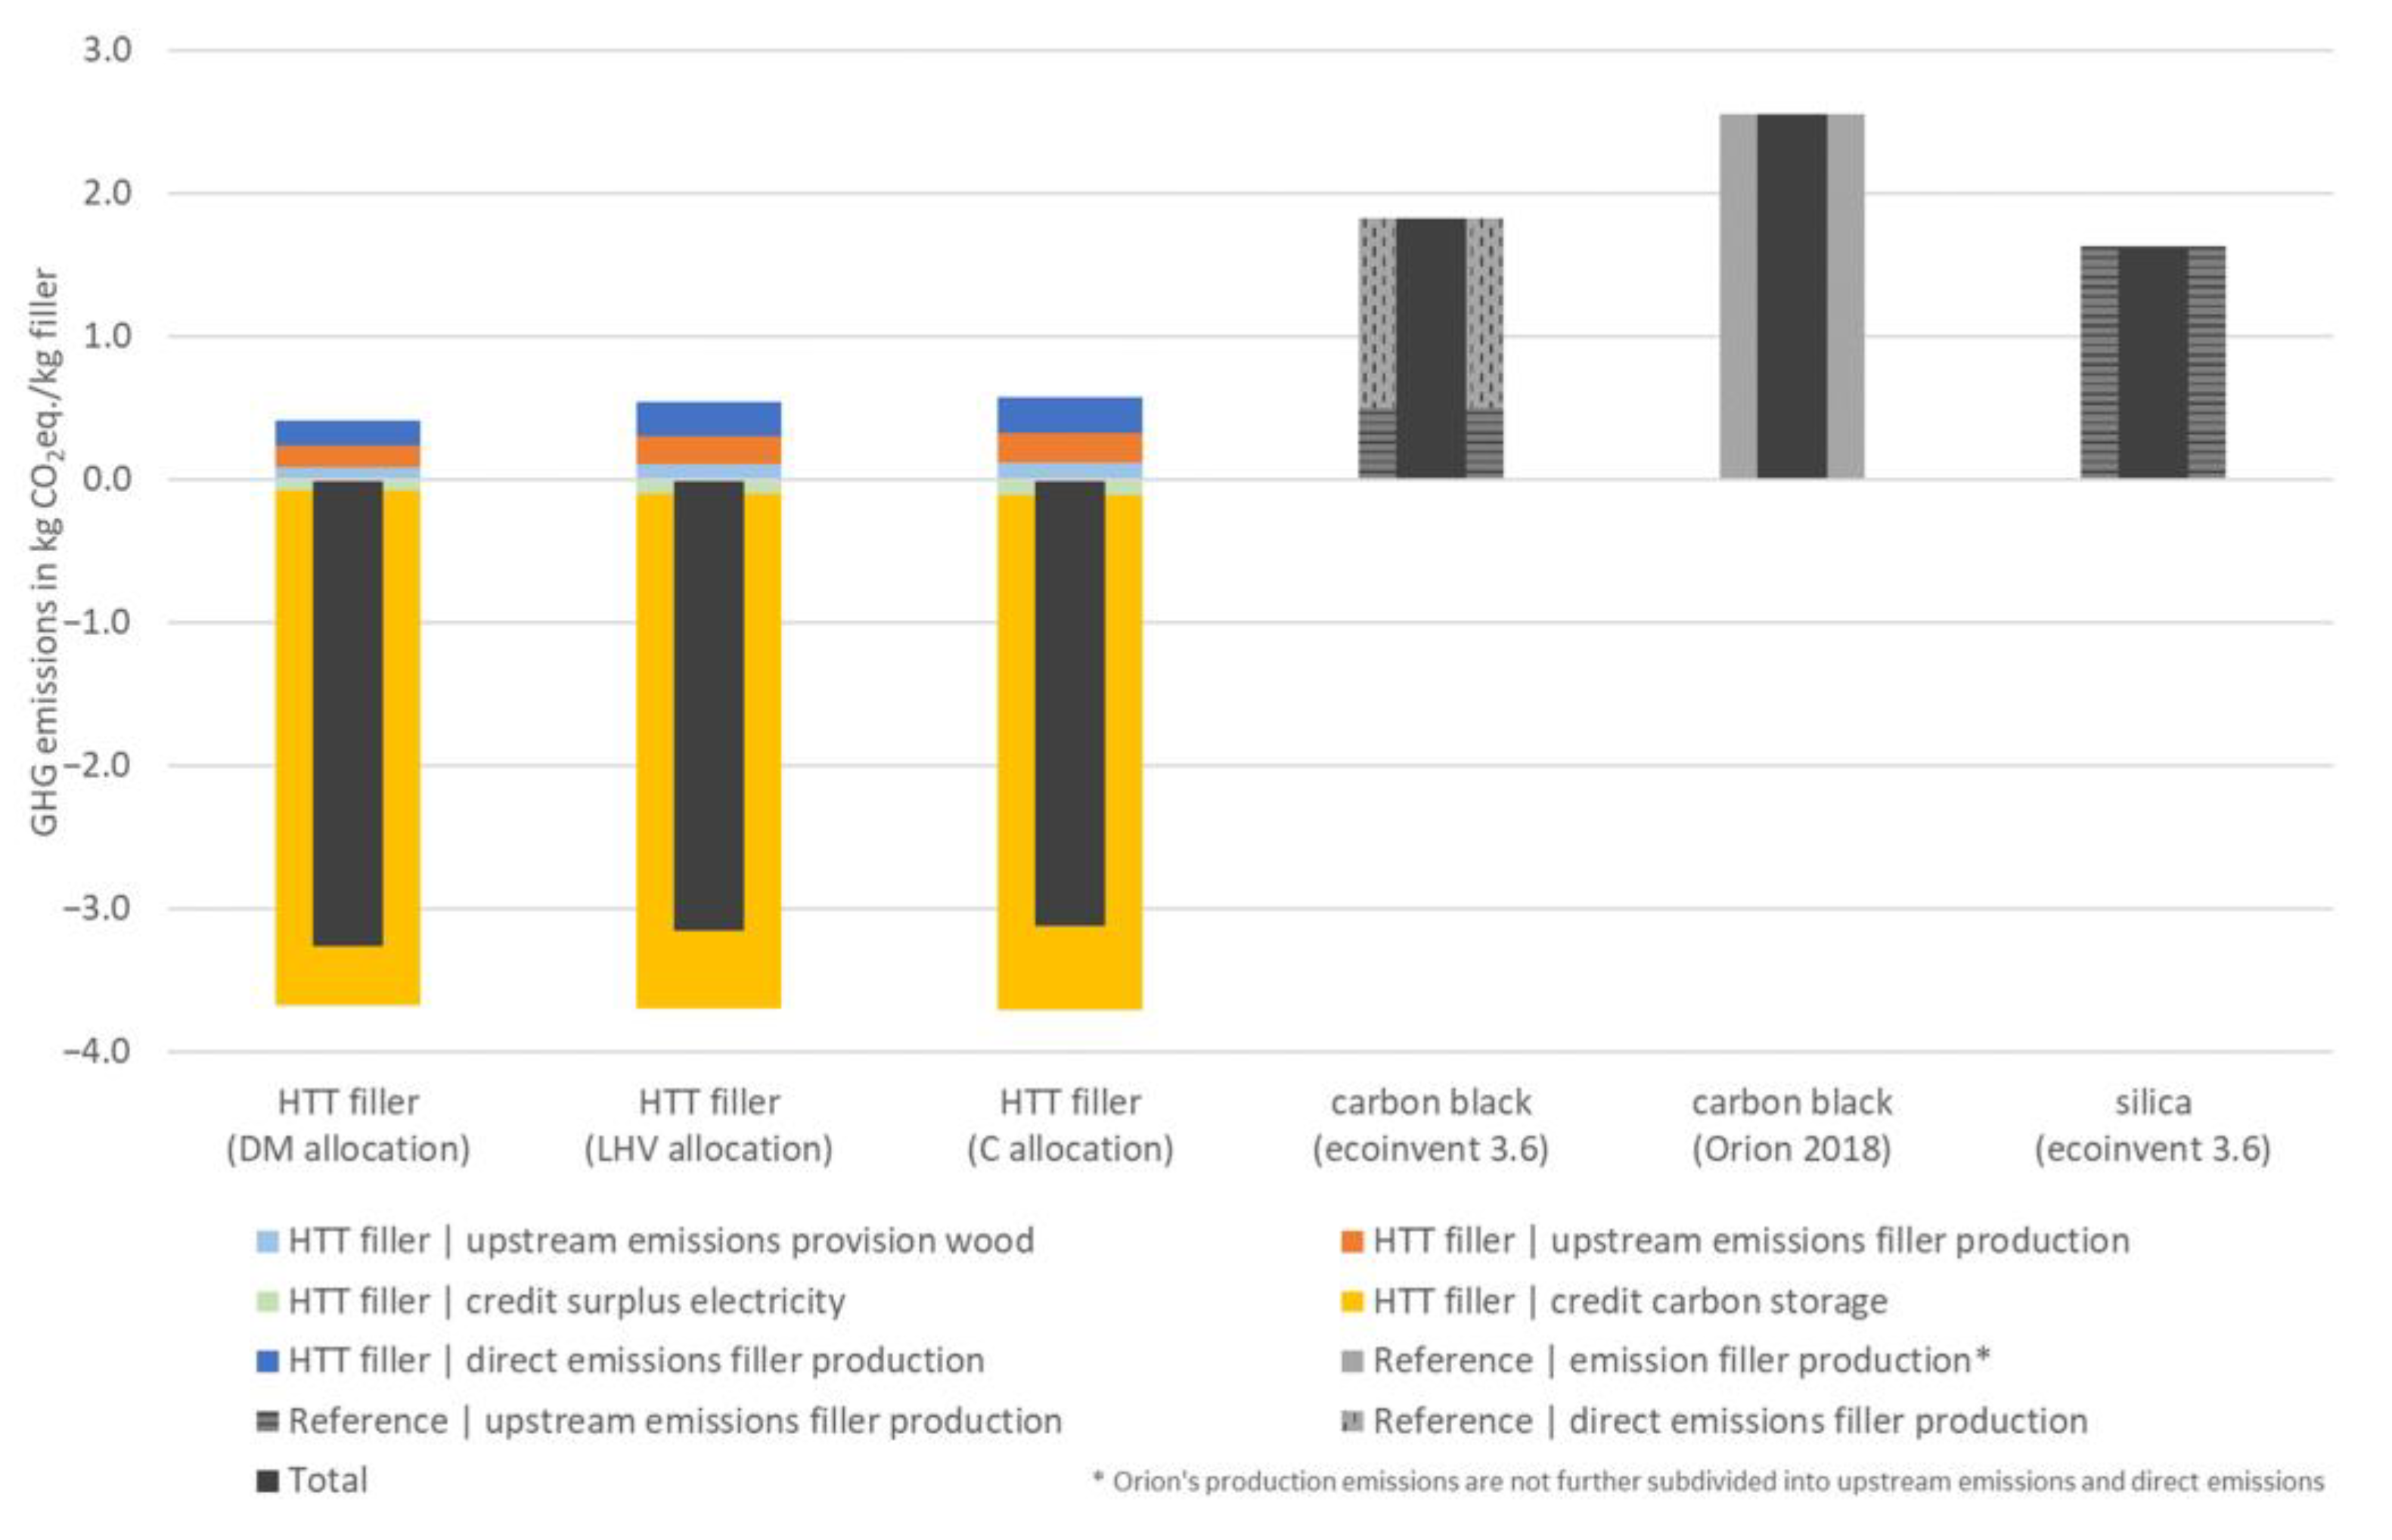
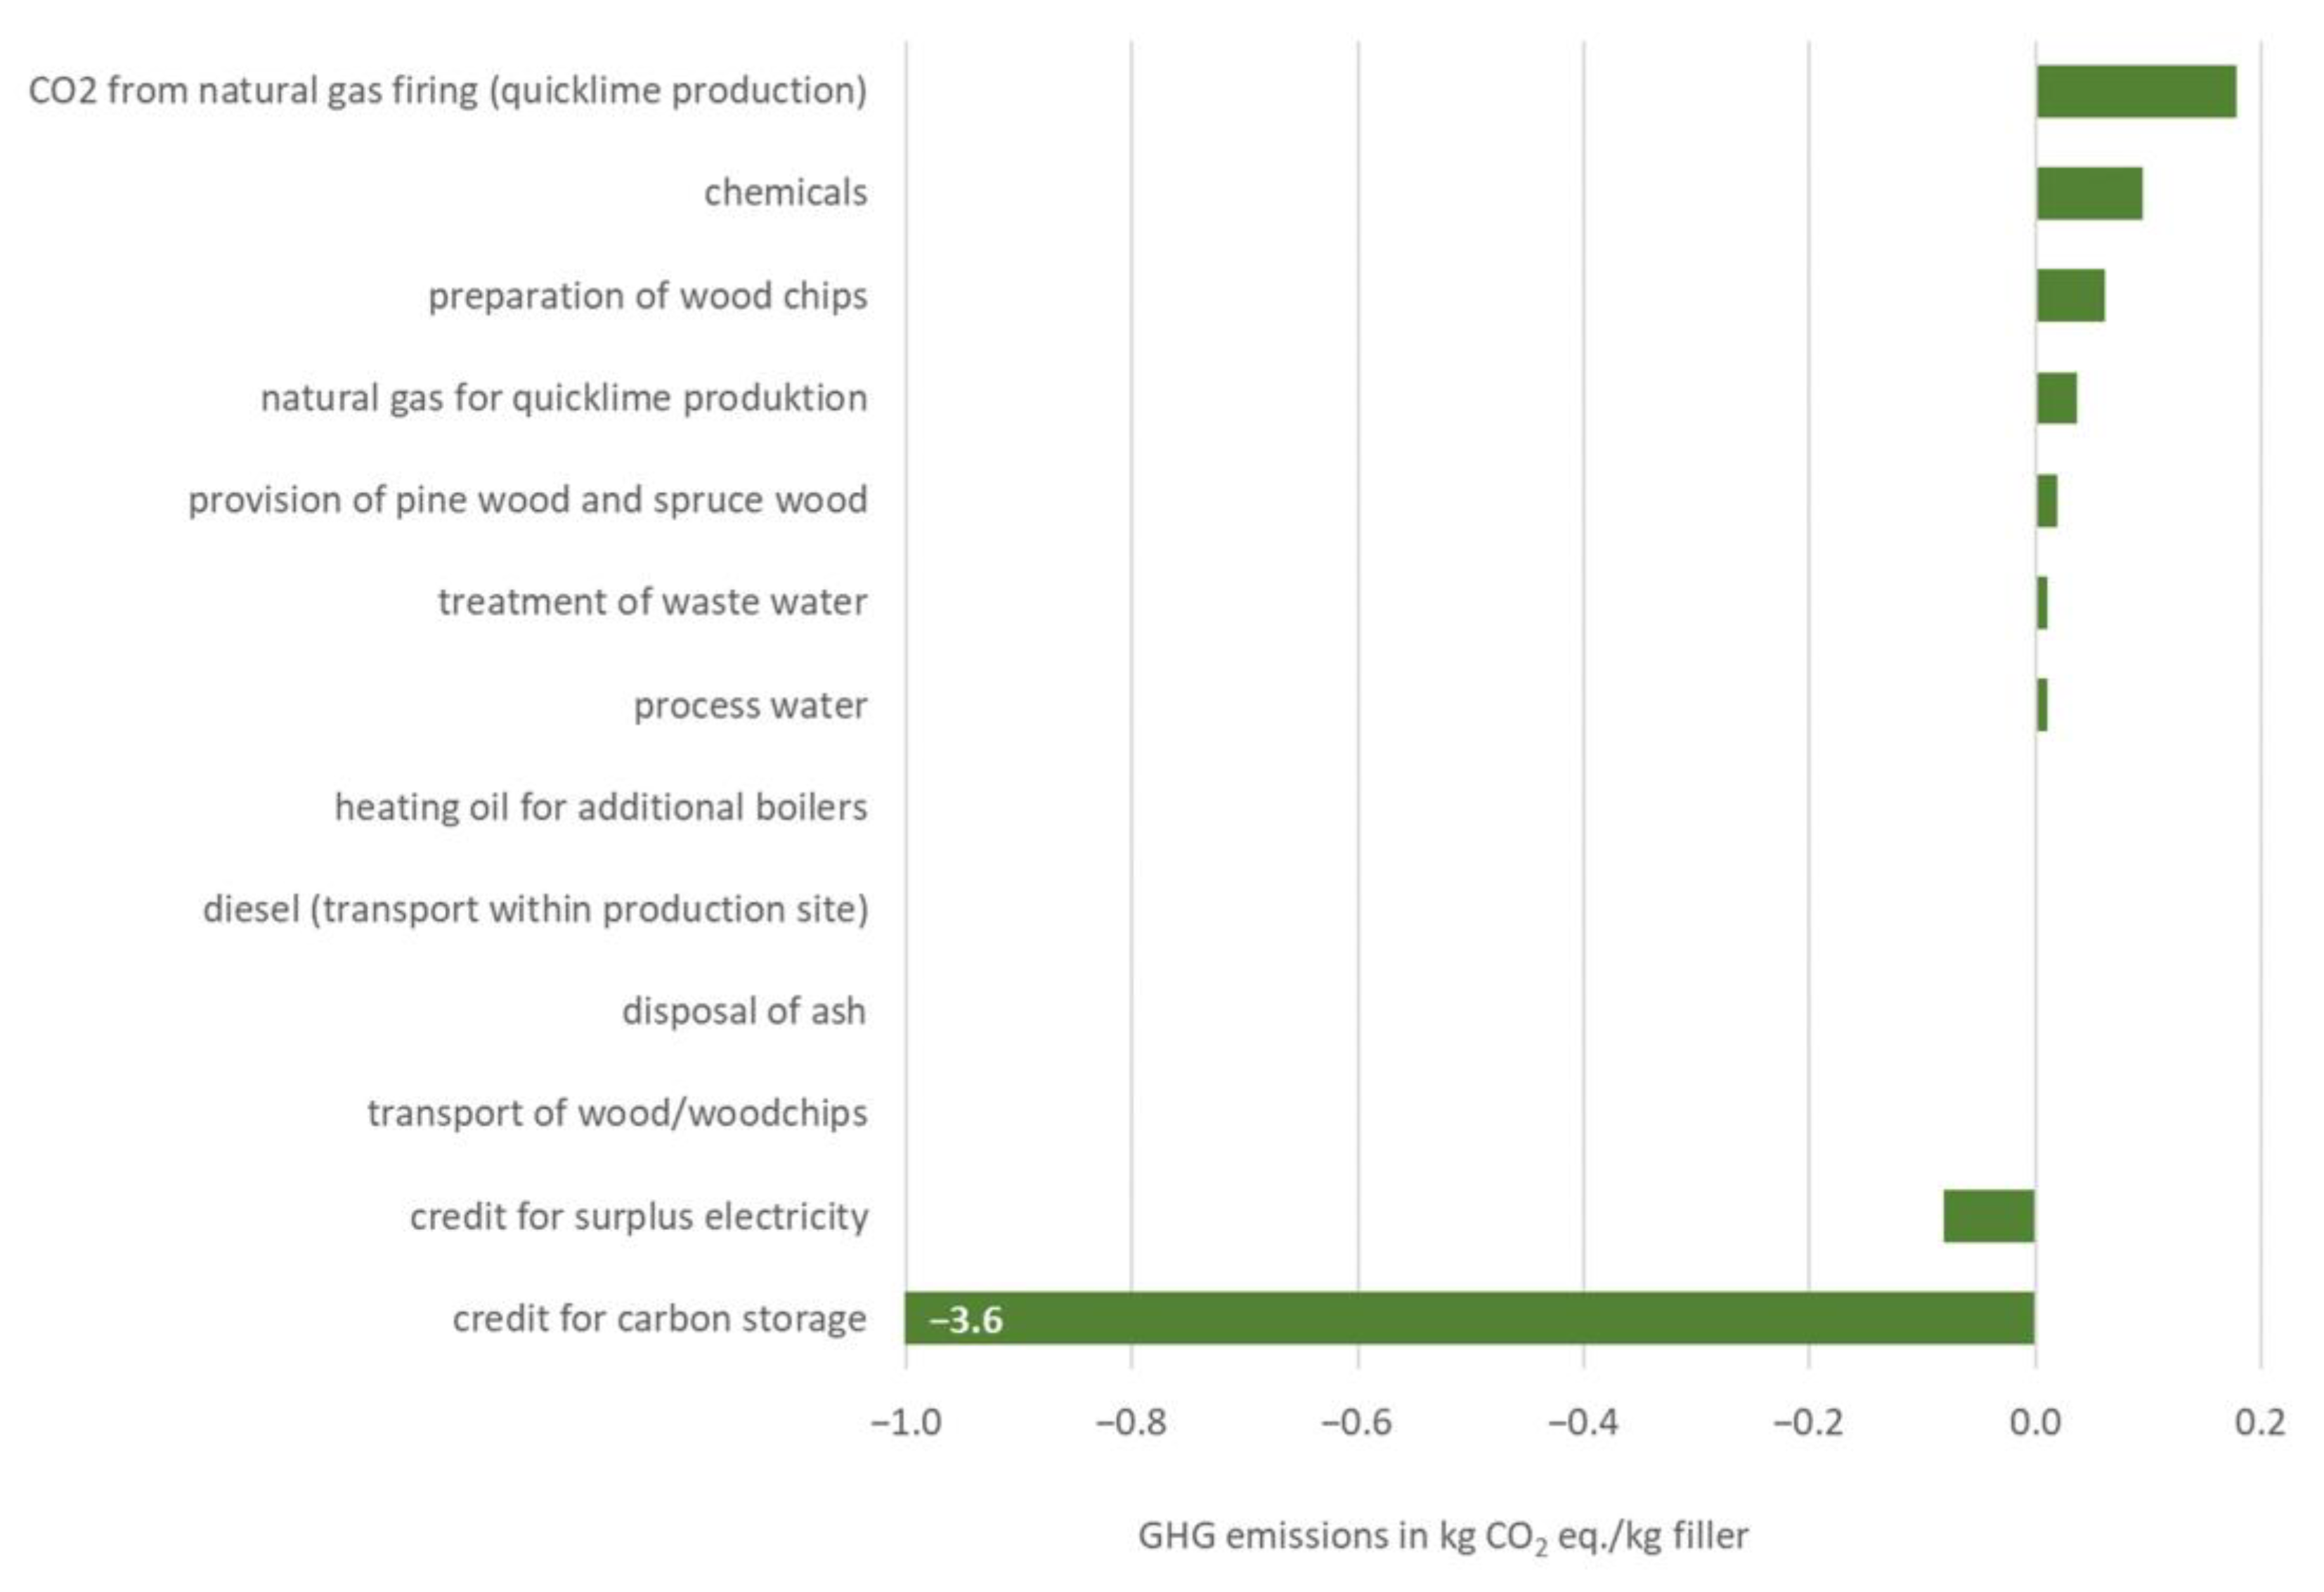
3.2. GHG Emissions and GHG Reduction

Figure 3 shows the assessed GHG emissions of the lignin-based HTT filler considering different allocation methods in comparison to the GHG emissions of the reference fillers carbon black and silica from the ecoinvent database [42] and the sustainability report of Orion [44]. It becomes clear that significantly lower GHG emissions would be caused within the considered HTT process chain than within the comparable process chains of the reference fillers. This is mainly due to the use of the biogenic feedstock lignin, first the HTT filler production and second for the process energy supply. The use of biogenic feedstock and the associated sequestration of carbon in the HTT filler leads to CO2 credits and thus to negative GHG emissions in total within the cradle-to-gate assessment. The use of lignin for energy supply has no additional impact on the climate due to its climate neutrality (see Section 2.3). The direct fossil CO2 emissions from the operation of the natural gas-fueled rotary kiln are included in the calculation, but are low compared to the total emissions of the reference fillers due to the relatively low use of natural gas.
The significantly higher emissions of carbon black are mainly due to the use of fossil-based petroleum as a feedstock for carbon black production and as an energy source for process energy supply. Petroleum is obtained in a very energy-intensive way by fractional distillation and is thus very GHG-intensive. Additionally, due to the fossil character of petroleum no credit can be awarded to the sequestered carbon in petroleum converted to carbon black filler within the cradle-to-gate assessment.
Although the GHG emissions of silica are lower than those of carbon black, they are significantly higher than the HTT filler’s GHG emissions. The higher GHG emissions compared to the HTT filler are primarily the result of the use of sodium silicate as feedstock and the high GHG emissions associated with its production. In addition, the fossil fuel used to provide process energy and the applied sulfuric acid cause further large amounts of GHG emissions.
Figure 3 also shows that the total GHG emissions are most influenced by the credit for biogenic carbon that is sequestered by the wood and bounded in the HTT filler. The credit for the electricity fed into the grid from lignin combustion are much lower. The figure also shows that most of the GHG emissions from the HTT filler process chain come from the direct CO2 emissions from the natural gas combustion for quicklime production (blue bar) and from upstream emissions of the auxiliary materials and energies used at the integrated pulp and HTT production site (orange bar). By contrast, the up-stream GHG emissions from the provision of wood are lower. As already mentioned, due to the biogenic origin of the lignin, no climate-effective GHG emissions are released from its internal combustion for energy supply.
Figure 4 illustrates the distribution of GHG emissions within the HTT process chain. It becomes clear that the combustion of natural gas emits most of the GHG emissions, followed by the use of chemicals in the integrated production plant. The third highest GHG emissions stem from the wood chip supply and the fourth highest from the upstream chain for the supply of natural gas, which is used in the rotary kiln for quicklime production. The other GHG emissions from the provision of pine and spruce wood, waste water and ash treatment, and the heating oil (boiler) and diesel (internal transport) used at the production site contribute to a lesser extent to the total GHG emissions. The credit for the carbon storage in the HTT filler and the electricity fed into the grid contributes significantly to reducing the total emissions.
It is already clear from Figure 3 that a high potential GHG saving would be associat-ed with a substitution of the conventional fillers silica and carbon black by the lignin-based HTT filler. Table 2 shows the absolute GHG savings per kg of filler. Accordingly, approx. 5.0–5.8 kg CO2 eq. per kg HTT filler could be saved compared to carbon black and approx. 4.8–4.9 kg CO2 eq. compared to silica.

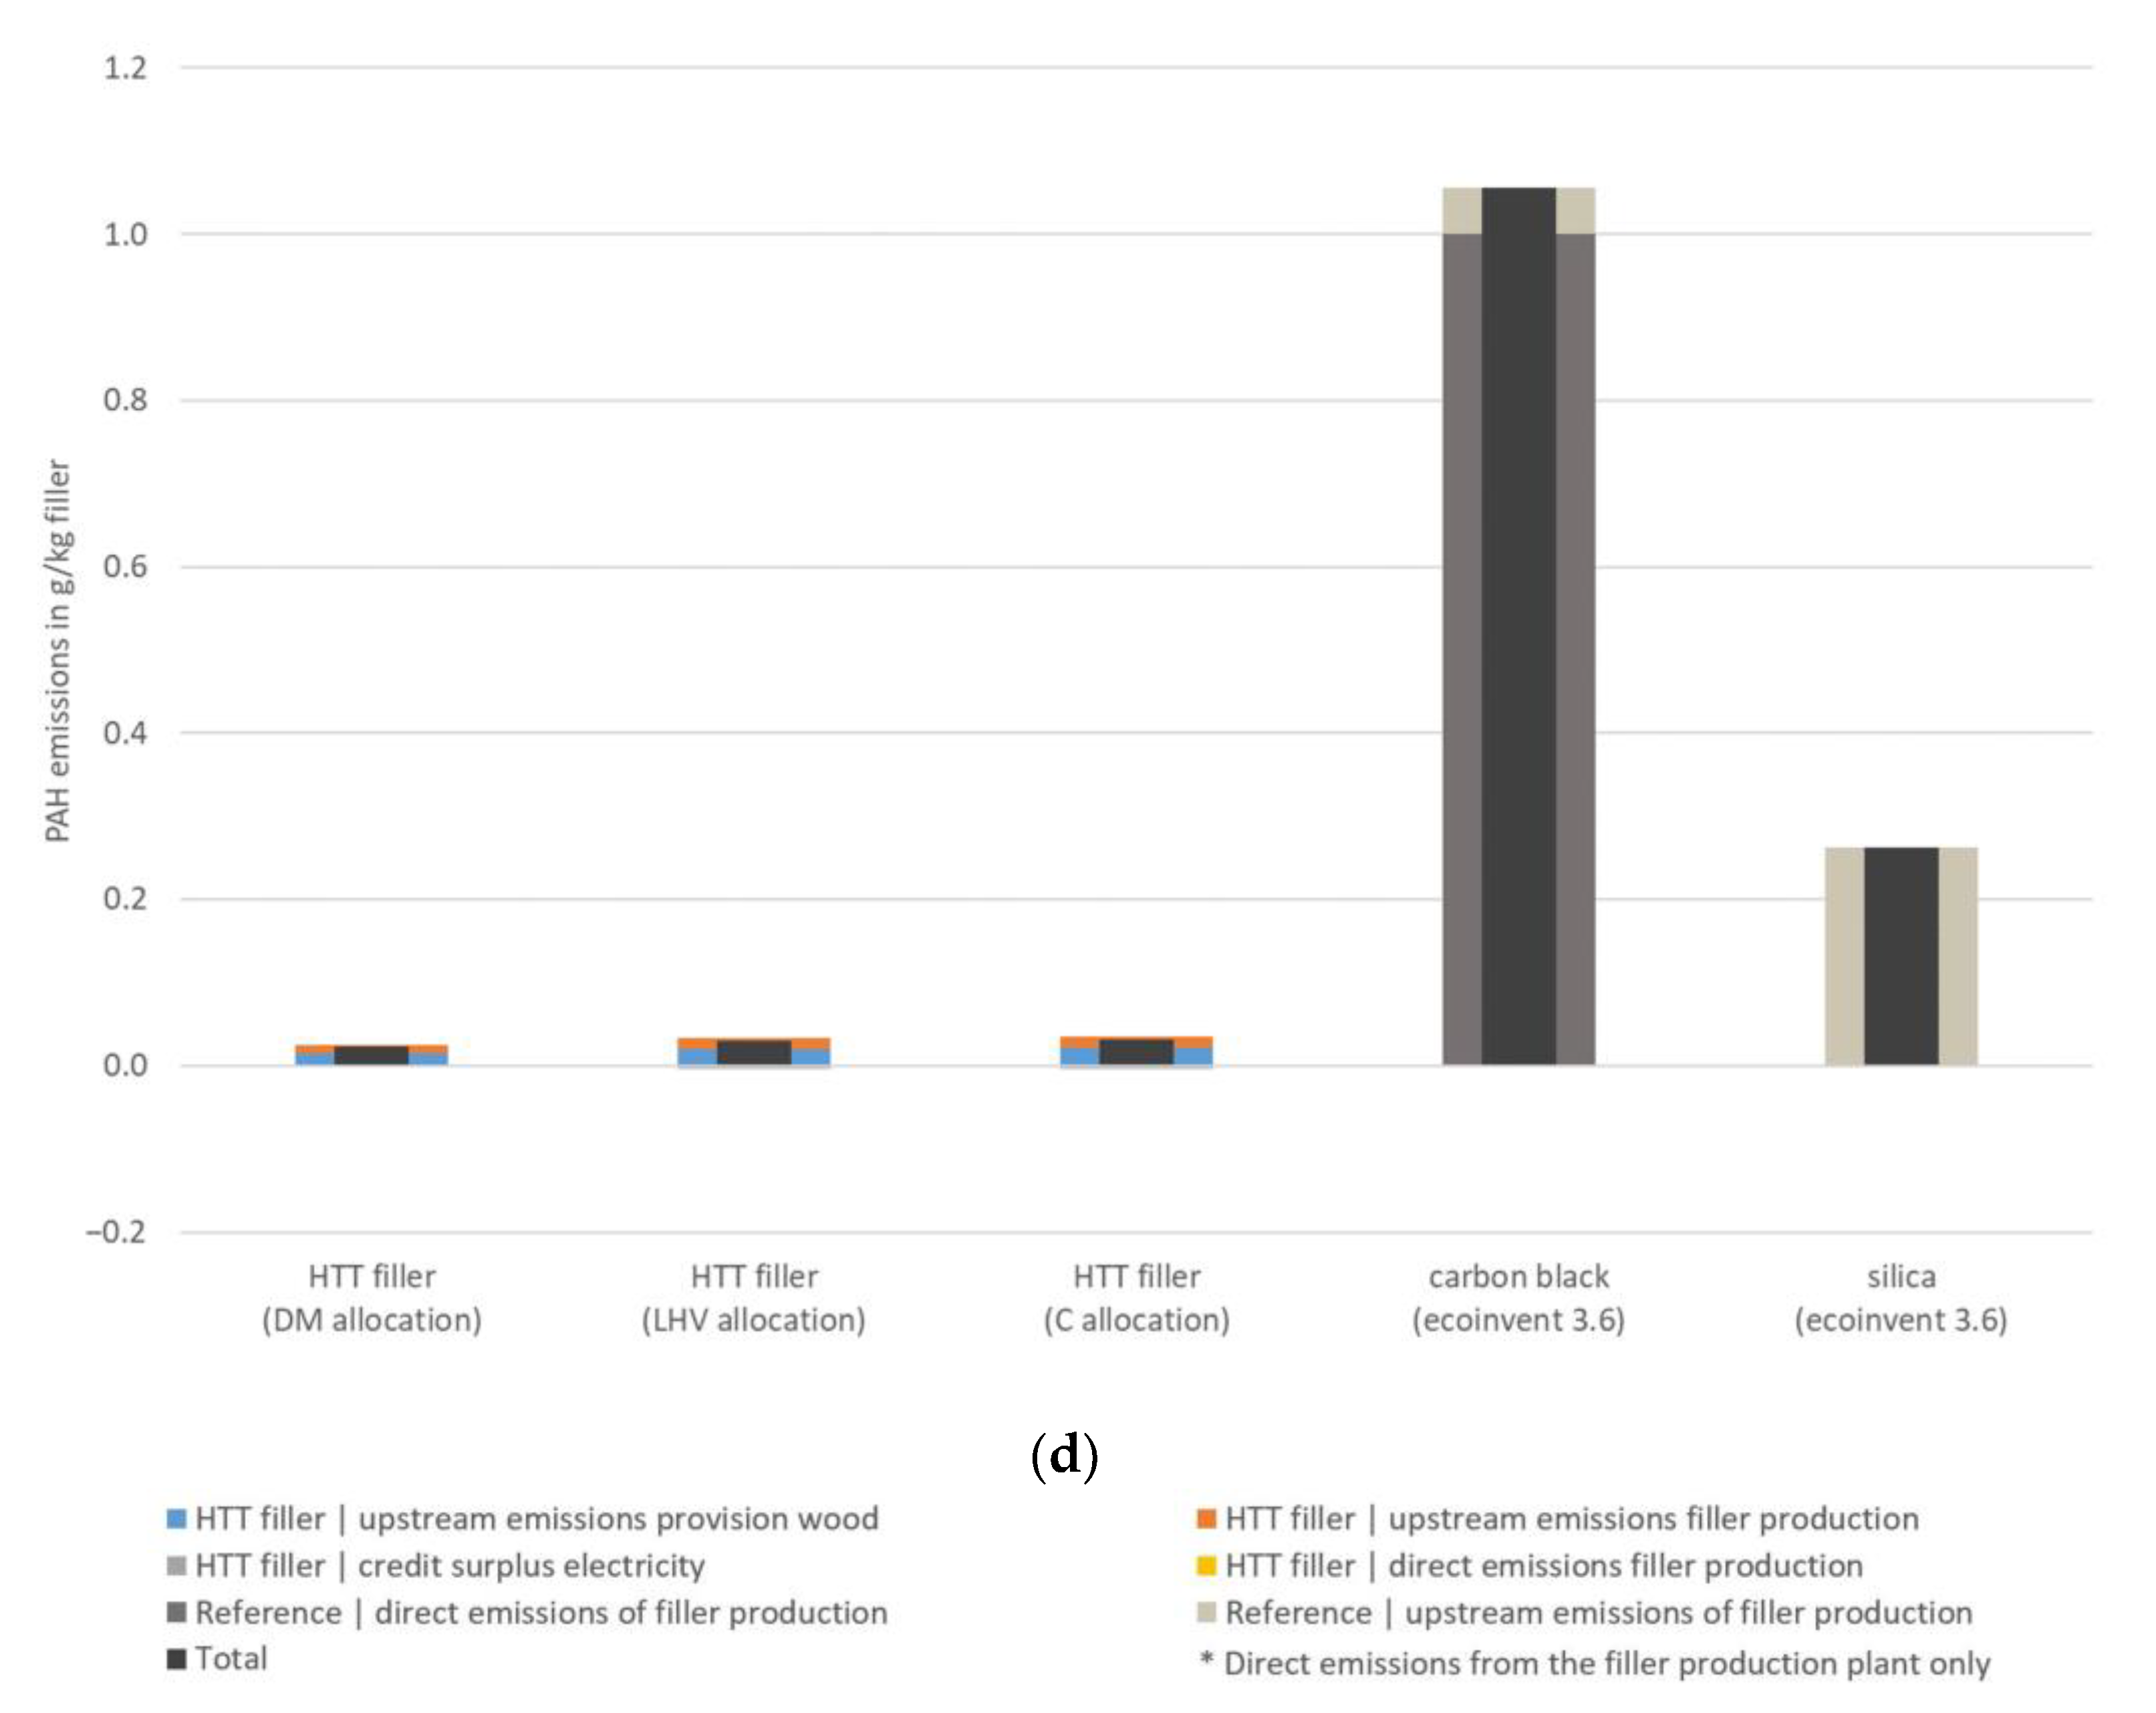
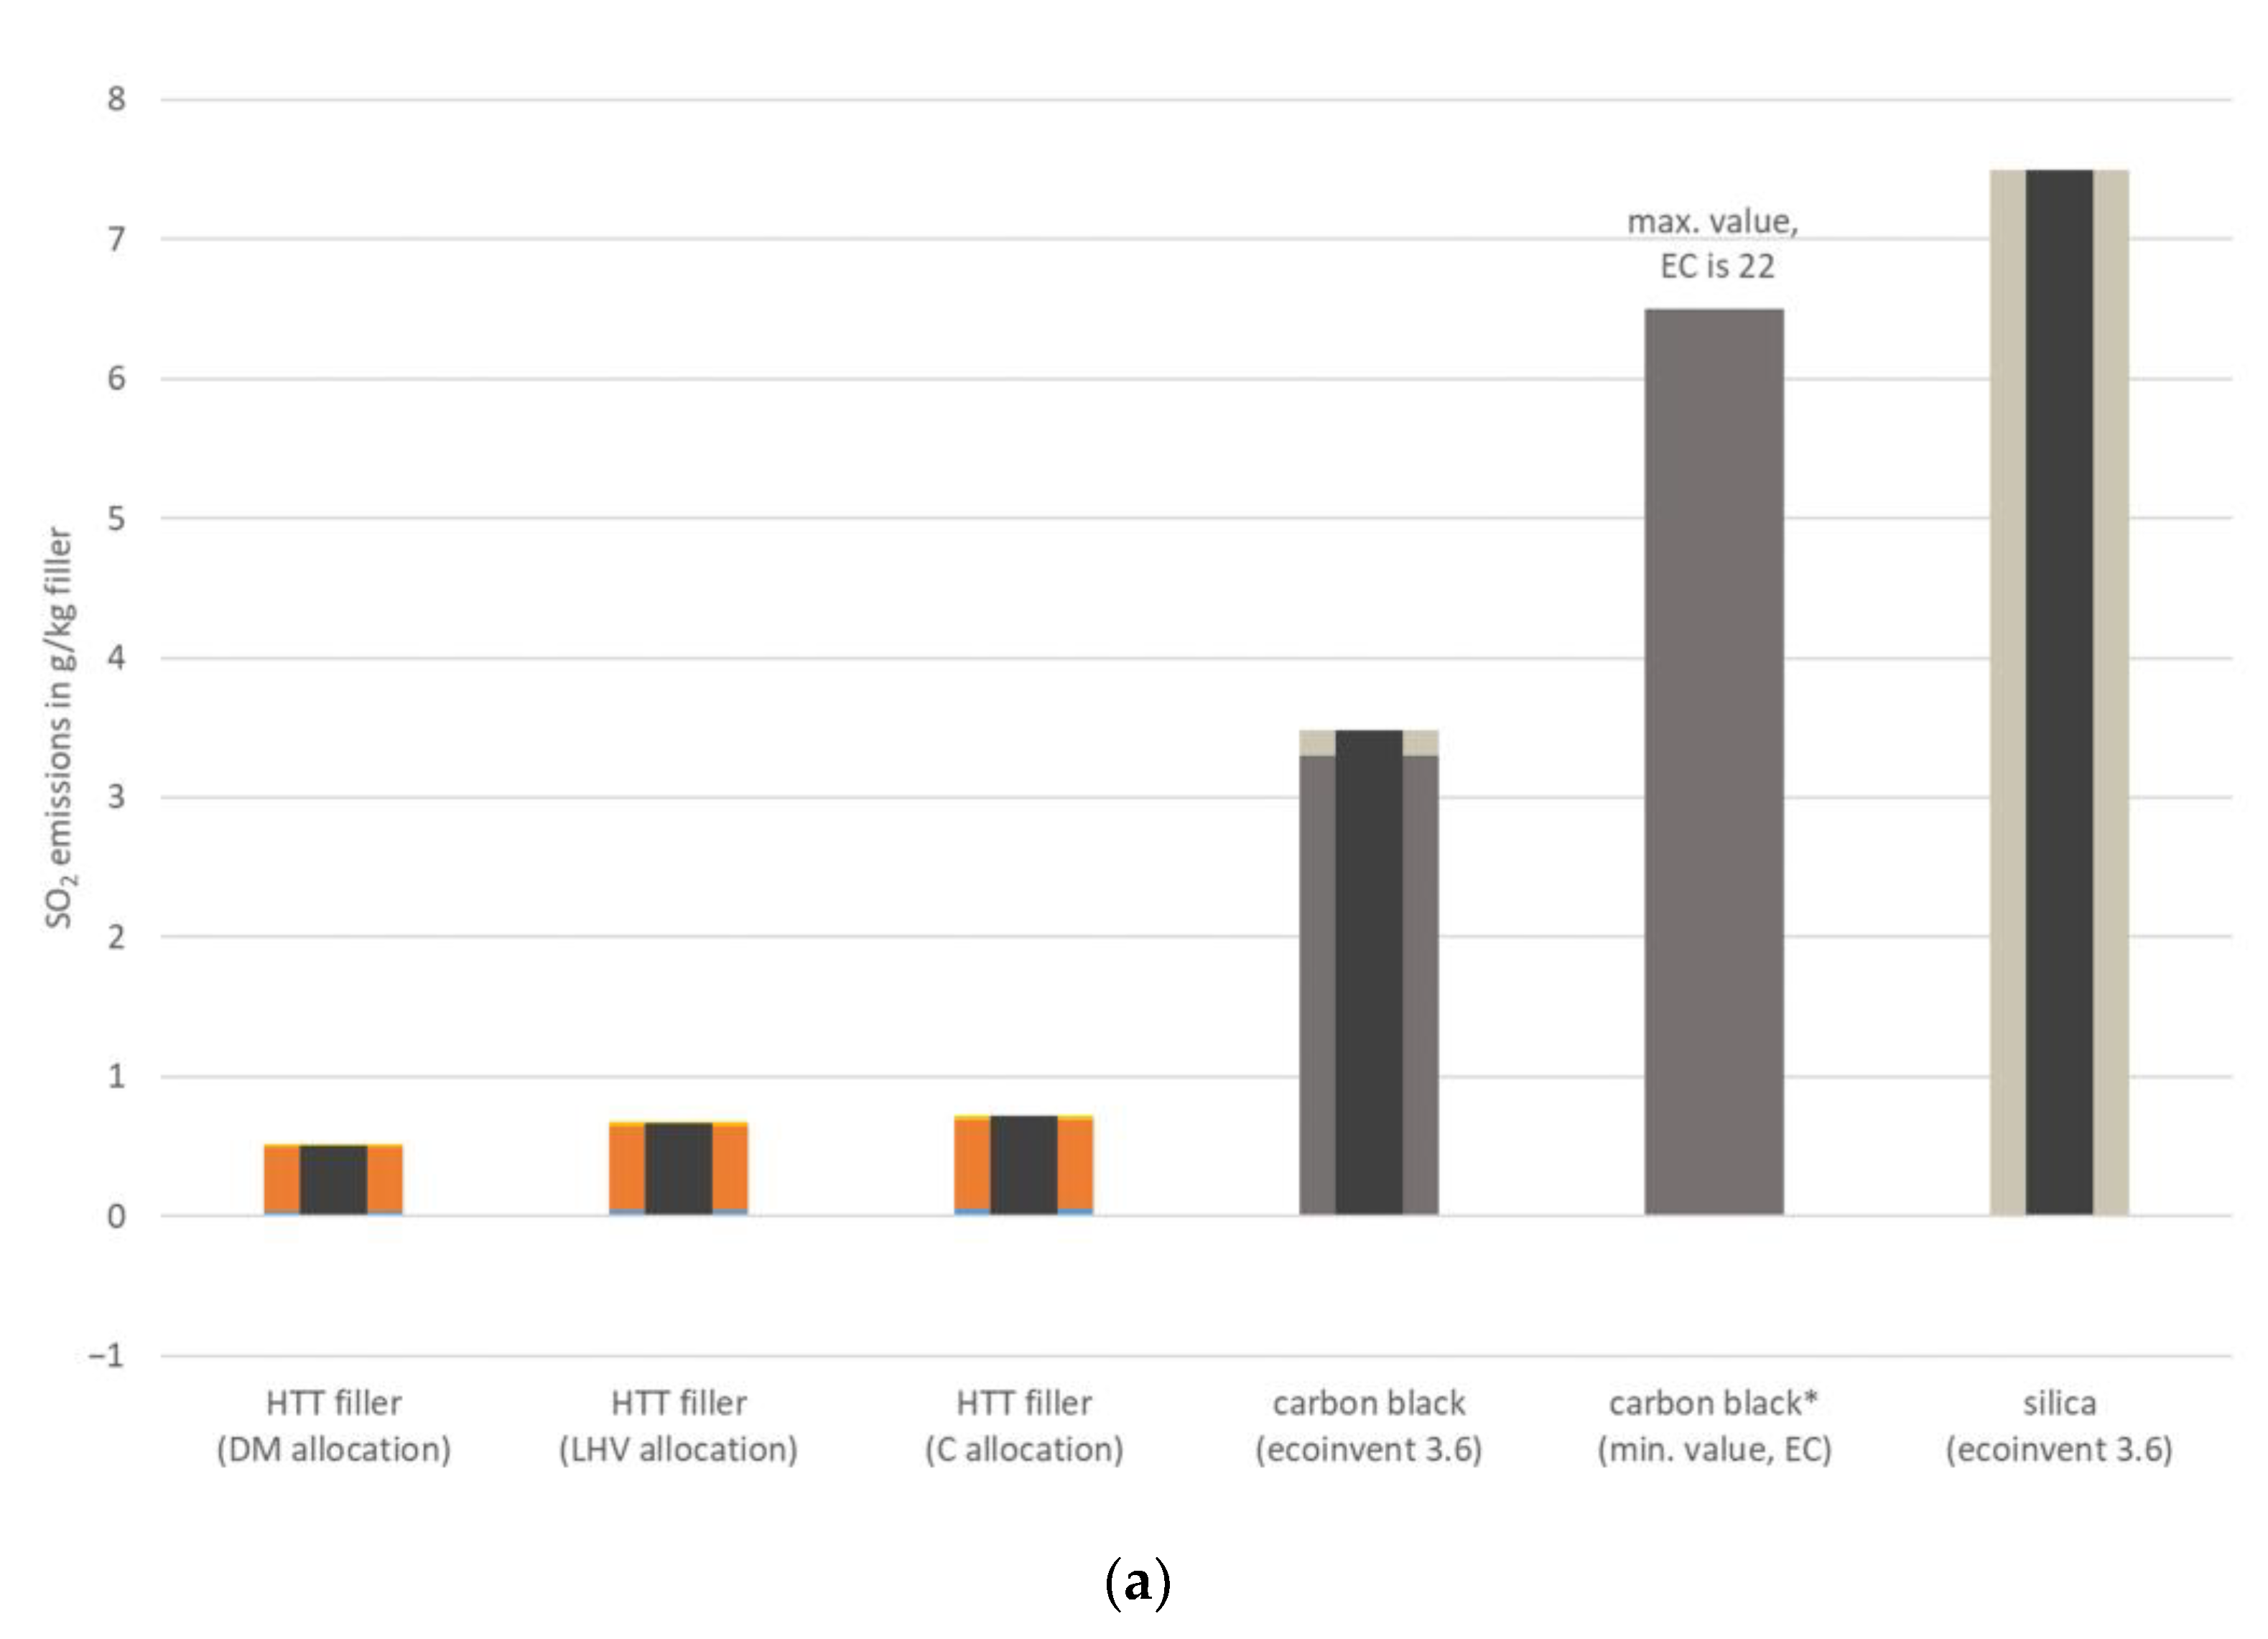
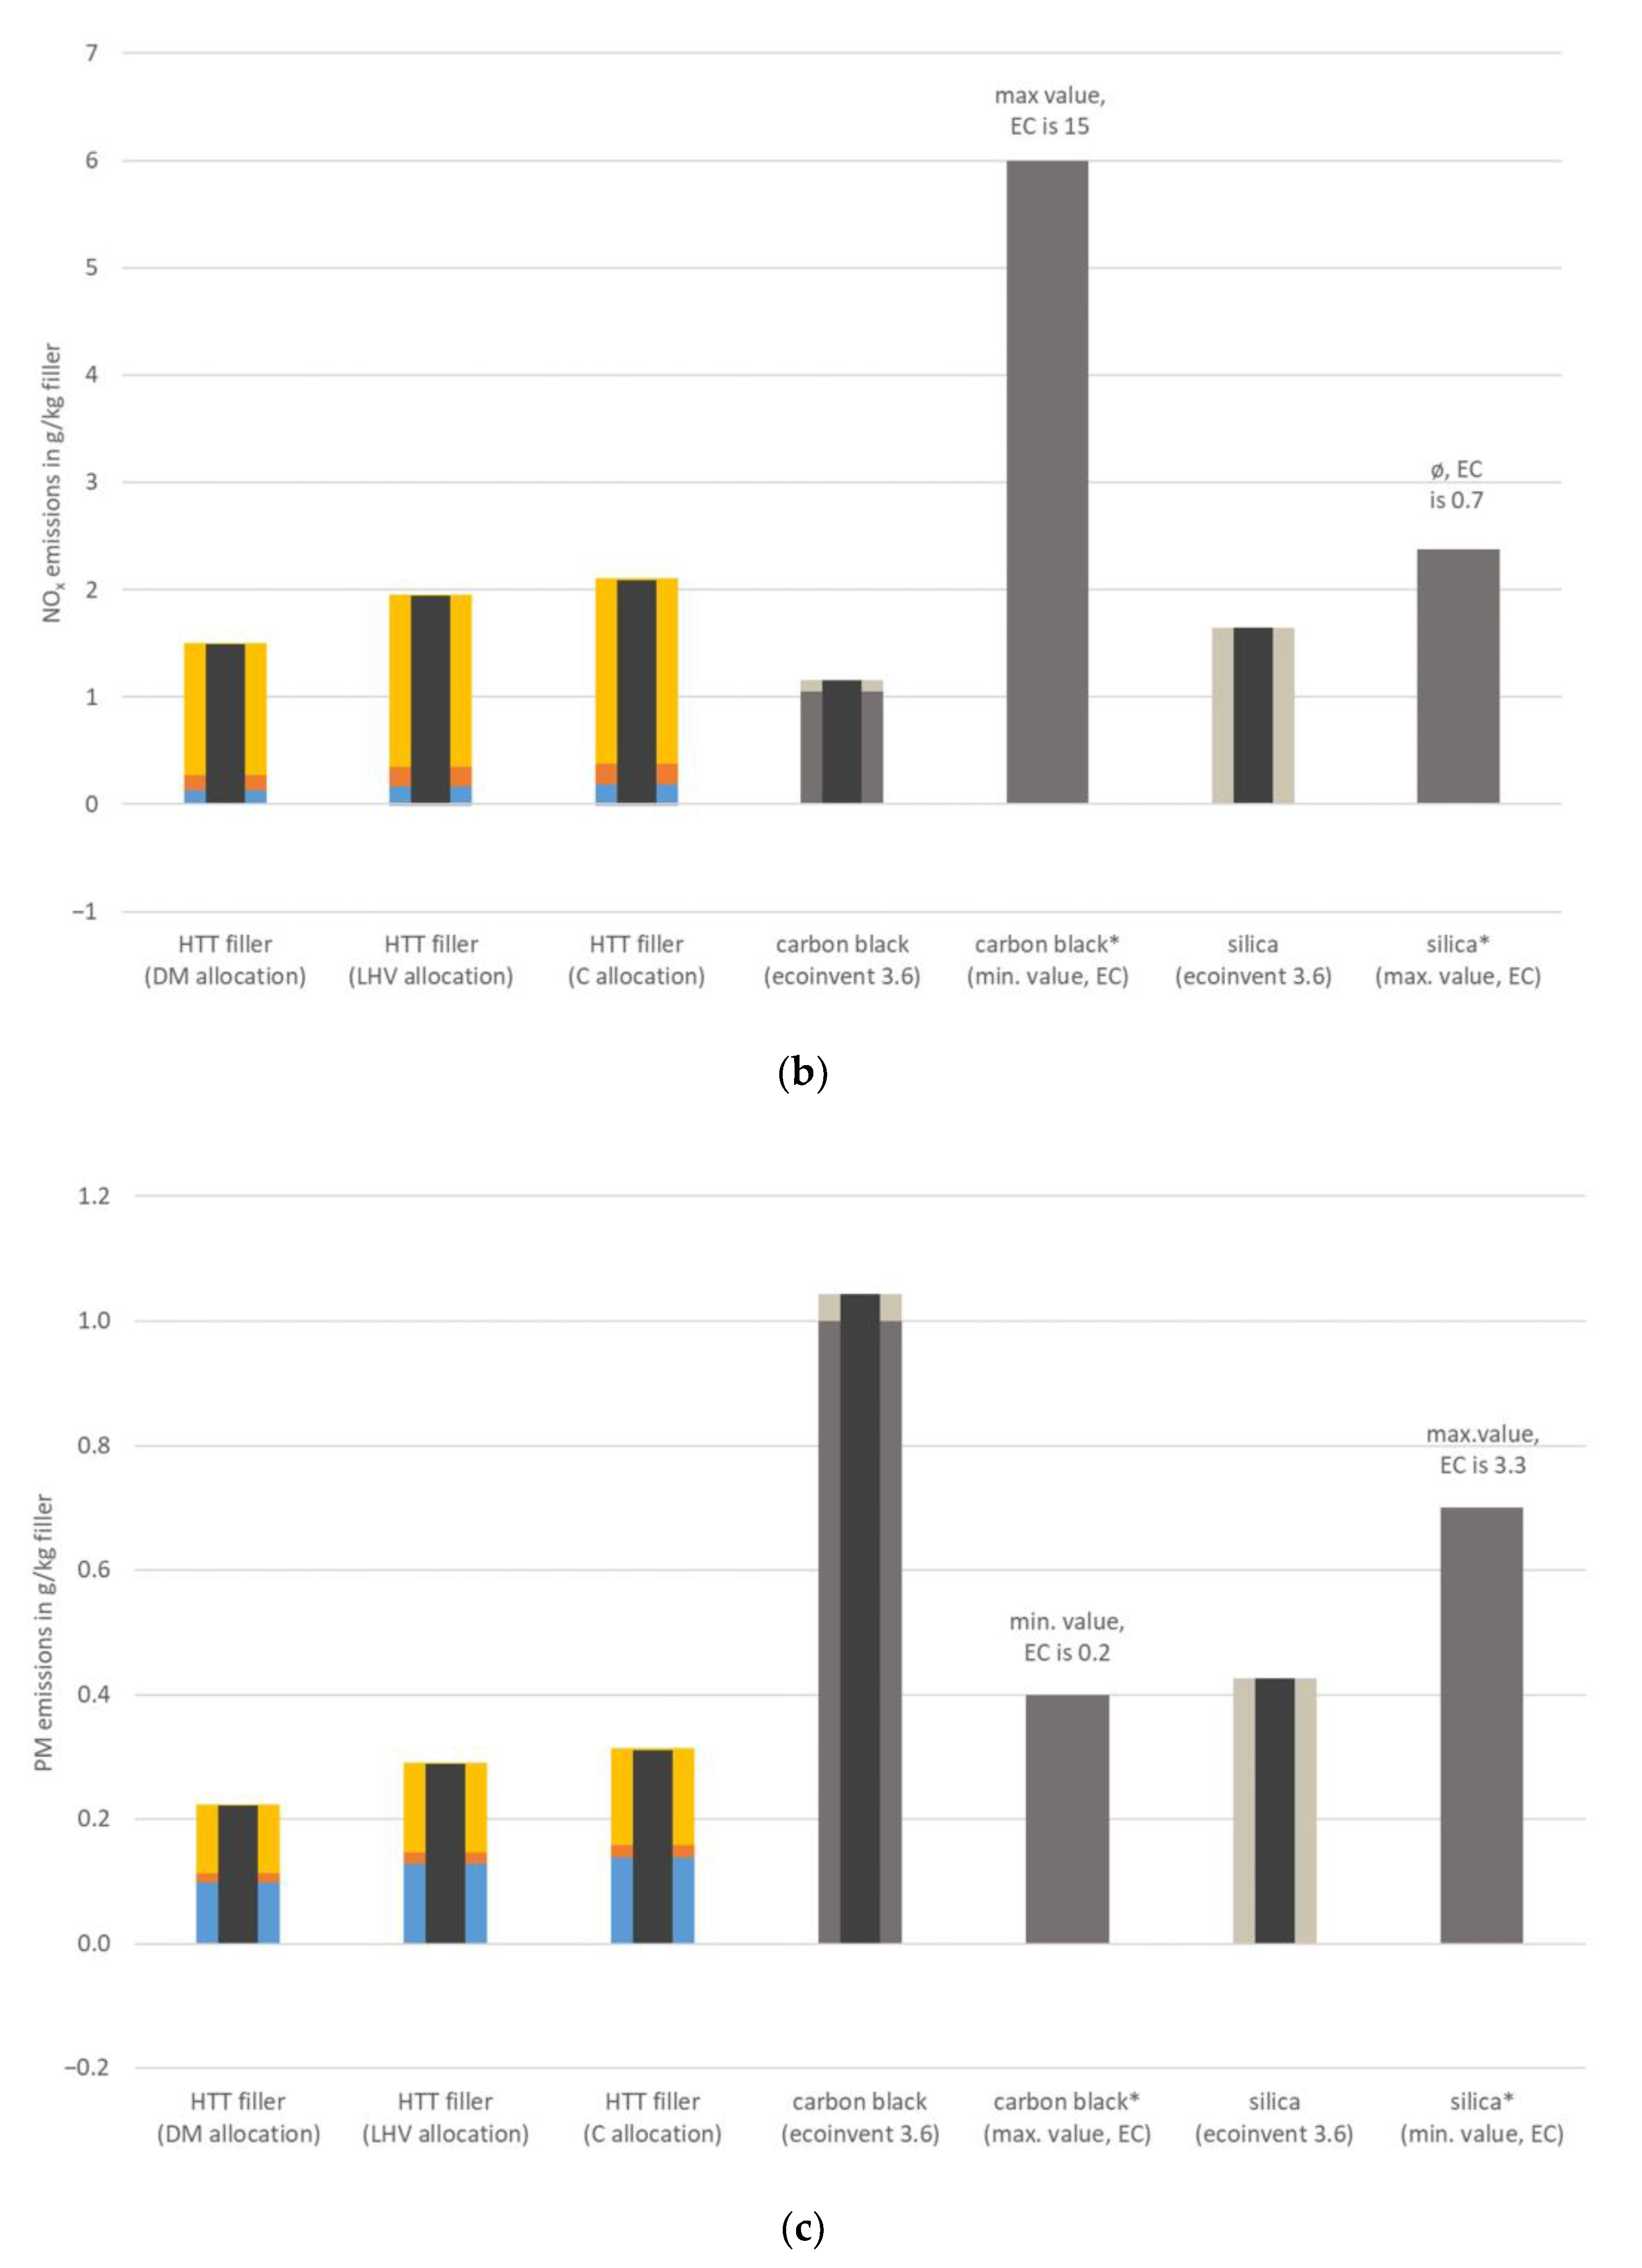
3.3. Emissions and Reduction of Air Pollutants

Sulfur dioxide (SO2) is mainly released during the combustion of sulfur-containing energy sources [50]. Figure 5a clearly shows that most SO2 emissions from the HTT process chain are not emitted during the combustion of lignin and natural gas at the integrated pulp and filler production site, but arise from the upstream chain during the production of the auxiliary materials used. Overall, Figure 5a shows that the SO2 emissions from the HTT filler process chain are significantly lower than those from carbon black and silica. Potentially, 80–85% of SO2 emissions can be saved compared to carbon black (ecoinvent data) and 90–93% compared to silica. The specification of direct SO2 emissions from the EC reference document for carbon black is striking. Here, the minimum value is double the direct emissions of the production plant according to the ecoinvent data. The wide range of SO2 emissions is based on the different sulfur contents in the raw material. SO2 emissions can be reduced by targeted flue gas treatment in the flue gas flow.
In principle, NOx emissions are mainly caused by combustion processes in industrial plants or engines, in certain industrial processes and in agriculture [51]. In the HTT filler process chain, most NOx emissions are released directly via combustion of the lignin and the natural gas and less via upstream emissions of the auxiliary materials used in the HTT filler production process and the wood and chip supply (see Figure 5b). NOx emissions can be reduced through targeted flue gas treatments in the flue gas stream. In contrast to the GHG and SO2 emissions, the NOx emissions of the HTT filler process chain are equal to or higher than those of carbon black and silica (according to ecoinvent data). However, if the NOx emissions from the HTT filler process chain are only compared with the direct NOx emissions of carbon black and silica production according to the EC reference document, there would be slight savings compared to the maximum NOx values of silica production and considerable savings compared to carbon black production.
PM is mainly emitted as a result of combustion processes (in engines or stationary) and from production processes (e.g., manufacturing of metals) [52].
In this study, PM with particle sizes of <2.5 μm, between 2.5 and 10 μm, and >10 μm are considered. As shown in Figure 5c, the PM emissions of the HTT filler process chain are lower than those of carbon black and silica production. Compared to the carbon black and silica process chains, 70–79% and 27–48% of the PM emissions can be saved, respectively. The PM emissions in the HTT filler process chain come in roughly equal parts from the direct combustion of the lignin/natural gas and from the provision of the wood chips and wood.
Additionally, in the case of PM emissions, the data of the ecoinvent database differ from those of the EC reference document for carbon black and silica production, e.g., the EC reference document for silica production states 0.7–3.3 g PM per kg silica, whereas the ecoinvent dataset does not show any direct PM emissions. However, it is clear that the direct PM emissions at the carbon black production site are higher than those at the integrated HTT filler production site. The direct PM emissions from silica production reported in the EC reference document are also significantly higher than those from HTT filler production.
PAH emissions are generally caused by the incomplete combustion of organic fuels such as wood, coal or oil. However, they are also natural components of fossil raw materials and remain in the products through their further processing [53].
No PAHs are emitted in the pulp and HTT filler production process due to lower combustion temperatures. The PAH emissions originate from the upstream chain in the production of the auxiliary materials used at the pulp and HTT filler production site and from the upstream chain in the provision of the wood and wood chips. Within the HTT filler process chain, much lower amounts of PAHs are emitted compared to the reference fillers. Compared to the silica process chain, about 90% of the PAH emissions can be saved, and compared to industrial carbon black production even more than 95% (see Figure 5d).

3.4. Overall Assessment

Overall, the potential substitution of the reference fillers carbon black and silica by the lignin-based HTT filler could lead to significant savings in GHG, SO2, PM and PAH emissions (see Table 3). Thus, for the GHG emissions and these air pollutants, the hypothesis could be confirmed that the replacement of the conventional fillers by the HTT filler leads to an environmental benefit, at least within this study. The highest savings in GHG and PAH emissions would result from the substitution of carbon black. In the case of NOx emissions, with the exception of the HTT filler allocated according to dry matter content, there would be additional emissions compared to the references. However, this only applies if the reference data come from the ecoinvent database. However, the EC best available techniques reference document [45] shows direct NOx emissions from the production plants for silica and carbon black production that are higher than the total NOx emissions of the HTT filler.
As generally demonstrated in the literature [49], the choice of the allocation method used between pulp and HTT filler also has an influence on the level of the balanced emissions.

4. Discussion

The results show a high potential to reduce GHG emissions and the considered air pollutants (except for NOx emissions) compared to the emissions of the conventional fillers carbon black and silica. These results depend strongly on the level of emissions of the defined reference fillers, for which different numbers are given from different data sources. For example, the values from the ecoinvent database for SO2 and NOx emissions for carbon black are significantly lower than those from the EC reference document, and while no direct NOx emissions are shown for silica in the ecoinvent database, some are listed in the EC reference document. The ecoinvent dataset presents generic LCA data for different products and services based on a variety of industry and other literature data. The EC reference document presents emission data for the best available technologies. ‘Best’ means most effective in achieving a high general level of protection of the environment [45]. Different data sources lead to different results. Further reasons could not be determined during the study. However, this example should make clear that relying on only one reference value (as is usually done in studies) from an internationally recognized database may not be sufficient. These values should be scrutinized more intensively and/or other sources should be used as well. Furthermore, the higher NOx emissions compared to the ecoinvent data do not pose a health threat since the pulp mill is already in operation and thus compliance with the NOx limit values according to the Federal Emission Control Act is guaranteed.
In addition, the GHG, SO2, PAH and PM emission reduction potential is so high because the filler production is assumed to be integrated into existing pulp mills. These have already been producing for a long time and therefore most of the processes are already optimized. The concepts for integrating the filler production are designed as optimally as possible and material and energy are used in a synergetic manner and are also recycled wherever possible. This is already reflected in the low emissions associated with lignin-based HTT filler production. Additionally, there is a potential for a further reduction of emissions in replacing the energy source for quicklime production. If natural gas were replaced by a renewable energy source, 0.18 kg CO2 eq. per kg HTT filler could be saved, additionally.
Another limitation of this study is that the fillers probably cannot be substituted one-to-one. As already mentioned, in most cases, the production of fillers is already adapted in such a way that they have specific properties according to their subsequent field of application. In addition, not every produced filler can meet the requirements of every application, e.g., for treads or side surfaces of car tires or window sealings. For further comparative environmental assessments, this means that statements about the environmental advantages compared to the reference fillers can only be made individually for a specific filler in a specific application. Only in these cases is the transferability of LCA results possible. Here, in this study the comparison of fillers within a cradle-to-gate assessment is a first step to obtain a trend regarding the emissions. Further research is ongoing to investigate how to reach specific properties, e.g., mechanical properties or durability, and to analyze the behavior of the HTT filler during blending into polymers and within use and the end-of-life phase compared to the fillers carbon black and silica.
Furthermore, it has to be emphasized that a cradle-to-gate assessment has been conducted in this study. Thus, the results of GHG, SO2, NOx, PM and PAH emissions only apply up to the production of the filler (to-gate). For a complete cradle-to-grave assessment, the expenditures of the further use and disposal phases have to be included in the balancing, and a complete carbon balancing would also have to be carried out. For the latter, the biogenic CO2 emissions released within the disposal phase of lignin-based HTT filler and the fossil CO2 emissions from rotting/combustion of carbon black would have to be taken into account. This would lead to higher absolute emission values in total compared to the cradle-to-gate emissions presented here.

5. Conclusions

The environmental cradle-to-gate assessment within this study shows that an assumed one-to-one substitution of the conventional, finite resource-based reference fillers carbon black and silica with the lignin-based HTT filler in an existing pulp mill would be associated with very high savings in GHG emissions (approx. 5 kg CO2 eq/kg filler), SO2 emissions (80–93%) and PAH emissions (88–98%). Depending on the reference filler, a significant reduction in PM emissions can also be expected. These would be 27–43% compared to silica and 70–79% compared to carbon black. Compared with the reference fillers (only ecoinvent data), the NOx emissions are the same or higher.

Supplementary Materials

The following supporting information can be downloaded at: https://www.mdpi.com/article/10.3390/su14095393/s1: Table S1: Charact. EcoinventData; Table S2: Direct emissions; Table S3: combustion carbon black.

Author Contributions

Conceptualization, K.M. and L.R.; methodology, K.M., L.R., S.M. and B.H.; software, K.M. and L.R.; validation, K.M., L.R., S.M., B.H. and D.T.; investigation, K.M. and L.R.; data curation, K.M.; writing—original draft preparation, K.M. and L.R.; writing—review and editing, S.M., B.H. and D.T.; visualization, K.M. and L.R.; supervision, S.M., B.H. and D.T.; project administration, K.M.; funding acquisition, K.M. All authors have read and agreed to the published version of the manuscript.

Funding

This research was funded by the Federal Ministry of Education and Research, grant number 03XP0160D.

Acknowledgments

We would like to thank all project participants of the BIOKOFF project (grant number 03XP0160D) for the fruitful discussions and the support, also by the project management (PtJ) Jülich. We furthermore acknowledge helpful comments from the reviewers.

Conflicts of Interest

The authors declare no conflict of interest. The funder had no role in the design of the study; in the collection, analyses or interpretation of data; in the writing of the manuscript, or in the decision to publish the results.

References

  1. United Nations: Transforming Our World: The 2030 Agenda for Sustainable Development. Available online: https://sdgs.un.org/sites/default/files/publications/21252030%20Agenda%20for%20Sustainable%20Development%20web.pdf (accessed on 30 August 2021).
  2. European Commission. A Sustainable Bioeconomy for Europe: Strengthening the Connection between Economy, Society and the Environment; Publications Office: Luxembourg, 2018. [Google Scholar] [CrossRef]
  3. Federal Ministry of Education and Research; Federal Ministry of Food and Agriculture. National Bioeconomy Strategy. Available online: https://www.bmel.de/SharedDocs/Downloads/EN/Publications/national-bioeconomy-strategy-summary.pdf;jsessionid=720125764F5005E38C017FF03B75D03C.live842?__blob=publicationFile&v=6pdf;jsessionid=CFF924DFD4A024E0A2E37846D72EA3D6.live852?__blob=publicationFile&v=4 (accessed on 30 August 2021).
  4. International Advisory Council on Global Bioeconomy. Global Bioeconomy Policy Report (IV): A Decade of Bioeconomy Policy Development around the World. Available online: https://gbs2020.net/wp-content/uploads/2020/11/GBS-2020_Global-Bioeconomy-Policy-Report_IV_web.pdf (accessed on 30 August 2021).
  5. United Nations: Paris Agreement. Available online: https://unfccc.int/sites/default/files/english_paris_agreement.pdf (accessed on 30 August 2021).
  6. Joffres, B.; Laurenti, D.; Charon, N.; Daudin, A.; Quignard, A.; Geantet, C. Thermochemical Conversion of Lignin for Fuels and Chemicals: A Review. Oil Gas Sci. Technol. Rev. d’IFP Energ. Nouv. 2013, 68, 765–783. [Google Scholar] [CrossRef]
  7. Ekielski, A.; Mishra, P.K. Lignin for Bioeconomy: The Present and Future Role of Technical Lignin. Int. J. Mol. Sci. 2021, 22, 63. [Google Scholar] [CrossRef] [PubMed]
  8. RoadToBio: Roadmap for the Chemical Industry in Europe towards a Bioeconomy. 2019. Available online: https://roadtobio.eu/uploads/publications/roadmap/RoadToBio_strategy_document.pdf (accessed on 25 March 2022).
  9. Demir, M.; Kahveci, Z.; Aksoy, B.; Palapati, N.K.R.; Subramanian, A.; Cullinan, H.T.; El-Kaderi, H.M.; Harris, C.T.; Gupta, R.B. Graphitic Biocarbon from Metal-Catalyzed Hydrothermal Carbonization of Lignin. Ind. Eng. Chem. Res. 2015, 54, 10731–10739. [Google Scholar] [CrossRef]
  10. Ashori, A. Nonwood Fibers—A Potential Source of Raw Material in Papermaking. Polym. Plast. Technol. Eng. 2006, 45, 1133–1136. [Google Scholar] [CrossRef]
  11. Ragauskas, A.J.; Beckham, G.T.; Biddy, M.J.; Chandra, R.; Chen, F.; Davis, M.F.; Davison, B.H.; Dixon, R.A.; Gilna, P.; Keller, M.; et al. Lignin Valorization: Improving Lignin Processing in the Biorefinery. Science 2014, 344, 1246843. [Google Scholar] [CrossRef] [PubMed]
  12. Kang, S.; Li, X.; Fan, J.; Chang, J. A direct synthesis of adsorbable hydrochar by hydrothermal conversion of lignin. Energy Sources Part A Recovery Util. Environ. Eff. 2016, 38, 1255–1261. [Google Scholar] [CrossRef]
  13. Bergius, F.; Specht, H. Die Anwendung Hoher Drucke bei Chemischen Vorgängen und eine Nachbildung des Entstehungsprozesses der Steinkohle; Wilhelm Knapp: Halle, Germany, 1913. [Google Scholar]
  14. Titirici, M.M.; Thomas, A.; Yu, S.-H.; Müller, J.-O.; Antonietti, M. A Direct Synthesis of Mesoporous Carbons with Bicontinuous Pore Morphology from Crude Plant Material by Hydrothermal Carbonization. Chem. Mater. 2007, 19, 4205–4212. [Google Scholar] [CrossRef]
  15. Sevilla, M.; Fuertes, A.B. Chemical and Structural Properties of Carbonaceous Products Obtained by Hydrothermal Carbonization of Saccharides. Chem. A Eur. J. 2009, 15, 4195–4203. [Google Scholar] [CrossRef]
  16. Sevilla, M.; Fuertes, A.B. The production of carbon materials by hydrothermal carbonization of cellulose. Carbon 2009, 47, 2281–2289. [Google Scholar] [CrossRef] [Green Version]
  17. Funke, A.; Ziegler, F. Hydrothermal carbonization of biomass: A summary and discussion of chemical mechanisms for process engineering. Biofuels Bioprod. Biorefin. 2010, 4, 160–177. [Google Scholar] [CrossRef]
  18. Setua, D.K.; Shukla, M.K.; Nigam, V.; Singh, H.; Mathur, G.N. Lignin reinforced rubber composites. Polym. Compos. 2000, 21, 988–995. [Google Scholar] [CrossRef]
  19. Kumaran, M.G.; De, S.K. Utilization of lignins in rubber compounding. J. Appl. Polym. Sci. 1978, 22, 1885–1893. [Google Scholar] [CrossRef]
  20. Košíková, B.; Gregorová, A.; Osvald, A.; Krajčovičová, J. Role of lignin filler in stabilization of natural rubber–based composites. J. Appl. Polym. Sci. 2007, 103, 1226–1231. [Google Scholar] [CrossRef]
  21. Keilen, J.J.; Pollak, A. Lignin for Reinforcing Rubber. Rubber Chem. Technol. 1947, 20, 1099–1108. [Google Scholar] [CrossRef]
  22. Hu, J.; Shen, D.; Wu, S.; Zhang, H.; Xiao, R. Effect of temperature on structure evolution in char from hydrothermal degradation of lignin. J. Anal. Appl. Pyrolysis 2014, 106, 118–124. [Google Scholar] [CrossRef]
  23. Medina-Martos, E.; Istrate, I.-R.; Villamil, J.A.; Gálvez-Martos, J.-L.; Dufour, J.; Mohedano, Á.F. Techno-economic and life cycle assessment of an integrated hydrothermal carbonization system for sewage sludge. J. Clean. Prod. 2020, 277, 122930. [Google Scholar] [CrossRef]
  24. Berge, N.D.; Li, L.; Flora, J.R.; Ro, K. Assessing the environmental impact of energy production from hydrochar generated via hydrothermal carbonization of food wastes. Waste Manag. 2015, 43, 203–217. [Google Scholar] [CrossRef]
  25. Benavente, V.; Fullana, A.; Berge, N.D. Life cycle analysis of hydrothermal carbonization of olive mill waste: Comparison with current management approaches. J. Clean. Prod. 2017, 142, 2637–2648. [Google Scholar] [CrossRef] [Green Version]
  26. Mayer, F.; Bhandari, R.; Gäth, S.A. Life cycle assessment on the treatment of organic waste streams by anaerobic digestion, hydrothermal carbonization and incineration. Waste Manag. 2021, 130, 93–106. [Google Scholar] [CrossRef]
  27. Zhang, J.; Li, G.; Borrion, A. Life cycle assessment of electricity generation from sugarcane bagasse hydrochar produced by microwave assisted hydrothermal carbonization. J. Clean. Prod. 2021, 291, 125980. [Google Scholar] [CrossRef]
  28. Corvalán, C.; Pérez, A.T.E.; Díaz-Robles, L.A.; Cubillos, F.; Vallejo, F.; Gómez, J.; Pino-Cortés, E.; Espinoza-Pérez, L.; Pelz, S.K.; Paczkowski, S.; et al. Life cycle assessment for hydrothermal carbonization of urban organic solid waste in comparison with gasification process: A case study of Southern Chile. Environ. Prog. Sustain. Energy 2021, 40, e13688. [Google Scholar] [CrossRef]
  29. Owsianiak, M.; Ryberg, M.; Renz, M.; Hitzl, M.; Hauschild, M.Z. Environmental Performance of Hydrothermal Carbonization of Four Wet Biomass Waste Streams at Industry-Relevant Scales. ACS Sustain. Chem. Eng. 2016, 4, 6783–6791. [Google Scholar] [CrossRef] [Green Version]
  30. Stobernack, N.; Mayer, F.; Malek, C.; Bhandari, R. Evaluation of the energetic and environmental potential of the hydrothermal carbonization of biowaste: Modeling of the entire process chain. Bioresour. Technol. 2020, 318, 124038. [Google Scholar] [CrossRef]
  31. Ischia, G.; Fiori, L. Hydrothermal Carbonization of Organic Waste and Biomass—A Review on Process, Reactor, and Plant Modeling. Waste Biomass Valorization 2021, 12, 2797–2824. [Google Scholar] [CrossRef]
  32. Zeymer, M.; Meisel, K.; Clemens, A.; Klemm, M. Technical, Economic, and Environmental Assessment of the Hydrothermal Carbonization of Green Waste. Chem. Eng. Technol. 2017, 40, 260–269. [Google Scholar] [CrossRef]
  33. Meisel, K.; Clemens, A.; Fühner, C.; Breulmann, M.; Majer, S.; Thrän, D. Comparative Life Cycle Assessment of HTC Concepts Valorizing Sewage Sludge for Energetic and Agricultural Use. Energies 2019, 12, 786. [Google Scholar] [CrossRef] [Green Version]
  34. Roy, P.; Dutta, A.; Gallant, J. Evaluation of the life cycle of hydrothermally carbonized biomass for energy and horticulture application. Renew. Sustain. Energy Rev. 2020, 132, 110046. [Google Scholar] [CrossRef]
  35. Kulas, D.G.; Thies, M.C.; Shonnard, D.R. Techno-Economic Analysis and Life Cycle Assessment of Waste Lignin Fractionation and Valorization Using the ALPHA Process. ACS Sustain. Chem. Eng. 2021, 9, 5388–5395. [Google Scholar] [CrossRef]
  36. Duuren, J.B.J.H.; Wild, P.J.; Starck, S.; Bradtmöller, C.; Selzer, M.; Mehlmann, K.; Schneider, R.; Kohlstedt, M.; Poblete-Castro, I.; Stolzenberger, J.; et al. Limited life cycle and cost assessment for the bioconversion of lignin-derived aromatics into adipic acid. Biotechnol. Bioeng. 2020, 117, 1381–1393. [Google Scholar] [CrossRef]
  37. Pérez-Pimienta, J.A.; Rios-Del Toro, E.E.; Amezquita-Garcia, H.J.; Escamilla-Alvarado, C. 5. Advances in biofuels and by-products from lignin. Sustainable Biofuels 2021, 101–130. [Google Scholar] [CrossRef]
  38. Haylock, R.; Rosentrater, K.A. Cradle-to-Grave Life Cycle Assessment and Techno-Economic Analysis of Polylactic Acid Composites with Traditional and Bio-Based Fillers. J. Polym. Environ. 2018, 26, 1484–1503. [Google Scholar] [CrossRef]
  39. Kleppe, P.J. Kraft pulping. Tappi 1970, 53, 35–47. [Google Scholar]
  40. Pawelzik, P.; Carus, M.; Hotchkiss, J.; Narayan, R.; Selke, S.; Wellisch, M.; Weiss, M.; Wicke, B.; Patel, M. Critical aspects in the life cycle assessment (LCA) of bio-based materials – Reviewing methodologies and deriving recommendations. Resour. Conserv. Recycl. 2013, 73, 211–228. [Google Scholar] [CrossRef]
  41. ifu Hamburg GmbH: Umberto LCA+10.0.3, ifu Hamburg GmbH: Hamburg, Germany, 2018.
  42. Swiss Federal Institute of Technology (ETH) Zurich; EPF Lausanne; Paul Scherer Institute (PSI); Swiss Federal Laboratories for Material Science and Technology (Empa); Agroscope; Institute for Sustainability Sciences. Ecoinvent vs. 3.6. Ecoinvent Association: Zurich, Switzerland, 2019. [Google Scholar]
  43. Lauf, T.; Memmler, M.; Schneider, S. Emissionsbilanz Erneuerbarer Energieträger. Available online: https://www.umweltbundesamt.de/sites/default/files/medien/1410/publikationen/2019-11-07_cc-37-2019_emissionsbilanz-erneuerbarer-energien_2018.pdf (accessed on 30 August 2021).
  44. Orion Engineered Carbons GmbH. Sustainability Report 2018. Available online: https://www.orioncarbons.com/en/2018_report_final.pdf (accessed on 10 November 2020).
  45. European Commission. Integrated Pollution Prevention and Control. Reference Document on Best Available Techniques for the Manufacture of Large Volume Inorganic Chemicals—Solids and Others Industry. Available online: https://eippcb.jrc.ec.europa.eu/sites/default/files/2019-11/lvic-s_bref_0907.pdf (accessed on 10 November 2020).
  46. ISO 14040:2006; DIN EN ISO 14040 Environmental Management—Life Cycle Assessment—Principles and Framework. German Institute for Standardization e.V.: Berlin, Germany, 2006.
  47. ISO 14044:2006; DIN EN ISO 14044 Environmental Management—Life Cycle Assessment—Requirements and Guidelines. German Institute for Standardization e.V.: Berlin, Germany, 2006.
  48. Pachauri, R.K.; Mayer, L. Climate Change 2014—Synthesis Report; Intergovernmental Panel on Climate Change: Geneva, Switzerland, 2015. [Google Scholar]
  49. Cherubini, F.; Strømman, A.H.; Ulgiati, S. Influence of allocation methods on the environmental performance of biorefinery products—A case study. Resour. Conserv. Recycl. 2011, 55, 1070–1077. [Google Scholar] [CrossRef]
  50. Umweltbundesamt: Sulphur-Dioxide. Available online: https://www.umweltbundesamt.de/en/topics/air/air-pollutants-at-a-glance/sulphur-dioxide (accessed on 30 August 2021).
  51. Umweltbundesamt: Nitrogen Dioxide. Available online: https://www.umweltbundesamt.de/en/topics/air/air-pollutants-at-a-glance/nitrogen-dioxide (accessed on 30 August 2021).
  52. Umweltbundesamt: Feinstaub-Belastung. Available online: https://www.umweltbundesamt.de/daten/luft/feinstaub-belastung#feinstaubkonzentrationen-in-deutschland (accessed on 10 November 2020).
  53. Umweltbundesamt: Was Sind Polyzyklische Aromatische Kohlenwasserstoffe (PAK), Wie Kann Ich Belastete Produkte Erkennen? Available online: https://www.umweltbundesamt.de/sites/default/files/medien/377/dokumente/faqs-pak.pdf (accessed on 30 August 2021).
Figure 1. Process chain of integrated lignin-based filler production (a) and conventional silica and carbon black filler production (b) with system boundaries; own illustrations.
Sustainability 14 05393 g001
Figure 2. Mass and energy balance of the paper mill with an integrated filler production.
Sustainability 14 05393 g002
Figure 3. Cradle-to-gate GHG emissions of the HTT filler and the reference fillers carbon black and silica. DM = dry matter; LHV = lower heating value; C = carbon.
Sustainability 14 05393 g003
Figure 4. Contribution of individual inputs and credits to total GHG emissions within the HTT filler production chain.
Sustainability 14 05393 g004
Figure 5. Cradle-to-gate SO2 emissions (a), NOx emissions (b), PM emissions (c) and PAH emissions (d) of the HTT filler and of the reference fillers carbon black and silica. DM = dry matter; LHV = lower heating value; C = carbon.
Sustainability 14 05393 g005aSustainability 14 05393 g005bSustainability 14 05393 g005c
Table 1. Allocation factors between HTT filler and pulp. DM = dry matter; LHV = lower heating value; C = carbon.
Allocation FactorsDM ContentLHV ContentC Content
HTT filler0.10.130.14
Pulp0.90.870.86
Table 2. Absolute GHG savings of HTT filler compared to carbon black and silica GHG savings are presented as absolute figures. Relative GHG savings given in percentage of the reference are not suitable because the GHG values of the HTT filler, unlike those of the reference fillers, are negative and would lead to savings higher than one hundred percent. DM = dry matter; LHV = lower heating value; C = carbon.
GHG Saving Compared to
(kg CO2 eq./kg Filler)
Carbon Black
(Ecoinvent 3.6)
Carbon Black
(Orion 2018)
Silica
(Ecoinvent 3.6)
HTT filler (DM allocation)5.085.814.89
HTT filler (LHV allocation)4.985.714.76
HTT filler (C allocation)4.955.684.76
Table 3. Emission savings compared to carbon black and silica (based only on ecoinvent data). GHG savings are presented as absolute GHG savings. Relative GHG savings given in percentage of the reference are not suitable (see Table 2). DM = dry matter; LHV = lower heating value; C = carbon.
Emission Savings
Compared to References
HTT Filler
(DM Allocation)
HTF Filler
(LHV Allocation)
HTT Filler
(C Allocation)
GHG emissions
(kg CO2 eq/kg filler)
   to carbon black5.084.984.95
   to silica4.894.764.76
SO2 emissions
   to carbon black85%82%80%
   to silica93%92%90%
NOx emissions
   to carbon black−22%−40%−45%
   to silica9%−15%−21%
PM emissions
   to carbon black79%72%70%
   to silica48%32%27%
PAH emissions
   to carbon black98%97%97%
   to silica91%89%88%
Publisher’s Note: MDPI stays neutral with regard to jurisdictional claims in published maps and institutional affiliations.

