Article

Effectiveness of Particulate Matter Forecasting and Warning Systems within Urban Areas

1
Department of Forestry and Landscape Architecture, Konkuk University, Seoul 05029, Korea
2
Rural Environment & Resource Division, National Institute of Agricultural Sciences, Wanju-gun 55365, Korea
*
Author to whom correspondence should be addressed.
Sustainability 2022, 14(9), 5394; https://doi.org/10.3390/su14095394
Submission received: 14 March 2022 / Revised: 18 April 2022 / Accepted: 27 April 2022 / Published: 29 April 2022
(This article belongs to the Section Social Ecology and Sustainability)

Abstract

:
The close relation between atmospheric pollution and human health has been well documented. Accordingly, various policies have been enacted worldwide to reduce and regulate air pollution, with most countries having established correlated monitoring systems. Notably in South Korea, increasing concerns about particulate matter (PM) concentrations led to the establishment of a nationwide forecasting and warning system in 2014. In this study, the PM trends in South Korea over the past decade were examined, and the correlated social issues were analyzed. In addition, the relationships between PM concentration, the forecasting–warning system, and people’s urban park use were analyzed to assess the efficacy of policy introduction. The results indicated that PM concentrations were an obstacle to outdoor activities, and the PM forecasting–warning system affected urban park use. Whereas the effects of PM forecasting and warning systems have not been sufficiently explored in practical terms in the literature, this study could be significant in proving the validity of environmental policies through the evidence including urban park visitors. This study also suggests future directions for developing PM forecasting and warning systems.

1. Introduction

Atmospheric pollution can influence citizens’ decision making regarding outdoor activities via multiple paths, including visual or detrimental health effects [1,2,3,4,5]. Over the past decade, interest in air pollution has steadily increased, and the World Health Organization (WHO) has classified air pollution as the greatest risk factor for human health [6,7]. Particulate matter (PM, including PM10 and PM2.5) has a more lethal effect on humans, owing to its small size [8,9]. PM originates from various natural and artificial sources, such as forest fires, traffic, and industrial activities [10,11,12]. Furthermore, PM can remain airborne for extended periods, owing to its small size. When humans are exposed to high concentrations of PM-containing chemical components, serious health issues can occur, such as heart disease, asthma, and respiratory tract illness, all of which can decrease life expectancy [9,13,14,15].
In addition to its direct effect on human health, PM has a negative effect on visibility, as it scatters light, and this effect worsens at higher concentrations (e.g., smog) [16]. Accordingly, low visibility affects peoples’ decisions and willingness to participate in outdoor activities [17]. As such, air pollution, including PM, has negative impacts on various aspects of well-being. Therefore, a great number of countries have established relevant policies to improve overall air quality. Air pollution is also effectively controlled and monitored, and such information is readily available to the general public. Furthermore, various means of monitoring and predicting air pollution trends are being developed.
Particularly in South Korea, the issue of PM has gained popularity relatively rapidly since 2014. Accordingly, various PM-related policies have been enacted, including the Special Act on Particulate Matter Reduction and the PM Forecasting and Warning System. In the present study, we aimed to analyze changes in the perception of PM in South Korea and to determine how the implementation of PM concentration forecasting and warning systems has affected people’s outdoor activities.

2. Literature Review

Various studies have shown that air pollution affects decision making regarding outdoor activities [1,2,3,4,12]. For example, Roberts et al. [2] showed that increasing air pollution concentrations decreased people’s physical activity in the US, whereas Xu et al. [3] studied the relationship between air pollution and travel behavior, revealing that the greater the degree of air pollution, the lower the number of travel area visited and distance traveled. Notably, the correlation pattern with PM concentrations did not differ, owing to levels of concern regarding the correlated health issues and visual effects of PM [12,18]. Similarly, An et al. [4] found that an increase in PM concentrations was correlated with a decrease in physical activity time.
As such, air pollution is closely related to human health and activity, with the associated risks having been emphasized in numerous studies. For example, the WHO noted that nation states should directly provide air pollution information (including PM) to their populace to ensure that individuals are informed [19] and can determine their actions based on this information [20]. Accordingly, to identify the precise degree of air pollution and prepare appropriate countermeasures, countries around the world are monitoring air pollution. In addition, the public can easily access air quality information for major cities around the world in real time. Various air quality maps have been built, and the UN Environment Programme built an urban air action platform to provide air quality data, including information about wildfires, monitoring points, and wind information (https://www.unep.org accessed on 17 January 2022).
Recent studies related to PM monitoring have focused on predicting air pollution and increasing prediction accuracy based on accumulated data [17,20,21,22]. One such study was conducted in China to establish a model to identify and predict the interactions of air pollution sources [7], with the underlying purpose of developing an air quality early warning system for predicting harsh atmospheric conditions to allow for early actions against air pollution. Additionally, Balram et al. conducted a study to predict the concentration of PM2.5 based on air pollution data collected in Zuoying, Taiwan [20]. Within the study, the derived results were used for modeling the air quality warning system. For each method, Bayesian regularized neural network via forward feature selection system (BRNN/FFS) and support vector machine classifier were used. Similarly, a study was carried out in Australia attempting to increase the accuracy of air quality prediction models using an online sequential extreme learning machine (OS-ELM) [21]. As artificial intelligence technology advances, the current research is trending toward building a system for air pollution prediction based on accumulated data.
Air pollution information has also been used as the basis for policy formation, with Canada, the US, and China all implementing PM forecasting systems [23]. Similarly, the government in South Korea has implemented a PM forecasting and warning system, where during periods of poor air quality, necessary information on recommended actions is provided directly to citizens.
Through such policies, citizens have gained access to various types of daily PM information. Inherently, this provision of information plays an important role in increasing the efficacy of related policies, as it enables citizens to improve their level of informedness, which ultimately affects their attitudes and behaviors. Such improvements in information provision appear to affect the level of citizens’ responses to PM; for example, Zhou et al. [24] showed that opinions on travel plans were influenced by air quality classification, as have other similar studies related to air pollution and citizens’ behaviors.
Not only academics and experts but also citizens are paying great attention to the dangers of PM. As previously discussed, a large number of studies have been conducted to increase the accuracy of information provided. However, there is a lack of studies concerning how such increasing information affects citizens’ behavior, as well as on the effect of implementing PM warning systems. Therefore, in this study, we explored the relationship between the concentration of PM and the visitation of major urban parks over the past decade in Seoul, South Korea. With this study, we also examined changes in behavior relating to outdoor activities and in decision making due to the PM forecasting and warning system.

3. Materials and Methods

3.1. Study Setting

3.1.1. PM Forecasting and Warning System in South Korea

In South Korea, a national-level forecasting and warning system that notifies the public of PM concentrations has been in operation since 2014. First introduced in Seoul in 2005, this system was passively implemented with different standards for each local government prior to its expansion. Since the mid-2010s, when PM issues began to significantly gain attention in South Korea, the system has been strengthened into an effective federal system on a unified basis.
PM concentrations are classified into four grades: good, normal, bad, and very bad (Table 1). During normal days, sensitive groups (e.g., children, the elderly, and those with correlated respiratory diseases) are recommended to avoid outdoor activities, whereas during bad or very bad periods, the public and sensitive groups are recommended to restrict excessive outdoor activities.
A PM10 advisory is issued when the average concentration in an area is >150 µg m3 for ≥2 h, considering weather conditions, whereas a PM10 warning is issued when the average concentration exceeds 300 µg m3 for 2 h. Alternatively, advisories and warnings for PM2.5 are issued when the average concentrations are 75 and 150 µg m3, respectively, for ≥2 h.
The government also provides appropriate guidelines for public action, along with PM forecasts and warnings, including restrictions on outdoor activities for sensitive groups; wearing masks when outside; refraining from visiting areas with high traffic; restrictions on the operation of outdoor sports facilities; and refraining from outdoor activities, such as park use.

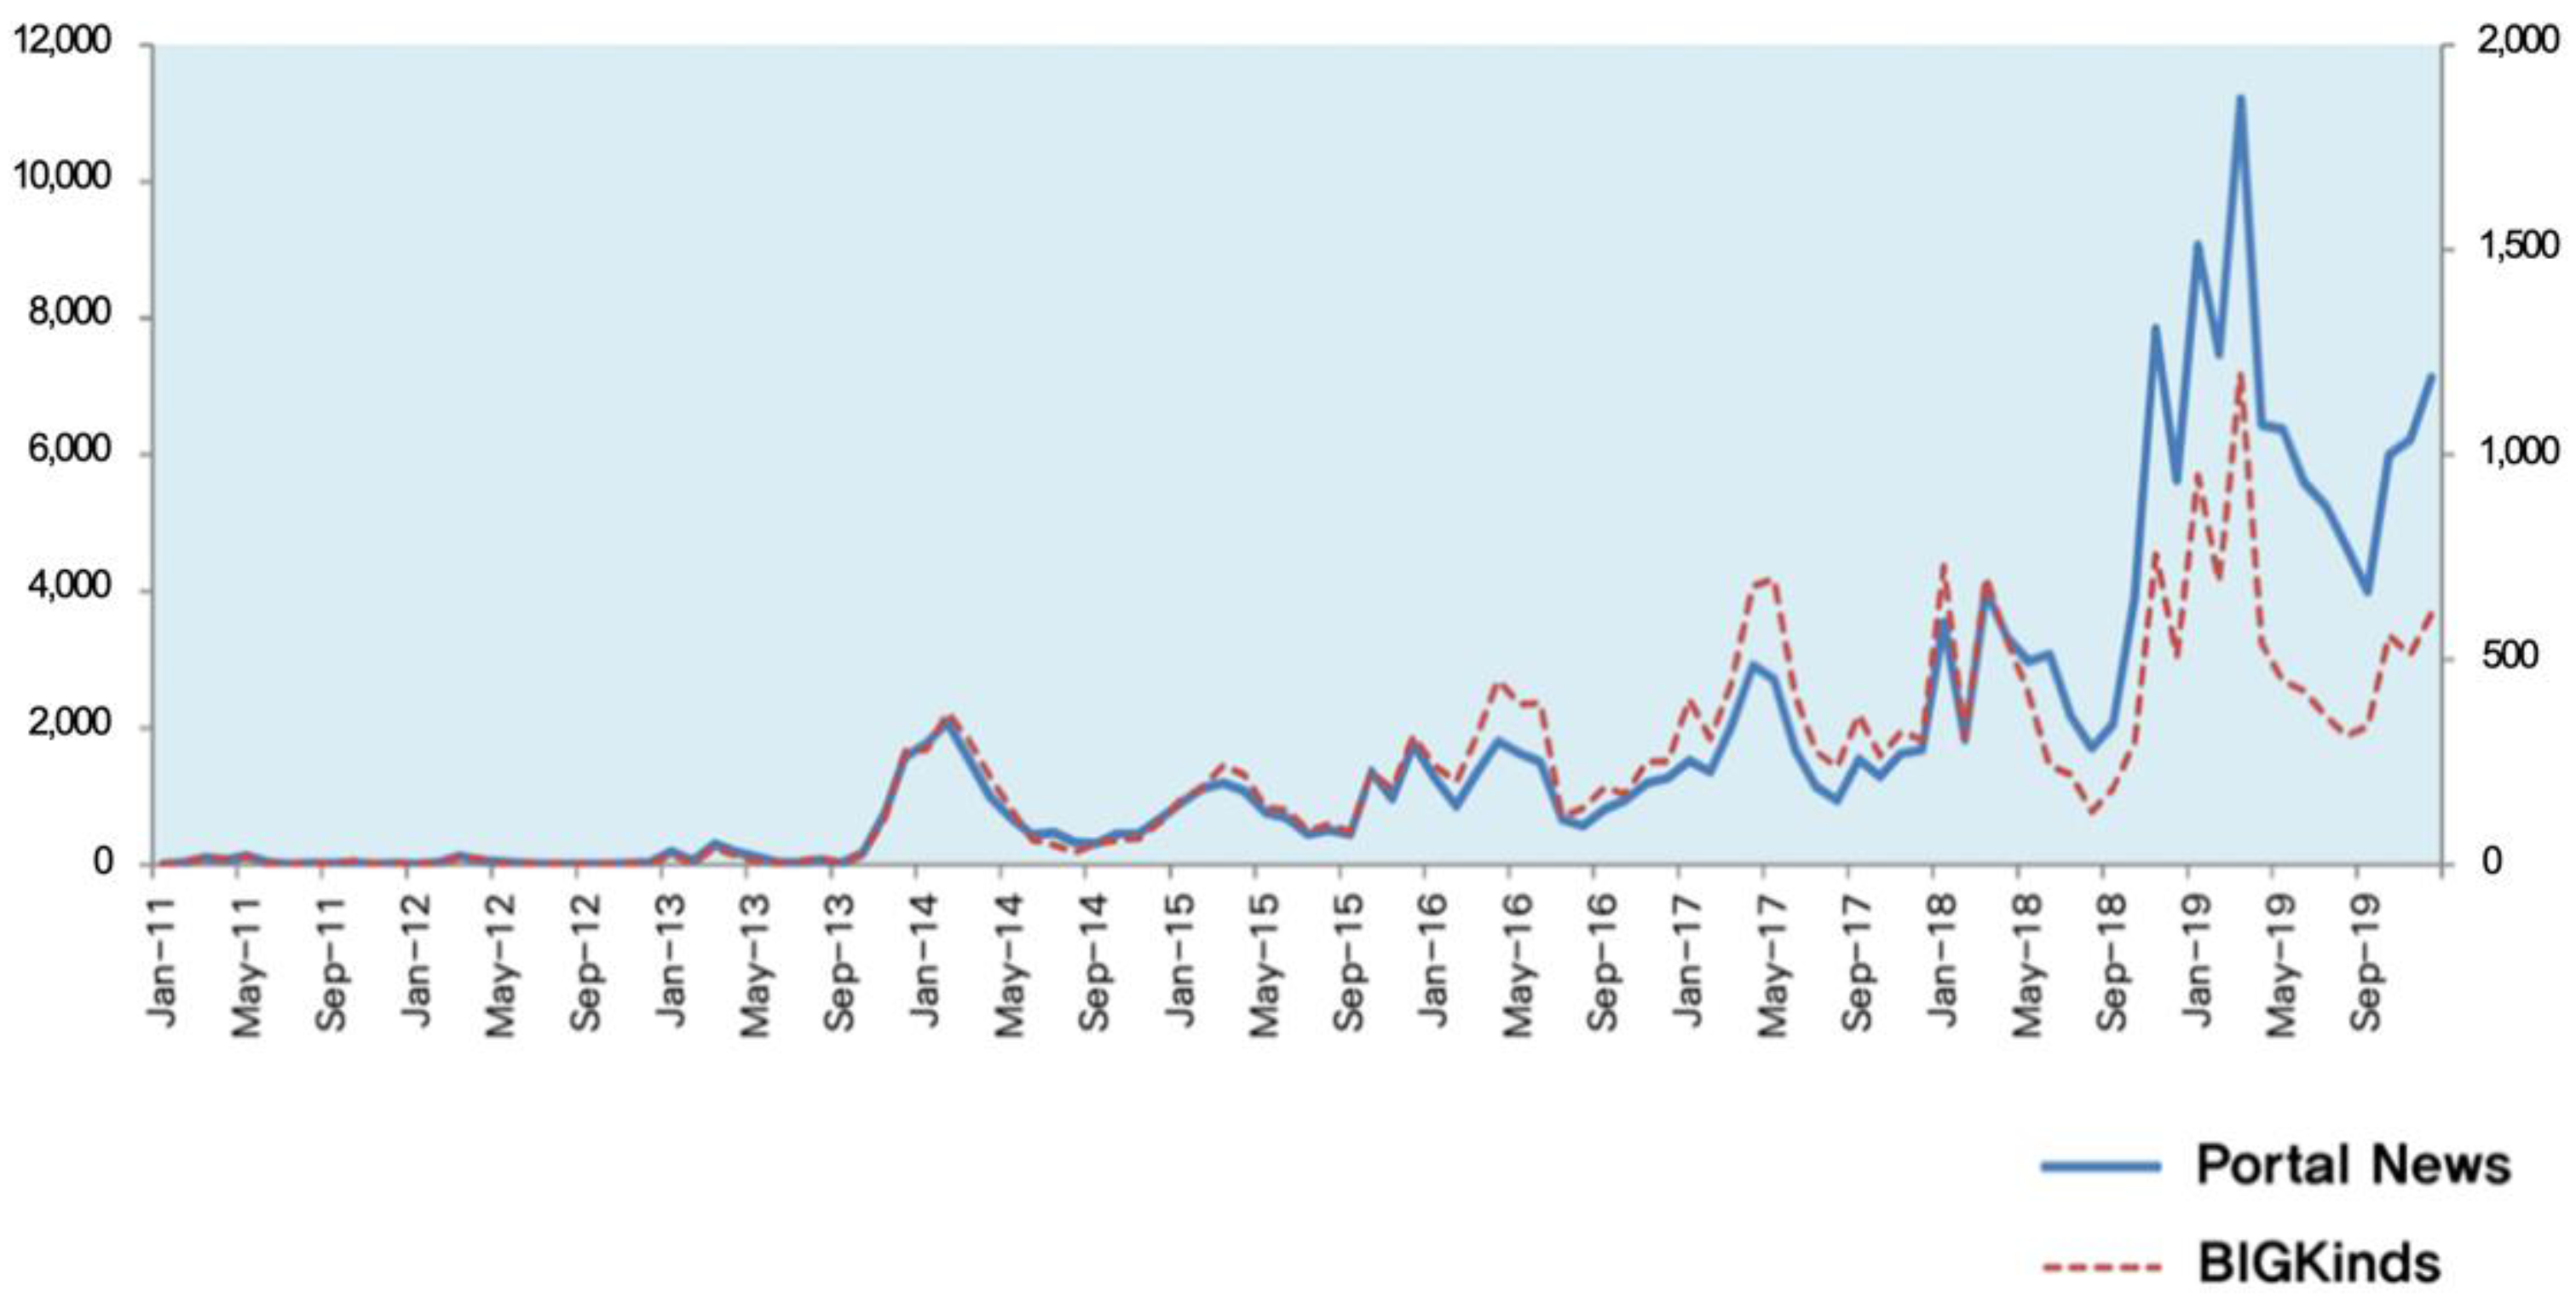
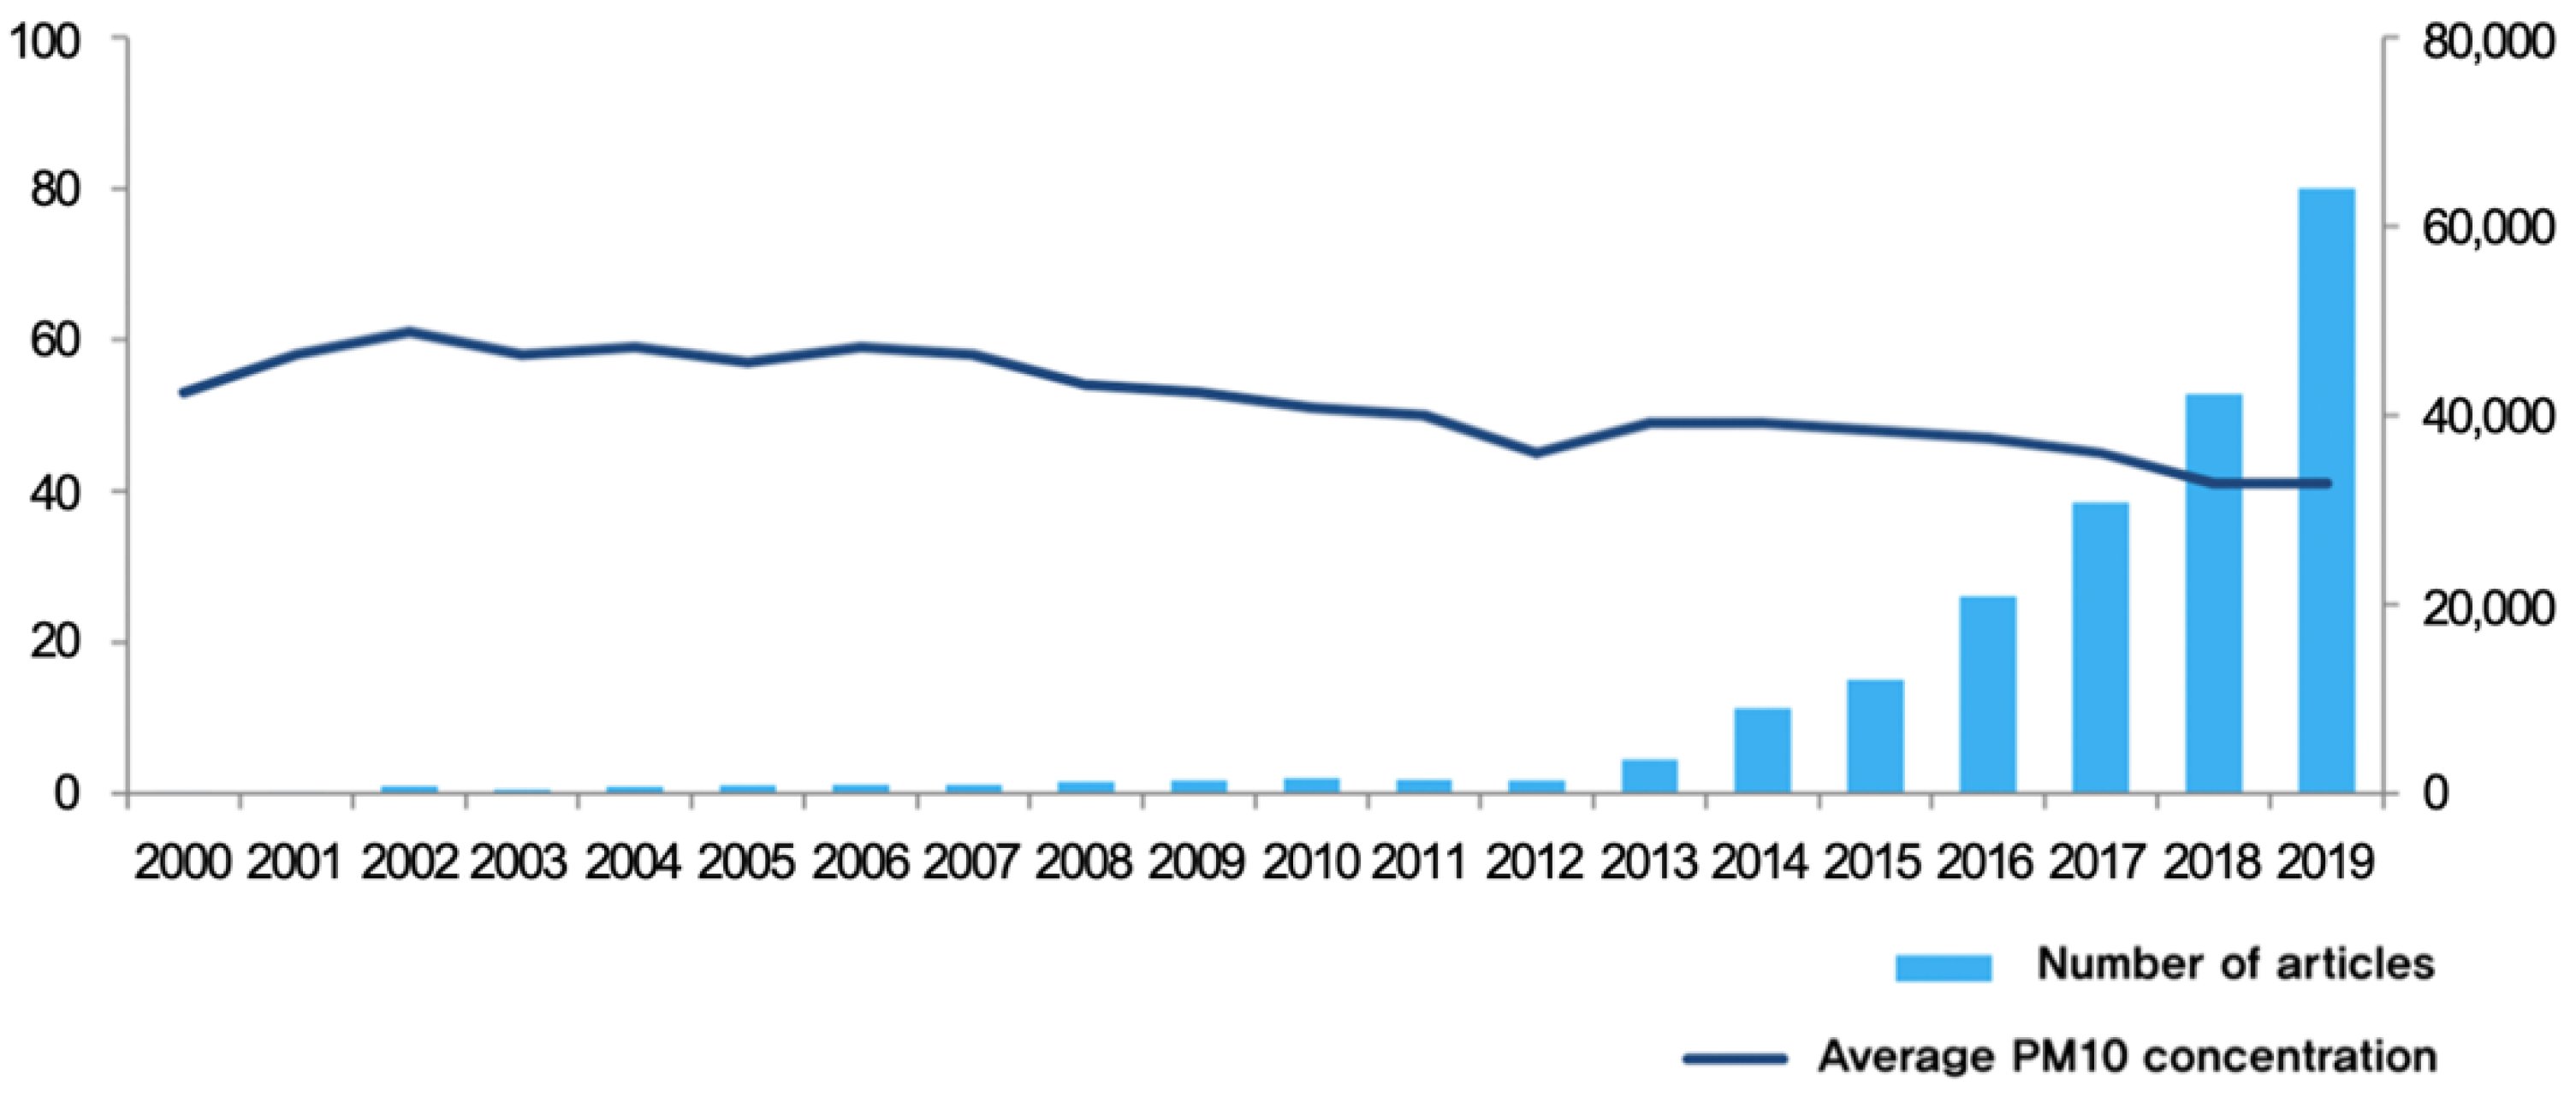
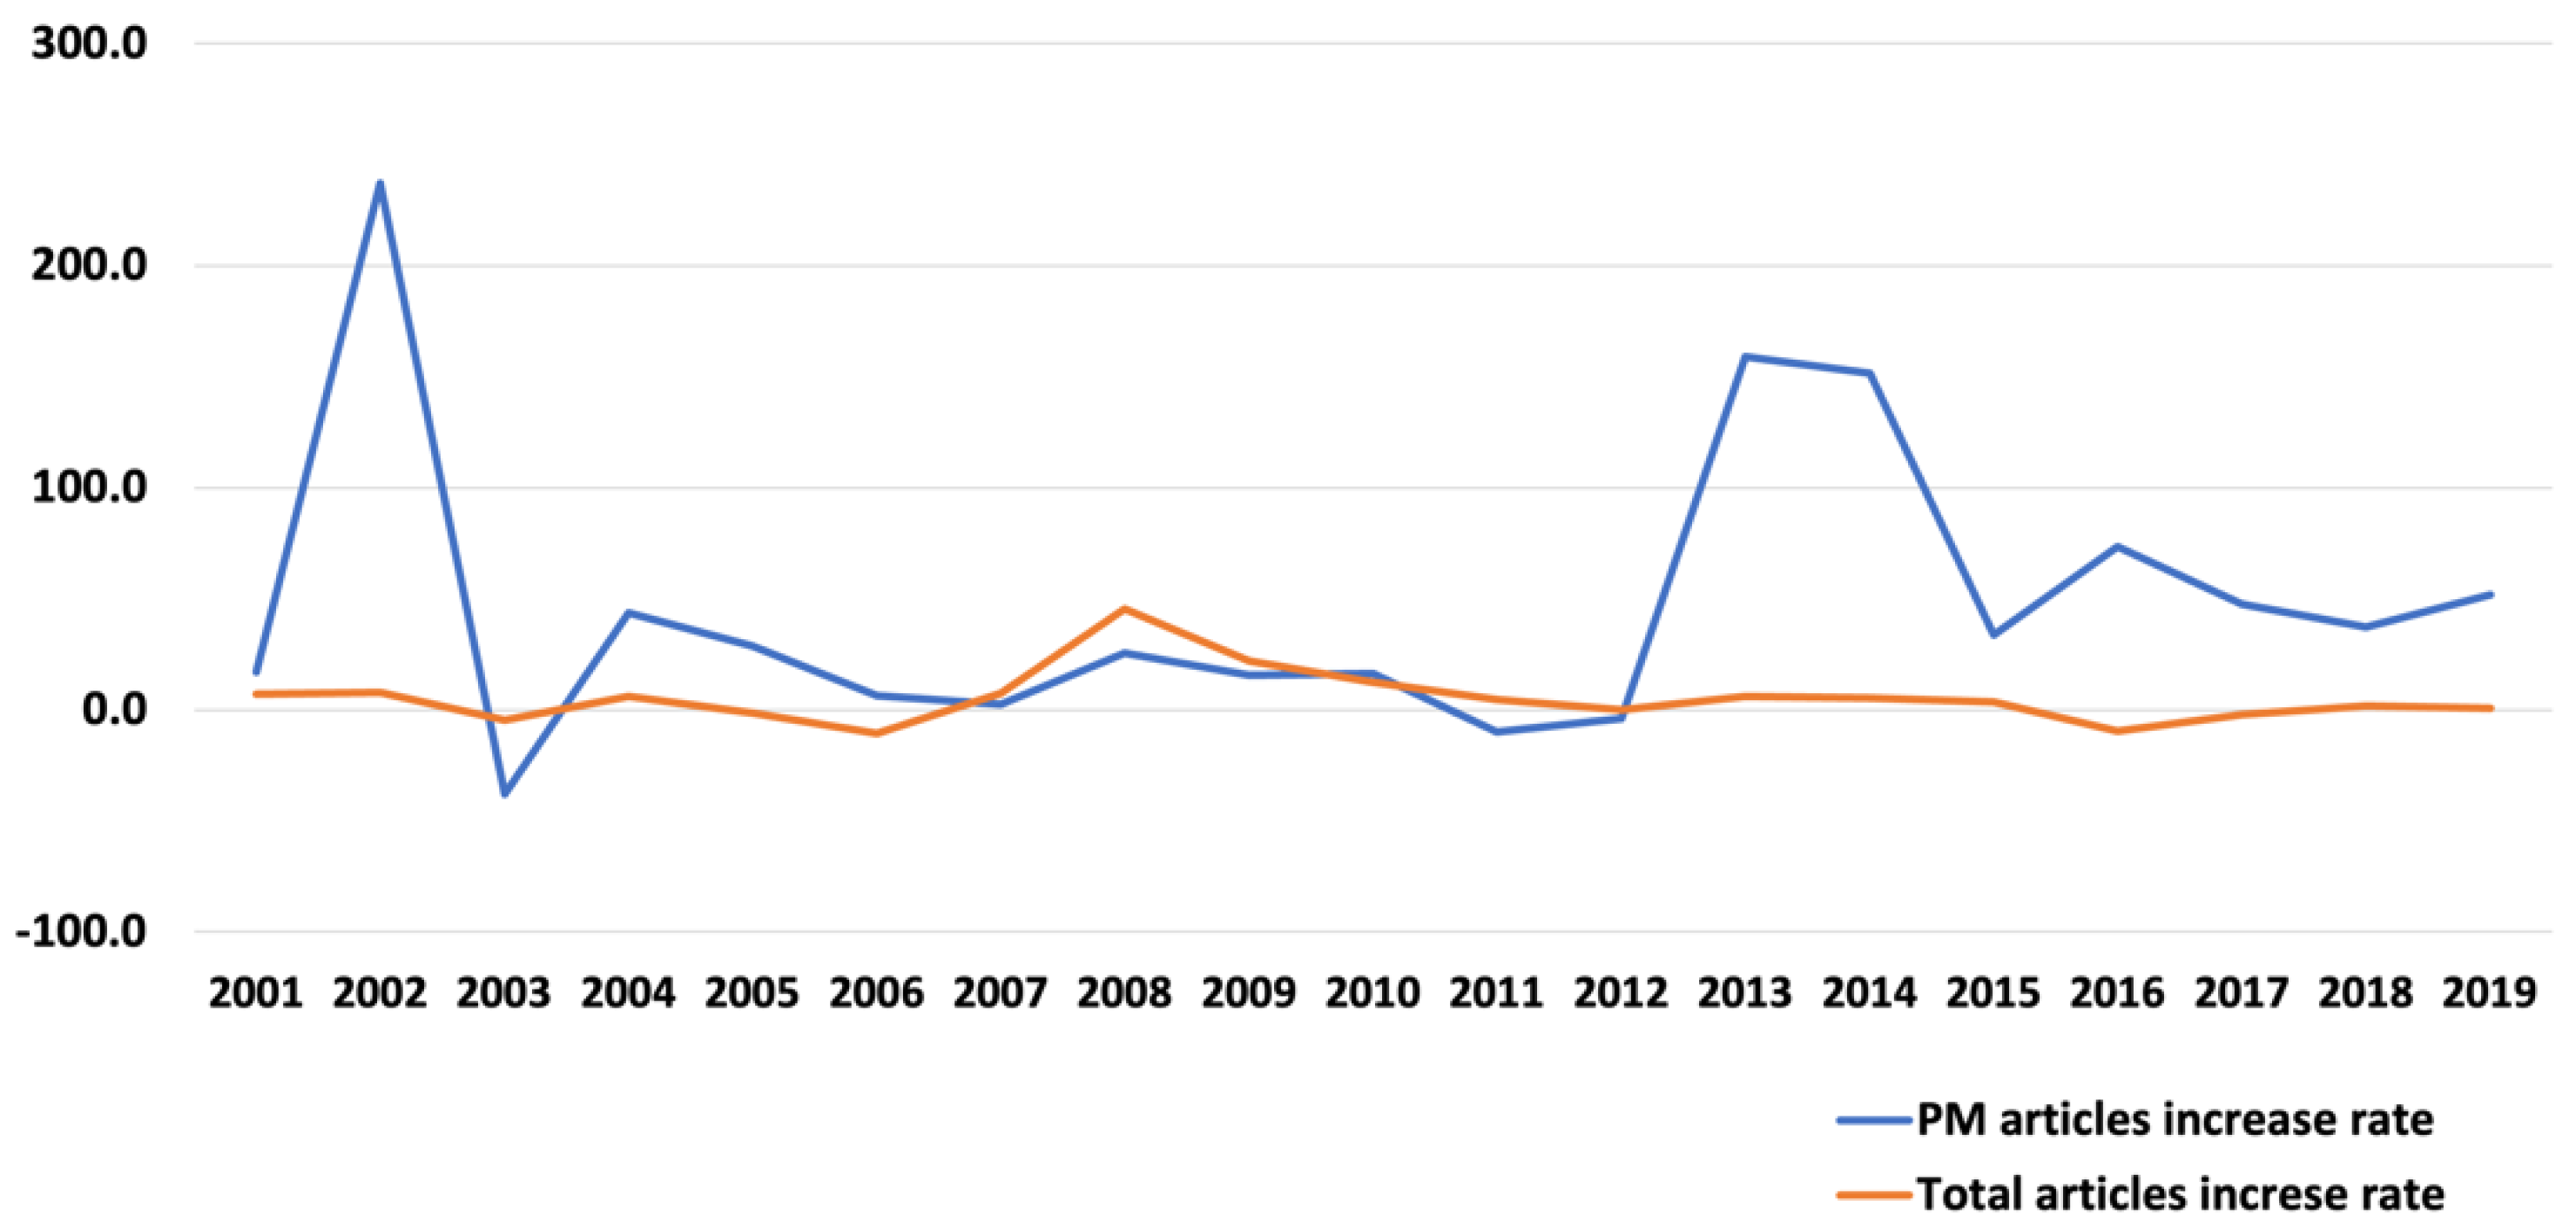
3.1.2. Social Issues and Changes in PM Concentrations in South Korea

PM-related online news articles from the past 20 years were investigated in order to identify trends in public interest within South Korea. The BIGkinds, a big data analysis system for news articles provided by the Korea Press Foundation, was implemented for the analysis. The increasing number of online news articles generated annually is shown in Table 2. In particular, articles related to PM issues sharply increased compared to the total number of articles (Figure 1). It was revealed that the number of correlated news reports on PM has increased rapidly since the mid-2010s, with an article frequency of ~200 year−1 in the early 2000s, increasing by >300 times to ~64,000 year−1 by 2019. This phenomenon indicates that the issue of atmospheric PM has evolved beyond a simple environmental problem into the realm of social concern [25].
In addition, the number of articles that included the keywords “particulate matter” and “forecasting” revealed that the introduction of the PM forecasting and warning system reinforced public and social concerns regarding PM (Figure 2). The graph shows that the number of articles increased in January and May, decreased in September, and increased again as January approached. This seems to reflect the seasonal characteristics of PM in South Korea. According to the Seoul Metropolitan Government, a trend of high PM concentrations occurs in the period between winter and early spring due to seasonal factors, and domestic and foreign influences. Whereas the number of articles was relatively low when the PM forecasting and warning systems were handled by local governments, since the nationwide PM forecasting system was implemented in 2014, this number has increased. Thus, although concerns about PM stimulated the expansion of the PM forecasting and warning system, system implementation further motivated social discussion, as indicated by the growth in related articles. Furthermore, the fact that concern regarding PM concentrations has largely developed in conjunction with the introduction of the PM forecasting and warning system is a testament to the system’s impact on the public, as the level of public information regarding PM significantly shifted between 2014 and 2015, thereby potentially changing citizens’ perceptions and attitudes.
Notably, it was found that the average annual PM concentrations in South Korea have gradually decreased since 2002, when the PM10 concentration was 61 μg m−3, on average, and have remained <50 μg m−3 since 2012 (Table 3).
Although PM pollution is treated as a serious social issue, it is difficult to judge whether air quality, especially PM concentrations, has deteriorated over time when comparing various measurement results [26]. Although average annual PM10 concentrations have generally decreased since 2000, public concern regarding PM has increased sharply since 2013 (Figure 3).
Despite the decreasing PM concentration, the major social concern regarding PM pollution is related to the negative effects of PM on human health and the environment. In particular, the IARC (International Agency for Research on Cancer) classified PM as a carcinogenic agent for humans (Group 1), and the government announced the implementation of the PM forecasting system and set the PM2.5 concentration standard. Consequently, public concern and the number of articles on PM have increased [25]. This phenomenon may also be due to the increased expectations of the public regarding air quality management. Additionally, PM concentrations are still higher than those in other OECD countries [27], possibly contributing to the public concern [25]. Furthermore, whereas the average annual concentration of PM has decreased over time, the frequency of high-concentration cases has increased, as indicated by the steep increase in peak concentration levels within a given year since 2015, with the number of days with high PM concentrations increasing from 5 d in 2015 to 16 d in 2019. Accordingly, the media have increased their coverage of PM, likely impacting the level of public concern [28].
This phenomenon has been interpreted in conjunction with the agenda-setting theory, whereby media (e.g., newspapers, news, and current affairs) contribute to the public’s agenda setting, and the agenda-setting function refers to instances where a topic reported in mass media is accepted as being important by the public [29,30].
According to priming theory, notably developed from the agenda-setting theory, if the media frequently or weightily report a particular issue, the public uses that issue as a basis for judgment during evaluation. Therefore, mass media influence what the public should think about, as well as how they think about it [29]. Thus, it appears likely that the agenda-setting and priming effects increased the public’s PM-related concerns. Furthermore, the issue of high PM concentrations reported through mass media is disseminated and reproduced through online media, such as SNS (social networking service) and blogs, affecting the perception of citizens, as well as overall socioeconomic activities.
Accordingly, in the present study, we aimed to examine whether PM concentrations in South Korea affected citizens’ use of urban parks. Furthermore, we also aimed to determine whether the PM forecasting and warning system has a meaningful effect on decision making as a case study. To this end, three urban park sites were selected, including indoor and outdoor spaces in Seoul: Gyeongbokgung Palace, Deoksugung Palace, and the National Museum of Korea.

3.2. Data Collection and Analysis

3.2.1. Data

PM concentration data used in this study were collected by city air monitoring stations across 25 boroughs in Seoul for 9 years (2011–2019). Notably, only data up to 2019 were used to exclude data following the outbreak of COVID-19. Currently, air quality in South Korea is measured via 11 types of monitoring stations: city, roadside, and suburban air quality monitoring stations; acid deposition, background density, heavy metal, harmful material, photochemical pollutant, global atmosphere, and PM2.5 monitoring stations; and air pollution concentration stations. All monitoring stations measure SO2, CO, O3, NO2, PM10, PM2.5, etc. Notably, the average PM concentration in Seoul was equivalent to the average value measured by the city air monitoring stations.
Data were collected from Air Korea, a public website operated by the Korea Environment Corporation, with the final released PM concentration data from this site being used. In addition to PM concentrations, five additional variables were selected, namely PM warning issuance; three weather variables, i.e., temperature, precipitation, and wind speed; and holiday conditions. The number of visitors to the case study sites was evaluated from 1 January 2011 to 31 December 2019 (total of nine years), and all visitor data were obtained upon request from the agency in charge of each site.

3.2.2. Analysis Method

Multiple regression analysis was conducted separately for each of the three target sites, as the impact of the PM concentration on users was analyzed by examining the differences between the results for different sites. In addition, we analyzed the effect of PM information on users according to whether an advisory or warning was issued. As stated above, because the PM forecasting and warning system expanded after 2014, system efficacy was expected to show an inflection point near 2015. Additionally, it was confirmed that articles related to PM information have rapidly increased since 2018. Considering the time required for system establishment, it was necessary to examine this period separately. Therefore, the following three periods were recognized in the present study: an introduction period of PM issues and forecasting–warning systems, 2011–2015; the spread period of PM issues and the system, 2016–2017; and the established period of PM issues, 2018–2019. Multiple regression analysis was then conducted for each period. The software used for the analysis was R-Studio.

3.2.3. Case Study Sites

To analyze the impact of PM pollution issues on urban park visitors, three case study sites located in Seoul were selected: Gyeongbokgung Palace (Site 1), Deoksugung Palace (Site 2), and the National Museum of Korea (Site 3). These sites are representative of places in Seoul visited by >2–3 million Korean nationals each year. Notably, Sites 1 and 2 have historically only been available to specific social classes; however, presently, they are places that provide historical and cultural experiences to all and play important roles as parks and open spaces. These case study sites are less affected by seasonal factors compared to other types of urban parks, as there is substantial cultural and commercial attraction for visitors, resulting in a relatively stable number of visitors. In addition, the Cultural Heritage Administration systematically manages the number of tourists per day to oversee data quality. Moreover, Sites 1 and 2 are typical parks mostly confined to outdoor spaces, whereas the main spaces of Site 3 are indoors. Therefore, differences were expected in PM pollution effects, depending on whether the case study site was inside or outside.

4. Results

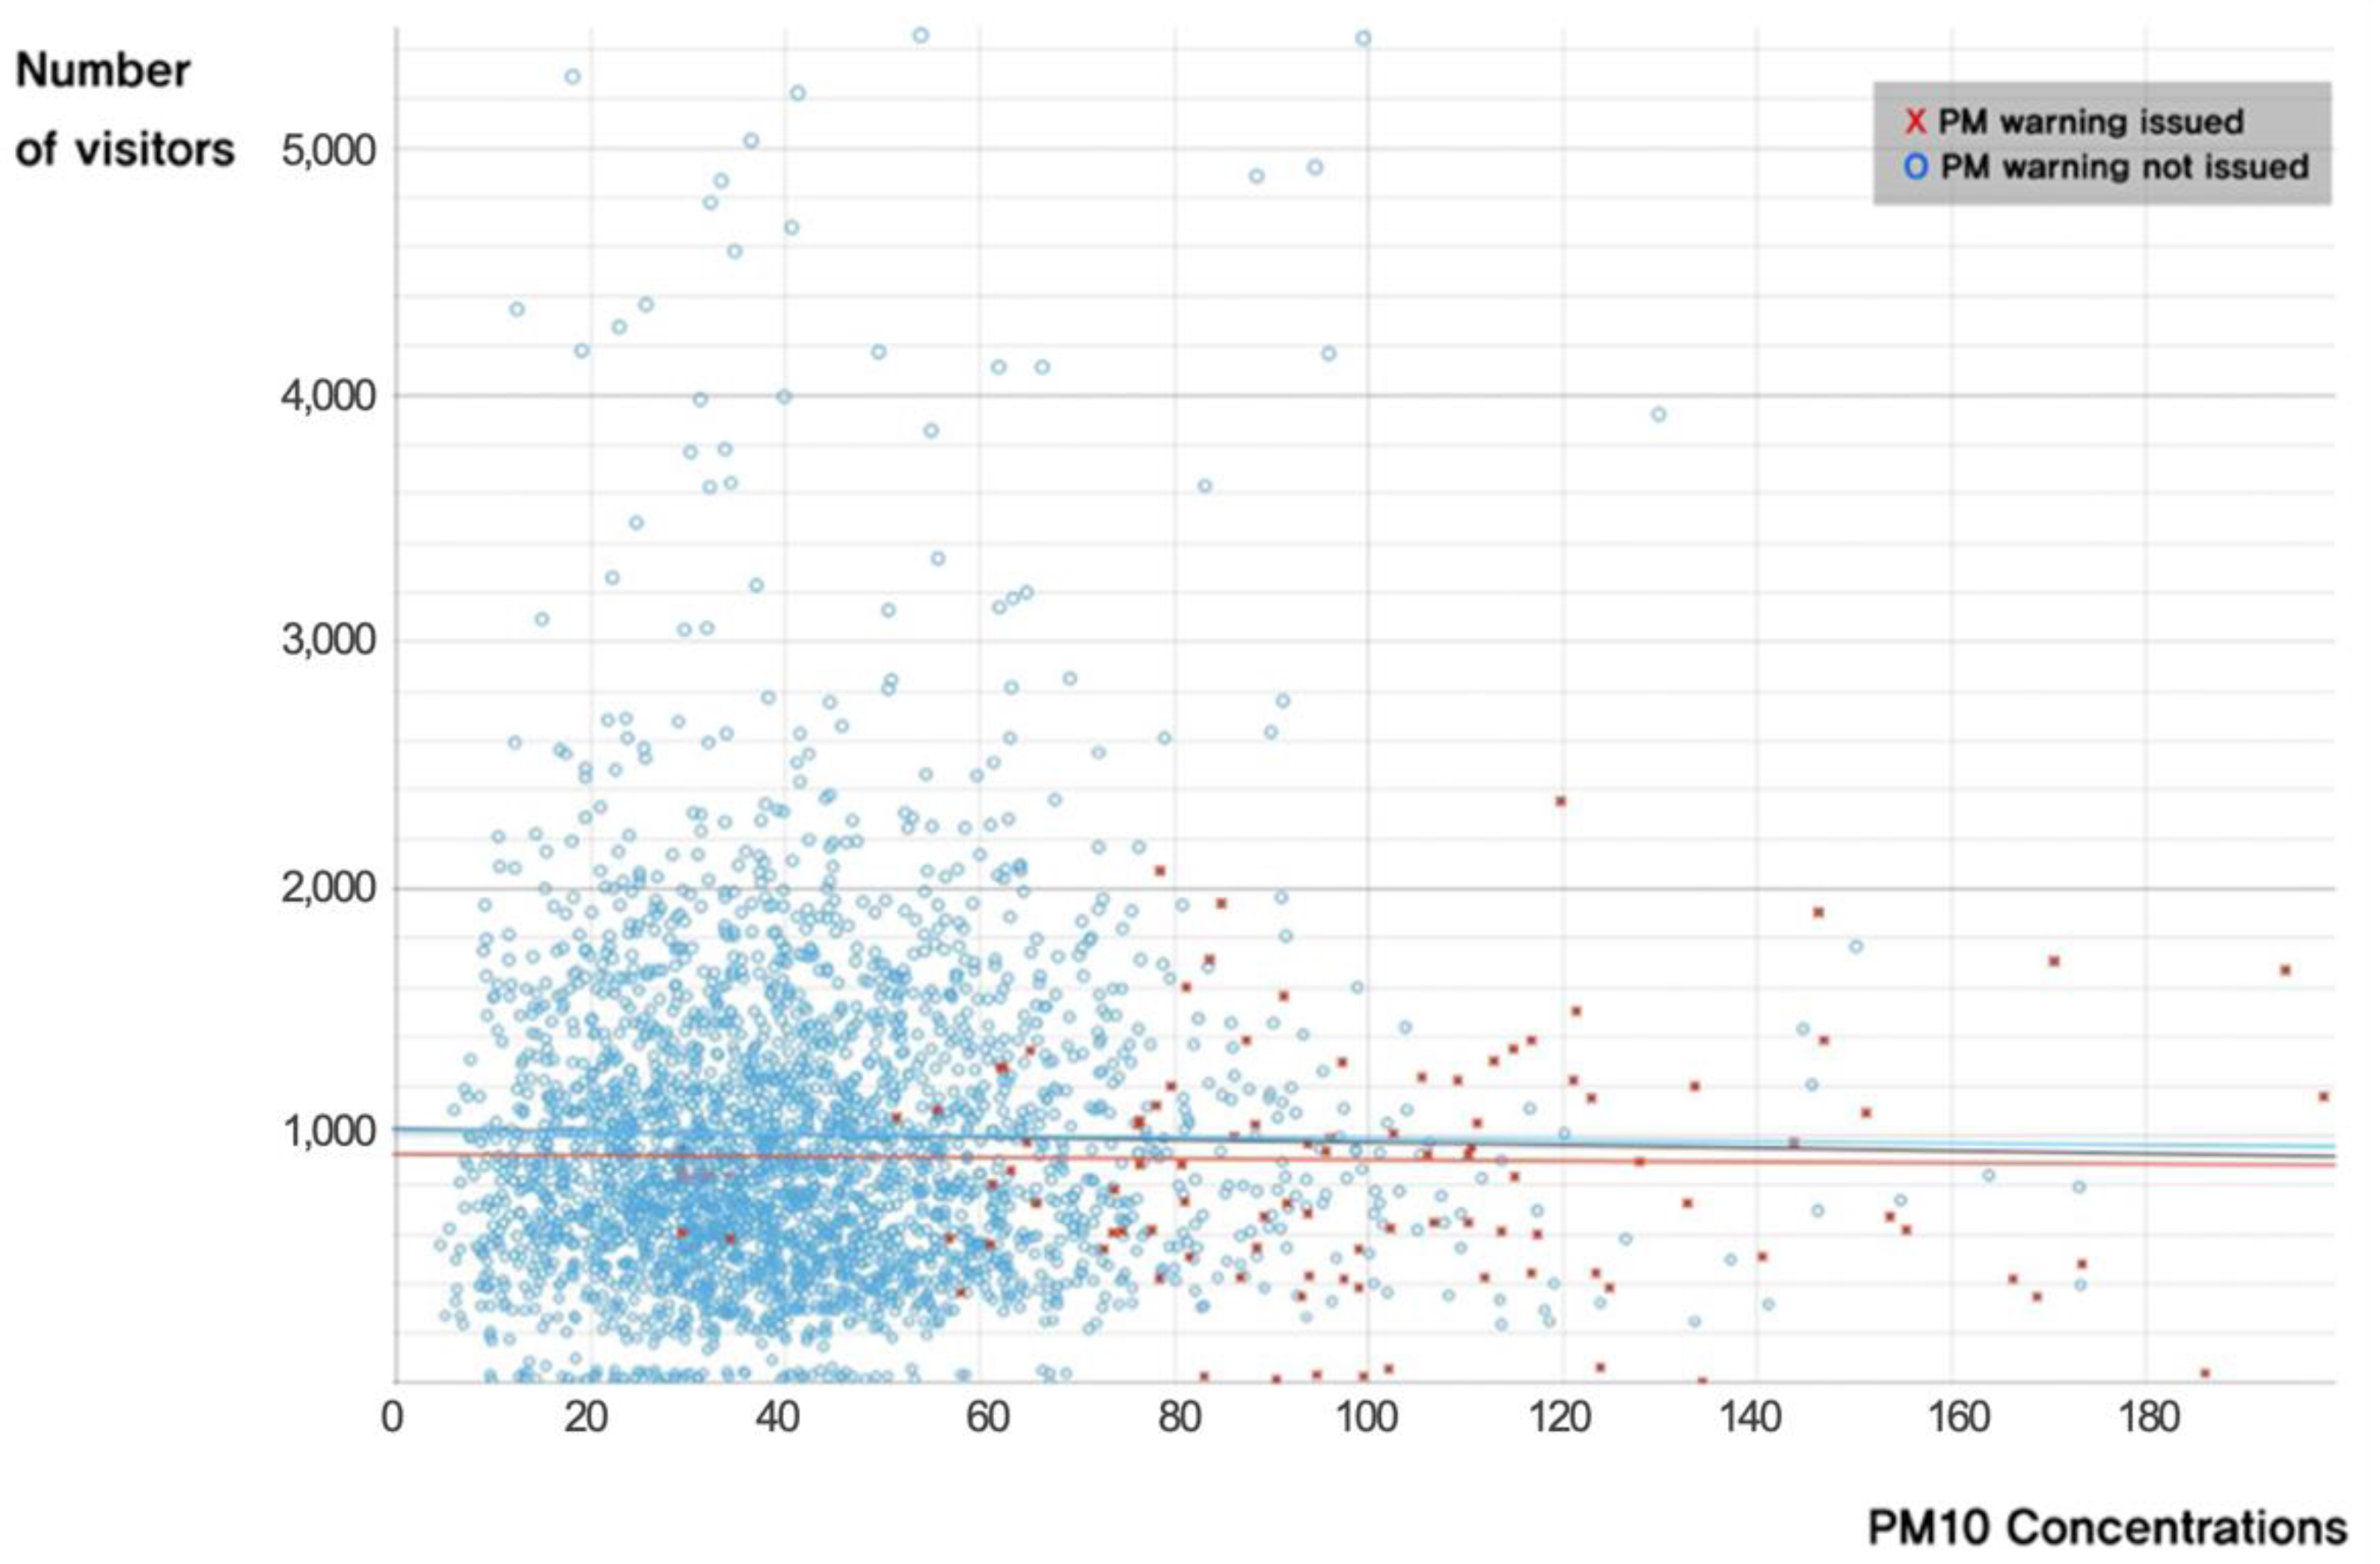
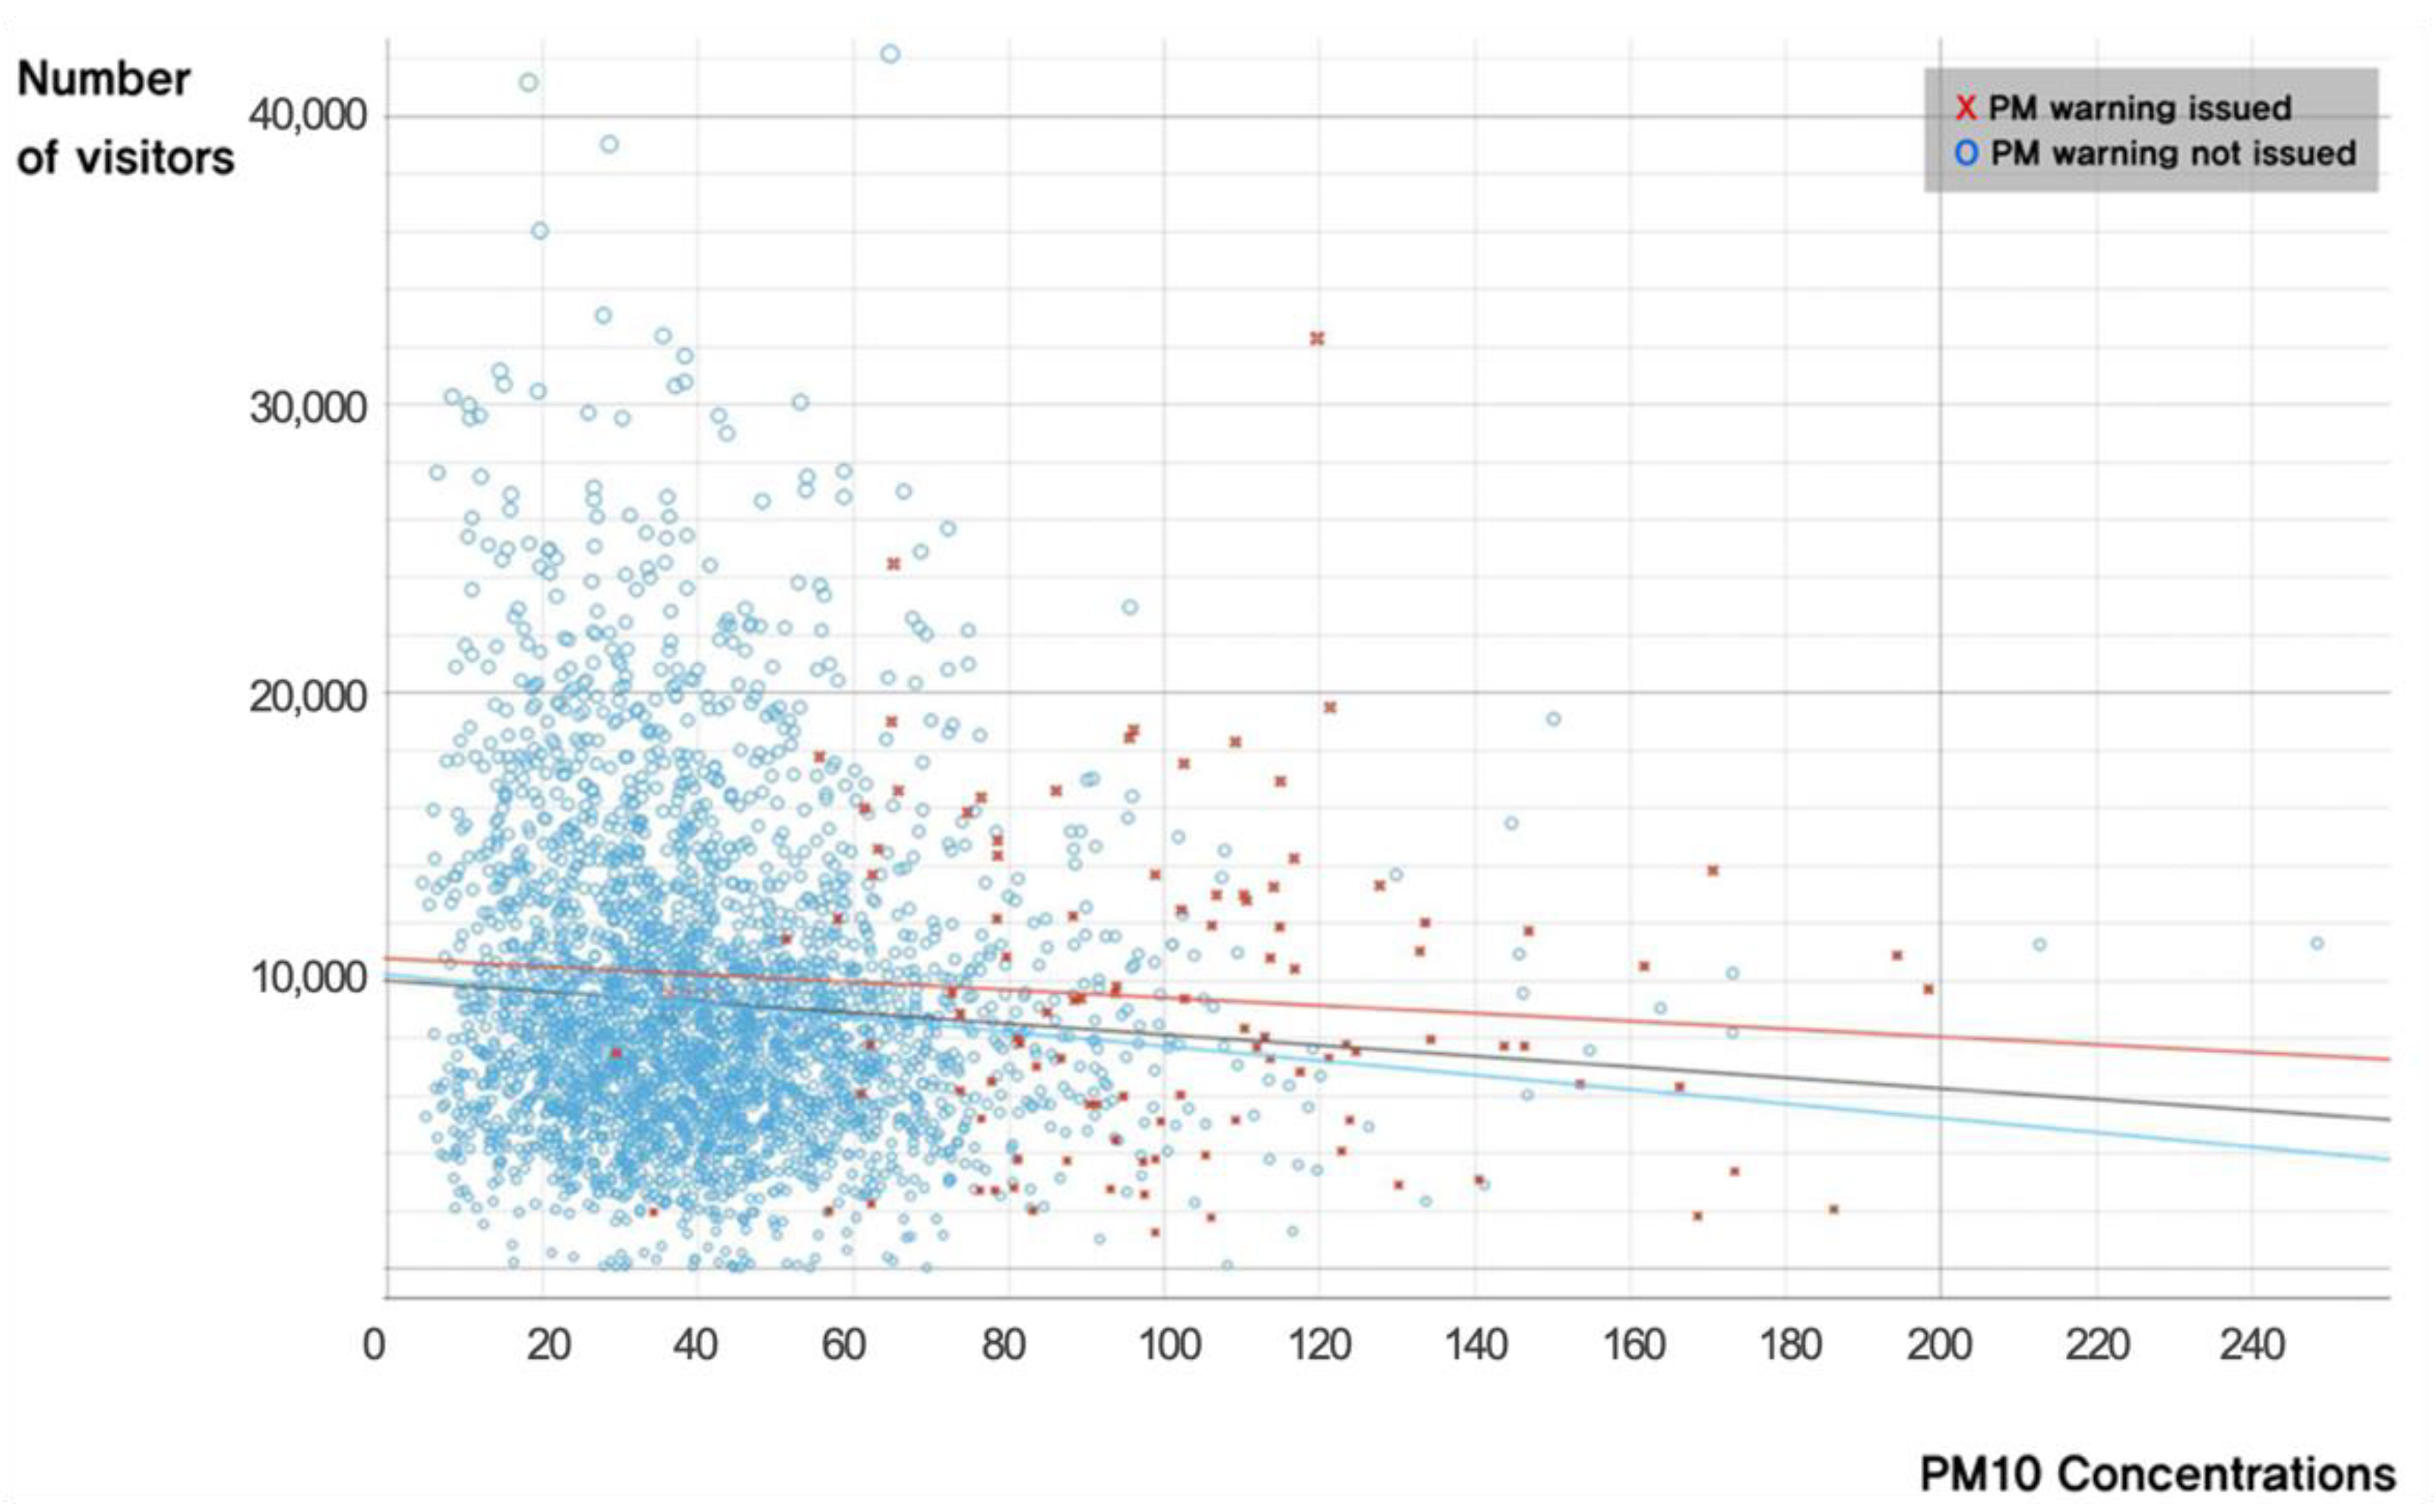
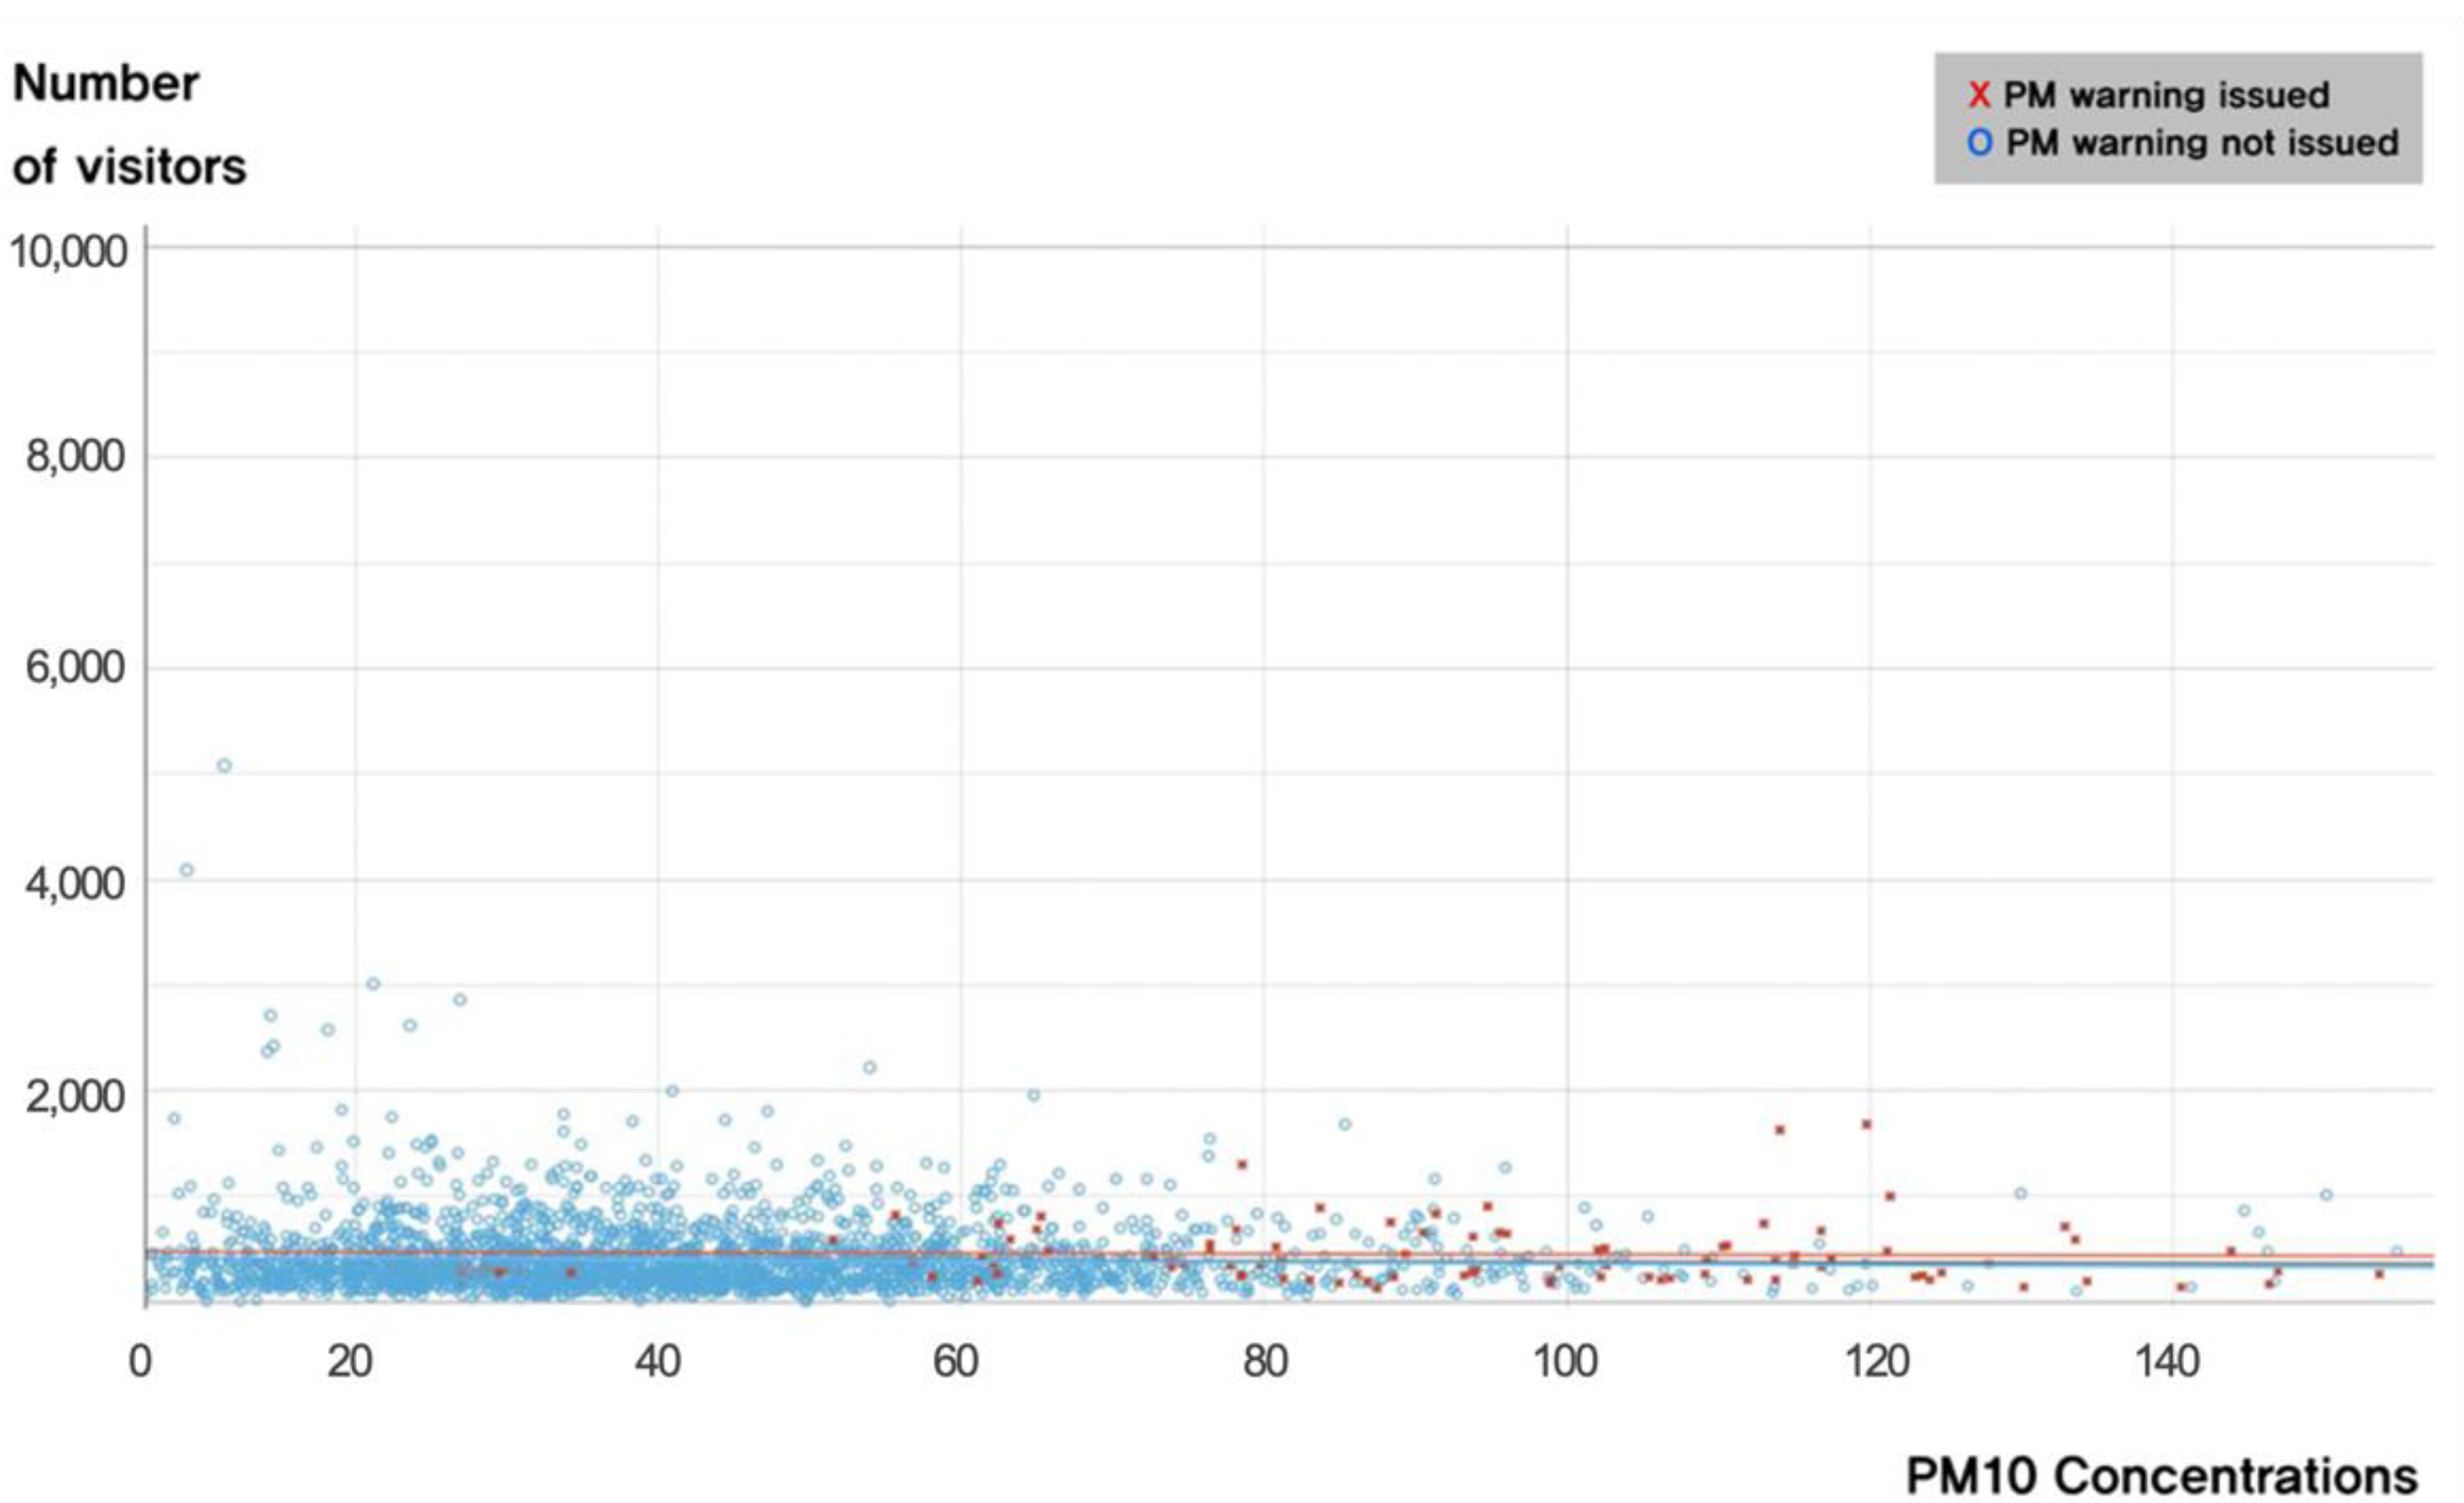
4.1. Analysis on PM Concentrations and Visitors

From 2011 to 2019, PM concentrations gradually decreased at the study sites (Figure 4). The daily PM10 concentration data showed that average concentrations decreased over the entire period, with this tendency being clearly observed in the monthly average PM concentration data, which presented a slight increase from 2012 to 2016 before decreasing over the following years.
According to the air quality report released every month by the Seoul Metropolitan Government, PM advisories were issued 38 times on 61 days from 2007 to 2019 (Table 4). In addition, a PM warning was issued once (for one day). Although the number of PM warnings was not high, considering that as the system is implemented, the media emphasize PM risks while mentioning warning issuances, it is likely that PM risks will be reflected more in public behavior over time.
The annual average number of Korean visitors to each case study site over the nine years analyzed was: Site 1, 3,257,590; Site 2, 1,259,939; and Site 3, 3,042,230 (Table 5). Although the number of visitors decreased during some periods, the number of overall visitors increased at all three sites since 2011.
The change in the number of visitors by PM concentration showed that the higher the PM concentration, the lower the number of visitors; however, the behavioral change was not remarkably significant for Site 1 (Figure 4, blue line). When the PM advisories and warnings were issued, it was confirmed that there was a slight decrease in the number of visitors, although it was difficult to determine whether this presented a clear trend (Figure 5, red line).
The results for Site 2 also indicated that the number of visitors slightly decreased when PM concentrations increased and PM advisories and warnings were issued (Figure 6).
Alternatively, in the case of Site 3, the number of visitors decreased as the PM concentration increased and PM advisory and warning were issued (Figure 7).
Over the past 9 years, PM concentrations have decreased overall, whereas the number of visitors to each site has increased. In addition, the number of visitors slightly decreased when PM concentrations were high; however, it is difficult to conclude a direct causality between the two or even significant changes in visitors’ behavior. Besides the PM concentrations, various variables affect user behavior, which must be considered comprehensively.

4.2. Multiple Regression Analyses by Site

At Site 1, the result of regression was F = 94.878, p < 0.001, with an R2 of 0.186 (adjusted R2 = 0.184). The results showed that both weather and holiday variables affected the number of visitors (Table 6). The number of visitors increased when temperatures and sunshine duration were higher, as well as when precipitation and wind speeds were lower. Holidays also led to significantly increased numbers of visitors; however, PM concentrations and warning issuance variables were not statistically significant.
At Site 2, the result of regression was F = 69.303, p < 0.001), with an R2 of 0.146 (adjusted R2 = 0.144). It was found that temperature, precipitation, wind speed, sunshine, and holiday variables all had a significant impact on the number of visitors (Table 7). In contrast with the results for Site 1, PM concentration and warning issuance were slightly statistically significant relative to the number of visitors, as the results showed that the higher the PM10 concentrations, the fewer the visitors; however, contrary to expectations, the number of visitors increased when a warning was issued.
At Site 3, the result of regression was F = 201.407, p < 0.001, with an R2 of 0.323 (adjusted R2 = 0.321). The number of visitors increased when temperatures were high, when precipitation and sunshine were low, and during holidays (Table 8); wind speed was not statistically significant. It was also observed that higher PM10 concentrations decreased the number of visitors, and similarly to Site 2, the issuance of PM warnings increased the number of visitors.

4.3. Multiple Regression Analysis by Period

The results for Site 1 across each period are listed in Table 9. The table represents the regression coefficient, β represents each variable’s influence, and t(P) represents the significance. During period 1, temperature, precipitation, sunshine, and holidays all significantly affected the number of visitors. PM concentrations were also found to increase the number of visitors, although this effect was only slightly statistically significant. During period 2, temperature, precipitation, and holidays affected visitor numbers, whereas PM concentrations and warning issuance did not show any such effects. The results of period 3 showed that temperature, precipitation, sunshine, and holidays affected the number of visitors, whereas PM10 concentrations were not significant. It was thus confirmed that PM warning issuance partially decreased the number of visitors during this period.
According to the results for period 1 at Site 2, temperature, precipitation, wind speed, sunshine, and holidays all affected the number of visitors; furthermore, the number of visitors also increased with PM concentration (Table 10). The results for period 2 showed that temperature, precipitation, and holidays affected the number of visitors, whereas PM concentrations were negatively correlated with the number of visitors. During period 3, holiday and weather variables (excluding wind speed) significantly increased the number of visitors; however, the PM concentrations and warning issuance were not statistically significant.
At Site 3, temperature, precipitation, and holidays increased the number of visitors during period 1 (Table 11). Furthermore, PM concentrations and warning issuance significantly affected visitor numbers (PM concentrations were negatively correlated, whereas warning issuances were positively correlated). The results for period 2 showed that the PM concentrations significantly decreased the number of visitors; however, it was found that PM warning issuances did not affect visitor numbers. During period 3, temperature, wind speed, and holidays affected the number of visitors, whereas high PM concentrations were negatively correlated with the number of visitors. Moreover, as with the analysis results of period 1, the number of visitors actually increased with the issuance of PM warnings.

5. Discussion

The results across the entire analysis period showed that weather and holidays consistently affected the number of visitors to the case study sites. At Sites 2 and 3, PM concentrations were found to have a negative effect on citizens’ outdoor activities; however, contrary to expectations, the results showed that the number of users increased when PM warnings were issued here (significant at the α = 0.1 level). This may have been due to the fact that PM advisories and warnings were issued when the PM concentration levels exceeded the standard levels, and therefore, the total number of issuances was insufficient to obtain an adequate sample size.
The results of each period did not confirm that a greater degree of PM information dissemination led to fewer visits by citizens to the case study sites; however, the results for period 3 indicated that PM warning issuances impacted the number of visitors at Site 1, thus supporting the effects of public information efforts. These results can also be considered in conjunction with the effects of PM discussed by the media. According to Cha et al. [31], agenda setting by the media in South Korea varied in each period (particularly between 2018 and 2019), with reports on the impact of PM on human health decreasing, and on the government’s policies increasing, in addition to conflicts between the government and the public.
However, Site 3, notably a mostly indoor space, received more visitors when PM warnings were issued. Considering the results for Site 1, this result may indicate that awareness of the risks of PM caused citizens to move from outdoor to indoor spaces. These findings are notably similar to those reported by Choi et al. [32], which indicated that people tend to gather in indoor spaces during periods of high PM concentrations.
There are limitations in interpreting the results of this study, as citizens’ decisions to use urban parks are affected by various variables, including changes in socioeconomic status, citizens’ thoughts and preferences on leisure, and individual interest levels in urban parks; however, as confirmed by the results of this study, the influence of atmospheric environmental conditions, such as weather and PM concentrations, can affect whether people visit an urban park, which implies the possibility that PM pollution is a serious social issue.
As indicated in the literature review [4,12,18], the level of PM concentration affects people’s willingness to participate in outdoor activities; this was also derived from the results of Site 2 and 3 in this research. However, the effectiveness of PM forecasting and warning systems has not been explored enough so far. The research result of the Site 3 case study indicated that PM forecasting and warning systems affect people’s willingness and actual behaviors towards outdoor activities. In terms of prediction and warning accuracies, current research has been mainly focused on technical aspects based on algorithms; however, in this study, we validated the effectiveness of prediction and warning systems based on actual evidence, including urban park visitors.
Perceptual recognition affects human behavior. According to Lee et al. [33], citizens’ perception of PM affects decision making more than the PM concentration data. In order to enhance people’s cognitive response to PM, together with PM forecasting and warning, systematic and constant feeding information and management strategies around PM could minimize PM’s negative impacts that have already occurred in peoples’ daily lives. As part of this, the PM forecasting and warning system was introduced in South Korea. The effectiveness of the warning system can be improved by securing continuous and detailed quality data. The case studies presented in this research are based on Seoul’s highly regarded tourist attractions; therefore, the study results cannot be generalized to represent people’s everyday life. In addition, the current system was implemented at a time when PM levels were already serious, predicting up to two days. Therefore, future research needs to consider whether such systems affect decision making in daily life, as well as various types of urban parks and circulation data.

6. Conclusions

In this study, the effects of PM pollution and PM forecasting and warning systems in South Korea were analyzed. Whereas research to date has focused on improving prediction and accuracy, in this study, we explored the effectiveness of the PM forecasting and warning system with respect to citizens’ behavior.
Three case study park sites in South Korea was analyzed. The number of visitors to each site was, in part, explained by weather and holiday variables; however, it was also confirmed that PM concentrations negatively impacted citizens’ outdoor activities, as indicated by fewer visitors at Sites 2 and 3 when PM concentrations were high. An examination across the entire study period suggested that the PM forecasting and warning system influenced park use behaviors; however, contrary to expectations, warning issuance was not statistically significantly correlated with visitors or even correlated with an increase in visitors. Additionally, when comparing the adjusted R2 of each model, it was found that the explanatory power of the model for Site 3 was higher than that of the models for Sites 1 and 2. Moreover, three distinct periods were identified and analyzed based on the amount of PM information being provided by the mass media to the public, as well as the functionality of the PM forecasting–warning system. Following the classification analyses for different periods, the hypothesis that the level of PM information distribution will significantly impact citizens’ behavioral responses was not clearly confirmed; however, the results for period 3 at Site 1 showed that PM warning issuances significantly decreased the number of visitors, whereas for Site 3, where the primary park space is located indoors, the number of visitors increased when PM warnings were issued.
It has not been long since the PM forecasting and warning system was introduced nationwide in South Korea; therefore, it is not yet clear whether the system has proven to be efficient or produce empirical results. In this study, analyzed data accumulated until 2019 after the implementation of the PM forecasting and warning system; it was possible to estimate that the PM forecasting and warning system partially affects citizens’ park use behavior. As continuous data are added in the future, the effectiveness of the system could be clearly assured. In addition, future studies are required that analyze changes in citizens’ perception, different types of urban open spaces, and circulations data.

Author Contributions

Conceptualization, Y.S., S.K., and J.P.; writing—original draft preparation, Y.S. and S.K.; writing—review and editing, K.A.; supervision, K.A., S.-W.L. All authors have read and agreed to the published version of the manuscript.

Funding

This research received no external funding.

Institutional Review Board Statement

Not applicable.

Informed Consent Statement

Not applicable.

Acknowledgments

This paper was written as part of Konkuk University’s research support program for its faculty on sabbatical leave in 2020. This paper was also supported by Korea Forest Service (Korea Forestry Promotion Institute) (FTIS 2021331A00-2223-AA01) and the National Research Foundation of Korea (NRF) grant funded by the Korea government (MSIT) (No. NRF-2021R1F1A1059444).

Conflicts of Interest

The authors declare no conflict of interest.

References

  1. Tainio, M.; Jovanovic Andersen, Z.; Nieuwenhuijsen, M.J.; Hu, L.; de Nazelle, A.; An, R.; Garcia, L.M.T.; Goenka, S.; Zapata-Diomedi, B.; Bull, F.; et al. Air Pollution, Physical Activity and Health: A Mapping Review of the Evidence. Environ. Int. 2021, 147, 105954. [Google Scholar] [CrossRef] [PubMed]
  2. Roberts, J.D.; Voss, J.D.; Knight, B. The Association of Ambient Air Pollution and Physical Inactivity in the United States. PLoS ONE 2014, 9, e90143. [Google Scholar] [CrossRef] [PubMed]
  3. Xu, Y.; Liu, Y.; Chang, X.; Huang, W. How Does Air Pollution Affect Travel Behavior? A Big Data Field Study. Transp. Res. Part D Transp. Environ. 2021, 99, 103007. [Google Scholar] [CrossRef]
  4. An, R.; Shen, J.; Ying, B.; Tainio, M.; Andersen, Z.J.; de Nazelle, A. Impact of Ambient Air Pollution on Physical Activity and Sedentary Behavior in China: A Systematic Review. Environ. Res. 2019, 176, 108545. [Google Scholar] [CrossRef]
  5. Lu, J.G. Air Pollution: A Systematic Review of Its Psychological, Economic, and Social Effects. Curr. Opin. Psychol. 2020, 32, 52–65. [Google Scholar] [CrossRef] [PubMed]
  6. Wendel, J. Air Pollution Ranks as Largest Health Risk. Eos Trans. AGU 2014, 95, 120. [Google Scholar] [CrossRef]
  7. Xu, Y.; Yang, W.; Wang, J. Air Quality Early-Warning System for Cities in China. Atmos. Environ. 2017, 148, 239–257. [Google Scholar] [CrossRef]
  8. Wang, S.; Feng, X.; Zeng, X.; Ma, Y. A Study on Variation of Concentrations of Particulate Matter with Different Sizes in Lanzhou, China. Atmos. Environ. 2009, 43, 2823–2828. [Google Scholar] [CrossRef]
  9. Khaniabadi, Y.O.; Goudarzi, G.; Daryanoosh, S.M.; Borgini, A.; Tittarelli, A.; De Marco, A. Exposure to PM10, NO2, and O3 and Impacts on Human Health. Environ. Sci. Pollut. Res. 2017, 24, 2781–2789. [Google Scholar] [CrossRef]
  10. Masselot, P.; Chebana, F.; Lavigne, É.; Campagna, C.; Gosselin, P.; Ouarda, T.B.M.J. Toward an Improved Air Pollution Warning System in Quebec. IJERPH 2019, 16, 2095. [Google Scholar] [CrossRef] [Green Version]
  11. Cascio, W.E. Wildland Fire Smoke and Human Health. Sci. Total Environ. 2018, 624, 586–595. [Google Scholar] [CrossRef]
  12. Hong, H.J.; Park, Y.H.; Yu, H.S. A Preliminary Study on Developing Environmental Assessment Methods in Urban Stream Watersheds; Korea Environment Institute: Sejong, Korea, 2013. [Google Scholar]
  13. Kim, K.-H.; Kabir, E.; Kabir, S. A Review on the Human Health Impact of Airborne Particulate Matter. Environ. Int. 2015, 74, 136–143. [Google Scholar] [CrossRef] [PubMed]
  14. Krewski, D. Evaluating the Effects of Ambient Air Pollution on Life Expectancy. N. Engl. J. Med. 2009, 360, 413–415. [Google Scholar] [CrossRef] [PubMed] [Green Version]
  15. Jeong, S.J. The Impact of Air Pollution on Human Health in Suwon City. Asian J. Atmos. Environ. 2013, 7, 227–233. [Google Scholar] [CrossRef] [Green Version]
  16. Hyslop, N.P. Impaired Visibility: The Air Pollution People See. Atmos. Environ. 2009, 43, 182–195. [Google Scholar] [CrossRef]
  17. Xu, J.; Chi, C.S.F.; Zhu, K. Concern or Apathy: The Attitude of the Public toward Urban Air Pollution. J. Risk Res. 2017, 20, 482–498. [Google Scholar] [CrossRef]
  18. Hankook Research. Monthly Report, March 2018; Hankok Research: Seoul, Korea, 2018. [Google Scholar]
  19. World Health Organization. Personal Interventions and Risk Communication on Air Pollution: Summary Report of WHO Expert Consultation, 12-14 February 2019, Geneva, Switzerland; World Health Organization: Geneva, Switzerland, 2020; ISBN 978-92-4-000027-8. [Google Scholar]
  20. Balram, D.; Lian, K.-Y.; Sebastian, N. Air Quality Warning System Based on a Localized PM2.5 Soft Sensor Using a Novel Approach of Bayesian Regularized Neural Network via Forward Feature Selection. Ecotoxicol. Environ. Saf. 2019, 182, 109386. [Google Scholar] [CrossRef]
  21. Sharma, E.; Deo, R.C.; Prasad, R.; Parisi, A.V. A Hybrid Air Quality Early-Warning Framework: An Hourly Forecasting Model with Online Sequential Extreme Learning Machines and Empirical Mode Decomposition Algorithms. Sci. Total Environ. 2020, 709, 135934. [Google Scholar] [CrossRef]
  22. Yang, G.; Lee, H.; Lee, G. A Hybrid Deep Learning Model to Forecast Particulate Matter Concentration Levels in Seoul, South Korea. Atmosphere 2020, 11, 348. [Google Scholar] [CrossRef] [Green Version]
  23. Saberian, S.; Heyes, A.; Rivers, N. Alerts Work! Air Quality Warnings and Cycling. Resour. Energy Econ. 2017, 49, 165–185. [Google Scholar] [CrossRef] [Green Version]
  24. Zhou, X.; Santana Jiménez, Y.; Pérez Rodríguez, J.V.; Hernández, J.M. Air Pollution and Tourism Demand: A Case Study of Beijing, China. Int. J. Tour. Res. 2019, 21, 747–757. [Google Scholar] [CrossRef]
  25. Yeo, M.; Kim, Y. Trends of the PM10 concentrations and high PM10 concentration cases by region in Korea. Part. Aerosol Res. 2019, 15, 45–56. [Google Scholar] [CrossRef]
  26. Byun, S.; Kim, S.-Y. Has Air Pollution Concentration Increased over the Past 17 Years in Seoul, South Korea? The Gap between Public Perception and Measurement Data. J. Korean Soc. Atmos. Environ. 2020, 36, 240–248. [Google Scholar] [CrossRef]
  27. Lee, J.H.; Kim, M.Y.; Kim, Y. Spatial Panel Analysis for PM2.5 Concentrations in Korea. J. Korean Data Inf. Sci. Soc. 2017, 28, 473–481. [Google Scholar]
  28. Yoon, S.; Kim, M. Topic Modeling on Fine Dust Issues Using LDA Analysis. J. Energy Eng. 2020, 29, 23–29. [Google Scholar] [CrossRef]
  29. Kim, Y.; Lee, H.; Lee, H.; Jang, Y. A Study of the Public’s Perception and Opinion Formation on Particulate Matter Risk. Korean J. Commun. Inf. 2015, 72, 52–91. [Google Scholar]
  30. McCombs, M. Setting the Agenda: The Mass Media and Public Opinion; Blackwell Publishing Inc.: Hoboken, NJ, USA, 2004; ISBN 978-0-7456-2312-2. [Google Scholar]
  31. Cha, H.-J.; Tian, Z.M.; Kweon, S.H. A Study on the Intermedia Network Agenda Settingon PM Issues: Focusing on the Network Agenda Setting between Media Reports and Naver Blogs. J. Cybercommun. Acad. Soc. 2020, 37, 5–52. [Google Scholar] [CrossRef]
  32. Choi, Y.; Yoon, H.; Kim, D. Where Do People Spend Their Leisure Time on Dusty Days? Application of Spatiotemporal Behavioral Responses to Particulate Matter Pollution. Ann. Reg. Sci. 2019, 63, 317–339. [Google Scholar] [CrossRef]
  33. Lee, K.-K.; Park, Y.; Han, S.-P.; Kim, H.C. The Alerting Effect from Rising Public Awareness of Air Quality on the Outdoor Activities of Megacity Residents. Sustainability 2020, 12, 820. [Google Scholar] [CrossRef] [Green Version]
Figure 1. Comparison between PM−related and total article increases.
Sustainability 14 05394 g001
Figure 2. Frequency of media reporting “particulate matter forecasting” as a keyword (in Korean).
Sustainability 14 05394 g002
Figure 3. Average annual PM10 concentration levels compared to the number of online articles over the 20-year period from 2000 to 2019.
Sustainability 14 05394 g003
Figure 4. PM10 concentration changes in Seoul (2011–2019). (a) Daily average (DA) analysis of PM10 concentration; (b) monthly average (MA) analysis of PM10 concentration (each box plot with whiskers represents the data variation of PM concentration for each year).
Sustainability 14 05394 g004
Figure 5. Scatter plot of PM concentration levels and the number of daily visitors (Site 1). Blue line: changes in the number of visitors based on PM concentration; red line: changes in the number of visitors based on PM advisories and warnings.
Sustainability 14 05394 g005
Figure 6. Scatter plot of PM concentration levels and the number of daily visitors—Site 2.
Sustainability 14 05394 g006
Figure 7. Scatter plot of PM concentration levels and the number of daily visitors (Site 3).
Sustainability 14 05394 g007
Table 1. Classification of particulate matter concentrations.
(μg·m3, day)
GoodNormalBadVery Bad
PM concentration PM100–3031–8081–150151<
PM2.50–1516–3536–7576<
Table 2. Annual online news articles produced (data: BIGKinds).
YearNumber of
PM Articles
Total Number of
Articles
YearNumber of
PM Articles
Total Number of
Articles
2000192 1,621,60220101598 (+16.4%)3,560,302 (+12.2%)
2001225 (+17.2%)1,737,440 (+7.1%)20111438 (−10.0%)3,728,829 (+4.7%)
2002758 (+236.9%)1,871,305 (+7.7%)20121381 (−4.0%)3,726,986 (+0.0%)
2003470 (−38.0%)1,788,110 (−4.4%)20133577 (+159.0%)3,952,681 (+6.1%)
2004675 (+43.6%)1,896,248 (+6.0%)20149001 (+151.6%)4,162,294 (+5.3%)
2005870 (+28.9%)1,866,553 (−1.6%)201512,020 (+33.5%)4,309,773 (+3.5%)
2006924 (+6.2%)1,665,812 (−10.8%)201620,853 (+73.5%)3,899,939 (−9.5%)
2007946 (+2.4%)1,788,570 (+7.4%)201730,779 (+47.6%)3,822,936 (−2.0%)
20081188 (+25.6%)2,603,433 (+45.6%)201842,219 (+37.2%)3,893,067 (+1.8%)
20091373 (+15.6%)3,171,855 (+21.8%)201964,049 (+51.7%)3,927,089 (+0.9%)
Table 3. Average concentration of PM10 in the past 20-year period (μg·m−3; Korea Environment Corporation).
YearConcentrationYearConcentration
200053201051
200158201150
200261201245
200358201349
200459201449
200557201548
200659201647
200758201745
200854201841
200953201941
Table 4. PM advisory and warning issuance in Seoul, South Korea, 2007–2010 and 2013–2019.
YearPM AdvisoryPM Warning
Frequency
of Issuance
Number of Days
of Issuance
Frequency
of Issuance
Number of Days
of Issuance
20072400
20082300
20092400
20101300
20110000
20120000
20131200
20142400
20153500
20166700
201761000
20185511
201981400
Total386111
Table 5. Total annual number of Korean visitors at each site.
YearSite 1Site 2Stie 3
20112,515,0571,036,6622,910,381
20123,098,350 (+23.2%)816,707 (−21.2%)2,626,093 (−9.8%)
20132,941,157 (−5.1%)1,035,879 (+26.8%)2,808,088 (+6.9%)
20143,657,760 (+24.4%)1,151,792 (+11.2%)3,408,851 (+21.4%)
20153,347,046 (−8.5%)1,088,531 (−5.5%)2,656,691 (−22.1%)
20163,122,183 (−6.7%)1,271,654 (+16.8%)3,212,143 (+20.9%)
20173,336,671 (+6.9%)1,522,049 (+19.7%)3,363,889 (+4.7%)
20183,425,247 (+2.7%)1,371,381 (−9.9%)3,178,236 (−5.5%)
20193,874,837 (+13.1%)2,044,800 (+49.1%)3,215,697 (+1.2%)
Table 6. Multiple regression results (Site 1) (2011–2019).
Unstandardized CoefficientStandardized CoefficienttpCollinearity Statistic
BStd. ErrorβToleranceVIF
constants4713.666655.171 7.1950.000
Temperature175.68914.1850.21812.3860.0000.9071.103
Precipitation−56.49311.972−0.087−4.7190.0000.8241.213
Wind speed−381.884172.794−0.038−2.2100.0270.9561.046
Sunshine duration253.20539.4540.1156.4180.0000.8721.147
Holiday6083.789305.7820.33319.8960.0000.9991.001
PM105.6456.2830.0170.8990.3690.7501.333
Warning issuance−781.918905.027−0.016−0.8640.3880.8001.250
R2 = 0.186, adjusted R2 = 0.184, F = 94.878 (p < 0.001).
Table 7. Multiple regression results (Site 2) (2011–2019).
Unstandardized CoefficientStandardized CoefficienttpCollinearity Statistic
BStd. ErrorβToleranceVIF
constants3625.448346.387 10.4660.000
Temperature37.5917.2790.0945.1640.0000.9051.105
Precipitation−21.4016.026−0.068−3.5510.0000.8311.203
Wind speed−659.07989.133−0.131−7.3940.0000.9561.046
Sunshine duration107.42020.3200.0985.2860.0000.8771.141
Holiday2768.510156.4890.30717.6910.0000.9981.002
PM10−5.9283.479−0.034−1.7040.0890.7641.309
Warning issuance778.104468.4840.0321.6610.0970.8201.220
R2 = 0.146, adjusted R2 = 0.144, F = 69.303 (p < 0.001).
Table 8. Multiple regression results (Site 3) (2011–2019).
Unstandardized CoefficientStandardized CoefficienttpCollinearity Statistic
BStd. ErrorβToleranceVIF
constants7588.363367.598 20.6430.000
Temperature69.4097.8240.1418.8710.0000.9011.110
Precipitation−11.7046.365−0.031−1.8390.0660.8281.207
Wind speed−77.18795.491−0.013−0.8080.4190.9551.047
Sunshine duration−75.48921.681−0.056−3.4820.0010.8741.144
Holiday6008.352169.3310.53735.4830.0000.9991.001
PM10−15.9203.731−0.075−4.2670.0000.7441.344
Warning occurrence1303.524491.8460.0452.6500.0080.8001.250
R2 = 0.323, adjusted R2 = 0.321, F = 201.407 (p = 0.001).
Table 9. Multiple regression result (Site 1).
BSEβt (P)VIF
Period 1
(2011–2015)
Constants3753.558810.561 4.631 (0.000)
Temperature196.35316.7930.27111.693 (0.000)1.086
Precipitation−44.24013.041−0.083−3.392 (0.001)1.202
Wind speed−338.493202.028−0.038−1.675 (0.094)1.049
Sunshine duration336.12247.0740.1697.140 (0.000)1.134
Holiday5375.496364.6480.32814.742 (0.000)1.004
PM1011.2876.6580.0421.695 (0.090)1.231
Warning issuance224.6731480.2530.0040.152 (0.879)1.155
R2 = 0.224, adjusted R2 = 0.221, F = 64.762 (p = 0.001)
Period 2
(2016–2017)
Constants7547.7272032.690 3.713 (0.000)
Temperature192.50437.7890.2005.094 (0.000)1.114
Precipitation−82.37132.470−0.104−2.537 (0.011)1.218
Wind speed−721.298602.206−0.047−1.198 (0.231)1.103
Sunshine duration116.399104.8930.0451.110 (0.268)1.167
Holiday6273.455813.4890.2907.712 (0.000)1.020
PM10−28.46721.102−0.063−1.349 (0.178)1.569
Warning issuance1899.8202776.4370.0310.684 (0.494)1.485
R2 = 0.142, adjusted R2 = 0.133, F = 14.682 (p = 0.001)
Period 3
(2018–2019)
Constants4782.2071564.201 3.057 (0.002)
Temperature116.98931.0850.1413.764 (0.000)1.231
Precipitation−70.98533.125−0.083−2.143 (0.032)1.318
Wind speed−23.461524.439−0.002−0.045 (0.964)1.104
Sunshine duration206.64786.0630.0922.401 (0.017)1.276
Holiday7499.755644.1390.39611.643 (0.000)1.013
PM1011.06917.5190.0300.632 (0.528)2.003
Warning issuance−2625.4571503.922−0.078−1.746 (0.081)1.762
R2 = 0.205, adjusted R2 = 0.197, F = 25.647 (p = 0.001)
Table 10. Multiple regression result (Site 2).
BSEβt (P)VIF
Period 1
(2011–2015)
Constants2211.288220.560 10.026 (0.000)
Temperature28.1374.4790.1356.282 (0.000)1.098
Precipitation−13.1143.291−0.089−3.984 (0.000)1.190
Wind speed−324.37153.570−0.127−6.055 (0.000)1.048
Sunshine duration77.82912.3910.1376.281 (0.000)1.128
Holiday2371.70996.5310.50624.569 (0.000)1.003
PM104.9921.9610.0582.545 (0.011)1.209
Warning issuance−53.500385.501−0.003−0.139 (0.890)1.116
R2 = 0.336, adjusted R2 = 0.333, F = 113.763 (p = 0.001)
Period 2
(2016–2017)
Constants4223.5951478.308 2.857 (0.004)
Temperature87.98626.9020.1313.271 (0.001)1.098
Precipitation−54.63025.316−0.091−2.158 (0.031)1.228
Wind speed−502.642437.781−0.046−1.148 (0.251)1.095
Sunshine duration64.66578.2340.0340.827 (0.409)1.175
Holiday3697.079590.7820.2426.258 (0.000)1.027
PM10−35.86215.551−0.107−2.306 (0.021)1.492
Warning issuance2031.1932022.6840.0461.004 (0.316)1.418
R2 = 0.094, adjusted R2 = 0.084, F = 9.243 (p = 0.001)
Period 3
(2018–2019)
Constants2959.577688.657 4.298 (0.000)
Temperature27.79113.5640.0812.049 (0.041)1.223
Precipitation−32.71814.883−0.089−2.198 (0.028)1.288
Wind speed−43.228229.515−0.007−0.188 (0.851)1.109
Sunshine duration142.98337.9050.1523.772 (0.000)1.260
Holiday2954.598277.8160.38410.635 (0.000)1.015
PM103.6147.7000.0230.469 (0.639)1.895
Warning issuance−300.427645.596−0.022−0.465 (0.642)1.684
R2 = 0.200, Adjusted R2 = 0.191, F = 22.238 (p = 0.001)
Table 11. Multiple regression result (Site 3).
BSEβt (P)VIF
Period 1
(2011–2015)
Constants7678.537534.792 14.358 (0.000)
Temperature99.03910.8650.2049.115 (0.000)1.101
Precipitation−14.0757.840−0.042−1.795 (0.073)1.189
Wind speed−146.874129.210−0.025−1.137 (0.256)1.050
Sunshine duration−108.34429.883−0.082−3.626 (0.000)1.129
Holiday5379.336232.7940.49423.108 (0.000)1.003
PM10−9.9174.704−0.050−2.108 (0.035)1.212
Warning issuance2046.623917.6160.0502.230 (0.026)1.118
R2 = 0.302, adjusted R2 = 0.299, F = 94.696 (p = 0.001)
Period 2
(2016–2017)
Constants9485.285834.043 11.373 (0.000)
Temperature−23.13315.443−0.047−1.498 (0.135)1.116
Precipitation−7.18113.478−0.017−0.533 (0.594)1.227
Wind speed−129.007247.430−0.016−0.521 (0.602)1.105
Sunshine duration−67.23443.962−0.049−1.529 (0.127)1.170
Holiday6992.099343.4900.60820.356 (0.000)1.018
PM10−33.6408.819−0.140−3.814 (0.000)1.537
Warning issuance1165.5741140.7120.0361.022 (0.307)1.453
R2 = 0.386, adjusted R2 = 0.380, F = 63.056 (p = 0.001)
Period 3
(2018–2019)
Constants7352.828822.664 8.938 (0.000)
Temperatures84.47916.3930.1695.153 (0.000)1.228
Precipitation−11.26417.670−0.022−0.637 (0.524)1.312
Wind speed−519.714273.991−0.059−1.897 (0.058)1.113
Sunshine duration32.53845.4280.0240.716 (0.474)1.270
Holiday6429.616344.8120.55718.647 (0.000)1.013
PM10−27.3799.145−0.125−2.994 (0.003)1.969
Warning issuance2122.759784.9890.1062.704 (0.007)1.737
R2 = 0.373, adjusted R2 = 0.367, F = 60.544 (p = 0.001)
Publisher’s Note: MDPI stays neutral with regard to jurisdictional claims in published maps and institutional affiliations.

