Article

Ambient and Heat-Cured Geopolymer Composites: Mix Design Optimization and Life Cycle Assessment

Center for Advanced Materials (CAM), Qatar University, Doha P.O. Box 2713, Qatar
*
Authors to whom correspondence should be addressed.
Sustainability 2022, 14(9), 4942; https://doi.org/10.3390/su14094942
Submission received: 3 March 2022 / Revised: 11 April 2022 / Accepted: 19 April 2022 / Published: 20 April 2022
(This article belongs to the Special Issue Recent Advances in Concrete Technologies and Building Materials)

Abstract

:
The feasibility of producing sustainable cement-free composites and its environmental impact were investigated in this research. Experimental parametric evaluation was carried out in this regard to explore the optimum mix design of the composites. The effect of synthesis parameters and curing conditions on the behavior of the produced geopolymer composites was investigated. The studied parameters included the molarity of the sodium hydroxide solution (12 M, 14 M, and 16 M), the sodium silicate to sodium hydroxide ratio (1, 1.5, 2, and 2.5), the fluid to binder ratio (0.6, 0.65, and 0.7), and the age. The curing conditions included ambient curing and heat treatment at 40 °C, 80 °C, and 120 °C for 24 h, 48 h, and 72 h. In addition, life cycle assessment was performed to compare the environmental impact of geopolymer and cementitious composites. The results reflected the possibility of producing geopolymer composites with significant positive environmental impacts over traditional cementitious composites. The synthesis parameters played a major role in the behavior of the produced geopolymers. Heat curing was necessary for the geopolymer mortar to achieve high early strength. However, strength development with age was more obvious for ambient-cured specimens than heat-cured specimens. The optimum fluid to binder ratio used in this research was 0.6. For this ratio, the compressive strength increased as the molarity of the sodium hydroxide solution increased for all sodium silicate to sodium hydroxide ratios. Finally, SEM images showed that the higher the molarity and as the amount of reacted FA particles increased, the better the microstructure of the geopolymer mortar was and the fewer pores the matrix had.

1. Introduction

Concrete is the most used material in the construction industry all over the world; in this industry, ordinary Portland cement (OPC) is considered as the main binding material. Cement production requires a huge amount of energy and is responsible for about 7% of carbon dioxide emissions to the atmosphere [1,2]. The production of one ton of cement produces about one ton of CO2 [3]. Therefore, as the production of cement increases, the release of greenhouse gases also increases. Researchers in the field of construction tend to come up with new binding materials that have mechanical and durability properties comparable to those of cementitious materials as well as have a lower carbon dioxide footprint. Geopolymers have been proposed as a potential binding material.
The geopolymerization process can be defined as the formation of 3-D polymeric chain rings consisting of Si-O-Al-O due to the activation of the source material that is rich in silica and alumina by an alkaline activator [4]. The use of geopolymer as a binder in construction materials was introduced by Davidovits in 1978 [5]. Since then, geopolymer binders have shown their capability in achieving a similar or higher strength than cementitious binding materials [6,7,8]. Geopolymers utilize the polycondensation of silica and alumina, which then contribute to C-A-S-H and/or N-A-S-H matrix formation to achieve the required strength. Water is only needed to facilitate the workability and does not contribute to the impact of the resulting geopolymer structure. In contrast, OPC needs the C-S-H gel for matrix formation in order to develop strength and needs to be mixed with water for a hydration reaction to occur, thus producing the primary hydration products (C-S-H and CH). This difference has crucially led to the mechanical and chemical properties of the resulting geopolymer product and renders it more resistant to heat, chemical attack, and the ingress of chemical species [9].
The behavior of geopolymer mortar highly depends on many factors, mainly the chemical composition of the source materials and its particle size distribution, curing conditions, and the type and concentration of the alkali activators [10,11,12]. For the production of geopolymers, the choice of source materials creates challenges since it depends on many factors, including end-use availability, costing, and type of application used. Class F fly ash (low-calcium FA) has been considered as a suitable source material for geopolymer production due to its high content of silica and alumina as well as its wide availability [13,14]. However, the major challenge of using class F FA in geopolymer production is the poor strength of the FA-based geopolymer materials when cured at ambient temperature [15]. In addition to the source materials, alkaline activators play a major role in activating the reaction in the geopolymerization process. The most common alkaline activator solutions used in geopolymer production are sodium or potassium hydroxides combined with sodium or potassium silicates [7,10,11,15]. However, a mixture of sodium hydroxide and sodium silicates is usually used due to their lower cost as compared to other activators. A sodium hydroxide solution is used to increase the dissolution rates of the source materials and to allow for better formation of polymerization products due to its exothermic characteristics [4,15,16]. The addition of a sodium silicate solution leads to the improved strength and the hardening properties of the binder [17]. An increase in the concentration of alkali hydroxide is believed to increase the reaction rate. However, beyond the optimum concentration of the alkaline activator, the properties of the produced geopolymer decrease [18]. The effect of alkaline solution molarity on the compressive strength of the geopolymer mortar has been investigated by many researchers, who concluded that the compressive strength increased as the molarity of NaOH solution increased [19,20,21]. Curing processes refer to the treatment of the casted concrete during its setting and hardening. Curing conditions play a significant role in the geopolymerization process and in the mechanical properties of geopolymers [22,23,24,25,26]. Most of the published literature shows that geopolymers need heat treatment to achieve strength comparable to that of Portland cement [6,8,10,13,15,18,20,22,23]. Heat treatment accelerates the dissolution of silica and alumina from the source materials and then assists in the polycondensation process. Beyond a certain temperature, the polymerization process decelerates, which adversely affects the strength of the geopolymers [11,16].
The abovementioned literature shows that the production and characterization of geopolymer composites have been well-studied. However, less research has been directed towards investigating the environmental impact of such materials. The novelty of this research comes from the fact that it tries to combine the syntheses, characterization, and environmental impact of the proposed geopolymer composites. Hence, this research aims to identify the optimum mix design of a class F fly ash-based geopolymer mortar (GPM) and focuses on the variation of its characteristics. The influence of the molarity of the sodium hydroxide solution, the sodium silicate to sodium hydroxide ratio, the fluid to binder ratio, curing conditions, and age on the compressive strength, flowability, and microstructure of geopolymer mortar made of class F fly ash is experimentally investigated. After that, a life cycle assessment (LCA) is conducted to evaluate the environmental impact of the optimum mix design of the geopolymer mortar and is compared with a mix design of the cement mortar.

2. Experimental Program
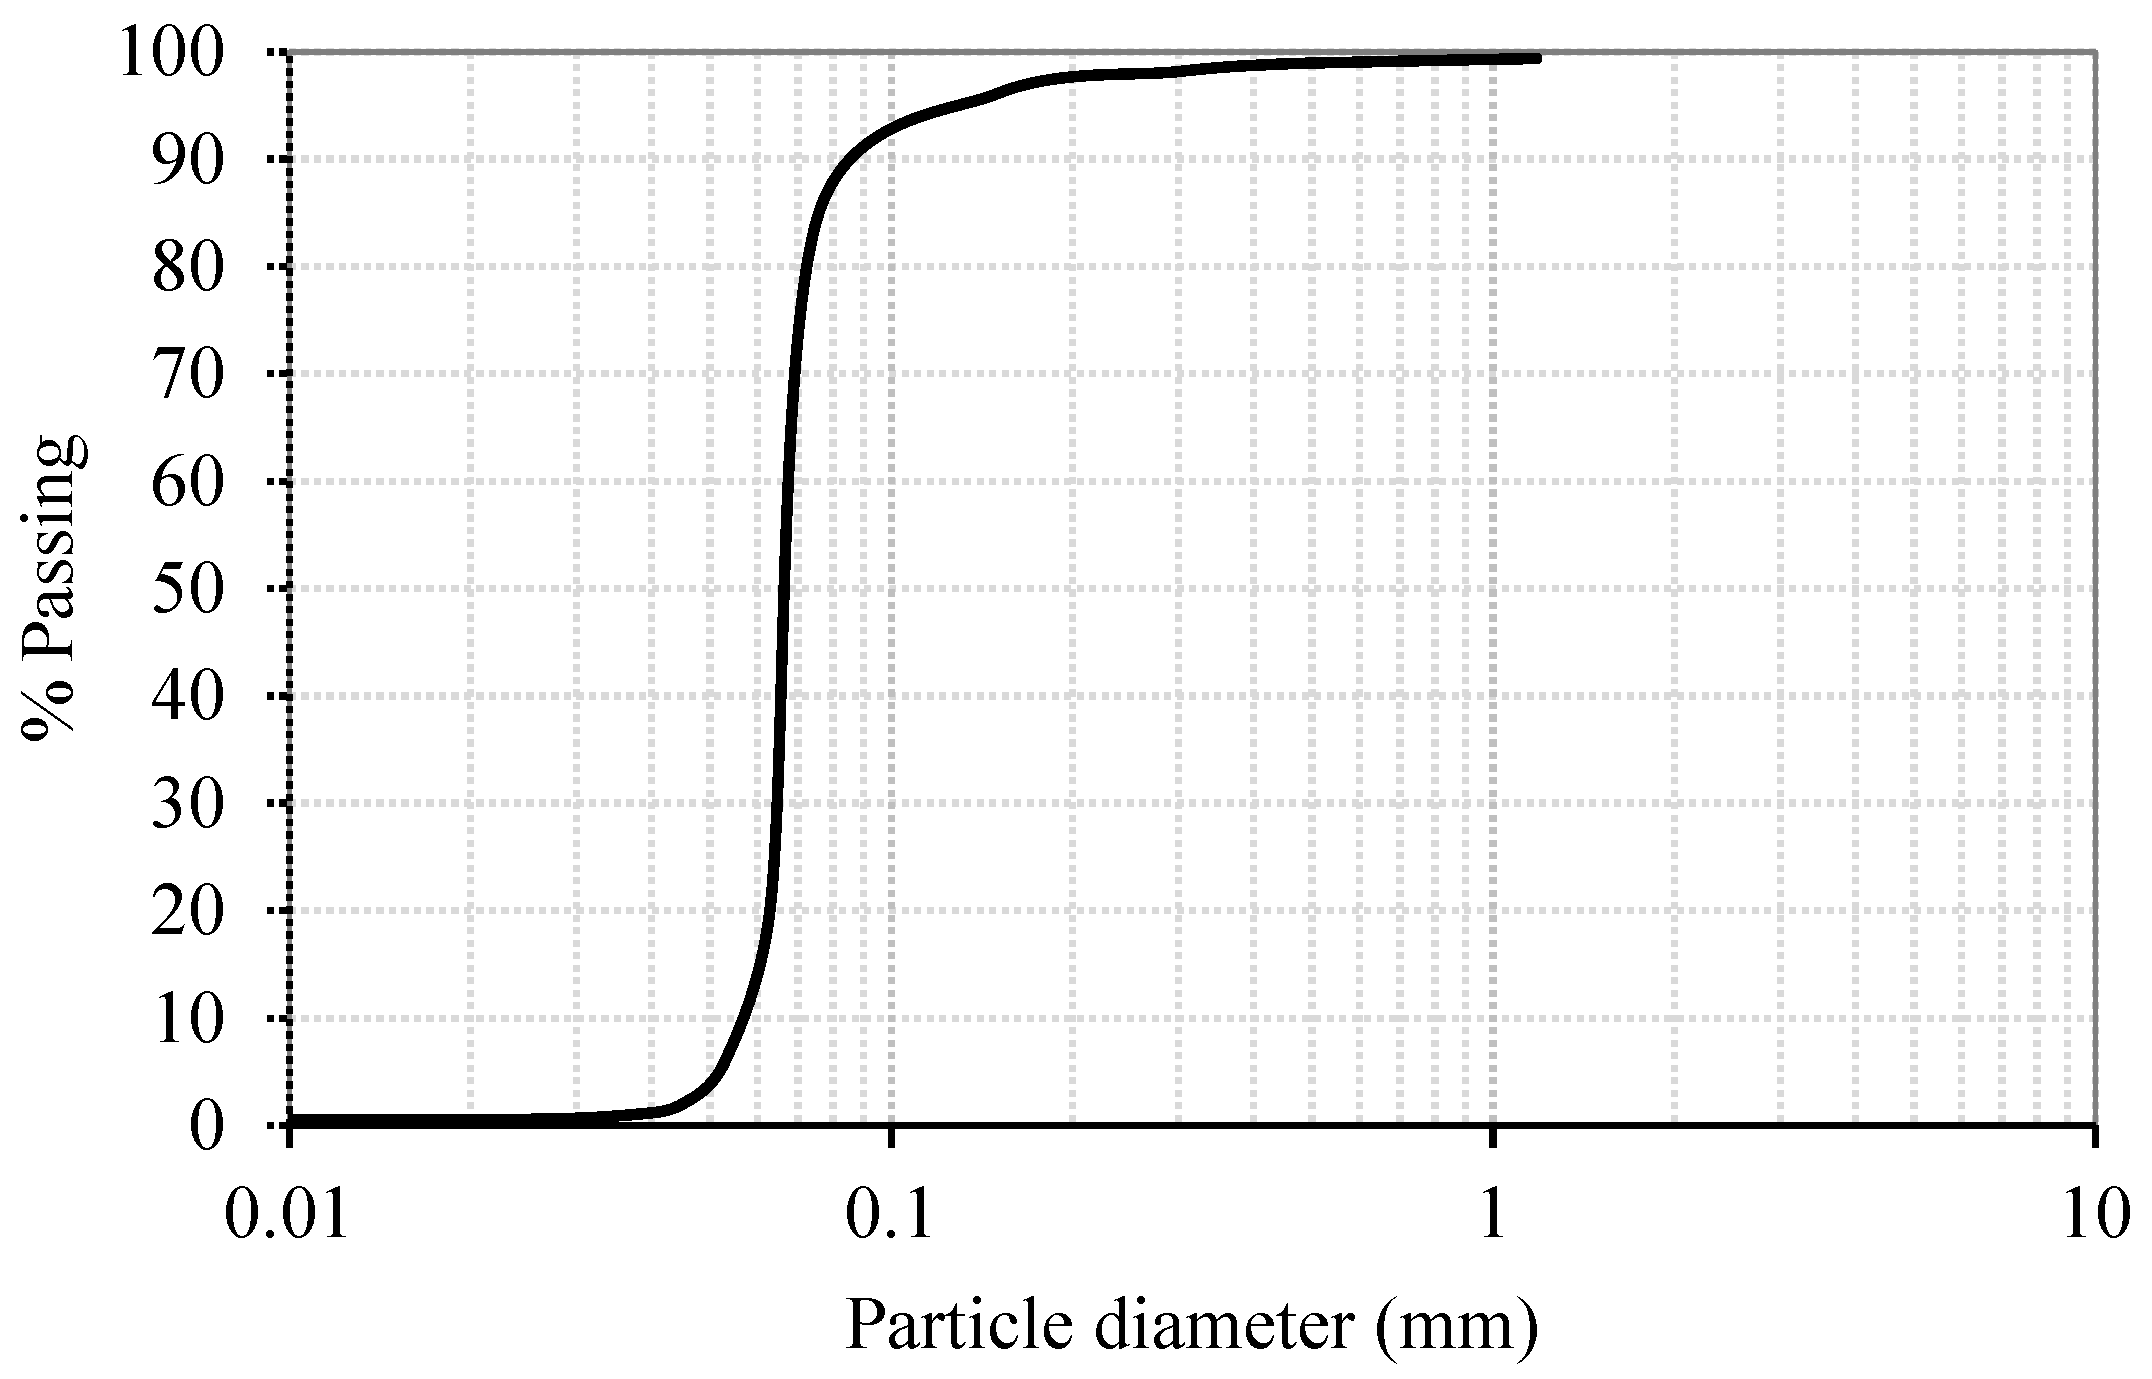
2.1. Materials

The fly ash (class F) was acquired from SMEET Qatar, with chemical compositions specified in Table 1, in compliance with ASTM C618-12a standards. The fly ash passed sieve #200 (75 µm) and had a moisture content and density of 0.5% and 2.23 g/cm3, respectively. The particle size distribution of the fly ash is as shown in Figure 1.
Locally available silica sand conforming to ASTM Standard C778 was used for geopolymer mortar mixing. The fineness modulus, specific gravity, and water absorption of the sand were equal to 2.31, 2.56, and of 1.87%, respectively. Sodium hydroxide (NaOH) pellets with a purity of 98% was acquired from a local supplier and used in this study. A NaOH solution with concentrations of 12, 14, and 16 Molar were prepared by mixing 480 g, 560 g, and 640 g of NaOH pellets, respectively, in one liter of distilled water. The NaOH pellets were dissolved gradually in distilled water until reaching the desired concentration of the solution. Each solution was prepared in a big plastic container immersed in a water bath to accommodate the heat of the reaction between the NaOH and water as the reaction was an exothermic reaction. The solution was left at room temperature for 30 min to lower its temperature. The solution was then poured into an airtight glass jar to prevent a reaction with air and to be used later to prepare the different mix designs of the geopolymer mortar. The sodium silicate (Na2SiO3) solution was acquired from Qatar Detergent Company in Qatar, with a Na2SiO3 concentration of 40%. The solution was prepared by mixing anhydrous sodium silicate crystals under heat and pressure with water. Both sodium hydroxide and sodium silicate were prepared separately before casting the geopolymer specimens.

2.2. Mix Proportions, Mortar Casting, and Specimen Preparations

The experimental work was divided into three phases. In the first phase, three different molarities of the NaOH solution of 12 M, 14 M, and 16 M were considered. The fluid to binder (f/b) ratios of 0.60, 0.65, and 0.70 were studied, where the fluid was the total activator solution of both NaOH and Na2SiO3 and the binder was the fly ash. Four ratios of Na2SiO3 /NaOH of 1, 1.5, 2, and 2.5 were used. The fly ash to sand ratio of 1:2.75 was fixed for all GPM mixes. GPM specimens were cured at a fixed temperature of 80 °C and for a duration of 24 h. In the second phase, the mix associated with the highest compressive strength from phase one was used to optimize the curing conditions. That mix was cured at three different temperatures of 40 °C, 80 °C, and 120 °C for three various durations of 24 h, 48 h, and 72 h. In the third phase, the mix associated with the highest compressive strength from phase one and cured at the optimum curing conditions extracted from phase two was used to study the strength development of GPM with time. The results were compared with the results of other mixes cured at ambient temperature. The studied parameters for all phases and the detailed mix design are summarized in Table 2 and Table 3, respectively.
Geopolymer mortar was prepared by mixing the NaOH and Na2SiO3 solutions for 2 min in a glass measuring jar. Then, the activator solutions were placed in a mixing bowl, and fly ash was added to the activator solutions and mixed in the mixing bowl for 30 s at low speed. After that, the sand was added to the mix and was mixed for 30 s at low speed. The mixing speed was increased to high speed, and the mixing continued for 120 s. At this point, the flow table test was conducted, followed by 15 s of mixing at high speed. The mortar was then poured into 5 cm mortar cubes to complete two layers, and each layer was tamped with a tamping rod for 32 times, according to the ASTM C305 standards. The excess mortar was removed with a trowel to ensure a flat surface.

2.3. Test Procedures

2.3.1. Compressive Strength

The compressive strength of the geopolymer mortar was determined in a control universal testing machine, according to the ASTM C109. The loading rate was set to 1.3 kN/s, with a peak sensitivity of 5 kN. Geopolymer mortar samples were loaded until failure. Three specimens for each mix were tested, and the average strength was reported.

2.3.2. Flow Table Test

The flow table was performed for all mix designs prepared in this study, according to ASTM C1437. The flow table test was accomplished by calculating the average of four readings.

2.3.3. Scanning Electron Microscopy (SEM)

SEM was conducted on selected geopolymer mortar specimens to study the effect of the studied parameters on the microstructure of the geopolymer mortar. SEM analysis was conducted for small mortar fragments using a NOVA NanoSEM 450 device (Hillsboro, OR, USA). The procedure for conducting the SEM analysis was as per ASTM C1723 standards. Fractured mortar pieces of a size of 0.5 cm were placed on a round metallic holder, and then gold coating was applied onto the specimens for 40 s in order to enhance the conductivity of the specimen.

2.3.4. Life Cycle Assessment (LCA)

LCA is an approach used to analyze the impacts of a product/service/activity on the environment, from the stage of retrieving the raw materials from the planet until the products are recycled or wasted, that is, until their disposal. The LCA allows for the estimation of the product lifespan, in the stages of production, use, and waste, or in other words, the complete process of producing a product. The process of applying LCA is considered to be a systematic approach, which consists of four components: (1) goal and scope definition, (2) inventory phase, (3) impact assessment phase, and (4) interpretation phase [27]. This approach has been employed in assessing the environmental impact of geopolymers [28,29]. In this study, the goal was to evaluate the environmental impact of the optimum mix design of geopolymer mortar and to compare it with a mix design of cement mortar (CM). The scope was to study the four processes of cradle-to-gate of the production of GPM and CM. The LCA study was performed using the Centrum voor Milieukunde Leiden (CML) 2016 method [30]. CML 2016 indicators provided information on the environmental issues associated with the inputs and outputs of the product system [27]. The assessment principally focused on the global warming potential (GWP), acidification potential (AP), eutrophication potential (EP), and abiotic depletion potential (ADP fossil) impact categories. These impact categories are relevant for the assessment of emissions generated during the production of binders [31,32,33,34]. LCA modelling was performed using the GaBi LCA modelling software (version 9.2.1.68).

Life Cycle Inventory (LCI)

Life cycle inventory (LCI) is the phase where all system boundary unit processes are quantified. The LCI data of the different processes considered in this study are listed in Table 4. Unit processes such as fly ash, cement, sand, sodium silicate, sodium hydroxide, water, and electricity were sourced from the GaBi database. The environmental impacts of capital goods such as equipment and buildings were not considered in this study. Oven curing is required in geopolymer mortar production, which is essential for initiating the chemical reaction of the binder at the first instance.

3. Results and Discussion

3.1. Compressive Strength

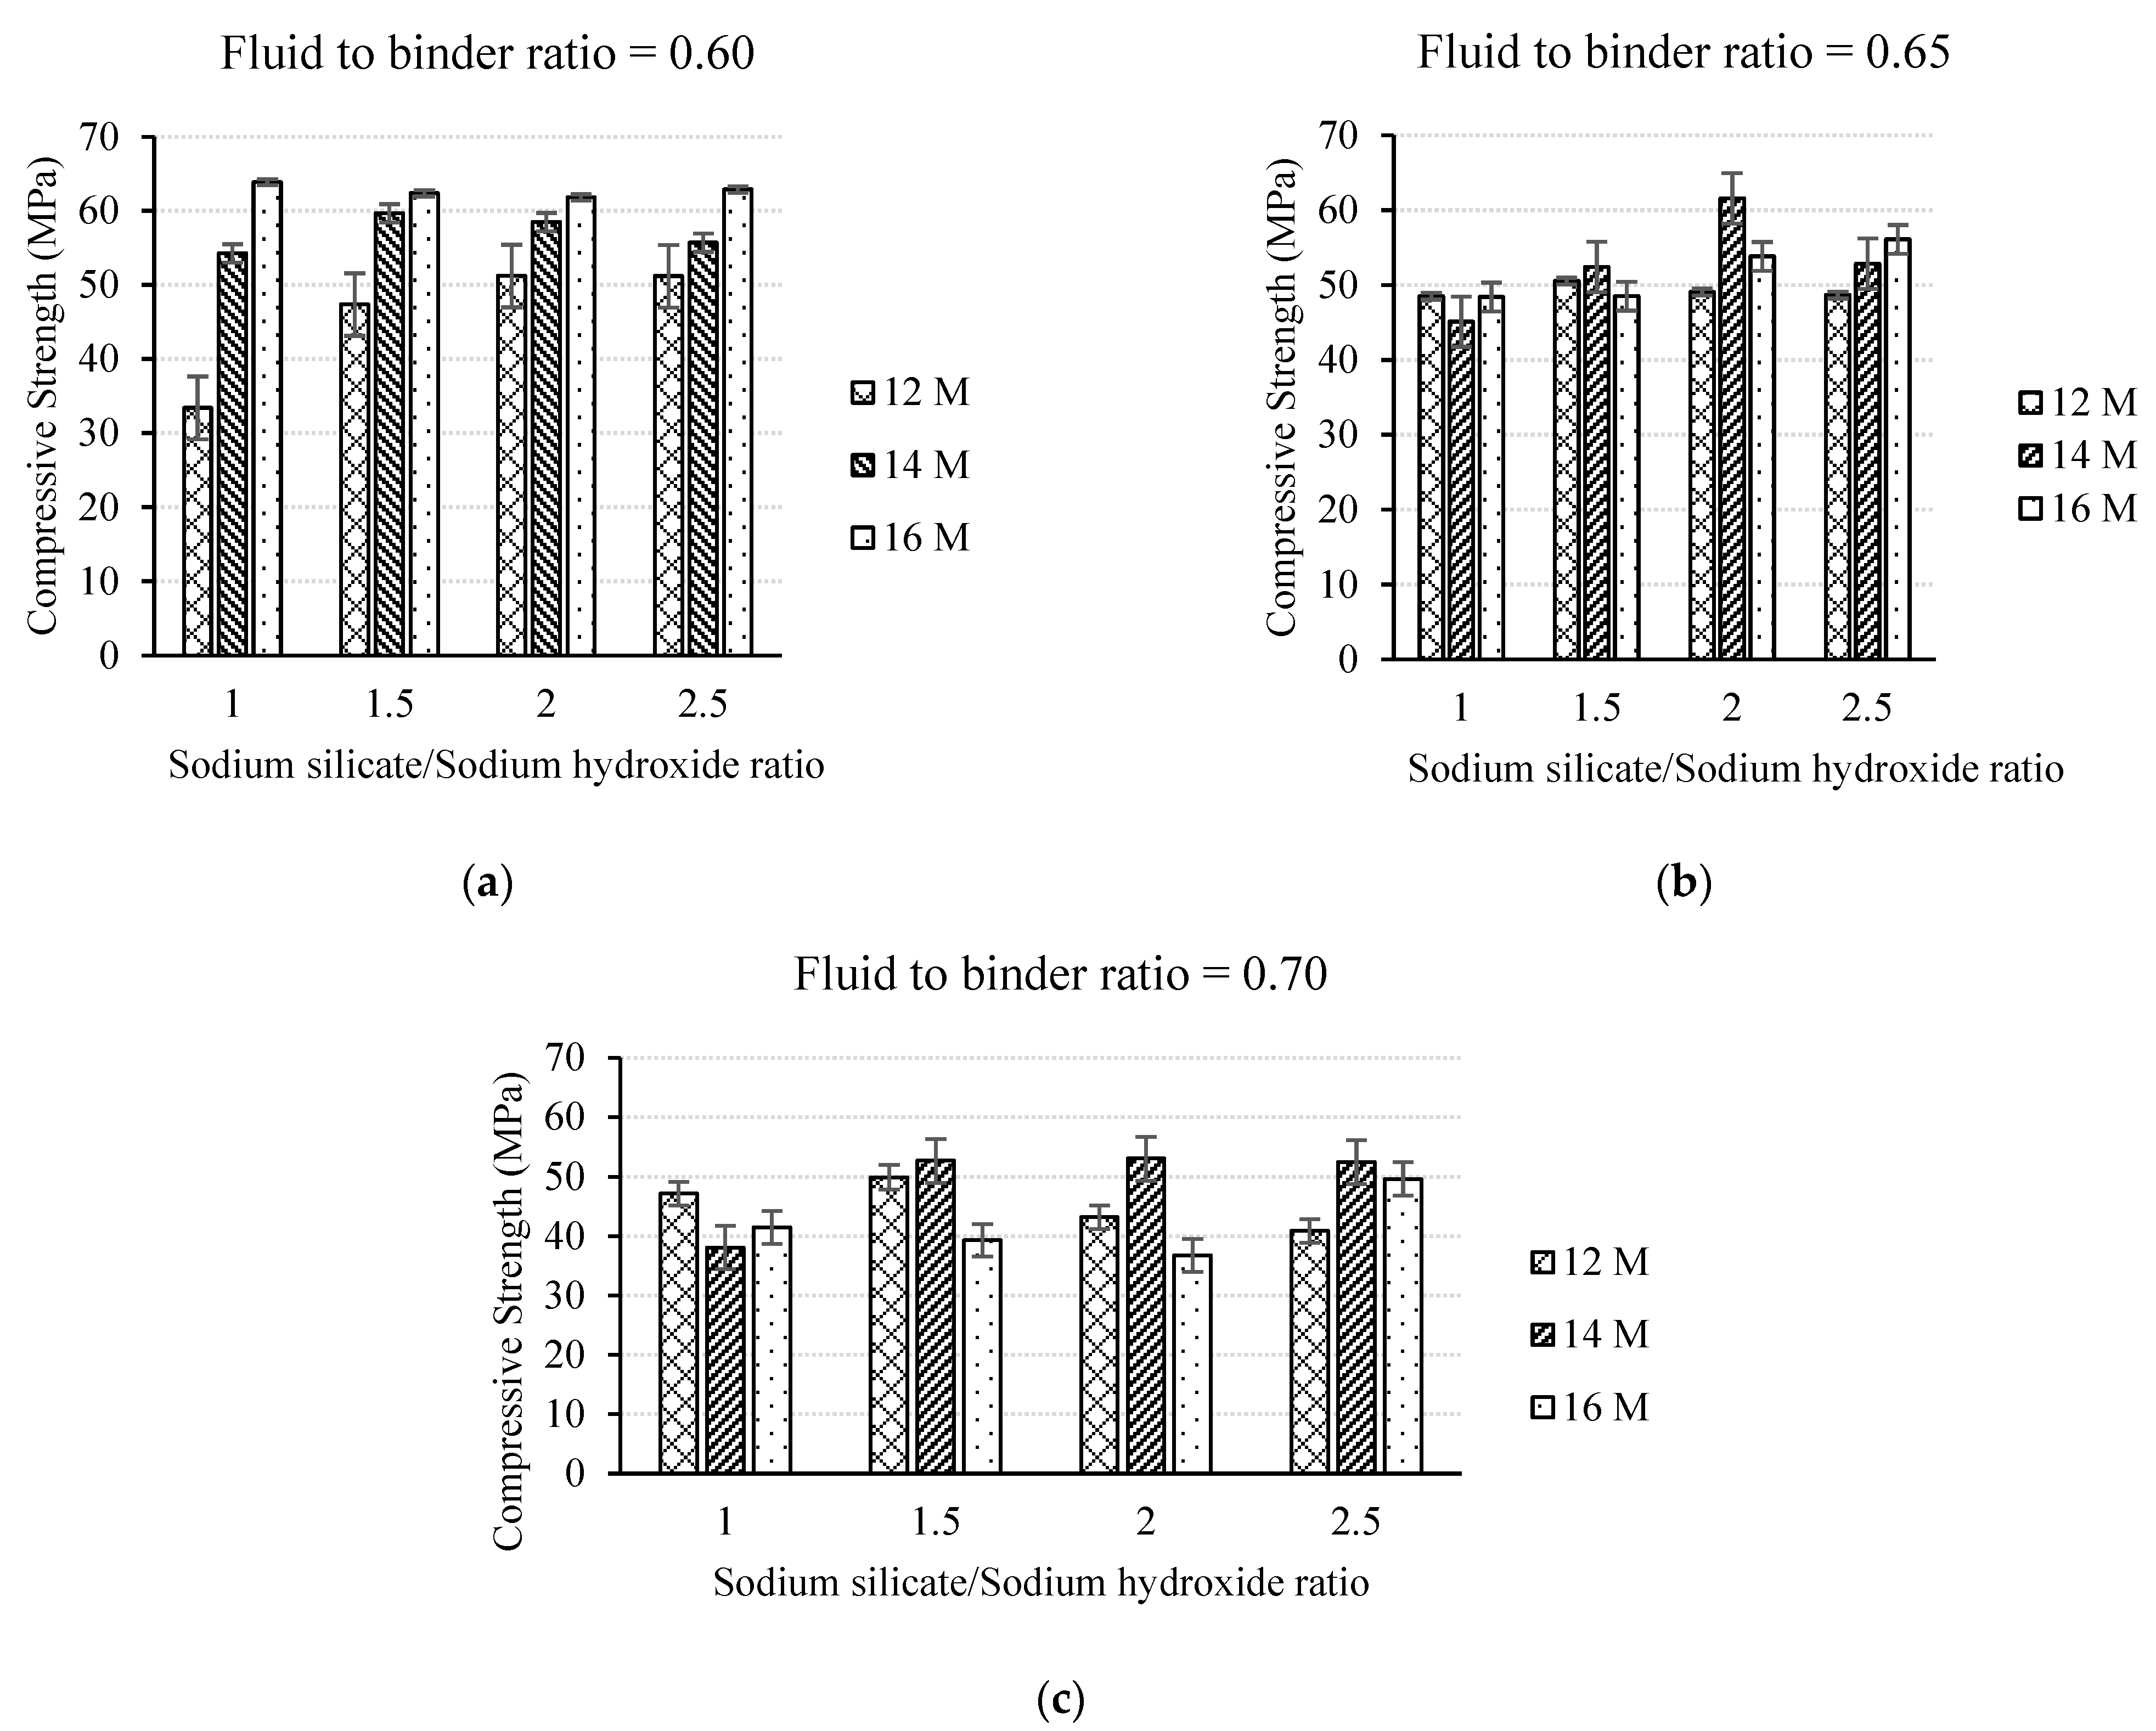
3.1.1. Effect of the Fluid to Binder Ratio and Activator Solution Characteristics

The effect of the fluid to binder ratio, the NaOH solution molarity, and the Na2SiO3/NaOH ratio on the compressive strength of the geopolymer mortar were studied in the first phase of this study. Three NaOH molarities: 12 M, 14 M, and 16 M; three fluid to binder ratios: 0.6, 0.65, and 0.7; and four sodium silicate to sodium hydroxide ratios: 1.0, 1.5, 2.0, and 2.5 were considered in this study. All specimens were cured at 80 °C for 24 h. The compressive strength results are depicted in Figure 2.
For the specimens casted with a fluid to binder ratio of 0.60, it was noted that an increasing trend for compressive strength was captured across the molarities of the NaOH solution; as the molarity increased, the compressive strength also increased for all Na2SiO3/NaOH ratios, as shown in Figure 2a. Using a sodium hydroxide solution with 16 M gave the highest compressive strength of more than 60 MPa, regardless of the sodium Na2SiO3/NaOH ratios. On the other hand, the minimum compressive strength of the geopolymer mortar casted with a fluid to binder ratio of 0.6 was attained in the case of using a 12 M NaOH solution with a Na2SiO3/NaOH ratio of 1.0. For specimens casted with a fluid to binder ratio of 0.65, an increasing trend for compressive strength with the molarities of the NaOH solution was noticed only in the case of using a Na2SiO3/NaOH ratio of 2.5, as shown in Figure 2b. A maximum compressive strength of 61.6 MPa was attained with the use of a 14 M NaOH solution and a Na2SiO3/NaOH ratio of 2.0. On the other hand, the minimum compressive strength was equal to 45.1 MPa and was attained with the use of a 14 M NaOH solution and a Na2SiO3/NaOH ratio of 1.0. For specimens casted with a fluid to binder ratio of 0.7, the maximum compressive strength was achieved in the case of using a NaOH solution of 14 M for all Na2SiO3/NaOH ratios, except for a ratio of 1.0, as shown in Figure 2c. For a Na2SiO3/NaOH ratio of 1.0, the compressive strength was the highest for specimens activated with a 12 M NaOH solution. The maximum compressive strength of 53 MPa was attained in the case of using a 14 M NaOH solution and a Na2SiO3/NaOH ratio of 2.0. On the other hand, the minimum compressive strength was equal to 36.8 MPa and was attained in the case of using a 16 M NaOH solution and a Na2SiO3/NaOH ratio of 2.0. The abovementioned results are in good agreement with the published literature [4,10,15,18,35]. Finally, the effect of the fluid to binder ratio on the compressive strength of the GPM varied for different molarities. For GPM specimens activated with a 16 M NaOH solution, a decreasing trend in compressive strength was achieved, which means that as fluid to binder ratio increased, the compressive strength decreased. This might be attributed to the excess amount of hydroxide ions in the mix; similar findings were reported by [36,37].

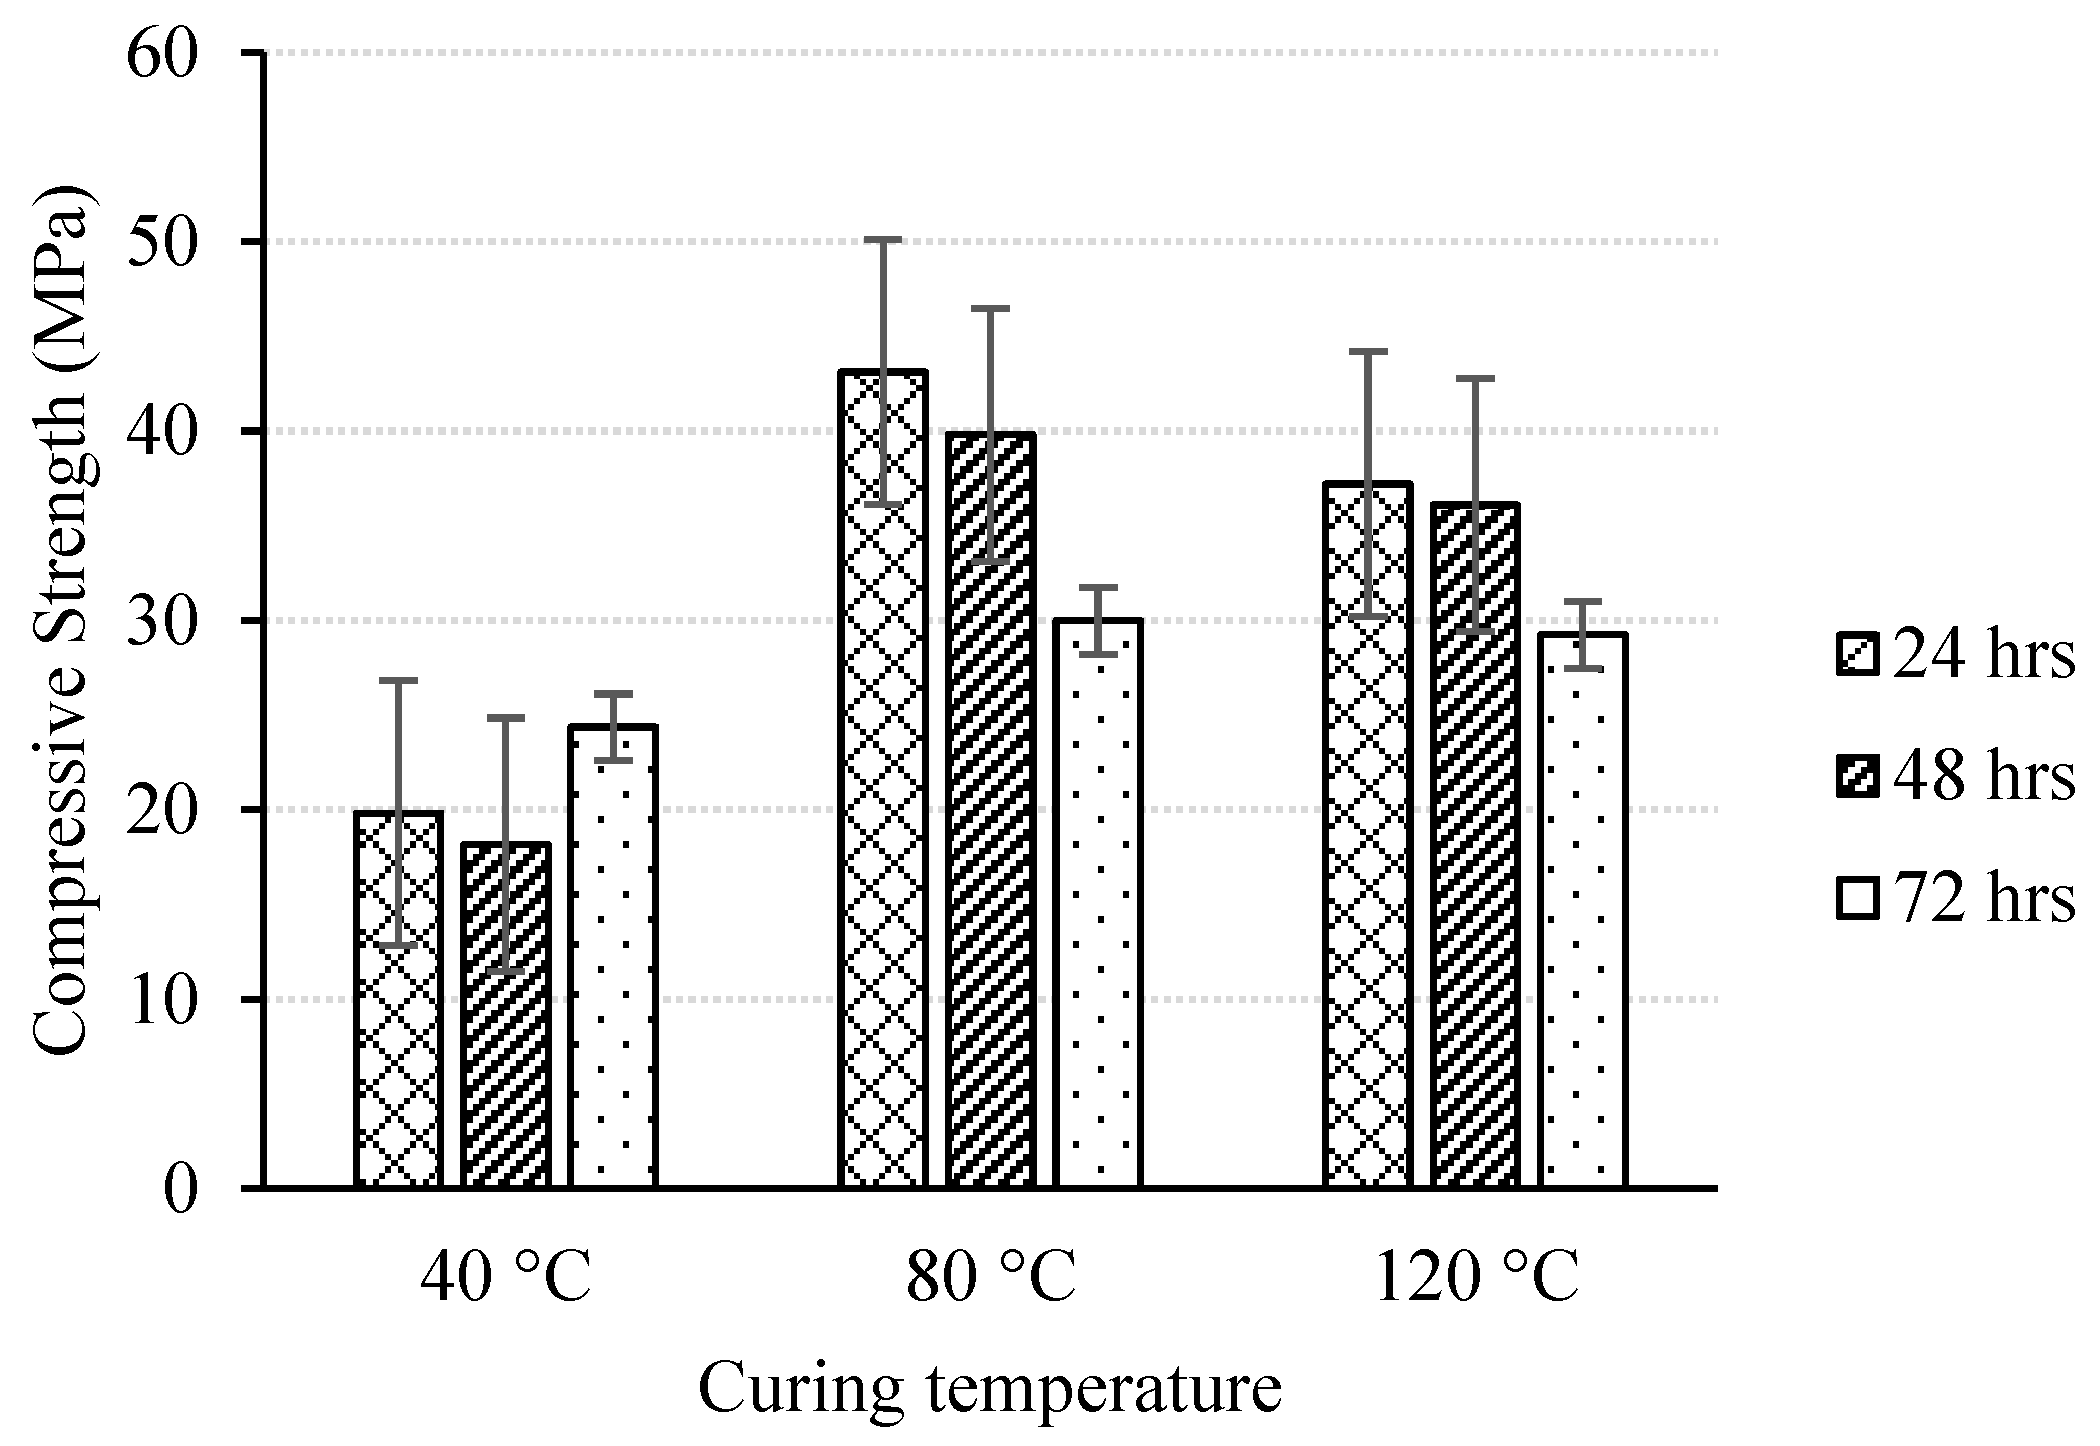
3.1.2. Effect of Curing Condition

It was good to know that the selection of the optimum mix design from among all mixes used in phase one had to be performed based on several parameters such as the strength, the workability, the cost, and the difficulties associated with the work. However, it was very complicated to choose one mix based on all of these parameters simultaneously. Thus, the optimum mix was chosen based on the strength due to the importance of this parameter in construction applications. In order to study the effect of curing conditions on the compressive strength of GPM, the mix design M25 was used to cast the specimens as it attained the highest compressive strength of all the mixes previously studied in phase one. Three curing temperatures of 40 °C, 80 °C, and 120 °C and three durations of 24 h, 48 h, and 72 h were considered in this phase of the study. The results are summarized in Table 5.
For all studied durations, the compressive strength of GPM increased by elevating the temperature from 40 °C to 80 °C, and then decreased at a curing temperature of 120 °C, as shown in Figure 3. The reason behind this trend can be attributed to the escape of water that occurs in the activator solutions; in the case of curing temperatures greater than 80 °C, numerous voids that affect the integrity of the matrix are left behind [15,22]. Similar results have been reported by many authors in the literature [6,38]. For specimens cured at 80 °C and 120 °C, Figure 3 shows that the compressive strength decreased with an increase in the curing duration. The loss of strength as the duration increased might be attributed to the breakup of the amorphous structure of the geopolymer mortar, thus exposing the matrix to extensive moisture loss [15,22]. Finally, it is good to mention that the optimum curing conditions for the compressive strength of the GPM were a heat-curing temperature of 80 °C for a duration of 24 h. These conditions helped the geopolymer mortar to gain a compressive strength of 43.1 MPa. The variation in the compressive strength for M25 between Phase 1 and Phase 2 may be attributed to the differences in the chemical composition of the source material (fly ash) within the same batch.

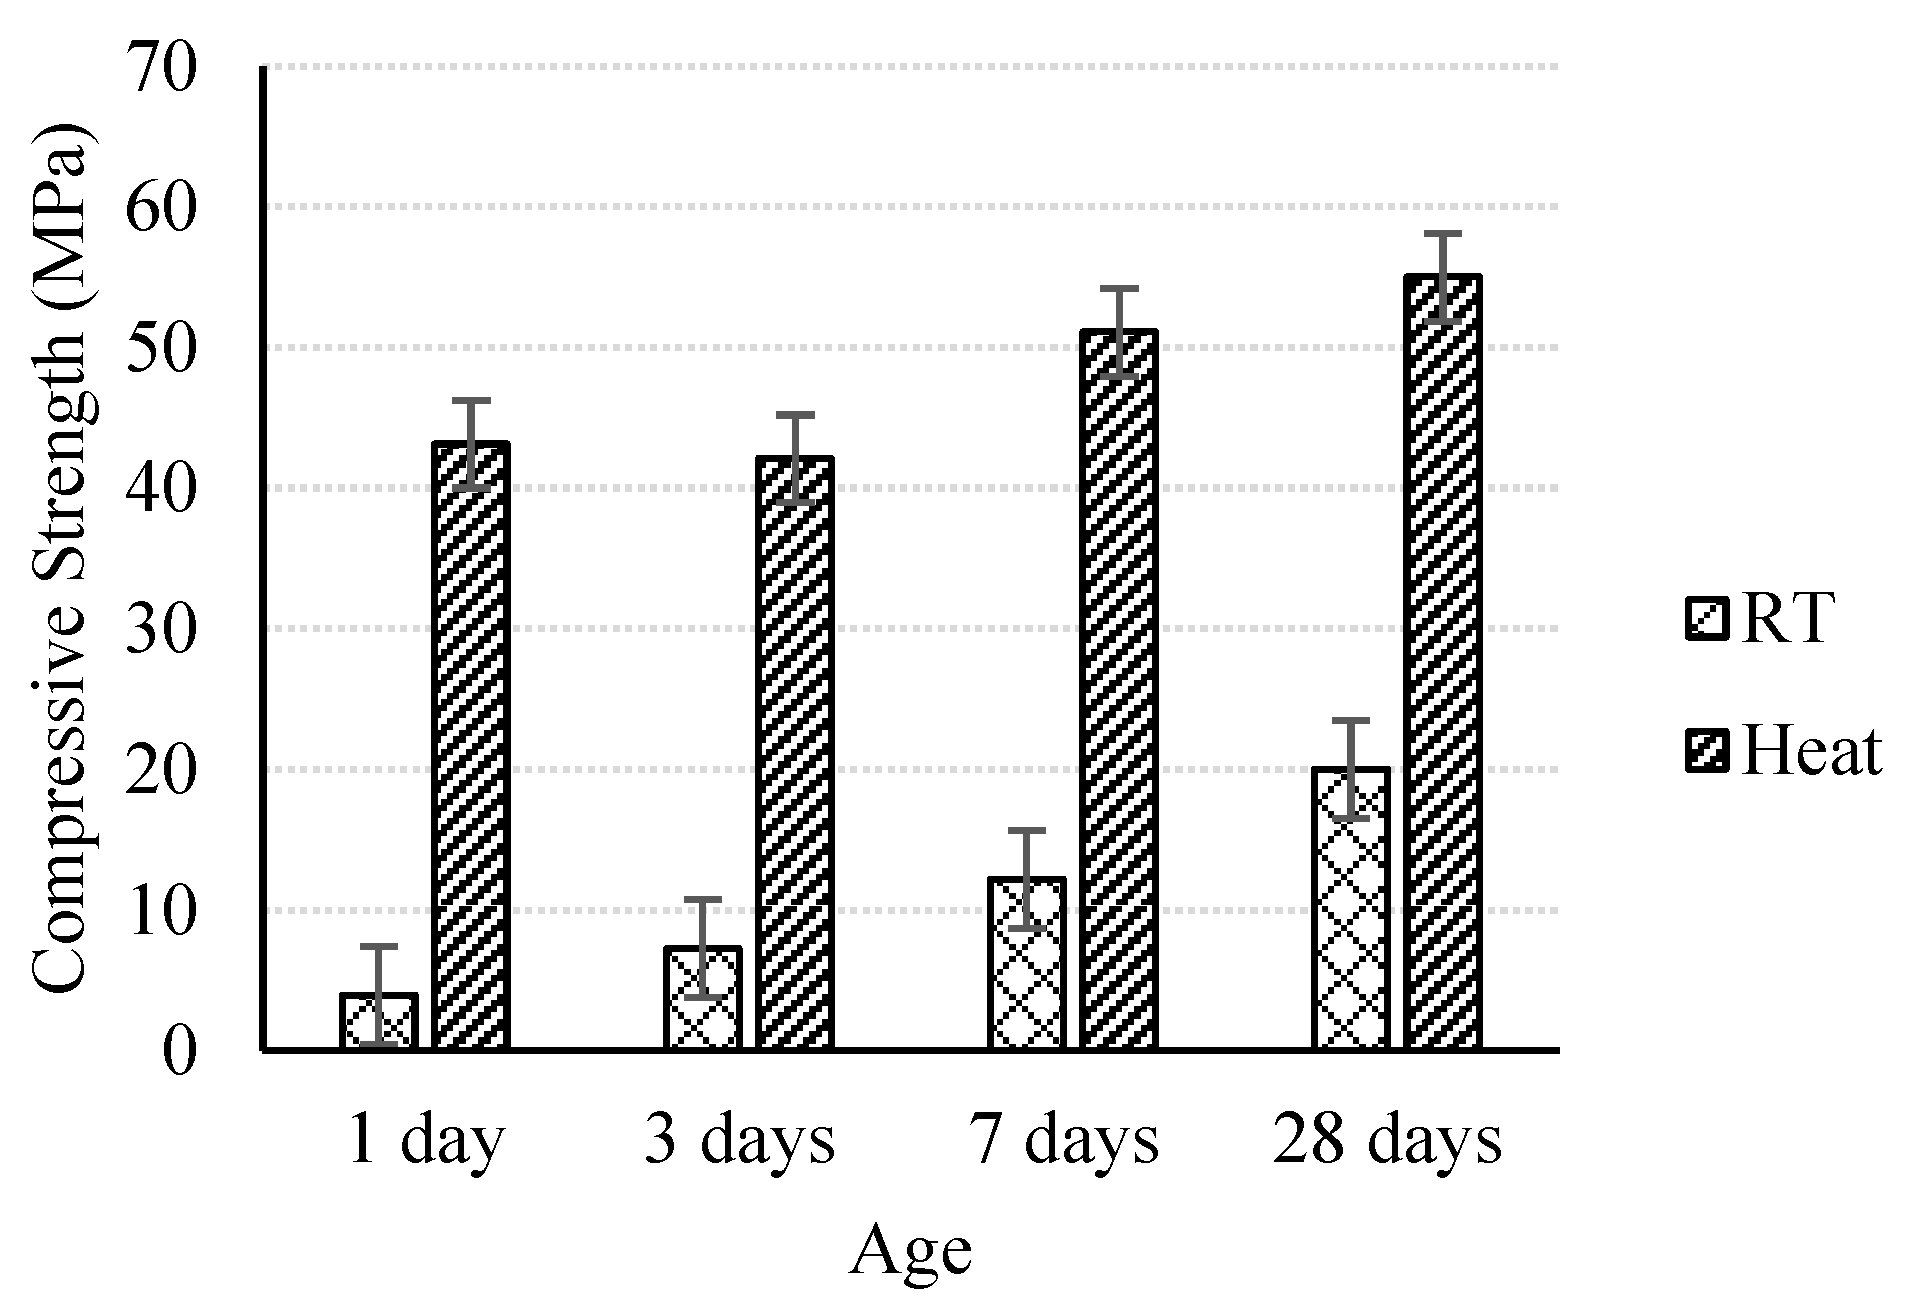
3.1.3. Effect of Age on Compressive Strength Development
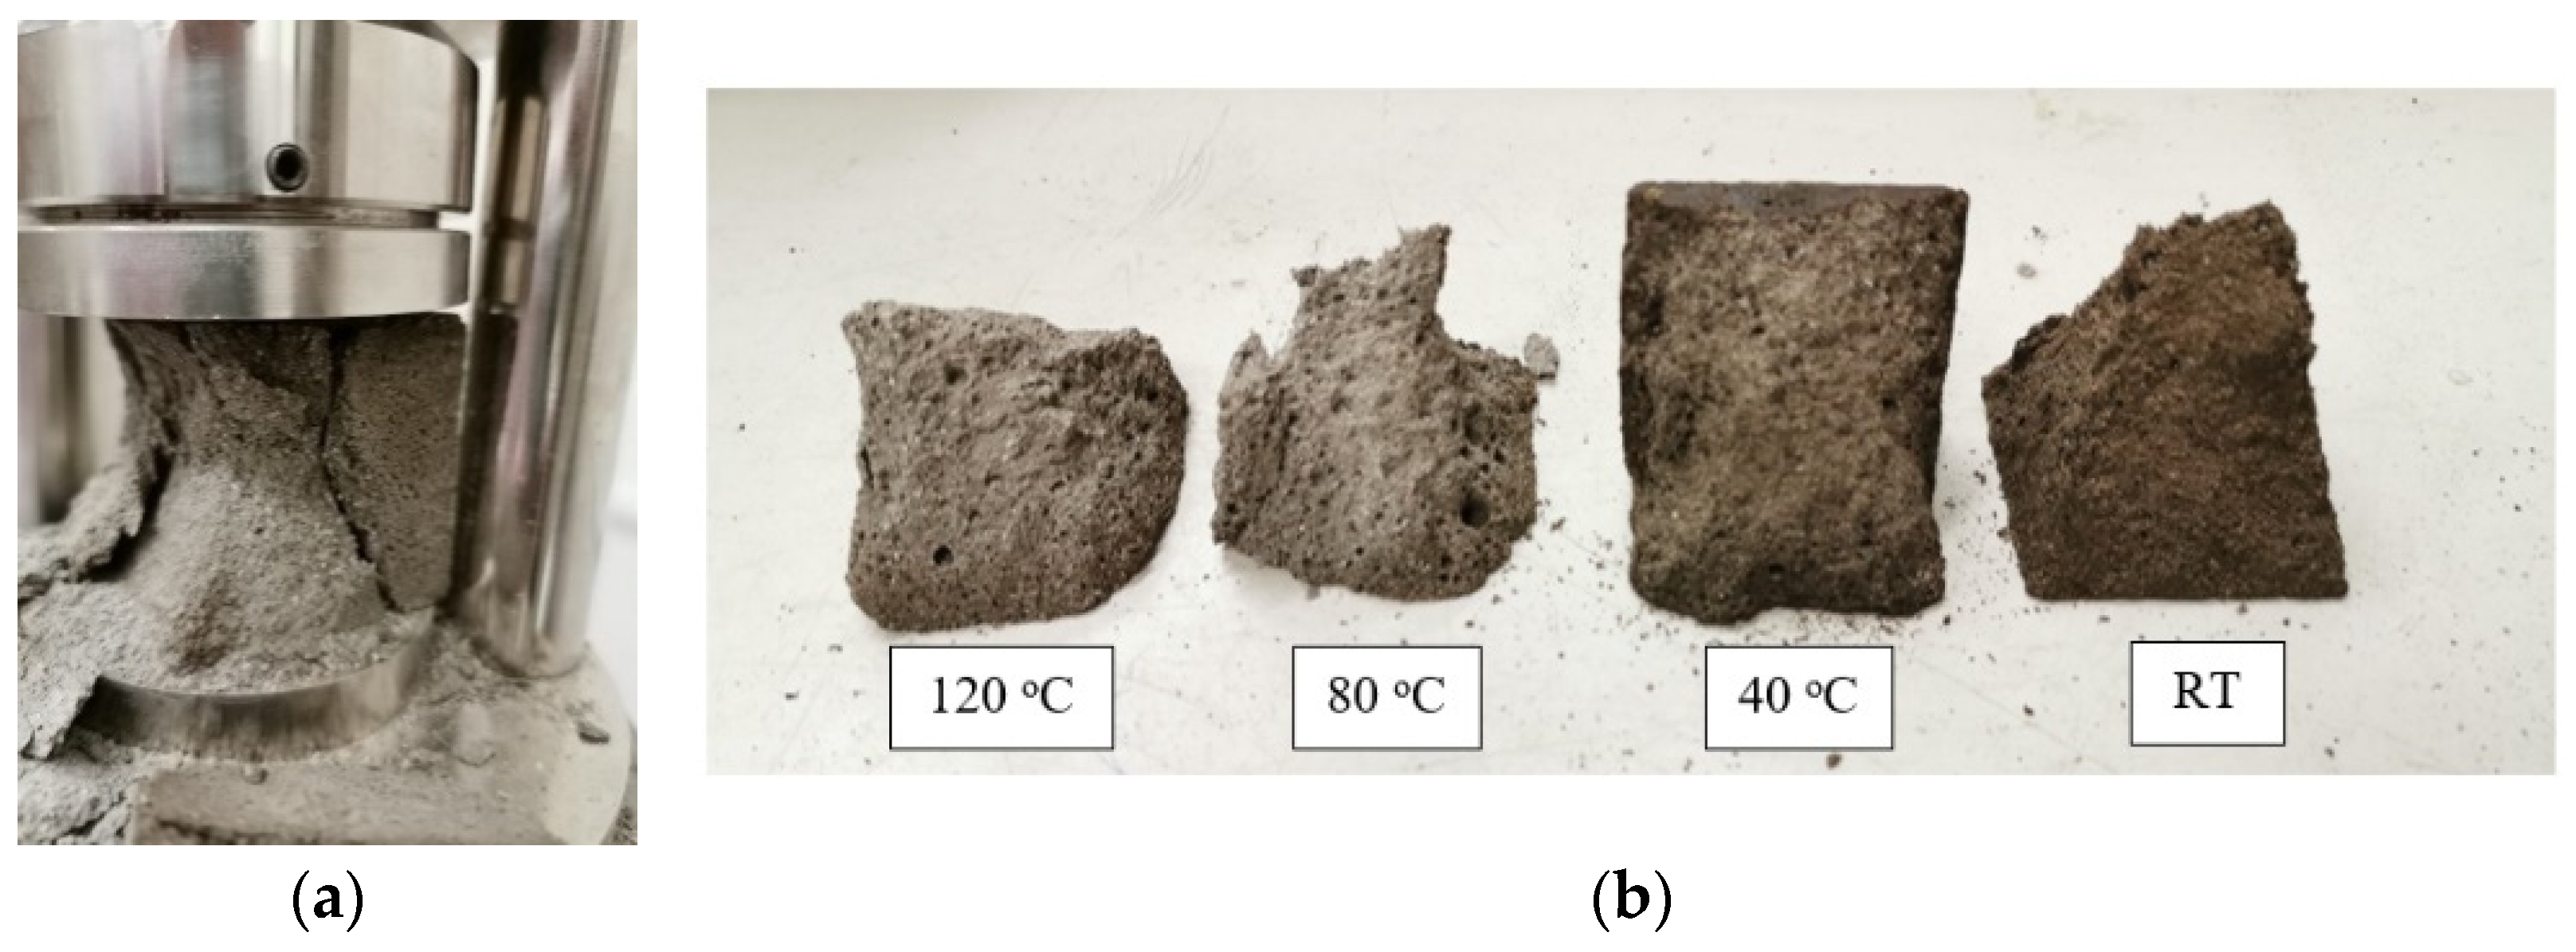
To investigate strength development with age for the geopolymer mortar, the mix design M25 was used to cast the specimens as it attained the highest compressive strength of all mixes previously studied in phase one. The specimens were cured at 80 °C for a duration of 24 h, as these conditions gave the highest compressive strength among all conditions previously studied in phase two of this study. After curing, the specimens were removed from the oven and were left at room temperature for the designated age before testing. For the sake of comparison, a second group of specimens was cured at ambient temperature (25 °C). Compressive strength development over age is shown in Figure 4. After 24 h, the heat and ambient-cured specimens attained about 43.1 MPa and 3.9 MPa, respectively. The big difference in the compressive strength emphasized the importance of heat curing in achieving high early strength value. The low value of early compressive strength of ambient-cured specimens could be attributed to the low content of iron oxide, calcium hydroxide, and reactive silica [11,13]. After 3 days, the heat-cured specimens did not gain any more compressive strength. On the contrary, the compressive strength of the ambient-cured specimens increased by 87%, reaching 7.3 MPa. Similar findings were reported by [11,20]. After 7 days, the compressive strength of both heat and RT-cured specimens increased by 19% and 213%, respectively. At 28 days, the compressive strength of heat and ambient-cured specimens reached 55 MPa (28% enhancement) and 20 MPa (413% enhancement), respectively. It can be noted that compressive strength development with age was more pronounced in the case of ambient curing as compared to heat curing. The huge development of strength with time for ambient-cured specimens might be attributed to the availability of moisture from the activator solution slowly reacting with the unreacted fly ash particles [13,18]. However, these results highlight the importance of heat curing in the strength development of geopolymer mortar. The heat-cured specimens in one day attained more than twice the compressive strength of the ambient-cured specimens at 28 days.

3.2. Failure Modes

Similar failure modes were observed for all test specimens under compression. During the compression tests, the GPM specimens failed explosively, which indicates a brittle failure. The cracks occurred at 45 degrees for all specimens, with fragments separating from specimens, as shown in Figure 5a. Moreover, it was observed that the color of the GPM samples cured at different temperatures varied, as it appeared to be darker in color for specimens cured at lower temperatures and brighter as the temperature increased, as shown in Figure 5b. This finding could be attributed to the degree of moisture in the GPM samples when subjected to heat curing.

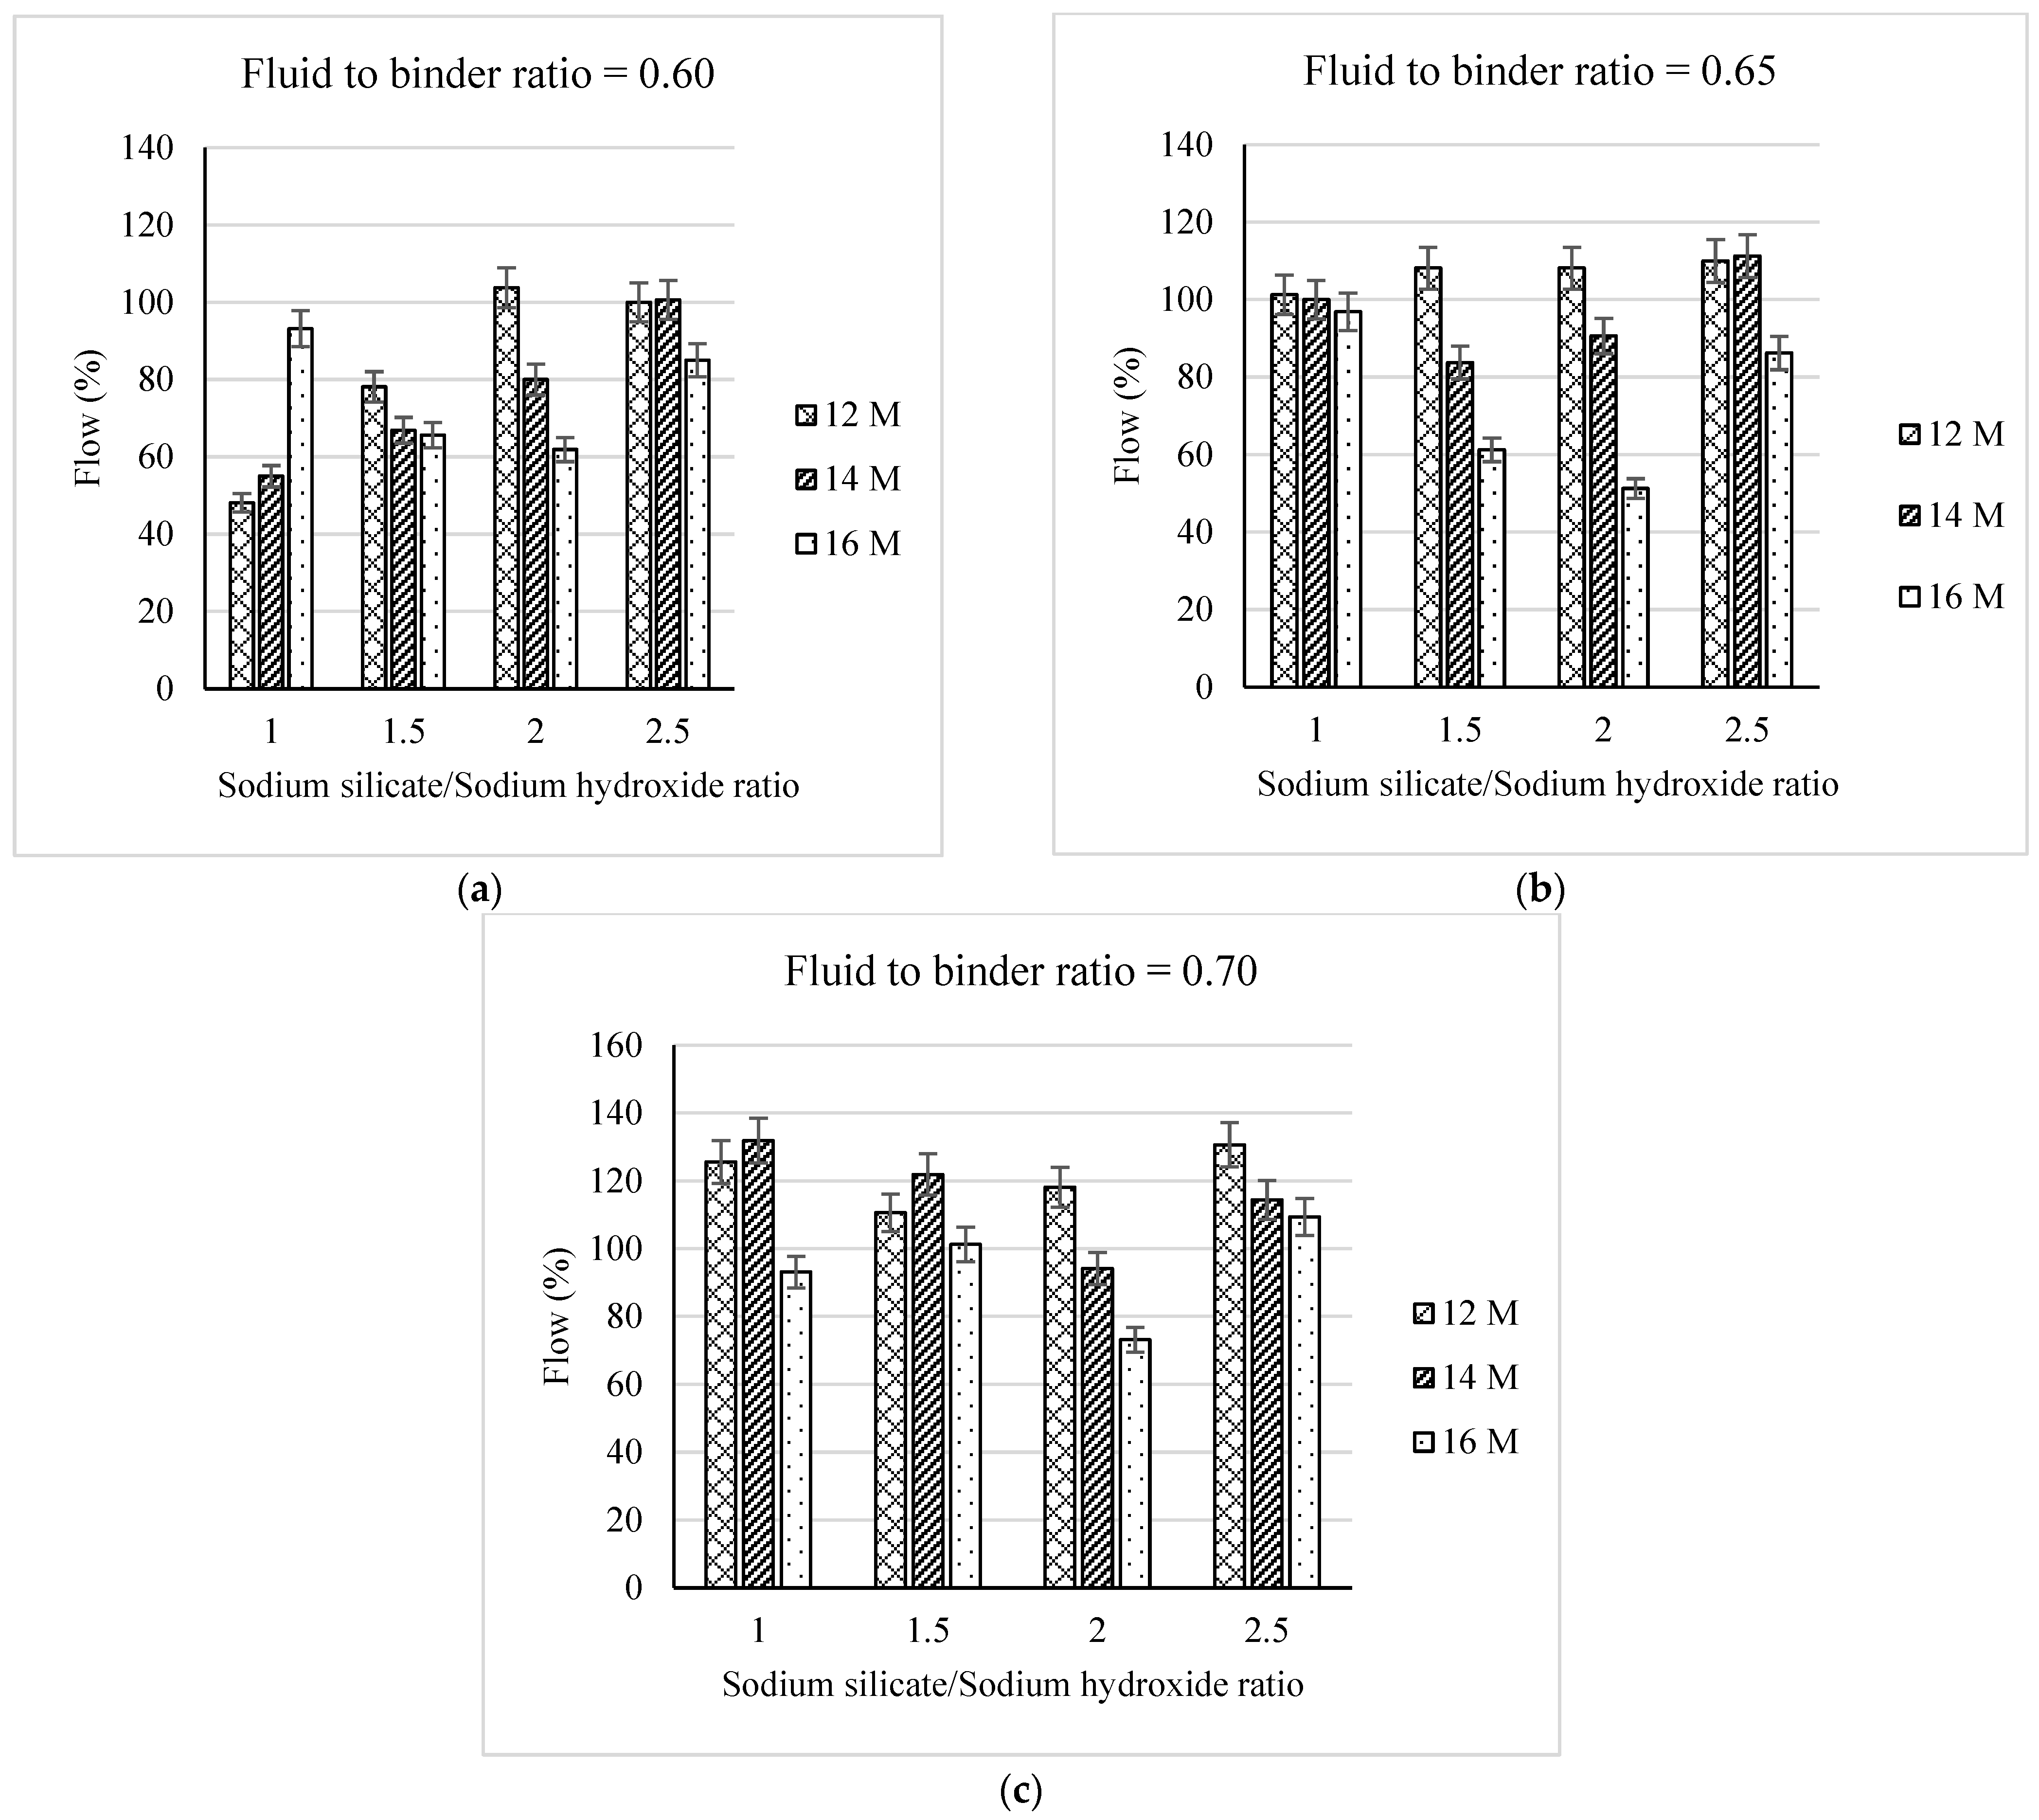
3.3. Flowability of the Geopolymer Mortar

The flowability of the geopolymer mortar was tested using the flow table test according to the ASTM C230. The results are plotted in Figure 6. It is clear from the figure that the flowability of the GPM highly depends on the NaOH solution molarity, the fluid to binder ratio, and the sodium hydroxide to sodium silicate ratio. A wide range of flowability was achieved during the experiments. The minimum flow value (48%) was achieved with the use of mix design M1, whereas the maximum flow value (132%) was attained with the use of mix design M21. Different trends were observed in the flowability of the geopolymer mortar, as shown in Figure 6. The most common trend found was that the lower the molarity of the NaOH solution, the higher the flowability of the mix. This finding could be attributed to the following reasons: when preparing the activator solution by mixing NaOH and Na2SiO3, the gelation process started and the viscosity of the resultant solution increased, which might have caused a reduction in the flow value of the GPM. In Figure 6a and for the sodium silicate to sodium hydroxide ratio of 1, the trend observed was the opposite—the higher the molarity, the higher the flowability of the geopolymer mix. This finding might be attributed to the low amount of solution existing in the mix, which allowed for a faster gelation process to occur [39]. It was also noticed that for the same molarity, the flow of the GPM increased as the ratio of Na2SiO3/NaOH increased. Finally, it was noted that the flow value of the GPM increased with the fluid to binder ratio. This finding could be attributed to the increase in the total amount of the solution available in the mix [11,13].

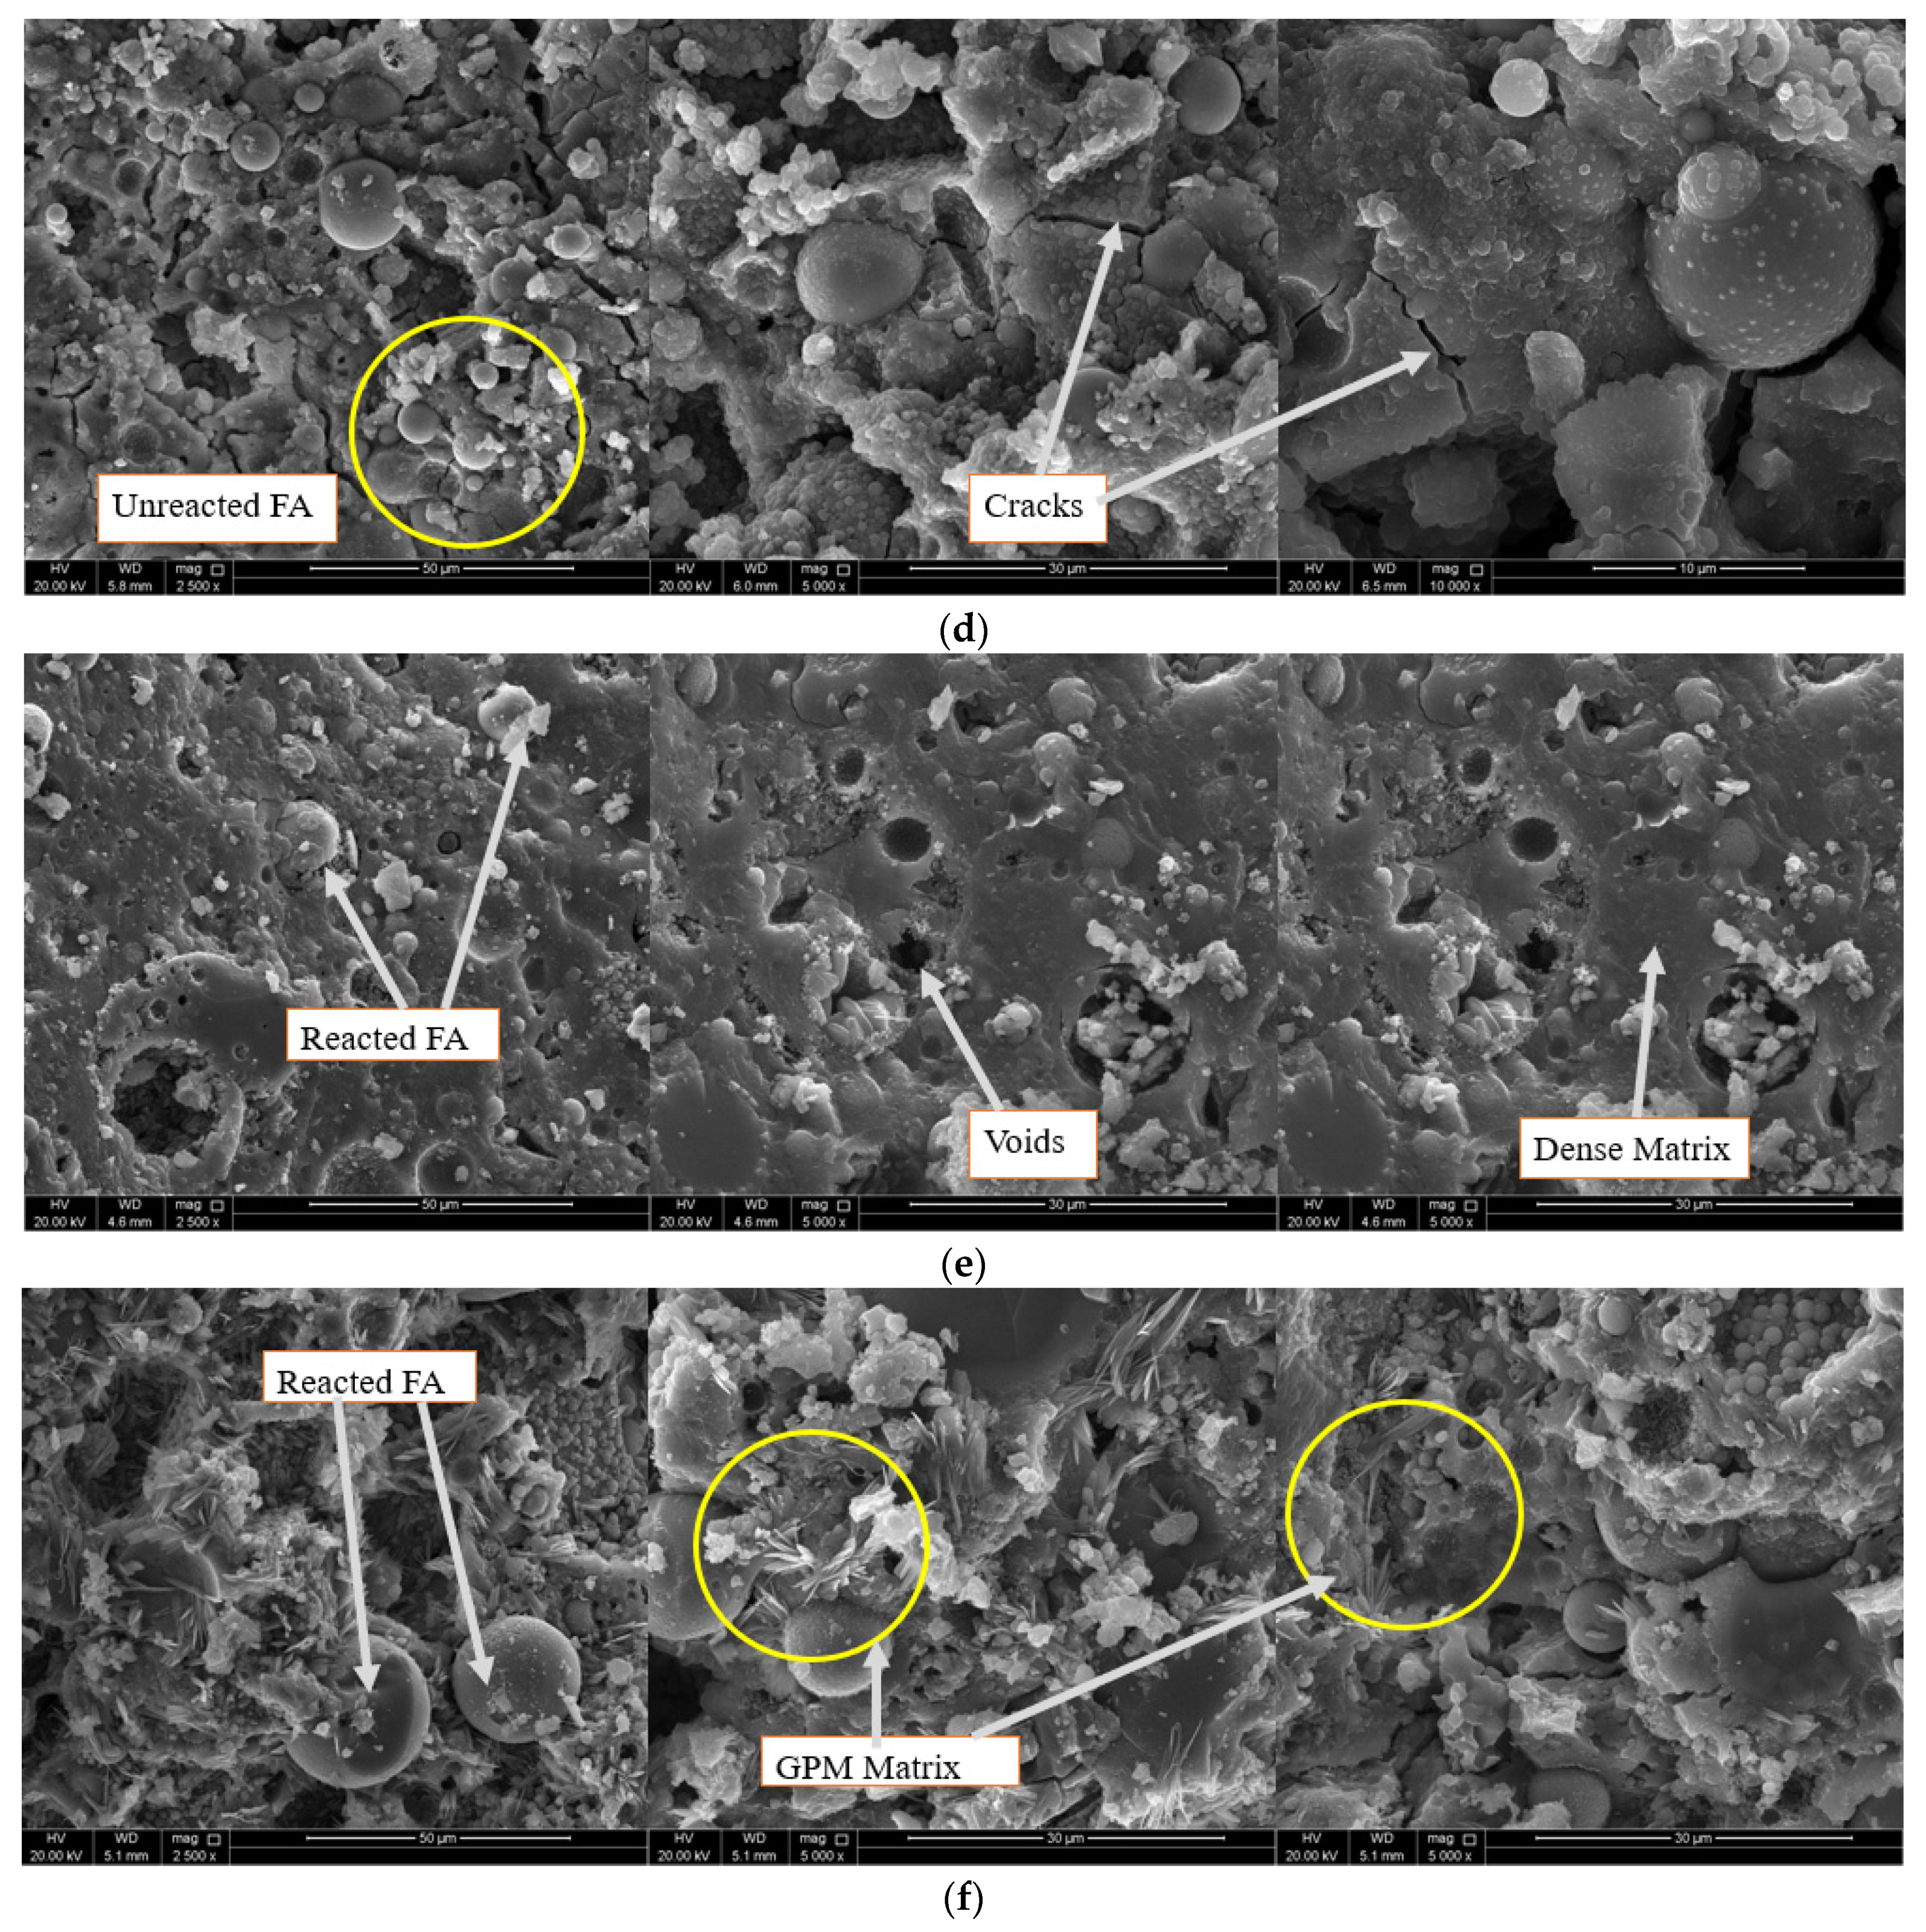
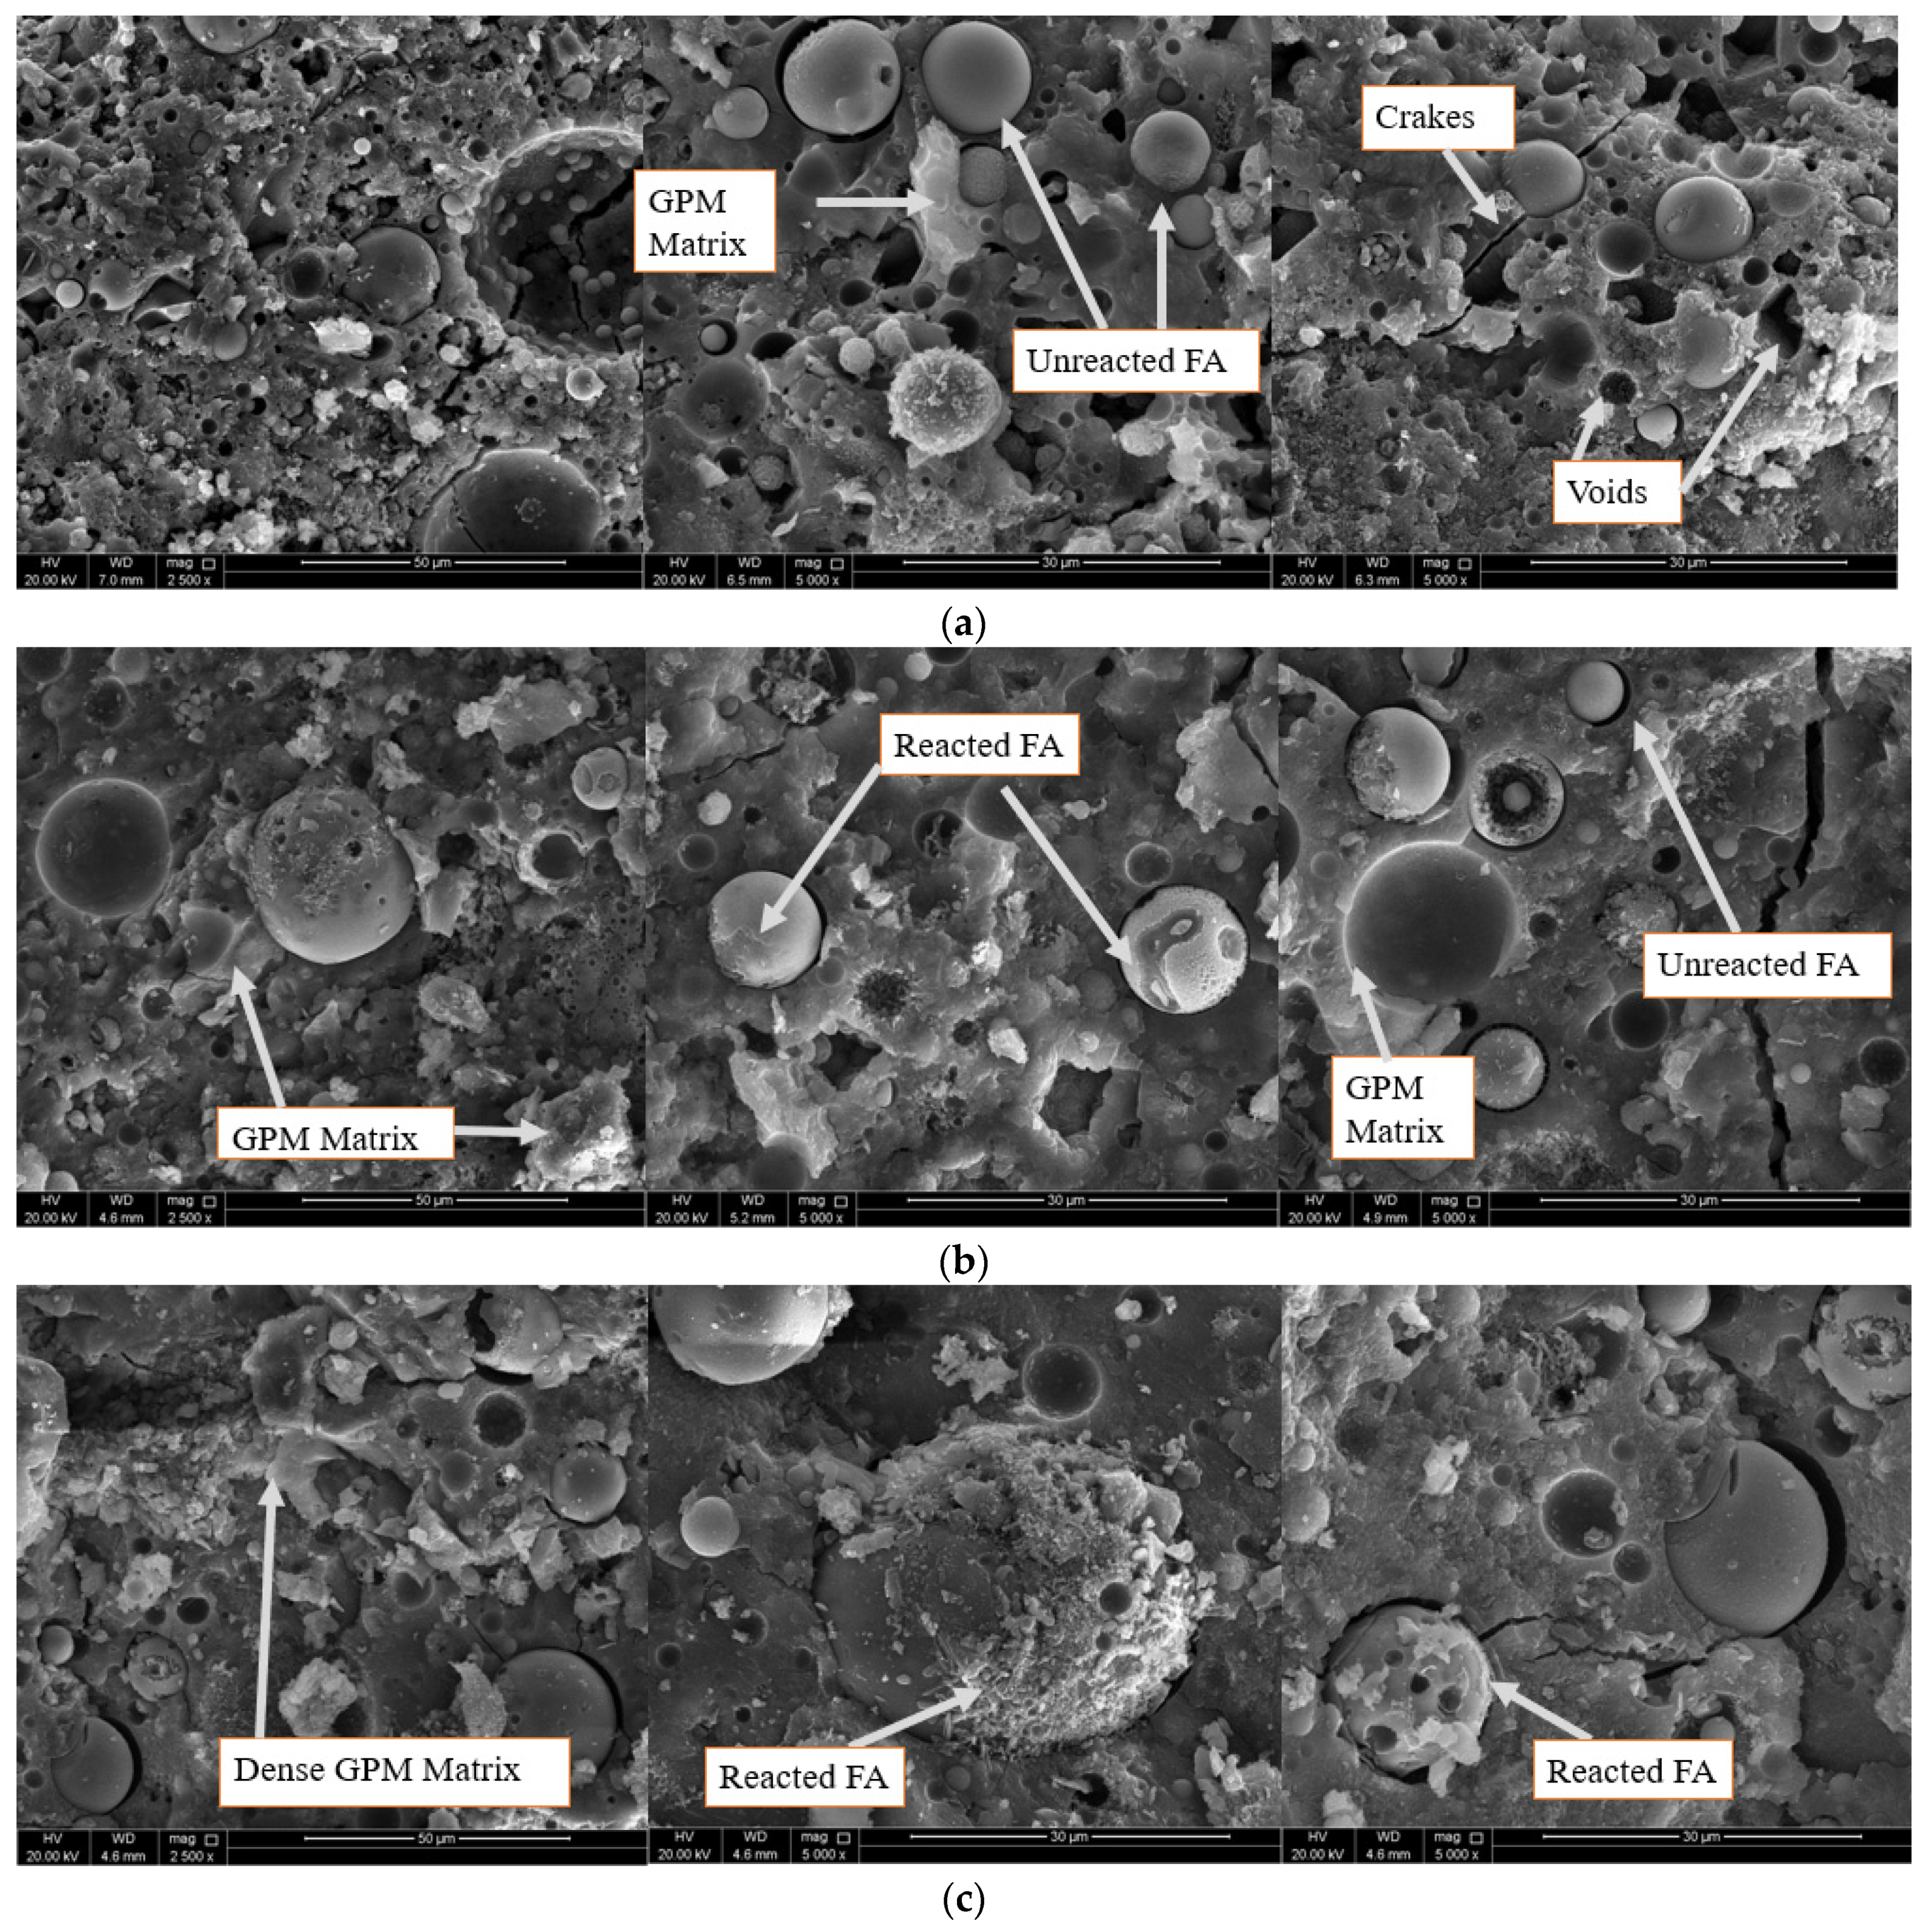
3.4. Microstructure Investigation Using SEM Imaging

Scanning electron microscopic imaging was conducted for selected GPM specimens to visually investigate the development of the geopolymerization products and to study the effect of various parameters on the microstructure of the GPM. Firstly, the effect of the NaOH solution molarity was studied by performing SEM imaging for three specimens prepared with different molarities (M1, M13, and M25). Figure 7a shows the SEM images for the GPM mix design of M1. It reflects the existence of pores in the matrix with reacted and unreacted FA particles, and with amorphous geopolymerization products. The GPM mainly contains structures of the types Q4 (2 Al) and Q4 (3 Al). The microstructure of the geopolymer specimens revealed the formation of a heterogeneous matrix, which consists of a dense, continuous, gel-like substance with micro cracks and micro pores. Similar findings have been reported in the literature [8]. The effect of the molarity of the NaOH solution was clearly observed through the SEM images. The higher the molarity and as the amount of reacted FA particles increased, the better the microstructure of the GPM and the fewer pores in the matrix were observed, as shown in Figure 7b,c. These factors ultimately affected the compressive strength values of the GPM. The effect of curing temperature on the microstructure of the GPM was also investigated through SEM imaging. Three GPM specimens cured at temperatures of 40 °C, 80 °C, and 120 °C for a duration of 48 h were tested. The effect of heat curing with different temperatures can be clearly observed in the SEM images shown in Figure 7d–f. It is clear that as the curing temperature increased, the GPM became denser with fewer cracks and voids. This finding was observed in specimens where the curing temperature was up to 80 °C; any further increase in the curing temperature led to more voids and disintegration in the specimens. Finally, similar observations of the GPM microstructure have been reported by other authors [40,41].

3.5. Life Cycle Assessment Results

LCA results of the comparison between the geopolymer mortar (GPM) and the cement mortar (CM) for the GWP, AP, EP, and ADP fossil are summarized in Figure 8.
For the GPM with the highest compressive strength, the environmental impact on the GWP, AP, EP, and ADP fossil showed lesser emissions when compared to the CM of a similar compressive strength, with 72%, 65%, 41%, and 29%, respectively. The main contributor to the impact categories in the production of the GPM was the production of the alkaline solution, which accounted for 50%, 25%, 20%, and 44%, respectively. Three main processes were analyzed for the LCA results. Initially, the extraction of source materials, which studies the processes needed to extract the source material and prepare it for use in production, e.g., the extraction of fly ash from required processes such as collection and packing. This was followed by a transportation process, where the material was transported to the site where it was going to be used. Gabi software allowed for the capture of the emissions related to each process. This approach was applied to all other materials used in this study, e.g., sand, alkali activators, and cement production. The production process is related to the mixing and preparation of the final mortar, e.g., the mixing and curing of the geopolymer mortar.
The production of the alkaline solution is associated with a high amount of energy consumption [42]. On the contrary, cement mortar production releases much higher emissions to the environment. The four impact categories investigated in this study showed that the main contributor to environmental emission is the production of Portland cement, as the emissions are emitted from the calcination of limestone and the combustion of fossil fuels [43]. The results showed that the production of Portland cement was the main contributor to the environmental emissions and was responsible for 89%, 79%, 63%, and 69% for the GWP, AP, EP, and ADP fossil, respectively. These results reveal that the environmental impact of using GPM instead of CM is significant in reducing emissions related to the construction industry [44,45,46,47,48].
Finally, the results of the LCA emphasized the relevance of using geopolymer mortar instead of cement mortar. A significant impact reduction was demonstrated, which increased the chances for the construction industry to adapt and use such construction materials that achieve excellent mechanical and environmental performance.

4. Conclusions

The following conclusions could be drawn from the experimental study and the LCA of geopolymer mortar production:
  • The strength and flowability of heat-treated geopolymer mortar are highly dependent on alkaline activator solution characteristics such as the NaOH solution molarity, the Na2SiO3/NaOH ratio, and the fluid to binder ratio. Among the studied specimens, the optimum mix design of the fly ash-based geopolymer mortar in terms of compressive strength was achieved for specimens prepared with a NaOH molarity of 16 M, a Na2SiO3/NaOH ratio of one, and a fluid to binder ratio of 0.6.
  • Heat curing is necessary for geopolymer mortar to achieve high early compressive strength. The optimum curing conditions among the studied specimens are heat treatment at 80 °C and for 24 h.
  • The chemical composition of the fly ash used in the production of the geopolymer mortar (e.g., fly ash) is an important factor that affects the mechanical behavior of the geopolymer mortar. The variations in the chemical composition of fly ash leads to unreliable results in the mechanical behavior; thus, this needs to be carefully investigated.
  • Strength development with age is more obvious for ambient-cured specimens than heat-cured specimens. However, the heat-treated geopolymer mortar can gain, in one day, more than twice the compressive strength of the ambient-cured specimens at 28 days.
  • The microstructure of the fly ash-based geopolymer mortar is affected by the molarity of the NaOH solution. The higher the molarity and as the amount of reacted FA particles increased, the better the microstructure became and the fewer pores in the matrix were found.
  • The production of geopolymer mortar is more environmentally friendly than the production of cement mortar. The production of 1.0 m3 of geopolymer mortar generates, for GWP, AP, EP and ADP fossil, emissions 72%, 65%, 41%, and 29% less than the production of 1.0 m3 of cement mortar.

Author Contributions

Conceptualization, M.R. and M.R.I.; Formal analysis, M.R.; Investigation, M.R.; Resources, N.A.-N.; Supervision, M.R.I. and N.A.-N.; Writing—original draft, M.R.; Writing—review & editing, M.R. All authors have read and agreed to the published version of the manuscript.

Funding

This research was funded by the Office of Research and Graduate studies at Qatar University under project no. QUST-1-CAM-2022-334.

Institutional Review Board Statement

Not applicable.

Informed Consent Statement

Not applicable.

Data Availability Statement

The data presented in this study are available on request from the corresponding author.

Acknowledgments

The authors would like to thank SMEET Qatar for providing the fly ash and Qatar Detergent Company for providing the sodium silicate solution. SEM imaging was accomplished in the Central Laboratories unit of Qatar University.

Conflicts of Interest

The authors declare no conflict of interest.

References

  1. Meyer, C. The greening of the concrete industry. Cem. Concr. Compos. 2009, 31, 601–605. [Google Scholar] [CrossRef]
  2. Kajaste, R.; Hurme, M. Cement industry greenhouse gas emissions–management options and abatement cost. J. Clean. Prod. 2016, 112, 4041–4052. [Google Scholar] [CrossRef]
  3. Aïtcin, P.-C. Cements of yesterday and today: Concrete of tomorrow. Cem. Concr. Res. 2000, 30, 1349–1359. [Google Scholar] [CrossRef]
  4. Rattanasak, U.; Chindaprasirt, P. Influence of NaOH solution on the synthesis of fly ash geopolymer. Miner. Eng. 2009, 22, 1073–1078. [Google Scholar] [CrossRef]
  5. Davidovits, J. High-Alkali Cements for 21st Century Concretes. Spec. Publ. 1994, 144, 383–398. [Google Scholar] [CrossRef]
  6. Atis, C.; Görür, E.; Karahan, O.; Bilim, C.; Ilkentapar, S.; Luga, E. Very high strength (120 MPa) class F fly ash geopolymer mortar activated at different NaOH amount, heat curing temperature and heat curing duration. Constr. Build. Mater. 2015, 96, 673–678. [Google Scholar] [CrossRef]
  7. Irshidat, M.R.; Abdel-Jawad, Y.A.; Al-Sughayer, R. Feasibility of producing sustainable geopolymer composites made of locally available natural pozzolan. J. Mater. Cycles Waste Manag. 2018, 20, 1751–1760. [Google Scholar] [CrossRef]
  8. Pereira, D.S.D.T.; da Silva, F.J.; Porto, A.B.R.; Candido, V.S.; da Silva, A.C.R.; Filho, F.D.C.G.; Monteiro, S.N. Comparative analysis between properties and microstructures of geopolymeric concrete and portland concrete. J. Mater. Res. Technol. 2018, 7, 606–611. [Google Scholar] [CrossRef]
  9. Hooton, R.D. Current developments and future needs in standards for cementitious materials. Cem. Concr. Res. 2015, 78, 165–177. [Google Scholar] [CrossRef]
  10. Mermerdaş, K.; Algın, Z.; Ekmen, Ş. Experimental assessment and optimization of mix parameters of fly ash-based lightweight geopolymer mortar with respect to shrinkage and strength. J. Build. Eng. 2020, 31, 101351. [Google Scholar] [CrossRef]
  11. Hadi, M.; Zhang, H.; Parkinson, S. Optimum mix design of geopolymer pastes and concretes cured in ambient condition based on compressive strength, setting time and workability. J. Build. Eng. 2019, 23, 301–313. [Google Scholar] [CrossRef]
  12. Tenepalli, J.S.; Neeraja, D. Properties of class F fly ash based geopolymer mortar produced with alkaline water. J. Build. Eng. 2018, 19, 42–48. [Google Scholar] [CrossRef]
  13. Nath, P.; Sarker, P.K. Effect of GGBFS on setting, workability and early strength properties of fly ash geopolymer concrete cured in ambient condition. Constr. Build. Mater. 2014, 66, 163–171. [Google Scholar] [CrossRef] [Green Version]
  14. Phoo-Ngernkham, T.; Chindaprasirt, P.; Sata, V.; Pangdaeng, S.; Sinsiri, T. Properties of high calcium fly ash geopolymer pastes with Portland cement as an additive. Int. J. Miner. Met. Mater. 2013, 20, 214–220. [Google Scholar] [CrossRef]
  15. Kubba, Z.; Huseien, G.F.; Sam, A.R.M.; Shah, K.W.; Asaad, M.A.; Ismail, M.; Tahir, M.M.; Mirza, J. Impact of curing temperatures and alkaline activators on compressive strength and porosity of ternary blended geopolymer mortars. Case Stud. Constr. Mater. 2018, 9, 00205. [Google Scholar] [CrossRef]
  16. Kantarcı, F.; Türkmen, I.; Ekinci, E. Optimization of production parameters of geopolymer mortar and concrete: A comprehensive experimental study. Constr. Build. Mater. 2019, 228, 116770. [Google Scholar] [CrossRef]
  17. Arnoult, M.; Perronnet, M.; Autef, A.; Rossignol, S. How to control the geopolymer setting time with the alkaline silicate solution. J. Non-Cryst. Solids 2018, 495, 59–66. [Google Scholar] [CrossRef]
  18. Saxena, S.K.; Kumar, M.; Singh, N.B. Influence of alkali solutions on properties of pond fly ash-based geopolymer mortar cured under different conditions. Adv. Cem. Res. 2018, 30, 1–7. [Google Scholar] [CrossRef]
  19. Görhan, G.; Kürklü, G. The influence of the NaOH solution on the properties of the fly ash-based geopolymer mortar cured at different temperatures. Compos. Part B Eng. 2014, 58, 371–377. [Google Scholar] [CrossRef]
  20. Budh, C.D.; Warhade, N.R. Effect of molarity on compressive strength of geopolymer mortar. Int. J. Civil Eng. Res. 2014, 5, 83–86. [Google Scholar]
  21. Madheswaran, C.K.; Gnanasundar, G.; Gopalakrishnan, N. Effect of molarity in geopolymer concrete. Int. J. Civil Struct. Eng. 2013, 4, 106–115. [Google Scholar]
  22. Narayanan, A.; Shanmugasundaram, P. An Experimental Investigation on Flyash-based Geopolymer Mortar under different curing regime for Thermal Analysis. Energy Build. 2017, 138, 539–545. [Google Scholar] [CrossRef]
  23. Mo, B.-H.; Zhu, H.; Cui, X.-M.; He, Y.; Gong, S.-Y. Effect of curing temperature on geopolymerization of metakaolin-based geopolymers. Appl. Clay Sci. 2014, 99, 144–148. [Google Scholar] [CrossRef]
  24. De Rossi, A.; Simão, L.; Ribeiro, M.J.; Hotza, D.; Moreira, R.D.F.P.M. Study of cure conditions effect on the properties of wood biomass fly ash geopolymers. J. Mater. Res. Technol. 2020, 9, 7518–7528. [Google Scholar] [CrossRef]
  25. Choi, Y.C.; Park, B. Effects of high-temperature exposure on fractal dimension of fly-ash-based geopolymer composites. J. Mater. Res. Technol. 2020, 9, 7655–7668. [Google Scholar] [CrossRef]
  26. Irshidat, M.R.; Al-Nuaimi, N.; Rabie, M. Sustainable utilization of waste carbon black in alkali-activated mortar production. Case Stud. Constr. Mater. 2021, 15, e00743. [Google Scholar] [CrossRef]
  27. ISO. 14040; Environmental Management–Life Cycle Assessment—Principles and Framework. International Organization for Standardization: Geneva, Switzerland, 2006.
  28. Passuello, A.; Rodríguez, E.D.; Hirt, E.; Longhi, M.; Bernal, S.A.; Provis, J.; Kirchheim, A.P. Evaluation of the potential improvement in the environmental footprint of geopolymers using waste-derived activators. J. Clean. Prod. 2017, 166, 680–689. [Google Scholar] [CrossRef]
  29. Abdulkareem, M.; Havukainen, J.; Horttanainen, M. How environmentally sustainable are fibre reinforced alkali-activated concretes? J. Clean. Prod. 2019, 236, 117601. [Google Scholar] [CrossRef]
  30. ThinkStep. GaBi Solutions. GaBi 2019. Available online: https://gabi.sphera.com/international/index/ (accessed on 2 March 2022).
  31. Knoeri, C.; Sanyé-Mengual, E.; Althaus, H.-J. Comparative LCA of recycled and conventional concrete for structural applications. Int. J. Life Cycle Assess. 2013, 18, 909–918. [Google Scholar] [CrossRef] [Green Version]
  32. Teh, S.H.; Wiedmann, T.; Moore, S. Mixed-unit hybrid life cycle assessment applied to the recycling of construction materials. J. Econ. Struct. 2018, 7, 13. [Google Scholar] [CrossRef] [Green Version]
  33. van den Heede, P.; De Belie, N. Environmental impact and life cycle assessment (LCA) of traditional and ‘green’ concretes: Literature review and theoretical calculations. Cem. Concr. Compos. 2012, 34, 431–442. [Google Scholar] [CrossRef]
  34. Chen, C.; Habert, G.; Bouzidi, Y.; Jullien, A. Environmental impact of cement production: Detail of the different processes and cement plant variability evaluation. J. Clean. Prod. 2010, 18, 478–485. [Google Scholar] [CrossRef]
  35. Chithambaram, S.J.; Kumar, S.; Prasad, M.M.; Adak, D. Effect of parameters on the compressive strength of fly ash based geopolymer concrete. Struct. Concr. 2018, 19, 1202–1209. [Google Scholar] [CrossRef]
  36. Patankar, S.V.; Jamkar, S.S.; Ghugal, Y.M. Effect of water-to-geopolymer binder ratio on the production of fly ash based geopolymer concrete effect of water-to-geopolymer binder ratio on the production of fly ash based geopolymer concrete. Int. J. Adv. Technol. Civil Eng. 2013, 2, 79–83. [Google Scholar] [CrossRef]
  37. Nematollahi, B.; Sanjayan, J. Effect of different superplasticizers and activator combinations on workability and strength of fly ash based geopolymer. Mater. Des. 2014, 57, 667–672. [Google Scholar] [CrossRef]
  38. Ilkentapar, S.; Atis, C.; Karahan, O.; Avşaroğlu, E.G. Influence of duration of heat curing and extra rest period after heat curing on the strength and transport characteristic of alkali activated class F fly ash geopolymer mortar. Constr. Build. Mater. 2017, 151, 363–369. [Google Scholar] [CrossRef]
  39. Abdullah, A.; Hussin, K.; Abdullah, M.; Yahya, Z.; Sochacki, W.; Razak, R.; Błoch, K.; Fansuri, H. The Effects of Various Concentrations of NaOH on the Inter-Particle Gelation of a Fly Ash Geopolymer Aggregate. Materials 2021, 14, 1111. [Google Scholar] [CrossRef]
  40. Zejak, R.; Nikolić, I.; Blecić, D.; Radmilović, V.; Radmilović, V.R. Mechanical and microstructural properties of the fly-ash-based geopolymer paste and mortar. Mater. Tehnol. 2013, 47, 535–540. [Google Scholar]
  41. Ng, C.; Alengaram, U.J.; Wong, L.S.; Mo, K.H.; Jumaat, M.Z.; Ramesh, S. A review on microstructural study and compressive strength of geopolymer mortar, paste and concrete. Constr. Build. Mater. 2018, 186, 550–576. [Google Scholar] [CrossRef]
  42. Fawer, M.; Concannon, M.; Rieber, W. Life cycle inventories for the production of sodium silicates. Int. J. Life Cycle Assess. 1999, 4, 207–212. [Google Scholar] [CrossRef] [Green Version]
  43. Huntzinger, D.N.; Eatmon, T. A life-cycle assessment of Portland cement manufacturing: Comparing the traditional process with alternative technologies. J. Clean. Prod. 2009, 17, 668–675. [Google Scholar] [CrossRef]
  44. Habert, G.; d’Espinose de Lacaillerie, J.B.; Roussel, N. An environmental evaluation of geopolymer based concrete production: Reviewing current research trends. J. Clean. Prod. 2011, 19, 1229–1238. [Google Scholar] [CrossRef]
  45. Bajpai, R.; Choudhary, K.; Srivastava, A.; Sangwan, K.S.; Singh, M. Environmental impact assessment of fly ash and silica fume based geopolymer concrete. J. Clean. Prod. 2020, 254, 120147. [Google Scholar] [CrossRef]
  46. Al Bakri, M.M.; Mohammed, H.; Kamarudin, H.; Niza, I.K.; Zarina, Y. Review on fly ash-based geopolymer concrete without Portland Cement. J. Eng. Technol. Res. 2011, 3, 1–4. [Google Scholar]
  47. McLellan, B.C.; Williams, R.; Lay, J.; van Riessen, A.; Corder, G.D. Costs and carbon emissions for geopolymer pastes in comparison to ordinary portland cement. J. Clean. Prod. 2011, 19, 1080–1090. [Google Scholar] [CrossRef] [Green Version]
  48. Zerfu, K.; Ekaputri, J.J. Review on Alkali-Activated Fly Ash Based Geopolymer Concrete. Mater. Sci. Forum 2016, 841, 162–169. [Google Scholar] [CrossRef]
Figure 1. Particle size distribution of the fly ash.
Sustainability 14 04942 g001
Figure 2. Effect of activator solutions on the compressive strength of the geopolymer mortar prepared with different fluid/binder ratios (a) 0.6, (b) 0.65, (c) 0.7.
Sustainability 14 04942 g002
Figure 3. Effect of curing conditions on the compressive strength of the geopolymer mortar.
Sustainability 14 04942 g003
Figure 4. Compressive strength development of the GPM mortar with age.
Sustainability 14 04942 g004
Figure 5. (a) Representative failure mode and (b) color change of the GPM specimens cured at different temperatures.
Sustainability 14 04942 g005
Figure 6. Effect of activator solutions on the flowability of the geopolymer mortar prepared with different fluid/binder ratios (a) 0.6, (b) 0.65, (c) 0.7.
Sustainability 14 04942 g006
Figure 7. SEM images of the GPM specimens casted with (a) M1, (b) M13, and (c) M25 and cured at 80 °C for 24 h, and casted with M25 and cured for 48 h at (d) 40 °C, (e) 80 °C, and (f) 120 °C.
Sustainability 14 04942 g007aSustainability 14 04942 g007b
Figure 8. LCA results for the geopolymer mortar and the cement mortar. (a) Overall emissions, (b) Emissions based on processes.
Sustainability 14 04942 g008
Table 1. Chemical composition of the fly ash used in this study.
OxideSiO2Al2O3CaOFe2O3MgOSO3K2ONa2OClLOI
%49.917.111.87.834.90.420.27720.14280.0113.5
Table 2. Studied parameters.
Phases Molarity Fluid/Binder RatioNa2SiO3/NaOHCuring
Temperature (°C)
Curing
Period (h)
Age (Days)
Phase One120.60180241
140.651.5
160.702
2.5
Phase Two160.60125 (ambient)241
4048
8072
120
Phase Three160.60180241
3
7
28
Table 3. GPM mix designs.
Mix Design IDNaOH Concentration (M)F/B Na2SiO3 /NaOHFly Ash (kg/m3)Sand (kg/m3)NaOH Solution (kg/m3)Na2SiO3 Solution (kg/m3)
M1120.617111956213213
M21.57111956171256
M327111956142284
M42.57111956122305
M50.6517111956231231
M61.57111956185277
M727111956154308
M82.57111956132330
M90.717111956249249
M101.57111956199299
M1127111956166332
M122.57111956142356
M13140.617111956213213
M141.57111956171256
M1527111956142284
M162.57111956122305
M170.6517111956231231
M181.57111956185277
M1927111956154308
M202.57111956132330
M210.717111956249249
M221.57111956199299
M2327111956166332
M242.57111956142356
M25160.617111956213213
M261.57111956171256
M2727111956142284
M282.57111956122305
M290.6517111956231231
M301.57111956185277
M3127111956154308
M322.57111956132330
M330.717111956249249
M341.57111956199299
M3527111956166332
M362.57111956142356
Table 4. Source of unit processes.
Type of DataSource
Fly AshGaBi database 2020, Fly Ash
CementGaBi database 2020 RER: Portland cement (CEM I ELCD/CEMBUREAU)
SandGaBi database 2020 (Sand 0/2 ts)
Sodium hydroxideGaBi database 2020, (EU-28, sodium hydroxide, 100% caustic soda)
Sodium silicateGaBi database 2020, (sodium silicate, waterglass)
WaterGaBi database 2020, Water (desalinated; deionized)
ElectricityGaBi database 2020, EU-28: Electricity grid mix ts
Transportation GaBi database 2020 Truck, Euro 3, up to 7.5 t gross weight/2.7 t payload capacity
DieselGaBi database 2020, EU-28: Diesel mix at refinery ts
Table 5. Mechanical and fresh properties of GPM.
Mix DesignCompressive Strength (MPa)Flow
Davg. (cm)
Flow (%)
M133.4214.8148.13
M247.3717.8178.13
M351.2320.38103.75
M451.1920.00100.00
M548.5320.13101.25
M650.5320.81108.13
M749.0920.81108.13
M848.6621.00110.00
M947.1522.56125.63
M1049.8721.06110.63
M1143.1721.81118.13
M1240.8523.06130.63
M1354.2815.5055.00
M1459.7016.6966.88
M1558.4918.0080.00
M1655.7420.06100.63
M1745.1320.00100.00
M1852.4318.3883.75
M1961.5819.0690.63
M2052.8721.13111.25
M2138.0623.19131.88
M2252.6422.19121.88
M2352.9819.4294.17
M2452.4021.44114.38
M2563.8619.3193.13
M2662.3816.5665.63
M2761.8316.1961.88
M2862.8918.5085.00
M2948.4219.6996.88
M3048.5316.1361.25
M3153.8515.1351.25
M3256.1218.6386.25
M3341.4619.3193.13
M3439.3020.13101.25
M3536.7717.3173.13
M3649.5920.94109.38
M25(D1T1)19.8319.3193.13
M25(D1T2)43.1319.3193.13
M25(D1T3)37.2119.3193.13
M25(D2T1)18.1719.3193.13
M25(D2T2)39.8019.3193.13
M25(D2T3)36.1019.3193.13
M25(D3T1)24.3719.3193.13
M25(D3T2)29.9819.3193.13
M25(D3T3)29.2419.3193.13
M25(RT-1 day)3.9319.3193.13
M25(RT-3 days)7.2619.3193.13
M25(RT-7 days)12.2019.3193.13
M25(RT-28 days)20.0019.3193.13
M25 (Heat-1 day)43.1319.3193.13
M25 (Heat-3 days)42.1119.3193.13
M25 (Heat-7 days) 51.0819.3193.13
M25 (Heat-28 days)55.0019.3193.13
Publisher’s Note: MDPI stays neutral with regard to jurisdictional claims in published maps and institutional affiliations.

