Article

Investigation on Current and Prospective Energy Transition Scenarios in Indian Landscape Using Integrated SWOT-MCDA Methodology

by
Venkatraman Indrajayanthan
1,*,
Nalin Kant Mohanty
1,
Rajvikram Madurai Elavarasan
2 and
Lucian Mihet-Popa
3,*
1
Department of Electrical and Electronics Engineering, Sri Venkateswara College of Engineering, Chennai 602117, India
2
Department of Electrical and Electronics Engineering, Thiagarajar College of Engineering, Madurai 625015, India
3
Faculty of Electrical Engineering, Ostfold University College, NO-1757 Halden, Norway
*
Authors to whom correspondence should be addressed.
Sustainability 2022, 14(9), 4940; https://doi.org/10.3390/su14094940
Submission received: 17 February 2022 / Revised: 15 April 2022 / Accepted: 18 April 2022 / Published: 20 April 2022

Abstract

:
India has ambitious goals to increase renewable energy penetration, and significant progress has been made since 2017. However, the Indian energy mix is highly dominated by fossil fuels. To set India on the pathway of the energy transition, a comprehensive analysis of the complex factors influencing the Indian energy sector is required. This study is put forward to delineate the current energy transition scenario in India and to direct the energy sector towards a prospective scenario for accomplishing a smooth energy transition. A hybrid quantitative-qualitative SWOT-integrated MCDA methodology is employed to accomplish the objective of this study. An extensive literature review is performed to understand and sort the various factors under each SWOT category. Fuzzy AHP methodology is utilized to convert the qualitative significance of each SWOT factor into quantitative scores, through which the crucial influencing factor in the current energy transition scenario is obtained. The top three highest-influence factors include utilizing the cost-competitiveness of solar and wind energy technologies over fossil fuels, the inadequacy of manpower having specialized skillsets, and connecting households to electricity and electrifying the transportation sector. The recommendation strategies are framed and presented for prospective energy transition scenarios. These strategies are assessed against the SWOT factors by using the PROMETHEE II methodology. The assessment results highlight that developing robust regulatory and policy frameworks, increasing the contribution of local energy resources, and promoting the distributed generation and grid infrastructure development are the highest-scoring strategies that have a synergic effect on multiple dimensions of energy transition, including political, financial, and techno-economic aspects. The proposed study will be conducive to framing effective policy in the upcoming years to assist the energy transition in India.

1. Introduction

India’s annual greenhouse gas emissions are the third-highest in the globe as of 2020, and a majority of its emissions are contributed by the energy sector [1]. Given the population, urbanization, and developmental factors in India, it is more likely that energy use, as well as electricity consumption, will increase, despite the measures in energy efficiency. India is one of the crucial countries in the world where rapid efforts need to be concentrated to curb emissions. Therefore, energy transition in India is the desideratum. Research to facilitate energy transition in India can initiate by assessing renewable energy potential [2]. For instance, review studies assessing the drivers of renewables, the current situation, the barriers, and the future initiatives in the state of India will be conducive to perceiving a holistic overview of the energy transition scenario [3,4]. Meanwhile, another study highlighted the progress of renewable energy technologies in various countries [5]. However, research regarding the current energy sector in India and their potential to witness energy transition, as well as to sort out the challenges through valid recommendations, is lacking.
The proposed study aims to provide a comprehensive investigation of the current energy transition scenario in India, as well as to recommend state-of-the-art strategies to achieve energy transition in the prospective scenario. Only when a holistic assessment is performed, effective recommendations be framed, and a comprehensive investigation requires accurate mapping of the scenario, which can be accomplished by using qualitative tools. The SWOT tool prevails as the most robust and simple qualitative tool; it provides an extensive assessment of the strengths, weaknesses, opportunities, and threats for the given objective, and has been utilized in applications such as hybrid energy networks [6], clean energy development [7], comparing the renewable and sustainable energy sectors [8], energy poverty [9], and many others. The key point to utilizing SWOT analysis is its realistic, fact-based, and data-driven approach. Meanwhile, the prospective energy transition scenario is built by propounded strategies, which are, in turn, developed by using SWOT factors. The strategies can aid in supporting strengths, strengthening weaknesses, utilizing opportunities, and averting threats. However, concerning the implementation aspects, the prioritization of one strategy relative to other strategies is the desideratum. Therefore, these strategies are evaluated for their significance in the energy transition by assessing their importance against each SWOT factor. This gives rise to multi-dimensional problems, and the methodology to deal with numerous factors and options requires a robust framework. Thus, a multi-criteria decision analysis (MCDA) framework is adopted since it produces an aggregated result by managing the multitude of perspectives, conflicting criteria, and ambiguity among the influencing factors and decision makers [10,11]. Another key reason for incorporating the MCDA framework is its ability to construct an evidence-based analysis by covering the aspects of economic, social, technological, environmental, and other perspectives through qualitative as well as quantitative attributes [12]. In addition, MCDA can integrate the synergic and trade-off effect induced on the final objective by the influencing factors.
The MCDA framework is employed in several studies, and some of the applications in the energy sector include sustainable energy consumption [13], jet fuels [14], sustainability assessment of the energy sector [15,16], waste-to-energy management strategies [17], energy storage systems [18], energy planning [19], location selection for solar energy plants [20], renewable energy potential assessment [21], second-generation biofuels [22,23], and many others. There are numerous MCDA frameworks and methods to attain an aggregated ranking. Some of the commonly used methods include the analytic hierarchy process (AHP) [24], best–worst Method (BWM) [25], VlseKriterijumska Optimizacija I Kompromisno Resenje (VIKOR) [26], preference ranking organization method for enrichment evaluation (PROMETHEE)—I and II [27], elimination and choice translating reality (ELECTRE) [28], technique for order preference by similarity to ideal solution (TOPSIS) [29], multi-objective optimization on the basis of ratio analysis (MOORA) [30], and decision making trial and evaluation laboratory (DEMATEL) [31]. Further, fuzzified methodologies such as fuzzy AHP [32], and fuzzy TOPIS [33,34] are also utilized in many studies. Among various MCDA methodologies, the authors utilized the PROMETHEE methodology since it is based on an outranking framework which can potentially yield a comprehensive comparison between various strategies. The utilization of the PROMETHEE methodology can be extended to evaluate numerous factors and alternatives with reliable results when compared to other methods. The authors also employed the fuzzy AHP methodology for finding the relative significance of the SWOT factors. Fuzzy AHP is used since it has the potential to accurately map the importance of SWOT factors in line with the requirements that are to be changed in the current scenario to transform it into a better prospective scenario.
The novelty of the proposed work relies on the integration of qualitative and quantitative attributes of the current energy transition scenario via a hybrid SWOT-Fuzzy AHP methodology. Further, the novelty is extended by utilizing the outcome of the current scenario to evaluate the strategies proposed for the prospective Indian energy transition scenario which, altogether, forms a SWOT and twin MCDA framework. This research study is structured as follows: Section 2 presents the literature review and the contributions of this study. Section 3 details the methodology employed in this study. Section 4 investigates the SWOT factors, which are assessed through the fuzzy AHP method for their relative significance. Section 5 presents the recommended strategies for prospective energy transition scenarios in India, which are assessed using the PROMETHEE methodology. The conclusions are presented in Section 6.

2. Literature Review

Fragkos et al. explored national low-carbon scenarios in Australia, Brazil, Canada, China, EU-28, India, Indonesia, Japan, the Republic of Korea, Russia, and the USA [35]. An integrated assessment model has been utilized for providing a cumulative insight into the energy systems, emissions, and economic implications of low-carbon pathways in these countries by investigating factors such as energy, transport, and land systems. The study suggests that a reallocation of investments toward low-carbon technologies is pivotal to witnessing a pronounced transformation in the energy sector without causing significant affordability issues. Fossil fuel taxes can enable the low-cost pathway for clean energy resources and aid in research and development [36]. Roy and Schaffartzik demonstrated the paradox of Indian energy transition, which is attributed to a higher usage of coal while making rhetorical progress in renewables [37]. The findings are indicative of the complex multi-dimensional factors influencing the coal preference, giving coal a dominant role to play and hindering the energy transition. Sharma et al. analyzed the major stalling force for rapid decarbonization in India with a case study oriented to the eastern state of Odisha [38]. The study identifies the complexity of coal usage with local and regional economies, social institutions, and political and industrial factors that prevail as a significant bottleneck to India’s decarbonization plans.
Moya et al. investigated agent-based scenarios for long-term energy transition via fuel-switching investments in India’s industry sector [39]. An integrated assessment approach is utilized to evaluate the decision-driving factors such as capital costs, net present value, operating cost, and a combination of capital and operating costs. The results highlight that high capital expenditure prevails as a significant hindrance to decarbonization in the industrial sector, which should be addressed through effective policy mechanisms. Maji and Kandlikar quantify India’s household energy transition in the context of air quality, climate, and equity [40]. Changes in lifestyles, economic growth, and urbanization are some of the influencing factors fueling the energy transition from traditional fuels to liquified petroleum gas (LPG). The results of the study highlight that the current initiatives in India will not be beneficial for low-income rural households by 2030, and the study suggests that a complete transition to LPG and electricity by 2030 can potentially bring down PM 2.5 exposure below the WHO guidelines throughout urban and rural landscapes. Harrington et al. analyzed the variation in rural household energy transitions from the perspective of basic lighting in India [41]. The results emphasized that microgrid-connected households contain fewer appliances when compared to grid-connected ones. The adoption of new technology in households is most commonly related to factors including awareness, access, and pricing, whereas the retention of the existing sources is often influenced by end-uses, access to repair services, and quality. Studies assessing the public willingness to utilize various energy technologies are crucial in drafting appropriate policy measures [42]. A study by Pandey and Sharma highlighted that public participation is vital to accomplishing energy transition, and the study presented three cases of renewable energy transition projects to perceive the role of the interplay of knowledge politics, vulnerability, and recognition-based energy justice [43].
Shidore and Busby investigated the reason behind India’s strong embrace of solar based on the interviews and key observations, and have sorted nine possible drivers as the reason apart from the techno-economic factors [44]. Further, the study highlights four chiefly dominating drivers for high solar energy preference, which include global pressure and partnerships, domestic politics, attracting investments, and energy sovereignty. Yadav et al. propounded a revised framework to support solar home systems for accomplishing rural energy transformations, especially for those below the low-income level [45]. This is accomplished by incorporating an electronic subsidy disbursement mechanism which can ameliorate the efficiency and effectiveness of solar home systems capital subsidy schemes. Gulagi et al. analyzed a 100% renewable energy penetration scenario in India with energy storage technologies such as batteries, pumped hydro storage, thermal energy storage, compressed air energy storage, and power-to-gas technology [46]. The results indicate that 100% renewable energy penetration is achievable in 2050 with a levelized cost of energy (LCOE) of 52 €/MWh in a country-wide scenario [46,47]. Further, the energy storage technologies serve a key role in providing flexibility to the energy system, and about 42% of the total electricity demand is satisfied with battery energy storage technologies. The solar PV and battery energy storage systems emerge to be the low-cost system in India. Jain et al. performed a dynamic analysis for terawatt-scale renewable energy systems in India to estimate the energy storage requirements [48]. The analysis is carried out for a 30-year period, from 2019 to 2048. The results indicate that for a solar-dominated energy mix, small seasonal storage is required but larger storage capacity is of utmost importance for bolstering the boost charging to consistently satisfy the demand for long non-sunny hours. On the other hand, for a wind-dominated energy mix, large seasonal storage is required.
Moallemi et al. assessed the energy transition pathways of the Indian electricity sector by policy analysis through a narrative-informed exploratory modelling approach [49]. This approach highlighted that realizing the 100 GW solar electricity target is far-fetched, and further developments towards energy transition is significantly dependent on the active role of the government. Reddy developed a green economy scenario, employing a bottom-up approach, and showed that the introduction of green technologies and improving energy efficiency can yield significant savings in resources by 2030. Furthermore, emphasizing the green energy economy will also create pathways out of poverty with an additional 10 million job opportunities [50]. Deshwal et al. analyzed the impact of the COVID-19 pandemic on the renewable energy scenario in India, exploring the associated challenges, lessons, and emerging opportunities [51]. Specifically, the study investigated the impact of the pandemic on power demand, electricity generation, changes in financial performance, progress in renewable energy penetration, and impacts on the solar industry, projects, and operational projects in India. Further, studies recommend a revamped policy approach for the energy sector in the post-pandemic world [52,53]. A study by Chaturvedi suggests that the power sector has to be elementally reformed for deep decarbonization [54]. Further, alternative economic development efforts should be prioritized in the fossil fuel-dependent states, while strategies such as engagement with citizens and the workforce, low-cost financing, and carbon pricing are crucial to the vision for a net-zero energy system in India. Mottaleb and Rahut provided implications for entrenching sustainable energy in India by assessing clean energy choices and energy consumption patterns by urban households in India [55]. The study highlights that, still, firewood emerges as the primary fuel source for urban households. Nevertheless, wealthy households utilize clean energy fuels. The study also suggests that education- and income-enhancing policy can accelerate the energy transition.
The studies discussed above deal with specific scenario analysis, policy investigation, socio-economic, and techno-economic themes of individual strategies toward energy transition. However, there are relatively few studies that direct the country towards energy transition, and there is no study that points to the significance of certain barriers and strategies unique to the Indian landscape. This study performs an extensive literature study to sort out the SWOT factors and evaluates them via fuzzy AHP methodology to identify the gravity of each factor given the objective of facilitating effective energy transition. Subsequently, the proposed strategies are assessed for their significance by their capability to revitalize the negative SWOT factors and coordinate the positive SWOT factors. Therefore, policymakers can benefit hugely from the direction that this study shows through the SWOT–MCDA framework. The contributions of this study are as follows:
  • Designing a hybrid qualitative–quantitative framework with the tools of SWOT, fuzzy AHP, and PROMETHEE II into a single integrated framework;
  • A comprehensive multidisciplinary investigation is performed and sorts out the unique strengths, weaknesses, opportunities, and threats prevailing in the current energy transition scenario in India;
  • Distinctive recommendation strategies for enhancing the energy transition in India are propounded;
  • Highly significant strategies and SWOT factors are highlighted through the analysis for effective policy planning.

3. Methodology

A hybrid methodology is utilized in this study to investigate the current and prospective energy transition scenarios in India. 
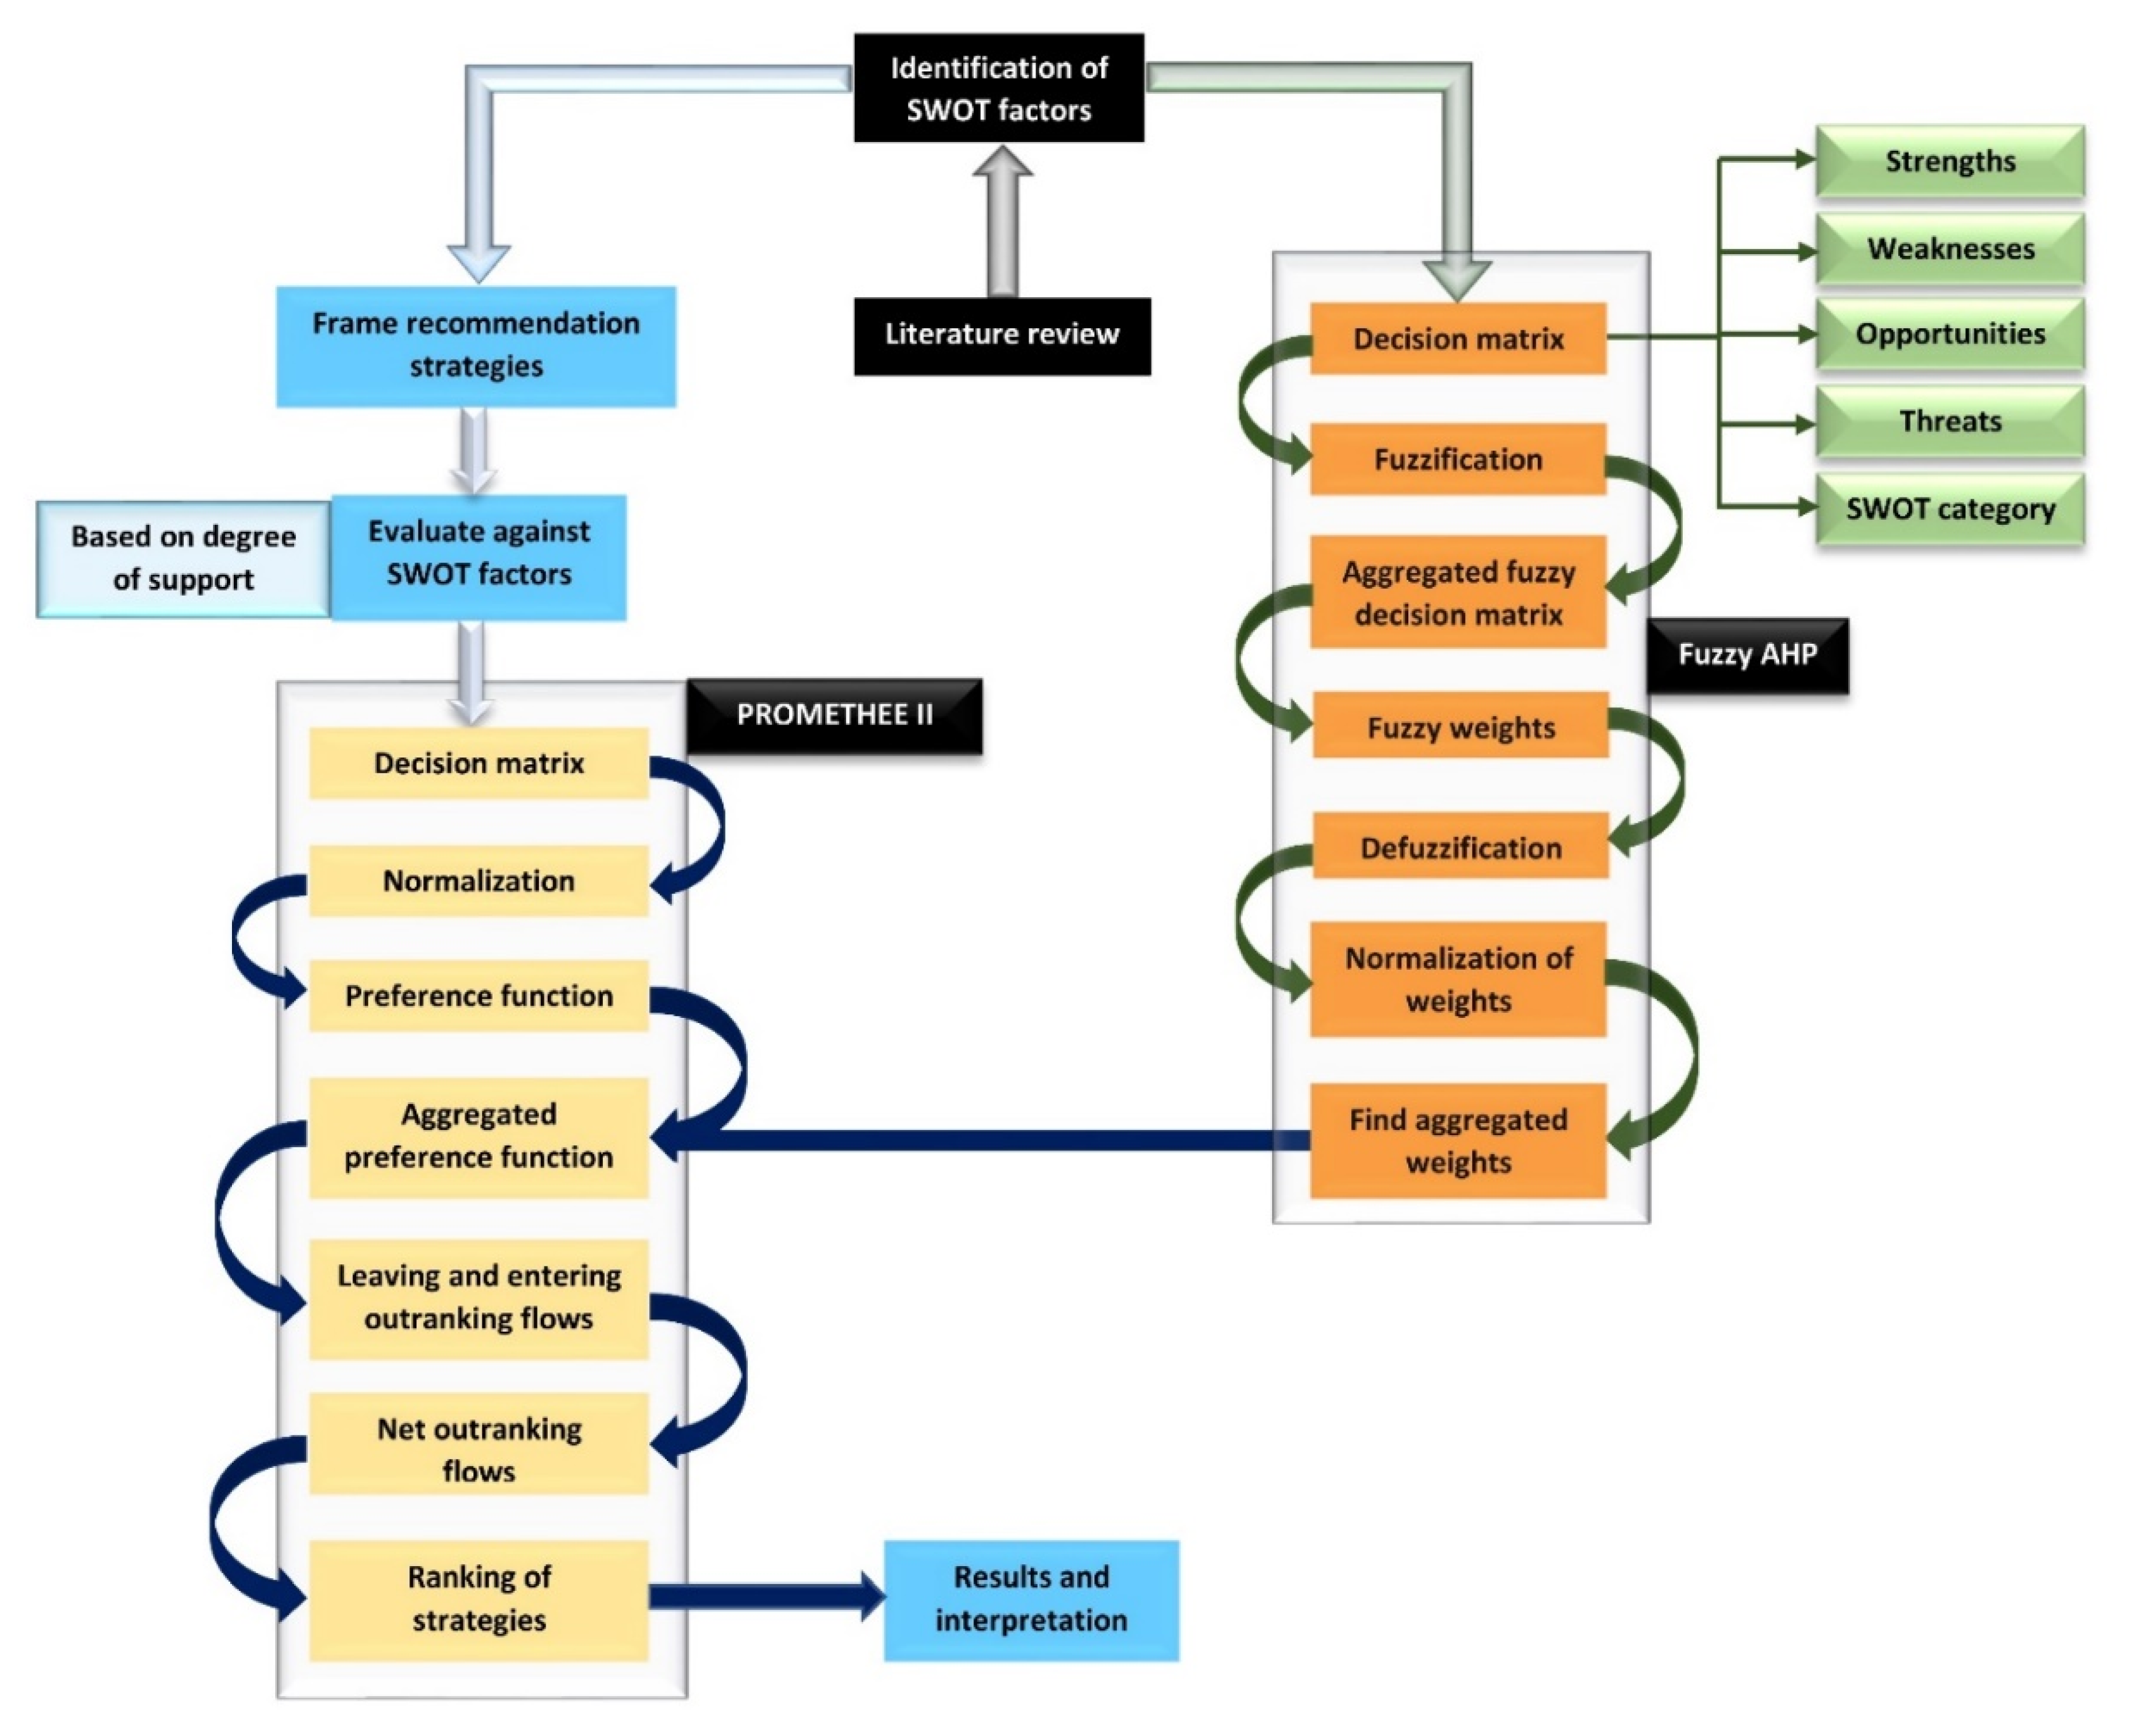
Figure 1 represents the methodology of this study. This methodology can be split into two parts. The first part focuses on energy transition in the current scenario, while the second part of the methodology is used to analyze the best-suited strategy for accelerating the energy transition in the prospective scenario. The former objective is accomplished by using SWOT–fuzzy AHP methodology, whereas the latter objective is attained by utilizing PROMETHEE II multi-criteria decision analysis methodology.

3.1. SWOT–Fuzzy AHP

SWOT analyses are commonly performed to map a present scenario with the tools of strengths, weaknesses, opportunities, and threats. Since SWOT is a qualitative tool, the significance of each SWOT factor is often unknown. Therefore, the authors utilized a hybrid qualitative–quantitative method, which can be obtained by integrating the fuzzy AHP methodology with SWOT analysis. Such hybrid methods have been used in studies dealing with ecotourism strategies [56], the space industry [57], public acceptance of hydrogen stations [58], sustainable energy planning [59], and many others. The various steps involved in SWOT–fuzzy AHP are shown below:
 Step 1:
Identify the SWOT factors
According to the objective of the SWOT, the various factors corresponding to the strengths, weaknesses, opportunities, and threats are to be sorted out. The strengths and weaknesses represent the already-existing abilities and inabilities. Meanwhile, the opportunities and threats represent a feasible pathway to achieve the objective and possible threats in future.
 Step 2:
Create a decision matrix
A pairwise decision matrix corresponding to each SWOT category is constructed. The decision matrix is of size n × n, where n represents the number of factors in a given category (such as strengths). The comparison score in the decision matrix is based on Saaty’s comparison scale [60]. In this decision matrix, the Aji element is always the reciprocal of element Aij. The mathematical representation of the decision matrix is given in Equation (1):
A i j = [ A 11 A 12 A 1 n à 12 1 A 22 A 2 n à n 1 1 à n 2 1 A n n ]
The decision matrix is created for all the factors within each category as well as for the four categories of SWOT.
 Step 3:
Fuzzification
Fuzzification is the process of converting the pairwise comparison matrix into triangular fuzzy numbers (TFN), which represent the corners of the triangle in the format of (a, b, c). The fuzzification process and the constraints are shown in Equation (2):
A i j = ( l i j ,   m i j ,   u i j )   and   Ã i j 1 = ( l i j ,   m i j ,   u i j ) 1 = ( 1 u i j , 1 m i j , 1 l i j ) ,   such   that   l i j < m i j < u i j
 Step 4:
Evaluate aggregated fuzzy decision matrix
The aggregation is accomplished by taking the geometric mean of each TFN corresponding to each element. This is represented in Equation (3):
r i = ( l i , m i , u i ) = i = 1 n A i j n
 Step 5:
Determination of fuzzy weights
The fuzzy weights are determined by obtaining the ratio of ri to the summation of all the ri elements. The mathematical representation is shown in Equation (4):
w i = r i i = 1 n r i = r i × ( i = 1 n r i ) 1
where wi is the fuzzy weight of the criterion i.
 Step 6:
Defuzzification of fuzzy weights
The obtained fuzzy weights are subjected to defuzzification by finding the center of the weight, as represented in Equation (5):
Centre of weight ( M i ) = l Ŵ i m Ŵ i u Ŵ i 3
where Mi is the weightage corresponding to the ith factor.
 Step 7:
Normalization of weights
The weights obtained after defuzzification might not be always equal to one. Therefore, normalization is accomplished to adjust the weights such that the summation of weights equals one. The normalization formula is shown in Equation (6):
N i = ( M i n = 1 N M i )
where Ni is the normalized weight corresponding to the ith factor.
 Step 8:
Find aggregated weights
After finding the fuzzy AHP weightage for factors corresponding to each SWOT criterion, the fuzzy AHP is again performed to find the weightage among the criteria such as strengths, weaknesses, opportunities, and threats. The weights obtained for individual factors are treated as local weights and the weights obtained for the SWOT categories are termed global weights. The aggregated weight is obtained for an individual factor by multiplying its local weight with the corresponding global weight.

3.2. PROMETHEE II

PROMETHEE II is based on an outranking method where the alternatives are compared with one another to obtain a cumulative ranking [61]. PROMETHEE II is utilized in this study due to its robust methodology to effectively rank the alternatives. The various applications in which PROMETHEE II are employed include suitability analyses of onshore wind farms [27], the selection of airport locations [62], ranking websites to support renewable energy market opportunities [63], and many others. In this study, the recommended strategies to accelerate the energy transition in India are evaluated and ranked with the PROMETHEE II methodology. This is accomplished to understand the impact of each strategy since the evaluation criteria are the various identified SWOT factors. The procedure of the PROMETHEE II method is illustrated as follows:
 Step 1:
Frame the decision matrix
The proposed strategies to accelerate the energy transition in India serve as alternatives and the SWOT factors prevail as the evaluation criteria. The decision matrix is an m × n matrix, where m and n are the number of strategies and the number of evaluation criteria, respectively. The strategies are evaluated against each SWOT factor using a simple score-conversion process based on Table 1. This process enables measurements of the performance of the strategies by converting the qualitative performance into a quantitative value. Nevertheless, the approach for allocating the performance score, as shown in Table 1, is based on the following approach. When a strategy is evaluated against a strength factor, the evaluation should be based on how the strength factor supports the strategy. The evaluation must be based on how the proposed strategy improves the weakness factor when the strategy is evaluated against a weakness factor. Meanwhile, the evaluation should be based on how a strategy favors in grabbing the opportunity and how it helps to avert the threat factors when a strategy is evaluated against an opportunity and threat factor, respectively.
 Step 2:
Normalization of decision matrix
The decision matrix is normalized based on the min–max normalization method. Depending on the nature of the relationship between the criteria and the objective, the criteria can be classified as beneficial or non-beneficial criteria. Beneficial criteria are the criteria in which a higher value is preferred, while the criteria in which a lower value is preferred are termed as non-beneficial criteria. Therefore, the normalization formula differs for both beneficial and non-beneficial criteria. The normalization formula for beneficial and non-beneficial criteria is represented in Equations (7) and (8), respectively.
For beneficial criteria:
N i j = | x i j min i ( x i j ) | | max i ( x i j ) min i ( x i j ) |
For non-beneficial criteria:
N i j = | max i ( x i j ) x i j | | max i ( x i j ) min i ( x i j ) |
where Nij is the element of the normalized decision matrix, m a x i ( x i j ) is the maximum value in the given criterion i, m i n i ( x i j ) is the minimum value in the given criterion i, and xij is the element of the decision matrix. In this study, the SWOT factors are utilized as criteria where the weaknesses and threats can be treated rationally as non-beneficial criteria. However, in this case, the recommended strategies act as an alternative and the strategies are always put forward to strengthen the strengths, revitalize the weaknesses, utilize the opportunities, and avert the threats. Therefore, all the strategies’ performance scores in the decision matrix indicate the beneficial characteristics between the criteria (SWOT factors) and the objective (to accelerate the energy transition). Hence, all the criteria are treated as beneficial criteria.
 Step 3:
Enumerate preference function
For a given criterion, the difference in scores between two alternatives is enumerated. In this step, the difference between each strategy’s score with respect to other strategies’ scores is obtained. The preference function is calculated based on Equation (9). The preference function is the difference between the considered alternative’s score for the given criterion when it is positive; otherwise, it is replaced with a value of 0.
P j ( a , b ) = { 0 ,                                     N a j N b j < 0 N a j N b j ,     N a j N b j 0  
where Pj(a,b) is the preference function between two alternatives, ‘a’ and ‘b’, Naj is the normalized score of alternative ‘a’ for criteria j and Nbj is the normalized score of alternative ‘b’ for criteria j.
 Step 4:
Determine aggregated preference function
The aggregated preference function is obtained by finding the ratio of the multiplication of the weightage corresponding to each criterion with the preference function score of each alternative to the summation of all the criteria weightage. This is mathematically represented in Equation (10). As the weightage is determined by using the fuzzy AHP method, the sum of the criteria weightage equals one.
π ( a , b ) = j = 1 m W j   P j ( a , b ) j = 1 m W j
where π (a, b) is the aggregated preference function and Wj is the weightage of the criteria j.
 Step 5:
Calculate leaving and entering outranking flows
The leaving outranking flow of an alternative “a” is determined by using Equation (11). The leaving outranking flow indicates the average performance dominance exerted by a given alternative over other alternatives for the given set of evaluation criteria. Therefore, a higher value is preferred for leaving the outranking flow:
ϕ + ( a ) = 1 n 1 b = 1 n π ( a , b ) ,     a b
where ϕ+ is the leaving outranking flow of a strategy, and n is the number of alternatives.
The entering outranking flow of an alternative “a” is determined by using Equation (12). The entering outranking flow indicates the average performance subjugation experienced by a given alternative over other alternatives for the given set of evaluation criteria. Thus, a lower value is preferred for entering outranking flow:
ϕ ( a ) = 1 n 1 b = 1 n π ( b , a ) ,     a b
where ϕ represents the entering outranking flow of a strategy.
 Step 6:
Determine the net outranking flow
The net outranking flow can be enumerated by finding the difference between the leaving outranking flow and the entering outranking flow for a given strategy. The mathematical expression for the same is illustrated in Equation (13):
ϕ ( a ) = ϕ + ( a ) ϕ ( a )
 Step 7:
Ranking of alternatives
The alternatives are ranked based on the net outranking flow score. The higher the net outranking flow score of a strategy, the higher its ability to accelerate the energy transition, or the higher is its rank.
Altogether, with SWOT–fuzzy AHP and PROMETHEE-II methodology, the current scenario is assessed and the recommended strategies are evaluated against multi-dimensional SWOT factors to effectively direct the energy transition scenario. The identification of various SWOT factors and strategies to accelerate energy transition is elaborated in the upcoming sections.

4. Current Energy Transition Scenario in India—SWOT–Fuzzy AHP Analysis

The current energy transition scenario is interpreted using the SWOT qualitative assessment tool in the first part of this section, while the importance of each identified SWOT factor is determined by using fuzzy AHP analysis and is presented in the second part of this section.

4.1. SWOT Factors

The strengths, weaknesses, opportunities, and threats in the current energy transition scenario in India are elucidated in this section. All the discussed SWOT factors are presented in Table 2.

4.1.1. Strengths

 S1:
High solar and wind energy potential as well as increasing preference
The prime strength that India stands on to pursue energy transition is its abundant solar and wind energy potential. About 5000 trillion kWh of solar energy is incident over India’s land area per annum, and most of the land area receives about 4 to 7 kWh per sq. m per day [64]. On the other hand, the cumulative wind energy potential at 100 m elevation is 302.25 GW, and its potential reaches 695.5 GW at 120 m above the ground level [65]. In recent years, the preference for solar and wind energy projects has increased substantially. The country achieved the fifth global position in deploying solar power with an installed capacity surpassing 30 GW, while it achieved fourth global position in wind power deployment with a total installed capacity of 39.25 GW [64,65]. In addition, the solar power capacity has increased by more than 11 times in the past five years [64].
 S2:
Slowdown in the investments and dependency on thermal power plants
In a report by Praxis Global Alliance, the analysis highlighted that India’s ambitious progress towards renewable energy deployment reduces its dependency on the thermal sector or coal. The dependency on the thermal sector is predicted to be reduced to ~50% and ~43% by the financial years 2022 and 2027, respectively [66]. Due to the revamping policies in India, a long-term power purchasing agreement in the thermal sector is less likely, while renewables are more likely to obtain a long-term power purchasing agreement [67,68]. Further, due to the current financial health of financial institutions in India, existing private players in the thermal sector experience difficulties in raising money [66].
 S3:
Renewable energy sector remains coupled to economic growth
The renewable energy sector in India is playing an increasingly significant role in the economic growth of India. Eren et al. performed an empirical analysis on the impact of renewable energy consumption on the financial development and economic growth in India [69]. The results highlight that renewable energy consumption is bidirectionally correlated with economic growth, while financial development drives the long-term development of renewable energy and economic growth. Therefore, the energy transition in India would support economic growth, which is a significant strength considering the country’s energy demand with expanding urbanization, industrialization, and population growth.
 S4:
Energy sector is favorable to attracting foreign and private investments
The Indian energy sector would witness a surge in energy consumption in the upcoming years due to the influence of energy-intensive industries, the growing service sector, and urbanization and population factors [70]. Thus, there exist plentiful opportunities for attracting investors, especially foreign and private investors. A study highlights that a 1% increase in foreign direct investments (FDIs) yields a 0.013% reduction in energy consumption in India [71]. By galvanizing the FDI in the renewable energy sector and establishing incentive schemes for the investors, sustainable economic and macroeconomic development can be favored [71].
 S5:
One nationalized grid and diverse energy mix
In India, the power transmission grid is divided into five regional grids, namely, the northern, eastern, western, north-eastern, and southern regions. The interlinking of regional grids with asynchronous HVDC enabled a limited power exchange across the regional grids, initiating the development of the national grid [72]. The subsequent development of synchronous inter-regional links gives rise to a single nationalized grid [72]. The objective of the single nationalized grid is to supply power from natural resource-rich regions to the load-centric natural resource-scarce regions [73,74]. This highly enhances the penetration of renewable energy since these resources are scattered and concentrated in some regions.
The energy mix of India is shown in Figure 2. About 45% of the energy mix is dominated by coal, and oil accounts for 25%. Altogether, fossil fuels’ contribution to the energy mix of India is 76%, while renewables contribute about 23%. Among the renewables, the majority of the contribution is from bioenergy resources, while hydropower, wind, and solar contribute less than 2% each. This diverse characteristic can be conducive to energy transition as well as entrench energy security.

4.1.2. Weaknesses

 W1:
Large amounts of energy imports
The Indian energy mix is dominated by fossil fuels such as coal, oil, and gas. The coal reserves are abundant in India, but these are depleting, and the domestic production of coal is witnessing a declining trend. The import dependence on coal constituted about 34% during the 2019–2020 period, and it has since experienced an upward trend. Similar to coal, the domestic production of crude oil is also declining, but the importation of crude oil is much higher than coal [76]. In 2019, India produced 32.2 million tons while it consumed 214.12 million tons of crude petroleum, marking an 85% dependency on imports [76]. Further, in monetary terms, oil imports contributed around 18% of the total imports in India in the fiscal year 2018–2019 [77]. On the other hand, 50% of India’s natural gas is imported [76]. The prime issue with the large importation of energy is energy security since a sudden disruption of supply from exporting counties can cause interruptions to the satisfaction of the energy demand of the country [78,79].
 W2:
Inflexibility of current grid infrastructure
The term inflexibility refers to the incapability of the grid to maintain balance between the supply and demand during uncertain scenarios, leading to a decrease in grid efficiency and resiliency. The current grid infrastructure in India is less likely to support increased renewable energy penetration due to its intermittent characteristics. The power transmission from the region where the power generation is higher to regions of lower power availability in real time requires sophisticated smart equipment for monitoring, planning, and controlling the energy distribution to minimize the curtailment [80]. Further, the hour-to-hour variations in solar and wind power production are predicted to triple over the next decade, and wider fluctuations in the peak demand can also be expected [81]. Thus, the inflexibility of the grid to accommodate and respond to the changes in power generation and demand is a major hindrance to energy transition, despite having one nationalized grid.
 W3:
Politically compromised and poor financial position of the power sector
The financial position of the power sector is worse, especially the DISCOMs. The energy rates have not increased due to the political pressures which compromise the financial performance of the power sector [82]. The perennial losses that power distribution companies experience stress the further development and investments in the generation, the grid, and the consumer billing infrastructure [83]. Even after significant reform efforts, the financial situation is getting worse. On the other hand, approximately more than one-fifth of the power distributed to the consumers is lost because of an inefficient grid infrastructure, or is never billed because of power theft and other factors [83]. Massive losses in the power sector cumulatively affect the public finances, which ultimately impacts economic growth.
 W4:
Lack of long-term vision and focus on short-term fixation
The state government usually focuses on short-term problem-solving strategies, such as ensuring temporary energy security, rather than focusing on the long-term benefiting vision of energy sustainability. This short-term focus has long-favored investment in the thermal sector, and the subsidies for coal and other fossil fuels are still higher than for alternative fuels. For instance, oil and gas subsidies were up by over 65% from the fiscal year 2017 to 2019 and coal subsidies remained unchanged, while the subsidies for renewable energy witnessed a 35% decline in the same period [84].
 W5:
Lack of optimized utilization of existing-generation capacity and large demand–supply gap
The optimized utilization of the existing generation capacity will offer numerous advantages and aid in minimizing the dependency on fossil fuels. For instance, if the state of Karnataka faces an energy deficit and plans to invest in expanding its energy generation capacity through an additional coal-based power plant, then the state’s dependency on fossil fuels will increase further. On the other hand, if the neighboring state of Tamil Nadu produces more energy through wind energy at the same time that Karnataka faces an energy deficit, then transmitting the power from Tamil Nadu to Karnataka will reduce the dependency on fossil fuels, create profit for wind farm owners, and strengthen regional coordination. Such benefits can be retrieved from the optimized utilization of existing generation capacity. The main issue that prevents such utilization is grid inflexibility, political influence, and disparate energy policy. In addition, the demand–supply gap prevails as a major concern for India, who has more demand than supply; this is especially experienced in the north-eastern and western regions [80].

4.1.3. Opportunities

 O1:
Connecting households to electricity and electrifying the transportation sector
In 2020, about 96.7% of Indian households are connected to the grid; 0.33% of the households rely on off-grid electricity and the unelectrified households contribute around 2.4% [85]. Energy poverty remains a major problem for unelectrified households. On the other hand, an average Indian household receives 20.6 h of electricity per day [85]. Therefore, improving energy access quality should be the key focus of the government of India. Electrification can introduce people into the country’s economy, but more importantly, it can reduce the dependency on polluting fuels as well as the energy intensity. This is because unelectrified households depend on fossil fuels or bioresources to satisfy their energy demands, and the equipment used for energy conversion is mostly inefficient. The transportation sector is the most difficult sector to decarbonize in India since it is almost completely dependent on fossil fuels. Therefore, electrifying the transportation sector will slowly decouple the fossil fuel dependency, provided that the renewable energy contribution in the electricity mix increases with time.
 O2:
Upgrading transmission infrastructure development
The major impeding factor for the energy transition in India would be the transmission infrastructure. In the current scenario, the grid infrastructure might support the renewable energy contribution, but as the renewable energy penetration increases, the grid would fail to maintain its efficiency and resiliency in providing uninterrupted power. Therefore, strategies and policy measures should be concentrated to upgrade the transmission infrastructure in terms of increasing its response, efficiency, inclusiveness, and robustness. Further, it will be conducive to the penetration of electric vehicles [86]. An incremental approach to upgrading towards a smart grid is recommended, and a study argues that social, financial, and political interventions underpin the transmission infrastructural development [87].
 O3:
Utilizing the cost-competitive advantage of solar and wind energy over fossil fuels
In 2019, the LCOE of fossil fuels ranges from USD 0.050 to USD 0.177 per kWh, while the average LCOE of solar photovoltaic and onshore wind energy is USD 0.068 per kWh and USD 0.053 per kWh, respectively [88]. Years of research and development for solar and wind energy have improved the affordability of solar and wind energy technologies, which are even cost-competitive with fossil fuel technologies. If these technologies are widely utilized on a large scale throughout the country, the LCOE trend can witness a further decrease without considering the subsidies. The financial debt of the Indian power sector can be minimized with investments in solar and wind energy technologies.
 O4:
Developing a transparent and proper regulatory framework
A transparent and proper regulatory framework is required to monitor the energy sector in all aspects. This can potentially minimize the risks experienced by the generation, transmission, and distribution companies. Power theft, debt, and political pressure, which are some of the key factors affecting the Indian energy sector, should be tackled by the regulatory framework. For example, DISCOMs are in long-term debt due to their outdated and untransparent billing system, as well as an obsolete distribution infrastructure, which has caused excessive power losses and power theft [89]. On the other hand, even if the auctioned power price is low, it is barely felt at the consumer end. Therefore, the regulatory framework should be entrenched to improve the financial performance of the distribution sector and the affordability of energy at the consumer end.
 O5:
Improve energy efficiency in terms of supply, transmission, and demand
Improving energy efficiency needs a comprehensive strategy from the energy generation to the consumer side [90,91]. Despite the existence of national codes and state regulations for energy efficiency enhancement, these measures are not firmly followed at a local level due to ineffective enforcement, a lack of elaborate technical methodology, and poor regulation structures [92]. Another study by Sahoo et al. highlights that the energy efficiency targets set for the power sector of India are much less than the actual energy saving capacity of the thermal power sector [93]. Further, the study finds substantial inefficiencies in the energy consumption systems as well as in managerial dexterity. The thermal power sector alone is expected to generate additional 4.7 million Energy Saving Certificates if the sector realizes its full energy-saving potential [93]. The energy efficiency improvement throughout the energy sector, from production to the consumer end, can cumulatively increase the electricity tariff—however, the consumer will experience a reduced energy consumption [94].

4.1.4. Threats

 T1:
Coordinating with the variability of the renewable energy sources
The variability of the renewable energy sources introduces volatility to the electricity price [95]. The variability can be either a lesser-supply-than-demand or a higher-supply-than-demand scenario. In the former scenario, the usage of dispatchable generators, usually powered by fossil fuels, in response to demand can be utilized. Further, the usage of energy storage technologies such as pumped hydropower and battery energy storage can be supportive [96,97]. Energy trade beyond the borders of a region can also be utilized to tackle the variability of intermittent energy resources. If the supply is higher than the demand, then it can be fed to charge the energy storage elements and utilized for other purposes, such as hydrogen production, heating fuels, and many others. In addition, the energy can be also traded to the neighboring grid. To make such solutions feasible, grid flexibility and upgrades to quickly respond to the intermittency are pivotal [98]. Therefore, coordinating all the energy resources, energy storage technologies, grid responses, and energy trades is a crucial step toward energy sustainability. Without such coordination, energy transition ceases to exist.
 T2:
Hike in electricity prices and losses in power sector companies
Investments in upgrades to the infrastructure as well as replacements for the existing thermal power plants might increase the electricity prices to assure quality and carbon-free energy. However, if such an increase in electricity prices is beyond the affordability for people in the lower and lower-middle-income categories, then the achieved energy transition will not be sustainable. Therefore, energy affordability is also a vital element in the process of the energy transition. On the other hand, in the process of development towards energy transition, the power sector companies might end up with severe losses due to their current poor financial performance. This might be possible if the government did not utilize the cost-competitive advantage of solar and wind energy over fossil fuels. Further, the regulatory framework, proper energy tariff structure, and subsidies favouring energy transition can be conducive to averting the threat of the insolvency of power sector companies.
 T3:
Disparate political approaches in states without a common energy policy
Political approaches are more focused on the development aspect rather than on emphasizing sustainable development. This gives rise to increased investments and subsidies toward fossil fuels. Despite India having a national goal, the key piece of information, such as the methodological aspects of achieving targets, individual states’ contribution to the timeline for achieving the target, detailed policy, and regulatory approaches, are not transparent. The loopholes in the policy framework can encourage the states to lean on fossil fuels with insignificant progress in renewables. Due to the same reason, no serious progress in reducing emissions is witnessed in the Indian landscape at the local level. The more refined the energy policy, goal, and political approaches are, the better the progression towards energy transition in India.
 T4:
Inadequacy of manpower having specialized skillsets
As the scenario shifts from fossil fuels to clean energy fuels, the requirement of skills to encounter new problems such as coordinating the variability of renewable energy sources will vary from that of handling power from fossil fuels. Therefore, the reskilling of workers is of the utmost importance in the process of the energy transition. The energy transition will be hindered if there is not a sufficient number of workers to tackle the problems in the emerging scenario. India’s 100 GW solar target would require 81,000 highly skilled workers, and 182,400 low-skilled workers annually [99]. Entrenching training programmes near the renewable energy sites and seeking employees who have experience in the related fields are some efforts that can be conducive to gathering sufficient manpower with suitable skillsets.
 T5:
Skewed energy tariff structure
The energy tariff structure in India is based on the cross-subsidization scheme, which is also utilized as a political advantage to maintain lower prices for certain consumer segments. This strained the financial performance of the power sector of India with frequent losses and further hindered them from making efforts to develop new transmission lines and upgrade existing ones. Therefore, a revamped energy tariff system that benefits the power sector and that is reasonable to the consumer is required under an appropriate regulatory framework.

4.2. SWOT–Fuzzy AHP Analysis

The identified SWOT factors illustrate the current scenario of the energy transition, and these factors are crucial for the effective energy transition in India. To further analyze the significance of each SWOT factor, the authors integrated fuzzy AHP analysis with the SWOT investigation. The fuzzy AHP multi-criteria decision analysis methodology handles the uncertainties in the decision making and converts the linguistic terms to quantitative values. Therefore, fuzzy AHP is utilized in this study, and the detailed methodology is elaborated on in Section 3. The SWOT categories such as strengths, weaknesses, opportunities, and threats are regarded as primary-level threats, and the weightage obtained among the categories is called the global weightage. Meanwhile, the individual factors in each category are considered at a secondary level, and the weightage obtained within the category is called the local weightage. Therefore, a five-decision matrix is required for performing the fuzzy AHP analysis in this case.
Under the strengths category, S1 is provided with higher weightage since, without clean energy potential, energy transition is less likely. S5 is allocated with a lower weightage, as the other strengths, such as higher clean energy potential, slowdown of investments in the thermal sector, attractive sector for investment, and one nationalized grid, are far more important than the energy sector being coupled to economic growth. This is because the other strengths can intensify the relationship between economic growth and energy sector development. The decision matrix of the strengths category is represented in Table 3.
Concerning the weaknesses category, the political pressure, political incoherency with national goals, and other political factors prevail as major weaknesses for India in pursuing the path of energy transition, and they might be threatening factors for prospective developments. Therefore, W3 (“politically compromised and poor financial position of the power sector”) is given the highest weightage in the weaknesses category. The grid inflexibility and humongous energy imports are provided with the second- and third-highest priorities, respectively, since grid inflexibility can cause more major hindrances in the progress of energy transition than energy import characteristics. W4, i.e., “lack of long-term vision”, is provided with the least weightage due to its relative insignificance. Further, by strengthening the rest of the weaknesses factors, a long-term vision and energy policy will be accomplished. The decision matrix of the weaknesses category is shown in Table 4.
For the decision matrix of the opportunities category, the weightage is given from highest to lowest in the following order: O3, O1, O4, O2, and O5. Utilizing the cost-competitive advantage of renewables is the vital approach that the government should consider, and is, thus, provided with the highest weightage. Despite the improvement of energy efficiency in all aspects being significant for energy transition, the other opportunities are relatively vital to energy-transition pursuits in the Indian landscape. The decision matrix of the opportunities category is presented in Table 5.
Regarding the threats category, the “inadequacy of manpower” threat, i.e., T4, is provided with the highest weightage to prioritize the reskilling of the workers to support the energy transition scenario. The second priority is given to T5 since the energy tariff structure is key to improving the financial performance of the energy sector in India, so as to sustainably focus on energy transition. On the other hand, the threat factors T1, T2, and T3 are provided with the same weightage, as they can significantly hinder the energy transition but not to the extent of the threat factors T4 and T5. The decision matrix of the threats category is represented in Table 6.
Among the categories of SWOT, utilizing opportunities and averting threats is the rational way to approach an objective. Further, by pursuing the opportunities, some of the threats can be avoided. Therefore, the opportunities category is given a higher weightage than the threats. Meanwhile, the strengths and weaknesses are provided with lower weightages since these represent the current scenario and do not influence future efforts. Nevertheless, the weaknesses are required to be improved and, thus, the weaknesses category is provided with a higher weightage when compared to the strengths category. The decision matrix for the SWOT categories is shown in Table 7.
The result of the SWOT–fuzzy AHP analysis is illustrated in Table 8. A graphical representation of the SWOT–fuzzy AHP scores is shown in Figure 3. The results indicate that utilizing the cost-competitive advantage of solar and wind energy is the most significant factor that can ultimately favour the Indian energy sector towards effective energy transition. The second- and third-highest influencing factors include the threat of inadequacy of manpower (T4) and the opportunity of electrification (O3), respectively. The least-influencing factor includes a slowdown of investments in the thermal sector (S2), the lack of long-term vision (W4), and the renewable energy sector coupled to economic growth (S3).

5. Enhancing Energy Transition in the Indian Landscape—The Prospective Scenario

The SWOT analysis elucidates the current energy transition scenario in India, while the fuzzy AHP analysis highlights the significant factors among the identified SWOT factors. The energy transition in the prospective scenario should be built on the strengths, overcome the weaknesses, utilize the opportunities, and avert the threats. Thus, in this section, the strategies for coordinating the SWOT factors to entrench the energy transition are proposed, and the strategies are evaluated for their significance.

5.1. Strategies to Accelerate the Energy Transition

Fifteen strategies (ST) are proposed to direct the current scenario of the Indian energy sector towards energy transition. These are as follows:
ST1.
Create a stable and conducive policy environment for attracting clean energy investments;
ST2.
Establishing regional coordination and enhancing collaboration between states to ensure the consistent growth of renewable energy;
ST3.
The policy must emphasize “energy transition funds” to support and remodel the economies of people affected by the energy transition;
ST4.
Create adequate incentives for renewable energy technologies;
ST5.
Develop robust, legal, regulatory, and policy frameworks and reduce the influence of politics on energy sector financing and planning;
ST6.
Increase digitalization and automation and optimize energy utilization with demand-side management strategies;
ST7.
Reskilling technicians, hiring engineers, and designing the workforce for the effective energy transition;
ST8.
Incentives for battery technologies and EVs, and investments in charging stations;
ST9.
Emphasizing distributed generation and subsequent grid infrastructure development;
ST10.
Focusing on sustainable development rather than just development by prioritizing capitalism over environmentalism;
ST11.
Improving the energy efficiency of wind and solar energy technologies as well as reducing the levelized cost of energy;
ST12.
Modernizing cooking fuels and electrifying them;
ST13.
Timely introduction of hydrogen fuels and other emerging energy storage technologies;
ST14.
Increase the contributions of local renewable energy resources, solar rooftop technologies, and renewable heating systems;
ST15.
Strengthen research and development and education in the energy sector.
These strategies are proposed to accelerate the efforts of the Indian energy sector towards energy transition in such a way that the weaknesses are transformed into strengths, while threats are suppressed with opportunities.

5.2. PROMETHEE II Analysis

The recommended strategies are treated as alternatives and are evaluated against the individual SWOT factors to perform a comprehensive analysis for identifying the strategies that are key to the energy transition. To accomplish this, the PROMETHEE II method of multi-criteria decision analysis is employed since the framework of PROMETHEE II is based on comparing and evaluating each alternative with one another against each criterion. A detailed methodological interpretation is elucidated in Section 3. In this analysis, the criteria involve the 20 SWOT factors, and the aggregated score obtained in the SWOT–fuzzy AHP analysis for individual factors is used as their corresponding weightages in the PROMETHEE II analysis. Since the alternatives are strategies, the evaluation against the criteria is accomplished in linguistic terms which, in turn, are converted into equivalent quantitative terms, as described in Table 1 in Section 3. The decision matrix for the PROMETHEE II analysis is shown in Table 9.
The preference function and the aggregated preference function are presented in Appendix A, Table A1. The leaving flow, entering flow, and net outranking flow scores, and the final ranks, are represented in Table 10. The results highlight that ST5, ST14, and ST9 have the top three outranking flow scores, respectively. ST5 deals with developing a robust regulatory and policy framework for the energy sector to mitigate the influence of political factors. This strategy can be beneficial for the Indian energy sector in multiple aspects, as is evident from the highest leaving flow score. Further, the influence of a higher weightage for the opportunities criteria boosts the score of this strategy since ST5 scores high in almost all the opportunities factors. ST14 stresses increasing the contribution of local renewable energy sources, rooftop solar photovoltaics, and renewable heating systems. ST14 attained the second rank due to its high score in leaving flow and lowest score in entering flow. An interesting observation is that the entering flow score of ST14 is lower than ST5, but ST5 attains the first rank due to a higher difference in the scores of leaving flow among ST5 and ST14. ST14 scores from low to high in the SWOT factors, but the scores are high in the opportunities and weaknesses factors. ST9, i.e., distributed generation and subsequent grid infrastructural development, is the third most-significant strategy that favors energy transition in India. As the distributed generation is promoted, the utilization of solar and wind energy systems will increase, thereby making use of the cost-competitiveness of these technologies. On the other hand, the grid infrastructure development will enable the energy transition to take place more smoothly. Due to ST9′s lack of focus on the policy aspect, it does not score higher in the net outranking flows.
The strategies that obtained the last three ranks are ST3 (13th), ST6 (14th), and ST11 (15th), respectively. ST3 represents a part of policy focus on energy transition funds to secure the economies of the people affected by the energy transition. The narrowed focus of this strategy is the reason for the lower score. As the framework of the PROMETHEE method involves the comparison of each alternative to one another to produce a cumulative ranking, the lack of influence on some aspects of SWOT factors increases the entering flow score when compared to the leaving flow score of the strategy. ST6 deals with promoting digitalization and optimized energy usage, and it attains the 14th position due to its focused attributes, as it does not have any influence on the criteria that emphasize economic and political characteristics. ST11, i.e., improving the energy efficiency of wind and solar energy technologies and increasing the affordability attributes, attains the last position. This position is again attributed to a narrowed focus on the strategy. Further, the capital flow on improving the efficiency of energy generation technologies can be directed to grid improvement for revitalizing the grid-related issues. This is because the improvement in terms of grid flexibility can generate more revenue and investment and enhance the trading capability of the state. The current scenario marks the financial performance and political influence as the major stalling force for the energy transition in India. Therefore, the strategies focusing on these aspects tend to score higher in the PROMETHEE analysis.
As a whole, the energy transition in India can be accelerated by firm planning and decentralized target allocation with coordinated energy policies in action. The expansion of solar and wind energy projects and the electrification of the transportation sector is the foundation for the energy transition in India. Concurrently, incremental upgrades to the grid, and interconnections between regions, is required. At the deepest level, the highest efforts should be concentrated on establishing an effective financial plan as well as decoupling the political influence on the energy sector by restructuring the energy tariff mechanism in India. In addition, the incentives, subsidy programmes, and carbon tax schemes have their own roles to promote energy transition. The proposed strategies can be conducive to transforming the negative attributes into opportunities and embracing the strengths to foresee a sustainable energy sector.

6. Policy and Social Implications

The policy approach should be restructured to be less influenced by political factors and redirected to achieve the energy transition. On the other hand, policies can also be channelized to emphasize carbon taxes and using them to provide incentives for supporting renewable energy development. India’s approach to reducing its dependency on fossil fuels will mark its pace of energy transition. The existing fossil fuel power plants should be gradually shut down without any further investments. Moreover, the government should make efforts to reskill the workers to align them with the energy transition and also create energy transition funds to aid those who are affected by the energy transition. Otherwise, there will not be sufficient social acceptance to hasten the process of the energy transition.
The financial performance of the energy sector in India can be improved by decreasing the gap in the electricity rates in the cross-subsidization approach, while the policies should promote proper tariff schemes. By coupling all these approaches, the top-performing strategies can be underpinned to accomplish energy transition in India. The accessibility of electricity and clean fuel to people in high-population density and remote areas should be focused on.
Funds should be channelized to clean energy investments, and specific focus must be given to the industrial and residential sectors. Cheaper PV panels and incentives for PV panels would encourage people to install rooftop solar PV panels. Concerning the transportation sector, the utilization of electric vehicles should be promoted. In India, the policy approach to electric vehicles can initiate with public transport. Despite the progress of electrifying four-wheelers and two-wheelers, the country should emphasize tax incentives in insurance for electric vehicle users to attract an increase in the usage of EVs. On the other hand, the challenge of installing charging stations requires a coordinated approach with public–private sector collaboration. Furthermore, the usage of electric stoves and electric vehicles can be run on clean energy if the rooftop PV panel approach is entrenched. This will not only increase clean energy consumption but also decrease the dependency on fossil fuels, which is the crucial challenge for India to witness the energy transition.
The recent crisis of the Russia–Ukraine war had disrupted the supply chain of oil from Russia, as Russia is the world’s largest exporter to the global markets and the second-largest exporter of crude oil [100]. The India–Russia relationship is and was always politically stable, and as such, it is expected that this war will not have much influence on energy security in India. However, India should make efforts to diversify its energy resources by focusing on solar and wind energy.

7. Conclusions

The energy transition is the key to the decarbonized and sustainable energy sector. India is one of the crucial countries that is required to decarbonize its energy sector to achieve its Paris Agreement and Sustainable Development Goals. However, the literature review indicated that the energy transition in India is bounded by complex paradoxical factors. To delineate the complexity of the multi-fold factors influencing the energy transition, as well as to propel the current scenario towards effective energy transition, a hybrid SWOT-integrated MCDA approach is proposed to identify the complex factors, evaluate them, and assess the recommendation strategies.
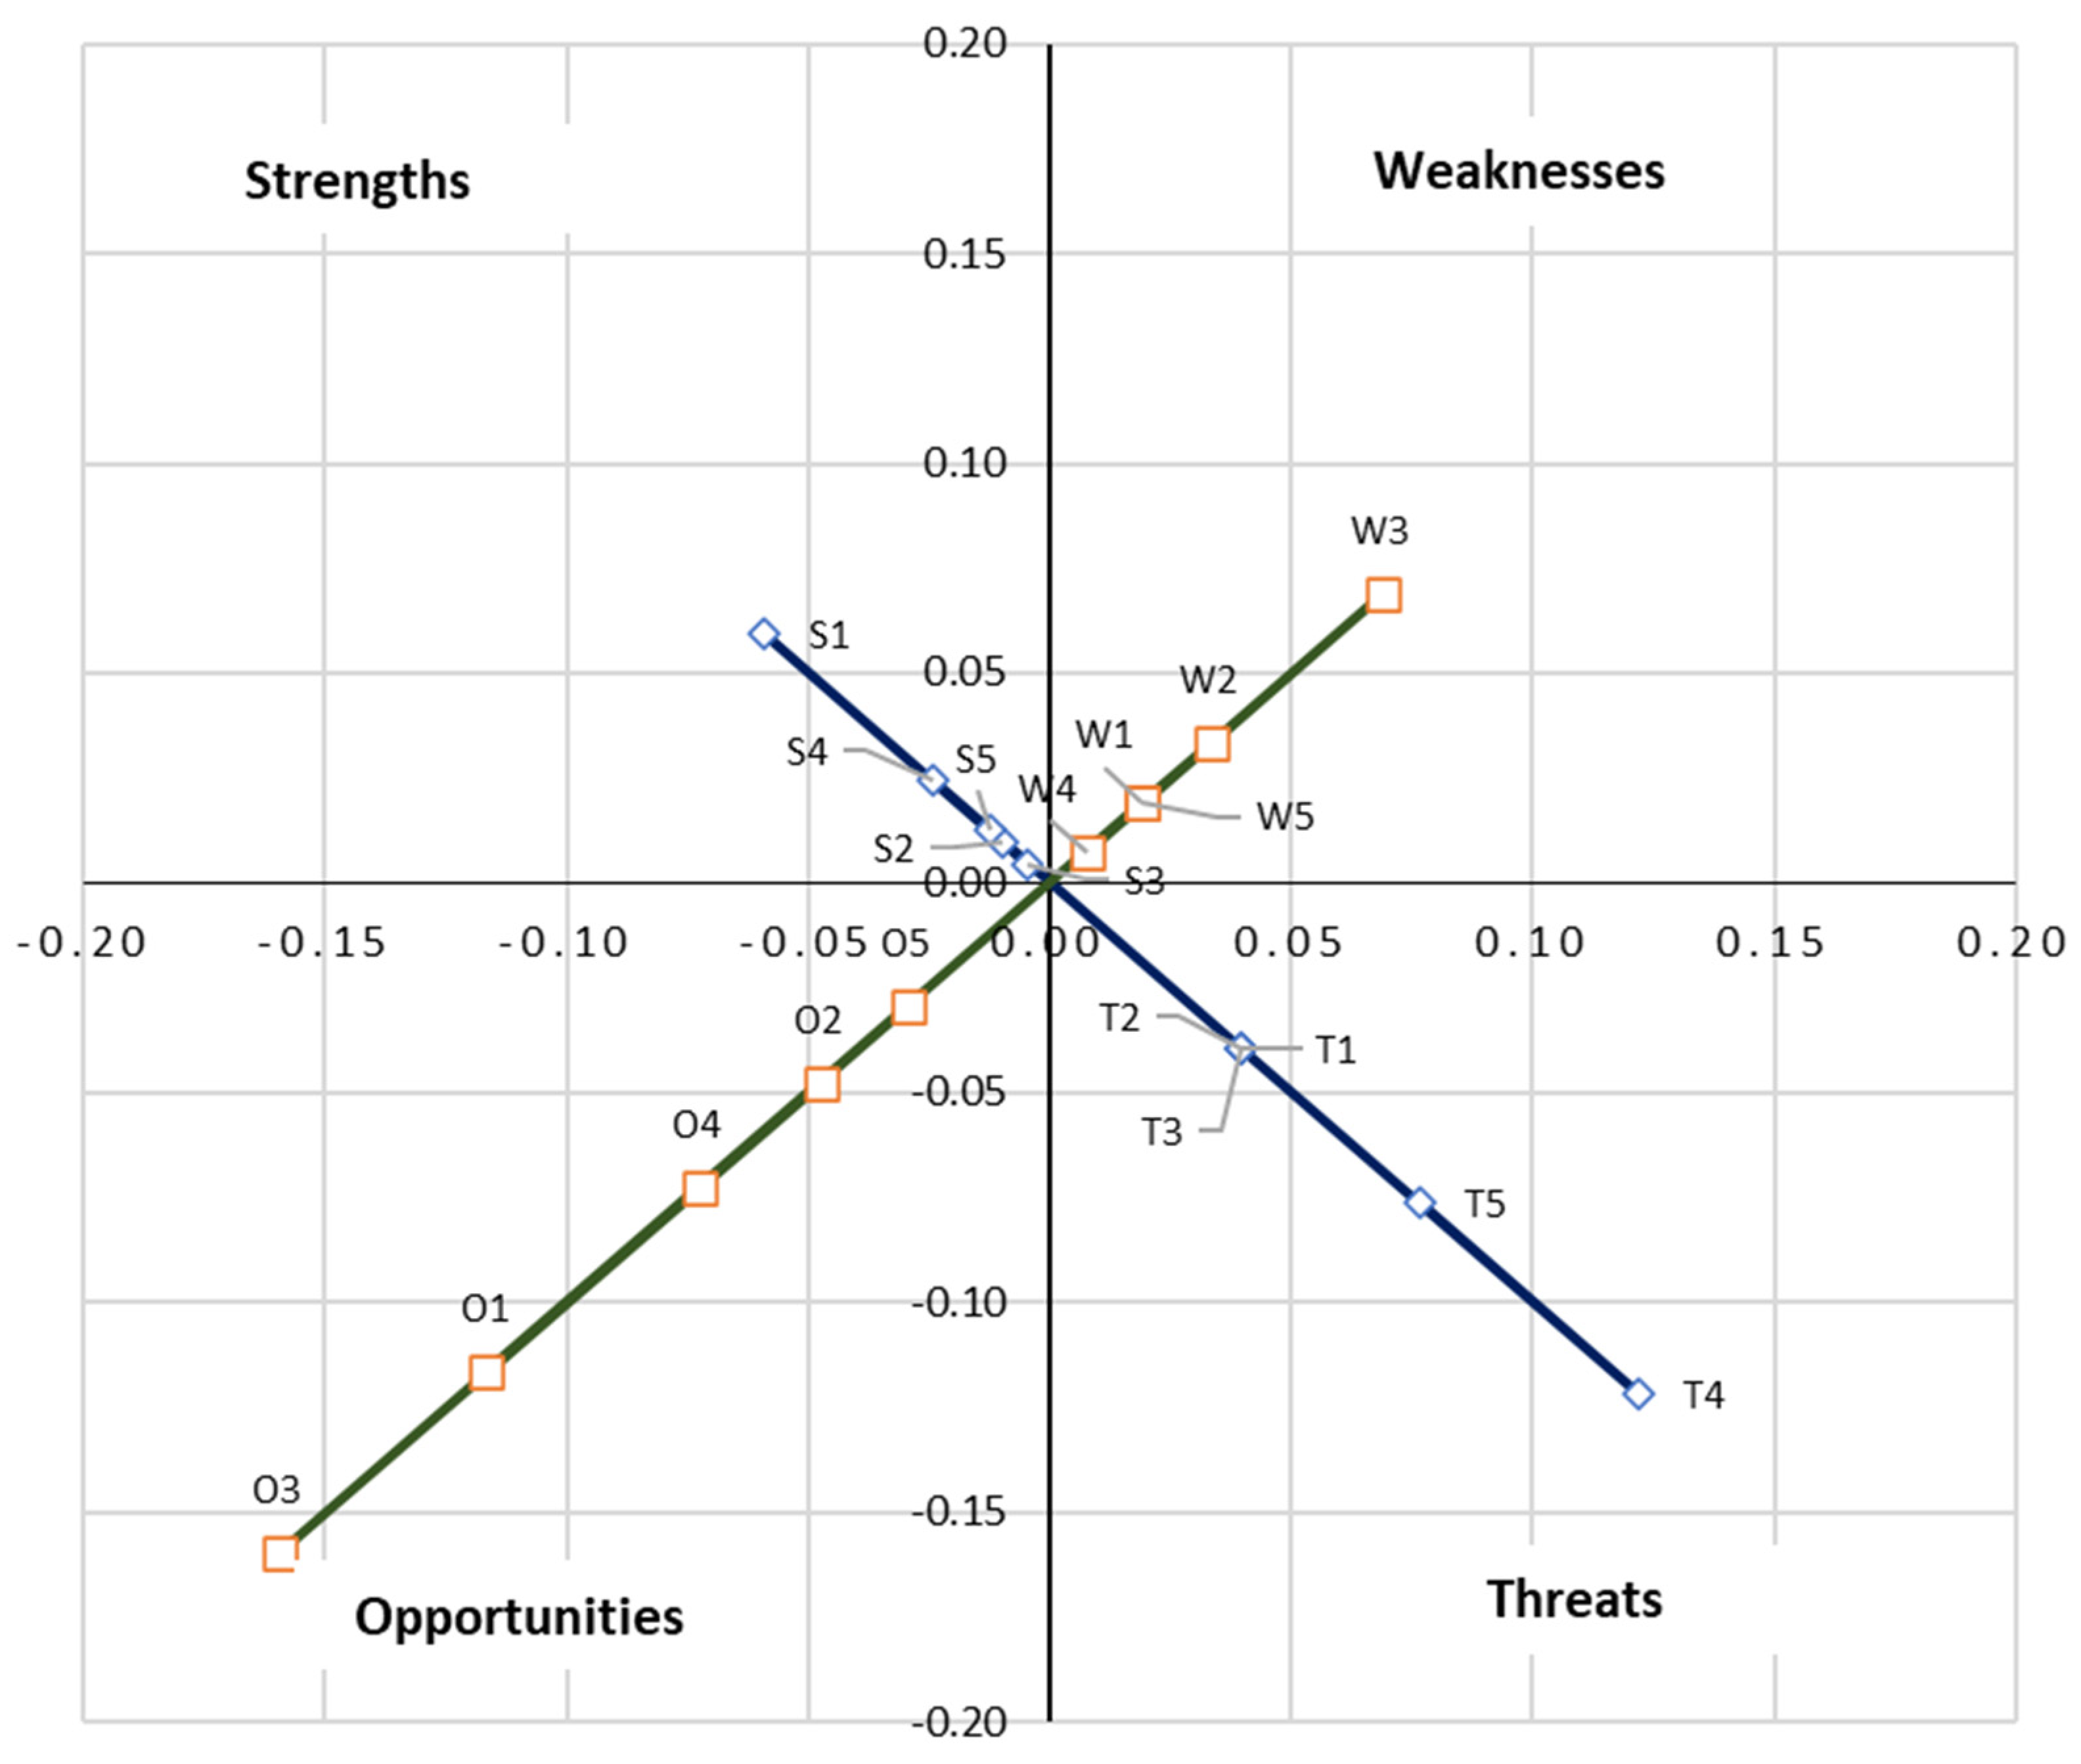
Five factors of strengths, weaknesses, opportunities, and threats have been presented. Upon analyzing the importance of these SWOT factors through the fuzzy AHP method, it can be inferred that high solar and wind energy potential (S1), a politically compromised and financially insolvent power sector (W3), utilizing the cost-competitive advantage of solar and wind energy over fossil fuels (O1), and the inadequacy of manpower having specialized skillsets (T4) are the most significant strengths, weaknesses, opportunities, and threats, respectively, of the current energy transition scenario in India. To accelerate the energy transition, fifteen strategies are proposed. These strategies are assessed against the SWOT factors using the PROMETHEE II methodology. Further, the aggregated score obtained in the fuzzy AHP method is fed into the PROMETHEE II method as weightage to the SWOT criteria. The results indicate that developing a robust policy and regulatory framework (ST5), increasing the contribution of local energy resources (ST14), and promoting distributed generation and the subsequent grid infrastructure development (ST9) are the top three strategies that can ultimately aid smooth energy transition in India. These strategies score relatively higher in the political, financial, and technological SWOT factors, which yield higher net outranking flow scores. On the other hand, the strategies with a narrowed focus, such as improving the energy efficiency of wind and solar energy technologies (ST11), score lower.
To conclude, India faces a paradoxical scenario because of its progress in both renewable energy penetration and fossil fuels in the energy mix. However, the current scenario demonstrates that investment in fossil fuel projects has witnessed a declining trend. The solution for the current complex scenario relies on the financial performance of the energy sector and the political approach, as well as the influence on the energy tariff structure in India. A revamped, coordinated, and coherent policy approach throughout the states of India is a desideratum.

Author Contributions

Conceptualization, V.I. and R.M.E.; methodology, V.I.; software, V.I.; validation, V.I. and N.K.M.; formal analysis, V.I., N.K.M., and R.M.E.; investigation, V.I., N.K.M., and R.M.E.; data curation, V.I.; writing—original draft preparation, V.I.; writing—review and editing, N.K.M., R.M.E., and L.M.-P.; visualization, V.I. and R.M.E.; supervision, N.K.M. All authors have read and agreed to the published version of the manuscript.

Funding

The APC was funded by Ostfold University College, Norway.

Institutional Review Board Statement

Not applicable.

Informed Consent Statement

Not applicable.

Data Availability Statement

Not applicable.

Conflicts of Interest

The authors declare no conflict of interest.

Appendix A

Table A1. Preference function and aggregated preference function in the PROMETHEE II analysis.
Pj (a,b)S1S2S3S4S5W1W2W3W4W5O1O2O3O4O5T1T2T3T4T5π (a,b)
ab
ST1ST200.6010000.40.2000.40.60.25000.5000.50.2498
ST1ST30010.800010.200.40.8000010.200.50.2645
ST1ST400.61100010000.4000010000.1618
ST1ST50000.40000.2000000000.250000.0333
ST1ST600.61100010.20000.60.250010.200.250.2852
ST1ST70000.800010.6000.400.50010.200.50.2335
ST1ST800.610.600010000.20.60.25000.75000.250.2658
ST1ST90010.40001000000.25000.50.2000.1289
ST1ST100000.400010000.400001000.250.1561
ST1ST1100.6110000.8000.40.800.50010.200.50.2960
ST1ST1200.61100010.2000.800.25001000.50.2387
ST1ST1300.610.200010000.400001000.250.1616
ST1ST140000.600010000.600000.50000.1316
ST1ST1500.610.400010.2000.400.50010000.1850
ST2ST10.600010.80.8000.80.20000.40.800.8000.2032
ST2ST30.201010.80.80.600.80.60.4000.40.80.51000.3187
ST2ST40010100.80.600.800000.40.40.50.8000.1790
ST2ST50.400010.40.2000.6000000.600000.0856
ST2ST60.601000.80.20.6000.2000000.51000.1857
ST2ST70.600010.80.60.60.40.40.2000.2500.60.51000.2594
ST2ST8001000.800.6000000000.250.6000.0946
ST2ST900100000.60000000.4001000.0970
ST2ST100000100.80.600.800000.20.20.50.2000.1371
ST2ST11001010.20.80.400.60.60.400.2500.80.51000.2842
ST2ST120.401010.20.80.600.800.4000.40.80.50.6000.2333
ST2ST1300100.250.20.20.6000.20000.200.50.4000.1242
ST2ST1400000.7500.40.60000.2000000.2000.0815
ST2ST1500100.750.20.20.6000000.25000.50.8000.1351
ST3ST10.40.200000000000.2000000.600.1307
ST3ST200.800.2000000000.80.2500000.600.2315
ST3ST400.800.2000000000000000.600.0856
ST3ST50.20.200000000000000000.400.0625
ST3ST60.40.800.2000000000.80.2500000.600.2551
ST3ST70.40.20000000.40000.20.50000000.0967
ST3ST800.800000000000.80.2500000.600.2266
ST3ST900.2000000000000.2500000.600.0932
ST3ST100000000000000000000.600.0732
ST3ST1100.800.20000000000.500000.600.1219
ST3ST120.20.800.20000000000.2500000.600.1156
ST3ST1300.800000000000000000.600.0808
ST3ST140000000000000000000.600.0732
ST3ST1500.8000000000000.500000.600.1170
ST4ST1100000.800000.200.4000.400000.1773
ST4ST20.400000000.200010.25000000.50.2412
ST4ST30.600000.8000.200.60.40.2000.400.200.50.2350
ST4ST50.800000.40000000000.200000.0628
ST4ST6100000.8000.200.2010.250000.200.250.3040
ST4ST7100000.8000.600.200.40.500.200.200.50.2563
ST4ST80.400000.800000010.25000000.250.2358
ST4ST900000000000000.250000.2000.0260
ST4ST1000000000000000000000.250.0191
ST4ST110.200000.200000.60.40.20.500.400.200.50.2347
ST4ST120.800000.2000.2000.40.20.2500.40000.50.1757
ST4ST130.200000.200000.200.20000000.250.0900
ST4ST14000000000000.2000000000.0095
ST4ST150.400000.2000.20000.20.50000000.0971
ST5ST10.200000.40.600.40.20.600.40.50.60.200.80.20.50.3359
ST5ST200.600.60000.20.600.40.410.750.200.2500.210.4348
ST5ST30010.400.40.60.80.60.210.80.20.50.60.20.751010.4990
ST5ST400.610.6000.60.80.40.20.40.400.50.600.750.80.20.50.3499
ST5ST60.20.610.600.400.80.600.6010.75000.7510.20.750.5386
ST5ST70.2000.400.40.40.8100.60.40.410.200.751010.4817
ST5ST800.610.200.400.80.4000.210.75000.50.60.20.750.4295
ST5ST900100000.80.400.2000.750.600.2510.20.250.2507
ST5ST100000000.60.80.20.20.40.400.250.400.750.20.20.750.2951
ST5ST1100.610.6000.60.60.4010.80.2100.20.7510.210.5259
ST5ST1200.610.6000.60.80.60.200.80.20.750.60.20.750.60.210.4120
ST5ST1300.6100000.8000.60.40.20.50.400.750.40.20.750.3614
ST5ST140000.2000.20.80.200.20.600.25000.250.20.20.250.1993
ST5ST1500.6100000.80.600.20.40.21000.750.80.20.50.3404
ST6ST10000100.6001000010.800000.1124
ST6ST20000000000.200.4000.600000.250.0595
ST6ST30000100.60010.40.80010.80000.250.2162
ST6ST40000100.600100.40010.400000.1156
ST6ST50000100000.800000.40.600000.0632
ST6ST70000100.400.40.600.400.250.60.60000.250.1378
ST6ST8000000000000.2000.4000000.0212
ST6ST90000000000.200001000000.0331
ST6ST100000100.600100.4000.80.200000.1019
ST6ST110000100.6000.80.40.800.250.20.80000.250.2070
ST6ST120000100.600100.80010.80000.250.1695
ST6ST1300000.2500000.200.4000.8000000.0494
ST6ST1400000.7500.2000.200.6000.4000000.0601
ST6ST1500000.7500000.200.400.250.2000000.0562
ST7ST10000000.2000.400000.40.200100.1558
ST7ST200.600.2000000000.600000100.2283
ST7ST30010000.2000.40.40.4000.40.2000.400.1529
ST7ST400.610.2000.2000.400000.4000100.1631
ST7ST50000000000.2000000000.800.1014
ST7ST600.610.2000000000.600000100.2329
ST7ST800.610000000000.600000100.2280
ST7ST9001000000000000.4000100.1382
ST7ST100000000.2000.400000.2000100.1421
ST7ST1100.610.2000.2000.20.40.40000.200100.2211
ST7ST1200.610.2000.2000.400.4000.40.200100.1899
ST7ST1300.61000000000000.2000100.1381
ST7ST14000000000000.2000000100.1314
ST7ST1500.61000000000000000100.1322
ST8ST10.60001010010.60000.6100.2000.2352
ST8ST20000.4000.200.20.20.40.2000.20.20000.250.1107
ST8ST30.2000.210100.2110.6000.610.250.400.250.3299
ST8ST40000.41010010.40.2000.60.60.250.2000.1897
ST8ST50.4000100.4000.8000000.800000.0963
ST8ST60.6000.4000.400.200.600000.20.250.4000.1634
ST8ST70.6000.2100.800.60.60.60.200.250.20.80.250.400.250.2752
ST8ST90000000000.20.20000.60.200.4000.0683
ST8ST1000001010010.40.2000.40.40.250000.1584
ST8ST110000.4101000.810.600.25010.250.400.250.3181
ST8ST120.4000.410100.2100.6000.610.25000.250.2142
ST8ST1300000.2500.4000.20.60.2000.40.20.250000.1292
ST8ST1400000.7500.6000.20.20.40000.200000.0834
ST8ST1500000.7500.400.20.20.20.200.25000.250.2000.0967
ST9ST11000111000.80.40.20.4000.80000.250.3099
ST9ST20.40.600.600.20.200.200.20.610000000.750.3247
ST9ST30.6000.411100.20.80.810.2000.80.5000.750.4081
ST9ST400.600.610.21000.80.20.60000.40.5000.250.1915
ST9ST50.800010.60.4000.600.20000.600000.1292
ST9ST610.600.6010.400.200.40.210000.5000.50.3870
ST9ST71000.4110.800.60.40.40.60.40.2500.60.5000.750.3970
ST9ST80.40.600.201000000.410000.25000.50.2800
ST9ST10000010.21000.80.20.60000.20.5000.50.1825
ST9ST110.20.600.610.41000.60.810.20.2500.80.5000.750.3964
ST9ST120.80.600.610.4100.20.8010.2000.80.5000.750.3258
ST9ST130.20.6000.250.40.40000.40.60.20000.5000.50.2067
ST9ST140000.20.7500.600000.8000000000.0722
ST9ST150.40.6000.750.40.400.2000.60.20.25000.5000.250.1786
ST10ST110.40000.8000.200.200.40.250.20.600.6000.2381
ST10ST20.4100.600000.400010.5000000.250.2657
ST10ST30.60.210.400.8000.400.60.40.20.250.20.600.800.250.2891
ST10ST40110.600000.200000.250.20.200.6000.0856
ST10ST50.80.40000.40000000000.400000.0745
ST10ST61110.600.8000.400.2010.50000.8000.3567
ST10ST710.400.400.8000.800.200.40.7500.400.800.250.3018
ST10ST80.4110.200.8000.200010.50000.4000.2710
ST10ST900.41000000.200000.50.2000.8000.0835
ST10ST110.2110.600.2000.200.60.40.20.7500.600.800.250.2953
ST10ST120.8110.600.2000.4000.40.20.50.20.600.400.250.2343
ST10ST130.211000.200000.200.20.250000.2000.1110
ST10ST1400.200.200000000.2000000000.0162
ST10ST150.411000.2000.40000.20.750000.6000.1545
ST11ST10.800000.60000.2000.200.8000000.1179
ST11ST20.200000000.20000.800.4000000.1528
ST11ST30.400000.600.20.20.200000.8000000.0776
ST11ST400000000.200.200000.8000000.0410
ST11ST50.600000.2000000000.2000000.0452
ST11ST60.800000.600.20.20000.800000000.2017
ST11ST70.800000.600.20.60000.200.4000000.1207
ST11ST80.200000.600.200000.800.2000000.1706
ST11ST900000000.20000000.8000000.0372
ST11ST1000000000.200.200000.6000000.0352
ST11ST120.60000000.20.20.200000.8000000.0780
ST11ST1300000000.20000000.6000000.0314
ST11ST1400000000.20000000.2000000.0196
ST11ST150.20000000.20.2000000000000.0271
ST12ST10.200000.600000.600.200000.2000.1331
ST12ST200000000000.400.800000000.1744
ST12ST3000000.6000010000000.4000.1438
ST12ST400000000000.40000000.2000.0545
ST12ST5000000.2000000000000000.0038
ST12ST60.200000.600000.600.800000.4000.2367
ST12ST70.200000.6000.400.600.20.250000.4000.1621
ST12ST8000000.60000000.800000000.1391
ST12ST900000000000.20000000.4000.0391
ST12ST1000000000000.40000000000.0467
ST12ST1100000000001000.250000.4000.1505
ST12ST1300000000000.60000000000.0700
ST12ST1400000000000.20000000000.0233
ST12ST1500000000000.2000.250000.2000.0493
ST13ST10.80000.750.60.600.40.8000.200.20.800.4000.1914
ST13ST20.2000.800000.60000.80.25000000.250.2007
ST13ST30.4000.60.750.60.600.60.80.40.4000.20.800.600.250.2445
ST13ST40000.80.7500.600.40.800000.20.400.4000.1044
ST13ST50.6000.20.750.20000.6000000.600000.0886
ST13ST60.8000.800.6000.60000.80.250000.6000.2521
ST13ST70.8000.60.750.60.4010.4000.20.500.600.600.250.2457
ST13ST80.2000.400.6000.40000.80.250000.2000.1897
ST13ST90000.200000.400000.250.2000.6000.0555
ST13ST100000.20.7500.600.20.8000000.200000.0589
ST13ST110000.80.7500.600.40.60.40.400.500.800.600.250.2394
ST13ST120.6000.80.7500.600.60.800.400.250.20.800.200.250.2055
ST13ST140000.40.500.200.2000.2000000000.0336
ST13ST150.2000.20.50000.600000.50000.4000.0795
ST14ST110.2000.2510.400.20.80.400.40.250.60.800.600.250.3338
ST14ST20.40.800.400.2000.400.2010.50.200000.750.3303
ST14ST30.6010.20.2510.400.40.80.80.20.20.250.60.80.50.800.750.4092
ST14ST400.810.40.250.20.400.20.80.2000.250.60.40.50.600.250.1961
ST14ST50.80.2000.250.60000.6000000.600000.0988
ST14ST610.810.401000.400.4010.5000.50.800.50.4351
ST14ST710.200.20.2510.200.80.40.400.40.750.20.60.50.800.750.4113
ST14ST80.40.81001000.200010.5000.250.400.50.3161
ST14ST900.21000000.200000.50.6000.8000.0933
ST14ST1000000.250.20.4000.80.20000.40.20.5000.50.1364
ST14ST110.20.810.40.250.40.400.20.60.80.20.20.7500.80.50.800.750.3999
ST14ST120.80.810.40.250.40.400.40.800.20.20.50.60.80.50.400.750.3311
ST14ST130.20.81000.400000.400.20.250.400.50.200.50.2059
ST14ST150.40.81000.4000.40000.20.75000.50.600.250.1952
ST15ST10.60000.250.60.6000.80.400.200.8100000.2266
ST15ST20000.60000000.200.800.40.20000.50.2234
ST15ST30.2000.40.250.60.6000.80.80.4000.8100.200.50.2925
ST15ST40000.60.2500.6000.80.20000.80.600000.1232
ST15ST50.40000.250.20000.600000.20.800000.0794
ST15ST60.6000.600.600000.400.8000.200.200.250.2707
ST15ST70.6000.40.250.60.400.40.40.400.200.40.800.200.50.2516
ST15ST80000.200.60000000.800.200000.250.1690
ST15ST9000000000000000.80.200.2000.0392
ST15ST1000000.2500.6000.80.20000.60.40000.250.1141
ST15ST110000.60.2500.6000.60.80.4000100.200.50.2469
ST15ST120.4000.60.2500.6000.800.4000.810000.50.1966
ST15ST1300000000000.40000.60.20000.250.0912
ST15ST140000.2000.200000.2000.20.200000.0347

References

  1. Ritchie, H.; Roser, M. CO2 and Greenhouse Gas Emissions. OurWorldInData.org. 2020. Available online: https://ourworldindata.org/co2-and-other-greenhouse-gas-emissions (accessed on 4 January 2022).
  2. Madurai Elavarasan, R.; Pugazhendhi, R.; Jamal, T.; Dyduch, J.; Arif, M.T.; Manoj Kumar, N.; Shafiullah, G.; Chopra, S.S.; Nadarajah, M. Envisioning the UN Sustainable Development Goals (SDGs) through the lens of energy sustainability (SDG 7) in the post-COVID-19 world. Appl. Energy 2021, 292, 116665. [Google Scholar] [CrossRef]
  3. Elavarasan, R.; Shafiullah, G.; Manoj Kumar, N.; Padmanaban, S. A State-of-the-Art Review on the Drive of Renewables in Gujarat, State of India: Present Situation, Barriers and Future Initiatives. Energies 2019, 13, 40. [Google Scholar] [CrossRef] [Green Version]
  4. Madurai Elavarasan, R.; Selvamanohar, L.; Raju, K.; Rajan Vijayaraghavan, R.; Subburaj, R.; Nurunnabi, M.; Khan, I.A.; Afridhis, S.; Hariharan, A.; Pugazhendhi, R.; et al. A Holistic Review of the Present and Future Drivers of the Renewable Energy Mix in Maharashtra, State of India. Sustainability 2020, 12, 6596. [Google Scholar] [CrossRef]
  5. Elavarasan, R.M. Comprehensive Review on India’s Growth in Renewable Energy Technologies in Comparison with Other Prominent Renewable Energy Based Countries. J. Sol. Energy Eng. 2020, 142, 030801. [Google Scholar] [CrossRef]
  6. Schmidt, R.-R.; Leitner, B. A collection of SWOT factors (strength, weaknesses, opportunities and threats) for hybrid energy networks. Energy Rep. 2021, 7, 55–61. [Google Scholar] [CrossRef]
  7. Jing, W.; Tao, M. Research on clean energy development strategy of China Three Gorges Corporation based on SWOT framework. Sustain. Energy Technol. Assess. 2021, 47, 101335. [Google Scholar] [CrossRef]
  8. Qaiser, I. A comparison of renewable and sustainable energy sector of the South Asian countries: An application of SWOT methodology. Renew. Energy 2022, 181, 417–425. [Google Scholar] [CrossRef]
  9. Agyekum, E.B. Energy poverty in energy rich Ghana: A SWOT analytical approach for the development of Ghana’s renewable energy. Sustain. Energy Technol. Assess. 2020, 40, 100760. [Google Scholar] [CrossRef]
  10. Saraswat, S.K.; Digalwar, A.K. Evaluation of energy alternatives for sustainable development of energy sector in India: An integrated Shannon’s entropy fuzzy multi-criteria decision approach. Renew. Energy 2021, 171, 58–74. [Google Scholar] [CrossRef]
  11. Bhardwaj, A.; Joshi, M.; Khosla, R.; Dubash, N.K. More priorities, more problems? Decision-making with multiple energy, development and climate objectives. Energy Res. Soc. Sci. 2019, 49, 143–157. [Google Scholar] [CrossRef]
  12. Cinelli, M.; Kadziński, M.; Gonzalez, M.; Słowiński, R. How to support the application of multiple criteria decision analysis? Let us start with a comprehensive taxonomy. Omega 2020, 96, 102261. [Google Scholar] [CrossRef] [PubMed]
  13. Bączkiewicz, A.; Kizielewicz, B. Towards Sustainable Energy Consumption Evaluation in Europe for Industrial Sector Based on MCDA Methods. Procedia Comput. Sci. 2021, 192, 1334–1346. [Google Scholar] [CrossRef]
  14. Xu, B.; Kolosz, B.W.; Andresen, J.M.; Ouenniche, J.; Greening, P.; Chang, T.-S.; Maroto-Valer, M.M. Performance Evaluation of Alternative Jet Fuels using a hybrid MCDA method. Energy Procedia 2019, 158, 1110–1115. [Google Scholar] [CrossRef]
  15. Sahabuddin, M.; Khan, I. Multi-criteria decision analysis methods for energy sector’s sustainability assessment: Robustness analysis through criteria weight change. Sustain. Energy Technol. Assess. 2021, 47, 101380. [Google Scholar] [CrossRef]
  16. Zhao, G.; Irfan Ahmed, R.; Ahmad, N.; Yan, C.; Usmani, M.S. Prioritizing critical success factors for sustainable energy sector in China: A DEMATEL approach. Energy Strateg. Rev. 2021, 35, 100635. [Google Scholar] [CrossRef]
  17. Vlachokostas, C.; Michailidou, A.V.; Achillas, C. Multi-Criteria Decision Analysis towards promoting Waste-to-Energy Management Strategies: A critical review. Renew. Sustain. Energy Rev. 2021, 138, 110563. [Google Scholar] [CrossRef]
  18. Baumann, M.; Weil, M.; Peters, J.F.; Chibeles-Martins, N.; Moniz, A.B. A review of multi-criteria decision making approaches for evaluating energy storage systems for grid applications. Renew. Sustain. Energy Rev. 2019, 107, 516–534. [Google Scholar] [CrossRef]
  19. LOKEN, E. Use of multicriteria decision analysis methods for energy planning problems. Renew. Sustain. Energy Rev. 2007, 11, 1584–1595. [Google Scholar] [CrossRef]
  20. Ruiz, H.S.; Sunarso, A.; Ibrahim-Bathis, K.; Murti, S.A.; Budiarto, I. GIS-AHP Multi Criteria Decision Analysis for the optimal location of solar energy plants at Indonesia. Energy Rep. 2020, 6, 3249–3263. [Google Scholar] [CrossRef]
  21. Pavlović, B.; Ivezić, D.; Živković, M. A multi-criteria approach for assessing the potential of renewable energy sources for electricity generation: Case Serbia. Energy Rep. 2021, 7, 8624–8632. [Google Scholar] [CrossRef]
  22. Haase, M.; Babenhauserheide, N.; Rösch, C. Multi criteria decision analysis for sustainability assessment of 2nd generation biofuels. Procedia CIRP 2020, 90, 226–231. [Google Scholar] [CrossRef]
  23. Sward, J.A.; Nilson, R.S.; Katkar, V.V.; Stedman, R.C.; Kay, D.L.; Ifft, J.E.; Zhang, K.M. Integrating social considerations in multicriteria decision analysis for utility-scale solar photovoltaic siting. Appl. Energy 2021, 288, 116543. [Google Scholar] [CrossRef]
  24. Panchal, S.; Shrivastava, A.K. Landslide hazard assessment using analytic hierarchy process (AHP): A case study of National Highway 5 in India. Ain Shams Eng. J. 2022, 13, 101626. [Google Scholar] [CrossRef]
  25. Madurai Elavarasan, R.; Leoponraj, S.; Dheeraj, A.; Irfan, M.; Gangaram Sundar, G.; Mahesh, G.K. PV-Diesel-Hydrogen fuel cell based grid connected configurations for an institutional building using BWM framework and cost optimization algorithm. Sustain. Energy Technol. Assess. 2021, 43, 100934. [Google Scholar] [CrossRef]
  26. Abdul, D.; Wenqi, J.; Tanveer, A. Prioritization of renewable energy source for electricity generation through AHP-VIKOR integrated methodology. Renew. Energy 2022, 184, 1018–1032. [Google Scholar] [CrossRef]
  27. Sotiropoulou, K.F.; Vavatsikos, A.P. Onshore wind farms GIS-Assisted suitability analysis using PROMETHEE II. Energy Policy 2021, 158, 112531. [Google Scholar] [CrossRef]
  28. Lin, R.; Lu, S.; Yang, A.; Shen, W.; Ren, J. Multi-criteria sustainability assessment and decision-making framework for hydrogen pathways prioritization: An extended ELECTRE method under hybrid information. Int. J. Hydrog. Energy 2021, 46, 13430–13445. [Google Scholar] [CrossRef]
  29. Li, Z.; Luo, Z.; Wang, Y.; Fan, G.; Zhang, J. Suitability evaluation system for the shallow geothermal energy implementation in region by Entropy Weight Method and TOPSIS method. Renew. Energy 2022, 184, 564–576. [Google Scholar] [CrossRef]
  30. Karande, P.; Chakraborty, S. Application of multi-objective optimization on the basis of ratio analysis (MOORA) method for materials selection. Mater. Des. 2012, 37, 317–324. [Google Scholar] [CrossRef]
  31. Asadi, S.; Nilashi, M.; Iranmanesh, M.; Ghobakhloo, M.; Samad, S.; Alghamdi, A.; Almulihi, A.; Mohd, S. Drivers and barriers of electric vehicle usage in Malaysia: A DEMATEL approach. Resour. Conserv. Recycl. 2022, 177, 105965. [Google Scholar] [CrossRef]
  32. Shao, Z.; Huq, M.E.; Cai, B.; Altan, O.; Li, Y. Integrated remote sensing and GIS approach using Fuzzy-AHP to delineate and identify groundwater potential zones in semi-arid Shanxi Province, China. Environ. Model. Softw. 2020, 134, 104868. [Google Scholar] [CrossRef]
  33. Elavarasan, R.M.; Leoponraj, S.; Vishnupriyan, J.; Dheeraj, A.; Gangaram Sundar, G. Multi-Criteria Decision Analysis for user satisfaction-induced demand-side load management for an institutional building. Renew. Energy 2021, 170, 1396–1426. [Google Scholar] [CrossRef]
  34. Elavarasan, R.M.; Pugazhendhi, R.; Shafiullah, G.M.; Irfan, M.; Anvari-Moghaddam, A. A hover view over effectual approaches on pandemic management for sustainable cities—The endowment of prospective technologies with revitalization strategies. Sustain. Cities Soc. 2021, 68, 102789. [Google Scholar] [CrossRef] [PubMed]
  35. Fragkos, P.; Laura van Soest, H.; Schaeffer, R.; Reedman, L.; Köberle, A.C.; Macaluso, N.; Evangelopoulou, S.; De Vita, A.; Sha, F.; Qimin, C.; et al. Energy system transitions and low-carbon pathways in Australia, Brazil, Canada, China, EU-28, India, Indonesia, Japan, Republic of Korea, Russia and the United States. Energy 2021, 216, 119385. [Google Scholar] [CrossRef]
  36. Pradhan, B.K.; Ghosh, J. A computable general equilibrium (CGE) assessment of technological progress and carbon pricing in India’s green energy transition via furthering its renewable capacity. Energy Econ. 2022, 106, 105788. [Google Scholar] [CrossRef]
  37. Roy, B.; Schaffartzik, A. Talk renewables, walk coal: The paradox of India’s energy transition. Ecol. Econ. 2021, 180, 106871. [Google Scholar] [CrossRef]
  38. Sharma, V.; Greig, C.; Lant, P. What is stopping India’s rapid decarbonisation? Examining social factors, speed, and institutions in Odisha. Energy Res. Soc. Sci. 2021, 78, 102117. [Google Scholar] [CrossRef]
  39. Moya, D.; Budinis, S.; Giarola, S.; Hawkes, A. Agent-based scenarios comparison for assessing fuel-switching investment in long-term energy transitions of the India’s industry sector. Appl. Energy 2020, 274, 115295. [Google Scholar] [CrossRef]
  40. Maji, P.; Kandlikar, M. Quantifying the air quality, climate and equity implications of India’s household energy transition. Energy Sustain. Dev. 2020, 55, 37–47. [Google Scholar] [CrossRef]
  41. Harrington, E.; Athavankar, A.; Hsu, D. Variation in rural household energy transitions for basic lighting in India. Renew. Sustain. Energy Rev. 2020, 119, 109568. [Google Scholar] [CrossRef]
  42. Irfan, M.; Elavarasan, R.M.; Hao, Y.; Feng, M.; Sailan, D. An assessment of consumers’ willingness to utilize solar energy in China: End-users’ perspective. J. Clean. Prod. 2021, 292, 126008. [Google Scholar] [CrossRef]
  43. Pandey, P.; Sharma, A. Knowledge politics, vulnerability and recognition-based justice: Public participation in renewable energy transitions in India. Energy Res. Soc. Sci. 2021, 71, 101824. [Google Scholar] [CrossRef]
  44. Shidore, S.; Busby, J.W. What explains India’s embrace of solar? State-led energy transition in a developmental polity. Energy Policy 2019, 129, 1179–1189. [Google Scholar] [CrossRef]
  45. Yadav, P.; Davies, P.J.; Abdullah, S. Reforming capital subsidy scheme to finance energy transition for the below poverty line communities in rural India. Energy Sustain. Dev. 2018, 45, 11–27. [Google Scholar] [CrossRef]
  46. Gulagi, A.; Bogdanov, D.; Breyer, C. The Demand for Storage Technologies in Energy Transition Pathways Towards 100% Renewable Energy for India. Energy Procedia 2017, 135, 37–50. [Google Scholar] [CrossRef]
  47. Gulagi, A.; Bogdanov, D.; Breyer, C. The role of storage technologies in energy transition pathways towards achieving a fully sustainable energy system for India. J. Energy Storage 2018, 17, 525–539. [Google Scholar] [CrossRef]
  48. Jain, S.; Kumar Jain, N.; Choudhary, P.; Vaughn, W. Designing terawatt scale renewable electricity system: A dynamic analysis for India. Energy Strateg. Rev. 2021, 38, 100753. [Google Scholar] [CrossRef]
  49. Moallemi, E.A.; de Haan, F.; Kwakkel, J.; Aye, L. Narrative-informed exploratory analysis of energy transition pathways: A case study of India’s electricity sector. Energy Policy 2017, 110, 271–287. [Google Scholar] [CrossRef]
  50. Reddy, B.S. India’s energy system transition—Survival of the greenest. Renew. Energy 2016, 92, 293–302. [Google Scholar] [CrossRef]
  51. Deshwal, D.; Sangwan, P.; Dahiya, N. How will COVID-19 impact renewable energy in India? Exploring challenges, lessons and emerging opportunities. Energy Res. Soc. Sci. 2021, 77, 102097. [Google Scholar] [CrossRef]
  52. Shekhar, J.; Suri, D.; Somani, P.; Lee, S.J.; Arora, M. Reduced renewable energy stability in India following COVID-19: Insights and key policy recommendations. Renew. Sustain. Energy Rev. 2021, 144, 111015. [Google Scholar] [CrossRef]
  53. Madurai Elavarasan, R.; Shafiullah, G.; Raju, K.; Mudgal, V.; Arif, M.T.; Jamal, T.; Subramanian, S.; Sriraja Balaguru, V.S.; Reddy, K.S.; Subramaniam, U. COVID-19: Impact analysis and recommendations for power sector operation. Appl. Energy 2020, 279, 115739. [Google Scholar] [CrossRef] [PubMed]
  54. Chaturvedi, V. A vision for a net-zero energy system for India. Energy Clim. Chang. 2021, 2, 100056. [Google Scholar] [CrossRef]
  55. Mottaleb, K.A.; Rahut, D.B. Clean energy choice and use by the urban households in India: Implications for sustainable energy for all. Environ. Chall. 2021, 5, 100254. [Google Scholar] [CrossRef]
  56. Sahani, N. Application of hybrid SWOT-AHP-FuzzyAHP model for formulation and prioritization of ecotourism strategies in Western Himalaya, India. Int. J. Geoheritage Park. 2021, 9, 349–362. [Google Scholar] [CrossRef]
  57. Lee, J.; Kim, I.; Kim, H.; Kang, J. SWOT-AHP analysis of the Korean satellite and space industry: Strategy recommendations for development. Technol. Forecast. Soc. Chang. 2021, 164, 120515. [Google Scholar] [CrossRef]
  58. Lee, Y.; Kim, Y.J.; Lee, M.C. Improving public acceptance of H2 stations: SWOT-AHP analysis of South Korea. Int. J. Hydrog. Energy 2021, 46, 17597–17607. [Google Scholar] [CrossRef]
  59. Solangi, Y.A.; Tan, Q.; Mirjat, N.H.; Ali, S. Evaluating the strategies for sustainable energy planning in Pakistan: An integrated SWOT-AHP and Fuzzy-TOPSIS approach. J. Clean. Prod. 2019, 236, 117655. [Google Scholar] [CrossRef]
  60. Saaty, T.L. A scaling method for priorities in hierarchical structures. J. Math. Psychol. 1977, 15, 234–281. [Google Scholar] [CrossRef]
  61. Abedi, M.; Ali Torabi, S.; Norouzi, G.-H.; Hamzeh, M.; Elyasi, G.-R. PROMETHEE II: A knowledge-driven method for copper exploration. Comput. Geosci. 2012, 46, 255–263. [Google Scholar] [CrossRef]
  62. Palczewski, K.; Sałabun, W. Influence of various normalization methods in PROMETHEE II: An empirical study on the selection of the airport location. Procedia Comput. Sci. 2019, 159, 2051–2060. [Google Scholar] [CrossRef]
  63. Andreopoulou, Z.; Koliouska, C.; Galariotis, E.; Zopounidis, C. Renewable energy sources: Using PROMETHEE II for ranking websites to support market opportunities. Technol. Forecast. Soc. Chang. 2018, 131, 31–37. [Google Scholar] [CrossRef]
  64. Ministry of New and Renewable Energy. Solar Energy. 2021. Available online: https://mnre.gov.in/solar/current-status/ (accessed on 5 January 2022).
  65. Ministry of New and Renewable Energy. Wind Energy. 2021. Available online: https://mnre.gov.in/wind/current-status/ (accessed on 5 January 2022).
  66. Praxisga. How India’s Power Sector Will Rebound from COVID-19 Crisis. 2020. Available online: https://www.praxisga.com/PraxisgaImages/ReportImg/how-india-s-power-sector-will-rebound-from-covid-19-crisis-Report-3.pdf (accessed on 6 January 2022).
  67. IEA. India 2020 Energy Policy Review. 2020. Available online: https://www.iea.org/reports/india-2020 (accessed on 7 January 2022).
  68. Elavarasan, R.M.; Shafiullah, G.M.; Padmanaban, S.; Kumar, N.M.; Annam, A.; Vetrichelvan, A.M.; Mihet-Popa, L.; Holm-Nielsen, J.B. A Comprehensive Review on Renewable Energy Development, Challenges, and Policies of Leading Indian States with an International Perspective. IEEE Access 2020, 8, 74432–74457. [Google Scholar] [CrossRef]
  69. Eren, B.M.; Taspinar, N.; Gokmenoglu, K.K. The impact of financial development and economic growth on renewable energy consumption: Empirical analysis of India. Sci. Total Environ. 2019, 663, 189–197. [Google Scholar] [CrossRef]
  70. IEA. India Energy Outlook 2021. 2021. Available online: https://www.iea.org/reports/india-energy-outlook-2021 (accessed on 7 January 2022).
  71. Nepal, R.; Paija, N.; Tyagi, B.; Harvie, C. Energy security, economic growth and environmental sustainability in India: Does FDI and trade openness play a role? J. Environ. Manag. 2021, 281, 111886. [Google Scholar] [CrossRef]
  72. Boddapati, V.; Nandikatti, A.S.R. Salient features of the national power grid and its management during an emergency: A case study in India. Energy Sustain. Dev. 2020, 59, 170–179. [Google Scholar] [CrossRef]
  73. Jayanth, K.G.; Boddapati, V.; Geetha, R.S. Comparative study between three-leg and four-leg current-source inverter for solar PV application. In Proceedings of the 2018 International Conference on Power, Instrumentation, Control and Computing (PICC), Thrissur, India, 18–20 January 2018; pp. 1–6. [Google Scholar]
  74. Power Grid Corporation of India. One Nation One Grid. 2021. Available online: https://www.powergrid.in/ (accessed on 8 January 2022).
  75. IEA. Data and Statistics. 2021. Available online: https://www.iea.org/data-and-statistics/data-browser?country=INDIA&fuel=Energy%20supply&indicator=TESbySource (accessed on 9 January 2022).
  76. Nouni, M.R.; Jha, P.; Sarkhel, R.; Banerjee, C.; Tripathi, A.K.; Manna, J. Alternative fuels for decarbonisation of road transport sector in India: Options, present status, opportunities, and challenges. Fuel 2021, 305, 121583. [Google Scholar] [CrossRef]
  77. Petroleum Planning & Analysis Cell. Import/Export. Available online: https://www.ppac.gov.in/content/212_1_ImportExport.aspx (accessed on 9 January 2022).
  78. Madurai Elavarasan, R.; Pugazhendhi, R.; Irfan, M.; Mihet-Popa, L.; Campana, P.E.; Khan, I.A. A novel Sustainable Development Goal 7 composite index as the paradigm for energy sustainability assessment: A case study from Europe. Appl. Energy 2022, 307, 118173. [Google Scholar] [CrossRef]
  79. Kumar, R.; Das, S.K.; Nayak, S.; Paswan, M. Achintya Sustainable energy security of India based on energy supply. Mater. Today Proc. 2021, 46, 6805–6811. [Google Scholar] [CrossRef]
  80. Madurai Elavarasan, R.; Afridhis, S.; Vijayaraghavan, R.R.; Subramaniam, U.; Nurunnabi, M. SWOT analysis: A framework for comprehensive evaluation of drivers and barriers for renewable energy development in significant countries. Energy Rep. 2020, 6, 1838–1864. [Google Scholar] [CrossRef]
  81. IEA. Power System Flexibility Will Be Essential for India to Reach Its Renewable Energy Targets. 2021. Available online: https://www.iea.org/commentaries/power-system-flexibility-will-be-essential-for-india-to-reach-its-renewable-energy-targets (accessed on 9 January 2022).
  82. Saxena, S.N. SWOT Analysis of Indian Power System. Int. J. Electr. Eng. Technol. 2019, 9, 15–17. [Google Scholar]
  83. J Kay, Tangled Wires: Preparing India’s Power Sector for the Clean Energy Transition. 2021. Available online: https://carnegieendowment.org/2021/08/04/tangled-wires-preparing-india-s-power-sector-for-clean-energy-transition-pub-85072 (accessed on 13 January 2022).
  84. IISD. Mapping India’s Energy Subsidies 2020: Fossil Fuels, Renewables, and Electric Vehicles. 2020. Available online: https://www.iisd.org/system/files/publications/india-energy-transition-2020.pdf (accessed on 10 January 2022).
  85. CEEW. State of Electricity Access in India. 2020. Available online: https://www.ceew.in/publications/state-electricity-access-india (accessed on 10 January 2022).
  86. Goel, S.; Sharma, R.; Rathore, A.K. A review on barrier and challenges of electric vehicle in India and vehicle to grid optimisation. Transp. Eng. 2021, 4, 100057. [Google Scholar] [CrossRef]
  87. Kumar, A. Beyond technical smartness: Rethinking the development and implementation of sociotechnical smart grids in India. Energy Res. Soc. Sci. 2019, 49, 158–168. [Google Scholar] [CrossRef]
  88. IRENA. Renewable Power Generation Costs in 2020. 2021. Available online: https://www.irena.org/publications/2021/Jun/Renewable-Power-Costs-in-2020 (accessed on 11 January 2022).
  89. Energy Transition. India’s Energy Transition and Power System: The Good, the Bad, the Ugly. 2021. Available online: https://energytransition.org/2021/03/indias-energy-transition-and-power-system-acrobatics-the-good-the-bad-the-ugly/ (accessed on 11 January 2022).
  90. Fuerst, F.; Singh, R. How present bias forestalls energy efficiency upgrades: A study of household appliance purchases in India. J. Clean. Prod. 2018, 186, 558–569. [Google Scholar] [CrossRef]
  91. Sahoo, S.K.; Varma, P.; Lall, K.P.; Talwar, C.K. Energy efficiency in India: Achievements, challenges and legality. Energy Policy 2016, 88, 495–503. [Google Scholar] [CrossRef]
  92. Chandel, S.S.; Sharma, A.; Marwaha, B.M. Review of energy efficiency initiatives and regulations for residential buildings in India. Renew. Sustain. Energy Rev. 2016, 54, 1443–1458. [Google Scholar] [CrossRef]
  93. Sahoo, N.R.; Mohapatra, P.K.J.; Sahoo, B.K.; Mahanty, B. Rationality of energy efficiency improvement targets under the PAT scheme in India—A case of thermal power plants. Energy Econ. 2017, 66, 279–289. [Google Scholar] [CrossRef]
  94. Abhyankar, N.; Phadke, A. Impact of large-scale energy efficiency programs on utility finances and consumer tariffs in India. Energy Policy 2012, 43, 308–326. [Google Scholar] [CrossRef]
  95. Maciejowska, K. Assessing the impact of renewable energy sources on the electricity price level and variability—A quantile regression approach. Energy Econ. 2020, 85, 104532. [Google Scholar] [CrossRef]
  96. Jafari, M.; Korpås, M.; Botterud, A. Power system decarbonization: Impacts of energy storage duration and interannual renewables variability. Renew. Energy 2020, 156, 1171–1185. [Google Scholar] [CrossRef]
  97. Beaudin, M.; Zareipour, H.; Schellenberglabe, A.; Rosehart, W. Energy storage for mitigating the variability of renewable electricity sources: An updated review. Energy Sustain. Dev. 2010, 14, 302–314. [Google Scholar] [CrossRef]
  98. Kumar, N.M.; Chopra, S.S.; Chand, A.A.; Elavarasan, R.M.; Shafiullah, G.M. Hybrid Renewable Energy Microgrid for a Residential Community: A Techno-Economic and Environmental Perspective in the Context of the SDG7. Sustainability 2020, 12, 3944. [Google Scholar] [CrossRef]
  99. CEEW. Filling the Skill Gap in India’s Clean Energy Market. 2016. Available online: https://www.ceew.in/publications/filling-skill-gap-india%E2%80%99s-clean-energy-market (accessed on 12 January 2022).
  100. World Economic Forum. Russia Is the World’s Largest Exporter of Petroleum Products—But What Exactly Are They? 2022. Available online: https://www.weforum.org/agenda/2022/04/which-petroleum-products-does-russia-supply-to-world/ (accessed on 13 April 2022).
Figure 1. Research methodology of the proposed study.
Sustainability 14 04940 g001
Figure 2. The energy mix of India. Data source: [75].
Sustainability 14 04940 g002
Figure 3. Results of SWOT–fuzzy AHP analysis.
Sustainability 14 04940 g003
Table 1. Conversion score for various degrees of support.
Degree of SupportConversion Score
No support0
Very low support1
Low support2
Medium support3
High support4
Very high support5
Table 2. SWOT factors.
StrengthsWeaknesses
S1High solar and wind energy potential as well as increasing preferenceW1Large amounts of energy imports
S2Slowdown in the investments and dependency on thermal power plantsW2Inflexibility of current grid infrastructure
S3Renewable energy sector remains coupled to economic growthW3Politically compromised and poor financial position of the power sector
S4Energy sector is favorable to attracting foreign and private investmentsW4Lack of long-term vision and focus on short-term fixation
S5One nationalized grid and diverse energy mixW5Lack of optimized utilization of existing-generation capacity and large demand–supply gap
OpportunitiesThreats
O1Connecting households to electricity and electrifying the transportation sectorT1Coordinating with the variability of the renewable energy sources
O2Upgrading transmission infrastructure developmentT2Hike in electricity prices and losses in power sector companies
O3Utilizing the cost-competitive advantage of solar and wind energy over fossil fuelsT3Disparate political approaches in states without a common energy policy
O4Developing a transparent and proper regulatory frameworkT4Inadequacy of manpower having specialized skillsets
O5Improve energy efficiency in terms of supply, transmission, and demandT5Skewed energy tariff structure
Table 3. Decision matrix of the strengths category.
S1S2S3S4S5
S116945
S20.17130.330.50
S30.110.3310.200.33
S40.253513
S50.20230.331
Table 4. Decision matrix of the weaknesses category.
W1W2W3W4W5
W110.500.2531
W2210.3352
W343164
W40.330.200.1710.33
W510.500.2531
Table 5. Decision matrix of the opportunities category.
O1O2O3O4O5
O1130.5024
O20.3310.330.502
O323134
O40.5020.3313
O50.250.500.250.331
Table 6. Decision matrix of the threats category.
T1T2T3T4T5
T11110.330.50
T21110.330.50
T31110.330.50
T433312
T52220.501
Table 7. Decision matrix of the SWOT category.
StrengthsWeaknessesOpportunitiesThreats
Strengths10.500.330.33
Weaknesses210.330.33
Opportunities3312
Threats330.501
Table 8. SWOT–fuzzy AHP weights.
SWOT FactorsFactor WeightsSWOT WeightsAggregated WeightsRank
S10.53730.11010.05917
S20.08680.009518
S30.04160.004620
S40.21990.024214
S50.11440.012617
W10.12880.14780.019015
W20.22500.033312
W30.46620.06896
W40.05110.007619
W50.12880.019015
O10.27420.42560.11673
O20.11160.04758
O30.37510.15961
O40.17030.07255
O50.06880.029313
T10.12440.31650.03949
T20.12440.03949
T30.12440.03949
T40.38520.12192
T50.24170.07654
Table 9. Decision matrix of the strategies for PROMETHEE analysis.
S1S2S3S4S5W1W2W3W4W5O1O2O3O4O5T1T2T3T4T5
ST103150005302433004102
ST230104443243202242500
ST324010000200043000030
ST450000400303253020102
ST513130234515455313514
ST600004030252402540001
ST703110010022231210050
ST830024050355302351201
ST953034550344552042003
ST1055130400403254130401
ST1140000301310041400000
ST1210000300205042000200
ST1340043330542243140301
ST1454121520444154342403
ST1530031330244241450102
Table 10. Results of PROMETHEE analysis.
StrategiesLeaving FlowEntering FlowNet Outranking FlowRank
ST10.19940.2072−0.00788
ST20.17280.2306−0.057810
ST30.12600.2772−0.151313
ST40.15460.14580.00887
ST50.38960.07320.31641
ST60.10020.2932−0.193014
ST70.16820.2594−0.091111
ST80.17630.2169−0.04069
ST90.27070.08450.18623
ST100.19840.11830.08014
ST110.08260.2812−0.198715
ST120.10190.2229−0.121012
ST130.15640.13220.02426
ST140.27800.06930.20882
ST150.16850.13170.03685
Publisher’s Note: MDPI stays neutral with regard to jurisdictional claims in published maps and institutional affiliations.

