
Differential Impacts of Climatic and Land Use Changes on Habitat Suitability and Protected Area Adequacy across the Asian Elephant’s Range


 ,
, 

 , and
, and
Abstract
:1. Introduction
2. Materials and Methods
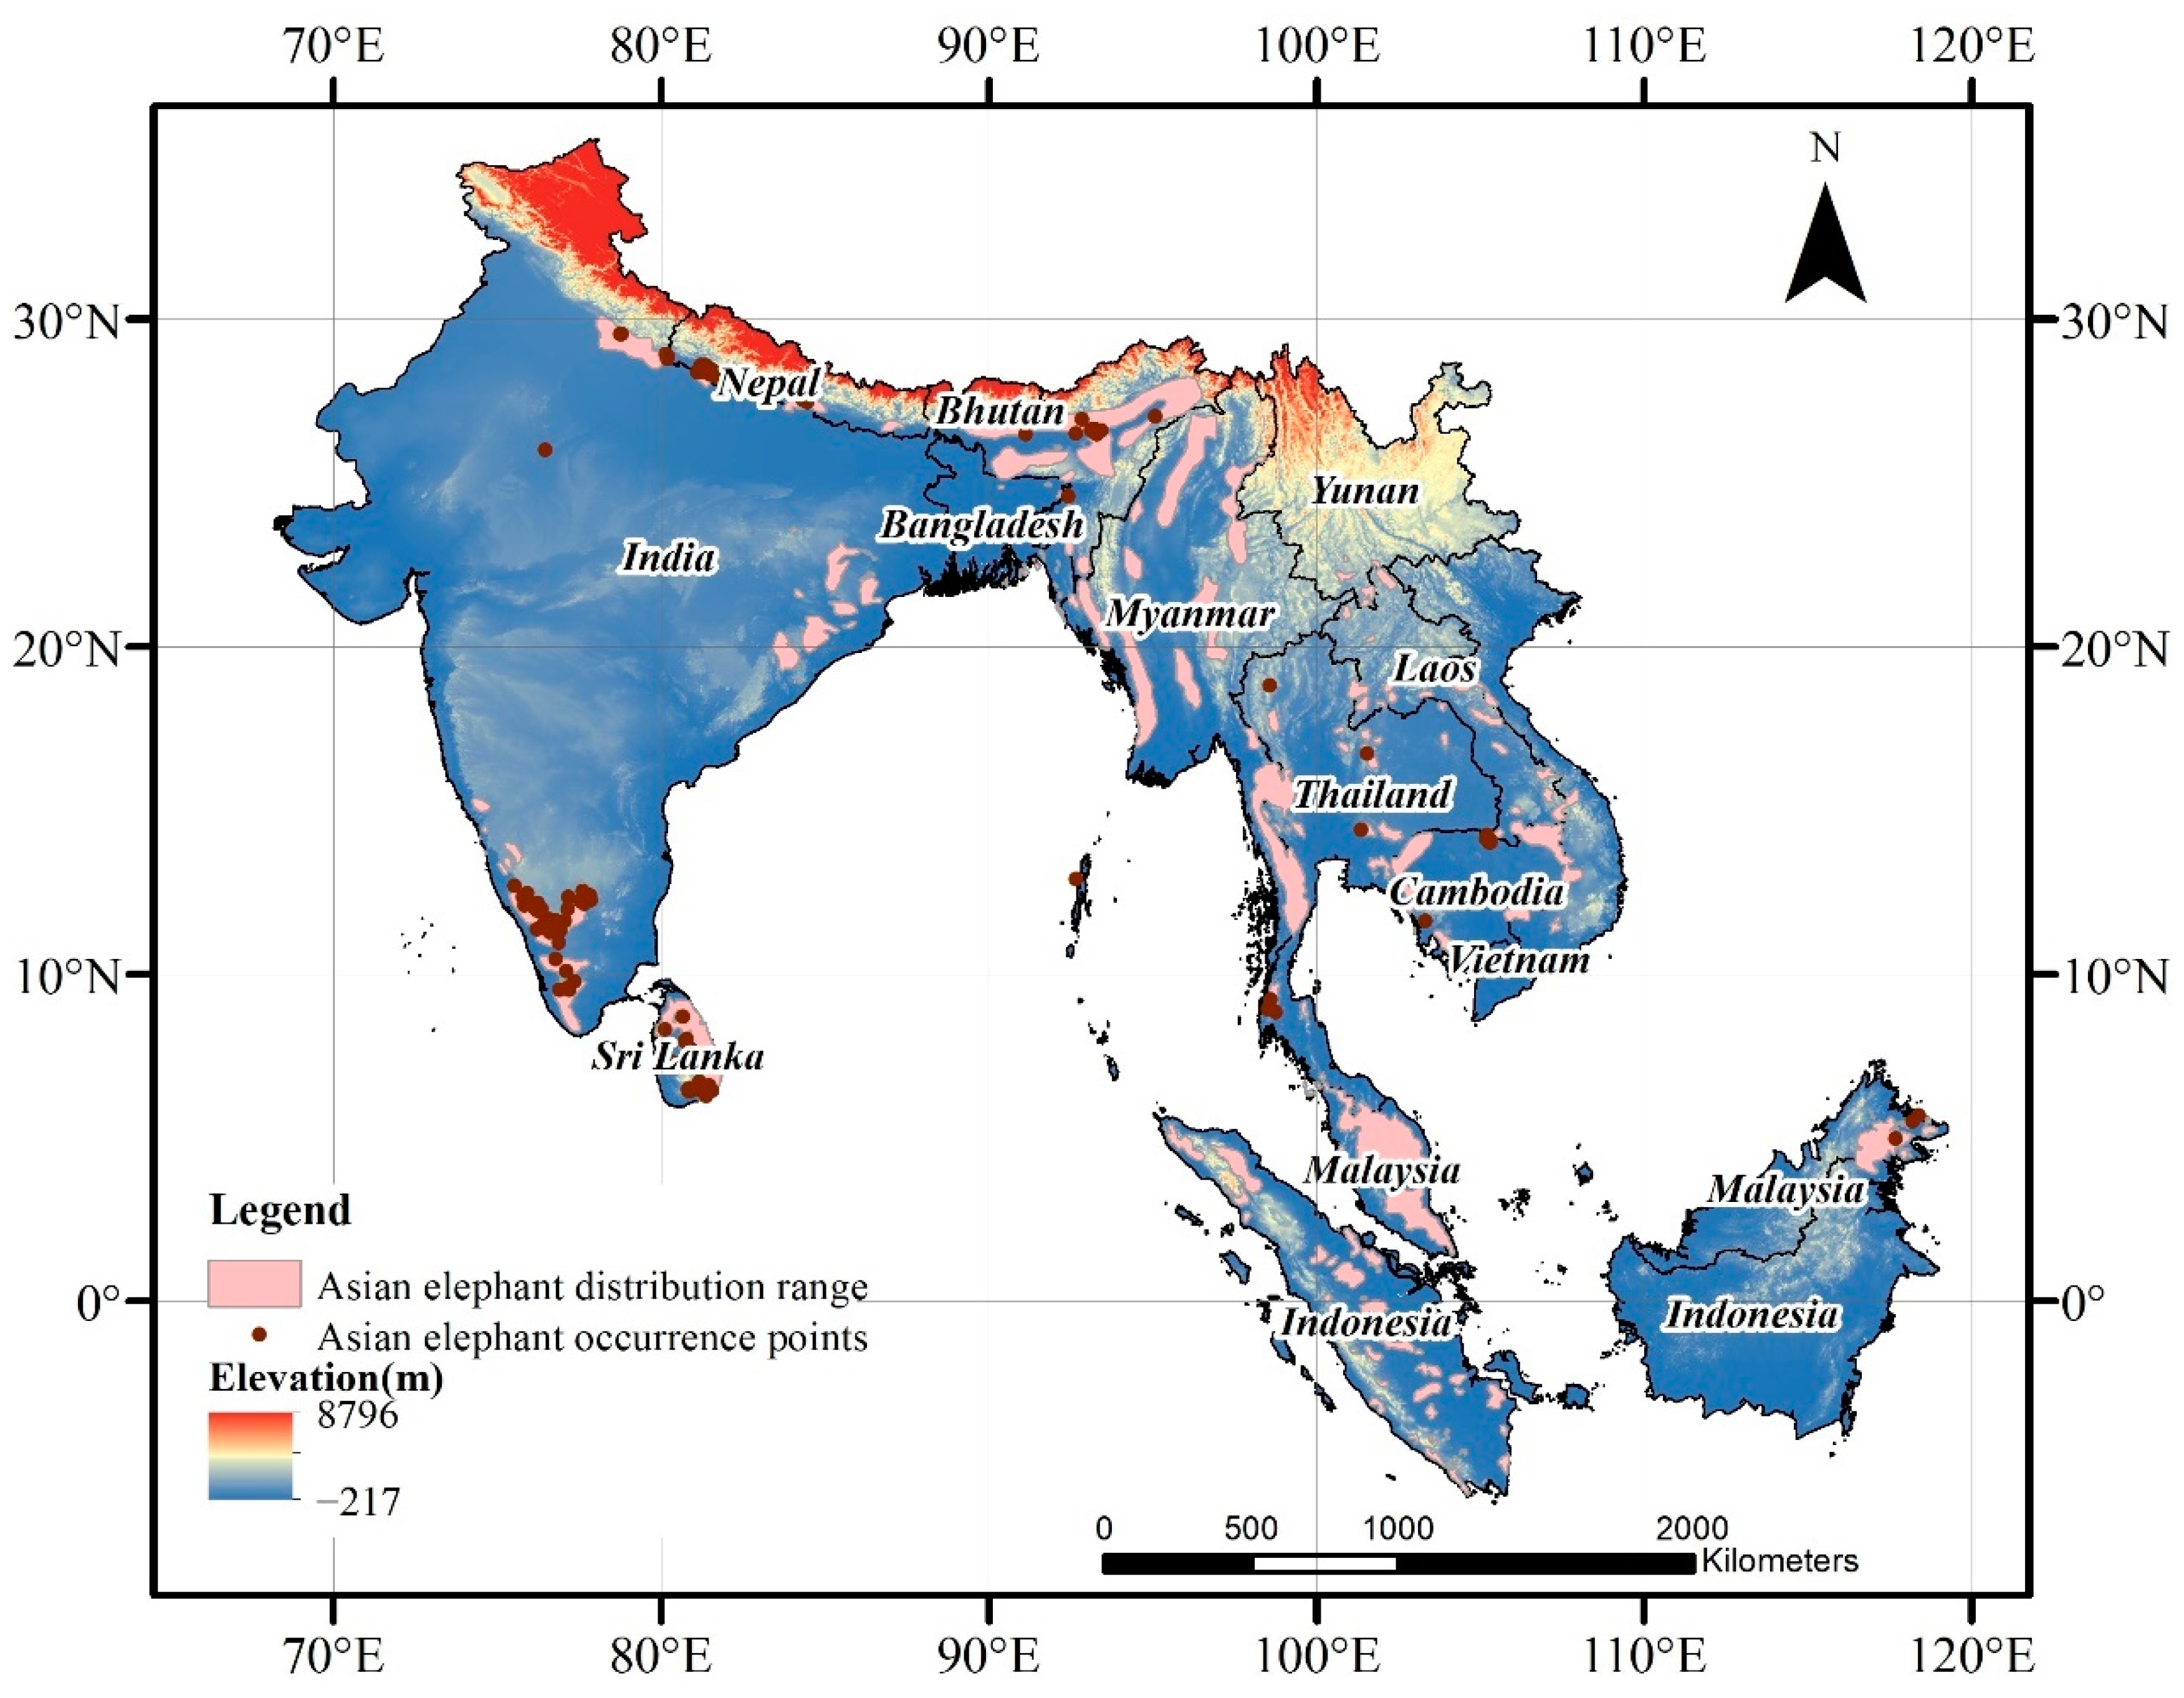
2.1. Study Area
2.2. Elephant Occurrence Data
2.3. Model Variables
2.3.1. Topography
2.3.2. Vegetation Variables
2.3.3. Anthropogenic Variables
2.3.4. Climatic Variables
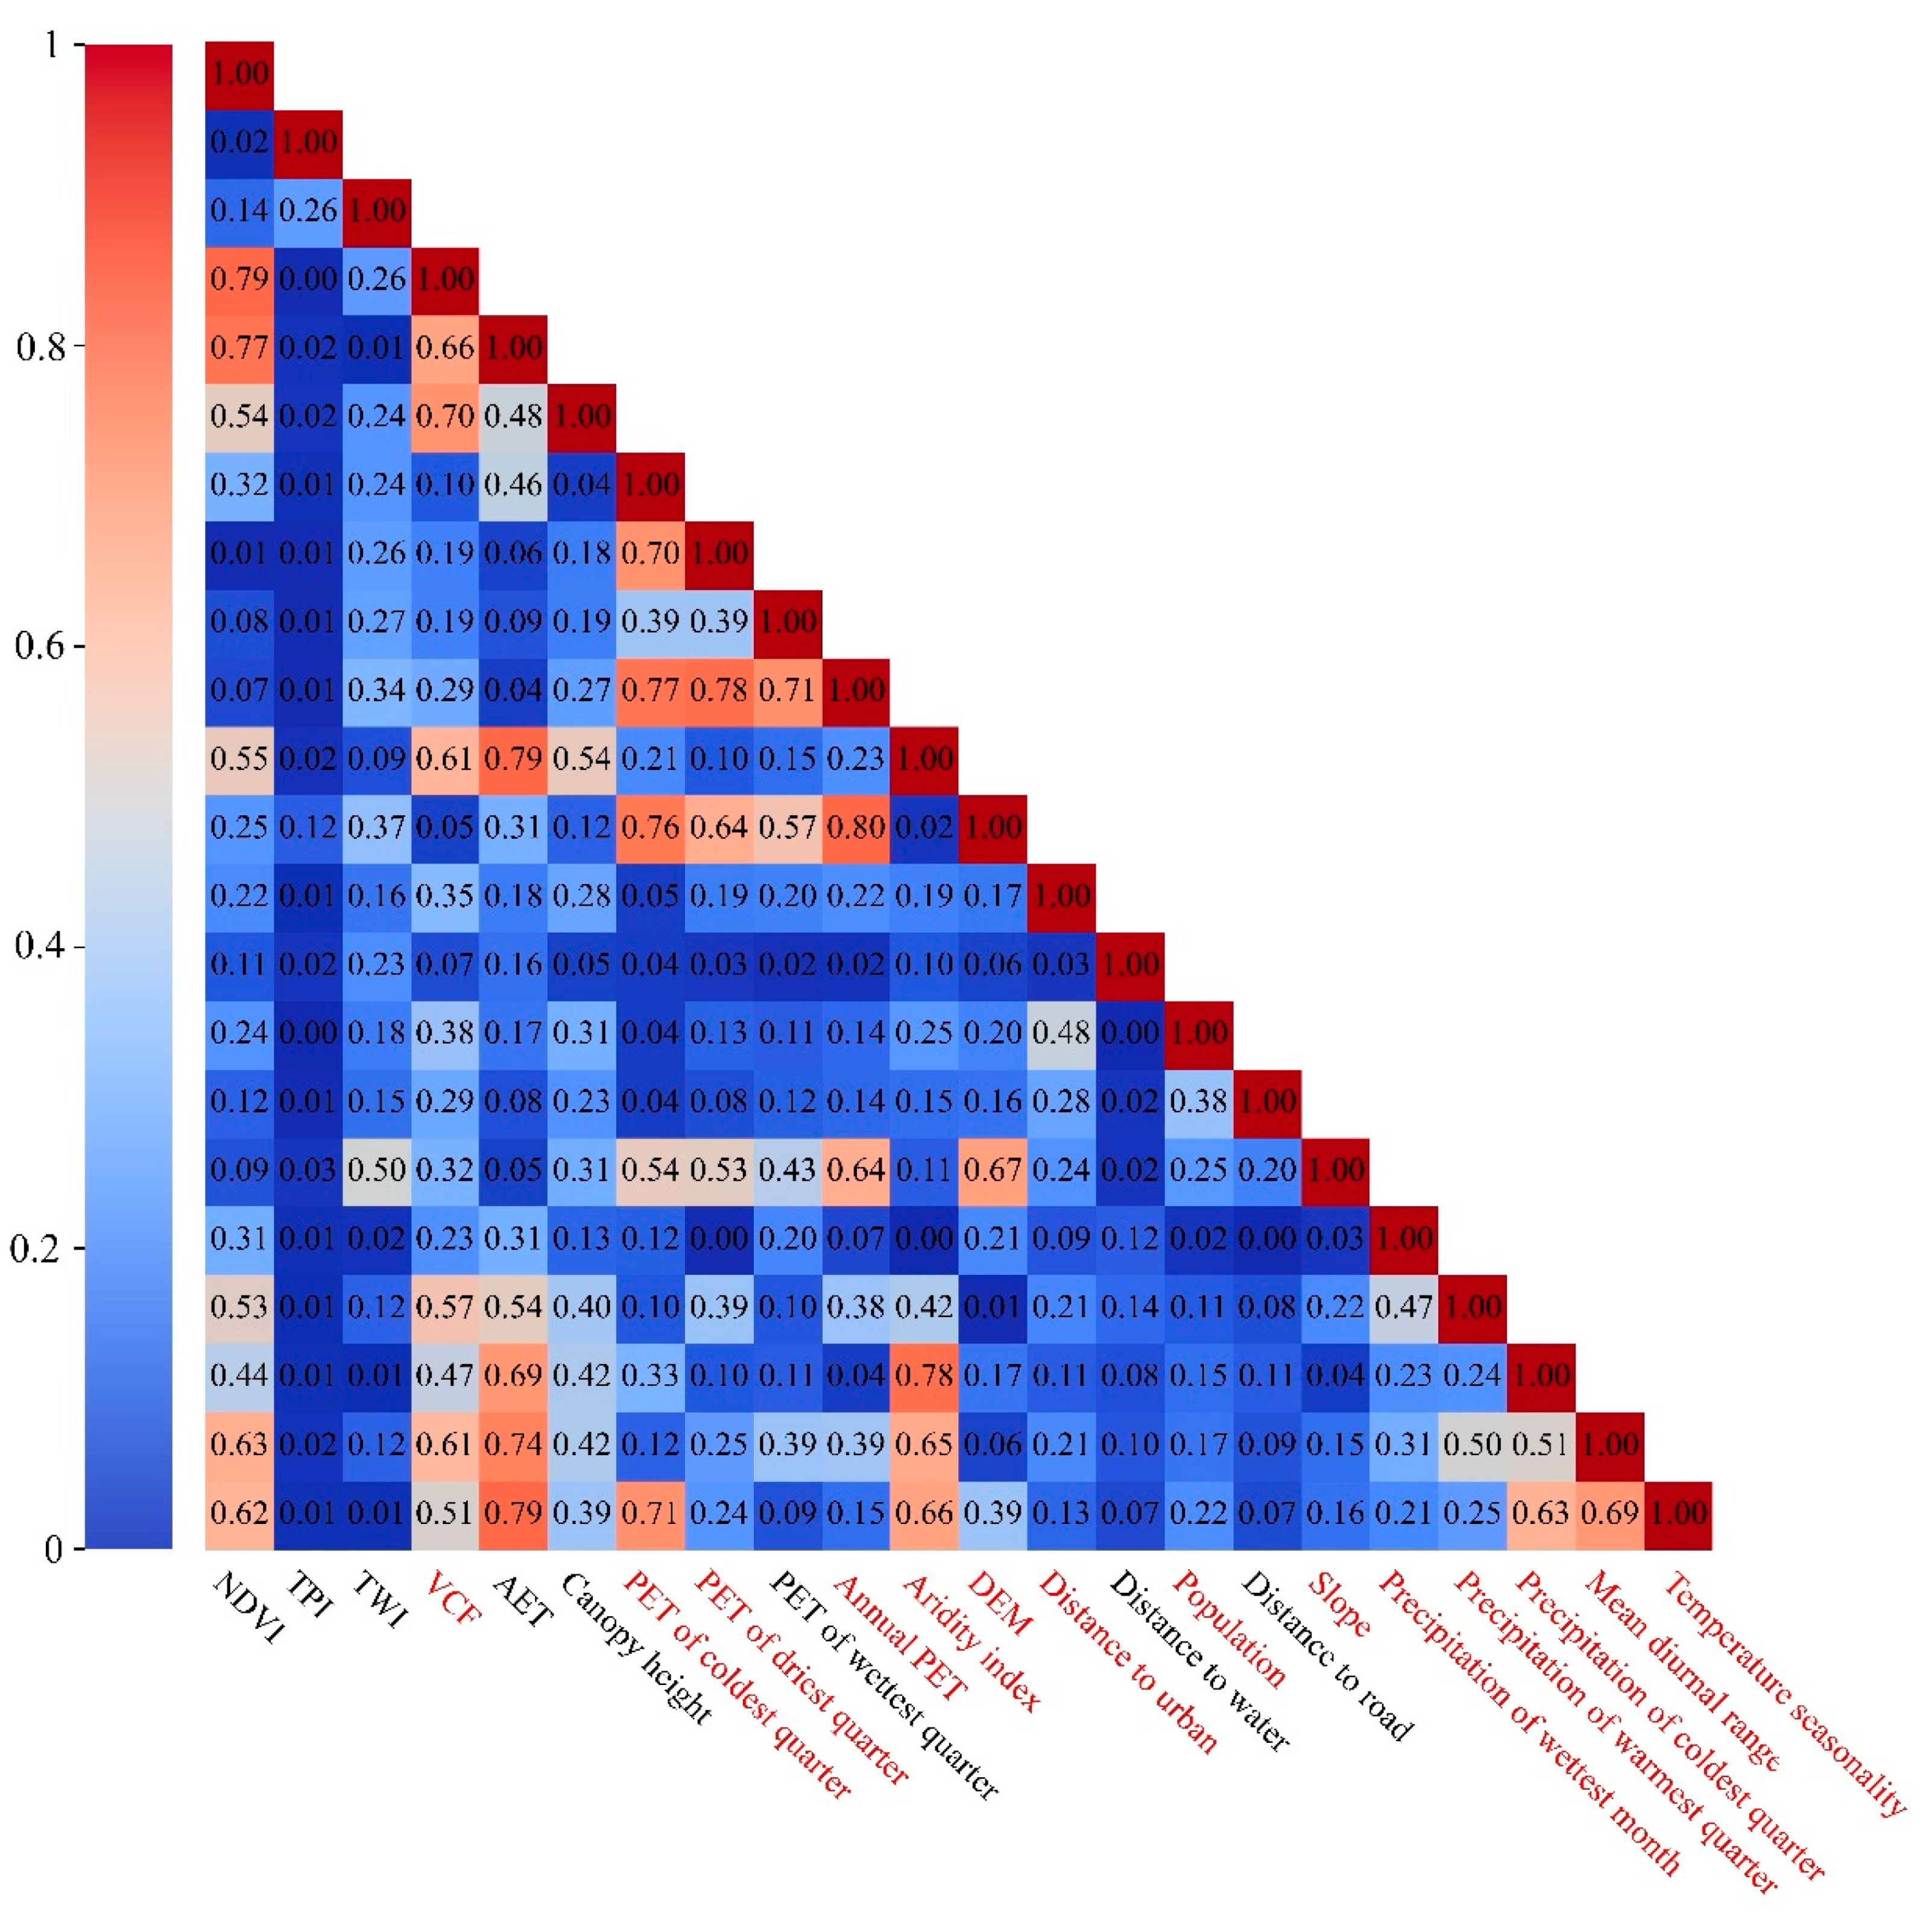
2.3.5. Variable Selection
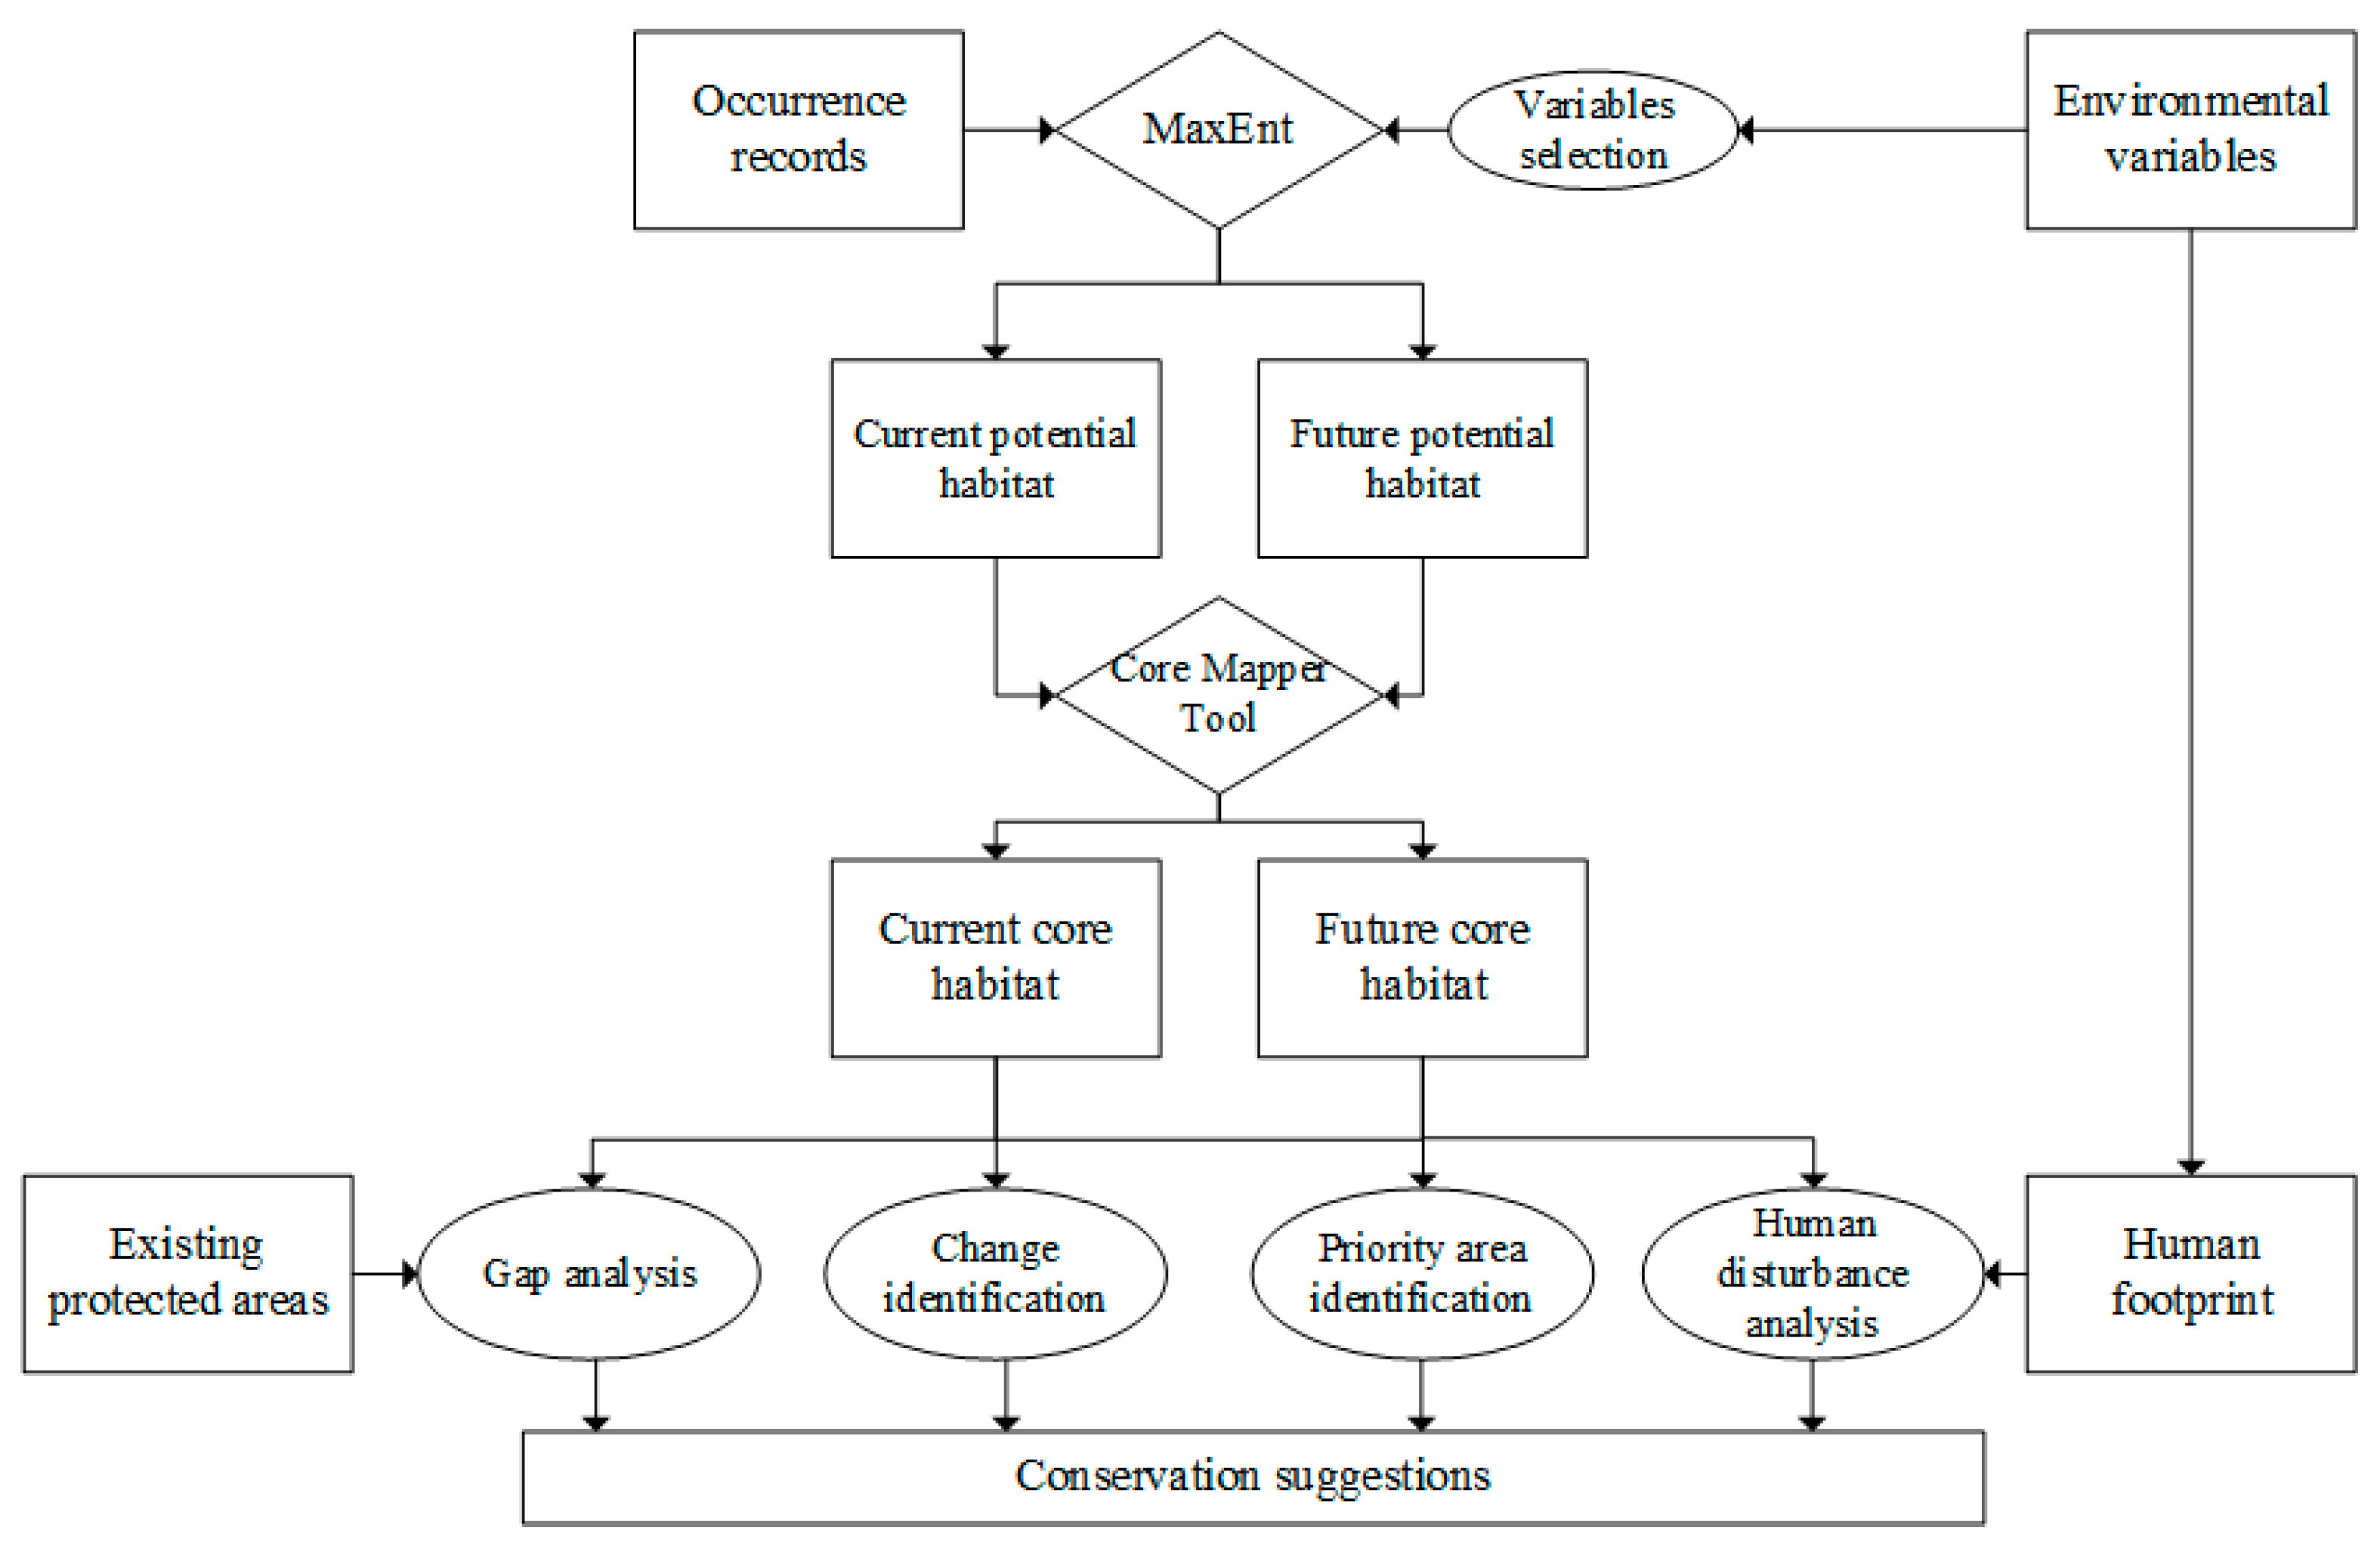
2.4. Species Distribution Modeling and Evaluation
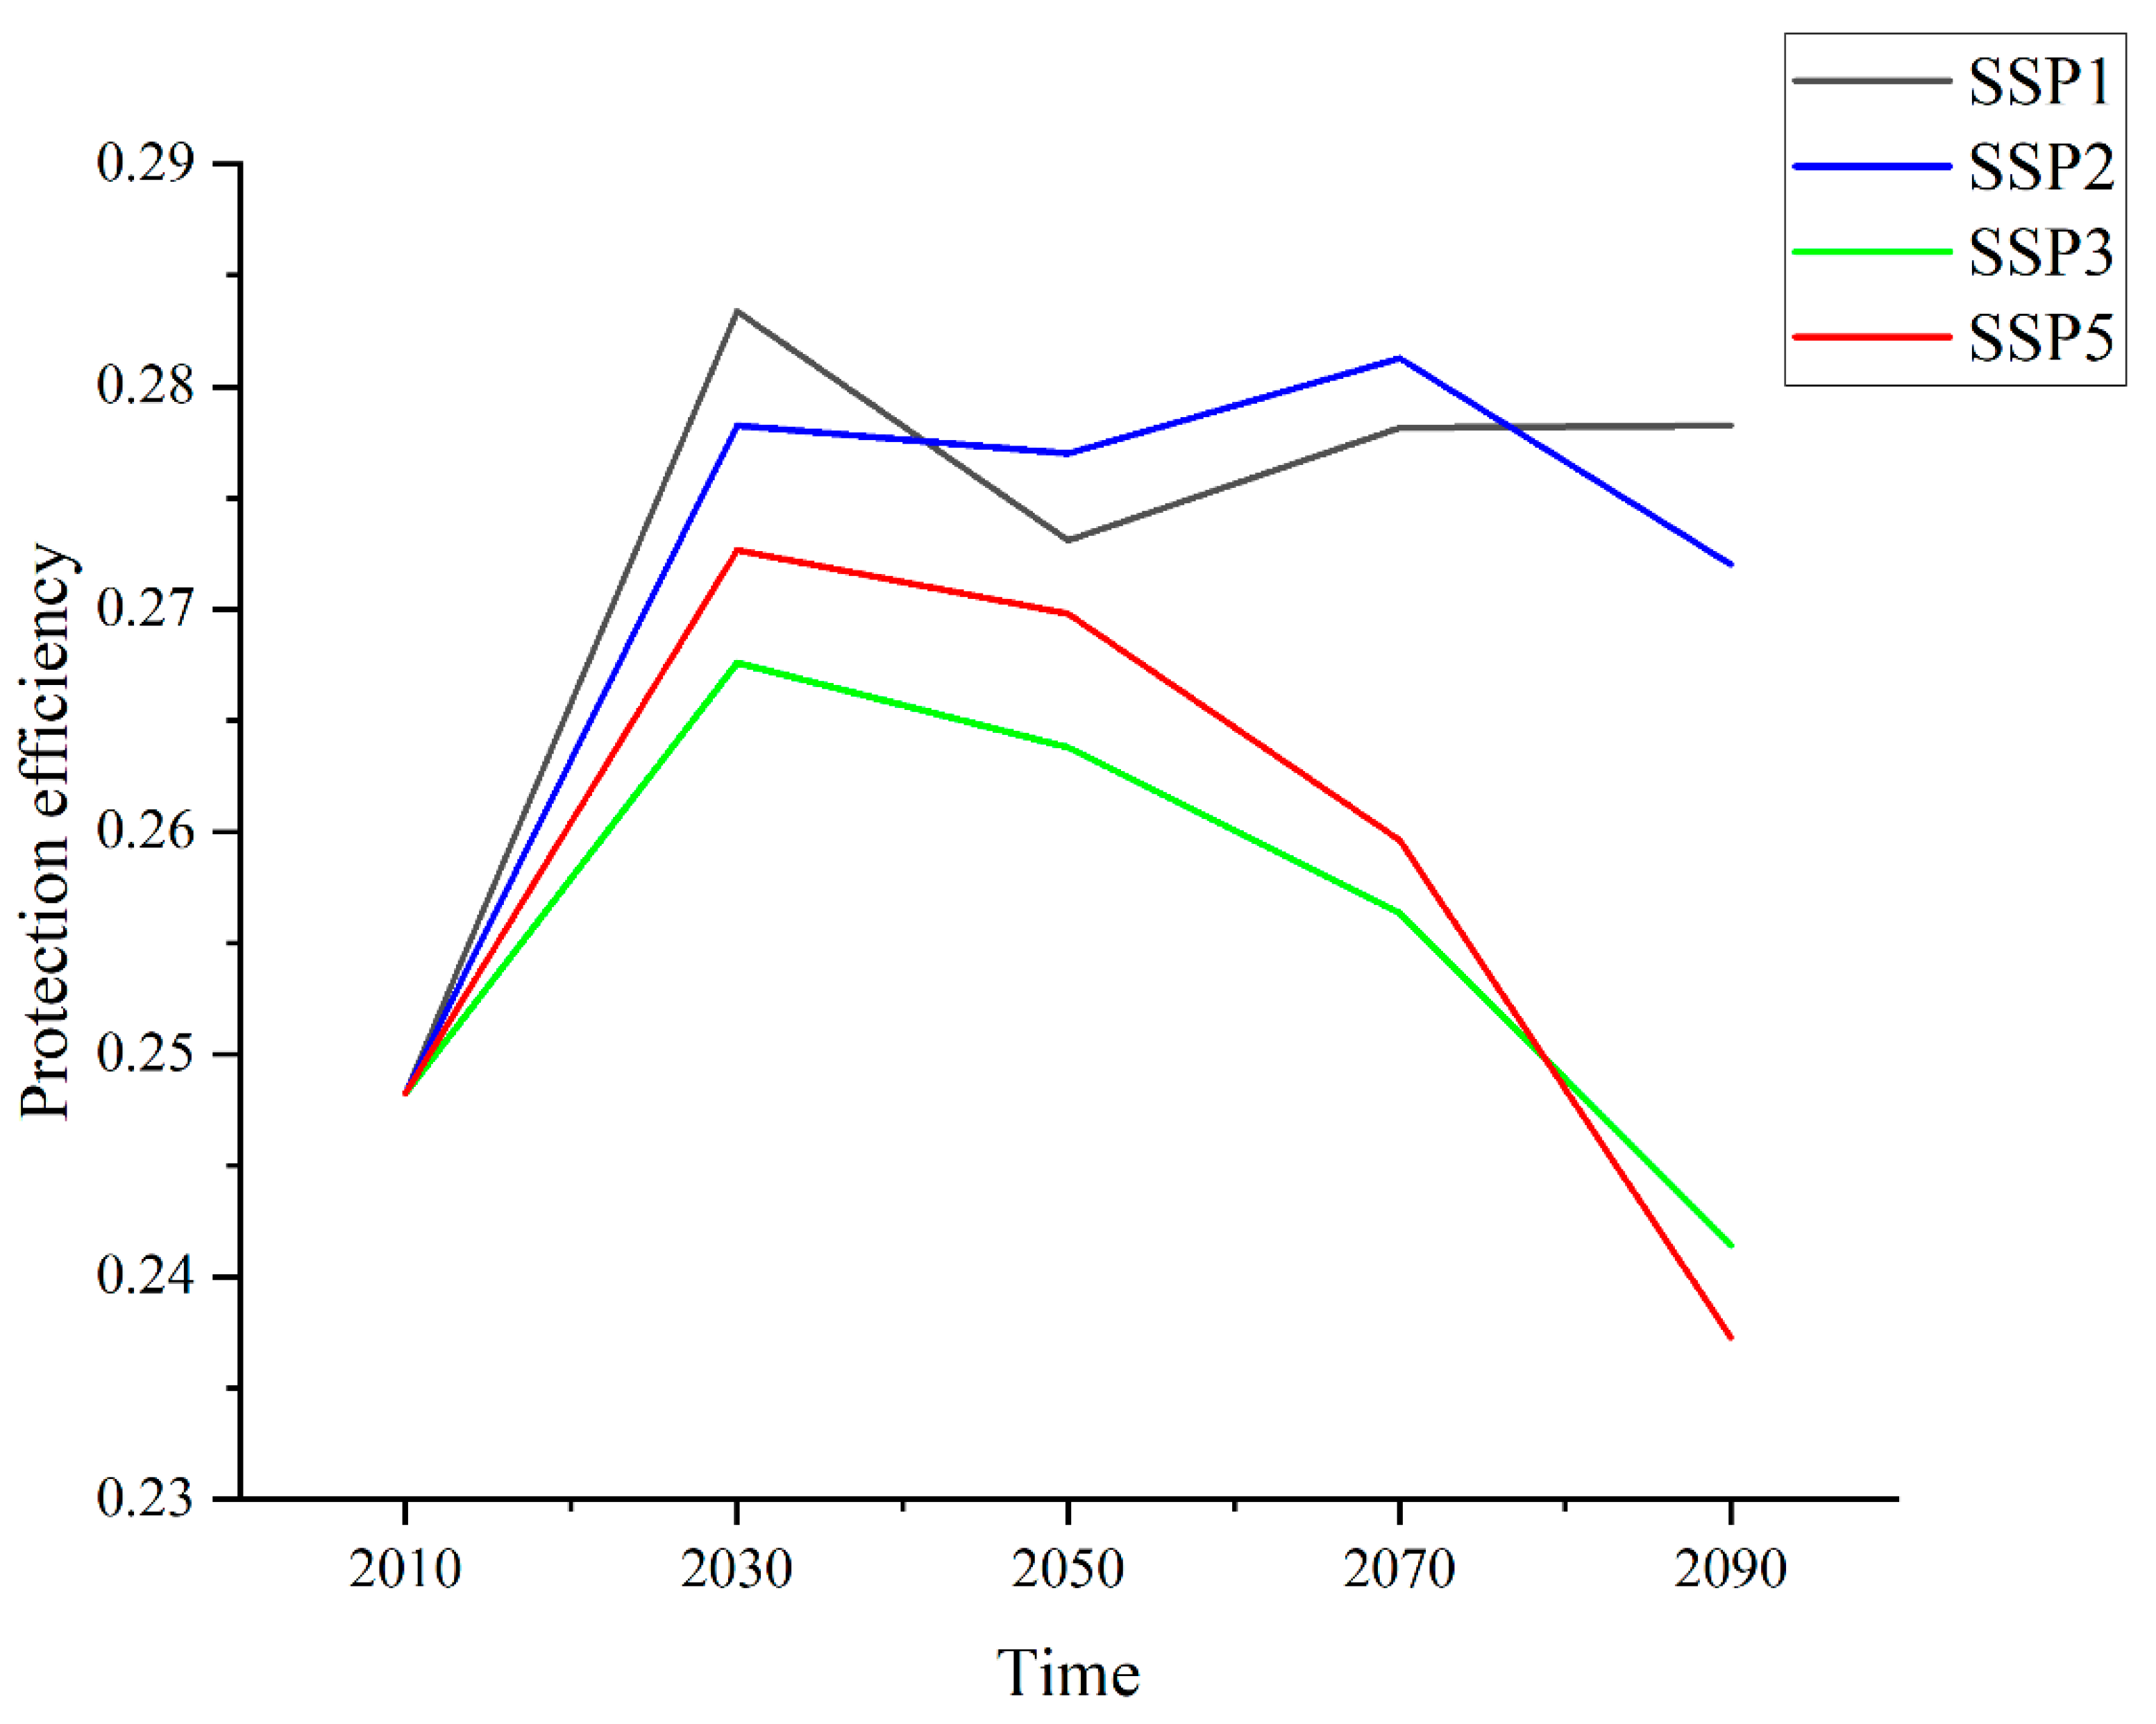
2.5. Projecting Future Potential Habitat
2.6. Assessing Disturbance and Protection in the Core Habitat
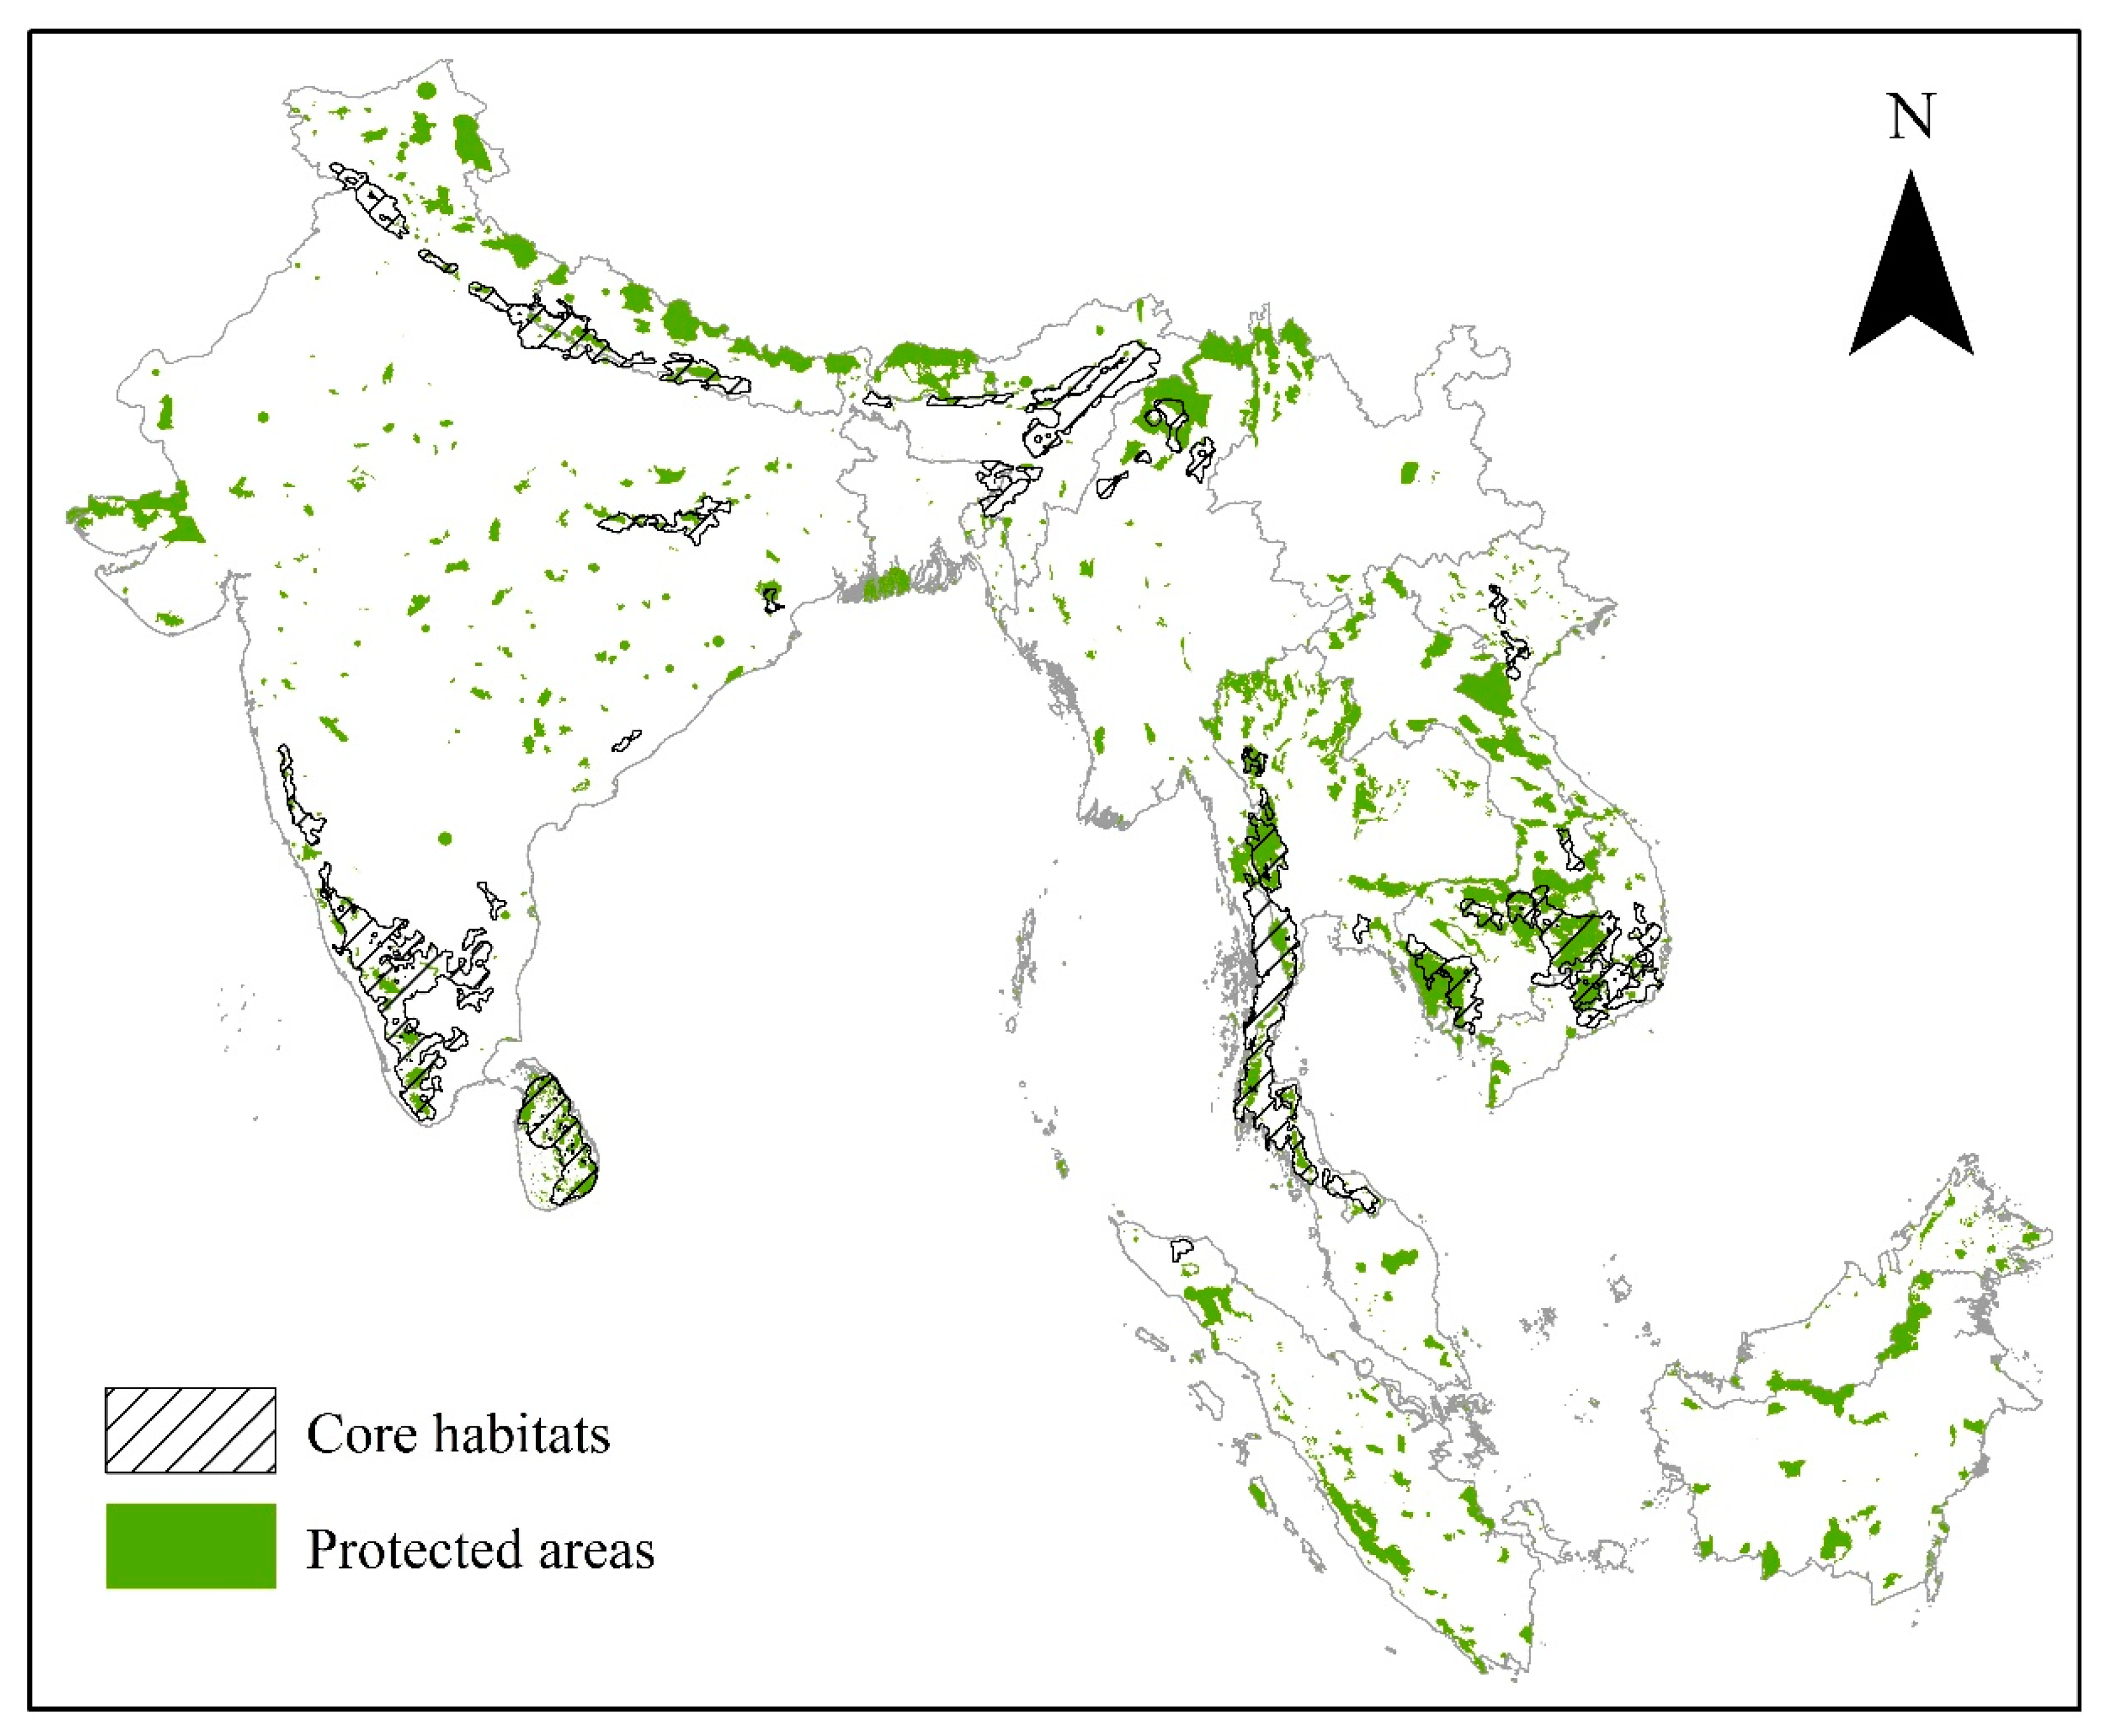
2.6.1. Core Habitat Identification
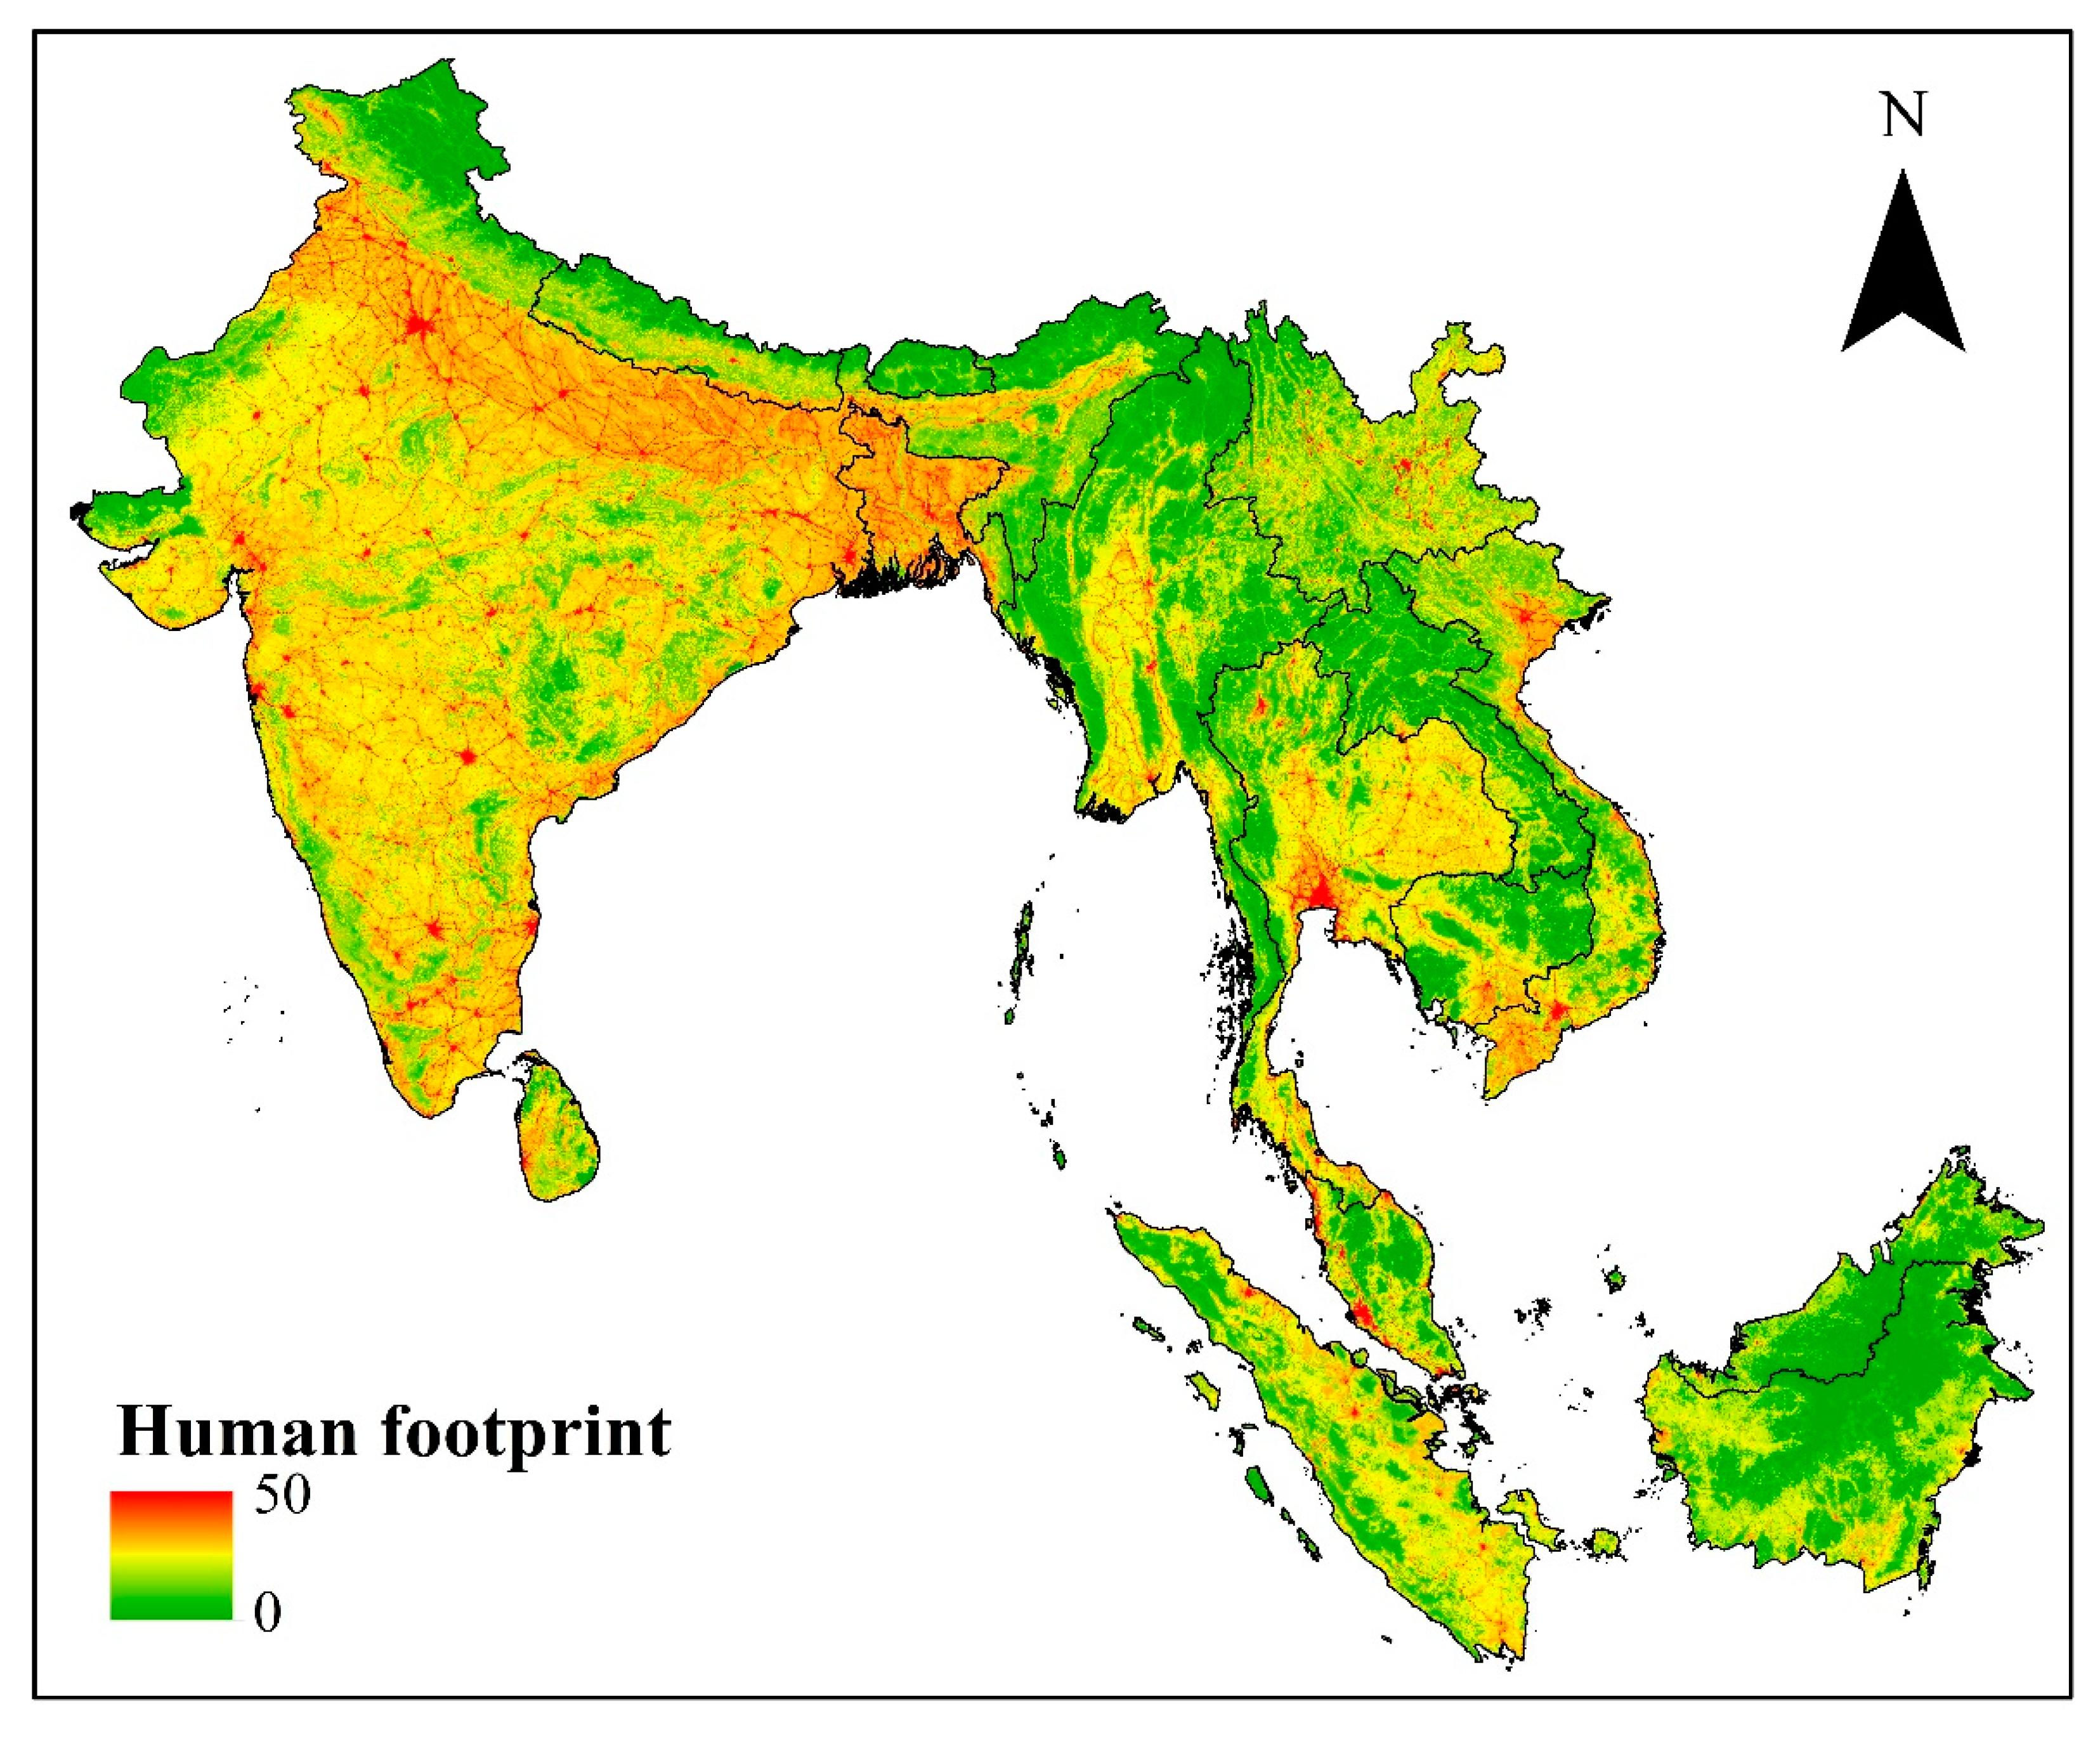
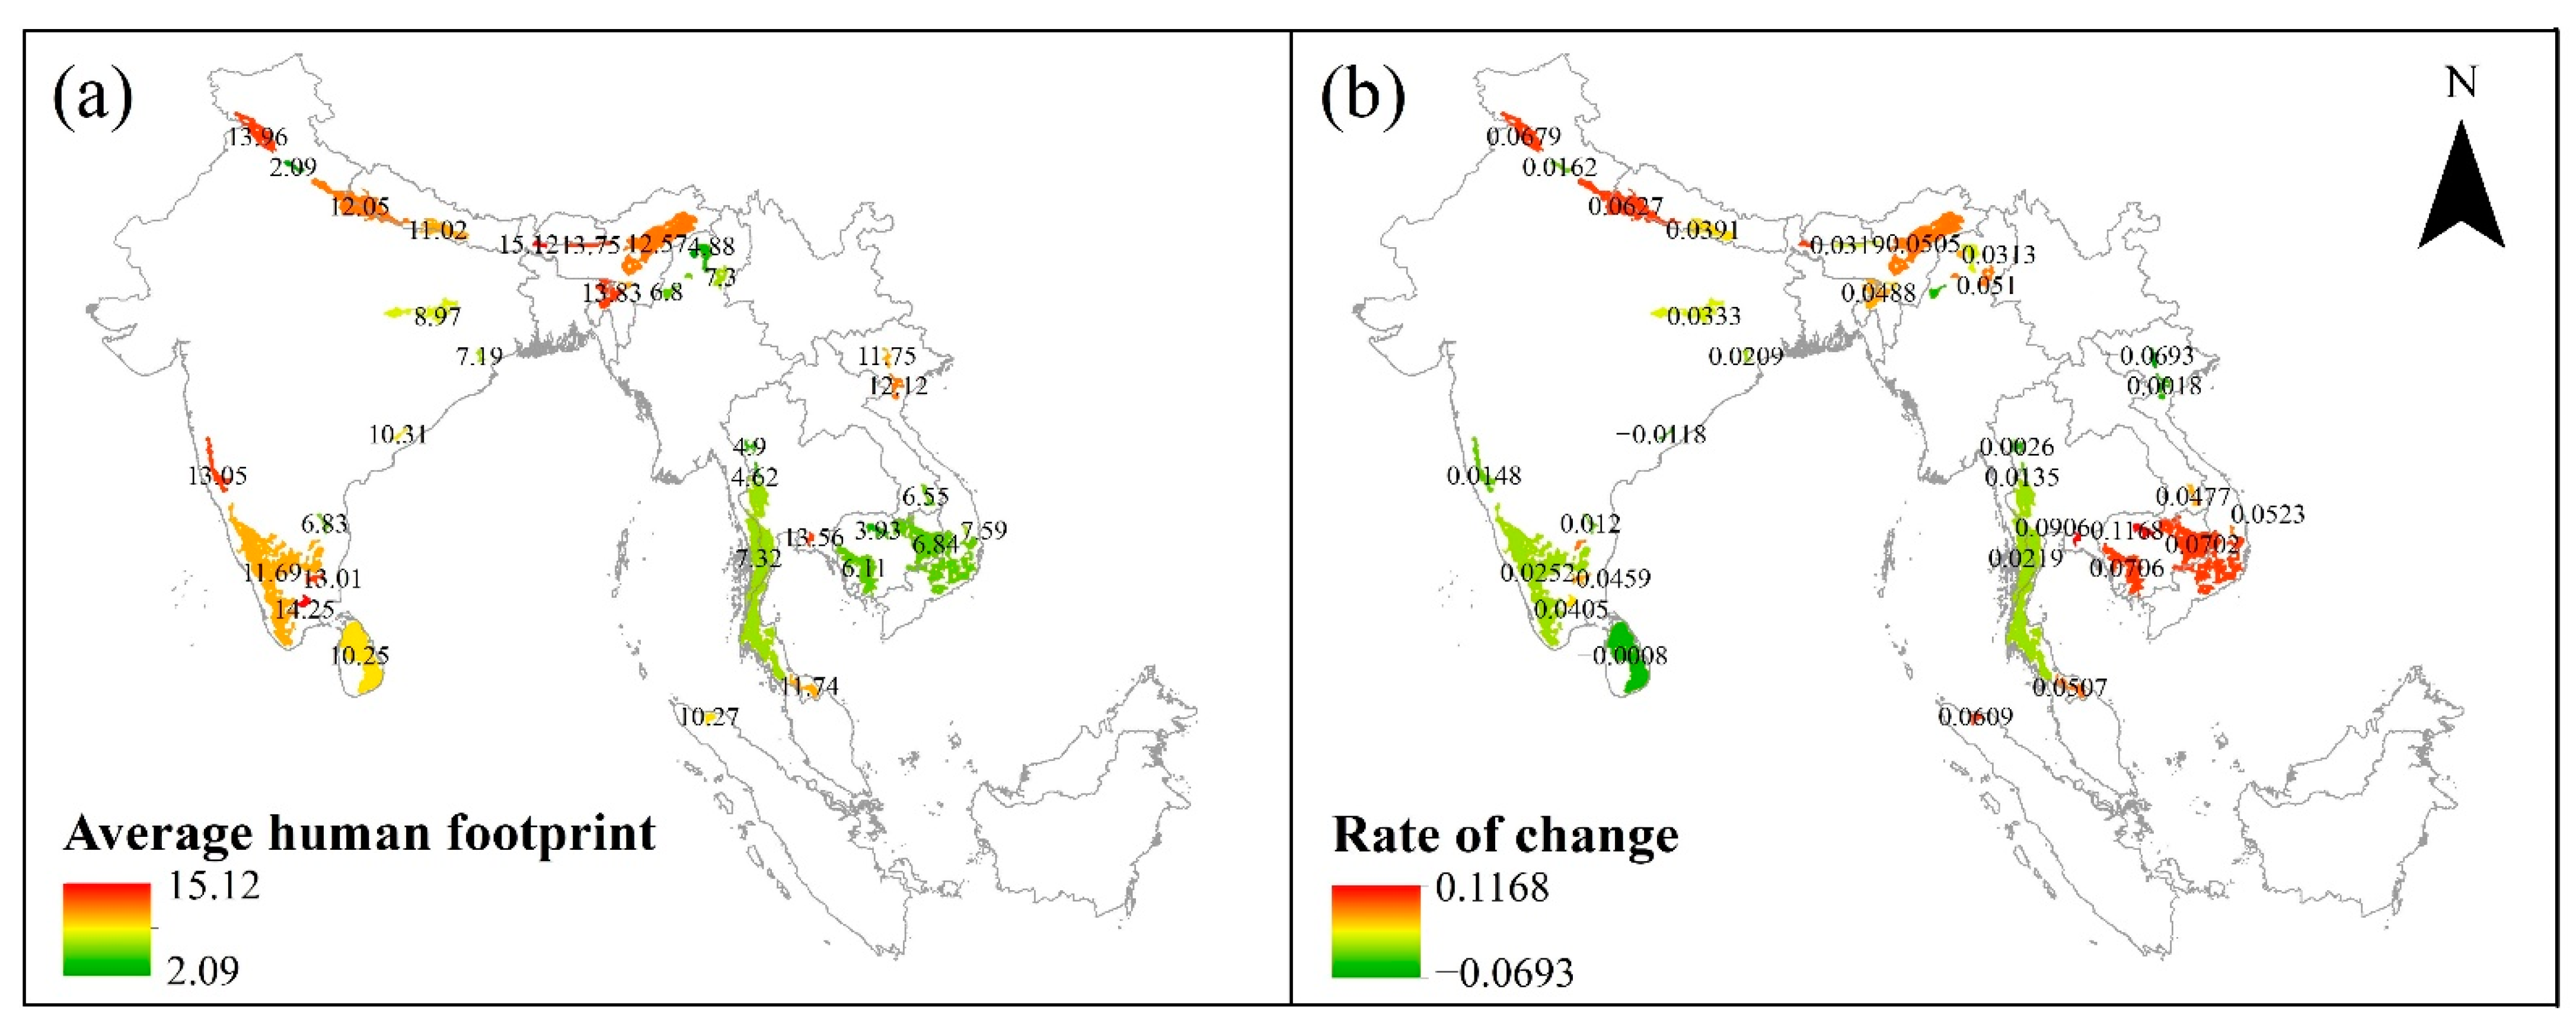
2.6.2. Human Footprint in Core Habitats
2.6.3. Gap Analysis
3. Results
3.1. Model Performance
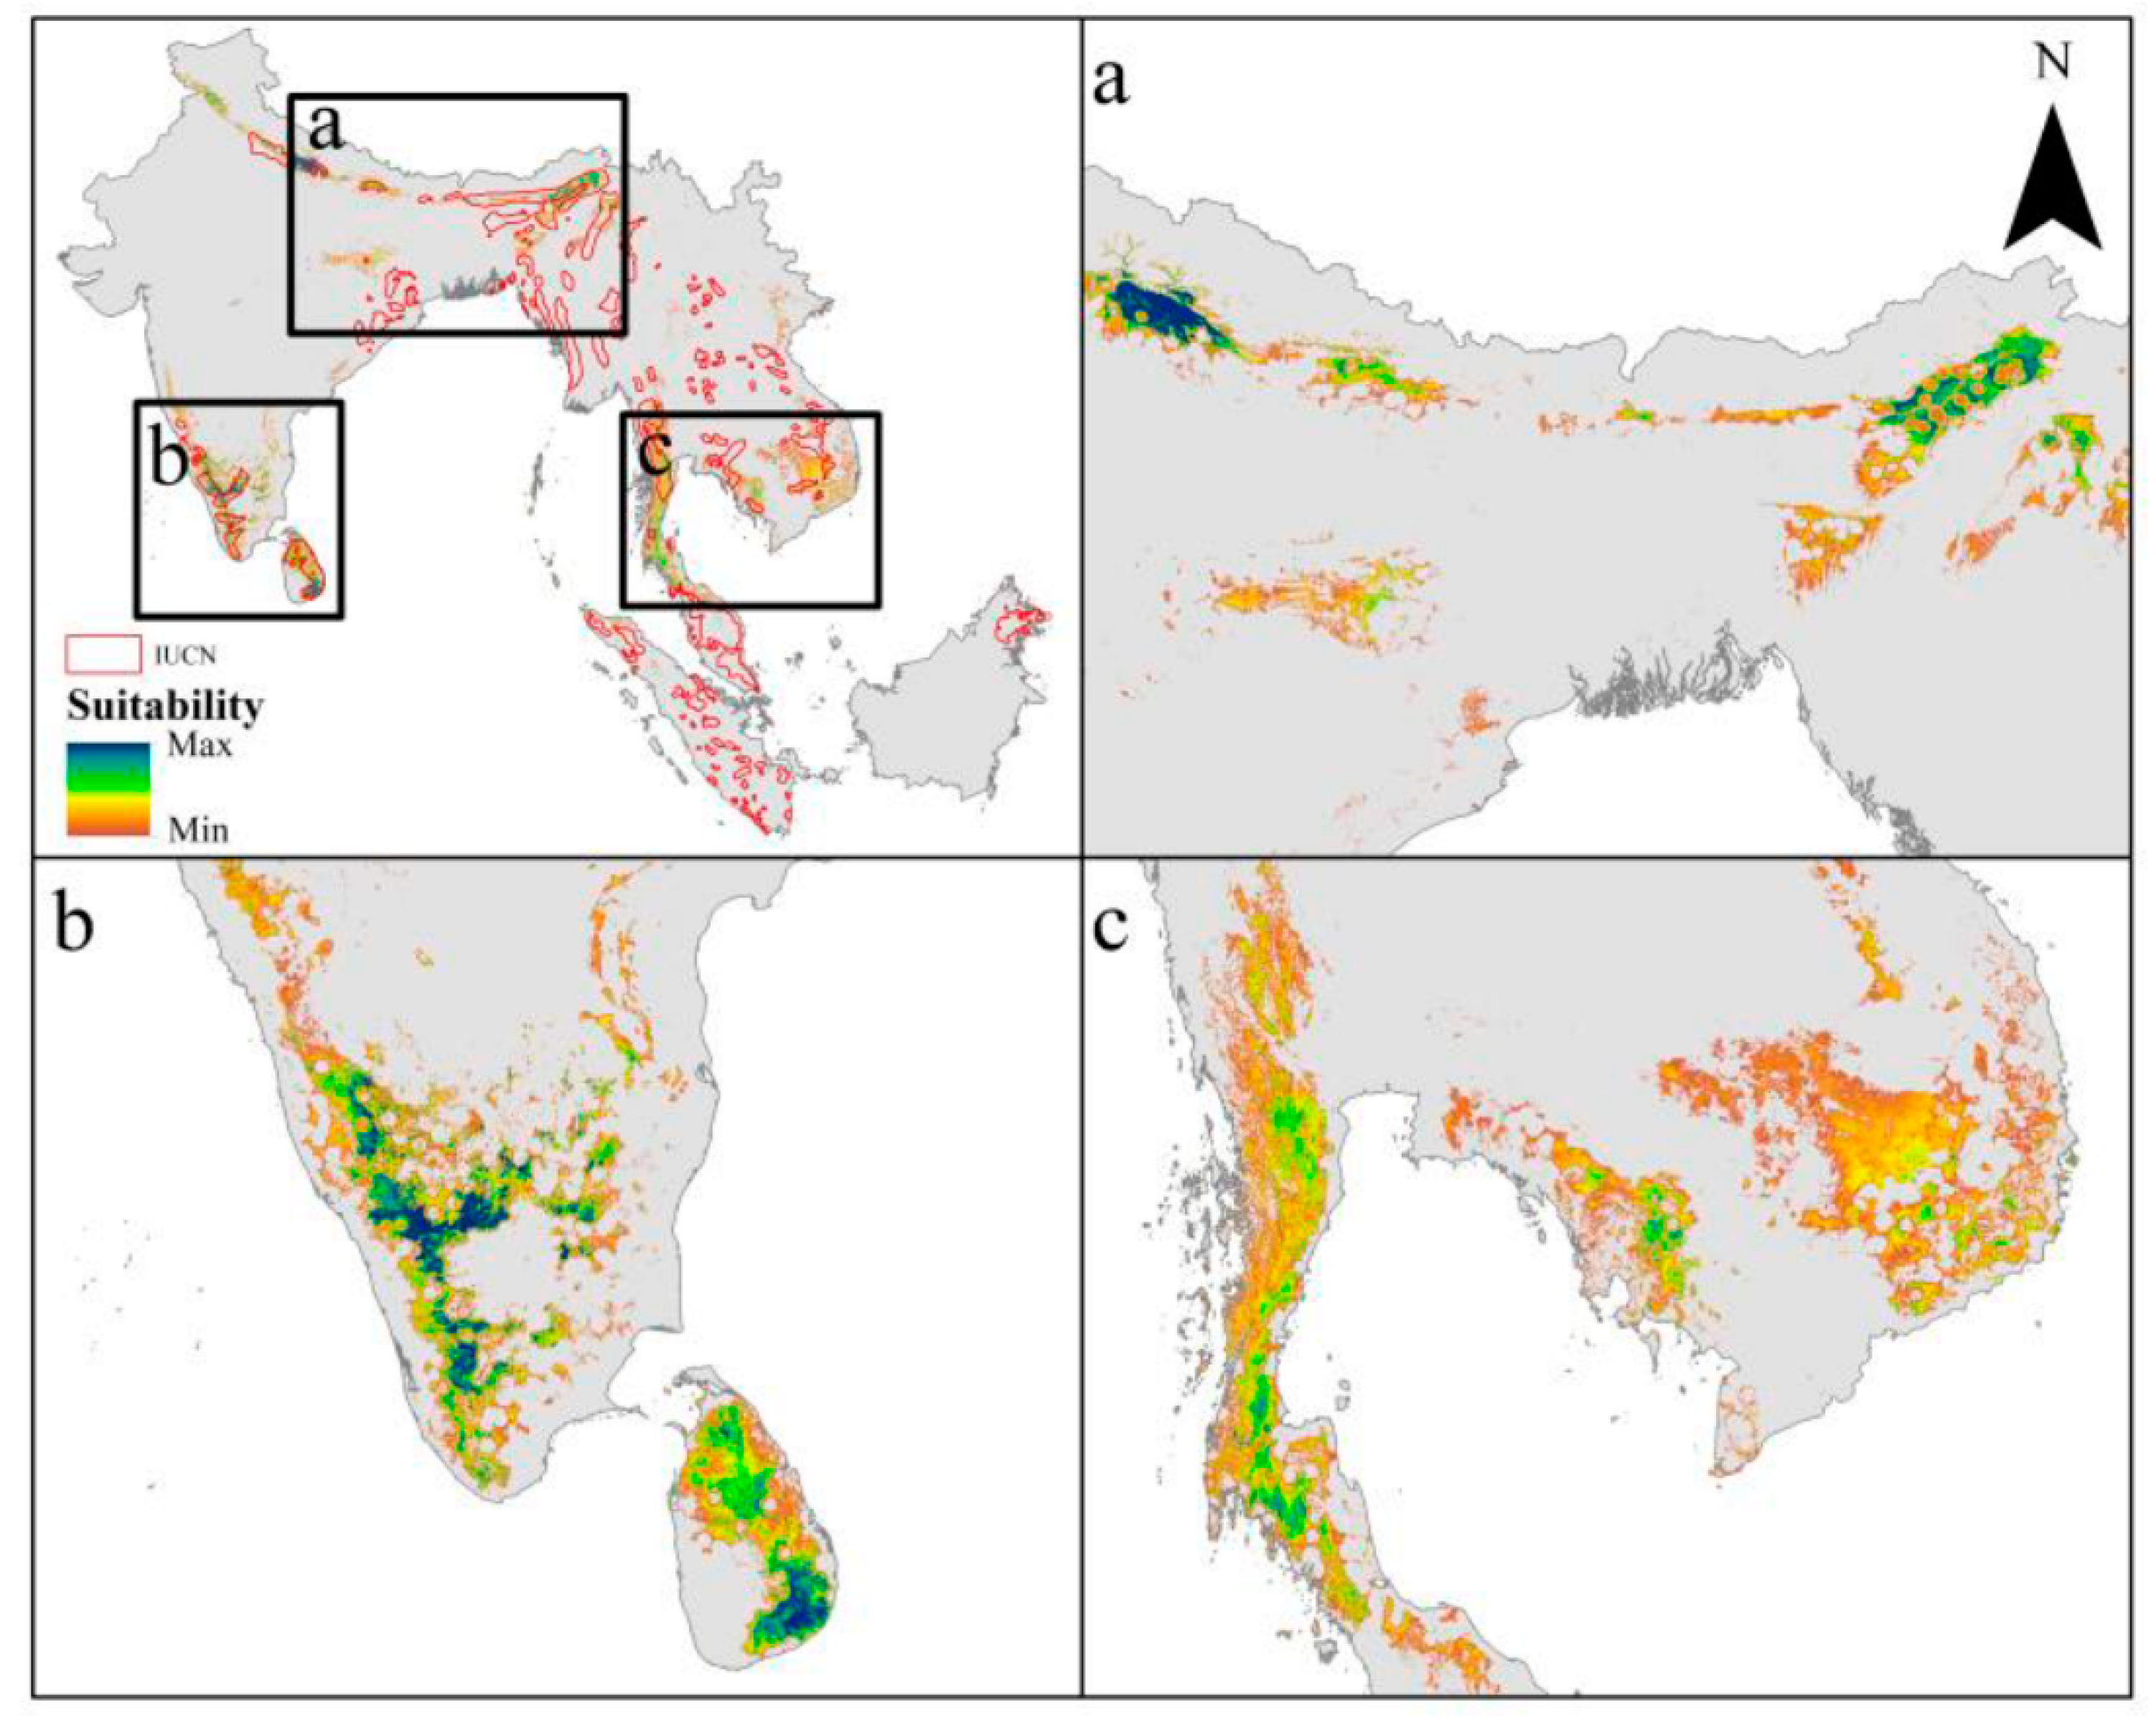
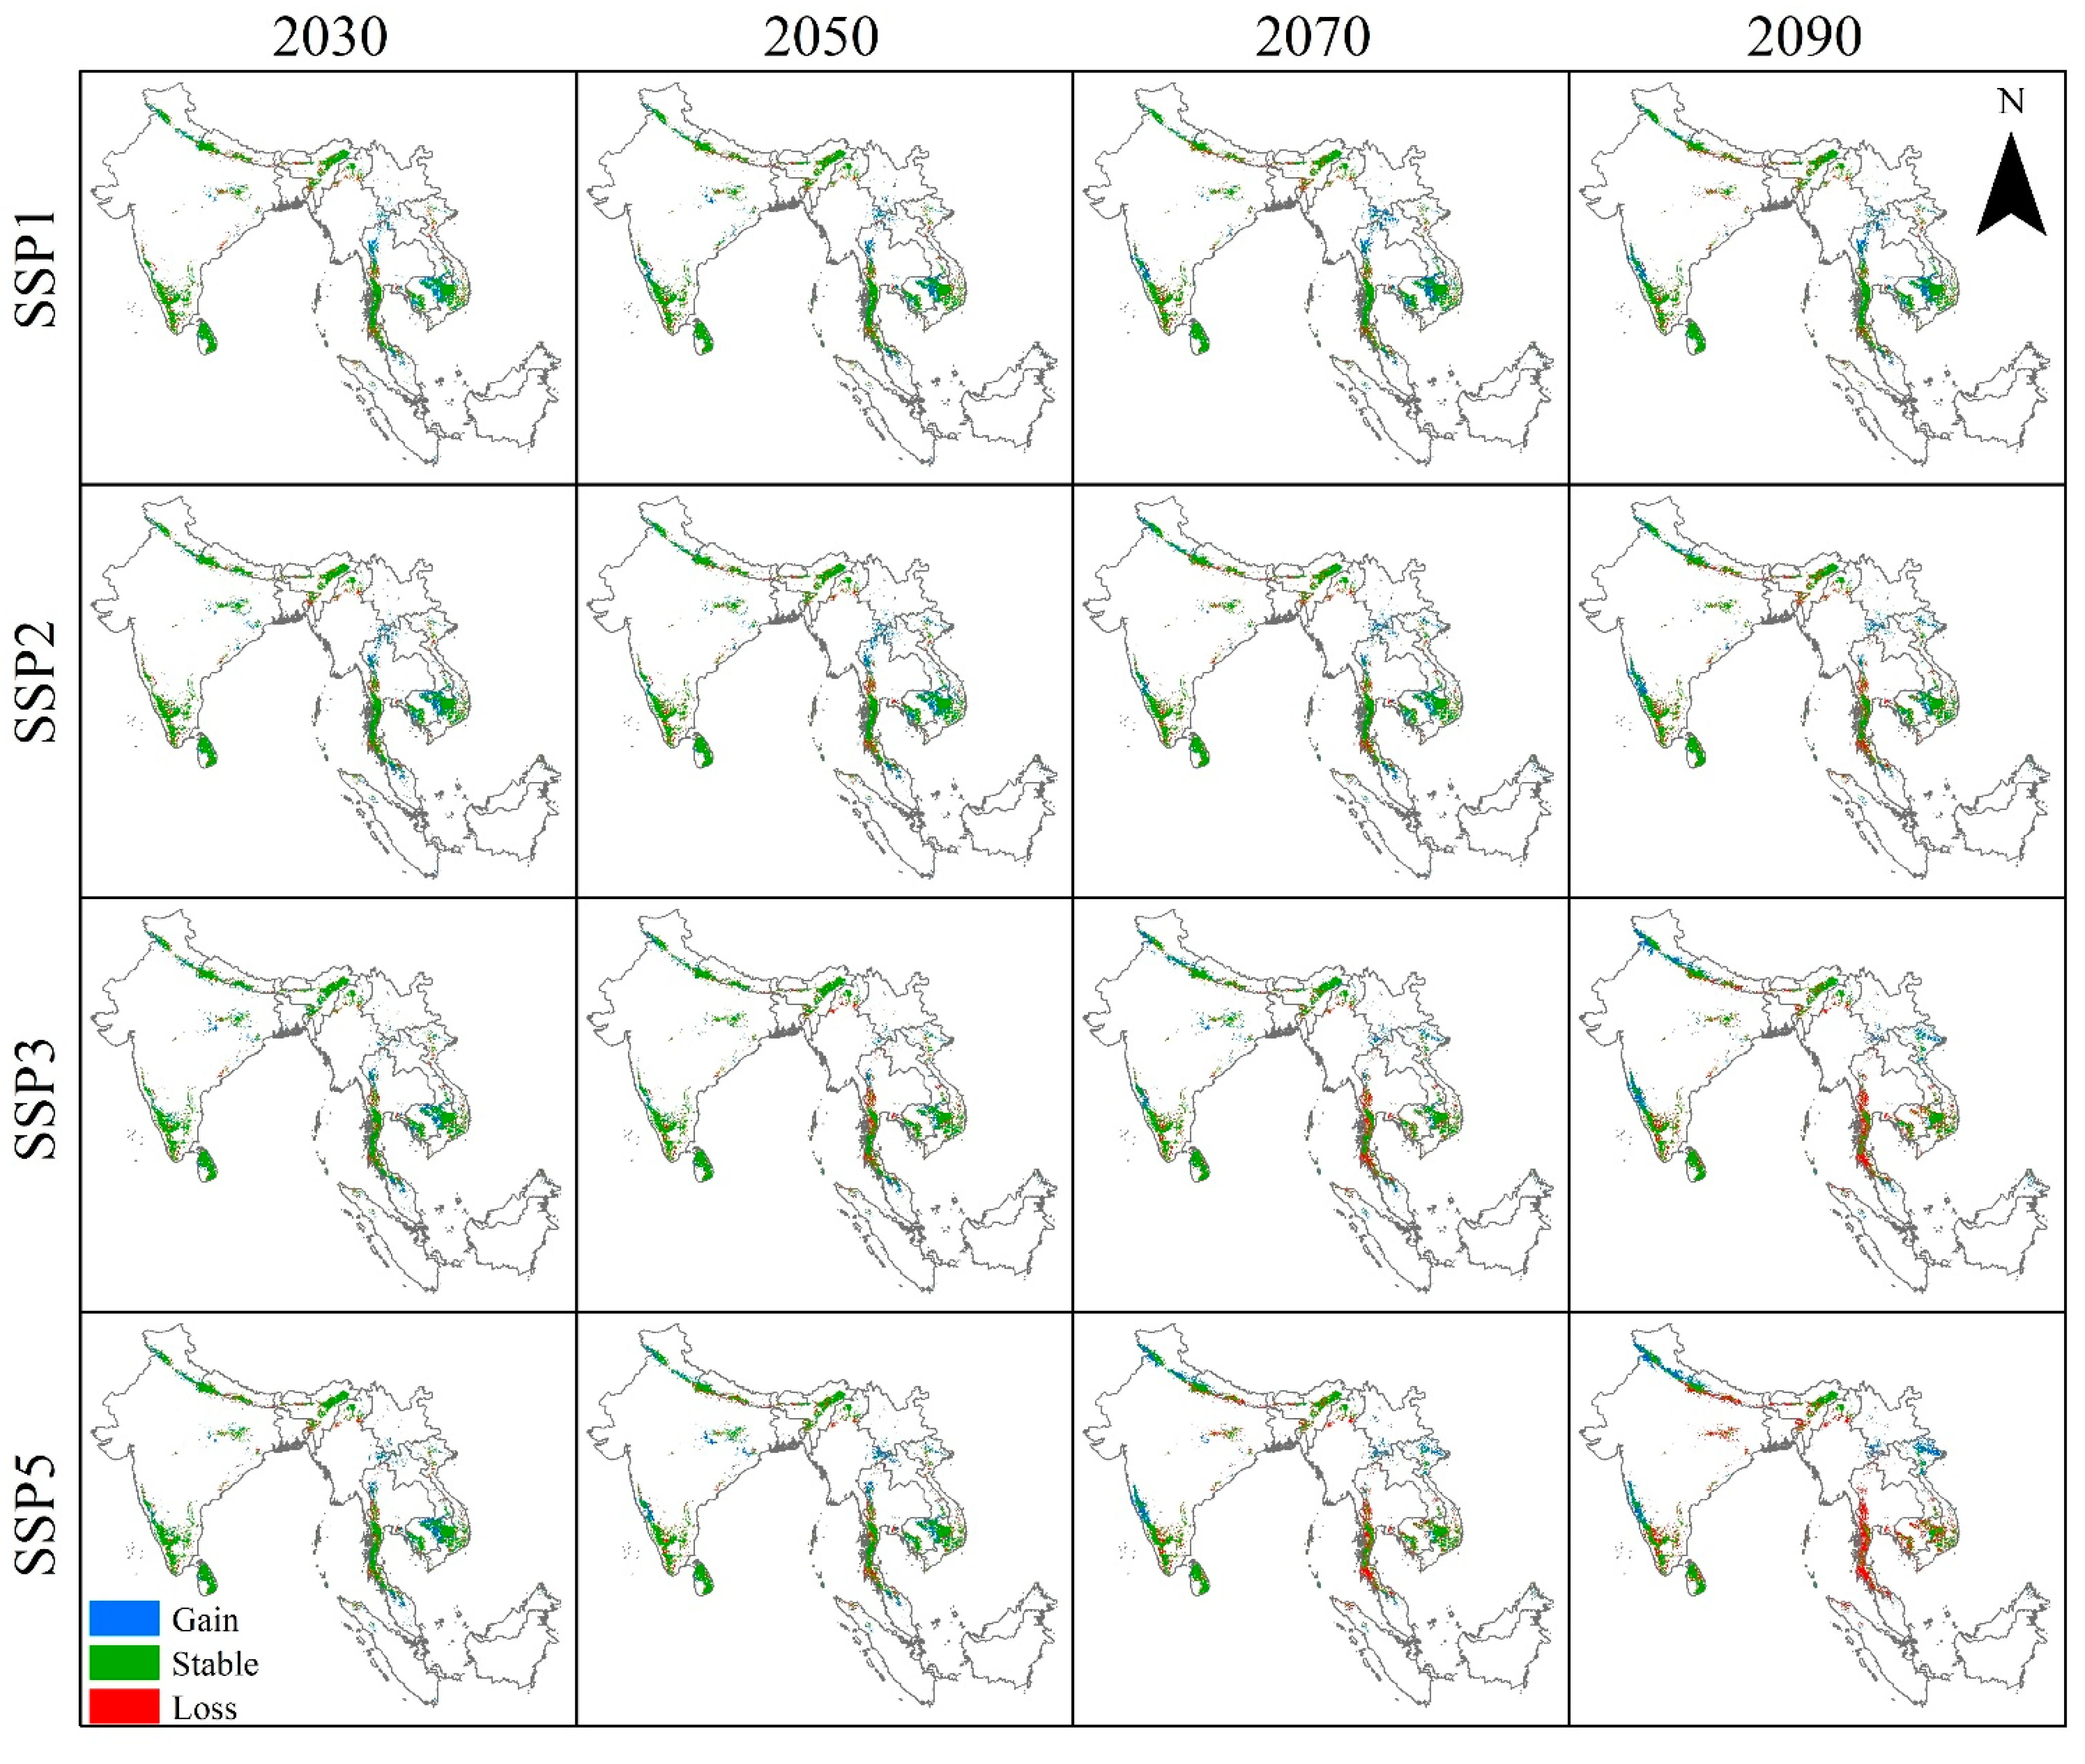
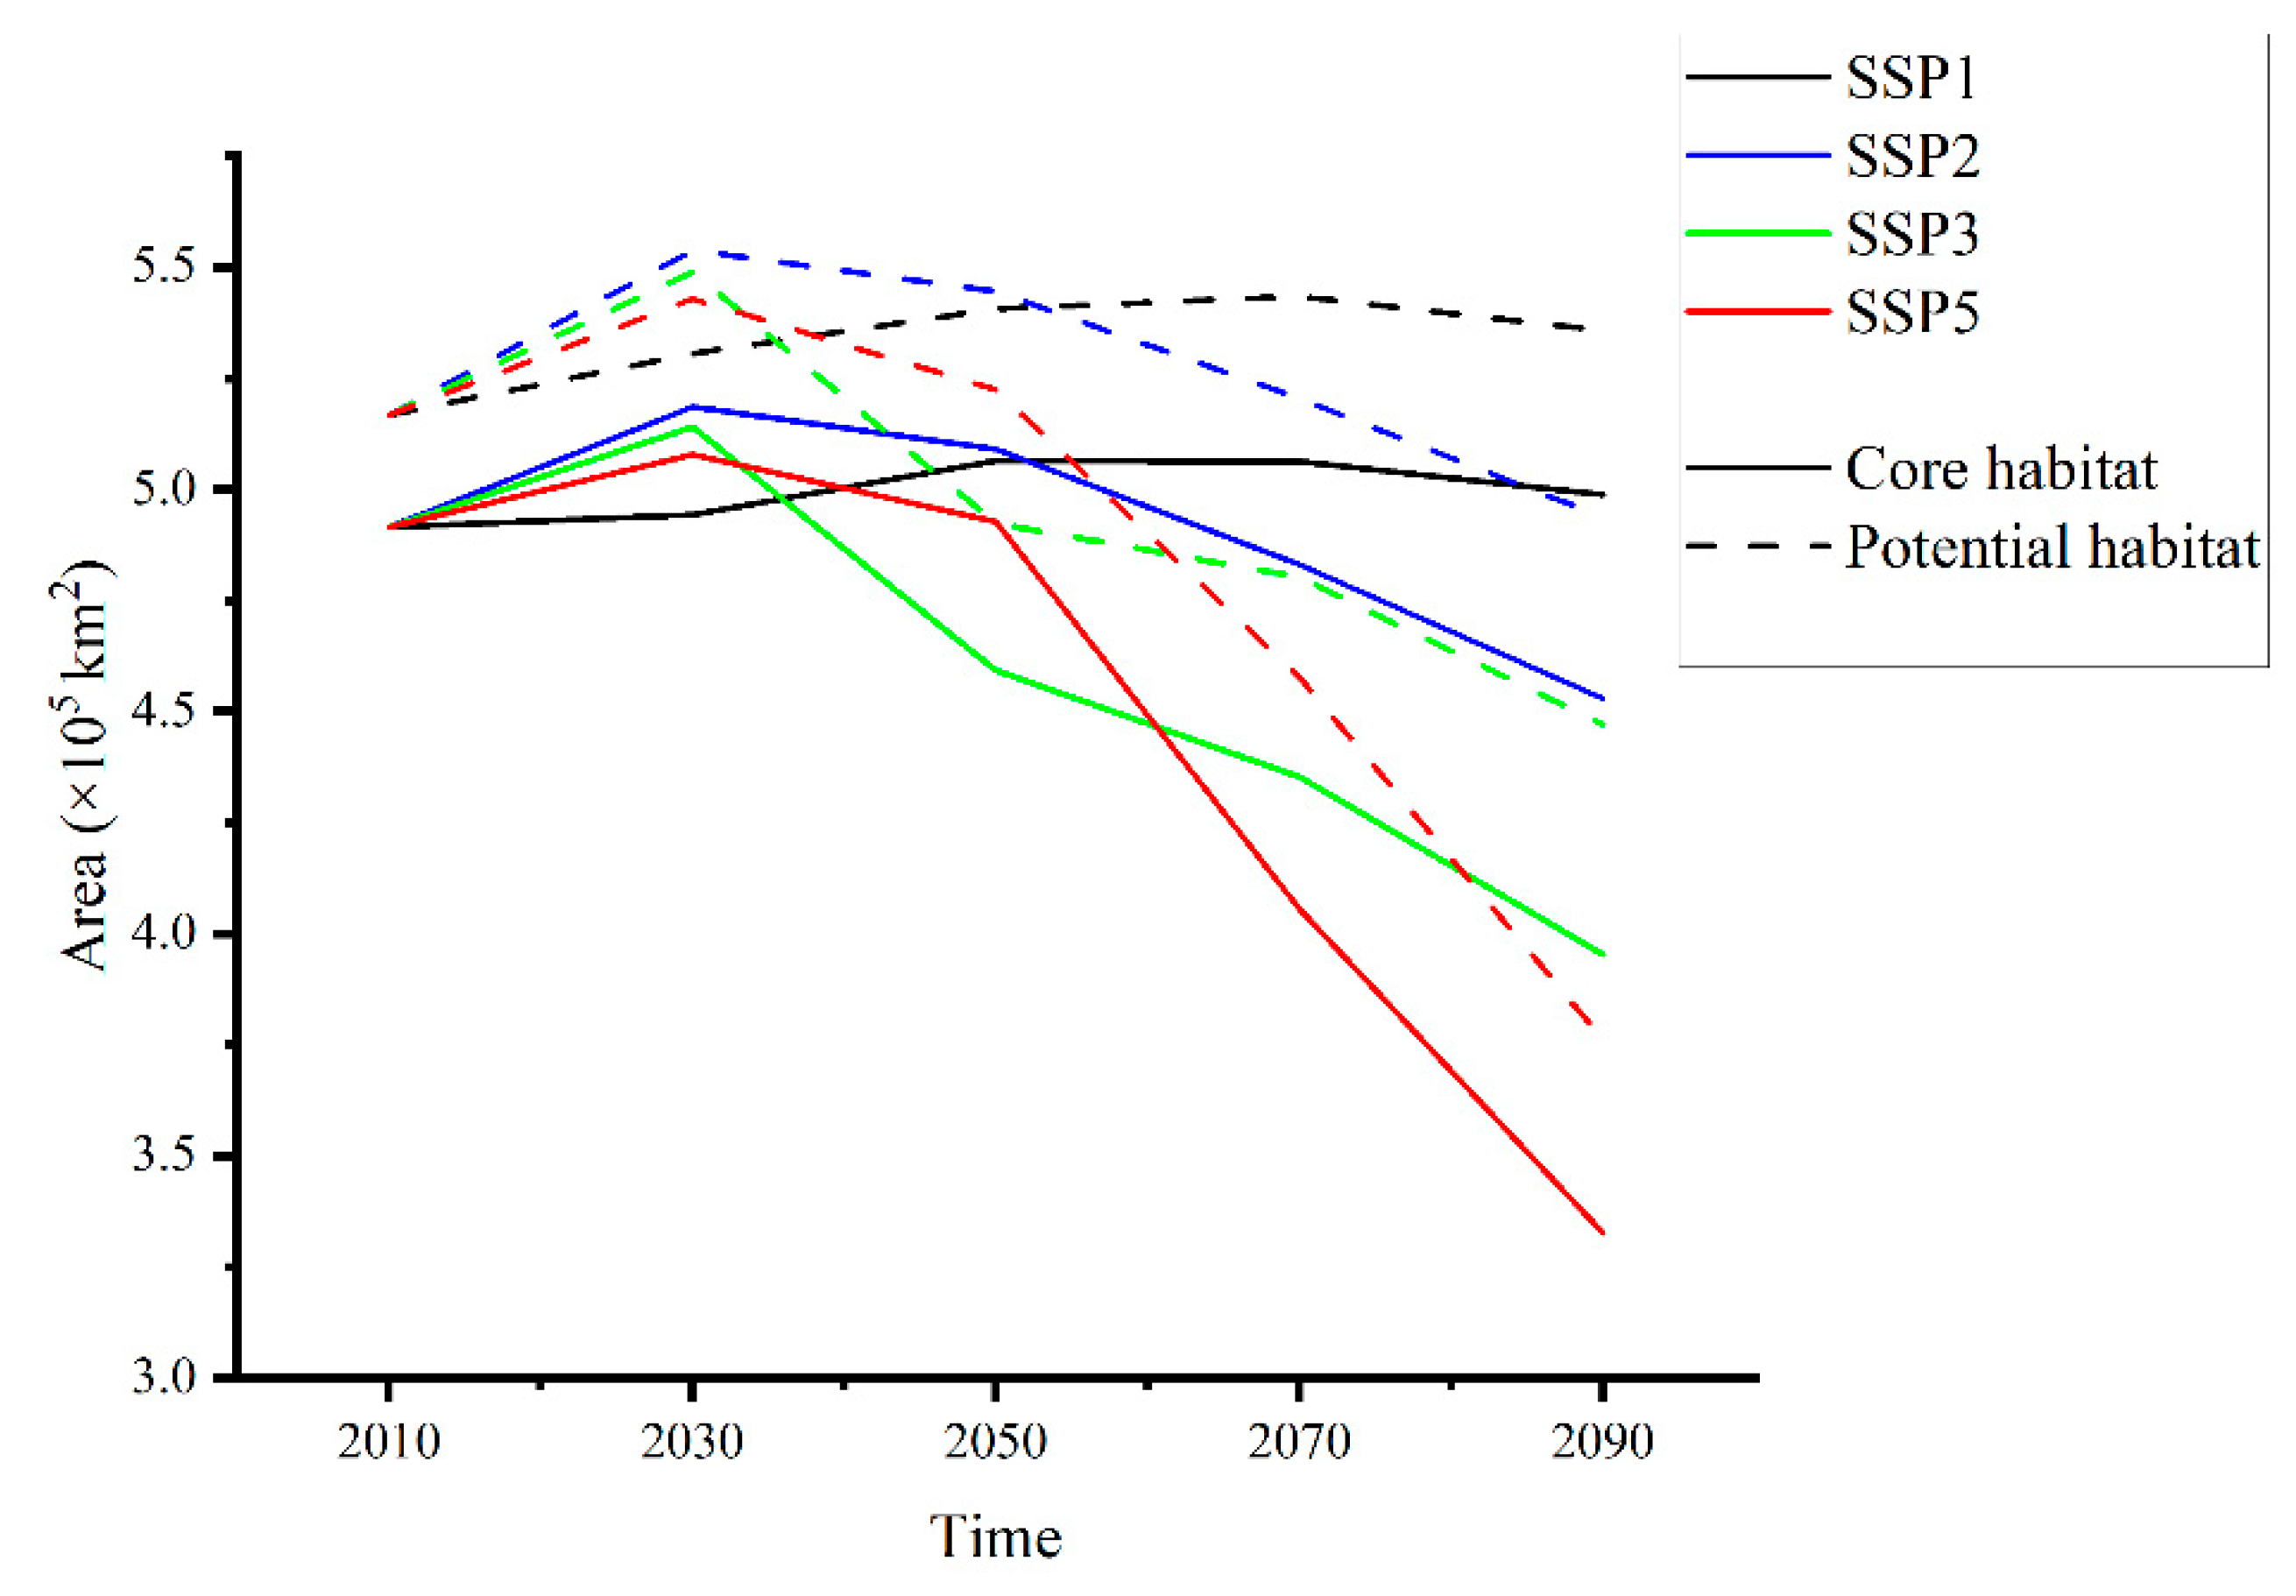
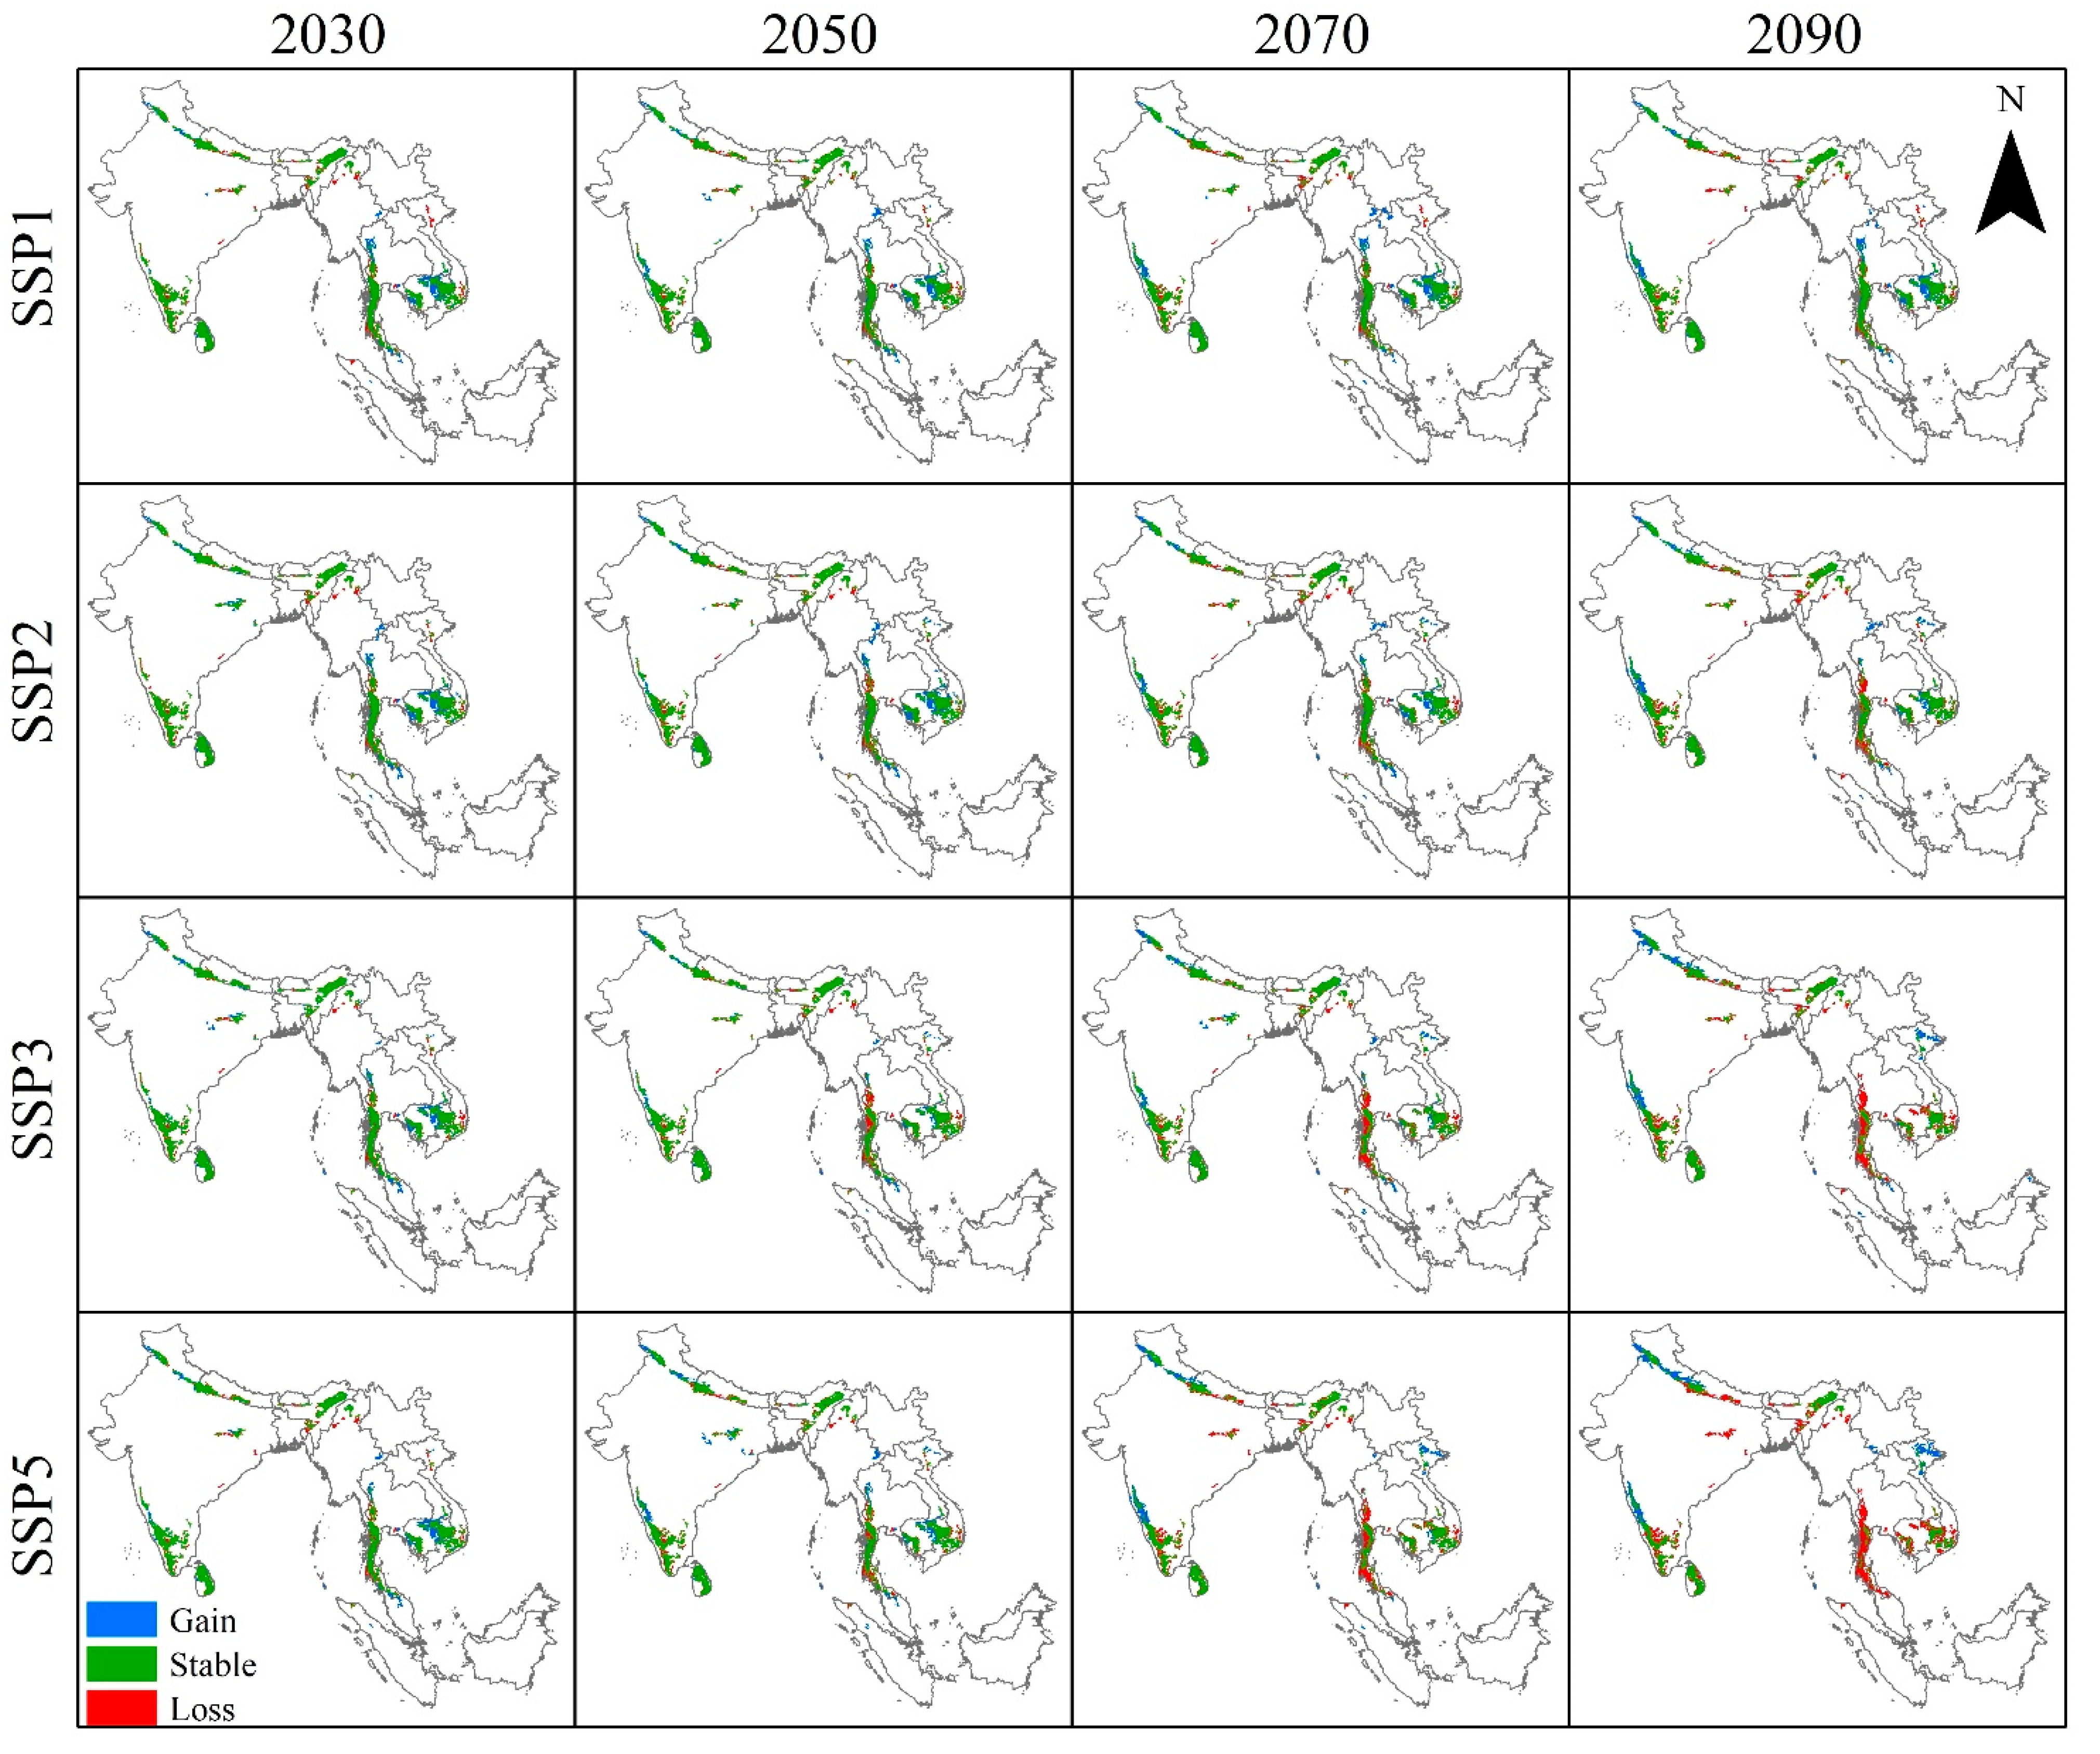
3.2. Current and Future Potential Habitats of Asian Elephants
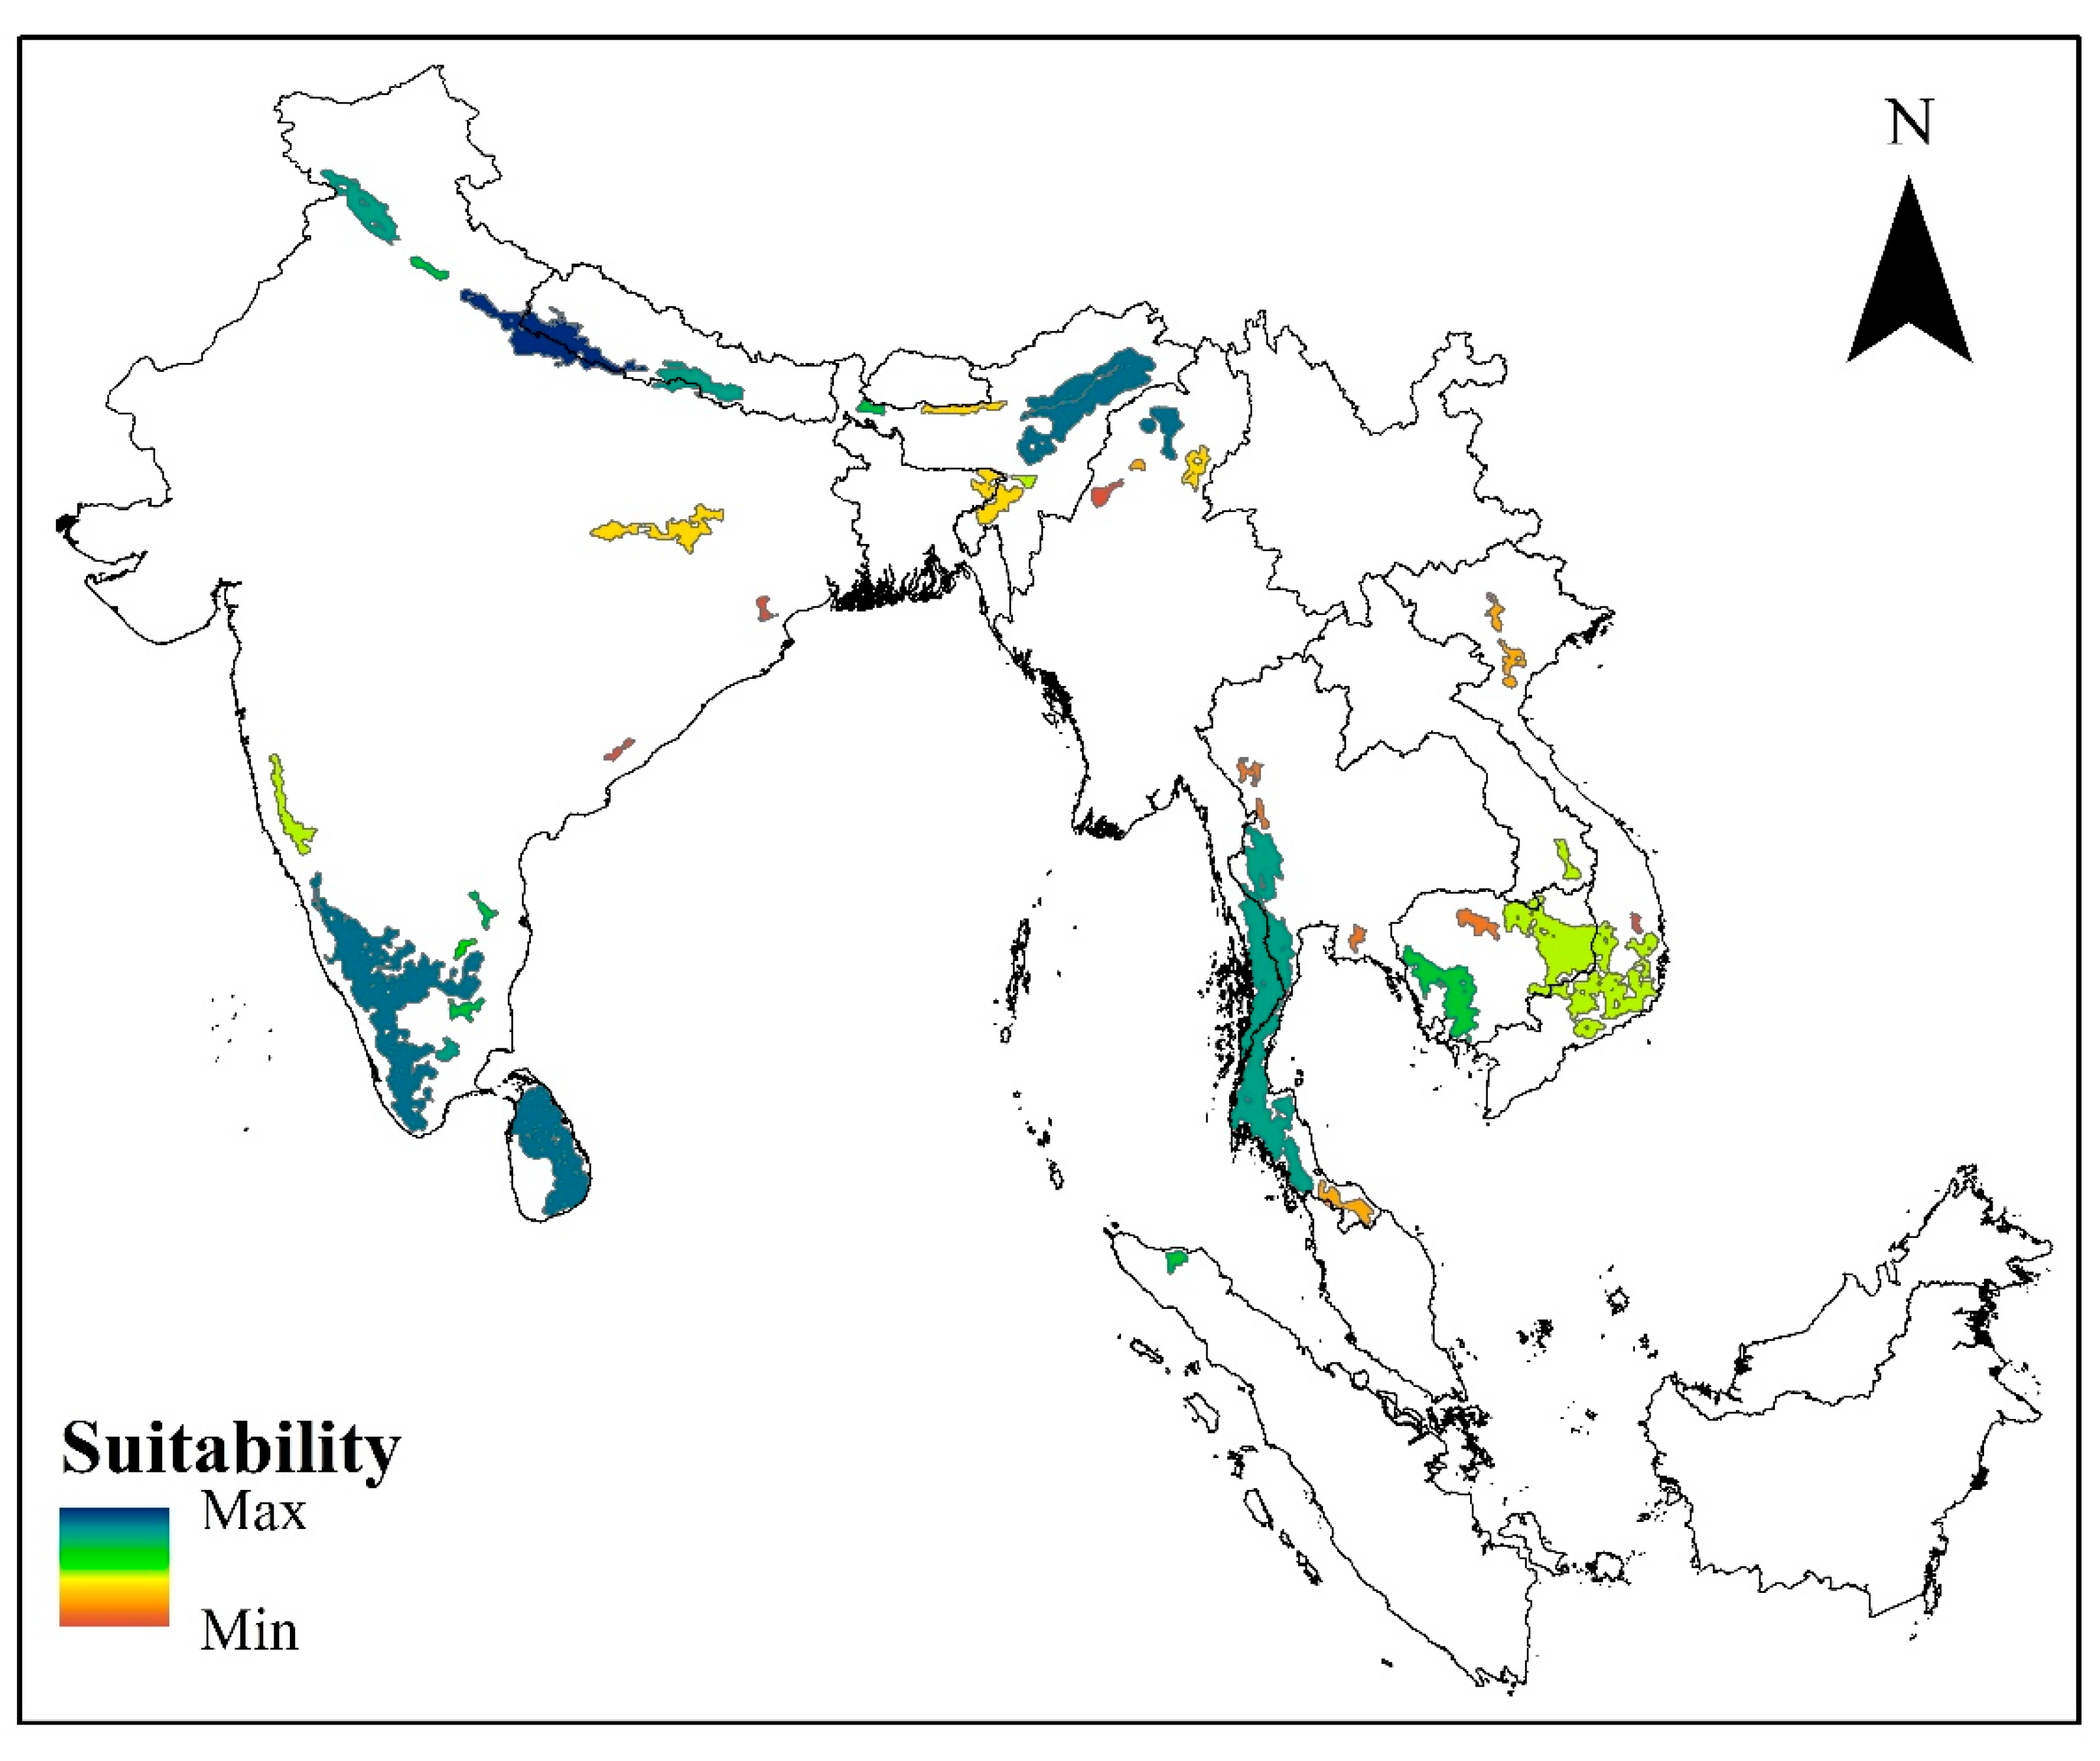
3.3. Identification of the Core Habitats
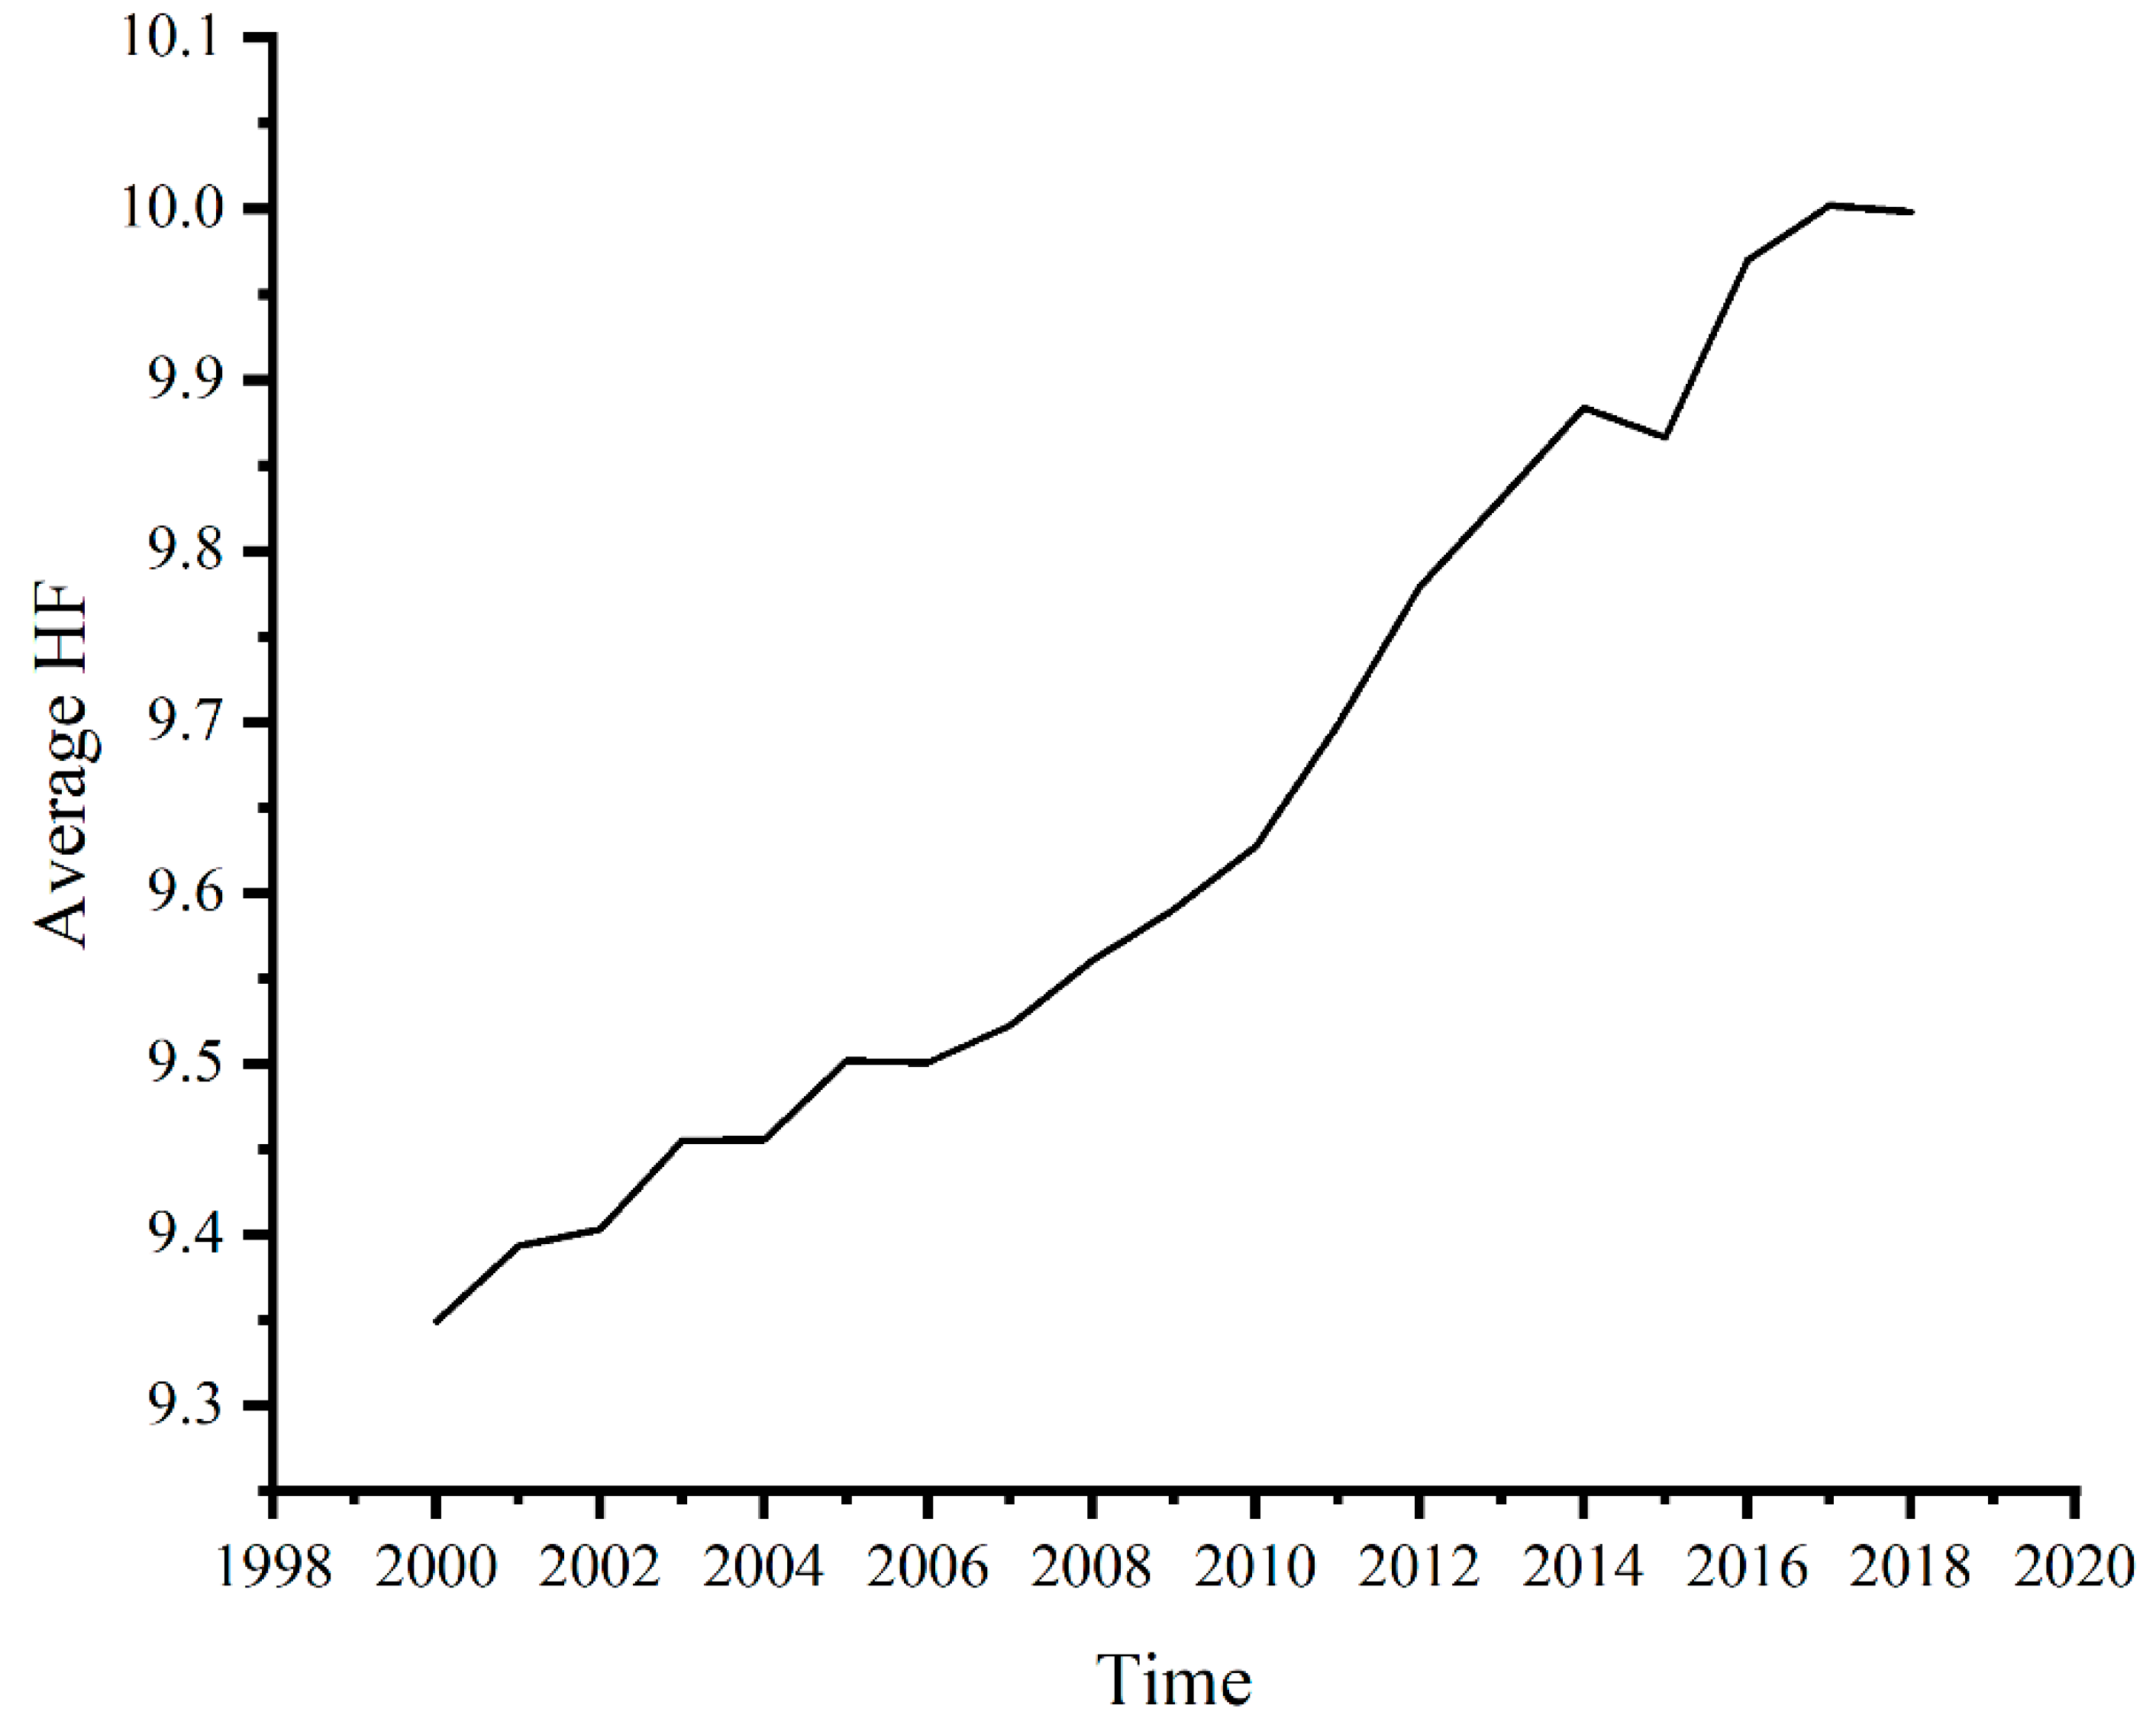
3.4. Human Footprint Mapping
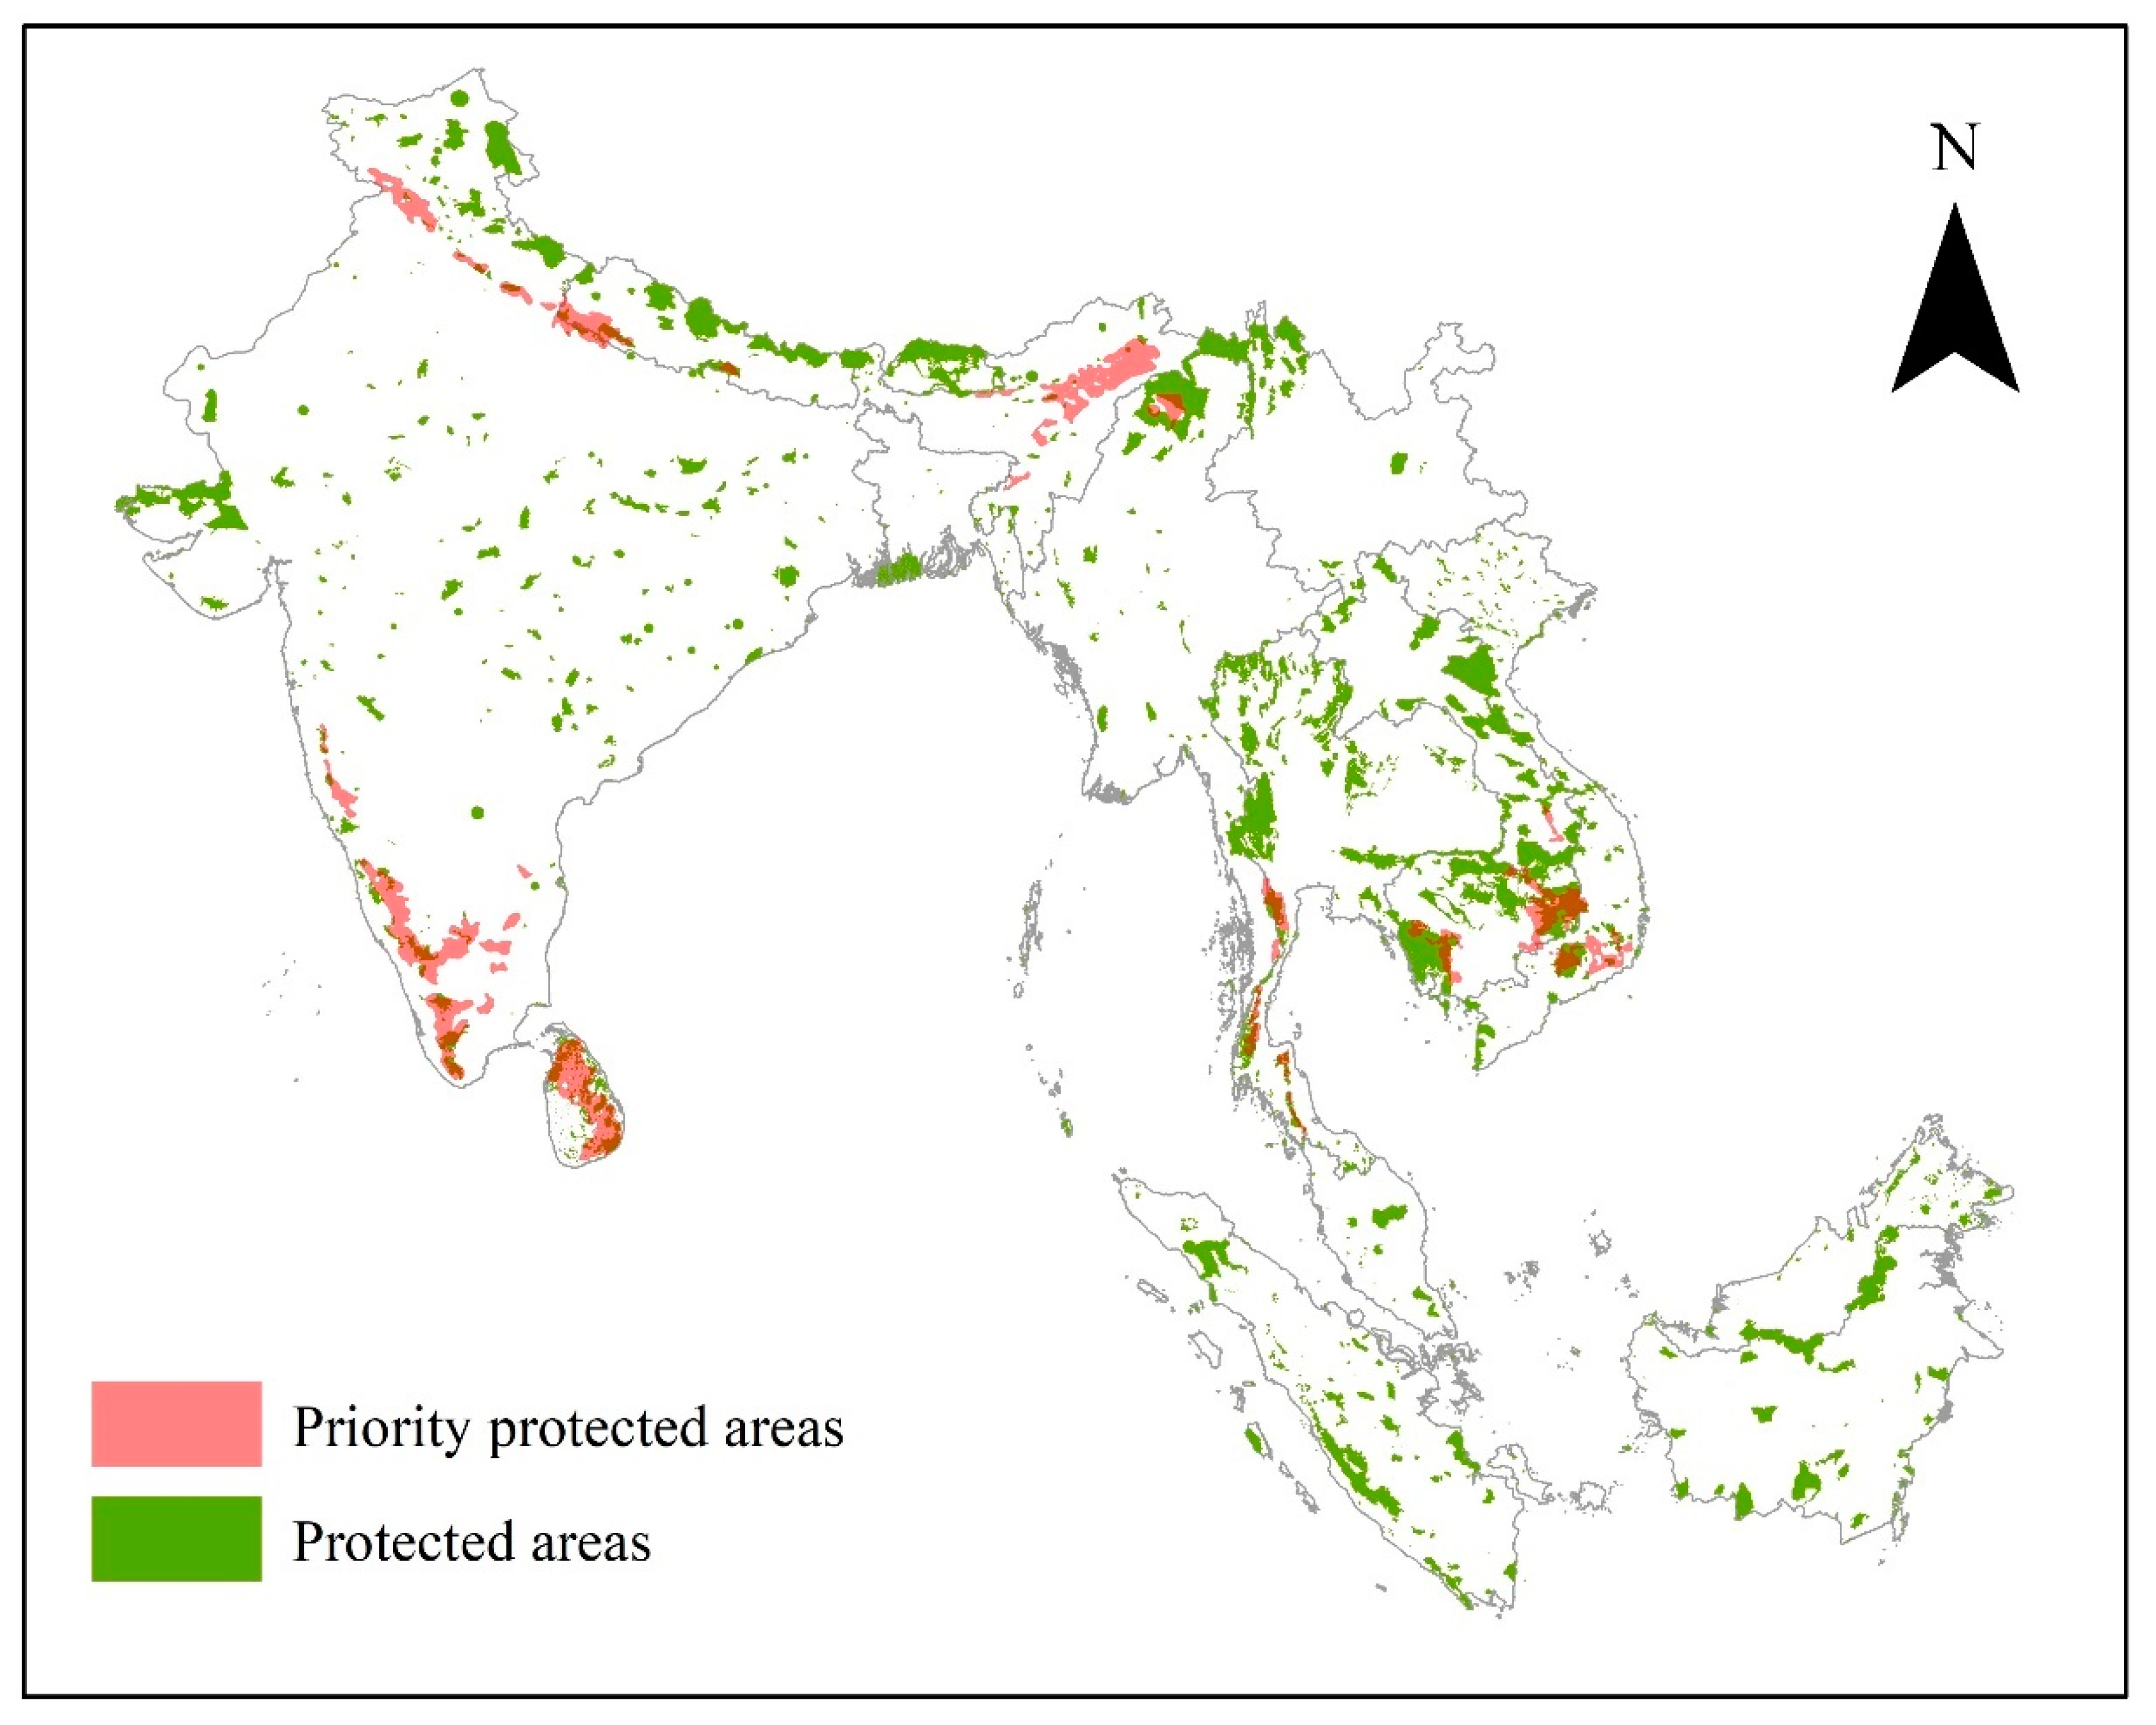
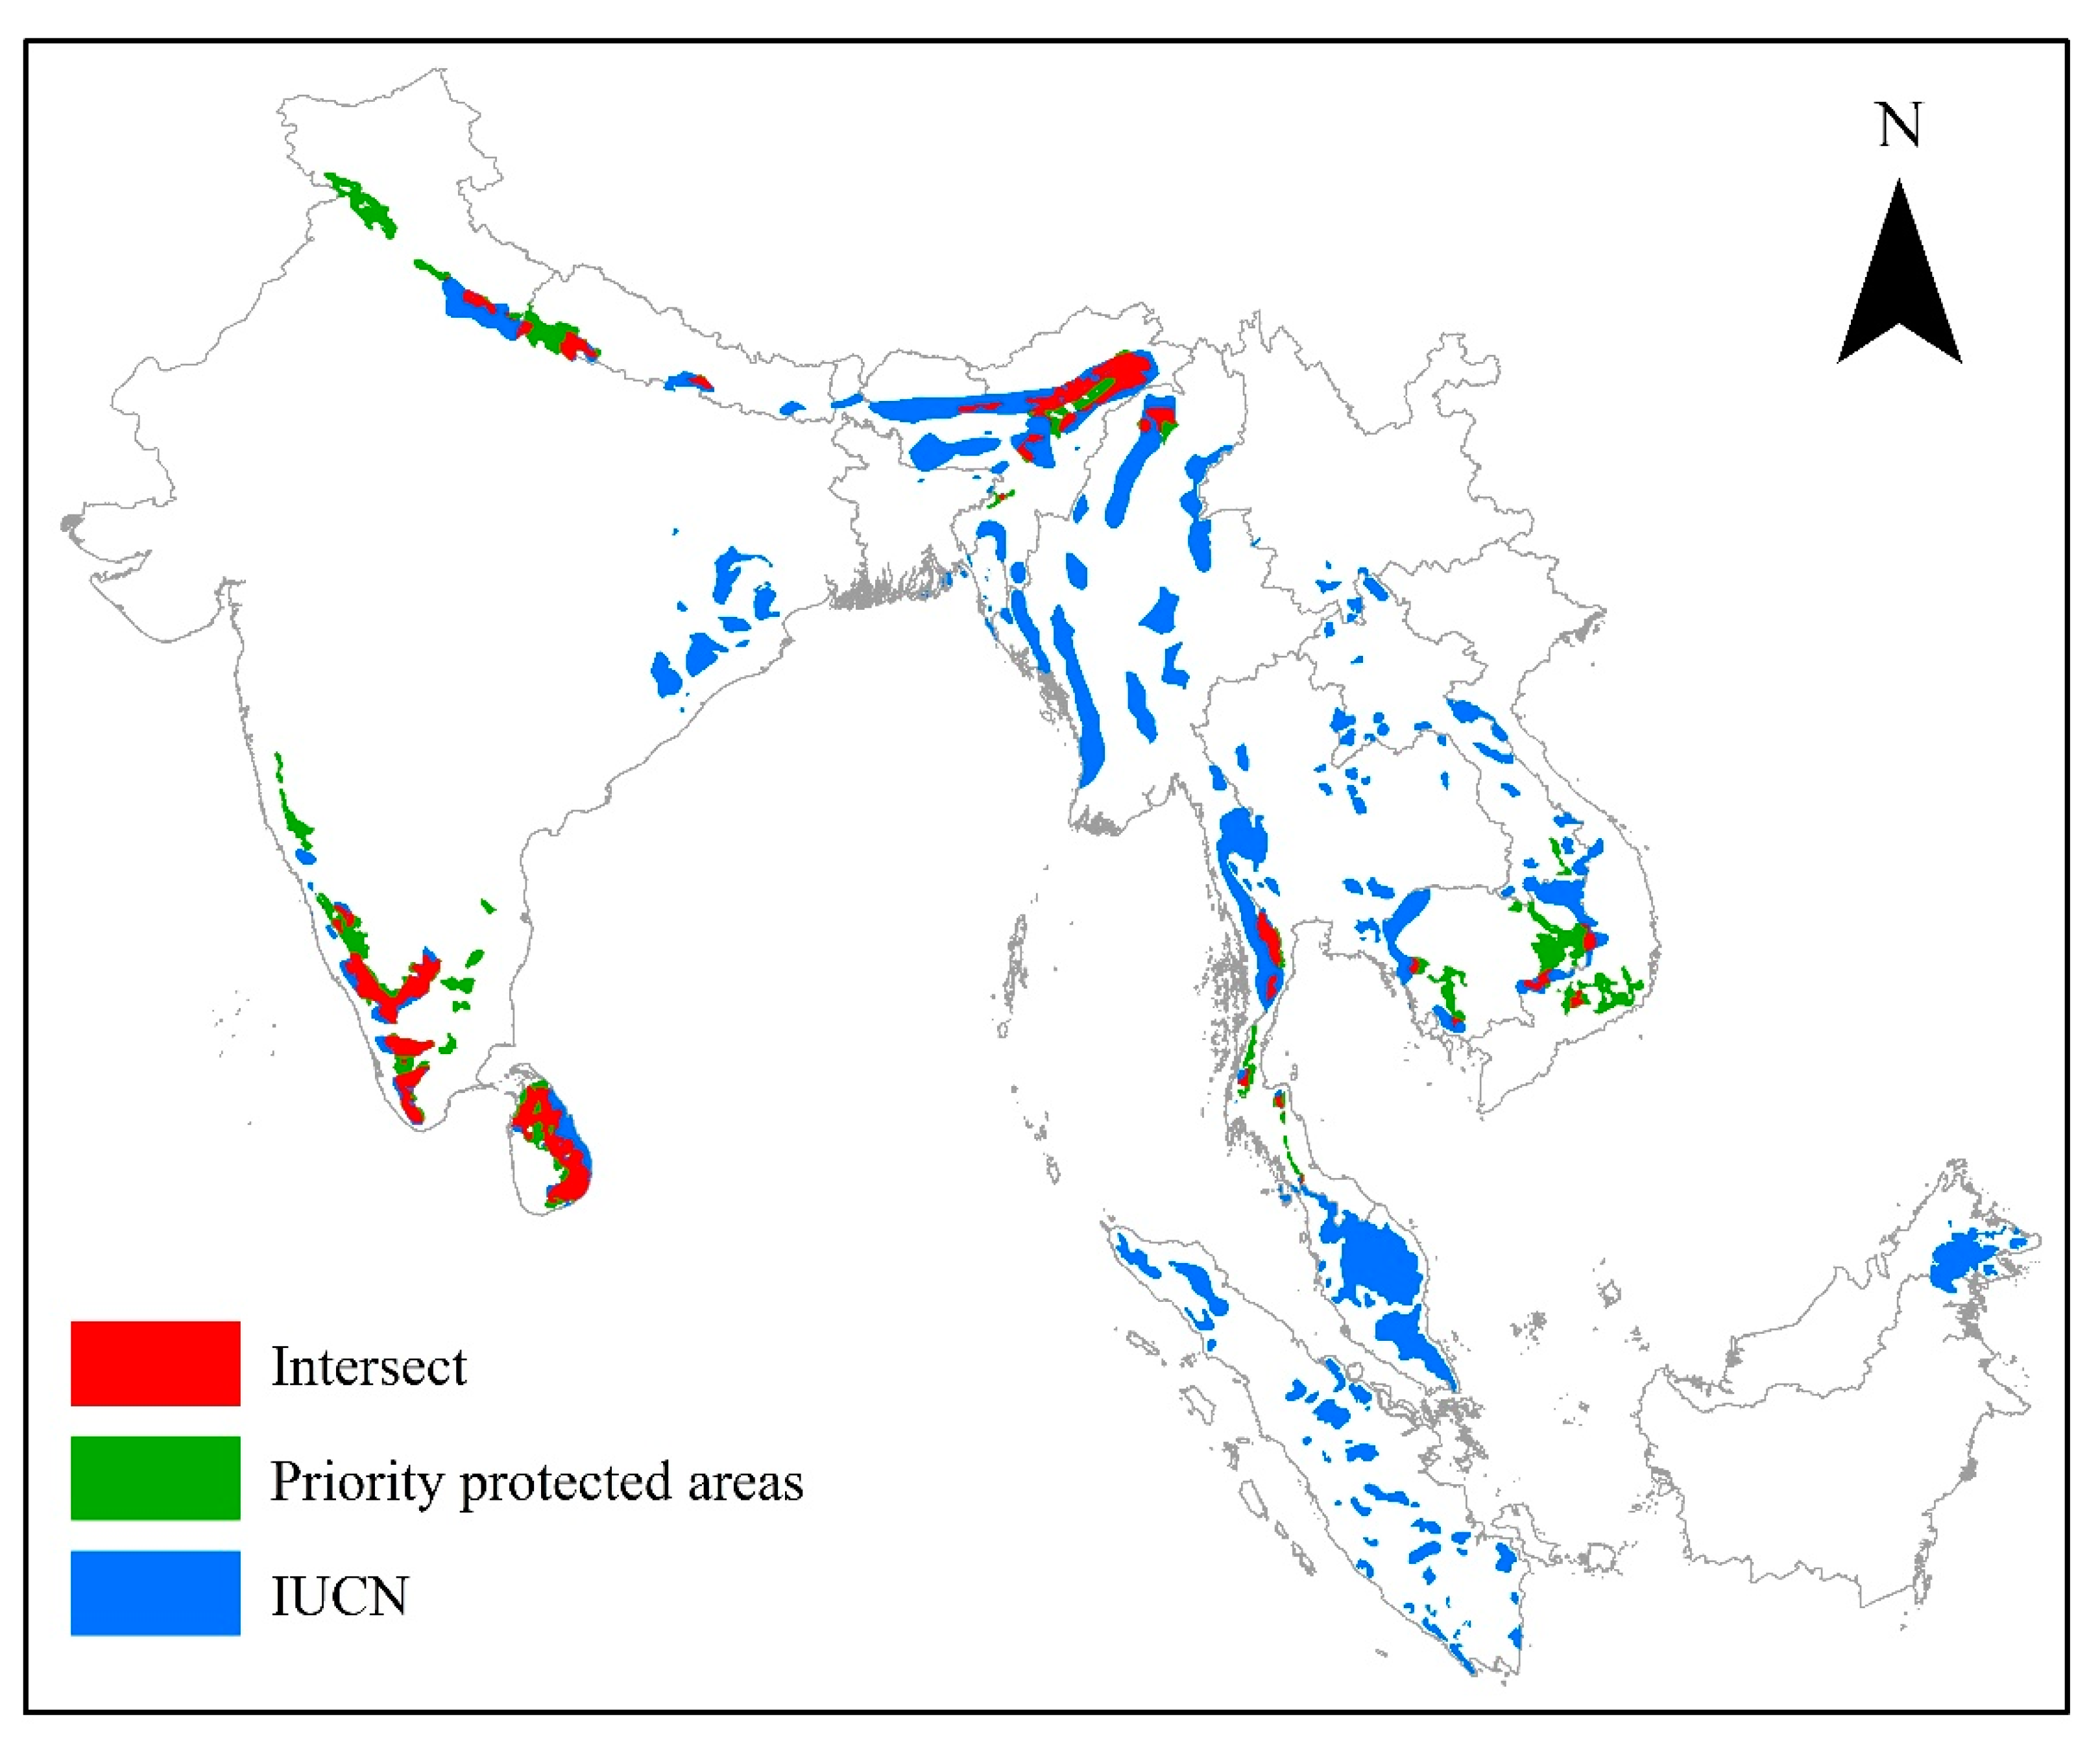
3.5. Gap Analysis
4. Discussion
4.1. Habitats Shift Caused by Climate Change
4.2. Habitats Compression Driven by Human Disturbance
4.3. More PAs Need to Be Established
4.4. Limitations of the Current Study
5. Conclusions
Author Contributions
Funding
Data Availability Statement
Acknowledgments
Conflicts of Interest
References
- Memtsas, D.P. Multiobjective programming methods in the reserve selection problem. Eur. J. Oper. Res. 2003, 150, 640–652. [Google Scholar] [CrossRef]
- Schmeller, D.S.; Evans, D.; Lin, Y.P.; Henle, K. The national responsibility approach to setting conservation priorities-Recommendations for its use. J. Nat. Conserv. 2014, 22, 349–357. [Google Scholar] [CrossRef]
- Gjerde, I.; Grytnes, J.A.; Heegaard, E.; Saetersdal, M.; Tingstad, L. Red List updates and the robustness of sites selected for conservation of red-listed species. Glob. Ecol. Conserv. 2018, 16, e00454. [Google Scholar] [CrossRef]
- Elith, J.; Leathwick, J.R. Species Distribution Models: Ecological Explanation and Prediction Across Space and Time. Annu. Rev. Ecol. Evol. Syst. 2009, 40, 677–697. [Google Scholar] [CrossRef]
- Wang, G.; Wang, C.; Guo, Z.R.; Dai, L.J.; Wu, Y.Q.; Liu, H.Y.; Li, Y.F.; Chen, H.; Zhang, Y.N.; Zhao, Y.X.; et al. Integrating Maxent model and landscape ecology theory for studying spatiotemporal dynamics of habitat: Suggestions for conservation of endangered Red -crowned crane. Ecol. Indic. 2020, 116, 106472. [Google Scholar] [CrossRef]
- Zhang, G.M.; Zhu, A.X.; Windels, S.K.; Qin, C.Z. Modelling species habitat suitability from presence-only data using kernel density estimation. Ecol. Indic. 2018, 93, 387–396. [Google Scholar] [CrossRef]
- Alamgir, M.; Mukul, S.A.; Turton, S.M. Modelling spatial distribution of critically endangered Asian elephant and Hoolock gibbon in Bangladesh forest ecosystems under a changing climate. Appl. Geogr. 2015, 60, 10–19. [Google Scholar] [CrossRef]
- Saranya, K.; Lakshmi, T.V.; Reddy, C.S. Predicting the potential sites of Chromolaena odorata and Lantana camara in forest landscape of Eastern Ghats using habitat suitability models. Ecol. Inform. 2021, 66, 101455. [Google Scholar] [CrossRef]
- Radosavljevic, A.; Anderson, R.P. Making better Maxent models of species distributions: Complexity, overfitting and evaluation. J. Biogeogr. 2014, 41, 629–643. [Google Scholar] [CrossRef]
- Merow, C.; Smith, M.J.; Silander Jr, J.A. A practical guide to MaxEnt for modeling species’ distributions: What it does, and why inputs and settings matter. Ecography 2013, 36, 1058–1069. [Google Scholar] [CrossRef]
- Warren, D.L.; Seifert, S.N. Ecological niche modeling in Maxent: The importance of model complexity and the performance of model selection criteria. Ecol. Appl. 2011, 21, 335–342. [Google Scholar] [CrossRef] [PubMed] [Green Version]
- Shi, X.; Yin, Q.; Sang, Z.; Zhu, Z.; Jia, Z.; Ma, L. Prediction of potentially suitable areas for the introduction of Magnolia wufengensis under climate change. Ecol. Indic. 2021, 127, 107762. [Google Scholar] [CrossRef]
- Mukul, S.A.; Alamgir, M.; Sohel, M.S.I.; Pert, P.L.; Herbohn, J.; Turton, S.M.; Khan, M.S.I.; Munim, S.A.; Reza, A.; Laurance, W.F. Combined effects of climate change and sea-level rise project dramatic habitat loss of the globally endangered Bengal tiger in the Bangladesh Sundarbans. Sci. Total Environ. 2019, 663, 830–840. [Google Scholar] [CrossRef] [PubMed]
- Panda, R.M.; Behera, M.D. Assessing harmony in distribution patterns of plant invasions: A case study of two invasive alien species in India. Biodivers. Conserv. 2019, 28, 2245–2258. [Google Scholar] [CrossRef]
- Byeon, D.-h.; Jung, S.; Lee, W.-H. Review of CLIMEX and MaxEnt for studying species distribution in South Korea. J. Asia-Pac. Biodivers. 2018, 11, 325–333. [Google Scholar] [CrossRef]
- Yang, Z.; Bai, Y.; Alatalo, J.M.; Huang, Z.; Yang, F.; Pu, X.; Wang, R.; Yang, W.; Guo, X. Spatio-temporal variation in potential habitats for rare and endangered plants and habitat conservation based on the maximum entropy model. Sci. Total Environ. 2021, 784, 147080. [Google Scholar] [CrossRef]
- Wan, J.Z.; Wang, C.J.; Han, S.J.; Yu, J.H. Planning the priority protected areas of endangered orchid species in northeastern China. Biodivers. Conserv. 2014, 23, 1395–1409. [Google Scholar] [CrossRef]
- Olivier, R. Distribution and Status of the Asian Elephant. Oryx 1978, 14, 379–424. [Google Scholar] [CrossRef]
- Menon, V.; Tiwari, S.K. Population status of Asian elephants Elephas maximus and key threats. Int. Zoo Yearb. 2019, 53, 17–30. [Google Scholar] [CrossRef]
- Baskaran, N. An overview of Asian Elephants in the Western Ghats, southern India: Implications for the conservation of Western Ghats ecology. J. Threat. Taxa 2013, 5, 4854–4870. [Google Scholar] [CrossRef] [Green Version]
- Baskaran, N.; Kannan, G.; Anbarasan, U.; Thapa, A.; Sukumar, R. A landscape-level assessment of Asian elephant habitat, its population and elephant-human conflict in the Anamalai hill ranges of southern Western Ghats, India. Mamm. Biol. 2013, 78, 470–481. [Google Scholar] [CrossRef]
- Chen, S.; Sun, G.-Z.; Wang, Y.; Huang, C.; Chen, Y.; Liu, P.; Deng, Y.; Cao, D.-F.; Zhang, M.-X.; Ong, S. A multistakeholder exercise to identify research and conservation priorities for Asian elephants in China. Glob. Ecol. Conserv. 2021, 27, e01561. [Google Scholar] [CrossRef]
- Fernando, P.; Wikramanayake, E.D.; Janaka, H.; Jayasinghe, L.; Gunawardena, M.; Kotagama, S.W.; Weerakoon, D.; Pastorini, J. Ranging behavior of the Asian elephant in Sri Lanka. Mamm. Biol. 2008, 73, 2–13. [Google Scholar] [CrossRef] [Green Version]
- Krishnan, V.; Kumar, M.A.; Raghunathan, G.; Vijayakrishnan, S. Distribution and Habitat Use by Asian Elephants (Elephas maximus) in a Coffee-Dominated Landscape of Southern India. Trop. Conserv. Sci. 2019, 12, 1940082918822599. [Google Scholar] [CrossRef]
- Kumar, M.A.; Mudappa, D.; Raman, T.R.S. Asian elephant Elephas maximus habitat use and ranging in fragmented rainforest and plantations in the Anamalai Hills, India. Trop. Conserv. Sci. 2010, 3, 143–158. [Google Scholar] [CrossRef] [Green Version]
- Nad, C.; Roy, R.; Roy, T.B. Human elephant conflict in changing land-use land-cover scenario in and adjoining region of Buxa tiger reserve, India. Environ. Chall. 2022, 7, 100384. [Google Scholar] [CrossRef]
- Neupane, D.; Kwon, Y.; Risch, T.S.; Williams, A.C.; Johnson, R.L. Habitat use by Asian elephants: Context matters. Glob. Ecol. Conserv. 2019, 17, e00570. [Google Scholar] [CrossRef]
- Puyravaud, J.P.; Cushman, S.; Davidar, P.; Madappa, D. Predicting landscape connectivity for the Asian elephant in its largest remaining subpopulation. Anim. Conserv. 2017, 20, 225–234. [Google Scholar] [CrossRef]
- Santiapillai, C.; Chambers, M.; Ishwaran, N. Aspects of the ecology of the Asian elephant Elephas maximus L. in the Ruhuna National Park, Sri Lanka. Biol. Conserv. 1984, 29, 47–61. [Google Scholar] [CrossRef]
- SUKUMAR, R. A brief review of the status, distribution and biology of wild Asian elephants Elephas maximus. Int. Zoo Yearb. 2006, 40, 1–8. [Google Scholar] [CrossRef]
- Chaiyarat, R.; Youngpoy, N.; Prempree, P. Wild Asian elephant Elephas maximus population in Salakpra Wildlife Sanctuary, Thailand. Endanger. Species Res. 2015, 29, 95–102. [Google Scholar] [CrossRef] [Green Version]
- Htet, N.N.P.; Chaiyarat, R.; Thongthip, N.; Anuracpreeda, P.; Youngpoy, N.; Chompoopong, P. Population and distribution of wild Asian elephants (Elephas maximus) in Phu Khieo Wildlife Sanctuary, Thailand. PeerJ 2021, 9, e11896. [Google Scholar] [CrossRef] [PubMed]
- Pradhan, N.M.B.; Wegge, P. Dry season habitat selection by a recolonizing population of Asian elephantsElephas maximus in lowland Nepal. Acta Theriol. 2007, 52, 205–214. [Google Scholar] [CrossRef]
- Neupane, D.; Kwon, Y.; Risch, T.S.; Johnson, R.L. Changes in habitat suitability over a two decade period before and after Asian elephant recolonization. Glob. Ecol. Conserv. 2020, 22, e01023. [Google Scholar] [CrossRef]
- Li, W.; Yu, Y.; Liu, P.; Tang, R.; Dai, Y.; Li, L.; Zhang, L. Identifying climate refugia and its potential impact on small population of Asian elephant (Elephas maximus) in China. Glob. Ecol. Conserv. 2019, 19, e00664. [Google Scholar] [CrossRef]
- Mandal, M.; Das Chatterjee, N. Geospatial approach-based delineation of elephant habitat suitability zones and its consequence in Mayurjharna Elephant Reserve, India. Environ. Dev. Sustain. 2021, 23, 17788–17809. [Google Scholar] [CrossRef]
- Bandara, J.S.; Cai, Y. The impact of climate change on food crop productivity, food prices and food security in South Asia. Econ. Anal. Policy 2014, 44, 451–465. [Google Scholar] [CrossRef]
- Supharatid, S.; Nafung, J.; Aribarg, T. Projected changes in temperature and precipitation over mainland Southeast Asia by CMIP6 models. J. Water Clim. Chang. 2022, 13, 337–356. [Google Scholar] [CrossRef]
- Almazroui, M.; Saeed, S.; Saeed, F.; Islam, M.N.; Ismail, M. Projections of Precipitation and Temperature over the South Asian Countries in CMIP6. Earth Syst. Environ. 2020, 4, 297–320. [Google Scholar] [CrossRef]
- Kanagaraj, R.; Araujo, M.B.; Barman, R.; Davidar, P.; De, R.; Digal, D.K.; Gopi, G.V.; Johnsingh, A.J.T.; Kakati, K.; Kramer-Schadt, S.; et al. Predicting range shifts of Asian elephants under global change. Divers. Distrib. 2019, 25, 822–838. [Google Scholar] [CrossRef] [Green Version]
- Vidya, T.; Thuppil, V. Immediate behavioural responses of humans and Asian elephants in the context of road traffic in southern India. Biol. Conserv. 2010, 143, 1891–1900. [Google Scholar] [CrossRef]
- Fernando, P.; Wikramanayake, E.; Weerakoon, D.; Jayasinghe, L.K.A.; Gunawardene, M.; Janaka, H.K. Perceptions and patterns of human-elephant conflict in old and new settlements in Sri Lanka: Insights for mitigation and management. Biodivers. Conserv. 2005, 14, 2465–2481. [Google Scholar] [CrossRef]
- Goswami, V.R.; Medhi, K.; Nichols, J.D.; Oli, M.K. Mechanistic understanding of human-wildlife conflict through a novel application of dynamic occupancy models. Conserv. Biol. 2015, 29, 1100–1110. [Google Scholar] [CrossRef]
- Alfred, R.; Ahmad, A.H.; Payne, J.; Williams, C.; Ambu, L.N.; How, P.M.; Goossens, B. Home Range and Ranging Behaviour of Bornean Elephant (Elephas maximus borneensis) Females. PLoS ONE 2012, 7, e31400. [Google Scholar] [CrossRef] [Green Version]
- Sharma, P.; Panthi, S.; Yadav, S.K.; Bhatta, M.; Karki, A.; Duncan, T.; Poudel, M.; Acharya, K.P. Suitable habitat of wild Asian elephant in Western Terai of Nepal. Ecol. Evol. 2020, 10, 6112–6119. [Google Scholar] [CrossRef]
- Taher, T.M.; Lihan, T.; Arifin, N.A.T.; Khodri, N.F.; Mustapha, M.A.; Patah, P.A.; Razali, S.H.A.; Nor, S.M. Characteristic of habitat suitability for the Asian elephant in the fragmented Ulu Jelai Forest Reserve, Peninsular Malaysia. Trop. Ecol. 2021, 62, 347–358. [Google Scholar] [CrossRef]
- de Silva, S.; Wu, T.; Thieme, A.; Johnson, J.; Nyhus, P.; Wadey, J.; Vu, T.; Mossbrucker, A.; Neang, T.; Chen, B.; et al. The Past, Present and Future of Elephant Landscapes in Asia. bioRxiv 2020. [Google Scholar] [CrossRef]
- Chape, S.; Harrison, J.; Spalding, M.; Lysenko, I. Measuring the extent and effectiveness of protected areas as an indicator for meeting global biodiversity targets. Philos. Trans. R. Soc. B-Biol. Sci. 2005, 360, 443–455. [Google Scholar] [CrossRef] [Green Version]
- Swart, C.; Donaldson, J.; Barker, N. Predicting the distribution of Encephalartos latifrons, a critically endangered cycad in South Africa. Biodivers. Conserv. 2018, 27, 1961–1980. [Google Scholar] [CrossRef] [Green Version]
- Williams, C.; Tiwari, S.K.; Goswami, V.R.; De Silva, S.; Kumar, A.; Baskaran, N.; Yoganand, K.; Menon, V. Elephas Maximus. The IUCN Red List of Threatened Species 2020: e.T7140A45818198; IUCN: Gland, Switzerland, 2020. [Google Scholar] [CrossRef]
- Divya; Mehrotra, R. Climate-Change And Hydrology With Emphasis On The Indian Subcontinent. Hydrol. Sci. J. J. Des. Sci. Hydrol. 1995, 40, 231–242. [Google Scholar] [CrossRef]
- Goswami, B.N. South Asian Monsoon. Intraseasonal Variability in the Atmosphere-Ocean Climate System; Lau, W.K.M., Waliser, D.E., Eds.; Praxis: San Jose, CA, USA, 2005. [Google Scholar] [CrossRef]
- Loo, Y.Y.; Billa, L.; Singh, A. Effect of climate change on seasonal monsoon in Asia and its impact on the variability of monsoon rainfall in Southeast Asia. Geosci. Front. 2015, 6, 817–823. [Google Scholar] [CrossRef] [Green Version]
- Gbif.Org. GBIF Occurrence Download. 2020. Available online: https://www.gbif.org/occurrence/download/0088548-200613084148143 (accessed on 21 October 2020).
- Jarvis, A.; Reuter, H.I.; Nelson, A.; Guevara, E. Hole-filled seamless SRTM data V4, International Centre for Tropical Agriculture (CIAT). 2008. Available online: https://srtm.csi.cgiar.org (accessed on 4 November 2020).
- Lehner, B.; Verdin, K.L.; Jarvis, A. New global hydrography derived from spaceborne elevation data. Eos Trans. Am. Geophys. Union 2008, 89, 93–94. [Google Scholar] [CrossRef]
- Didan, K. MOD13A2 MODIS/Terra Vegetation Indices 16-Day L3 Global 1km SIN Grid V006. 2015. Available online: https://developers.google.com/earth-engine/datasets/catalog/MODIS_006_MOD13A2?hl=en (accessed on 5 June 2021).
- Myneni, R.; Knyazikhin, Y.; Park, T. MOD15A2H MODIS/Terra Leaf Area Index/FPAR 8-Day L4 Global 500m SIN Grid V006. 2015. Available online: https://developers.google.com/earth-engine/datasets/catalog/MODIS_006_MOD15A2H?hl=en (accessed on 5 June 2021).
- DiMiceli, C.; Carroll, M.; Sohlberg, R.; Kim, D.; Kelly, M.; Townshend, J. MOD44B MODIS/Terra Vegetation Continuous Fields Yearly L3 Global 250m SIN Grid V006. 2015. Available online: https://developers.google.com/earth-engine/datasets/catalog/MODIS_006_MOD44B?hl=en (accessed on 6 June 2021).
- Simard, M.; Pinto, N.; Fisher, J.B.; Baccini, A. Mapping forest canopy height globally with spaceborne lidar. J. Geophys. Res. Biogeosci. 2011, 116. [Google Scholar] [CrossRef] [Green Version]
- ESA. Land Cover CCI Product User Guide Version 2. 2017. Available online: Maps.elie.ucl.ac.be/CCI/viewer/download/ESACCI-LC-Ph2-PUGv2_2.0.pdf (accessed on 28 August 2020).
- Tratalos, J.; Fuller, R.A.; Warren, P.H.; Davies, R.G.; Gaston, K.J. Urban form, biodiversity potential and ecosystem services. Landsc. Urban Plan. 2007, 83, 308–317. [Google Scholar] [CrossRef]
- Fischer, J.; Brosi, B.; Daily, G.C.; Ehrlich, P.R.; Goldman, R.; Goldstein, J.; Lindenmayer, D.B.; Manning, A.D.; Mooney, H.A.; Pejchar, L.; et al. Should agricultural policies encourage land sparing or wildlife-friendly farming? Front. Ecol. Environ. 2008, 6, 382–387. [Google Scholar] [CrossRef]
- Pant, G.; Dhakal, M.; Pradhan, N.M.B.; Leverington, F.; Hockings, M. Nature and extent of human-elephant Elephas maximus conflict in central Nepal. Oryx 2016, 50, 724–731. [Google Scholar] [CrossRef] [Green Version]
- Scrizzi, A.; Le Bel, S.; La Grange, M.; Cornelis, D.; Mabika, C.T.; Czudek, R. Urban human-elephant conflict in Zimbabwe: A case study of the mitigation endeavour. Pachyderm 2017, 59, 76–85. [Google Scholar]
- Adams, T.S.F.; Chase, M.J.; Leggett, K.E.A. Elephant movements in different human land-uses in Chobe District, Botswana. Pachyderm 2020, 62, 74–86. [Google Scholar]
- Marcacci, G.; Westphal, C.; Wenzel, A.; Raj, V.; Nölke, N.; Tscharntke, T.; Grass, I. Taxonomic and functional homogenization of farmland birds along an urbanization gradient in a tropical megacity. Glob. Chang. Biol. 2021, 27, 4980–4994. [Google Scholar] [CrossRef]
- Hamblin, A.L.; Youngsteadt, E.; López-Uribe, M.M.; Frank, S.D. Physiological thermal limits predict differential responses of bees to urban heat-island effects. Biol. Lett. 2017, 13, 20170125. [Google Scholar] [CrossRef]
- Kosicki, J.Z. The impact of artificial light at night on taxonomic, functional and phylogenetic bird species communities in a large geographical range: A modelling approach. Sci. Total Environ. 2021, 780, 146434. [Google Scholar] [CrossRef]
- Tatem, A.J. WorldPop, open data for spatial demography. Sci. Data 2017, 4, 170004. [Google Scholar] [CrossRef]
- Open Street Map Contributors. Planet Dump. 2015. Available online: https://www.openstreetmap.org (accessed on 1 February 2021).
- Meijer, J.R.; Huijbregts, M.A.J.; Schotten, K.C.G.J.; Schipper, A.M. Global patterns of current and future road infrastructure. Environ. Res. Lett. 2018, 13, 064006. [Google Scholar] [CrossRef] [Green Version]
- Fick, S.E.; Hijmans, R.J. WorldClim 2: New 1-km spatial resolution climate surfaces for global land areas. Int. J. Climatol. 2017, 37, 4302–4315. [Google Scholar] [CrossRef]
- Title, P.O.; Bemmels, J.B. ENVIREM: An expanded set of bioclimatic and topographic variables increases flexibility and improves performance of ecological niche modeling. Ecography 2018, 41, 291–307. [Google Scholar] [CrossRef] [Green Version]
- Trabucco, A.Z.; Robert, J. Global High-Resolution Soil-Water Balance. Figshare Fileset 2019, 10, m9. [Google Scholar] [CrossRef]
- Sheppard, C.S. How does selection of climate variables affect predictions of species distributions? A case study of three new weeds in New Zealand. Weed Res. 2013, 53, 259–268. [Google Scholar] [CrossRef]
- Li, Y.C.; Li, M.Y.; Li, C.; Liu, Z.Z. Optimized Maxent Model Predictions of Climate Change Impacts on the Suitable Distribution of Cunninghamia lanceolata in China. Forests 2020, 11, 302. [Google Scholar] [CrossRef] [Green Version]
- Phillips, S.J.; Anderson, R.P.; Dudík, M.; Schapire, R.E.; Blair, M.E. Opening the black box: An open-source release of Maxent. Ecography 2017, 40, 887–893. [Google Scholar] [CrossRef]
- Huang, Z.D.; Bai, Y.; Alatalo, J.M.; Yang, Z.Q. Mapping biodiversity conservation priorities for protected areas: A case study in Xishuangbanna Tropical Area, China. Biol. Conserv. 2020, 249, 108741. [Google Scholar] [CrossRef]
- Peterson, A.T.; Papeş, M.; Soberón, J. Rethinking receiver operating characteristic analysis applications in ecological niche modeling. Ecol. Model. 2008, 213, 63–72. [Google Scholar] [CrossRef]
- Peterson, A.; Soberón, J.; Pearson, R.; Anderson, R.; Martínez-Meyer, E.; Nakamura, M.; Araújo, M. Ecological Niches and Geographic Distributions; Princeton University Press: Princeton, NJ, USA, 2011; Volume 49. [Google Scholar]
- Chen, G.; Li, X.; Liu, X.; Chen, Y.; Liang, X.; Leng, J.; Xu, X.; Liao, W.; Qiu, Y.a.; Wu, Q.; et al. Global projections of future urban land expansion under shared socioeconomic pathways. Nat. Commun. 2020, 11, 537. [Google Scholar] [CrossRef] [PubMed] [Green Version]
- Voldoire, A.; Saint-Martin, D.; Sénési, S.; Decharme, B.; Alias, A.; Chevallier, M.; Colin, J.; Guérémy, J.-F.; Michou, M.; Moine, M.-P.; et al. Evaluation of CMIP6 DECK Experiments With CNRM-CM6-1. J. Adv. Modeling Earth Syst. 2019, 11, 2177–2213. [Google Scholar] [CrossRef] [Green Version]
- Eyring, V.; Bony, S.; Meehl, G.A.; Senior, C.A.; Stevens, B.; Stouffer, R.J.; Taylor, K.E. Overview of the Coupled Model Intercomparison Project Phase 6 (CMIP6) experimental design and organization. Geosci. Model Dev. 2016, 9, 1937–1958. [Google Scholar] [CrossRef] [Green Version]
- Shirk, A.J.; McRae, B.H. Gnarly Landscape Utilities: Core Mapper User Guide; The Nature Conservancy: Fort Collins, CO, USA, 2013. [Google Scholar]
- Sukumar, R. The Asian Elephant Ecology and Management; Cambridge University Press: Cambridge, UK, 1993. [Google Scholar]
- Venter, O.; Sanderson, E.W.; Magrach, A.; Allan, J.R.; Beher, J.; Jones, K.R.; Possingham, H.P.; Laurance, W.F.; Wood, P.; Fekete, B.M.; et al. Global terrestrial Human Footprint maps for 1993 and 2009. Sci. Data 2016, 3, 160067. [Google Scholar] [CrossRef] [PubMed] [Green Version]
- Sanderson, E.W.; Jaiteh, M.; Levy, M.A.; Redford, K.H.; Wannebo, A.V.; Woolmer, G. The Human Footprint and the Last of the Wild: The human footprint is a global map of human influence on the land surface, which suggests that human beings are stewards of nature, whether we like it or not. BioScience 2002, 52, 891–904. [Google Scholar] [CrossRef]
- Theobald, D.M.; Kennedy, C.; Chen, B.; Oakleaf, J.; Baruch-Mordo, S.; Kiesecker, J. Earth transformed: Detailed mapping of global human modification from 1990 to 2017. Earth Syst. Sci. Data 2020, 12, 1953–1972. [Google Scholar] [CrossRef]
- UNEP-WCMC and IUCN. Protected Planet: The World Database on Protected Areas (WDPA); UNEP-WCMC and IUCN: Cambridge, UK, 2020; Available online: www.protectedplanet.net (accessed on 25 September 2020).
- Steven, J.; Phillips, M.D.; Robert, E.; Schapire. Maxent software for modeling species niches and distributions (Version 3.4.3). Available online: http://biodiversityinformatics.amnh.org/open_source/maxent/ (accessed on 8 June 2020).
- Pramanik, M.; Diwakar, A.K.; Dash, P.; Szabo, S.; Pal, I. Conservation planning of cash crops species (Garcinia gummi-gutta) under current and future climate in the Western Ghats, India. Environ. Dev. Sustain. 2021, 23, 5345–5370. [Google Scholar] [CrossRef]
- Padalia, H.; Ghosh, S.; Reddy, C.S.; Nandy, S.; Singh, S.; Kumar, A.S. Assessment of historical forest cover loss and fragmentation in Asian elephant ranges in India. Environ. Monit. Assess. 2019, 191, 13. [Google Scholar] [CrossRef]
- Sampson, C.; Leimgruber, P.; Tonkyn, D.; Pastorini, J.; Janaka, H.K.; Sotherden, E.; Fernando, P. Effects of illegal grazing and invasive Lantana camara on Asian elephant habitat use. Biol. Conserv. 2018, 220, 50–59. [Google Scholar] [CrossRef] [Green Version]
- Jayasankar, C.B.; Surendran, S.; Rajendran, K. Robust signals of future projections of Indian summer monsoon rainfall by IPCC AR5 climate models: Role of seasonal cycle and interannual variability. Geophys. Res. Lett. 2015, 42, 3513–3520. [Google Scholar] [CrossRef]
- Lopez-Pujol, J.; Zhang, F.-M.; Ge, S. Plant biodiversity in China: Richly varied, endangered, and in need of conservation. Biodivers. Conserv. 2006, 15, 3983–4026. [Google Scholar] [CrossRef]
- Acharya, K.P.; Paudel, P.K.; Neupane, P.R.; Kohl, M. Human-Wildlife Conflicts in Nepal: Patterns of Human Fatalities and Injuries Caused by Large Mammals. PLoS ONE 2016, 11, e0161717. [Google Scholar] [CrossRef] [PubMed]
- Chen, Y.; Marino, J.; Chen, Y.; Tao, Q.; Sullivan, C.D.; Shi, K.; Macdonald, D.W. Predicting Hotspots of Human-Elephant Conflict to Inform Mitigation Strategies in Xishuangbanna, Southwest China. PLoS ONE 2016, 11, e0162035. [Google Scholar] [CrossRef]
- Gubbi, S.; Swaminath, M.H.; Poornesha, H.C.; Bhat, R.; Raghunath, R. An elephantine challenge: Human-elephant conflict distribution in the largest Asian elephant population, southern India. Biodivers. Conserv. 2014, 23, 633–647. [Google Scholar] [CrossRef]
- Jadhav, S.; Barua, M. The Elephant Vanishes: Impact of human-elephant conflict on people’s wellbeing. Health Place 2012, 18, 1356–1365. [Google Scholar] [CrossRef]
- Lamichhane, B.R.; Subedi, N.; Pokheral, C.P.; Dhakal, M.; Acharya, K.P.; Pradhan, N.M.B.; Smith, J.L.D.; Malla, S.; Thakuri, B.S.; Yackulic, C.B. Using interviews and biological sign surveys to infer seasonal use of forested and agricultural portions of a human-dominated landscape by Asian elephants in Nepal. Ethol. Ecol. Evol. 2018, 30, 331–347. [Google Scholar] [CrossRef]
- Puyravaud, J.-P.; Davidar, P.; Laurance, W.F. Cryptic destruction of India’s native forests. Conserv. Lett. 2010, 3, 390–394. [Google Scholar] [CrossRef]
- Bai, Z.G.; Dent, D.L.; Olsson, L.; Schaepman, M.E. Proxy global assessment of land degradation. Soil Use Manag. 2008, 24, 223–234. [Google Scholar] [CrossRef]
- Jathanna, D.; Karanth, K.U.; Kumar, N.S.; Karanth, K.K.; Goswami, V.R. Patterns and Determinants of Habitat Occupancy by the Asian Elephant in the Western Ghats of Karnataka, India. PLoS ONE 2015, 10, e0133233. [Google Scholar] [CrossRef] [Green Version]
- Madhusudan, M.D. Recovery of wild large herbivores following livestock decline in a tropical Indian wildlife reserve. J. Appl. Ecol. 2004, 41, 858–869. [Google Scholar] [CrossRef]
- Pollock, L.J.; Thuiller, W.; Jetz, W. Large conservation gains possible for global biodiversity facets. Nature 2017, 546, 141–144. [Google Scholar] [CrossRef] [PubMed]
- Liu, L.; Guan, L.; Zhao, H.; Huang, Y.; Mou, Q.; Liu, K.; Chen, T.; Wang, X.; Zhang, Y.; Wei, B.; et al. Modeling habitat suitability of Houttuynia cordata Thunb (Ceercao) using MaxEnt under climate change in China. Ecol. Inform. 2021, 63, 101324. [Google Scholar] [CrossRef]
- Kaiser, H. The dynamics of populations as result of the properties of individual animals. Fortschr. Zool. 1979, 25, 109–136. [Google Scholar]
- Huston, M.; DeAngelis, D.; Post, W. New computer models unify ecological theory: Computer simulations show that many ecological patterns can be explained by interactions among individual organisms. BioScience 1988, 38, 682–691. [Google Scholar] [CrossRef]
- DeAngelis, D.L. Individual-Based Models and Approaches in Ecology: Populations, Communities and Ecosystems; CRC Press: Boca Raton, FL, USA, 2018. [Google Scholar]
- Uchmański, J.; Grimm, V. Individual-based modelling in ecology: What makes the difference? Trends Ecol. Evol. 1996, 11, 437–441. [Google Scholar] [CrossRef]


| Class Number | ESA CCI LC Class Number | Description |
|---|---|---|
| 0 | 210 | Water body |
| 1 | 10–20 | Cropland |
| 2 | 30–40 | Mosaic of cropland and natural vegetation |
| 3 | 190 | Urban |
| 4 | 50 | Evergreen broad-leaved forest |
| 5 | 60–62 | Deciduous broad-leaved forest |
| 6 | 70–72 | Evergreen needle-leaved forest |
| 7 | 80–82 | Deciduous needle-leaved forest |
| 8 | 90 | Mixed forests |
| 9 | 100–110 | Mosaic of tree, shrub, and herbaceous |
| 10 | 120–122 | Shrubland |
| 11 | 130 | Grass |
| 12 | 140 | Lichens and mosses |
| 13 | 150–153 | Sparse vegetation |
| 14 | 160–180 | Flooded trees and shrubs |
| 15 | 200–202 | Bare |
| 16 | 220 | Snow and ice |
| Source | Variable | Source | Variable |
|---|---|---|---|
| WorldClim | Annual Mean Temperature | ENVIREM | Aridity Index |
| Mean Diurnal Range | Climatic Moisture Index | ||
| Isothermality | Continentality | ||
| Temperature Seasonality | Pluviothermic Quotient | ||
| Max Temperature of Warmest Month | Growing Degree Days (0 °C) | ||
| Min Temperature of Coldest Month | Growing Degree Days (5 °C) | ||
| Temperature Annual Range | Max Temperature of Coldest Month | ||
| Mean Temperature of Wettest Quarter | Min Temperature of Warmest Month | ||
| Mean Temperature of Driest Quarter | Count of Month Greater than 10 °C | ||
| Mean Temperature of Warmest Quarter | PET of Coldest Quarter | ||
| Mean Temperature of Coldest Quarter | PET of Driest Quarter | ||
| Annual Precipitation | PET Seasonality | ||
| Precipitation of Wettest Month | PET of Warmest Quarter | ||
| Precipitation of Driest Month | PET of Wettest Quarter | ||
| Precipitation Seasonality | Annual PET | ||
| Precipitation of Wettest Quarter | CGIAR-CSI | Annual AET | |
| Precipitation of Driest Quarter | |||
| Precipitation of Warmest Quarter | |||
| Precipitation of Coldest Quarter |
| Pressure | Scores | Description | Time | Source |
|---|---|---|---|---|
| Build | 0, 10 | All builds set with a score of 10 | 2000–2018 | ESA CCI LC [59] |
| Cropland | 0, 7 | All croplands set with a score of 7 | 2000–2018 | ESA CCI LC [59] |
| Pasture * | 0–4 | All pastures set with a score ranged 0–4 based on intensity | 2000 | Farming the planet [88] |
| Reservoir | 0, 7 | All reservoirs set with a score of 7 | 2000–2018 | GRanD [89] |
| Population | 0–10 | 2000–2018 | Worldpop [68] | |
| Night light | 0–10 | Equal quintile bins | 2000–2018 | VIIRS-Like [90] |
| Road * | 0, 8 Direct | 500 m either side of roads given a direct pressure score of 8 (4.4, 1.5) | 2018 | GRIP [70] |
| 0–4 Indirect | Starting 500 m out from road, pressure score of 4 (2.2, 0.75) exponentially decaying out to 15 km | |||
| Railway * | 0, 8 | 500 m either side of railways given a direct pressure score of 8 | 2018 | openstreetmap [69] |
| Waterway * | 0–4 | Pressure score of 4 exponentially decaying out to 15 km | 2018 | openstreetmap [69] |
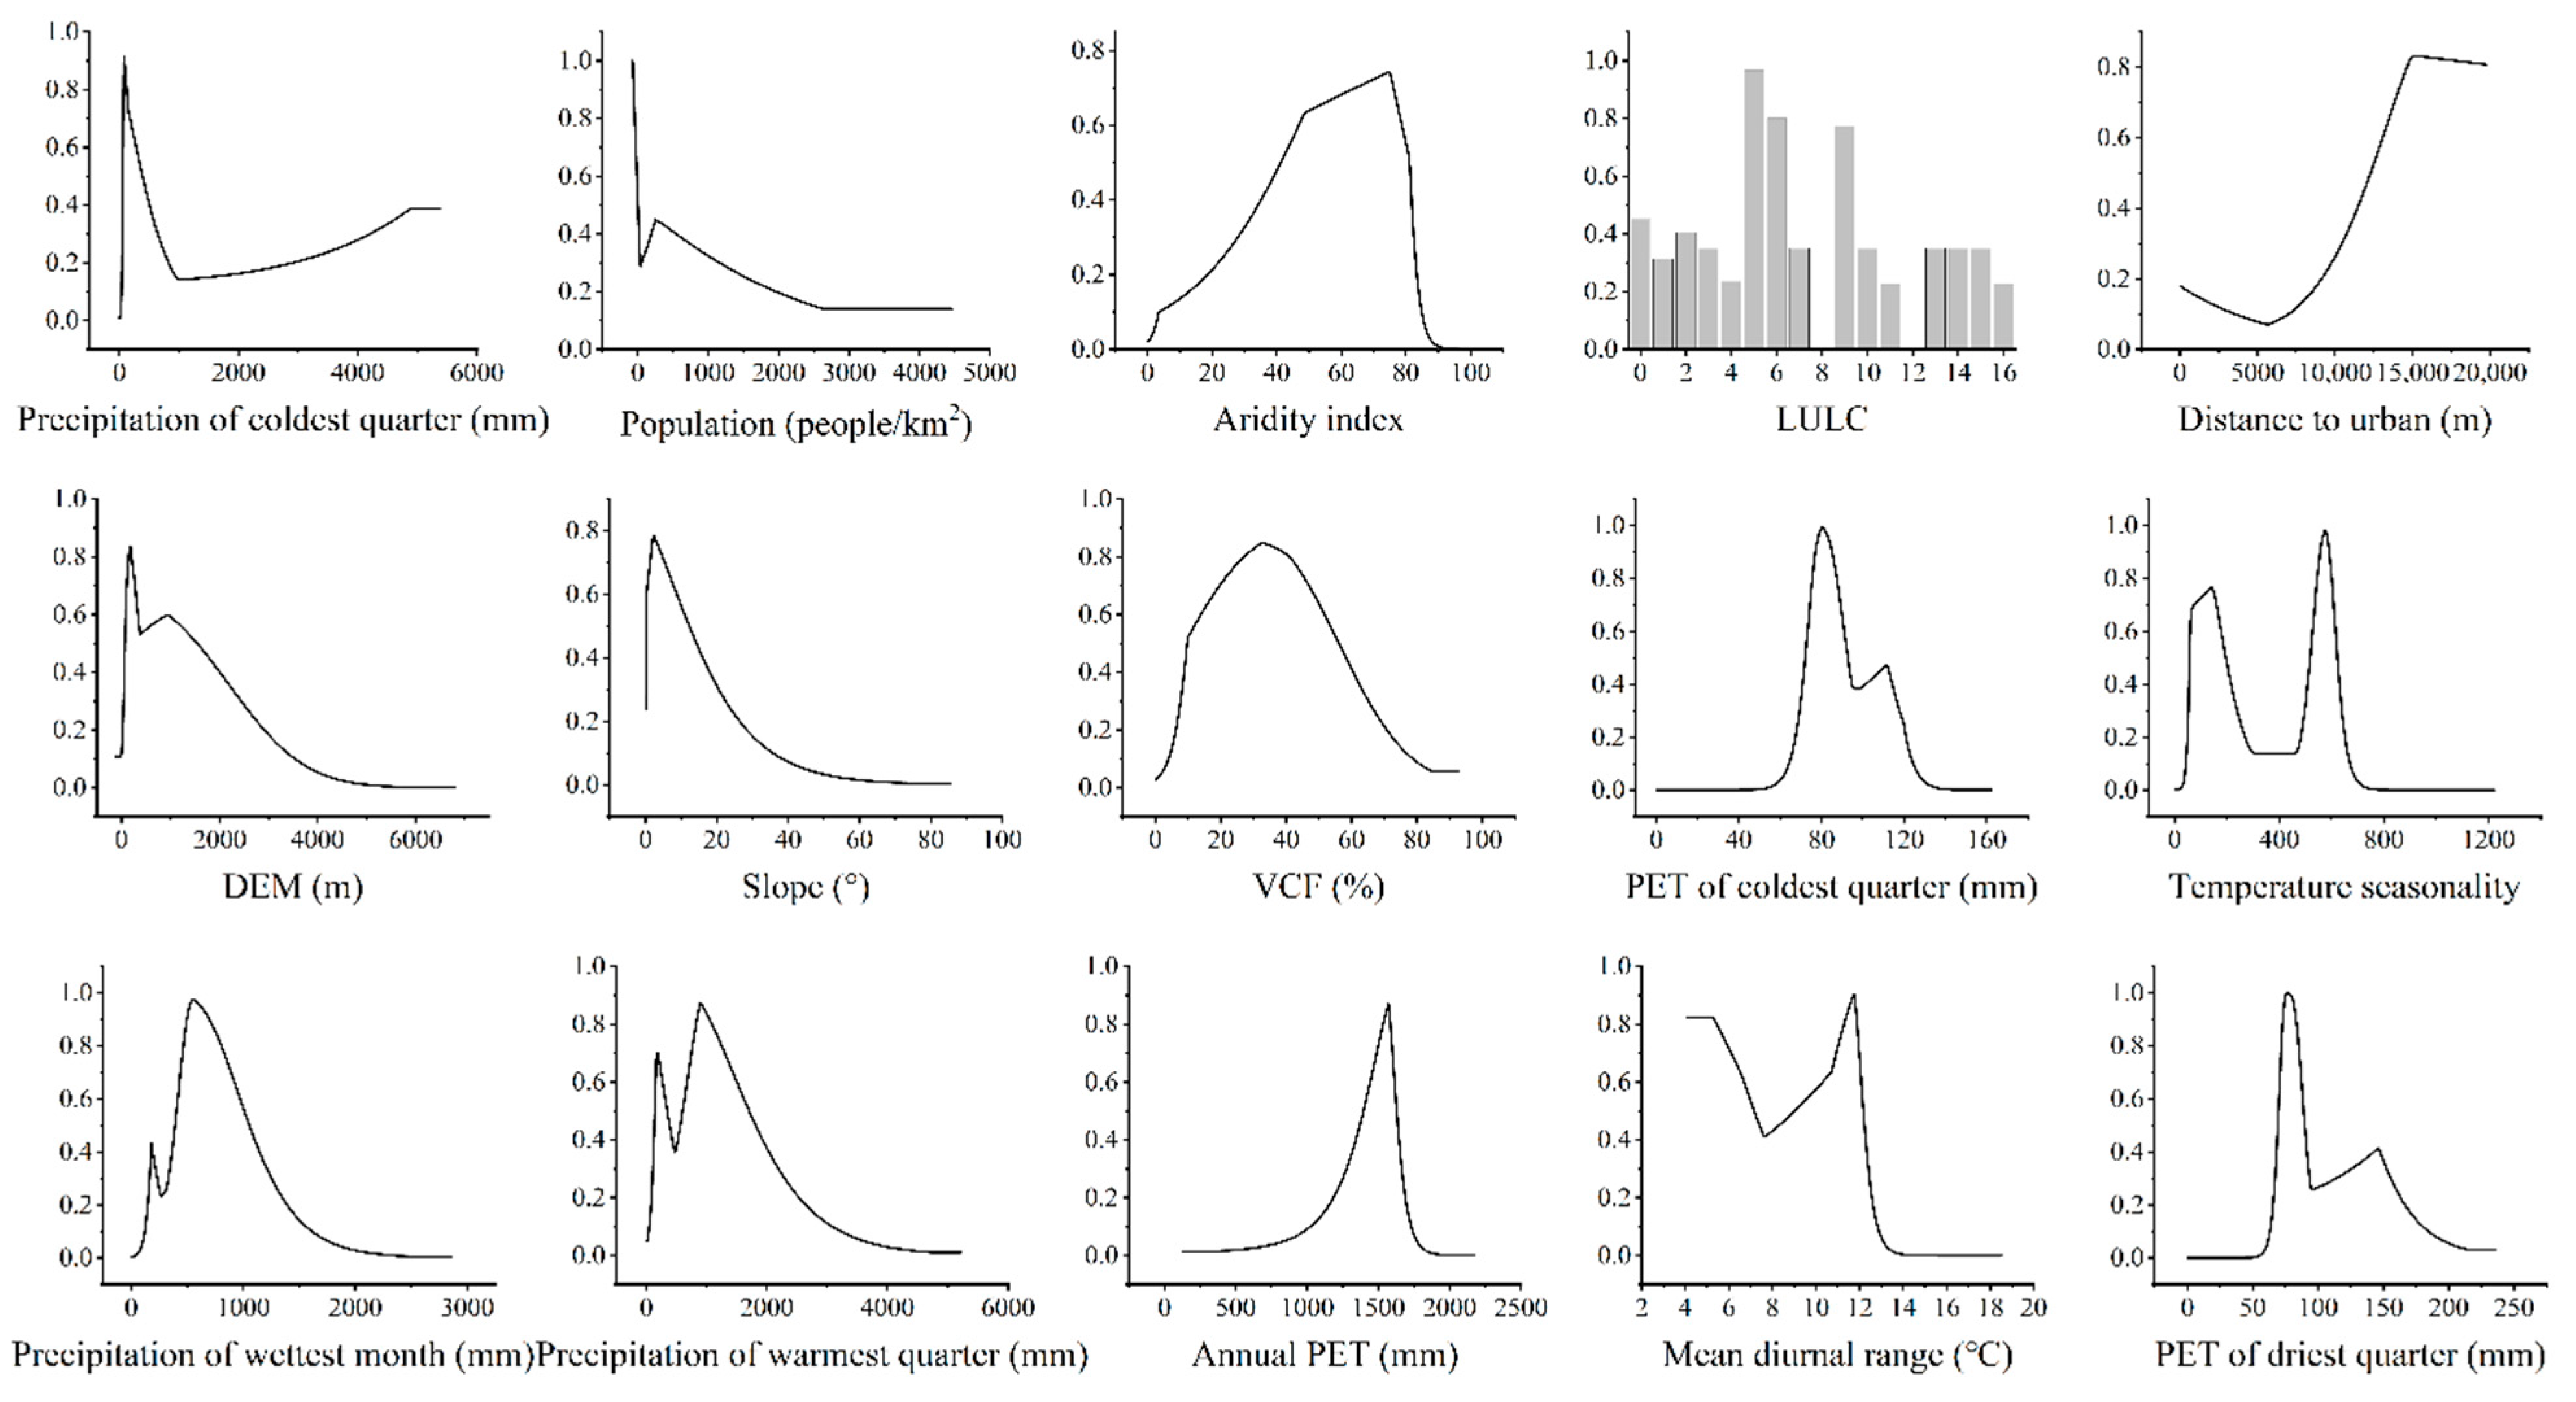
| Variable | Percent Contribution | Type |
|---|---|---|
| Precipitation of coldest quarter * | 25.1 | Climatic |
| Population | 22.9 | Anthropogenic |
| Aridity index * | 13.4 | Climatic |
| LULC * | 5.4 | Anthropogenic |
| Distance to urban area * | 4.9 | Anthropogenic |
| DEM | 4 | Topographical |
| Slope | 4 | Topographical |
| VCF | 3.7 | Vegetation |
| PET of coldest quarter * | 3.7 | Climatic |
| Temperature seasonality * | 3.5 | Climatic |
| Precipitation of wettest month * | 3 | Climatic |
| Precipitation of warmest quarter * | 2.7 | Climatic |
| Annual PET * | 1.3 | Climatic |
| Mean diurnal range * | 1.3 | Climatic |
| PET of driest quarter * | 1.1 | Climatic |
Publisher’s Note: MDPI stays neutral with regard to jurisdictional claims in published maps and institutional affiliations. |
© 2022 by the authors. Licensee MDPI, Basel, Switzerland. This article is an open access article distributed under the terms and conditions of the Creative Commons Attribution (CC BY) license (https://creativecommons.org/licenses/by/4.0/).
Share and Cite
Yang, W.; Ma, Y.; Jing, L.; Wang, S.; Sun, Z.; Tang, Y.; Li, H. Differential Impacts of Climatic and Land Use Changes on Habitat Suitability and Protected Area Adequacy across the Asian Elephant’s Range. Sustainability 2022, 14, 4933. https://doi.org/10.3390/su14094933
Yang W, Ma Y, Jing L, Wang S, Sun Z, Tang Y, Li H. Differential Impacts of Climatic and Land Use Changes on Habitat Suitability and Protected Area Adequacy across the Asian Elephant’s Range. Sustainability. 2022; 14(9):4933. https://doi.org/10.3390/su14094933
Chicago/Turabian StyleYang, Wei, Yuanxu Ma, Linhai Jing, Siyuan Wang, Zhongchang Sun, Yunwei Tang, and Hui Li. 2022. "Differential Impacts of Climatic and Land Use Changes on Habitat Suitability and Protected Area Adequacy across the Asian Elephant’s Range" Sustainability 14, no. 9: 4933. https://doi.org/10.3390/su14094933
APA StyleYang, W., Ma, Y., Jing, L., Wang, S., Sun, Z., Tang, Y., & Li, H. (2022). Differential Impacts of Climatic and Land Use Changes on Habitat Suitability and Protected Area Adequacy across the Asian Elephant’s Range. Sustainability, 14(9), 4933. https://doi.org/10.3390/su14094933