Article

Life Cycle Assessment of the High Performance Discontinuous Fibre (HiPerDiF) Technology and Its Operation in Various Countries

1
Faculty of Engineering and Physical Sciences, University of Surrey, Guildford, Surrey GU2 7XH, UK
2
Bristol Composites Institute, Department of Aerospace Engineering, School of Civil, Aerospace and Mechanical Engineering, University of Bristol, Queen’s Building, University Walk, Bristol BS8 1TR, UK
3
National Composites Centre, Bristol & Bath Science Park, Emersons Green, Bristol BS16 7FS, UK
*
Author to whom correspondence should be addressed.
Sustainability 2022, 14(3), 1922; https://doi.org/10.3390/su14031922
Submission received: 24 December 2021 / Revised: 5 February 2022 / Accepted: 5 February 2022 / Published: 8 February 2022

Abstract

:
Composite waste is a growing issue due to the increased global demand for products manufactured from these advanced engineering materials. Current reclamation methods produce short length fibres that, if not realigned during remanufacture, result in low-value additives for non-structural applications. Consequently, to maximise the economic and functional potential, fibre realignment must occur. The High Performance Discontinuous Fibre (HiPerDiF) technology is a novel process that produces highly aligned discontinuous fibre-reinforced composites, which largely meet the structural performance of virgin fibres, but to date, the environmental performance of the machine is yet to be quantified. This study assessed the environmental impacts of the operation of the machine using life cycle assessment methodology. Electrical energy consumption accounts for the majority of the greenhouse gas emissions, with water consumption as the main contributor to ecosystem quality damage. Suggestions have been made to reduce energy demand and reuse the water in order to reduce the overall environmental impact. The hypothetical operation of the machine across different European countries was also examined to understand the impacts associated with bulk material transport and electricity from different energy sources. It was observed that the environmental impact showed an inverse correlation with the increased use of renewable sources for electricity generation due to a reduction in air pollutants from fossil fuel combustion. The analysis also revealed that significant reductions in environmental damage from material transport between the reclamation facility to the remanufacturing site should also be accounted for, and concluded that transportation routes predominantly via shipping have a lower environmental impact than road and rail haulage. This study is one of the first attempts to evaluate the environmental impact of this new technology at early conceptual development and to assess how it would operate in a European scenario.

1. Introduction

Carbon fibre reinforced polymer (CFRP) composites have become increasingly popular in several areas of application due to their advantageous mechanical properties (e.g., high specific strength and stiffness) and desirable aesthetic characteristics. In particular, CFRP composites exhibit high specific performance, resistance to corrosion, and high durability [1]; all of which are being explored in earnest for high performing alternatives to metallics which can realise reductions in through-life environmental impact (EI), predominately with lower fuel consumption. However, a growing issue facing the composites industry is the handling of manufacturing waste together with components and products at end of life (EOL). The material waste generated during the production of composites can be up to 50% of total production volume [2] and it is estimated that between 6000 and 8000 commercial aircraft containing CFRP airframes will reach the end of their service lives by 2030 [3]. To prevent the loss of valuable material from the technical product system, the Waste Framework Directive [4] regulates the order of preferential treatment of waste within the European Union (EU). Composite recycling has been largely avoided for years by manufacturers and asset owners due to its complexity, leading to a lack of research and economic investment, especially when disposal via landfill or incineration still attracted low costs. This is further compounded where incineration options can be considered as energy recovery and then meet the requirements within specific legislative targets. In response to this, restrictive fiscal and economic instruments have been put in place to divert composite waste away from incineration and landfill [5]. The Landfill Directive in 1999 [6] has led to several EU member states, such as Germany, banning waste composite to landfill [7]. Specific waste streams have also been targeted, and this is particularly true of the automotive sector, the fastest-growing adopter of CFRP composites, where weight savings of up to 65% can be achieved when replacing steel [8]. The End of Life Vehicle (ELV) Directive is now in place, which requires that a minimum of 85% by weight of all vehicles produced in the EU must be reused or recycled, with only 5% weight permitted to go to landfill [9]. Therefore, as the composite industry continues to grow, the need to develop effective recycling routes is becoming more urgent.
Composite recycling technologies have previously been analysed in three comprehensive reviews [10,11,12]. Many of the established recycling processes for CFRP with a thermoset matrix are two-step comprising of the degradation of the matrix to reclaim the fibres and their subsequent remanufacture into recycled composite intermediate feedstock or final product. Fibre reclamation involves breaking down the covalent cross-links within the thermoset matrix network in the virgin composite either through chemical [13,14] or thermal [10,15,16,17] processes. While these methods have been identified as offering the potential for application, both could benefit from optimisation in order to handle the growing volume of composite waste. The resulting reclaimed carbon fibres (rCFs) are usually fragmented into short lengths of randomly oriented, low-density, “fluffy” filaments due to waste comminution, with areas of fibre breakage induced during handling, processing, and chopping following reclamation. The most accessible way to remanufacture rCFs is via direct moulding techniques such as injection moulding of pelletised material, and compression moulding of bulk moulding compounds and sheet moulding compounds. Alternatively, rCFs can be remanufactured into chopped strand mats [18] or nonwoven mats through processes analogous to wet paper-making [19] or carding, cross-lapping, and needling [20], which can be subsequently spun into yarn [21,22]. However, the best mechanical performance, and therefore the highest value, is achieved following the realignment of the short rCFs with techniques such as the Centrifugal Fibre Alignment Drum developed at the University of Nottingham [23], the Tailorable Feedstock for Forming from the University of Delaware [24], and the High Performance Discontinuous Fibre (HiPerDiF) technology invented at the University of Bristol [25], which forms the basis of the current study.
The potential value of the HiPerDiF technology in remanufacturing rCFs [26,27,28] aiding the recycling of both thermoset [29] and thermoplastic [30,31] matrix composites, and manufacturing waste [32] within a circular economy framework [29,30,31] has been widely demonstrated, and, if deployed in the right applications, could be a key component to deliver the UK Government’s legal commitment for net-zero greenhouse gas (GHG) emissions by 2050 [33]. For industry to achieve this, reliable environmental impact (EI) information based on scientific data must be clearly communicated to customers, government, and wider stakeholders. The global shift in public opinion towards a more environmentally conscious approach means that producers and consumers are increasingly turning to life cycle assessment (LCA) to analyse the EI of products and services. The successful inclusion of LCA is evident across high value manufacturing composite industries already, including marine [34], aerospace [35,36], construction [37,38,39,40], and wind energy [41,42]. This paper aims to evaluate the EI of the HiPerDiF technology through LCA, to highlight any environmental hotspots and identify pathways for technology optimisation. Further analyses have widened the system boundary to consider the practical logistics of operating the technology in various EU location scenarios, incorporating different sources of electrical energy and transportation routes.

2. Background

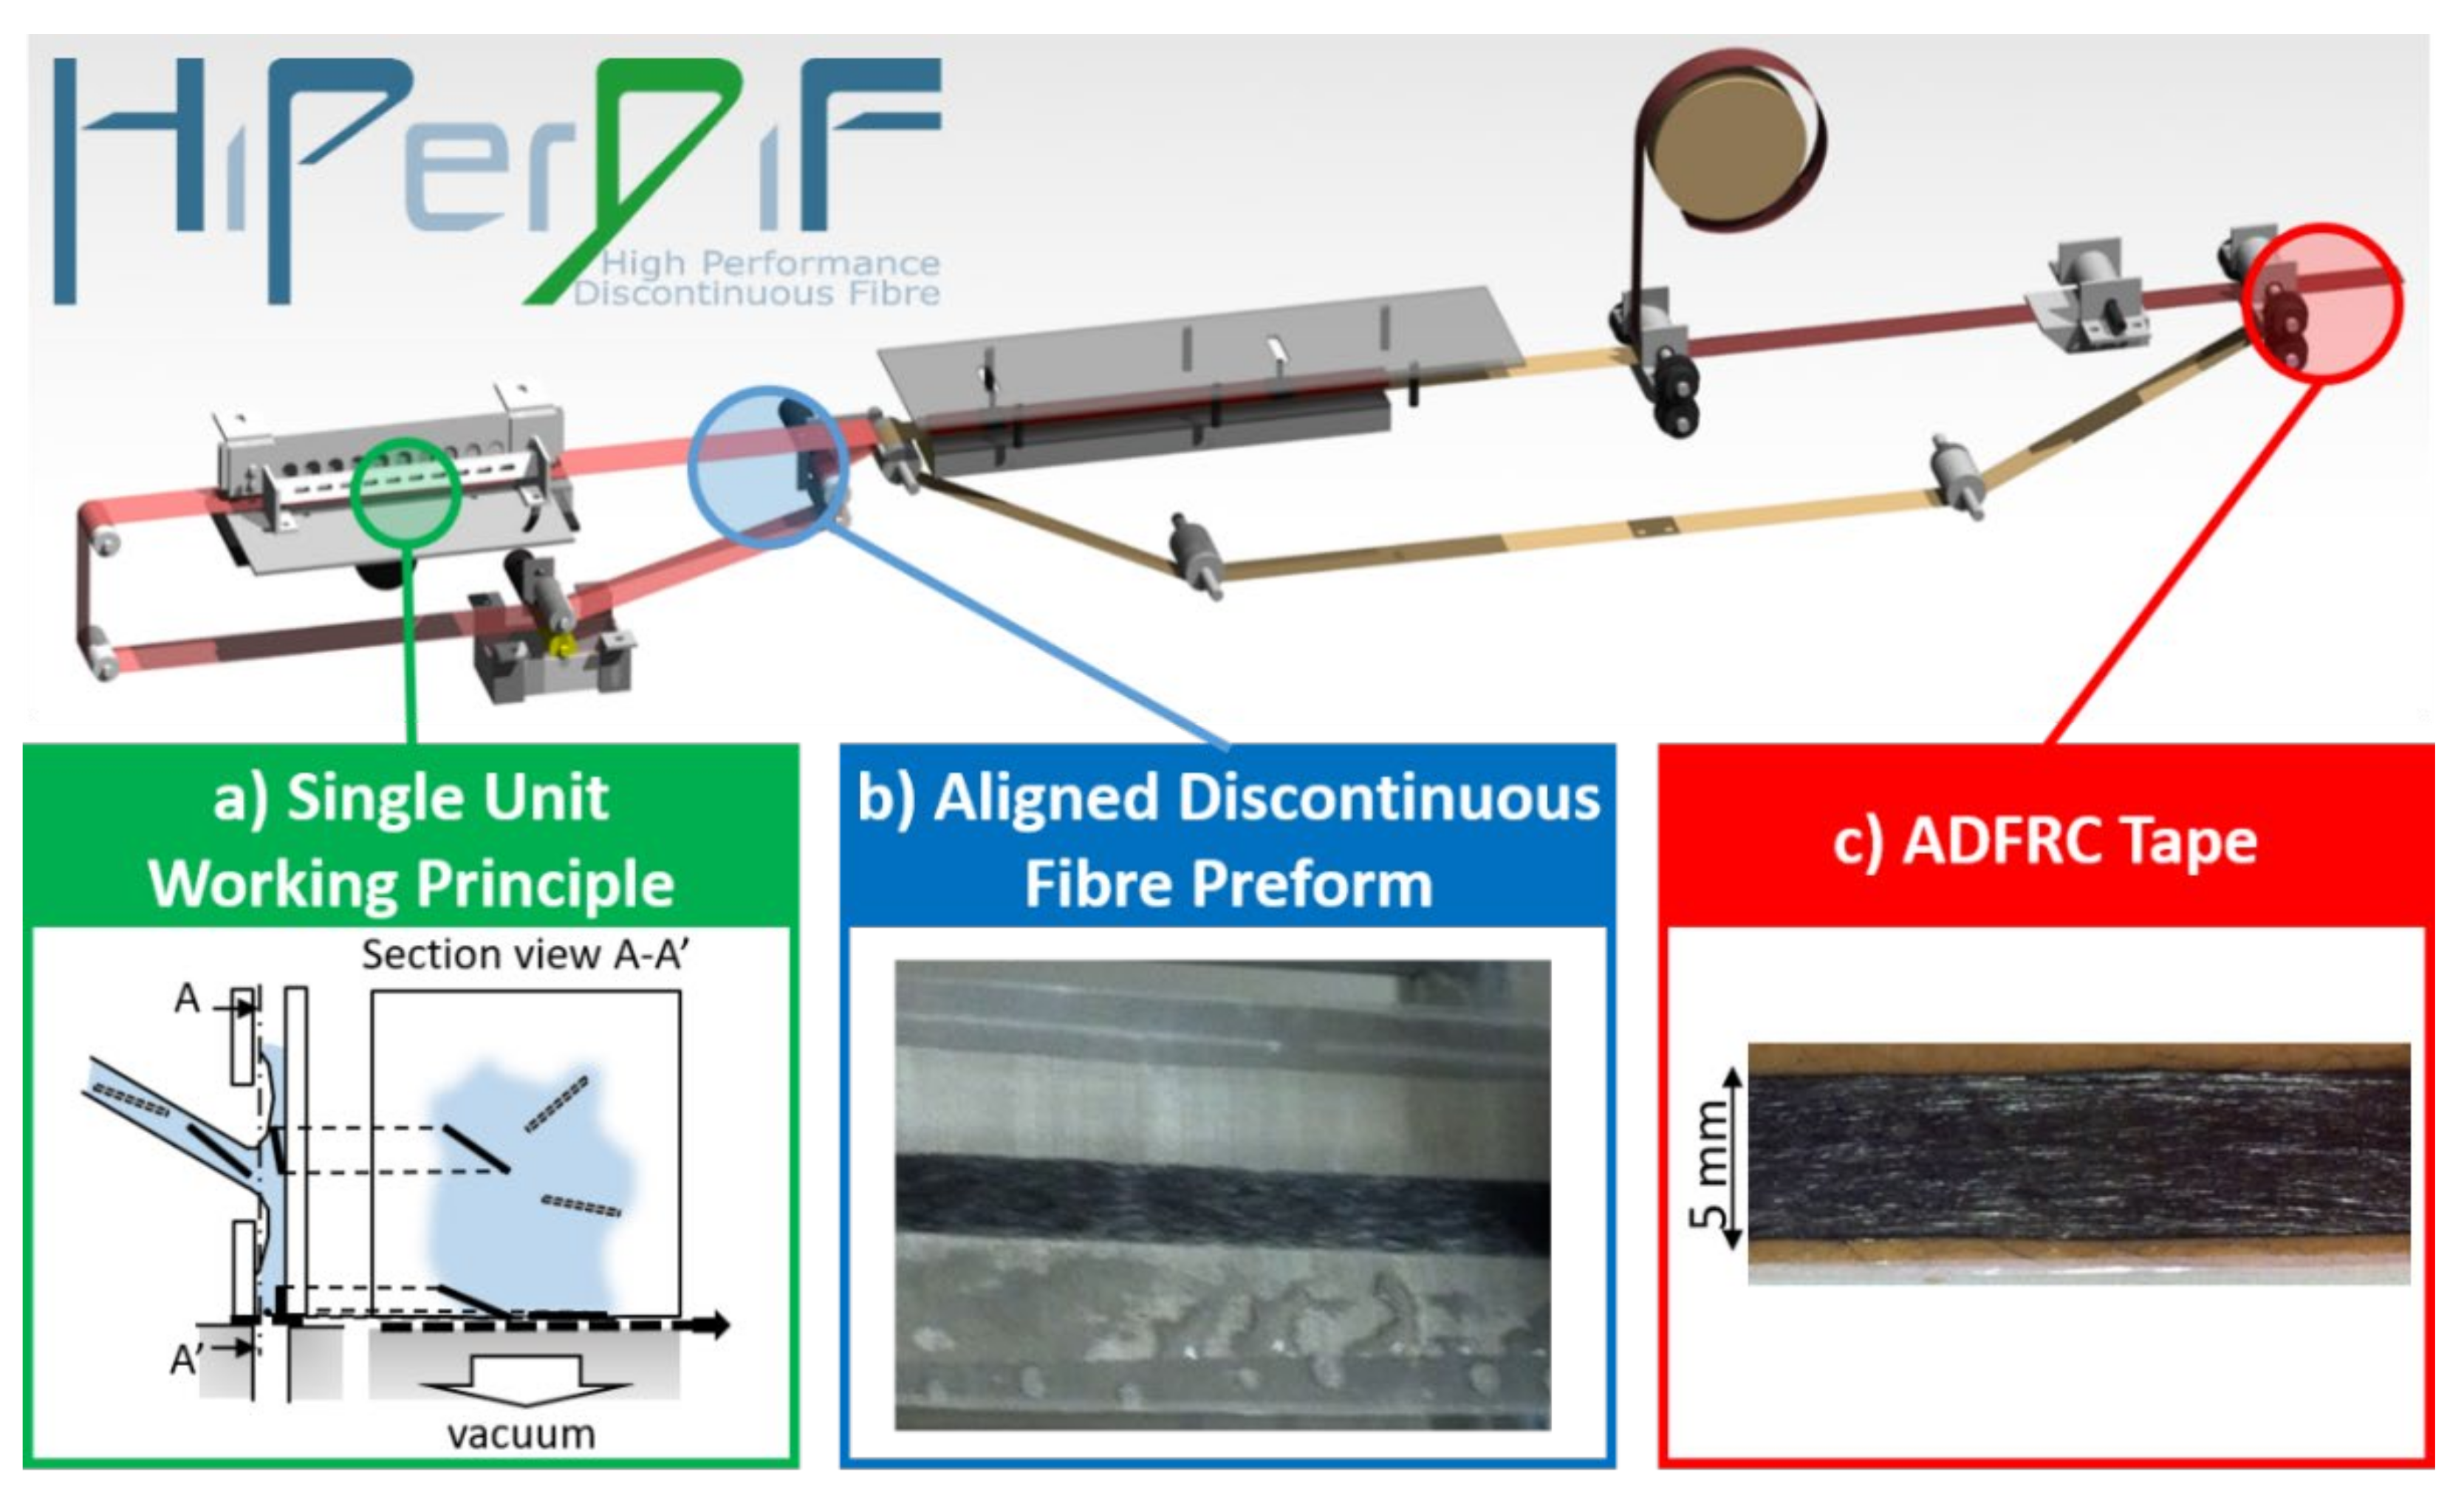
2.1. The HiPerDiF Technology

The HiPerDiF method is a patented manufacturing process [43] to produce highly aligned discontinuous fibre tapes [25]. The third generation of the HiPerDiF machine, capable of high throughput (up to 100 m/hour quantities of prepreg) with full instrumentation, has been constructed at the National Composites Centre (NCC) in Bristol, funded by the Engineering and Physical Sciences Research Council (EPSRC) [27,44] [27]. The focus of this study is on the previous laboratory-scale machine (HiPerDiF 2G), built as a proof of concept for research and development purposes, shown schematically in Figure 1.
At the start of the process, discontinuous fibres of between 1 and 15 mm in length are suspended in a low viscosity aqueous carrier fluid [46]. With the aid of the peristaltic pump, this suspension is accelerated and directed through a series of nozzles towards a course of narrowly spaced parallel plates, demonstrated in Figure 1a. The alignment mechanism relies on a sudden liquid momentum change upon impact with the plates [47,48]. The aligned fibres are subsequently carried along a conveyor belt whilst the water medium is removed by vacuum suction and the fibre preform is dried via infrared heater (see Figure 1b). The result is a dry fibre preform-tape ready for impregnation with resin (Figure 1c). A recovery system allows the machine to recirculate and reuse part of the carrier fluid. Other than the reclaimed material and the polymer film that constitutes the new matrix, the HiPerDiF system only requires electrical energy and water as inputs.
The HiPerDiF technology has been used to remanufacture carbon fibres reclaimed both with pyrolytic and solvolytic processes [26,28], as well as manufacturing waste [32], into high performance recycled composites. Moreover, it was used to intermingle rCF and natural fibres to obtain functionalised materials with potential vibration damping applications [27]. The mechanical advantages of HiPerDiF technology for the remanufacture of reclaimed fibres are evident, with clear retention of preferred characteristics demonstrated: Longana et al. observed a 26% increase in stiffness and 77% increase in strength for a quasi-isotropic composite made from HiPerDiF aligned tape preforms from randomly orientated composite [45].

2.2. Life Cycle Assessment of FRP Material

LCA is a structured method using a holistic systems-based approach to identify the environmental hotspots through a product’s life cycle, from the raw material extraction and product assembly through to its use and EOL disposal options. A four-phase framework to complete an LCA is collated into a set of International Standard Organisation rules [49,50], which maintain enough flexibility to allow its application to any product or process. These are:
  • Goal and scope definition: establishing the reason for the study and defining the system under review. Whilst LCAs are based on qualified scientific data, they can have subjective elements, for example, the chosen system boundary, functional unit, or underlying assumptions, which must all be declared before carrying out the data collection phase.
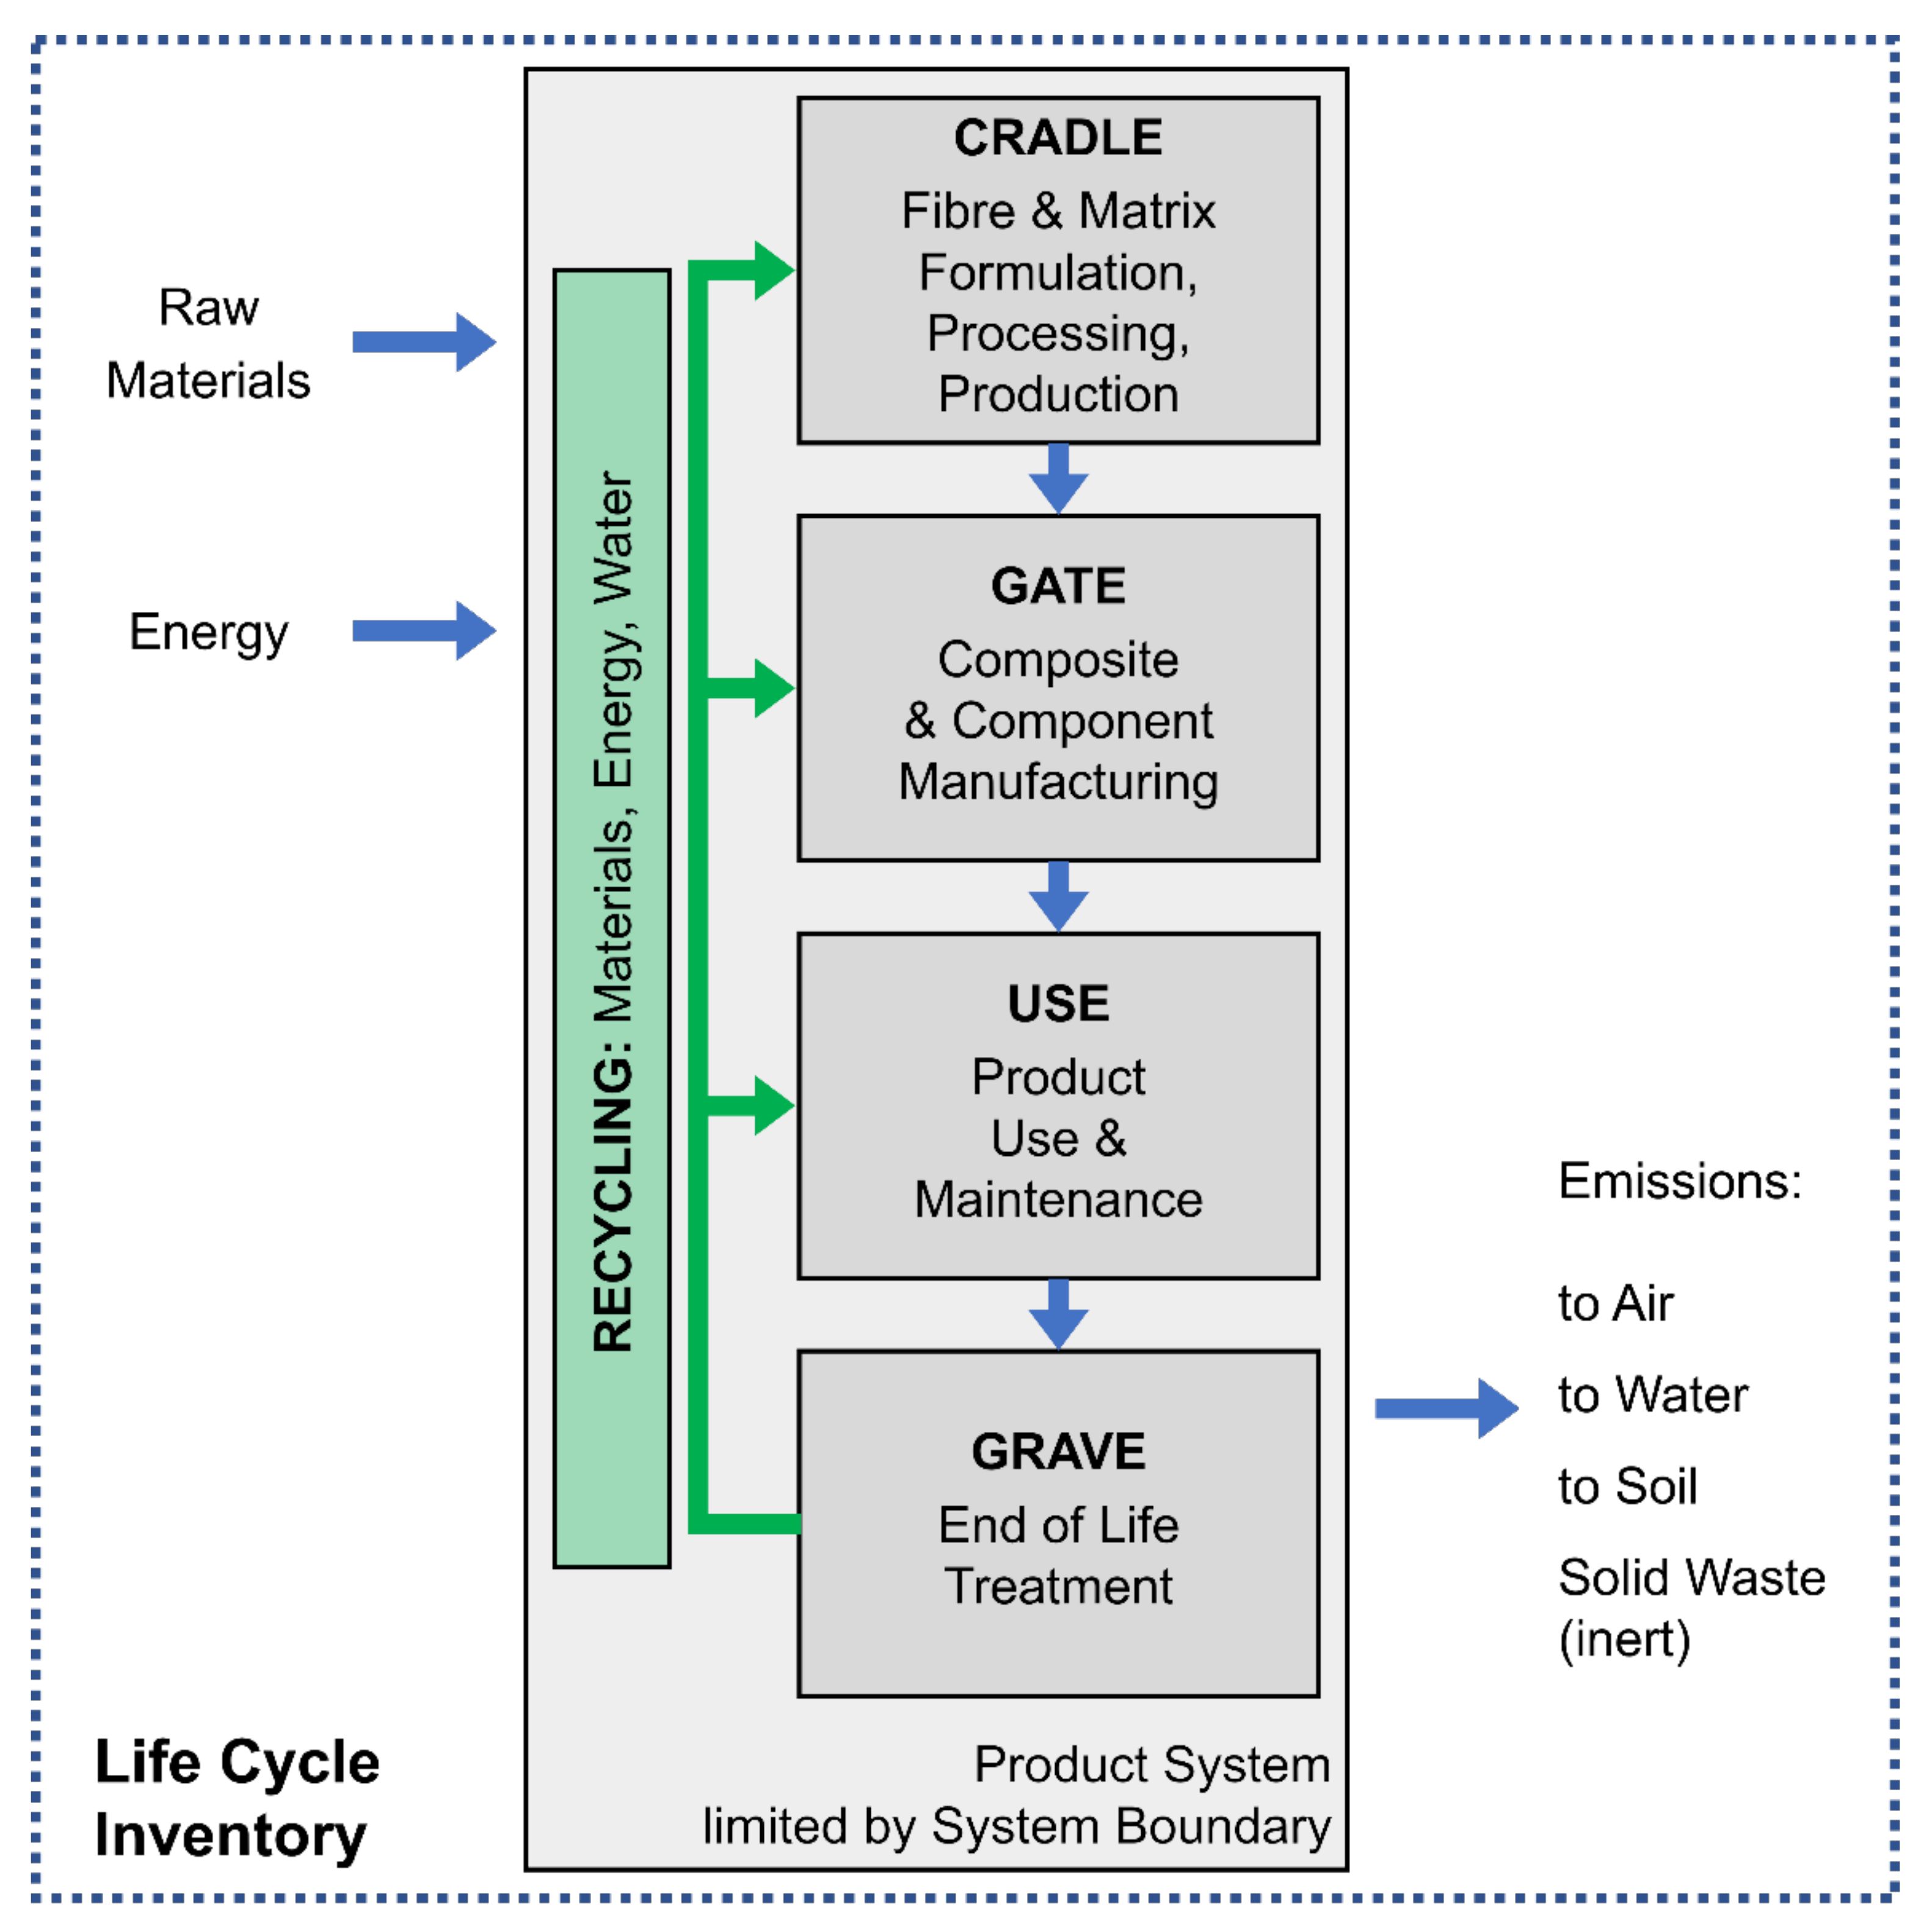
  • Inventory analysis: an inventory collates the inputs, outputs, and other environmental aspects within the system boundary for the functional unit. Figure 2 represents a schematic of a composite material product LCA, with materials and energy as inputs and waste materials and emissions as the outputs, collected during the inventory analysis stage for a cradle-to-grave system.
  • Impact assessment: the inventory data are weighted and characterised to show the impacts on natural resources, the environment, and human health.
  • Interpretation: results are analysed. To ensure meaningful conclusions from LCA, a critical approach to interpreting the results is achieved through a series of checks throughout the assessment.
Figure 2. Schematic of LCA system, adapted from [51].
Sustainability 14 01922 g002
LCA manages a large amount of complex data and is designed to clearly communicate this information to a wide audience. The holistic system approach avoids shifting the problem from one life cycle impact stage to another or across EIs [52]. There are also limitations, such as time and resources required for completion, along with the subjective choice of assumptions and system boundary upon which the LCA has been based. It is therefore crucial that plenty of time is factored in to undertake the study, and the approach taken is well documented for transparency.
Until recently, applications for recovered fibres from waste composite have been limited, and therefore LCA data for recycling and remanufacturing of composites are rarely available [53]. Previous studies have highlighted the ecological need to develop recycling routes for composites, and have also underlined how the benefits of recycling are strongly linked to the impacts of the reclamation process, the materials replaced by rCF in the second-life application, and the type of application in which they are used [54]. The onward use or second life cycle of recycled composites is not often considered in LCA and there is uncertainty surrounding the retention of the mechanical properties of the composite through the various recycling processes, especially without fibre realignment. Virgin material may still be required to compensate if the recyclate quality is compromised. Assuming performance equivalency between virgin and recycled CFRP material, Tapper et al. concluded that the additional environmental burden from producing and manufacturing CFRP automotive parts compared to a steel baseline does not break even until recycled materials are used, despite the significant environmental savings reported during the use phase [51]. Therefore, the closer the resulting quality of the remanufactured composite is to the original virgin architecture and material performance, the less virgin fibre material is required to compensate, which will bring significant environmental and economic savings to the automotive industry—one of the aims of HiPerDiF technology.
The inclusion of HiPerDiF technology could result in recycled composites that retain the preferred mechanical properties associated with virgin material, displacing the production of composites from raw material extraction. There are currently no published studies on the EI of fibre realignment methods, so the results from this LCA will be the first of its kind. This will limit the ability to include direct comparisons within the analysis and further highlight the large gap of research into other fibre remanufacturing technologies.

3. The HiPerDiF Study

3.1. Goal and Scope Definition

The present work is a gate-to-gate study to assess the EI associated with the realignment of discontinuous fibres using the HiPerDiF 2G machine. This will focus purely on the process energy demand (PED) of machine operation and exclude the embodied energy that is required to build the machine or from the aligned output material. The LCA is divided into three distinct sections:
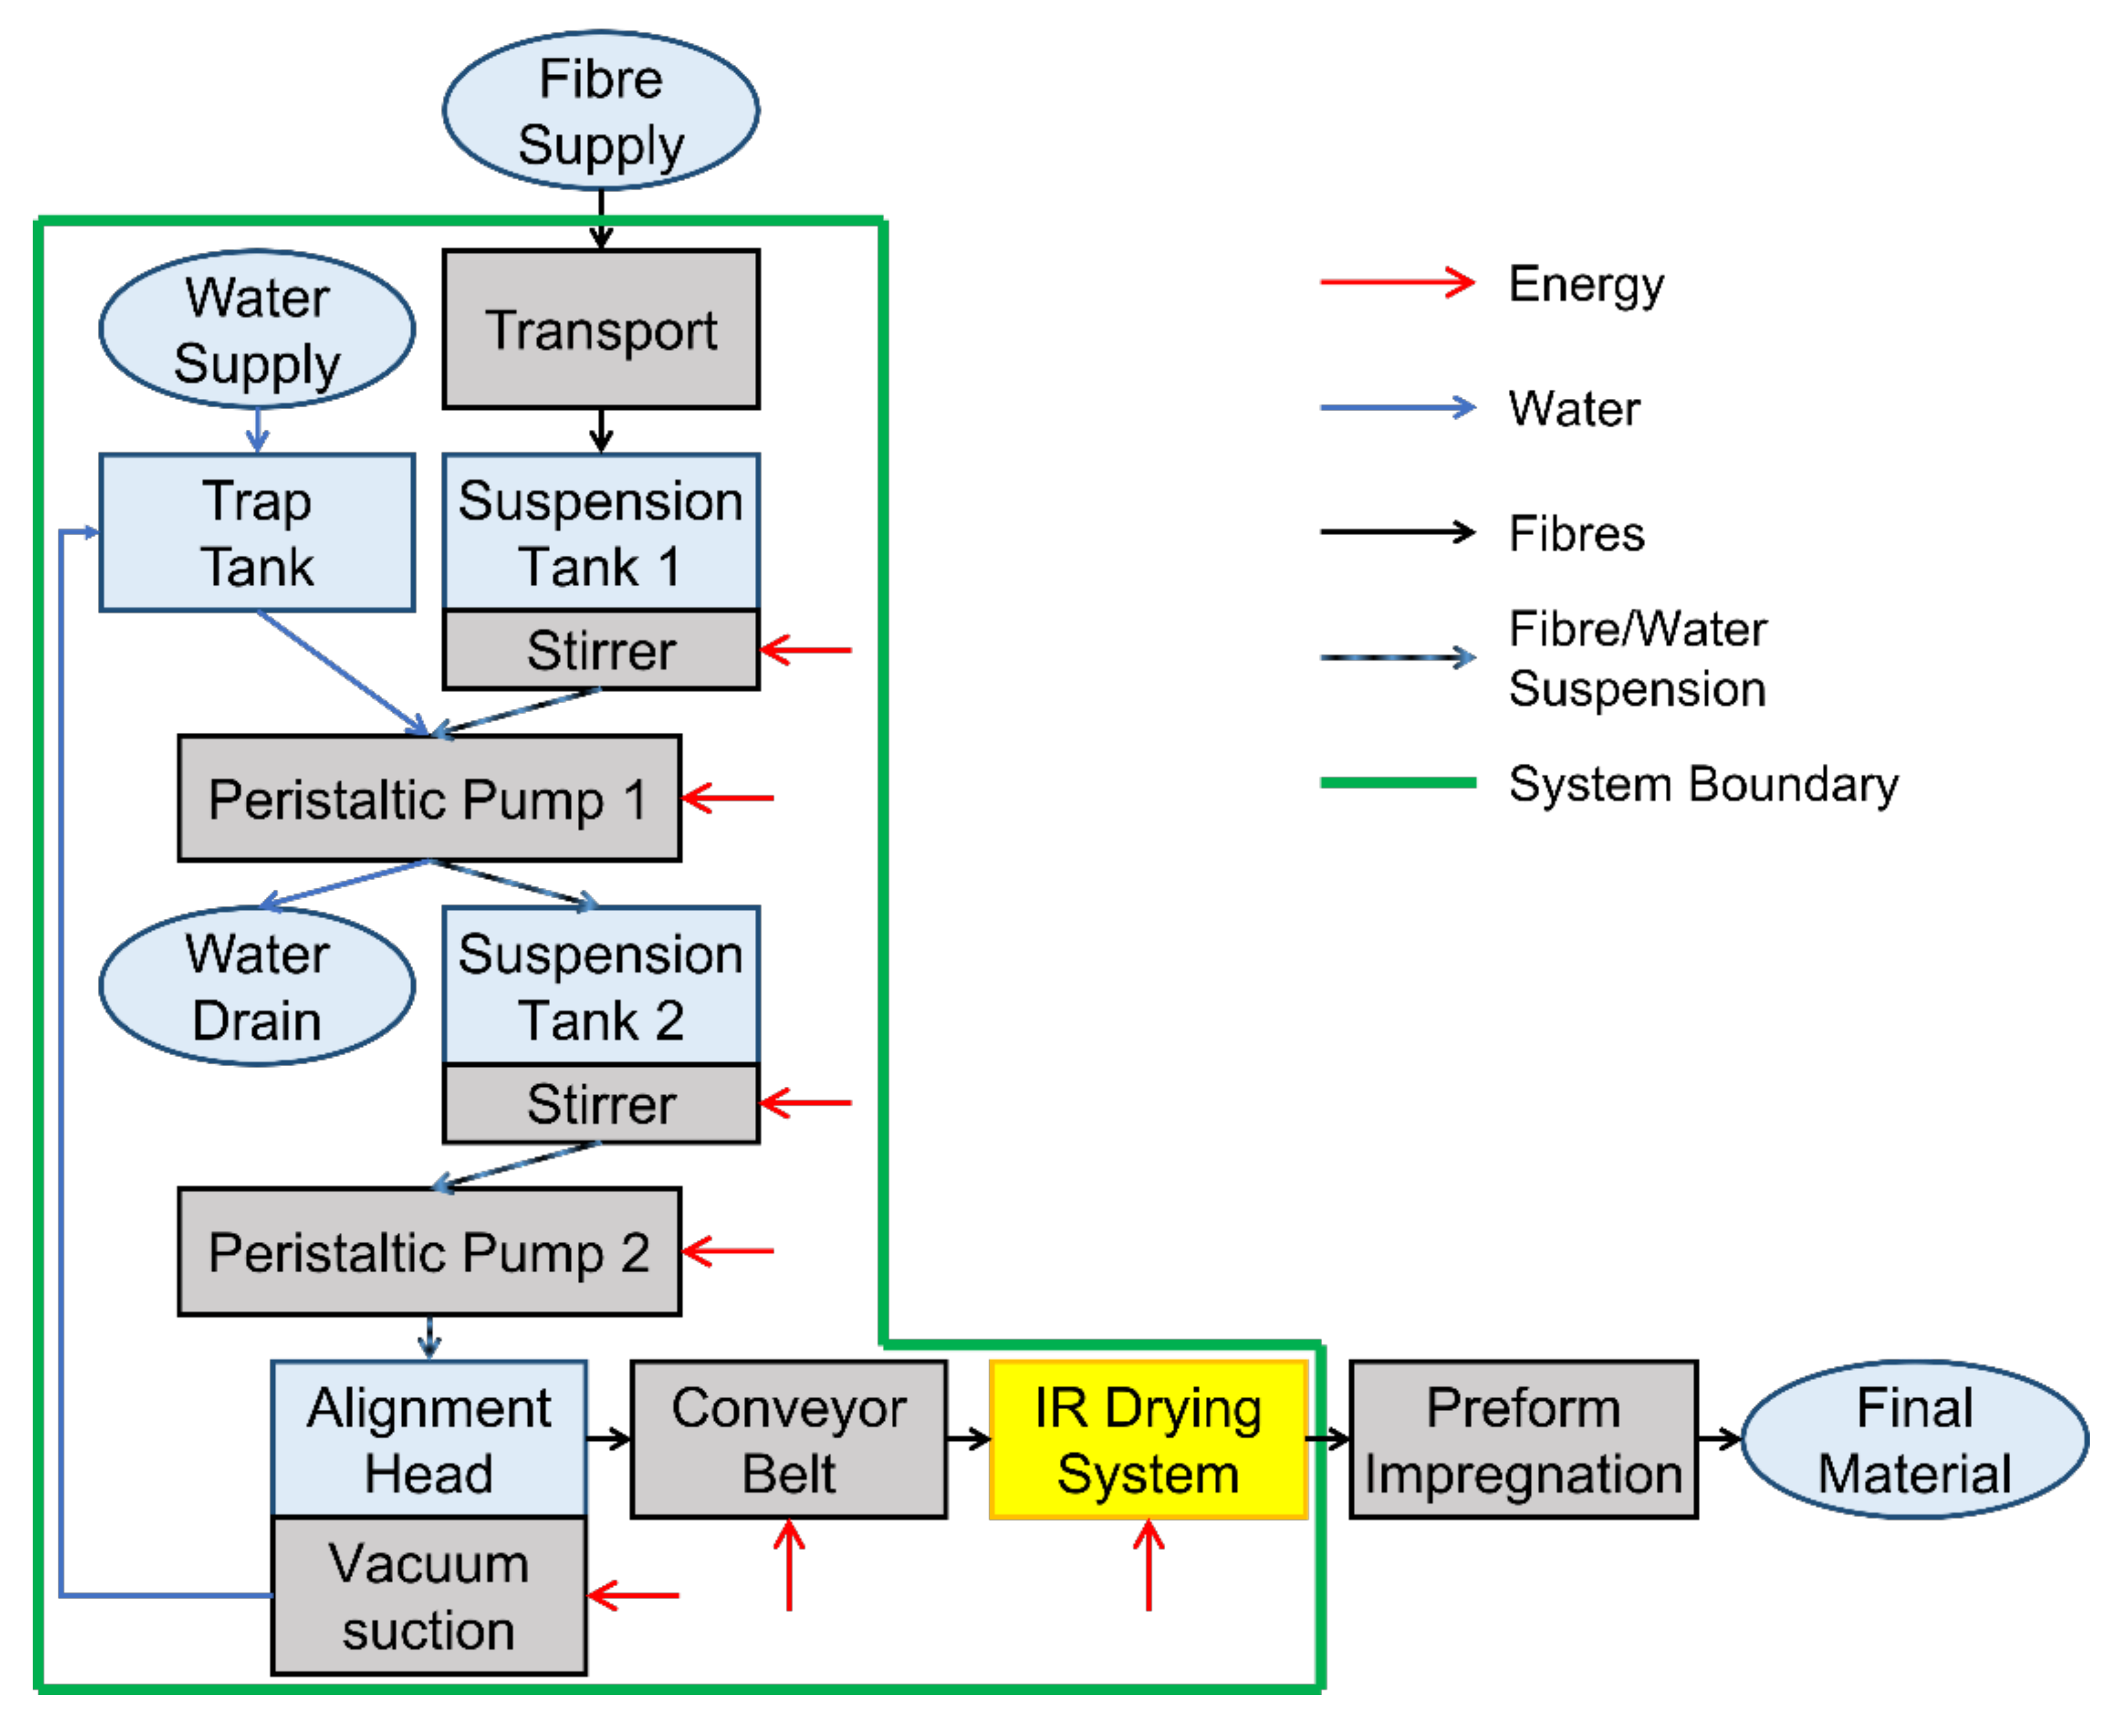
  • Inventory assessment with primary data collection of the PED of appliances used and water required for HiPerDiF technology operation in Bristol, UK. A schematic of the system boundary is presented in Figure 3, indicating the flow of energy through the HiPerDiF prototype during processing. The only inputs to this system that will contribute to the environmental burden are the electrical energy and the water required to run the machine. These data will be used to identify hotspots for future optimisation and will form the baseline against which further impact assessment analyses can be compared. The functional unit (FU) is a quantitative measure of the output of a product or service from the system under investigation [55]. A mass-based FU was selected over a specific composite component so this study can benefit from comparison with future work, which will be the throughput of 1 gramme of aligned discontinuous fibre preform (ADFP).
    Figure 3. System for LCA study of the HiPerDiF technology lab-scale prototype (HiPerDiF 2G).
    Figure 3. System for LCA study of the HiPerDiF technology lab-scale prototype (HiPerDiF 2G).
    Sustainability 14 01922 g003
  • Impact assessment of HiPerDiF machine when operated in various EU location scenarios, specifically chosen to investigate the variability of impact across different sources of electricity generation, which are listed in Table 1. The following locations have been selected:
    • Bristol, UK—the location of the current HiPerDiF 2G machine, acting as the control for comparison with the other scenarios.
    • Varberg, Sweden (SE)—the CFRP composite manufacturer Carbon & Composites AB [56] is situated on the west coast, south of Gothenburg. Sweden is one of the leading countries in Europe for electricity generated from renewable sources and between 2014 and 2017 65% of its net generating capacity per annum came from renewable sources [57].
    • Zurich, Switzerland (CH)—Swiss electricity generation also comes predominantly from renewable sources, at 77% of total net generation capacity. However, Switzerland incorporates a vastly different wastewater management system than Sweden, discussed later in the paper.
    • Stade, Germany (DE)—Germany has a similar energy generation mix to the UK, predominantly from fossil fuels, but is further along in the transition towards renewably sourced electricity. It has the largest net generation capacity in solar and wind energy at 20% and 23% of the total, respectively, whereas Sweden and Switzerland source their electricity principally from hydroelectric power (HEP). Hexcel Composites GmbH [58] have a manufacturing site in Stade, conveniently located alongside the River Elbe connecting the North Sea with Hamburg harbour. The CU Nord Recycling Centre [59] is also located in Stade, indicating that if the HiPerDiF 2G machine were to be located in that region there would be few burdens associated with material transportation from the reclamation site.
    • Roussillon, France (FR)—72% of France’s total electricity generation was sourced from nuclear power in 2017 [57]; France has the largest dependence on nuclear energy in the world. Opened in 2018, the Hexcel Roussillon [60] plant is their main production site for polyacrylonitrile (PAN), the carbon fibre precursor, and CF for aerospace CFRP composites.
      Table 1. Net electrical generation capacity and energy source breakdown as a percentage of the total for selected European countries from 2014–2017 [57].
      Table 1. Net electrical generation capacity and energy source breakdown as a percentage of the total for selected European countries from 2014–2017 [57].
      Energy Source (as a Percentage of the Total)UKSECHDEFR
      Fossil fuels5611<14217
      Nuclear112319549
      Other non-renewable-<124-
      Non-renewable total6735225166
      Wind1516<1239
      Solar12-7205
      Biomass2814<1
      Hydro44168219
      Renewable total3365774934
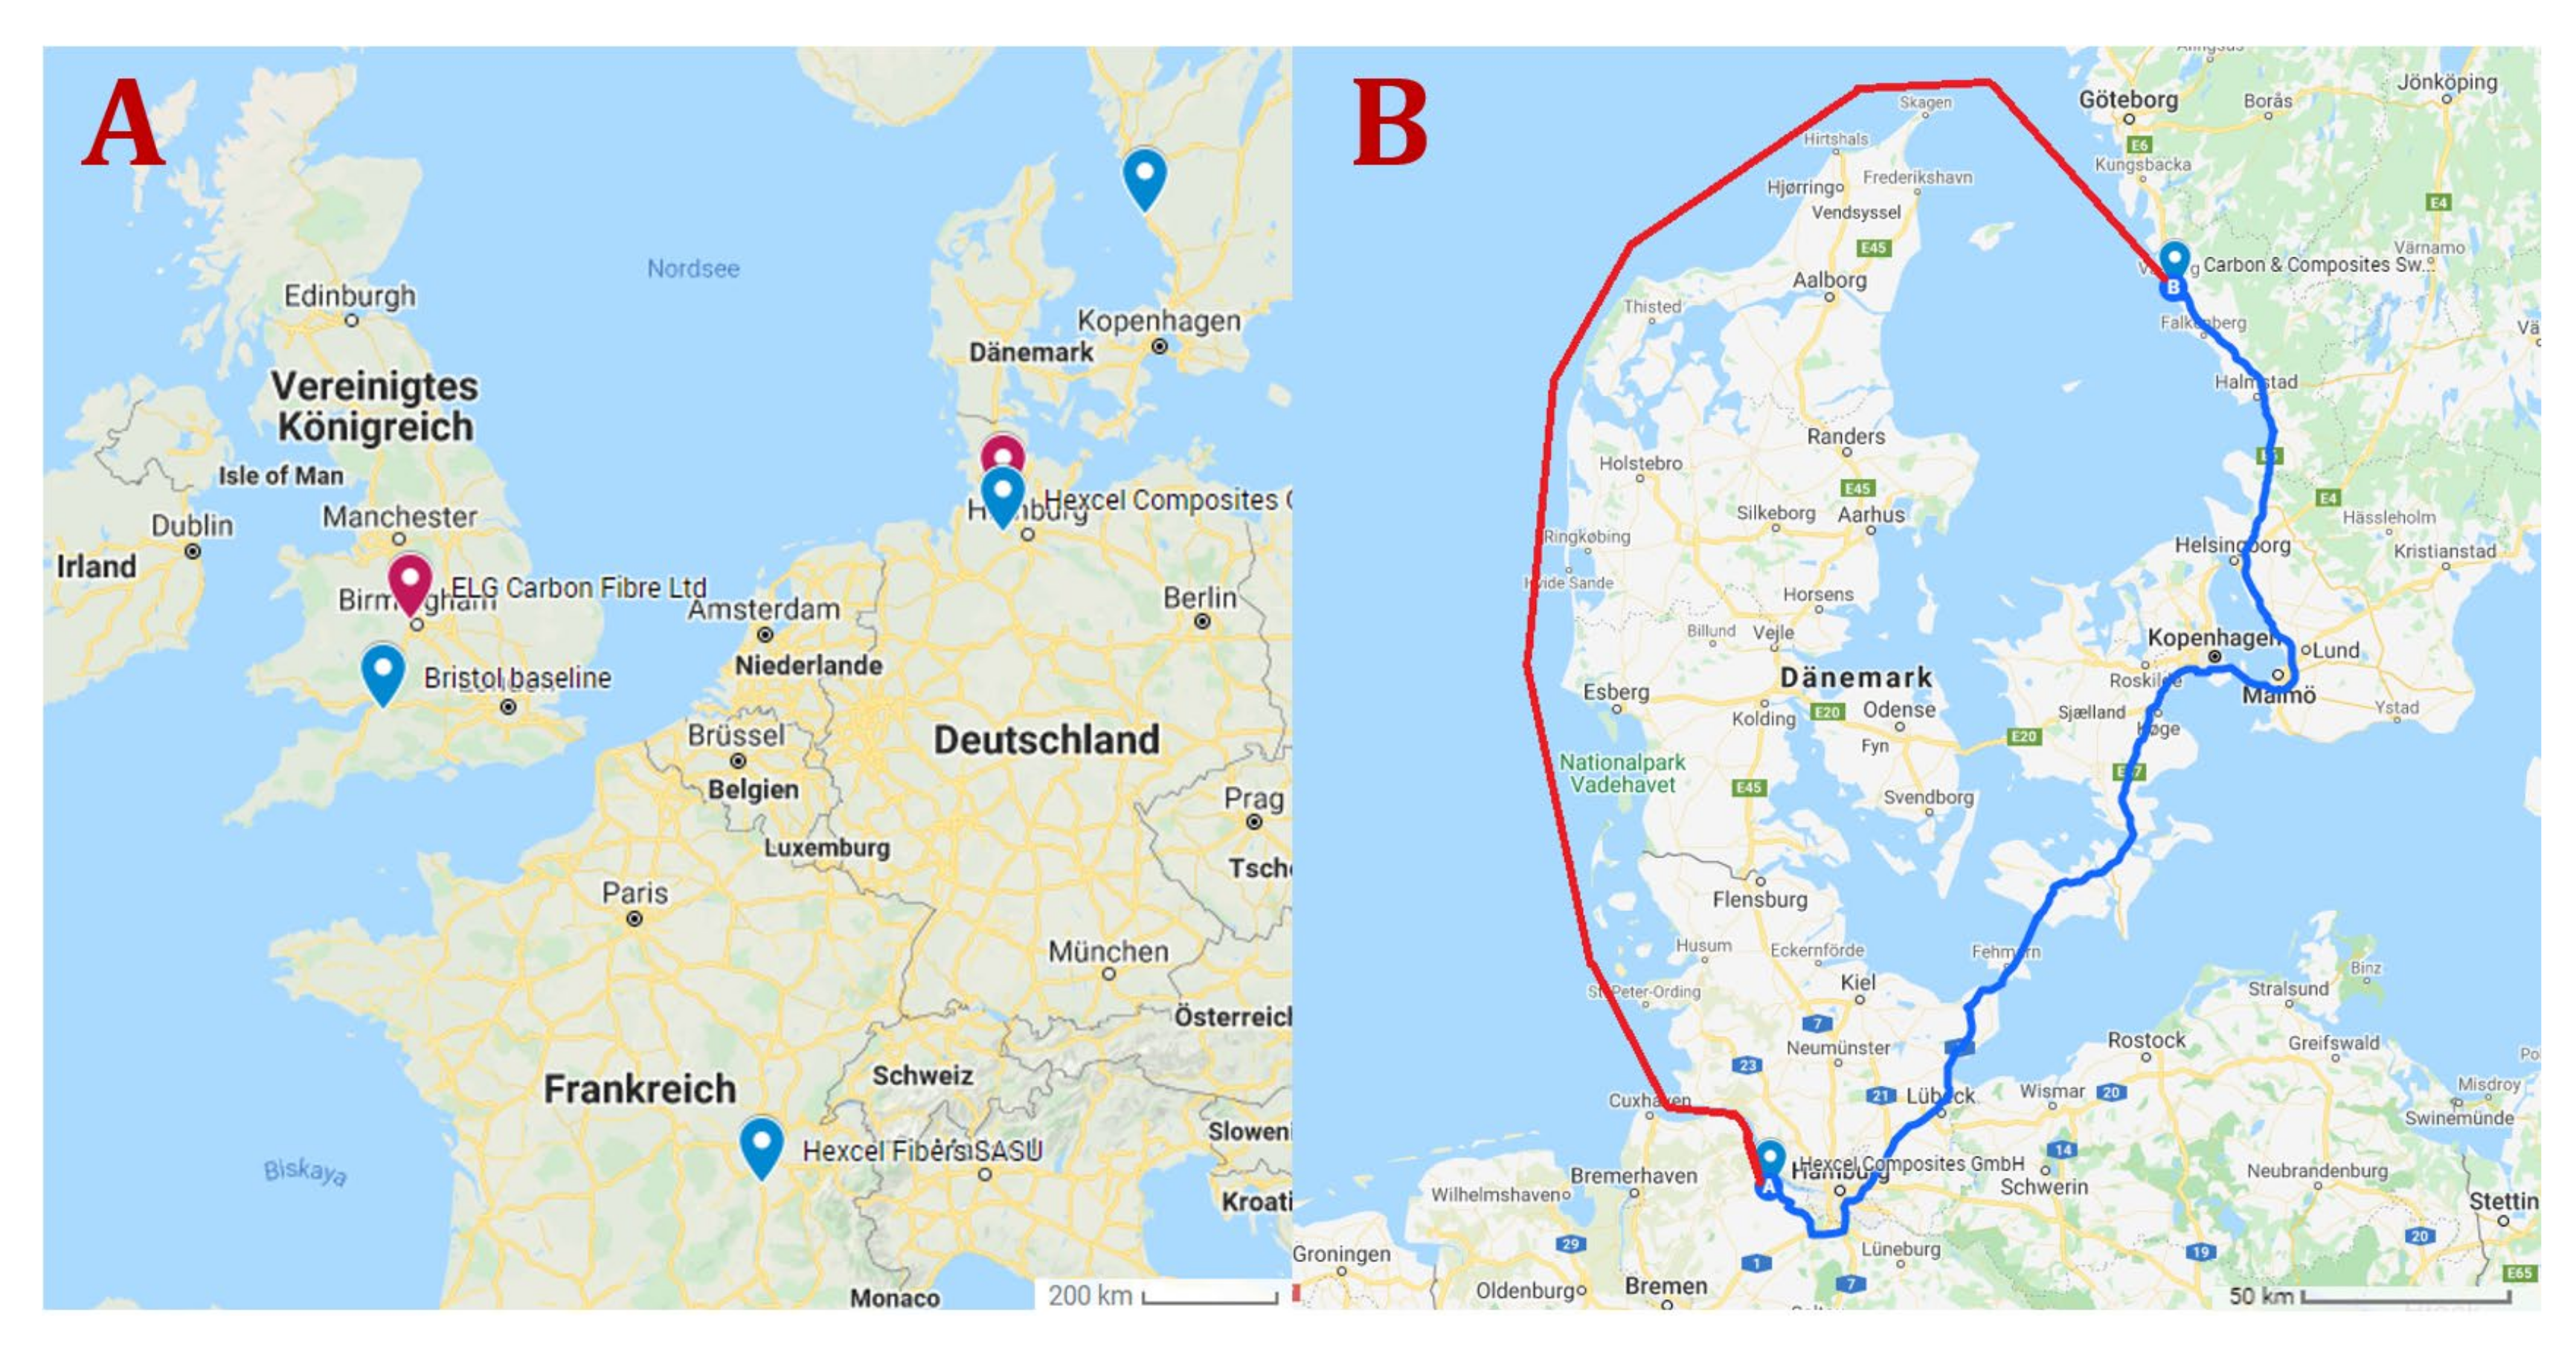
  • The final part of this impact assessment involves expanding the system boundary to incorporate the transport of the recovered fibre material. The two main composite recyclers currently based in Europe were chosen to demonstrate the variation in environmental burdens from alternative modes of transportation:
    • ELG Carbon Fibre Ltd., near Birmingham, UK [61] which has become Gen 2 Carbon since the production of this review [62];
    • CU Nord Recycling Centre, in Stade, DE [59].
The transportation distances for each route were calculated using Google Maps and typical sea routes between nearby industrial ports with SeaRoutes.com [63]. Most of the transport scenarios via sea also require road transport between the company site/destination and the port. For example, to transport recovered fibres from ELG (UK) to Roussillon (FR) the material would be transported by road from Birmingham to Dover, crossing the English Channel by freight ship to Dunkirk and finally reaching Roussillon by road. The purpose of this analysis is to understand the additional EI of transporting material to a location that has a lower operational EI due to a cleaner electricity source and wastewater treatment profile since it has often been cited in the academic literature that the transportation impact can contribute up to 50% of the entire recycling impact [5].
The impact assessments were carried out using SimaPro v9, a leading LCA software tool that incorporates data from the Ecoinvent 3 database. The impact assessment method IMPACT 2002+ was chosen for this study as it enables the impacts to be observed at 15 midpoint categories and then further aggregated into four damage endpoints: human health (HH), ecosystem quality (EQ), climate change (CC), and resources (Re) [64]. By characterising the data in this way, a causational link is established between the action and the effect. Respiratory effects, ionising radiation, human toxicity, and ozone layer depletion affect human health and are aggregated into the damage category HH, measured in disability-adjusted life years, known as DALY. This metric is used to quantify the burden of human disease resulting from environmental pollution and attributed to the life cycle of a system or product. Impacts to aquatic and terrestrial ecosystems which include acidification and eutrophication are grouped into EQ and are measured in PDF/m2/year, otherwise known as the potentially disappeared fraction of species per m2 per year [65]. All emissions contributing to global warming are in the CC damage category and measured in kilogrammes of carbon dioxide equivalent (kg CO2eq). The total impacts associated with non-renewable energy consumption and mineral extraction are represented in the Re damage category and expressed as primary megajoules (MJ), measuring the surplus energy required to extract the equivalent non-renewable energy source utilised for the process and the total energy loss as a resource [66]. IMPACT 2002+ is the only method that offers all the available steps in LCIA: characterisation, damage assessment, normalisation, weighting, and single score addition which facilitates a more transparent communication of the results. Cumulative energy demand (CED) [67] is a single-issue impact assessment methodology used for the additional analysis of the transportation scenario as it allows a clearer observation of the emissions from different types of energy associated with transportation, expressed in MJ.

3.2. Inventory Analysis

To understand the EI of the HiPerDiF process, the inventory data were collected by measuring the electrical energy for each appliance, the water required to operate the machine and the mass of the fibre tape produced.
The energy demand data for each appliance was collected using a Watt meter and the water demand was measured with markings on the suspension tanks. The infrared heater and pumps required a different method of data collection because their power demand was not constant. For the heater, a connected thermocouple was set to maintain a temperature of 75 °C to prevent the heater from alternating between a ramp and dwell state. For the pumps, the inconsistent power reading could be caused by the fluctuating torque generated by the motor—the metal bars used to contract and relax the pipes lead to cyclic loading, which could also vary the resistance of the motor. To account for these variations, the machine was left to run for upwards of an hour so that the appliances were able to reach their regular operating temperatures. An average wattage was calculated by measuring the cumulative energy. Moreover, to produce 1 gramme of ADFP, 18.45 litres of water are required. The energy demand to manufacture 1 gramme of dry ADFP with the current HiPerDiF 2G process is summarised in Table 2.
In terms of energy consumption, Table 2 shows vacuum suction is the appliance with the highest energy demand at 64% of the total power demand by HiPerDiF 2G. Next comes the second peristaltic pump for fibre realignment consuming only 19% of the power demand of the vacuum. This large difference highlights the dominance of the vacuum suction’s energy demand over the other appliances, representing the area of greatest potential for optimisation.
Prior to this LCA, it was hypothesised that the infrared heater would consume the most energy since there is currently no insulation to prevent heat energy loss. The results in Table 2 show the infrared heater is the fourth largest power consumer. Notwithstanding, improvements to the efficiency of the drying phase is still considered to be one of the simplest options for machine optimisation, e.g., the addition of insulation would result in lower power consumption from the heater allowing it to spend longer periods in dwell state.
Figure 4 demonstrates that that vacuum has a significantly higher impact in three of the four categories—HH, CC, and Re. Wastewater dominates the EQ category, which was anticipated due to the limited water reuse in the current prototype after it is collected from the vacuum. EIs associated with wastewater treatment in Europe in the Ecoinvent database are due to construction materials of the sewer grid and treatment facility (e.g., reinforcing steel, and chromium steel), as well as sludge activation and water purification, potentially toxic to aquatic and terrestrial life [68]. Two solutions can be found to reduce environmental burdens associated with water use/waste:
  • Increase the fibre concentration of the machine such that more aligned fibre preform is manufactured per unit volume of water, and/or
  • Adapt the design of the water reclamation process by pumping water back into the high concentration tank and reusing it for the next cycle. This could potentially cause instability in the fibre concentration in the tanks, resulting in an inconsistent fibre volume fraction of the final preform, and is a limitation of the design in this HiPerDiF 2G prototype. For the subsequent model (the HiPerDiF 3G based in NCC), the pumped water could be harvested into a separate storage tank for reuse in the next cycle.

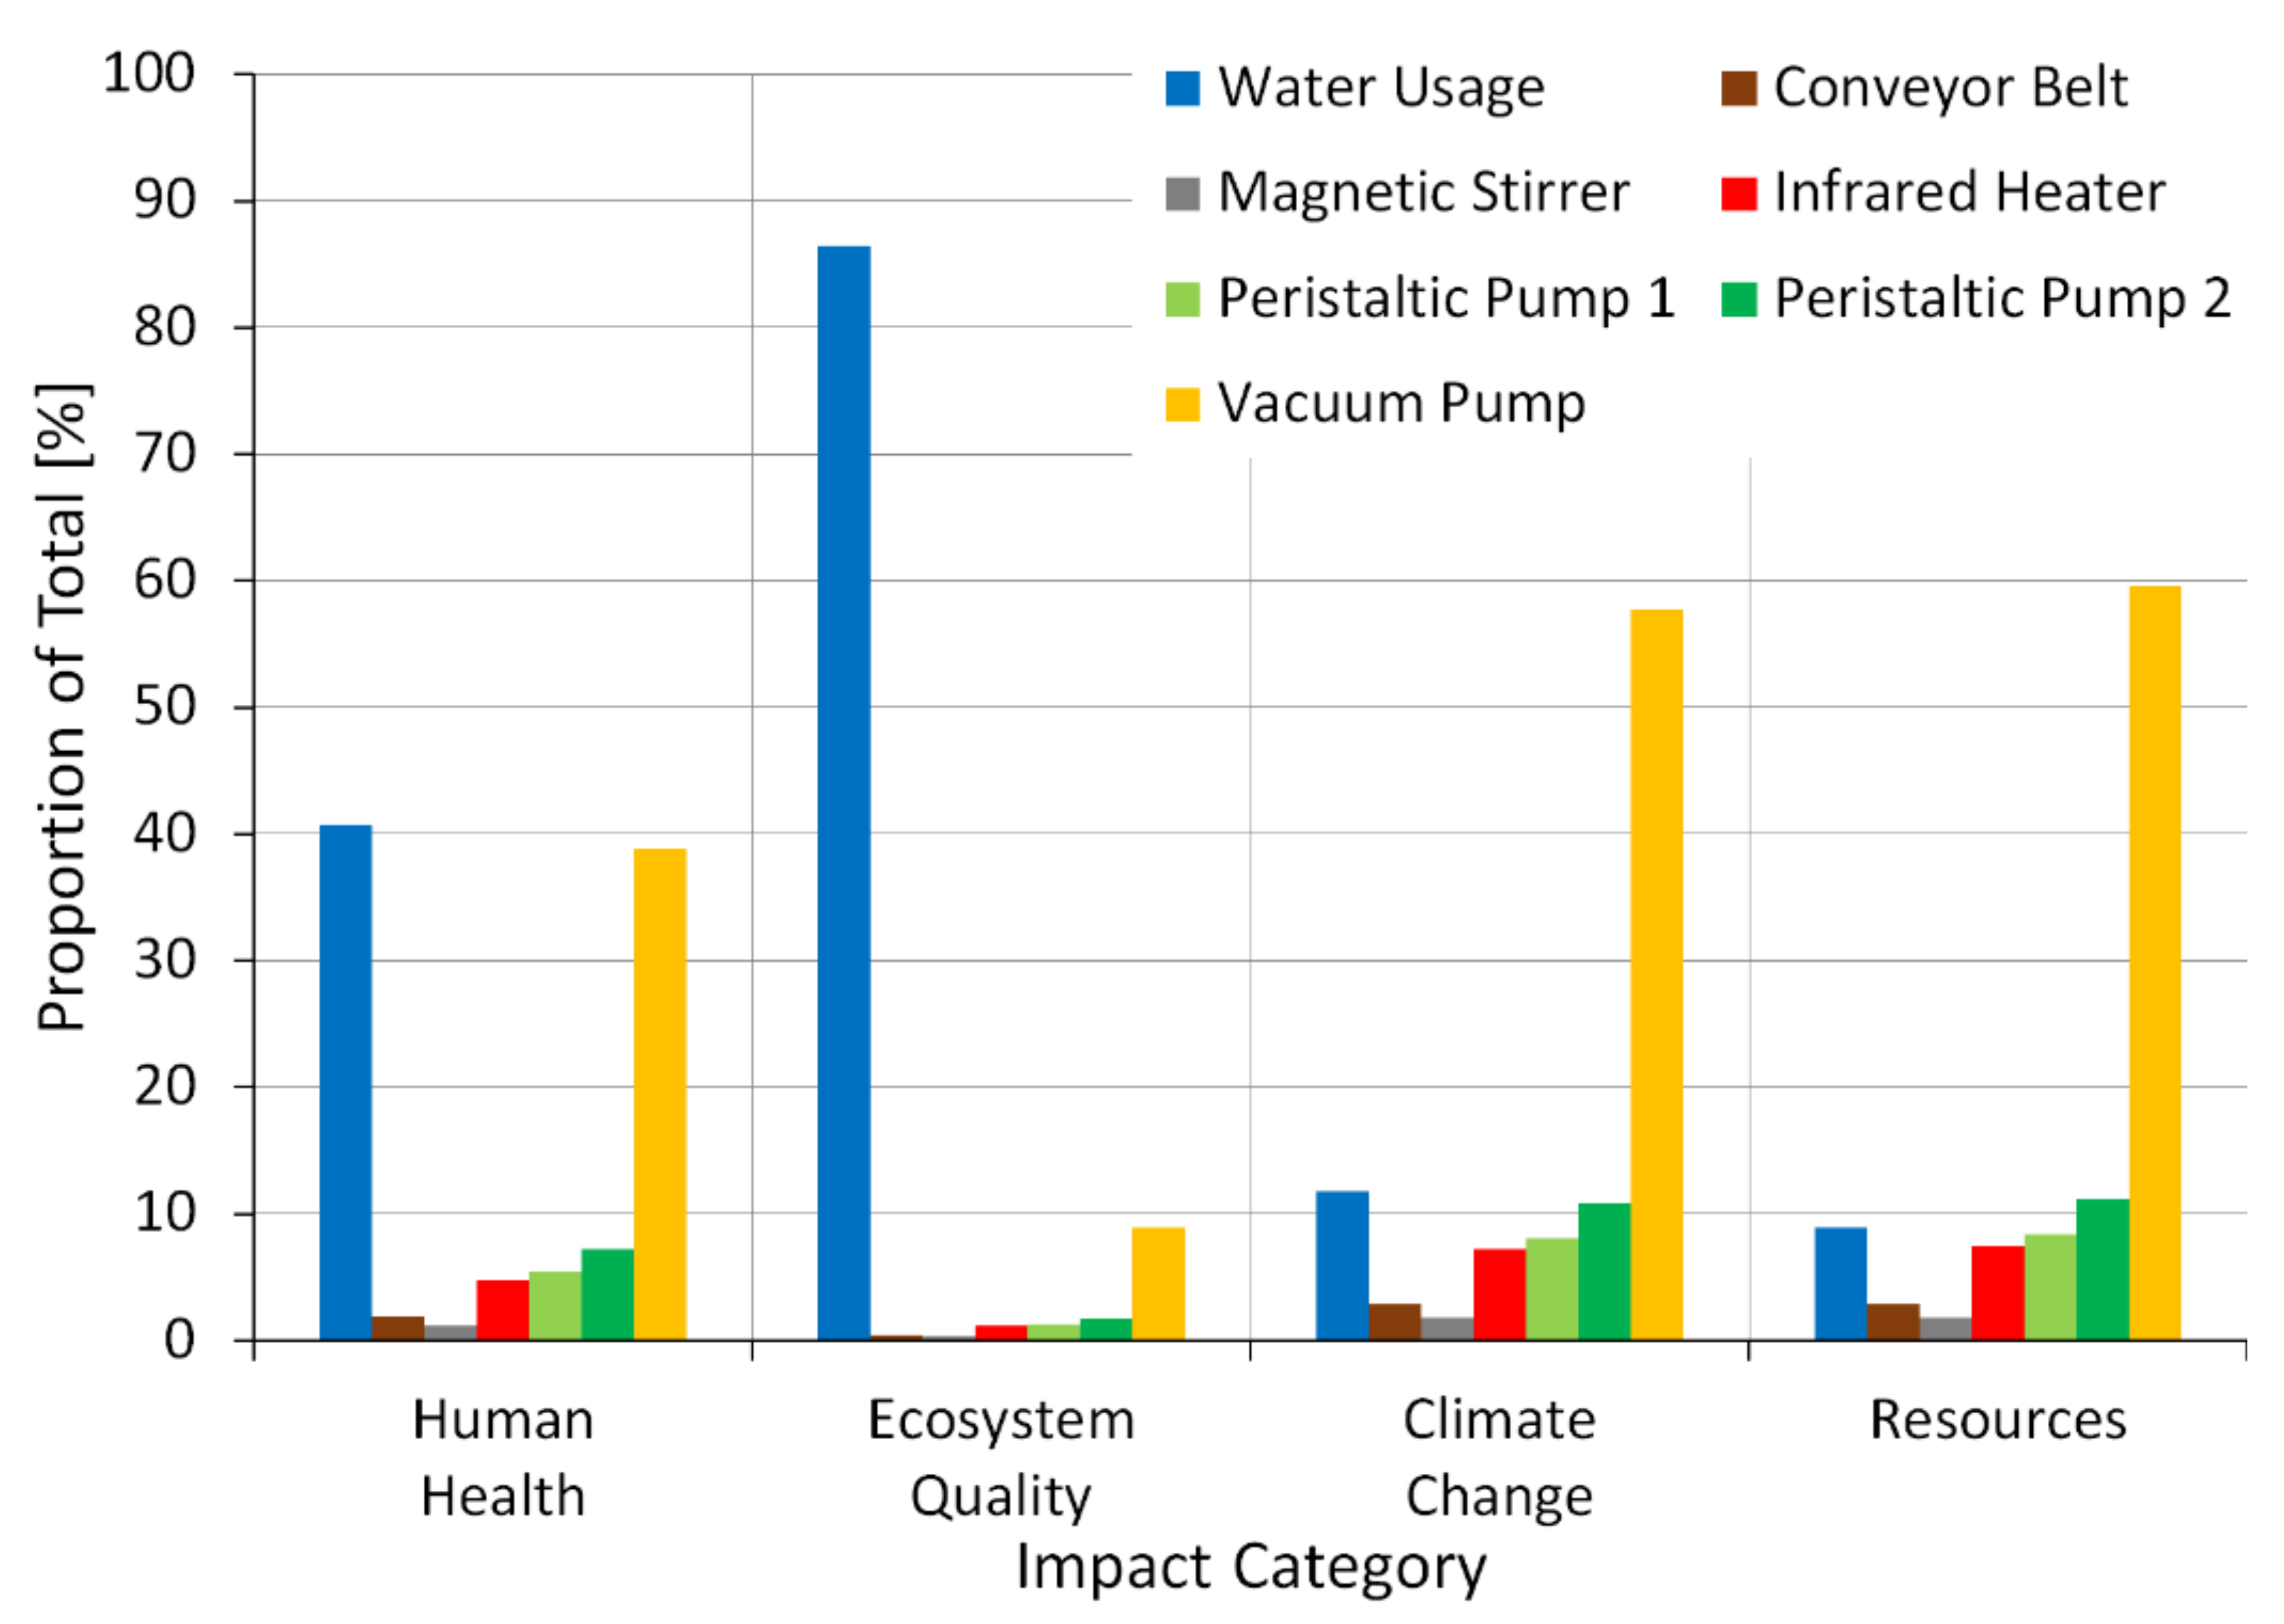
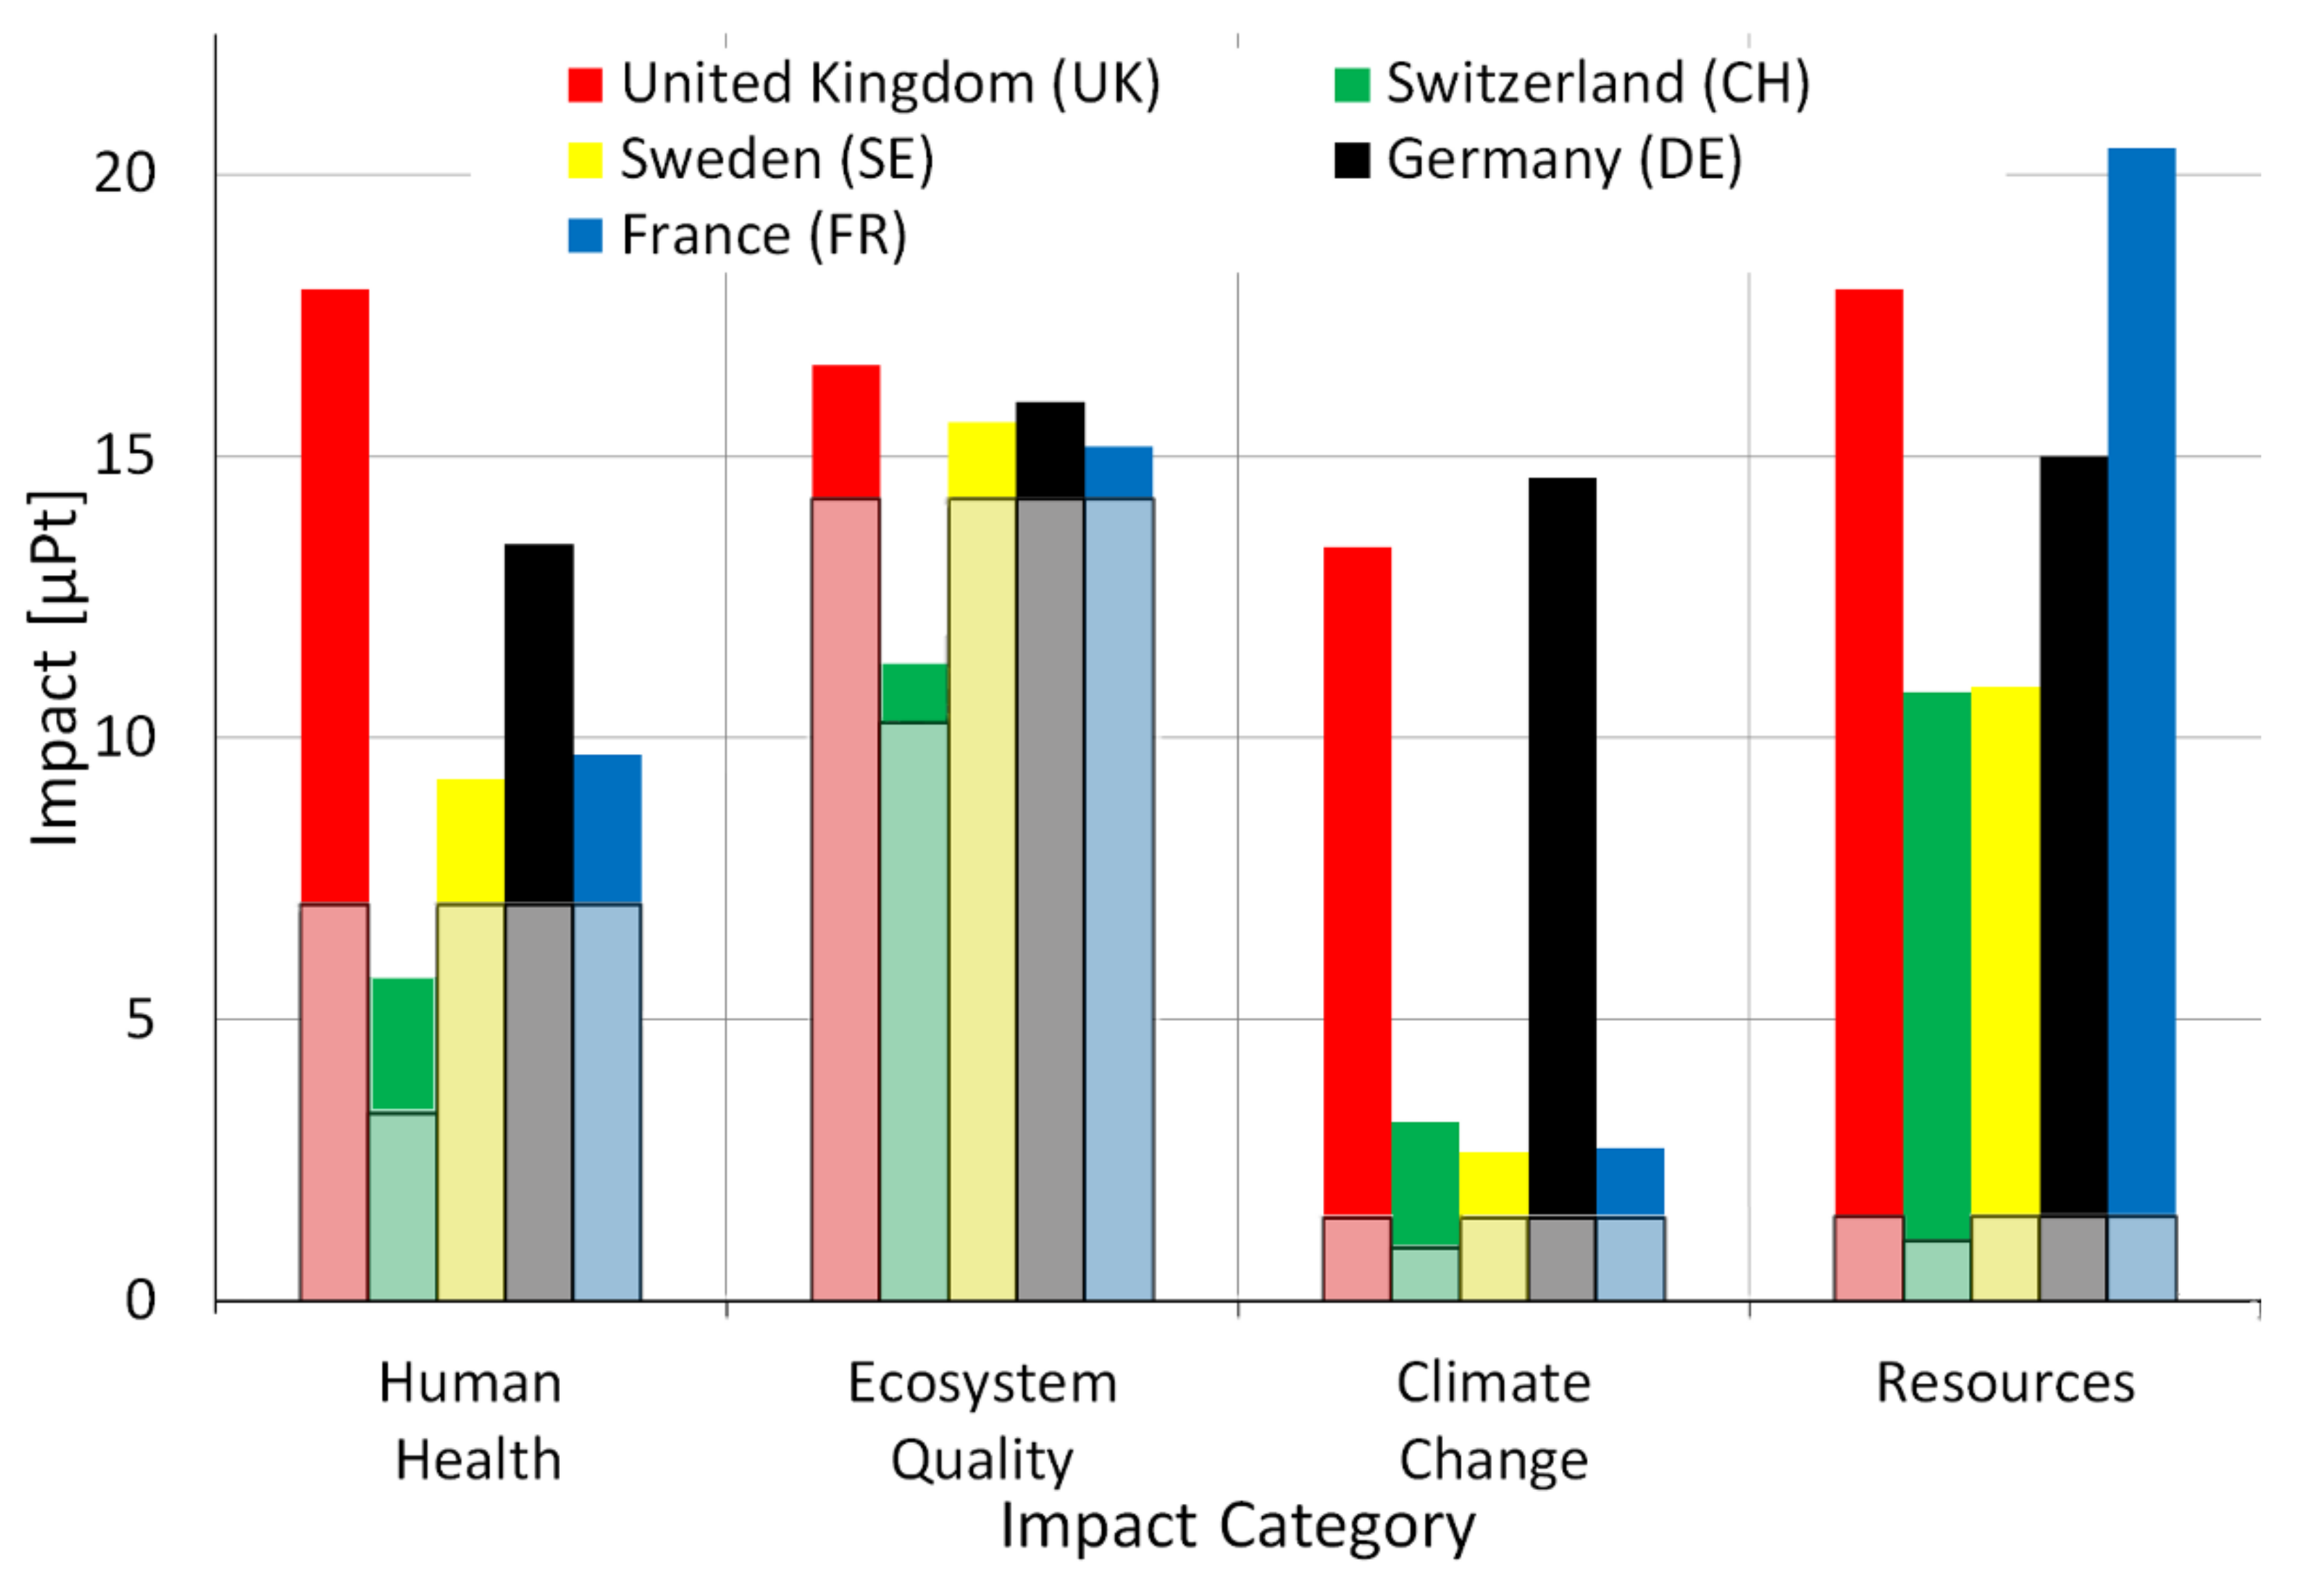
3.3. Impact Assessment of HiPerDiF Operation in Various European Scenarios

This analysis compares the operation of HiPerDiF 2G in the five selected European countries (including water use), and a CED analysis of electricity energy sources used in each country of the sample group, presented in Figure 5.
These LCIA results show that running the HiPerDiF 2G machine in the UK has the highest impact across all the categories except for Re. This is because the UK generates most of their energy from fossil fuels. Despite efforts to reduce GHG missions under the Climate Change Act 2008 [69], natural gas still dominates electricity production providing 40% of the total energy mix in 2017 [70]. Natural gas has an overall efficiency of over 80% energy from source making it one of the lowest overall impact fossil fuels [71], but it still requires the combustion of fossil fuel resources. The air pollutants from natural gas combustion are CO2, SO2, NOx and particulates, all of which affect the HH impact category through respiratory problems [72]. CO2 is a GHG contributing to ozone layer depletion affecting the CC category, whereas other compounds such as SOx and NOx cause additional impacts in acidic deposition and eutrophication affecting the EQ category [73]. For electrical energy consumption only, the CED impact assessment was also chosen to analyse the energy sources used by each country, displayed in Figure 6. The CED method splits biomass into renewable (organic waste including wood and food products) and non-renewable (wood and biomass from primary forests) sources. The UK’s largest power station, Drax, produces energy from both coal and biomass [74]; Figure 7 shows that the UK has the largest renewable biomass generation, contributing 40% of the national CED for renewable energy generation. The emission profile of burning biomass for energy is similar to that of natural gas, but lower impact than the burning of oil or coal. If the carbon sequestered by the plants through photosynthesis during their growth is accounted for in the biomass metric, then the net GHG emissions could be neutral [75]. However non-renewable biomass exhausts valuable primary forest resources whereas renewable biomass does not, reflected in a lower impact score for the Re category. This is still significantly overshadowed by the immense use of fossil fuels resulting in the UK performing the worst for the operation of the HiPerDiF 2G machine.
Germany (DE) is the second-largest user of fossil fuels in this study sample, as reflected by the second worst EI score in Figure 6, after the UK. The reasons for this are similar to those for the UK, but Germany still generates a large percentage of electricity from coal. GHG emissions from coal are higher than natural gas and oil due to the inefficiency of the combustion process. Coal-fired power plants have not yet benefitted from modernisation due to their planned gradual phase-out, and the emissions associated with burning coal contain pollutants with greater toxicity, such as COx, SOx, soot, and other organic compounds [72]. Despite Germany using a more polluting fossil fuel base than the UK, it is still lower in all damage categories because it also receives the largest electricity generation from wind and solar sources in the sample group (Table 1). The EI of wind energy predominantly comes from the atmospheric emissions relating to the construction of the turbine, specifically the manufacture and assembly of the foundation (cement), and the structure itself (GFRP and CFRP composites, steel, and pig iron). Other EIs are noise from turbine operation [76] and the ecosystem impacts from wildlife interference (birds, shells, and fish) [77], but these are minimal compared to the impacts from using non-renewable energy sources. Similarly, with solar energy, the largest EI comes from the construction, installation and decommission phases [78]. During solar cell development, the manufacture of high technology materials, i.e., crystalline silicon and thin film, that maximise energy absorption efficiency result in high environmental burdens [79]. However, once the solar panel is in the use phase, no additional natural resources are exhausted and no waste products or emissions accumulate, giving an overall lower EI than for fossil fuels.
France (FR) has a significantly lower impact on HH than the UK and Germany (Figure 5) despite generating most of its electricity from nuclear energy (Figure 6). High environmental risks are associated with the extraction of uranium isotopes, the operation of the plants and the radioactive waste produced. The handling of radioactive material and the concentration of it in one place means that nuclear plants constantly emit low-level radiation to the surrounding area and therefore all life cycle stages of the nuclear fuel chain involve the emission of ionising radiation, posing the greatest risk for HH. LCA data from the literature [80] indicate the greatest risk to HH is associated with uranium mining, however, the system boundary for this work included the country’s entire population for the sample. Academic literature has acknowledged an increased cancer rate in workers at nuclear energy plants [81,82] and, controversially, further studies have indicated an increased rate of cancer among populations surrounding nuclear plants [83]. If the largest risk lies with the minuscule proportion of the population who work and live around the plant/extraction site, the true impact on this group could be far greater than the results displayed in [80]. Figure 5 demonstrates that France also has the highest impact in the Re category because uranium isotopes are a non-renewable power source that must be extracted from rocks involving substantial mining efforts. Despite the detrimental effect this has on the surrounding ecosystem, a low amount of waste is produced relative to the amount of energy generated, most of which is stored at the plant, reflected by the moderate score for EQ damage. Whilst the degree of damage caused by low-level radiation on wildlife is significant, it is still not fully understood, with disagreement in academic opinion highlighting the need for further research [84,85]. Other EIs from nuclear energy are significantly less than fossil fuels overall since the reaction does not produce smoke or CO2 [86]. EOL nuclear waste accumulation will become an increasing concern, and disposal options for low quantities of highly radioactive waste will likely affect EQ scores in the future [87].
Operating HiPerDiF 2G in Sweden (SE) has the lowest EI in all impact categories except EQ. SE generates the highest amount of electricity from renewable sources, accounting for 31% of the total CED (Figure 6), predominantly from HEP, representing 22% of the total and 71% of the contribution from renewables. In common with wind and solar power, there is no combustion during the generation of HEP, but dam locations can cause a chain of catastrophic environmental disasters, for example, the flooding of upland forests and peatlands caused by the dam construction in Manitoba, Canada [88]. Dam placement can cause large and frequent water level fluctuations affecting the surrounding wildlife, reducing aquatic and terrestrial quality. Blockages affect critical fish migration, observed in both the Gezhouba (China) and Tucurui (Brazil) dams [89,90], and river contamination of mercury and algae blooms resulting from stagnant water and increased sediments/nutrients upstream [91]. All these effects contribute to the higher damage score for EQ. Conversely, emissions from dam construction and maintenance are comparatively low against fossil fuels: life cycle emissions from large-scale HEP plants can be as low as 3% and 1.7% of the natural gas and coal emissions, respectively [92]. This explains the lower EI from Switzerland (CH) too, where HEP makes up a large proportion of the electricity profile, as 15% of the total CED in Switzerland still comes from fossil fuel sources, against Sweden’s 4%.
Similar EI profiles can be observed in Figure 5 when water usage is included in the comparison. All countries in the sample group except Switzerland use data from the same Ecoinvent database (with European averages) which increase proportionately when accounting for water usage. Switzerland (CH) displays noticeable EI differences across the comparison study. As a small but land-locked country, Switzerland pioneered the nationwide establishment of an efficient wastewater treatment system and enshrined it into the country’s first environmental legislation [93]. Its success has been reflected in the EI comparison: when water usage was included, the scores from all damage impact categories were approximately 30% lower than the European average. With electricity consumption only, the original conclusion was that SE achieved the lowest impact score but this changes when water usage is included in the calculation, as CH have lower impacts on both EQ and HH. Without the inclusion of water usage, SE has a 20% lower overall EI score, however, when water usage is included, CH has a lower overall EI by 7%, indicating that CH is now the most favourable country to operate HiPerDiF 2G from the sample group. It is likely that the actual EI of water usage in SE is lower than the European average, due to the increased construction of small on-site wastewater systems and tighter requirements for domestic water treatment, so a potential limitation of this study is that country-specific water usage data were not available [94,95]. Data of this kind are now available through the “Wastewater LCI Initiative” [96], however, they were not available during the current study.
A final important note from this part of the analysis, the energy mix in Table 1 shows a discrepancy with the CED mix of the countries in Figure 6. The electricity generation capacities in Table 1 are the maximum electrical output of each source which is different to actual power production. Renewable sources, such as solar and wind, are reliant on inconsistent weather conditions, reflected in the variations between potential and actual outputs. There are also significant energy imports/exports to and from the countries in the sample group. For example, Switzerland imported 50.9% of its total energy in 2015 [97]. Differences in total supply and final consumption of power in each country are explained by distribution and transformation losses and can be a significant margin: 29.5% of energy in Sweden was lost due to this in 2015 [98]. These are not always accounted for at the characterisation stage within SimaPro as it focuses on the net generation capacity of each actual country.

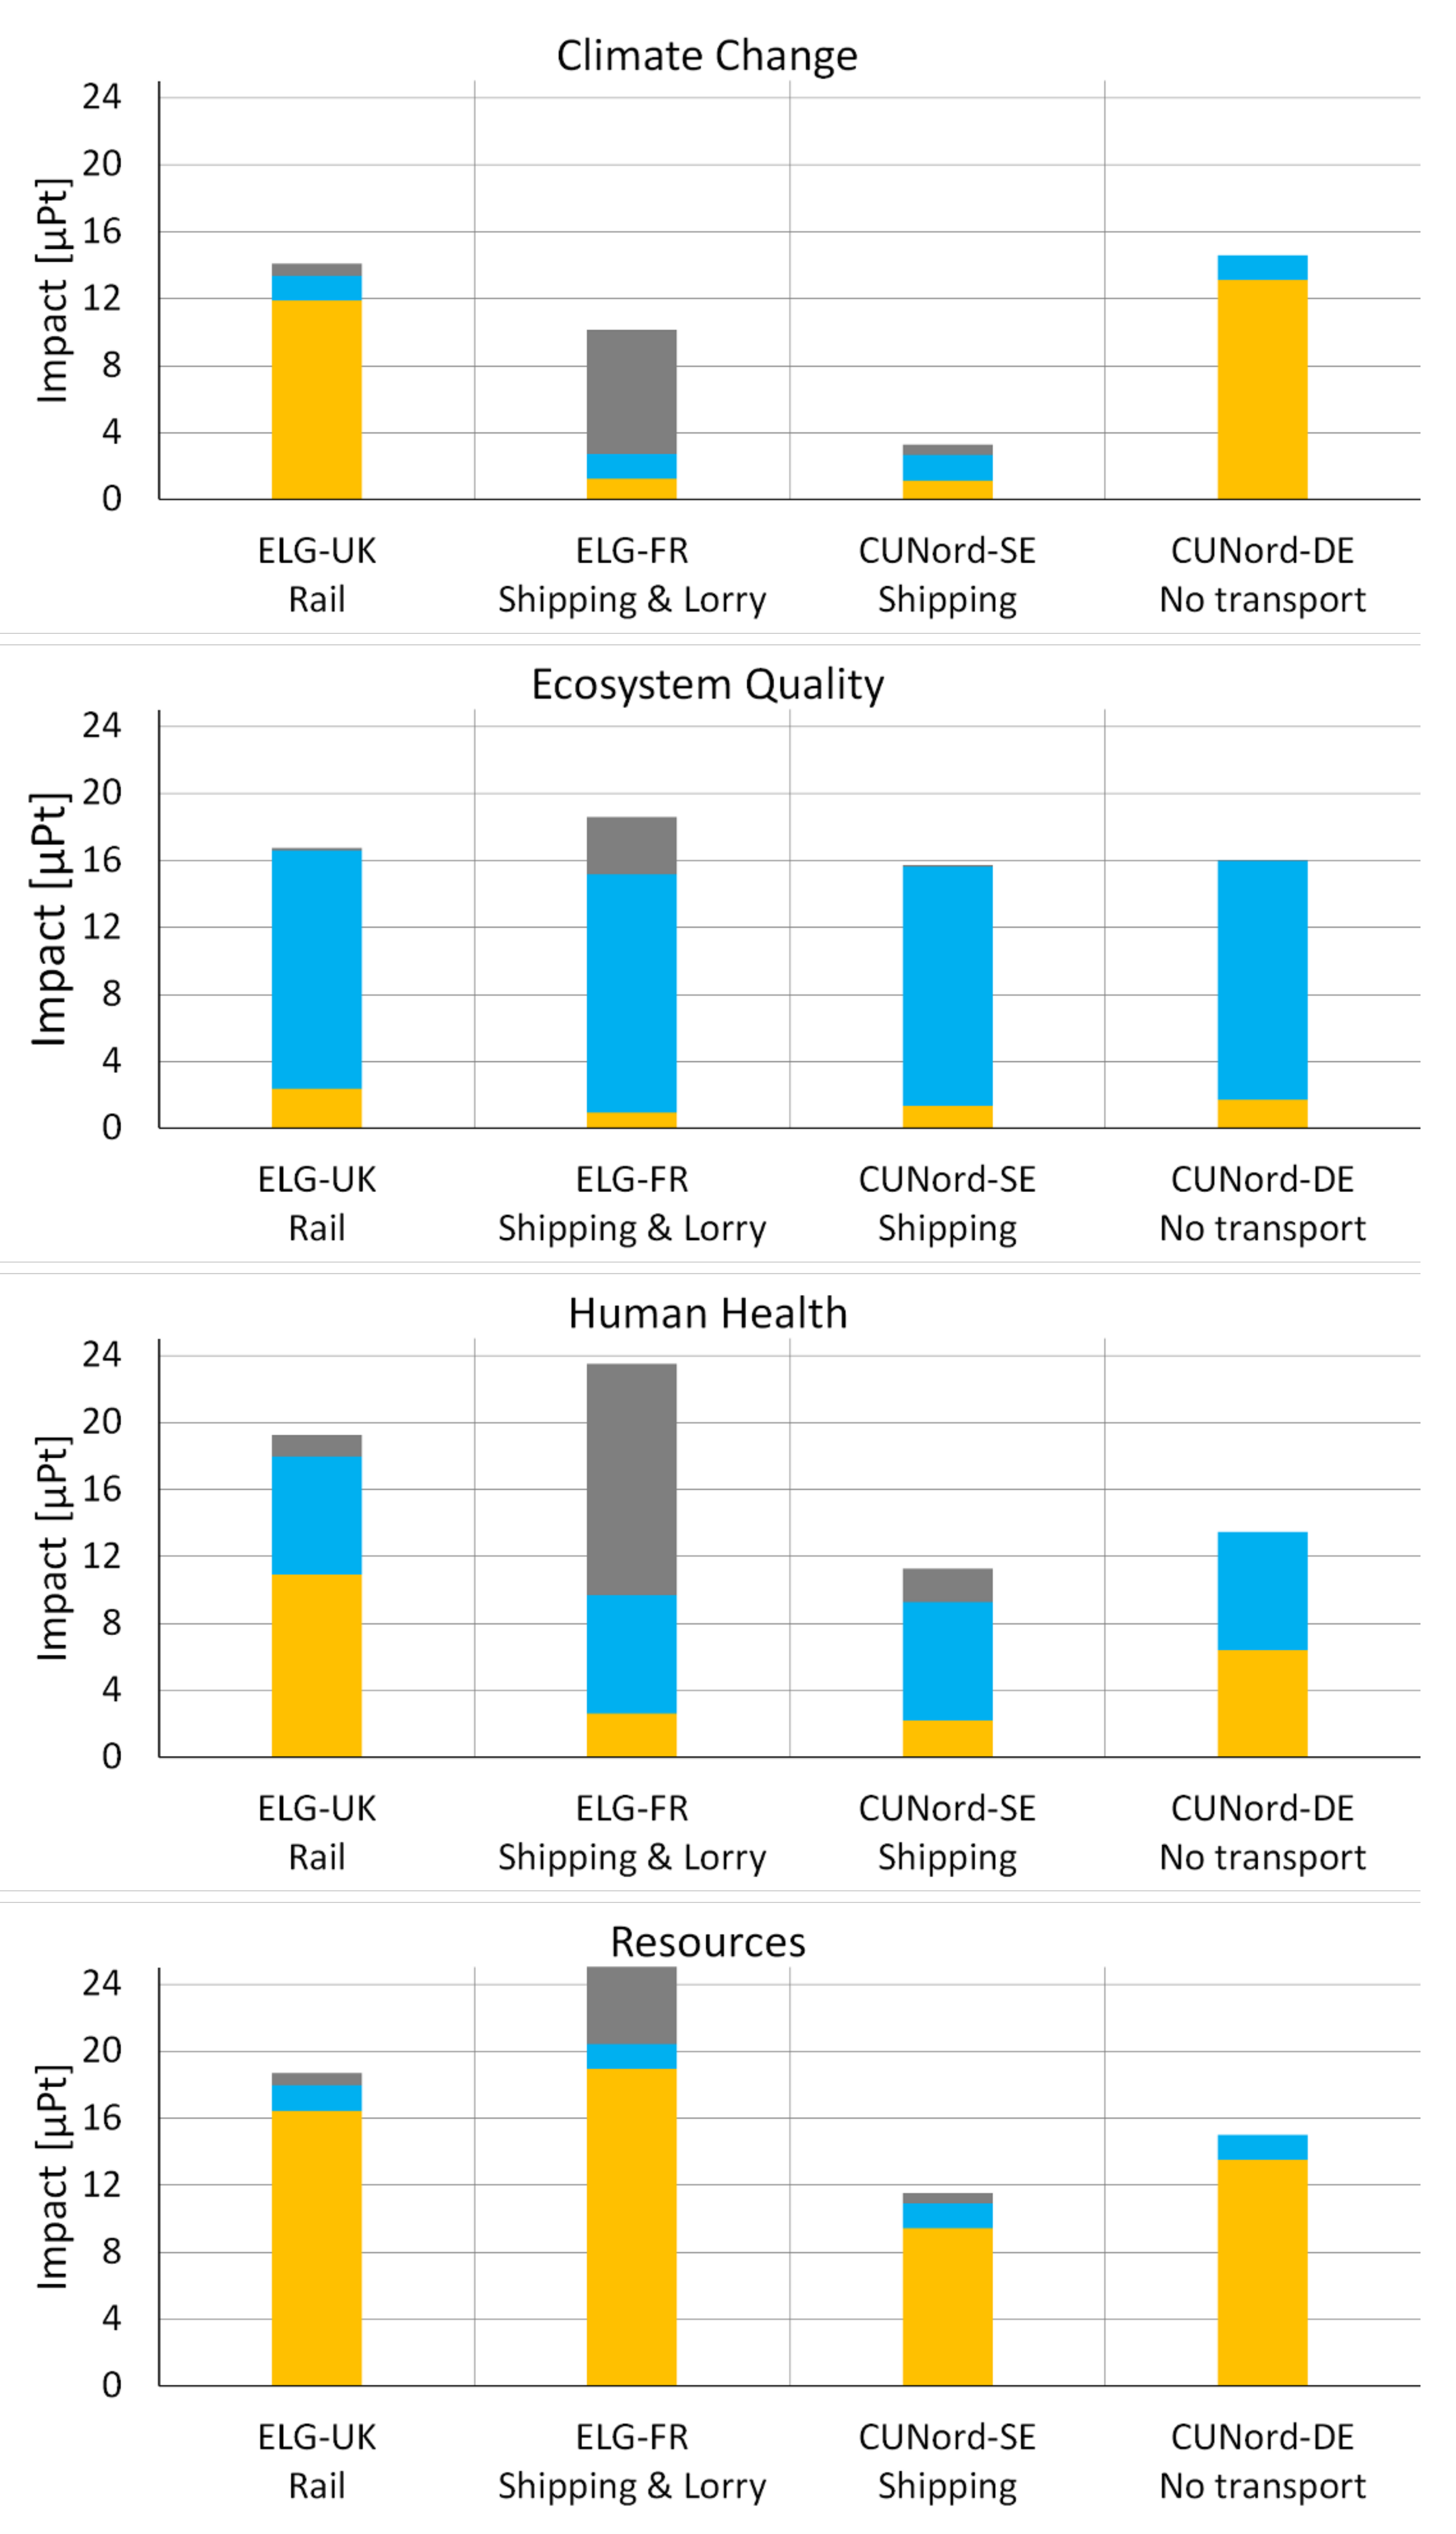
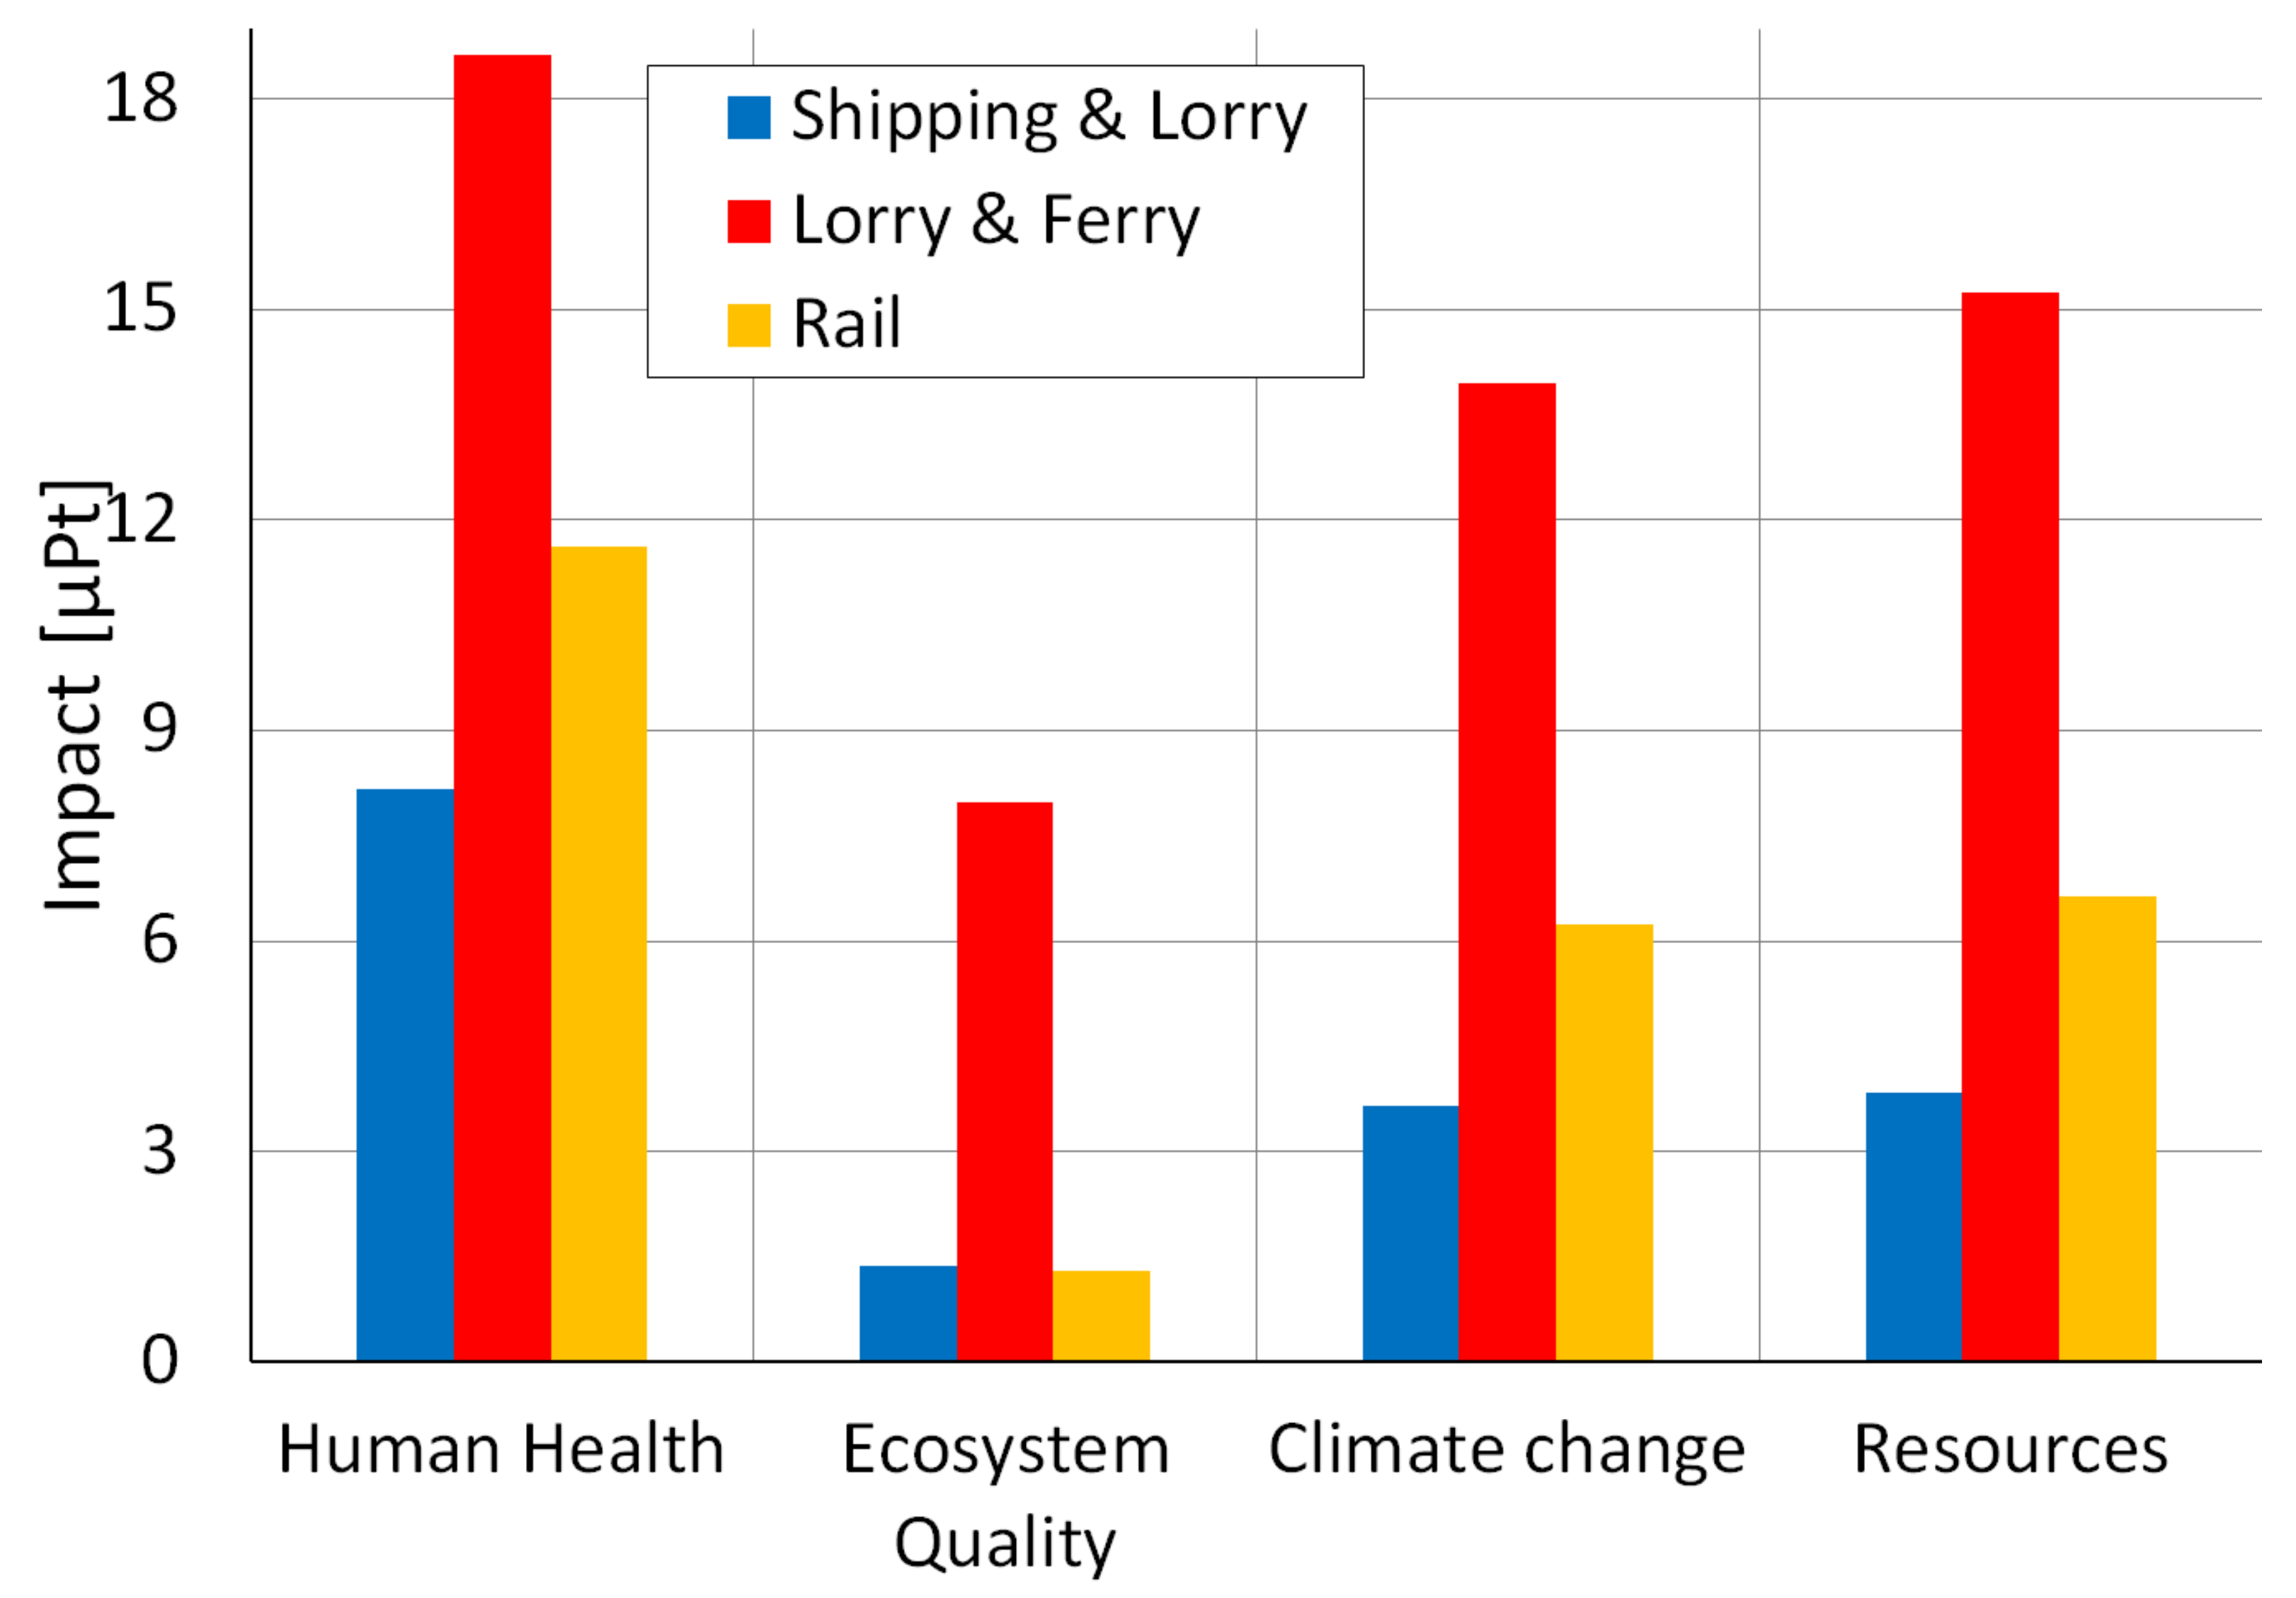
3.4. Impact Assessment of Material Transport Scenarios and Overall Country Comparison

The placement of the HiPerDiF technology (in the form of the second-generation machine) across various European scenarios can significantly affect the EI of its operation. However, the transportation of the material will also need to be calculated in order to provide a comprehensive LCA. Therefore, the system boundary has been expanded to include the transportation of reclaimed material from the reclamation facility to the remanufacturing site. By virtue of rCF being a non-degrading, stable material it has been assumed that there is no time limit on the travel route to its destination and for this reason shipping, rail and road haulage have all been considered. This assessment aims to understand if transporting material via a low-impact method such as shipping and then remanufacturing with HiPerDiF 2G in a location that sources electricity from renewable energy could result in a lower EI than remanufacturing the reclaimed material at the recycling facility that uses electricity sourced from fossil fuels. This analysis does not include the EI of the reclamation process itself, just the transportation of reclaimed materials to the HiPerDiF remanufacturing site.
In order to better understand real-world product placement and fit, it is anticipated that future optimised models of the technology, at technology readiness level (TRL) 9, would handle a higher throughput of material, measured in kg per hour instead of the current machine’s output of grammes per hour (TRL 2), with higher energy efficiency. After consideration of the academic literature available on technological scale-up [99,100] and consultation with composite and LCA experts at the University of Bristol, University of Surrey, and the NCC, it was concluded that taking into account the efficiency of scaling meant it was most likely the impact per functional unit as kg/hour output was the same as the current machine (at grammes/hour output). A working hypothesis allows for more calculations to be made with operation values of a commercialised, scaled HiPerDiF model of the future, including the material transportation. This accepts that there could be a minimal amount of deviation to either side of the value in future practice.
The two main composite reclamation centres in Europe are:
  • CU Nord in Stade, which sits alongside the River Elbe in Northern Germany (Composites United);
  • ELG Carbon Fibre in Birmingham, near the centre of the UK, accessible by road and train only (ELG Carbon Fibre Ltd.).
The HiPerDiF 2G locations in this analysis are selected based on their existing carbon fibre manufacturing capabilities:
  • Bristol, UK, is the baseline where HiPerDiF technology has been invented and developed;
  • Hexcel Composites GmbH, in Stade, DE, next to a major composite reclamation centre;
  • Varnberg, SE, the location of Carbon & Composites AB along the west coast of Sweden;
  • Roussillon, FR, the location of Hexcel’s other European carbon fibre manufacturing facility.
The site in Switzerland has been omitted from this analysis since the recommendation of an additional pump to recirculate the water through the HiPerDiF machine would require a significant reduction in the water required. The purpose of including Switzerland in the first part of the analysis was to highlight the reduction in damage with the inclusion of an efficient wastewater treatment network. However, the optimised model will be fitted with the recommended additional water tank, which may require a small increase in electricity for its functioning. Since the water would then be recirculated, there would only be a very low initial water input requirement.
A plethora of transport routes could be constructed between the sample group locations and reclamation points, demonstrated in Figure 8. For this comparison, the most direct and close to real-world options have been selected using a blend of road, rail, and sea options. The CED score for the distance travelled via each transportation method has been calculated and recorded in Table 3. Often the route by lorry or train involves a more direct route to the destination than via shipping, which is bound to established waterways. This results in indirect routes around the continent for ships, accompanied by additional lorry transport to/from port. Even so, initial analysis indicates that shipping has the lowest impact according to the CED method results, whereas road haulage is the highest.
To demonstrate the impact of each method of transportation, Figure 9 charts the IMPACT 2002+ analysis of three possible route scenarios from the ELG reclamation facility to the Hexcel manufacturing site in Stade, Germany into the four main EI categories (CC, EQ, HH, and Re). The route that is predominantly via road (including a small proportion of ferry transport across the English Channel) has significantly higher EI across all impact categories compared with the other two transport options. The route with predominantly shipping (with some road haulage to the port) is the lowest in all categories except EQ, and transport by rail sits in the middle of the two.
The largest contributing factor to the damage categories is the effect that GHG emissions have on the environment when fuel combustion occurs. Both train and lorry transport use diesel fuel, whereas ships predominantly use heavy fuel oil (HFO), lower in cost but highly polluting, or a blend of diesels, known as marine diesel oil. This can contribute to increased water and air pollution, and the devasting effects from oil spills. More recently there has been a very gradual transition towards liquified natural gas (LNG) carriers which contains less carbon per unit of energy than marine diesel [101], although LNG is predominantly methane—a significantly more potent GHG than CO2. Further research is required into the wider life cycle effects of LNG before more carriers make the transition.
Despite this, shipping has an average decrease in EI by 80% when compared to transport by lorry. More than 10 billion tonnes of cargo are transported globally by ship each year, which is approximately 90% of total trade [102]. This transportation dominance can be partially attributed to the capacity size of the shipping containers, standardised into 20 ft eq. units (TEU) which are then efficiently stacked on ships to maximise the space available—not possible with freight transport by train or lorry [103]. This “economies of scale” effect increases the output units whilst decreasing the average unit cost [104], as well as the average EI. TEU shipping containers can be effectively loaded directly onto cargo trains and lorries, to be transported to inland destinations.
Rail can also be an efficient method of bulk transportation over long distances, but the routes are not as flexible as road haulage. Where locations do not benefit from rail access, costly transhipment costs will apply, blocking the wider adoption of rail for freight transports. Within Europe, some trains run on electricity and others on diesel, and this varies from country to country. Whilst it is accepted that diesel-powered trains have a higher EI than electricity-powered, the result could also vary if the electric train running through France receives electricity predominantly from nuclear power generation, as opposed to a renewable energy source [105]. Within the UK, the government strategy is to optimise the current rail network and encourage the transfer of road haulage to train, potentially reducing GHG emissions in order to hit the “Net-zero by 2050” legal mandate [33]. It is estimated that each tonne of freight transported by rail reduces carbon emissions by 76% compared to road haulage, and each freight train removes 43 to 76 lorries from the roads [105]. However, the UK’s electrical grid would need to significantly decarbonise its current power source in order to reach the maximum benefits of this transition. The EI of logistics and transportation are currently under extreme scrutiny, with research also considering the role that hydrogen fuel cells could play in the future.
Road haulage is currently the highest impact method of freight transportation in this analysis, as indicated by the highest impact across all categories, despite accruing the fewest miles travelled. This is what makes transport by road so convenient: lorries can take advantage of the most direct routes between locations. There are other negative social consequences of road haulage which are not included in this analysis, such as increased traffic and noise pollution, which disrupts human and animal physical and mental health. If the cost of transportation and other market forces were not an issue, transport by road should be completely avoided. Shipping is the lowest EI form of long-distance transportation, and potentially most cost-effective. However, it is also one of the slowest. Whilst this is suitable for these relatively inert reclaimed fibres, the flexibility of transport by lorry over shipping and rail means road haulage is, unfortunately, more popular; it is estimated that around 70% of freight within the US is transported by lorry [106]. However, recent developments in electrification for road haulage means it is very gradually becoming more environmentally attractive [107,108], but the true costs of these changes are yet to be fully understood.
The final analysis of this study combined the route to each remanufacturing location that received the lowest CED score (from Table 3 highlighted in green) with the processing impact of the HiPerDiF 2G operation. Using IMPACT 2002+ analysis, the original four impact categories (CC, EQ, HH, and Re) were compared to establish the lowest impact option overall. The results are presented in Figure 10.
Without CH included in the sample group, SE is now the country with the overall lowest EI for operating the HiPerDiF technology. Transporting material to the HiPerDiF 2G location in SE from CU Nord (via shipping) was also the lowest impact transport option across the entire sample group, despite being the second longest in distance.
The second optimal overall scenario is from CU Nord to Hexcel Composites (DE), which requires virtually no transportation. The effect of moving large quantities of reclaimed material around the same facility, even if the site is large, will be negligible when compared to the other distances travelled across this sample group. The next highest impact overall was ELG, Birmingham (UK) to NCC, Bristol (UK) via rail scenario—the shortest distance travelled of all four scenarios—where the impact of transportation on all of the damage categories is practically negligible. The smallest change in overall EI occurred when transporting material within the UK or DE because the two main fibre reclamation centres are based in these countries, resulting in reduced transport distances. Despite this, the UK and DE still have the highest impact on CC and Re categories due to the heavy reliance on power from fossil fuels. The UK’s electricity is generated from a slightly higher proportion of fossil fuels than DE, as reflected in the marginally higher impact scores for CC and Re for electricity. Transport burdens do become more significant for countries having a lower fossil fuel reliance, as reflected by the lower HH impacts for SE and FR. Although SE has the second-longest distance to travel, it has the lowest impact of these three scenarios because it used only shipping from CU Nord—the least damaging transportation method—which is impossible for the land-locked locations in the UK and FR. For the EQ damage category, the transport burden is negligible since these impacts are associated with large amounts of water waste. Even with the scaled increase in fibre concentration to 1 kg of preform produced per hour, it would require the same amount of water and is therefore still the largest contributing factor for that impact category. However, the impact on EQ in the DE scenario is nearly equal to SE with the inclusion of transportation in the system boundary, attributed to the impact of SE’s HEP generation on the surrounding ecosystems.
The most damaging scenario was for transporting the material from ELG to FR via shipping and road haulage. Despite this scenario being the longest distance, nearly 18% of the total distance travelled is via road haulage. It has been previously discussed that transportation by road is the highest impact method available in this analysis, so it can be deduced that the larger impact scores can be attributed to the lorry section of the route. Since FR generates its electricity predominantly from nuclear, this pushes up the impact on Re and reduces the impact on CC.

3.5. Interpretation and Future Considerations

This study identifies the challenges of recycling CFRP, with respect to the resulting degraded material, complications with dismantling and transportation, and reduced economic value of onward applications of the material. Completing analyses holistically and iteratively with LCA highlights the interconnectivity of environmental problems, and that focusing on one aspect will shift burdens to another. Consideration of EI early in the design of new technology can result in more sustainable processes being developed.
There are many additional factors that have not been considered in this study that can affect the final EI score. Some of the transport routes in these analyses are unrealistic since the calculated distances are linear. In real-world conditions, trains would follow existing rail lines, some of which may not include industrial freight transport. Lorry transport would be required along more sections of each route, which was an impractical consideration for this study. Haulage arrangements post-Brexit have been significantly disrupted with hauliers declining to take on loads destined for the UK coupled with increased freight charges and paperwork [109]. However, it is unknown at this stage how this will shape long-term logistics between the UK and the EU. The differences in landscapes and weather conditions can significantly alter the amount of fuel required. Additionally, the energy sector across Europe is changing in response to growing concerns over climate change: the UK has increased the offshore wind farm [110] and DE is phasing out their nuclear power plants, along with some other countries [111].
Recycling a product at the end of its life should result in ecological benefits when compared with producing virgin material for the next product life cycle, but often this is unfortunately not always the case. There are other issues at EOL which contribute to the EI beyond the remanufacturing process which has not been considered in this analysis, such as disassembly of the product, reducing the size, transporting the waste to the recycling facility, and treating the reclaimed fibres to be compatible with the remanufacturing process. The EI of the reclamation processes themselves will need to be accounted for in a fully comprehensive LCA, including the energy, material, and equipment inputs for pyrolysis and solvolysis, the two commercial fibre reclamation methods available at the moment. The main input for pyrolysis is heat, and for solvolysis, it would be the production of the chemicals [112,113].
As more composite structures reach the end of their useful life and the amount of reclaimed fibre accumulates, strategic decisions over the location of HiPerDiF technology in relation to the reclamation facility will need to be carefully considered. Much like the variation in EI across the locations for operating HiPerDiF, the location of these reclamation facilities could also affect the overall EI. Considering the EOL supply chain in the future, further research could be to investigate if the establishment of specialised carbon fibre composite waste processing hubs would result in lower EI and economic costs. For example, a coastal location surrounding the North Sea with electricity from renewable energy sources that could reclaim and remanufacture fibres from EOL offshore wind turbines, or a hub in relative proximity to a major airport or aircraft decommissioning centres, that can specialise in recycling fibre from decommissioned aircraft. Early consideration of these logistical issues can establish how HiPerDiF technology can best fit into these supply chains to ensure that the EI of reclamation remains low whilst maximising the economic value it can bring to second-life carbon fibre.
Another significant trade-off is the economic implications, which have not been considered in this report. When decisions are made, potential economic benefits have long outweighed environmental factors. The cost of reclaimed fibres will vary depending on the supplier: ELG is one of Europe’s largest CFRP recycling companies by commercialising pyrolysis with an annual process rate of 2000 tonnes/yr [114]. With this volume, it could be more cost-effective than CU Nord [115]. High quality recyclate generates market demand, and therefore the addition of the innovatory HiPerDiF approach to realigning rCF should add value to recyclate, indicating that fully recycling carbon fibres in this way would make economic sense. The inventory data collected for this LCA can also be used to inform a life cycle costing (LCC) analysis.
Finally, these results were generated using two LCIA methods, IMPACT 2002+ and CED. Future analyses should include other impact assessment methods to validate the optimised model before commercialisation. This LCA focused on a gate-to-gate remanufacture process, with the widening of the boundary to include transportation costs, but further work would expand the system boundary to consider the full decommissioning and reclamation impacts of the EOL phase, incorporation of emerging fibre reclamation technologies such as fluidised-bed processing, and a comparison with the EI of virgin composite production. This HiPerDiF conceptual technology has presented the composites industry with a potential solution to close the loop on EOL waste, keeping material within the industrial system. Since the completion of this report, a scaled third generation HiPerDiF (3G) machine has been constructed at the National Composites Centre in Bristol, UK. This development is fully instrumented, automated, designed for 100 m/hr throughput and has incorporated the results of this paper to optimise the PED of the next-generation model. Furthermore, a spin-out company (Lineat Composites, https://lineat.co.uk/, accessed on 23 December 2021) has recently been formed to commercialise the technology. An updated holistic and iterative LCA study is recommended after the HiPerDiF 3G technology optimisation to account for these changes, and further highlight the interconnectivity of the environmental and economic issues at EOL. Together with industrial partners, this study will assist with establishing HiPerDiF’s best fit within the supply chain and should include a cost analysis to fully remanufacture waste composite, including detailed transport routes.

4. Conclusions

The LCA presented in this report has assessed the EI associated with a HiPerDiF 2G technology prototype. The intention was to address the identified environmental hotspots for the next optimised model whilst also scaling up the productivity of the resulting preform. The HiPerDiF technology is an effective methodology to remanufacture rCF into high performance recycled composites. To date, its capability has been limited to laboratory-scale performance, but the construction of a scaled-up machine (HiPerDiF 3G) should improve this aspect considerably.
The vacuum suction appliance had the greatest EI in three of the four damage categories, consuming 64% of the total power of the machine.
Water usage accounted for 84% of damage to EQ of operating HiPerDiF, predominantly due to the water not being reused. The addition of a full water recirculation system has been proposed in order to reuse the water for each cycle. Recirculating the water for each cycle of this process will significantly minimise the overall requirement, especially as the technology is scaled-up.
Whilst this impact analysis is a rudimentary step to understand the implications of recycling carbon fibre, this result indicates that location and logistics, i.e., the distance between reclamation and remanufacturing facilities, can have a large impact on the overall environmental scores of remanufacturing reclaimed fibres:
  • Countries with a decarbonised electricity grid are preferable for minimal processing impact associated with the operation of HiPerDiF.
  • Transportation of reclaimed material via shipping from a country with electricity predominantly generated from non-renewable sources to a country using electricity from predominantly renewable sources results in a lower EI overall. Although shipping is a slow form of transport, the quality of the inert fibre material would not be affected by long delivery times. Road transport resulted in the highest EI in all modelled routes.
  • If it were not possible to position the HiPerDiF 2G in a location that receives electricity from renewable sources, then the next least damaging option would be to locate the machine close to reclamation centres to minimise the EI attributed to material transportation. The colocation of the reclamation and of the remanufacturing facility in a dedicated centre able to generate its own electricity from renewables on site would be the ideal solution for companies that are setting up from scratch.
This study was completed on the conceptual HiPerDiF second prototype (HiPerDiF 2G), and a second evaluation should be conducted on the optimised third-generation model (HiPerDiF 3G) recently completed at the National Composites Centre in Bristol, UK.
The results of this study demonstrate a methodology to evaluate the environmental impact of this new technology at early conceptual development via LCA informed by primary data collection. Moreover, this work offers an example of how to investigate the possible implications of placing a new technology in the current European supply chain considering different scenarios.

Author Contributions

Conceptualization, A.M.F., N.W. and M.L.L.; methodology, A.M.F., N.W. and M.L.L.; software, A.M.F.; validation, A.M.F., N.W. and M.L.L.; formal analysis, A.M.F. and M.L.L.; investigation, A.M.F., N.W. and M.L.L.; resources, M.L.L.; data curation, A.M.F., N.W. and M.L.L.; writing—original draft preparation, A.M.F. and N.W.; writing—review and editing, A.M.F. and M.L.L.; visualization, A.M.F. and M.L.L.; supervision, M.L.L., A.V.L.F., T.Y., D.A.J., R.J.M., I.H. and F.M.; project administration, A.M.F. and M.L.L.; funding acquisition, A.M.F. and M.L.L. All authors have read and agreed to the published version of the manuscript.

Funding

The authors thank the Engineering and Physical Sciences Research Council for supporting this project through the ‘High Performance discontinuous fibre composites—a sustainable route to the next generation of composites’ (EP/P027393/1) grant [44] and the Open Research team at the University of Surrey for funding the publication of this article.

Institutional Review Board Statement

Not applicable.

Informed Consent Statement

Not applicable.

Data Availability Statement

All data required for reproducibility are provided within the paper.

Conflicts of Interest

The authors declare no conflict of interest.

Abbreviations

AbbreviationDefinition
ADFPAligned discontinuous fibre preform
CCClimate change
CEDCumulative energy demand
CFCarbon fibre
CFRPCarbon fibre reinforced polymer composite
CHSwitzerland
COCarbon monoxide
CO2Carbon dioxide
CO2eqCarbon dioxide equivalent
DEGermany
EfWEnergy from waste
EIEnvironmental impact
ELVEnd of Life Vehicle Directive
EOLEnd of life
EPEpoxy thermoset resin matrix
EPSRCEngineering and Physical Sciences Research Council
EQEcosystem quality
EUEuropean Union
FRFrance
FUFunctional unit
GCVGross calorific value
GFRPGlass fibre reinforced polymer composite
GHGGreenhouse gas
GWPGlobal warming potential
HEPHydroelectric power
HFOHeavy fuel oil
HHHuman health
HiPerDiFHigh Performance Discontinuous Fibre technology
IPCCIntergovernmental Panel on Climate Change
ISOInternational Standards Organisation
LCALife cycle assessment
LCCLife cycle costing analysis
LCILife cycle inventory
LCIALife cycle impact assessment
LNGLiquified natural gas
NCCNational Composite Centre
NGNatural gas
NOxNitrogen oxide
PANPolyacrylonitrile
PEDProcess energy demand
rCFReclaimed carbon fibre
ReResources
SESweden
SO2/xSulphur dioxide/oxides
TEUTwenty-foot equivalent unit
TRLTechnology readiness level
UKUnited Kingdom
USUnited States
vCFVirgin carbon fibre
VOCVolatile organic compound

References

  1. Mouritz, A.P. Fibre–polymer composites for aerospace structures and engines. In Introduction to Aerospace Materials; Woodhead Publishing: Sawston, UK, 2012; pp. 338–393. [Google Scholar]
  2. Job, S.; Leeke, G.; Oliveux, G.; Pickering, S.; Shuaib, N.A. Composites Recycling: Where Are We Now? Composites UK: Berkhamstead, UK, 2016. [Google Scholar]
  3. McConnell, V.P. Launching the carbon fibre recycling industry. Reinf. Plast. 2010, 54, 33–37. [Google Scholar] [CrossRef]
  4. Commission Directive (EU). Directive 2008/98/EC of the European Parliament and of the Council of 19 November 2008 on Waste and Repealing Certain Directives (Text with EEA Relevance); European Parliament: Strasbourg, France, 2008. [Google Scholar]
  5. Li, X.; Bai, R.; McKechnie, J. Environmental and financial performance of mechanical recycling of carbon fibre reinforced polymers and comparison with conventional disposal routes. J. Clean. Prod. 2016, 127, 451–460. [Google Scholar] [CrossRef]
  6. Council of the European Union. Council Directive 1999/31/EC of 26 April 1999 on the Landfill of Waste; European Parliament: Strasbourg, France, 1999. [Google Scholar]
  7. Sakellariou, N. Current and potential decommissioning scenarios for end-of-life composite wind blades. Energy Syst. 2018, 9, 981–1023. [Google Scholar] [CrossRef]
  8. Das, S. The Cost of Automotive Polymer Composites: A review and Assessment of DOE’s Lightweight Materials Composite Research; Oak Ridge National Laboratory: Oak Ridge, TN, USA, 2001.
  9. Commission Directive (EU). Directive 2000/53/EC of the European Parliament and of the Countil of 18 September 2000 on End-Of-Life Vehicles; European Parliament, Council of the European Union: Strasbourg, France, 2000. [Google Scholar]
  10. Pickering, S.J. Recycling technologies for thermoset composite materials—Current status. Compos. Part A Appl. Sci. Manuf. 2006, 37, 1206–1215. [Google Scholar] [CrossRef]
  11. Pimenta, S.; Pinho, S.T. Recycling carbon fibre reinforced polymers for structural applications: Technology review and market outlook. Waste Manag. 2011, 31, 378–392. [Google Scholar] [CrossRef] [Green Version]
  12. Oliveux, G.; Dandy, L.O.; Leeke, G.A. Current status of recycling of fibre reinforced polymers: Review of technologies, reuse and resulting properties. Prog. Mater. Sci. 2015, 72, 61–99. [Google Scholar] [CrossRef] [Green Version]
  13. Piñero-Hernanz, R.; Dodds, C.; Hyde, J.; García-Serna, J.; Poliakoff, M.; Lester, E.; Cocero, M.J.; Kingman, S.; Pickering, S.S.; Wong, K.H. Chemical recycling of carbon fibre reinforced composites in nearcritical and supercritical water. Compos. Part A Appl. Sci. Manuf. 2008, 39, 454–461. [Google Scholar] [CrossRef]
  14. Oliveux, G.; Dandy, L.O.; Leeke, G.A. Degradation of a model epoxy resin by solvolysis routes. Polym. Degrad. Stab. 2015, 118, 96–103. [Google Scholar] [CrossRef] [Green Version]
  15. Pimenta, S.; Pinho, S.T. The effect of recycling on the mechanical response of carbon fibres and their composites. Compos. Struct. 2012, 94, 3669–3684. [Google Scholar] [CrossRef] [Green Version]
  16. Meyer, L.O.; Schulte, K.; Grove-Nielsen, E. CFRP-Recycling Following a Pyrolysis Route: Process Optimization and Potentials. J. Compos. Mater. 2003, 43, 1121–1132. [Google Scholar] [CrossRef] [Green Version]
  17. Åkesson, D.; Foltynowicz, Z.; Christéen, J.; Skrifvars, M. Microwave pyrolysis as a method of recycling glass fibre from used blades of wind turbines. J. Reinf. Plast. Compos. 2012, 31, 1136–1142. [Google Scholar] [CrossRef]
  18. Edwards, K.L. An overview of the technology of fibre-reinforced plastics for design purposes. Mater. Des. 1998, 19, 1–10. [Google Scholar] [CrossRef]
  19. Wong, K.H.; Pickering, S.J.; Rudd, C.D. Recycled carbon fibre reinforced polymer composite for electromagnetic interference shielding. Compos. Part A Appl. Sci. Manuf. 2010, 41, 693–702. [Google Scholar] [CrossRef]
  20. Miyake, T.; Imaeda, S. A dry aligning method of discontinuous carbon fibers and improvement of mechanical properties of discontinuous fiber composites. Adv. Manuf. Polym. Compos. Sci. 2016, 2, 117–123. [Google Scholar] [CrossRef] [Green Version]
  21. Mohammad, M.; Hasan, B.; Nitsche, S.; Abdkader, A.; Cherif, C. Influence of process parameters on the tensile properties of DREF-3000 friction spun hybrid yarns consisting of waste staple carbon fiber for thermoplastic composites. Text. Res. J. 2019, 89, 32–42. [Google Scholar]
  22. Rimmel, O.; May, D.; Goergen, C.; Poeppel, A.; Mitschang, P. Development and validation of recycled carbon fiber-based binder tapes for automated tape laying processes. J. Compos. Mater. 2019, 53, 3257–3268. [Google Scholar] [CrossRef] [Green Version]
  23. Turner, T.A.; Warrior, N.A.; Pickering, S.J. Development of high value moulding compounds from recycled carbon fibres Development of high value moulding compounds from recycled carbon fibres. Plast. Rubber Compos. 2013, 39, 151–156. [Google Scholar] [CrossRef]
  24. Heider, D.; Tierney, J.; Deitzel, J.; Kubota, M.; Thiravong, J.; Gargitter, V.; Burris, W.; Morris, J.; Shevchenko, N.; Yarlagadda, S.; et al. Closed Loop Recycling of CFRP Into Highly Aligned High Performance Short Fiber Composites Using the TUFF Process. In Proceedings of the SAMPE 2019 Technical Conference and Exhibition, Charlotte, NC, USA, 20–23 May 2019. [Google Scholar]
  25. Yu, H.; Potter, K.D.; Wisnom, M.R. A novel manufacturing method for aligned discontinuous fibre composites (High Performance-Discontinuous Fibre method). Compos. Part A Appl. Sci. Manuf. 2014, 65, 175–185. [Google Scholar] [CrossRef]
  26. Longana, M.L.; Yu, H.; Jalavand, M.; Wisnom, M.R.; Potter, K.D. Aligned discontinuous intermingled reclaimed/virgin carbon fibre composites for high performance and pseudo-ductile behaviour in interlaminated carbon-glass hybrids. Compos. Sci. Technol. 2017, 143, 13–21. [Google Scholar] [CrossRef] [Green Version]
  27. Longana, M.L.; Ondra, V.; Yu, H.; Potter, K.D.; Hamerton, I. Reclaimed carbon and flax fibre composites: Manufacturing and mechanical properties. Recycling 2018, 3, 52. [Google Scholar] [CrossRef] [Green Version]
  28. Longana, M.L.; Yu, H.; Hamerton, I.; Potter, K.D. Development and application of a quality control and property assurance methodology for reclaimed carbon fibers based on the HiPerDiF (High Performance Discontinuous Fibre) method and interlaminated hybrid specimens. Adv. Manuf. Polym. Compos. Sci. 2018, 4, 48–55. [Google Scholar] [CrossRef] [Green Version]
  29. Longana, M.L.; Ong, N.; Yu, H.; Potter, K.D. Multiple closed loop recycling of carbon fibre composites with the HiPerDiF (High Performance Discontinuous Fibre) method. Compos. Struct. 2016, 153, 271–277. [Google Scholar] [CrossRef] [Green Version]
  30. Tapper, R.J.; Longana, M.L.; Yu, H.; Hamerton, I.; Potter, K.D. Development of a closed-loop recycling process for discontinuous carbon fibre polypropylene composites. Compos. Part B Eng. 2018, 146, 222–231. [Google Scholar] [CrossRef] [Green Version]
  31. Tapper, R.J.; Longana, M.L.; Hamerton, I.; Potter, K.D. A Closed-Loop Recycling Process for Discontinuous Carbon Fibre Polyamide 6 Composites; University of Bristol: Bristol, UK, 2019. [Google Scholar]
  32. Aravindan, P.; Becagli, F.; Longana, M.L.; Blok, L.G.; Pozegic, T.R.; Huntley, S.J.; Rendall, T.; Hamerton, I. Remanufacturing of Woven Carbon Fibre Fabric Production Waste into High Performance Aligned Discontinuous Fibre Composites. J. Compos. Sci. 2020, 4, 68. [Google Scholar] [CrossRef]
  33. Priestley, S. Briefing Paper Number CBP8590: Net Zero in the UK; House of Commons Library: London, UK, 2019. [Google Scholar]
  34. Otheguy, M.E.; Gibson, A.G.; Findon, E.; Cripps, R.M.; Ochoa Mendoza, A.; Aguinaco Castro, M.T. Recycling of end-of-life thermoplastic composite boats. Plast. Rubber Compos. 2009, 38, 406–411. [Google Scholar] [CrossRef]
  35. Witik, R.A.; Gaille, F.; Teuscher, R.; Ringwald, H.; Michaud, V.; Månson, J.-A.E. Economic and environmental assessment of alternative production methods for composite aircraft components. J. Clean. Prod. 2012, 29–30, 91–102. [Google Scholar] [CrossRef]
  36. Bachmann, J.; Hidalgo, C.; Bricout, S. Environmental analysis of innovative sustainable composites with potential use in aviation sector—A life cycle assessment review. Sci. China Technol. Sci. 2017, 60, 1301–1317. [Google Scholar] [CrossRef] [Green Version]
  37. Hong, T.; Hastak, M. Life-cycle cost assessment model for fiber reinforced polymer bridge deck panels. Can. J. Civ. Eng. 2007, 34, 976–991. [Google Scholar] [CrossRef]
  38. Hunkeler, D.; Rebitzer, G. The future of life cycle assessment. Int. J. Life Cycle Assess. 2005, 10, 305–308. [Google Scholar] [CrossRef]
  39. Zhang, C. The environmental impacts of fibre-reinforced polymer composites in construction. Proc. Inst. Civ. Eng. Constr. Mater. 2015, 168, 276–286. [Google Scholar] [CrossRef]
  40. Martínez-Rocamora, A.; Solís-Guzmán, J.; Marrero, M. LCA databases focused on construction materials: A review. Renew. Sustain. Energy Rev. 2016, 58, 565–573. [Google Scholar] [CrossRef]
  41. Rankine, R.K.; Chick, J.P.; Harrison, G.P. Energy and carbon audit of a rooftop wind turbine. Proc. Inst. Mech. Eng. Part A J. Power Energy 2006, 220, 643–654. [Google Scholar] [CrossRef] [Green Version]
  42. Merugula, L.A.; Khanna, V.; Bakshi, B.R. Comparative life cycle assessment: Reinforcing wind turbine blades with carbon nanofibers. In Proceedings of the IEEE International Symposium on Sustainable Systems and Technology, ISSST, Arlington, VA, USA, 17–19 May 2010. [Google Scholar]
  43. Yu, H.; Potter, K.D. Method and Apparatus for Aligning Discontinuous Fibres. UK Patent EP2986768B1, 4 April 2014. [Google Scholar]
  44. Engineering and Physical Sciences Research Council. High Performance Discontinuous Fibre Composites—A Sustainable Route to the Next Generation of Composites. 2017. Available online: https://gow.epsrc.ukri.org/NGBOViewGrant.aspx?GrantRef=EP/P027393/1 (accessed on 25 February 2021).
  45. Longana, M.L.; Yu, H.; Lee, J.; Pozegic, T.R.; Huntley, S.J.; Rendall, T.; Potter, K.D.; Hamerton, I. Quasi-isotropic and Pseudo-Ductile Highly Aligned Discontinuous Fibre Composites Manufactured with the HiPerDiF (High Performance Discontinuous Fibre) Technology. Materials 2019, 12, 1794. [Google Scholar] [CrossRef] [Green Version]
  46. Pozegic, T.R.; Huntley, S.J.; Longana, M.L.; He, S.; Indrachapa Bandara, R.M.; King, S.G.; Hamerton, I. Improving Dispersion of Recycled Discontinuous Carbon Fibres to Increase Fibre Throughput in the HiPerDiF Process. Materials 2020, 13, 1544. [Google Scholar] [CrossRef] [Green Version]
  47. Huntley, S.; Rendall, T.; Longana, M.; Pozegic, T.; Potter, K.; Hamerton, I. Validation of a smoothed particle hydrodynamics model for a highly aligned discontinuous fibre composites manufacturing process. Compos. Sci. Technol. 2020, 196, 108152. [Google Scholar] [CrossRef]
  48. Huntley, S.; Rendall, T.; Longana, M.; Pozegic, T.; Potter, K.; Hamerton, I. SPH Simulation for Short Fibre Recycling Using Water Jet Alignment SPH Simulation for Short Fibre Recycling Using Water Jet Alignment. Int. J. Comut. Fluid Dyn. 2021, 35, 129–142. [Google Scholar] [CrossRef]
  49. BS EN ISO 14040; 2006 Environmental Management—Life Cycle Assessment—Principles and Framework. British Standards Institution: London, UK, 2006.
  50. BS EN ISO 14044; 2006 Environmental Management—Life Cycle Assessment—Requirements and Guidelines. British Standards Institution: London, UK, 2006.
  51. Tapper, R.J.; Longana, M.L.; Norton, A.; Potter, K.D.; Hamerton, I. An evaluation of life cycle assessment and its application to the closed-loop recycling of carbon fibre reinforced polymers. Compos. Part B Eng. 2020, 184, 107665. [Google Scholar] [CrossRef]
  52. Deng, Y.; Paraskevas, D.; Tian, Y.; Van Acker, K.; Dewulf, W.; Duflou, J.R. Life cycle assessment of flax-fibre reinforced epoxidized linseed oil composite with a flame retardant for electronic applications. J. Clean. Prod. 2016, 133, 427–438. [Google Scholar] [CrossRef]
  53. Meng, F.; Mckechnie, J.; Turner, T.; Wong, K.H.; Pickering, S.J. Environmental Aspects of Use of Recycled Carbon Fiber Composites in Automotive Applications. Environ. Sci. Technol. 2017, 51, 12727–12736. [Google Scholar] [CrossRef]
  54. Witik, R.A.; Teuscher, R.; Michaud, V.; Ludwig, C.; Månson, J.-A.E. Carbon fibre reinforced composite waste: An environmental assessment of recycling, energy recovery and landfilling. Compos. Part A Appl. Sci. Manuf. 2013, 49, 89–99. [Google Scholar] [CrossRef]
  55. Rebitzer, G.; Ekvall, T.; Frischknecht, R.; Hunkeler, D.; Norris, G.; Rydberg, T.; Schmidt, W.P.; Suh, S.; Weidema, B.P.; Pennington, D.W. Life cycle assessment Part 1: Framework, goal and scope definition, inventory analysis, and applications. Environ. Int. 2004, 30, 701–720. [Google Scholar] [CrossRef]
  56. Carbon & Composites Sweden. Available online: https://www.carbon-composites.se/ (accessed on 19 February 2021).
  57. Reseau de Transport D’electricite (RTE). RTE—Electricity Report 2017/2017 Annual Electricity Report; Reseau de Transport D’electricite (RTE): Paris, France, 2017. [Google Scholar]
  58. Hexcel Stade. Available online: https://www.hexcel.com/About/Site-Locations/1457/hexcel-stade (accessed on 19 February 2021).
  59. Composites United e.V. Available online: https://composites-united.com/cluster/cu-nord/ (accessed on 25 February 2021).
  60. Hexcel Roussillon. Available online: https://www.hexcel.com/About/Site-Locations/1454/hexcel-roussillon (accessed on 19 February 2021).
  61. ELG Carbon Fibre Ltd. Available online: http://www.elgcf.com/ (accessed on 25 February 2021).
  62. Gen 2 Carbon. Available online: https://www.gen2carbon.com/ (accessed on 1 October 2021).
  63. Sea Routes. Available online: https://classic.searoutes.com/ (accessed on 25 February 2021).
  64. Jolliet, O.; Margni, M.; Charles, R.; Humbert, S.; Payet, J.; Rebitzer, G.; Rosenbaum, R. IMPACT 2002+: A New Life Cycle Impact Assessment Methodology. Int. J. Life Cycle Assess. 2003, 8, 324–330. [Google Scholar] [CrossRef] [Green Version]
  65. European Commission Joint Research Centre—Institute for Environment and Sustainability. International Reference Life Cycle Data System (LCD) Handbook: Recommendations for Life Cycle Impact Assessment in the European Context; Publications Office of the European Union: Luxemburg, 2011. [Google Scholar]
  66. Humbert, S.; de Schryver, A.; Bengoa, X.; Margni, M.; Jolliet, O. IMPACT 2002+: User Guide; Quantis: Renens, Switzerland, 2014. [Google Scholar]
  67. Frischknecht, R.; Jungbluth, N.; Althaus, H.J.; Bauer, C.; Doka, G.; Dones, R.; Hischier, R.; Hellweg, S.; Köllner, T.; Loerincik, Y.; et al. Implementation of Life Cycle Impact Assessment Methods; Ecoinvent Centre: Duberndorf, Switzerland, 2007. [Google Scholar]
  68. Raghuvanshi, S.; Bhakar, V.; Sowmya, C.; Sangwan, K.S. Waste water treatment plant life cycle assessment: Treatment process to reuse of water. Proc. CIRP 2017, 61, 761–766. [Google Scholar] [CrossRef]
  69. Lockwood, M. The political sustainability of climate policy: The case of the UK Climate Change Act. Glob. Environ. Chang. 2013, 23, 1339–1348. [Google Scholar] [CrossRef] [Green Version]
  70. Energy UK. Energy in the UK; Energy UK: London, UK, 2018. [Google Scholar]
  71. Aoun, M.C.; Faure, A. Is Natural Gas Green Enough for the Environmental and Energy Policies? The French Institute for International Relations: Paris France; Clingendael International Energy Programme: The Hague, The Netherlands, 2015. [Google Scholar]
  72. Manisalidis, I.; Stavropoulou, E.; Stavropoulos, A.; Bezirtzoglou, E. Environmental and Health Impacts of Air Pollution: A. Review. Front. Public Health 2020, 8, 14. [Google Scholar] [CrossRef] [Green Version]
  73. Schleisner, L.; Nielsen, P.S. External Costs Related to Power Production Technologies; Riso National Laboratory: Roskilde, Denmark, 1997. [Google Scholar]
  74. Drax. Available online: https://www.drax.com/ (accessed on 19 February 2021).
  75. Abbasi, T.; Abbasi, S.A. Biomass energy and the environmental impacts associated with its production and utilization. Renew. Sustain. Energy Rev. 2010, 14, 919–937. [Google Scholar] [CrossRef]
  76. Dykes, K.; Platt, A.; Guo, Y.; Ning, A.; King, R.; Parsons, T. Effect of Tip-Speed Constraints on the Optimized Design of a Wind Turbine Effect; National Renewable Energy Laboratory: Golden, CO, USA, 2014.
  77. Leung, D.Y.C.; Yang, Y. Wind energy development and its environmental impact: A review. Renew. Sustain. Energy Rev. 2012, 16, 1031–1039. [Google Scholar] [CrossRef]
  78. Tsoutsos, T.; Frantzeskaki, N.; Gekas, V. Environmental impacts from the solar energy technologies. Energy Policy 2005, 33, 289–296. [Google Scholar] [CrossRef]
  79. Alsema, E.A.; de Wild-Scholten, M.J.; Fthenakis, V.M. Environmental Impacts of PV Electricity Generation—A Critical Comparison of Energy Supply Options. In Proceedings of the European Photovoltaic Solar Energy Conference, Dresden, Germany, 4–8 September 2006. [Google Scholar]
  80. Dones, R.; Bauer, C.; Bolliger, R.; Burger, B.; Heck, T.; Röder, A.; Emmenegger, M.F.; Frischknecht, R.; Jungbluth, N.; Tuchschmid, M. Life Cycle Inventories of Energy Systems: Results for Current Systems in Switzerland and Other UCTE Countries; Ecoinvent Centre: Duberndorf, Switzerland, 2007. [Google Scholar]
  81. Hadjimichael, O.; Ostfeld, A.; D’Atri, D.; Brubaker, R. Mortality and Cancer Incidence Experience of Employees in a Nuclear Fuels Fabrication Plant. J. Occup. Med. 1983, 25, 48–61. [Google Scholar] [CrossRef]
  82. Omar, R.Z.; Barber, J.A.; Smith, P.G. Cancer mortality and morbidity among plutonium workers at the Sellafield plant of British Nuclear Fuels. Br. J. Cancer 1999, 79, 1288–1301. [Google Scholar] [CrossRef]
  83. Jablon, S.; Hrubec, Z.; Boice, J.D. Cancer in Populations Living Near Nuclear Facilities; International Atomic Energy Agency Bulletin: Vienna, Austria, 1991. [Google Scholar]
  84. Baker, R.J.; Chesser, R.K. The Chernobyl Nuclear Disaster and Subsequent Creation of a Wildlife Preserve. Environ. Toxicol. Chem. 2000, 19, 1231–1232. [Google Scholar] [CrossRef]
  85. Beresford, N.A.; Copplestone, D. Effects of ionizing radiation on wildlife: What knowledge have we gained between the chernobyl and fukushima accidents? Integr. Environ. Assess. Manag. 2011, 7, 371–373. [Google Scholar] [CrossRef] [PubMed] [Green Version]
  86. International Energy Agency. Environmental and Health Impacts of Electricity Generation: A Comparison of the Environmental Impacts of Hydropower with those Generation Techonologies; International Energy Agency: Paris, France, 2002; p. 239. [Google Scholar]
  87. Mink, P.T. Nuclear Waste: The Most Compelling Environmental Issue Facing The World Today. Fordham Environ. Law Rev. 2011, 8, 165–170. [Google Scholar]
  88. Rosenberg, D.M.; Bodaly, R.A.; Usher, P.J. Environmental and social impacts of large scale hydroelectric development: Who is listening? Glob. Environ. Change 1995, 5, 127–148. [Google Scholar] [CrossRef]
  89. Zhong, Y.; Power, G. Environmental impacts of hydroelectric projects on fish resources in China. Regul. Rivers Res. Manag. 1996, 12, 81–98. [Google Scholar] [CrossRef]
  90. Fearnside, P.M. Environmental Impacts of Brazil’s Tucuruí Dam: Unlearned Lessons for Hydroelectric Development in Amazonia. Environ. Manag. 2001, 27, 377–396. [Google Scholar] [CrossRef]
  91. Rosenberg, D.M.; Berkes, F.; Bodaly, R.A.; Hecky, R.E.; Kelly, C.A.; Rudd, J.W.M. Large-scale impacts of hydroelectric development. Environ. Rev. 1997, 5, 27–54. [Google Scholar] [CrossRef]
  92. Union of Concerned Scientists. Environmental Impacts of Hydroelectric Power. 2013. Available online: https://www.ucsusa.org/resources/environmental-impacts-hydroelectric-power (accessed on 19 February 2021).
  93. Ammann, K. Why Today’s Swiss Waterways Are Fit for Swimming. 2017. Available online: https://www.swissinfo.ch/eng/wastewater_bathing-prohibited-in-switzerland-definitely-a-thing-of-the-past/43296836 (accessed on 19 February 2021).
  94. Andre, A.; Sundin, A.M.; Linderholm, L.; Borbas, I.; Svinhufvud, K.; Eklund, K.; Unger, M.L.; Rosenblom, T. Wastewater Treatment in Sweden 2016; Swedish Environmental Protection Agency: Stockholm, Sweden, 2016. [Google Scholar]
  95. Ericsson, B.; Hallmans, B. Trends in domestic wastewater treatment in Sweden. Desalination 1994, 98, 259–263. [Google Scholar] [CrossRef]
  96. Muñoz, I. Wastewater Life Cycle Inventory Initiative. WW LCI Version 3.0: Changes and Improvements to WW LCI v2; 2.-0 LCA Consultants: Aalborg, Denmark, 2019. [Google Scholar]
  97. Trading Economics. Switzerland Energy Imports, Net (% of Energy Use). 2016. Available online: https://tradingeconomics.com/switzerland/energy-imports-net-percent-of-energy-use-wb-data.html (accessed on 19 February 2021).
  98. Swedish Energy Agency. Energy in Sweden 2017; Swedish Energy Agency: Stockholm, Sweden, 2018. [Google Scholar]
  99. Tsoy, N. Upscaling methods used in ex ante life cycle assessment of emerging technologies: A review. Int. J. Life Cycle Assess. 2020, 25, 1680–1692. [Google Scholar] [CrossRef]
  100. Thonemann, N.; Schulte, A.; Maga, D. How to conduct prospective life cycle assessment for emerging technologies? A systematic review and methodological guidance. Sustainability 2020, 12, 1192. [Google Scholar] [CrossRef] [Green Version]
  101. Pavlenko, N.; Comer, B.; Zhou, Y.; Clark, N.; Rutherford, D. The Climate Implications of Using LNG as a Marine Fuel; Swedish Environmental Protection Agency: Stockholm, Sweden, 2020. [Google Scholar]
  102. Walker, T.R.; Adebambo, O.; Del Aguila Feijoo, M.C.; Elhaimer, E.; Hossain, T.; Edwards, S.J.; Morrison, C.E.; Romo, J.; Sharma, N.; Taylor, S.; et al. Environmental effects of marine transportation. In World Seas: An Environmental Evaluation Volume III: Ecological Issues and Environmental Impacts, 2nd ed.; Elsevier Ltd.: Amsterdam, The Netherlands, 2018; pp. 505–530. [Google Scholar]
  103. Rodrigue, J.-P.; Comtois, C.; Slack, B. The Geography of Transport Systems, 3rd ed.; Routledge: London, UK; New York, NY, USA, 2013. [Google Scholar]
  104. Krugman, P.R. Increasing returns, monopolistic competition, and international trade. J. Int. Econ. 1979, 9, 469–479. [Google Scholar] [CrossRef]
  105. Fridell, E.; Bäckström, S.; Stripple, H. Considering infrastructure when calculating emissions for freight transportation. Transp. Res. Part D Transp. Environ. 2019, 69, 346–363. [Google Scholar] [CrossRef]
  106. Berg, N. The Future of Freight: More Shipping, Less Emissions? GreenBiz. 2016. Available online: https://www.greenbiz.com/article/future-freight-more-shipping-less-emissions (accessed on 19 February 2021).
  107. Allen, J. DAF Trucks’ First Electric Lorry Delivered To Supermarket Chain. The Sunday Times. 2019. Available online: https://www.driving.co.uk/news/daf-electric-lorry-delivered/ (accessed on 19 February 2021).
  108. Bloomberg. Musk Unveils Tesla Semi and Reveals Surprise Cargo: The Revived Roadster. Industry Week, 7 November 2017. [Google Scholar]
  109. Clarke, S. Road Freight between Britain and EU Is Down by a third, Data Shows. The Guardian. 31 January 2021. Available online: https://www.theguardian.com/politics/2021/jan/31/road-freight-britain-eu-down-third-data-shows-brexit (accessed on 26 August 2021).
  110. Thomas, N. Offshore Wind Power Offers Hope in Cutting UK Emissions. Financial Times. 2019. Available online: https://www.ft.com/content/1cdeb0e8-61a1-11e9-b285-3acd5d43599e (accessed on 19 February 2021).
  111. Cooper, M. The implications of Fukushima: The US perspective. Bull. At. Sci. 2011, 67, 8–13. [Google Scholar] [CrossRef]
  112. Khalil, Y.F. Sustainability assessment of solvolysis using supercritical fluids for carbon fiber reinforced polymers waste management. Sustain. Prod. Consum. 2019, 17, 74–84. [Google Scholar] [CrossRef]
  113. Vo Dong, P.A.; Azzaro-Pantel, C.; Cadene, A.L. Economic and environmental assessment of recovery and disposal pathways for CFRP waste management. Resour. Conserv. Recycl. 2018, 133, 63–75. [Google Scholar] [CrossRef] [Green Version]
  114. Black, S. Composites Recycling Is Gaining Traction. Composites World. 2017. Available online: https://www.compositesworld.com/articles/composites-recycling-is-gaining-traction (accessed on 19 February 2021).
  115. Hann Chua, M.; Smyth, B.M.; Murphy, A.; Butterfield, J. Understanding aerospace composite components’ supply chain carbon emissions. In Proceedings of the Irish Manufacturing Conference, Belfast, Ireland, 3–4 September 2015. [Google Scholar]
Figure 1. Schematic showing the HiPerDiF technology highlighting the different stages of the process, taken from [45]. (a) Single unit working principle, (b) aligned discontinuous fibre preform, (c) ADFRC tape.
Sustainability 14 01922 g001
Figure 4. EI comparison between the appliances and water usage of HiPerDiF 2G (expressed relative to the highest value of the category).
Sustainability 14 01922 g004
Figure 5. Operational EI comparison of the scaled HiPerDiF 2G machine in different European country scenarios based on electrical energy demand and water use impacts. The addition of water usage impact is highlighted in a lighter shade.
Sustainability 14 01922 g005
Figure 6. CED assessment to remanufacture 1 kg of ADFP through HiPerDiF 2G in the various European scenarios (excluding water), presented as the actual impact from each energy source.
Sustainability 14 01922 g006
Figure 7. CED assessment to remanufacture 1 kg of ADFP through HiPerDiF 2G in the various European scenarios (excluding water), presented as the impact relative to the renewable/non-renewable groups’ highest value.
Sustainability 14 01922 g007
Figure 8. (A) shows the European composite recyclers (in purple) and manufacturers (in blue) selected for this study. (B) shows the sample of transportation routes from reclamation facility, CU Nord in Stade, to manufacturer, Carbon & Composites in Sweden—the red route by shipping and the blue route by road haulage. Taken from Google Maps.
Sustainability 14 01922 g008
Figure 9. IMPACT 2002+ analysis results (characterised and normalised) of three possible routes between ELG Ltd. and Hexcel GmbH.
Sustainability 14 01922 g009
Figure 10. Environmental impact comparison of operating the scaled HiPerDiF machine in different European countries, including transportation and water use impact.
Sustainability 14 01922 g010
Table 2. Measured power consumption of the HiPerDiF 2G alignment process and the relative energy demand per gramme of output.
ProcessAppliancePower
Consumption (W)
Energy Demand (Wh/g)
Suspension agitationHot plate stirrer (x2)568.2
Pump between tanksPeristaltic pump I13019.0
Pump to alignment platesPeristaltic pump II17325.3
Water recoveryVacuum suction928135.7
Fibre movementConveyor belt456.6
Fibre preform dryingInfrared heater11516.8
x is to indicate that two hot plate stirrers were used.
Table 3. Routes from reclamation centres to composite manufacturers in Europe via shipping, rail, road and ferry. Distances are measured in kilometres, taken from Google Maps and Searoutes.com.
To: HiPerDiF Remanufacturing Destination
Bristol, UKRousillon, FRStade, DEVarberg, SE
Scenario12 12 12312
From: Reclamation origin pointELG,
Birmingham UK
Lorry145 1162407 1065 1451608315
Ferry 45 67 67
Rail 150 1327
Shipping 1876 1565 1135
CED (GJ)0.3170.122 2.551.22 2.271.080.5933.530.889
CFK
Valley, Stade DE
Scenario1231231 123
Lorry1032 1190 260 689391
Ferry67 128
Rail 1294 1792
Shipping 1565 4365 546
CED (GJ)2.271.060.2762.61.461.340 1.510.8550.0962
With the lowest CED highlighted in green for each of the destinations.
Publisher’s Note: MDPI stays neutral with regard to jurisdictional claims in published maps and institutional affiliations.

