Article

Co-Selection of Heavy Metal and Antibiotic Resistance in Soil Bacteria from Agricultural Soils in New Zealand

1
School of Health Sciences, Massey University, Wellington 6021, New Zealand
2
Scion, Tītokorangi Drive, Rotorua 3010, New Zealand
3
Civil Engineering and Ryan Institute, National University of Ireland, H91 TK33 Galway, Ireland
4
Waikato Regional Council, Hamilton 3240, New Zealand
*
Author to whom correspondence should be addressed.
Sustainability 2022, 14(3), 1790; https://doi.org/10.3390/su14031790
Submission received: 14 December 2021 / Revised: 24 January 2022 / Accepted: 2 February 2022 / Published: 4 February 2022

Abstract

:
Accumulation of trace elements (including heavy metals) in soil from usage of superphosphate fertilisers induces resistance of soil bacteria to trace elements of environmental concern (TEoEC) and may co-select for resistance to antibiotics (Ab). This study aimed to investigate selection of co-resistance of soil bacteria to Cd, Zn and Hg, and Ab in soils with varied management histories. Genetic diversity of these bacteria and horizontal transfer of Cd resistance genes (cadA and czcA) were also investigated. Soils with either pastoral and arable management histories and either high levels of Cd and Zn, or indigenous bush with background levels of these TEoEC from the Waikato region, New Zealand were sampled. Plate culturing with a range of TEoEC and Ab concentrations, Pollution Induced Community Tolerance (PICT) assay, antibiotic sensitivity, terminal restriction fragment length polymorphism (TRFLP) and horizontal gene transfer (HGT) analyses were employed to investigate co-selection of TEoEC and Ab resistance. Higher levels of bacterial resistance to TEoEC and Ab correlated with higher levels of TEoEC in soil. Bacterial community structures were altered in soils with high TEoEC levels. Cd resistance genes were transferred from donor bacterial isolates, to recipients and the transconjugants also had resistance to Zn and/or Hg and a range of Ab.

1. Introduction

Most trace elements have a fundamental role in the life processes of microorganisms and higher organisms and act as essential elements in the environment. Trace elements (TEs) of environmental concern (TEoEC) including cadmium (Cd), zinc (Zn) and mercury (Hg) can be added to the environment by a variety of different human-related activities or natural processes [1]. Some TEs, such as Cd, Hg, silver (Ag), and lead (Pb), have no known beneficial role, and their cations (e.g., Cd2+ and Hg2+) can form potentially harmful complexes [2]. Some other metals, e.g., cobalt (Co), Zn and copper (Cu), are micronutrients and considered necessary elements for cellular metabolism and other processes in life. These can also be harmful at high concentrations [3]. For example, Zn is involved in stabilizing many enzymes as well as RNA and DNA via electrostatic forces [4]; however, in high concentrations these ions can have toxic effects, by producing complex compounds in cells. The presence of high concentrations of non-essential metals in cells can be detrimental to cell functioning, as the non-essential metals may have a higher binding affinity to thiol groups or oxidised organic products and displace essential metals [5].
Contamination of soil, by TEoECs is an important issue due to potential impacts on ecosystem functions [6]. Sources include the discharge of agricultural chemicals, fertilisers, animal manure and other wastes applied to land with subsequent transfer to aquatic environments [5]. Accumulation of such contaminants including Cu, Hg, Pb, Zn and Cd in the soil environment potentially endangers human and animal health and may trigger resistance to Ab [7]. Studies have linked exposure to heavy metals (HM) to Ab resistance through mechanisms of co-resistance (different resistance determinants on shared gene elements), cross-resistance (genes encoding resistance to both TEoEC and Ab) and shared regulatory responses to TEoEC and Ab exposure, like biofilm induction [8]. Accumulation of TEoECs in soil is considered an emerging issue endangering human and animal health [9,10].
Bioavailability and toxicity of trace elements in the environment are influenced by soil composition—particularly the content and nature of organic matter, hydrated metal oxides, and clay minerals—and environmental conditions, including pH and redox potential. For cationic metals, lower pH is associated with increased mobility, and low oxygen (reducing conditions) can result in an increase in metal release through partial dissolution of amorphous metal oxides [3].
Recent studies have shown that TEoEC resistance and Ab resistance can be selected simultaneously by microorganisms in TEoEC-contaminated ecosystems [11] and those with other contaminants [12]. This underlines the importance of preventing the accumulation of TEoEC in the environment. The co-selection of TEoEC and Ab resistance is a potentially serious health concern in terms of both human and animal health. This could also cause economic burdens on the livestock industry [13,14].
New Zealand’s agricultural soils are subject to a range of contaminant inputs, of which inorganic contaminants in phosphate fertilisers and animal remedies are of special interest due to their capacity to accumulate over time [15]. The application of superphosphate fertiliser leads to elevated levels of some HMs in agricultural soils, especially Cd [7,16,17]. The use of animal remedies and pesticides containing Zn has resulted in raised levels of Zn in these soils to 60 mg kg−1 [18,19].
Cd concentrations in soils of dairy farms in the Waikato region of New Zealand are on average five times higher than their natural background levels after seven decades of accumulation from phosphate fertilisers [16,20]. The national average concentration of Cd in soil in New Zealand is about 0.35 mg kg−1. This concentration of Cd differs with land use, with 0.43 mg kg−1 for pastoral soils, 0.24 mg kg−1 for arable soils, and 0.16 mg kg−1 for indigenous forest (background) soils; the latter do not receive fertiliser application [21]. Average Zn concentrations have doubled in pastoral and arable soils during the last two-three decades through the widespread use of Zn in agricultural chemicals (e.g., as a preventative for the fungal disease facial eczema in sheep and cattle) [19]. Average figures also obscure the heterogeneity in soils and the fact that some areas have accumulated more Cd or Zn than others. The average concentration of Zn in Waikato soils was 60 mg kg−1, but 11% of farms in this region had Zn concentrations exceeding 100 mg kg−1. This concentration (100 mg kg−1), and 1 mg kg−1 for Cd, have been suggested as guideline thresholds for protection of soil microbial processes [22] and potential to impact on dietary levels [23], respectively. Hg levels in Waikato soils are very low (>0.2 mg/Kg) and primarily from natural sources like volcanism. The high levels of Cd and Zn in Waikato soils may lead to resistance to TEoEC and subsequent co-selection for Ab resistance in these soils’ bacteria [24,25].
Horizontal Gene Transfer (HGT) plays an important role in the evolutionary changes of resistance to antimicrobials and TEoEC. The most common mechanisms of HGT in prokaryotes are conjugation, transformation, transposition and transduction [26].
The co-occurrence of resistance to these elements and Ab in soils from TEoEC contaminated areas is poorly understood. In this study, our primary hypothesis was that selection for both Cd, Zn and Hg, and Ab resistance would occur in soils contaminated with TEoECs. This also allowed us to test the secondary hypothesis that the levels of resistance (as measured by minimum inhibitory concentrations [MICs] and EC50 levels for TEoECs and Abs) might be higher on average in isolates from sites with contaminated soils, compared to isolates from background uncontaminated soil. A third hypothesis was that some bacterial taxonomic groups would be better able to adapt to a soil environment contaminated with TEoECs and this would result in differences in bacterial operational taxonomic unit profiles between sites with significantly different levels of TEoEC contamination. Our fourth hypothesis was that at least some TEoECR and/or AbR would be due to pre-existing resistance genetic elements, amplified and/or mobilized within the microbial biosphere, not just due to de novo mutations conferring resistance.
We aimed to gain a further understanding of TEoEC resistance (TEoECR) and antibiotic resistance (AbR) co-selection by comparing ratios of TEoECR and AbR bacteria to total colony forming units (cfu) in samples from sites with pastoral and arable farming land use histories with elevated soil TEoEC levels. Levels of resistance for both selected individual isolates and consortia from each site were determined. We examined potential differences in bacterial community structure using Terminal Restriction Fragment Length Polymorphism (TRFLP) assay [27], and a sample of isolates were identified using 16S rDNA sequencing. We investigated if resistance genes were mobilized to new bacterial hosts via conjugation assays of HGT of Cd resistance genes. The identity of the bacteria carrying mobilizable Cd resistant genes was determined by 16S rDNA sequencing.

2. Materials and Methods

2.1. Soil Samples

Three sets of soil samples, with each set including samples originating from pastoral, arable and indigenous forest (background, control) sites were collected from the Waikato region of New Zealand based on standard soil sampling protocols [28]. Samples were collected from the upper soil horizon at 0–10 cm depth and aggregated to provide sufficient mass for sample analysis. Sampling was performed from February 2014 to June 2015. A total of five different rural properties were sampled (Table 1), drawn from sites that make up the Waikato Regional Council’s Regional Soil Quality Monitoring Programme [29]. The sampling sites from agricultural properties were chosen from those with regular inputs of Cd and Zn due to usage of fertilisers and animal remedies. Input rates of Cd from fertilisers in Waikato for the approximate period 1945–2005 (six decades), based on loading estimates and observed soil values have been estimated as 0.006–0.007 mg kg−1yr−1[30]. The annual amount of phosphorus applied to New Zealand soil as fertiliser peaked at 219,000 tonnes in 2005, but has reduced to an annual application of ~150,000 tonnes per year over the subsequent decade (155,000 tonnes in 2015) [31].
The soil for all samples was Patumahoe Clay Loam, classified as a typic Orthic Granular Soil in the New Zealand soil classification [32], and as a Ferralsol in the World Reference Base for Soil Resources [33]. Pastoral soil samples were collected from sheep and cattle farming sites EW-69 and EW-135. The arable cropping soil samples (sites EW-85 and EW-86) were from sites used in vegetable, potato and onion cropping for about 100 years. Both arable cropping and pastoral sites have received regular inputs of products containing TEoEC, (e.g., superphosphate fertilisers). Background samples were collected from site EW-73, a reserve covered in indigenous forest for >100 years, that has not received any inputs of products containing TEoEC. Physicochemical properties of soil samples were assessed by the methodology described in Table S1 (Supplementary Material).

2.2. Plate Culture

Soil samples were sieved (aperture = 5 mm) to remove large debris [34] and dry weight determined [35]. Soil samples (10 g, dry weight) were added to a 200 mL bottle containing sterile 1X phosphate buffered saline (PBS) (pH = 7.0), and shaken at 200 rpm at 4 °C for 1 h. Serial dilutions were prepared with 1X PBS diluent in sterile 50 mL glass bottles washed with 50% nitric acid, and aliquots were plated on R2A agar and incubated for up to 14 days at 25 °C [36]. Cycloheximide was dissolved in DMSO and filter sterilized, then added to the media (final concentration of 100 µg mL−1) to prevent the growth of fungi and yeasts [36].
Cd, Zn and Hg and Ab (tetracycline (Tc), chloramphenicol (Cm), erythromycin (Ery), carbenicillin (Cb), and ampicillin (Amp) were added to R2A Agar plates using stock solutions of TEoEC (Ab addition at ~37 °C). The Ab were selected from different Ab classes. Final TEoEC ion concentrations were 0.1, 0.01 and 0.001 mM for CdCl2 and HgCl2, and 1, 0.1 and 0.01 mM for ZnSO4. Final concentrations of 20, 100 and 200 μg mL−1 of each Ab (dissolved in DMSO and sterilised by 0.45 µm syringe filter) were used as media additives. These concentrations bracketed the average soil concentrations of the TEoEC over three orders of magnitude, and ranged an order of magnitude above the threshold for AbR in soil bacteria is defined as growth at 20 μg mL−1 by the EUCAST ECOFF classification [37].

2.3. Minimum Inhibitory Concentration (MIC) and EC50 Determination

MICs were determined by broth microdilution analysis for Cd, Zn and Hg and the five Ab with n = 900 selected bacterial isolates from each soil set (total n = 3600). These isolates were selected based on various colony morphologies on the plates containing Cd (1 mM), Zn (5 mM) or Hg (0.1 mM). Bacterial isolates (n = 150) from each soil set were selected as sensitive controls of the MIC determination analysis for the TEoEC and Ab. A 99 µL aliquot of liquid culture adjusted to cell density of 5 × 10⁵ mL−1 was dispensed to each well of 96-well polystyrene microtiter plates [38]. Cell density adjustment is discussed in Section S3. A 1 µL aliquot of TEoEC or Ab stock was added to the wells in triplicates. Preparation of TEoEC and Ab stock solutions is described in Section S4. An aliquot of 1 µL DMSO/99 µL fresh broth media, positive (growth without any antimicrobial additives) and negative (sterile; fresh media without bacterial cells) controls were included in triplicates. Staphylococcus aureus NCTS 12973, a standard Ab sensitive control strain was added to each batch. Cultures were incubated in a shaking incubator at 25 °C and 200 rpm for 72 h [39] and read at time 0 and 6-h intervals at 600 nm wavelength [40]. Bacterial resistance was quantified as MIC, based on data at the exponential growth phase, and was analysed according to the EUCAST ECOFF (epidemiological cut-off) recommendations. Antibiotic resistance in soil bacteria is defined as growth at 20 μg mL−1 as per the EUCAST ECOFF classification [37]. EC50 values were calculated for each batch of results using Prism–GraphPad 6 software and the Log (inhibitor) vs. response, variable slope (four parameters) method. Growth monitoring by plate culturing and measurements of the metals’ bioavailability was carried out after 72 h incubation (Sections S5 and S6).

2.4. Pollution Induced Community Tolerance (PICT) Analysis

The tolerance of the bacterial consortia (cultures containing a diverse range of species) derived from soil samples to a range of antimicrobial agents at various concentrations was determined by a 96-well microtitre plate culture method called PICT [41]. A 100 µL aliquot of culture dilution with ~5 × 10⁵ mL−1 bacterial cells was added to each well of microtitre plates containing 99 µL of 2× R2A broth [38] (Section S3). A 1 µL aliquot of TEoEC or Ab was added to the allocated wells in triplicate, as were negative and positive controls (Section S4). The exponential growth rate of bacteria at 12-h incubation was recorded and used to calculate MICs. Growth monitoring (Section S5) and TEoEC bioavailability (Section S6) assessments were performed after 72 h incubation at 25 °C and 200 rpm.

2.5. Terminal Restriction Fragment Length Polymorphism (TRFLP)

Genomic DNA from the soil samples was extracted using Mo Bio PowerSoil® DNA Isolation Kits (Qiagen, Auckland) and subjected to TRFLP analysis to examine bacterial community diversity and structure. The 63F forward primer (5′-CAG GCC TAA CAC ATG CAA GTC-3′) 5′-labelled with 6-FAM [42] and the 1087R reverse primer (5′-CTC GTT GCG GGA CTT AAC CC-3′) 5′-labelled with VIC® [43] were used to amplify 16S rDNA. PCR conditions used are shown in Table S2. PCR amplimers were digested as previously described [44]. Restriction fragment lengths were measured by detection of terminal fluorescent labelled fragments analysed by ABI3730 Capillary Genetic Analyser [45]. TRFLP data analysis was performed with GeneMapper® v.4.1 for peak analysis and PRIMER v.7 software for analysis of relative abundance of terminal fragments as a proportion of a total peak height in that profile [46].

2.6. Genetic Mobility of Cd Resistance by Horizontal Gene Transfer

Two of the most common genes encoding Cd resistance in bacterial isolates, cadA and czcA, were amplified as previously described [47] using the PCR conditions listed in Table S3. A total number of 135 Cd resistant bacterial isolates (15 per soil sample) were tested for cadA and czcA. Total bacterial genomic DNA was extracted by the boiling-cooling method [48]. An overnight broth culture of a streptomycin resistant (SmR) and Cd sensitive Pseudomonas aeruginosa ICMP 6286 (International Collection of Microorganisms from Plants (ICMP), Landcare Research, New Zealand) (denoted MUW001) was used as a recipient strain [49]. Incubation was performed at 37 °C for 18 h followed by 6 h of incubation at 48 °C [50]. A lawn culture of recipient cells on well-dried BH agar (containing 2% agar, 100 µg mL−1 of Sm sulphate, and 1 mM CdCl2) [51] was printed with donor cells using sterile velvet cloth in a replica plate mating and incubated for 24 h at 37 °C. The sensitivity of the donor bacterial strains to the concentration of 100 μg mL−1 of Sm was determined prior to mating. The presence of the horizontally transferred czcA and cadA genes in transconjugant strains was investigated with the PCR reactions described above. Transconjugants were tested for resistance to TEoEC by culturing on nutrient agar plates containing 1 mM of Cd, 5 mM of Zn or 0.1 mM of Hg, and to Ab by broth microdilution assay using Tc, Cm, Ery, Cb and Amp. The isolates carrying the mobilizable cadA and czcA genes were identified by 16S rDNA sequencing using unlabeled 63F and 1087R primers, and the data were compared to the NCBI nucleotide database using blastn.

2.7. Statistical Analysis

Three-way ANOVA analysis of the bacterial counts from each soil and comparison of mean values using Bonferroni correction for multiple comparisons was performed. Soils set, land use, and TEoEC concentration were independent variables. Monthly mean temperature and rainfall during the sampling months, moisture content, pH, total C and N content, and Olsen P values were covariates.
Four-way ANOVA analysis was conducted for resistant bacterial counts of the soil samples on plates with TEoEC and Ab additives. Soil sets, soils history of usage, initial TEoEC concentrations of soils, and TEoEC or Ab concentrations in media were independent variables. The dependent variable was bacterial CFU. Monthly mean temperature and rainfall during the sampling months, soils moisture content, pH of soils, total C and N content of soils, and Olsen P values were co-variates.
Three-way ANOVA analysis was conducted for PICT and broth microdilution analysis of bacteria from the soil samples. Soil samples, history of soils usage, and concentrations of TEoEC and Ab in microtitre plates were independent variables. The dependent variable was MIC or EC50 value.
Three-way ANOVA was carried out for TRFLP analysis to compare the abundance of the T-RFs between samples. Soil samples, history of soils usage, and soils TEoEC concentrations were independent variables. The dependent variable was the number of T-RFs reads.

3. Results

3.1. Physicochemical Properties of Soil

The soil samples collected for this project were analysed for inorganic and organic analytes and other physicochemical features (Table 2). Cd and Zn concentrations were significantly higher in pastoral soils (sites EW-69 and EW-135) compared to arable (sites EW-85 and EW-86) and indigenous forest (background) soil (site EW-73) (p < 0.05). Other physicochemical features of the soil sampling sites from which these three soil sample sets were collected are listed in Table S4.

3.2. Bacteriological Characterisation of Soil Samples

Plate counts on R2A medium revealed that total CFU/g in pastoral and arable cropping soils were higher compared to the background site (p < 0.05) for each sample set (WRSS1, the first sampling date in February 2014; WRSS2, the second sampling date in August 2014; WRSS3, the third sampling date in June 2015) (WRSS1, Figure 1). There were no significant differences in total CFU in pasture, arable and background soils between sampling dates. (Figure S1).
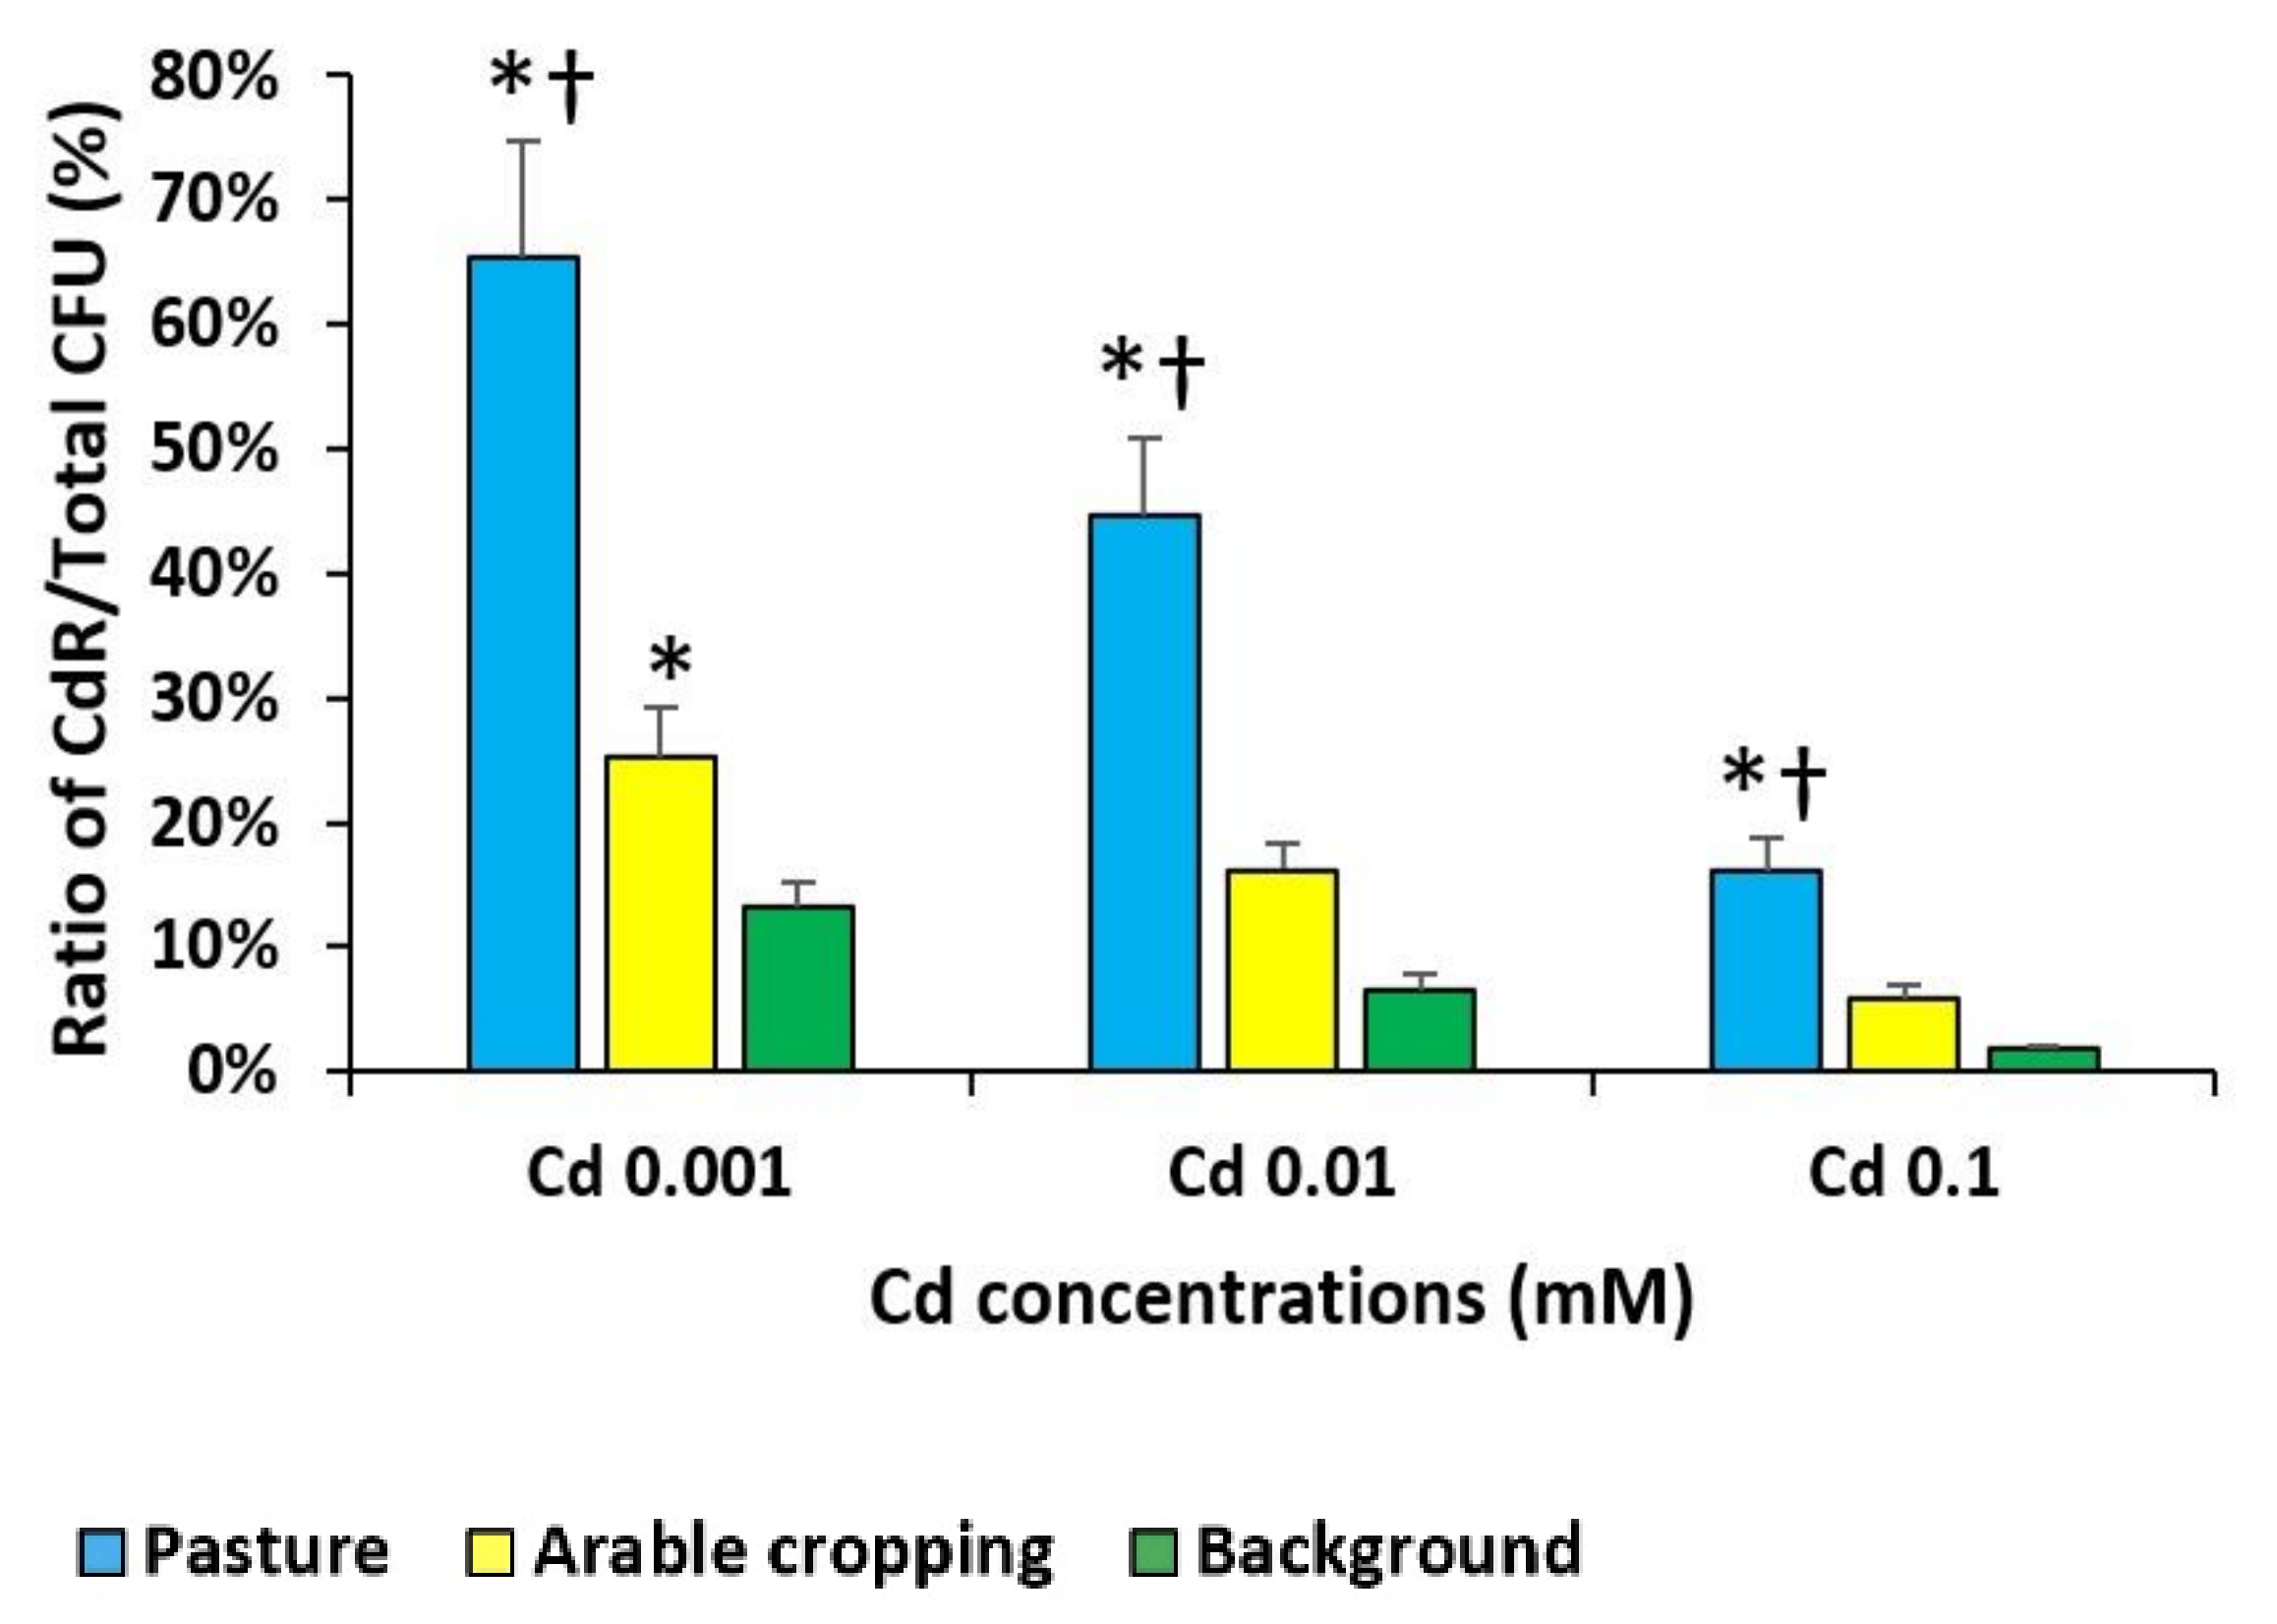
Plate culture of soil samples on R2A agar supplemented with three concentrations of Cd (Figure 2), Zn and Hg (Figure S2) showed that the ratios of TEoECR isolates/total CFU were higher for pastoral soil bacteria compared to those from background soil (p < 0.05). Ratios of TEoECR bacteria increased with decreasing TEoEC concentration. In terms of land use types, the highest ratios (most relative resistance) were found for pastoral soils, followed by arable soils, and then background. Similar results were determined for WRSS2 and WRSS3 (Figure S3). There were no significant differences between the ratios of TEoECR/total bacterial CFU between WRSS1, WRSS2 and WRSS3 collected on different dates. Overall, pastoral sites, with higher soil TEoEC levels, had higher ratios compared to arable and background sites on each sampling date.
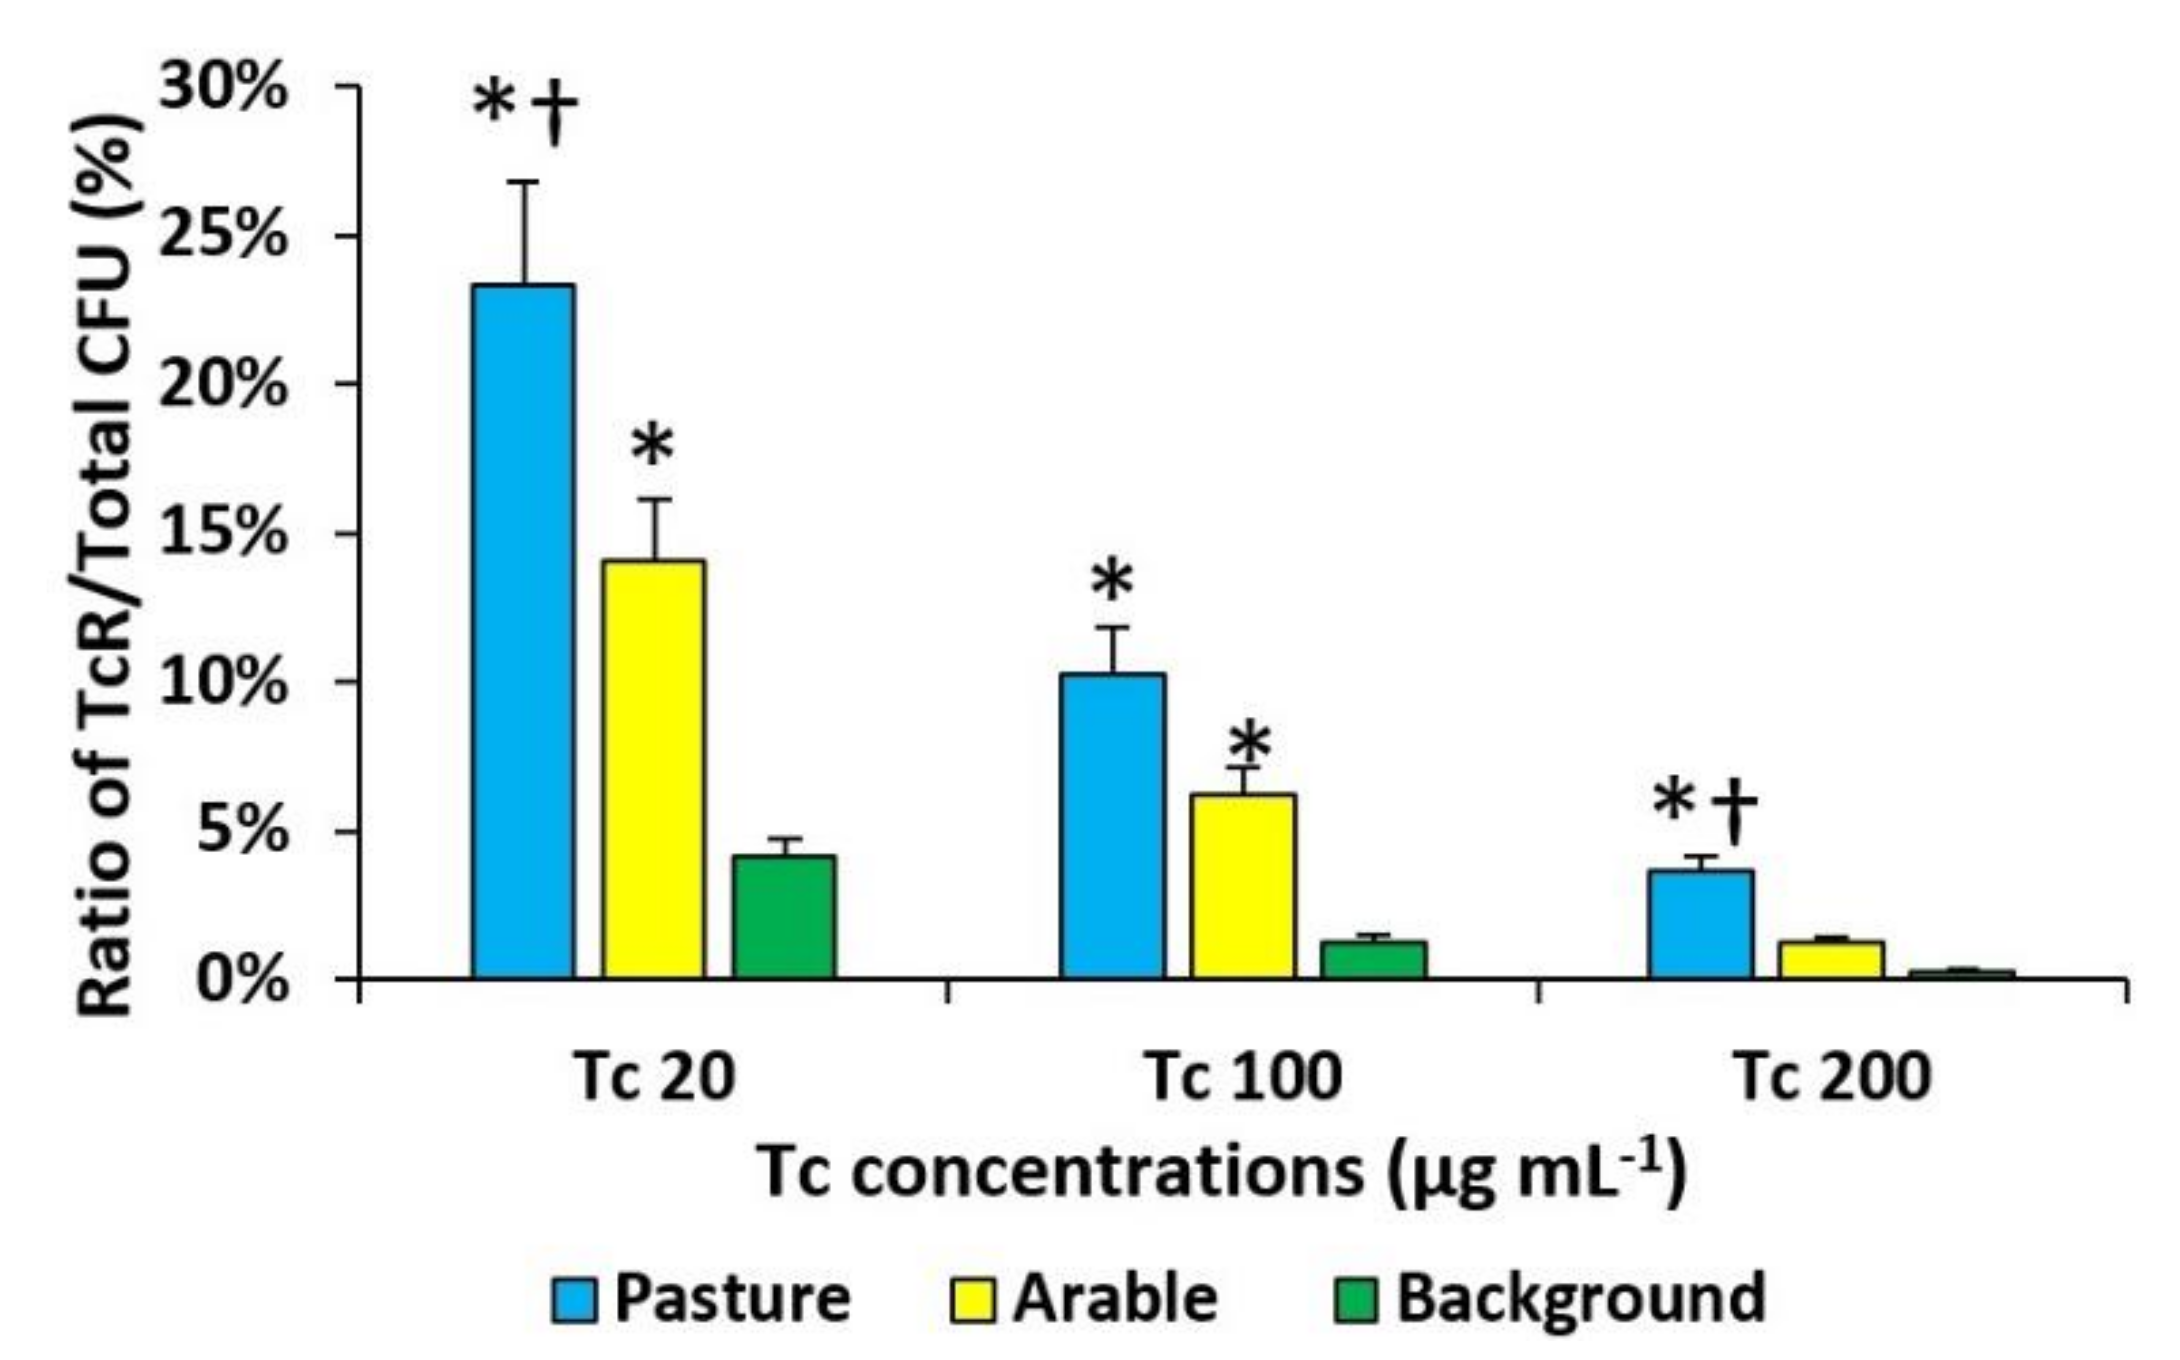
Determination of AbR CFUs with plate counts from the soil samples allowed the calculation of ratios of AbR/total bacterial CFU of the WRSS1 pasture, arable and background (EW-73) soil samples when exposed to five common antibiotics (Tc (Figure 3), Cm, Ery, Cb and Amp (Figure S4). Pastoral and arable soils had significantly higher ratios of AbR/total bacterial CFU compared to background, and the pastoral soil had higher AbR/total bacterial CFU ratios compared to arable soil (Figure 3). Similar results were determined for WRSS2 and WRSS3 (Figure S5).

3.3. Pollution Induced Community Tolerance (PICT) Assay

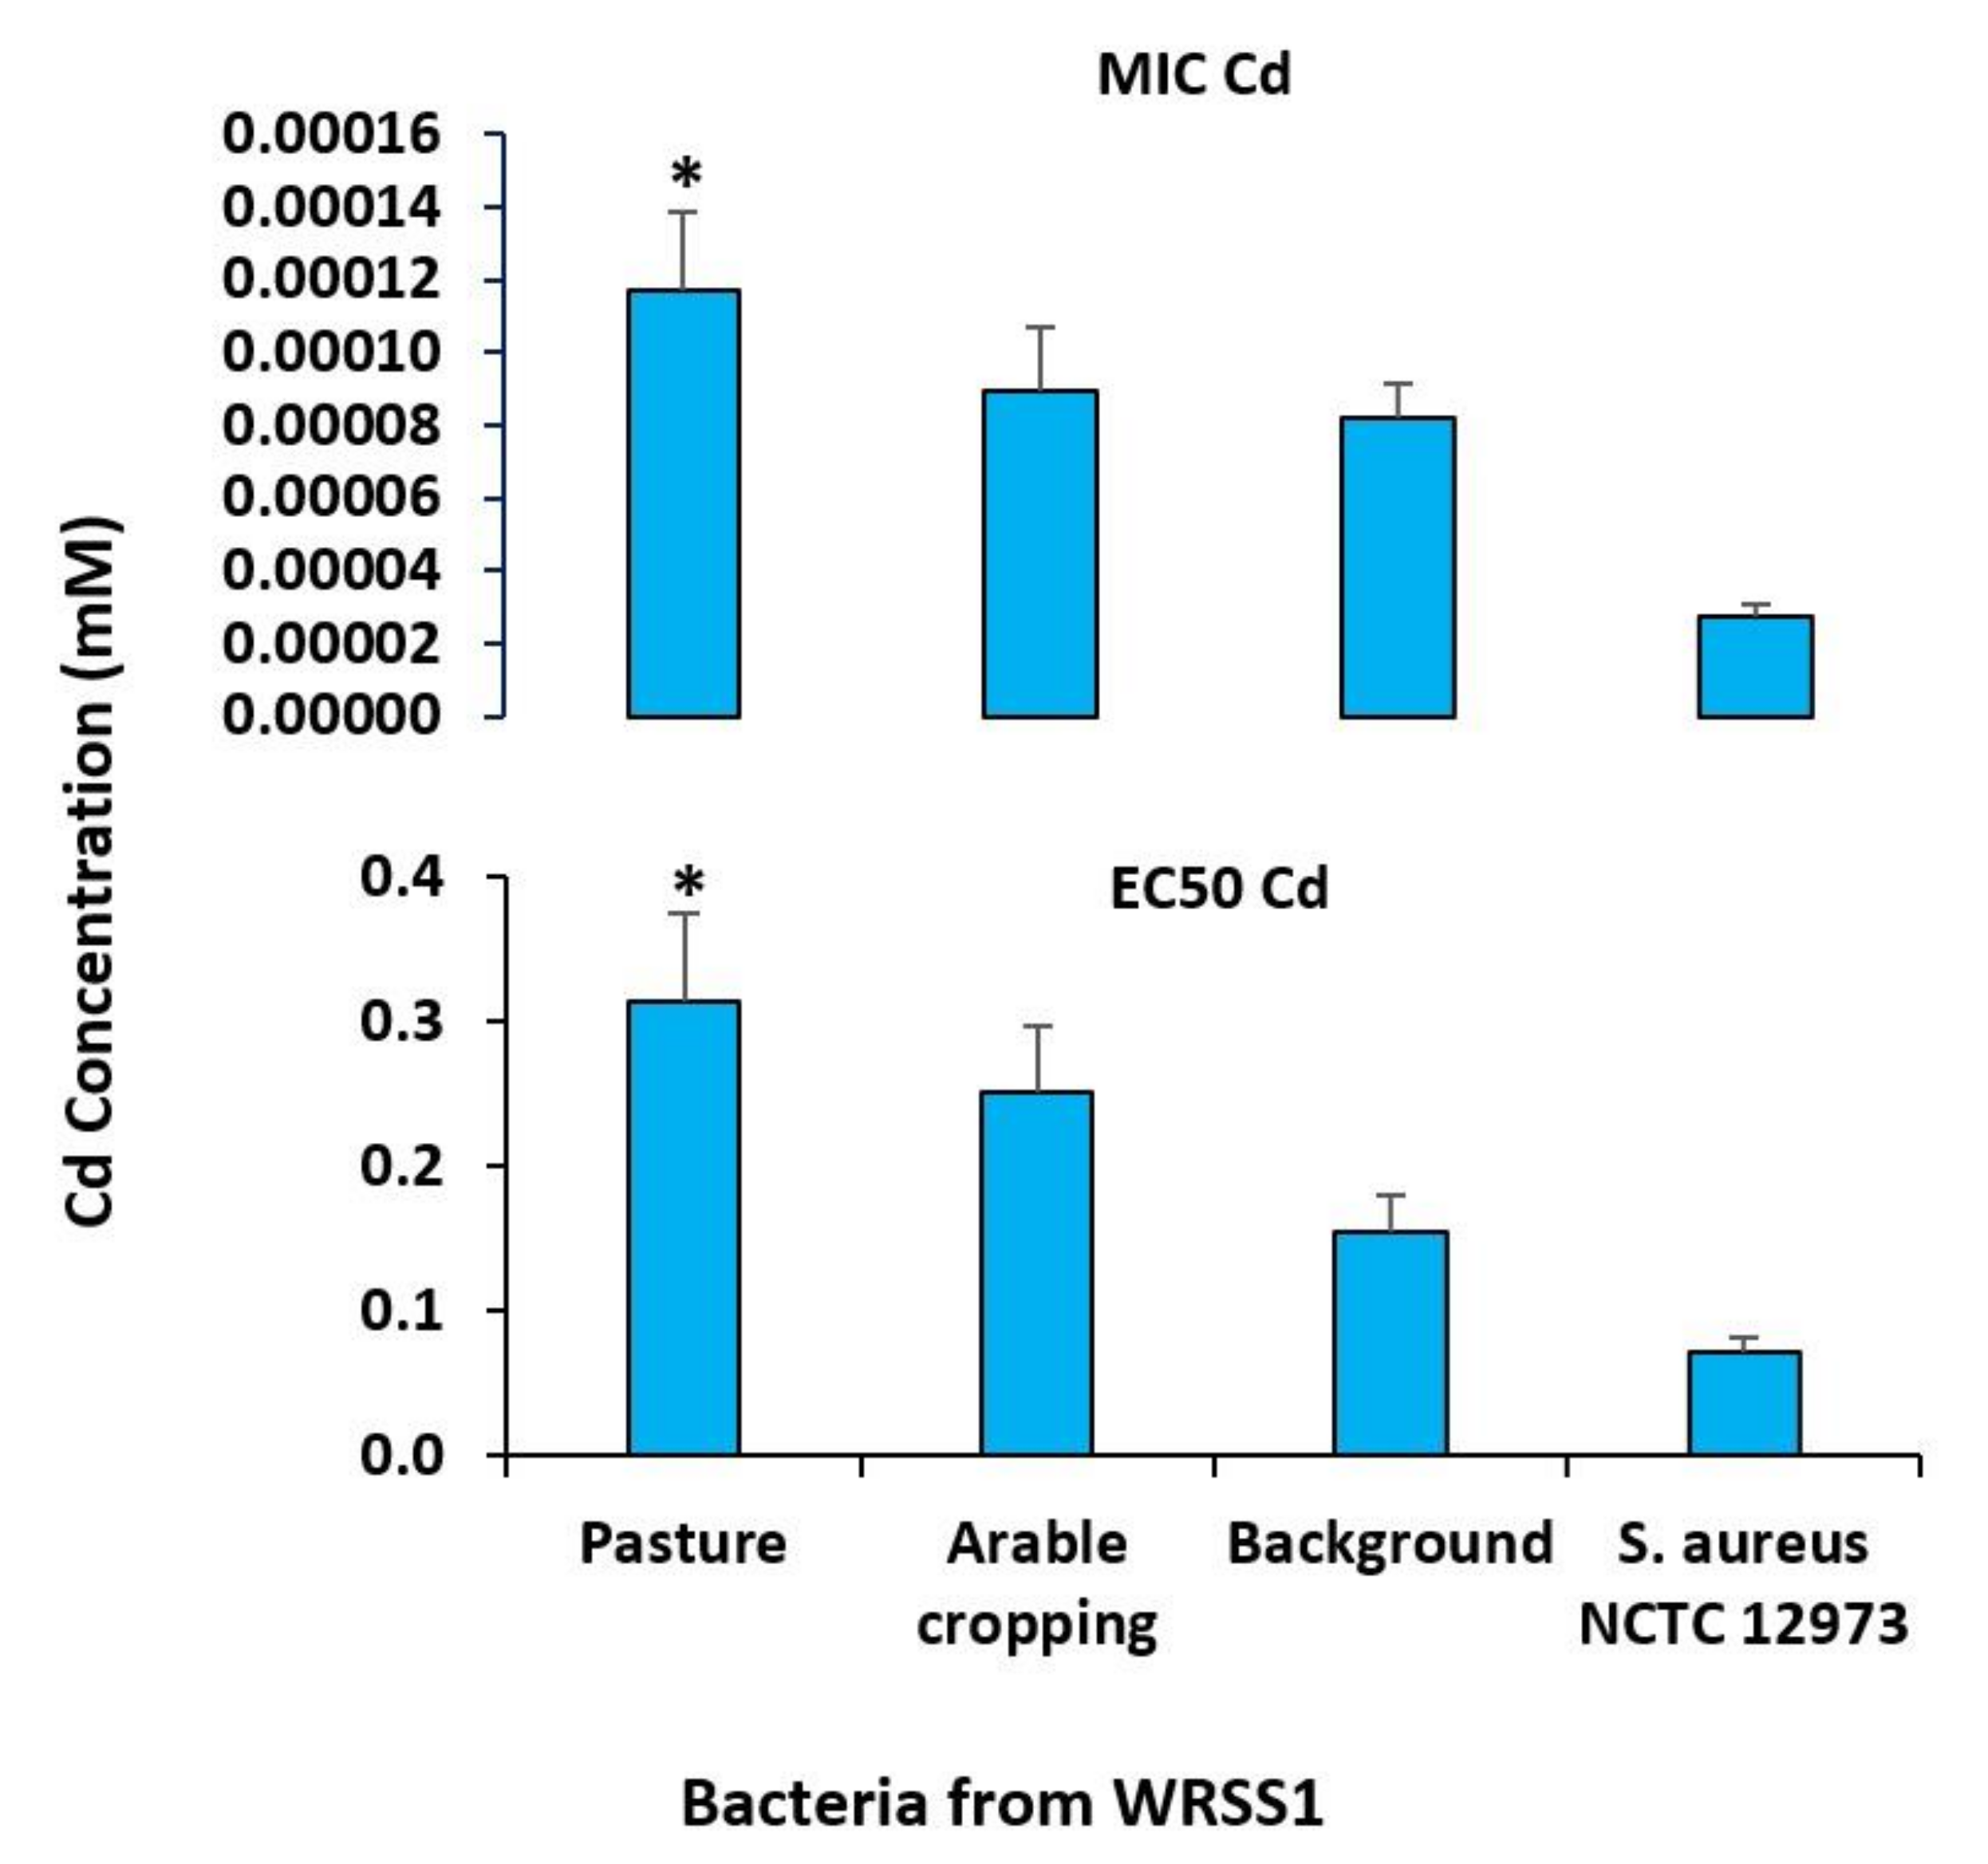
Samples of bacterial consortia isolated from the soil sample sets were subjected to PICT analysis for Cd (Figure 4), Zn and Hg (Figure S6) for WRSS1 and indicated MIC and EC50 values were significantly greater for TEoEC for consortia from pastoral soil compared to those from background soil.
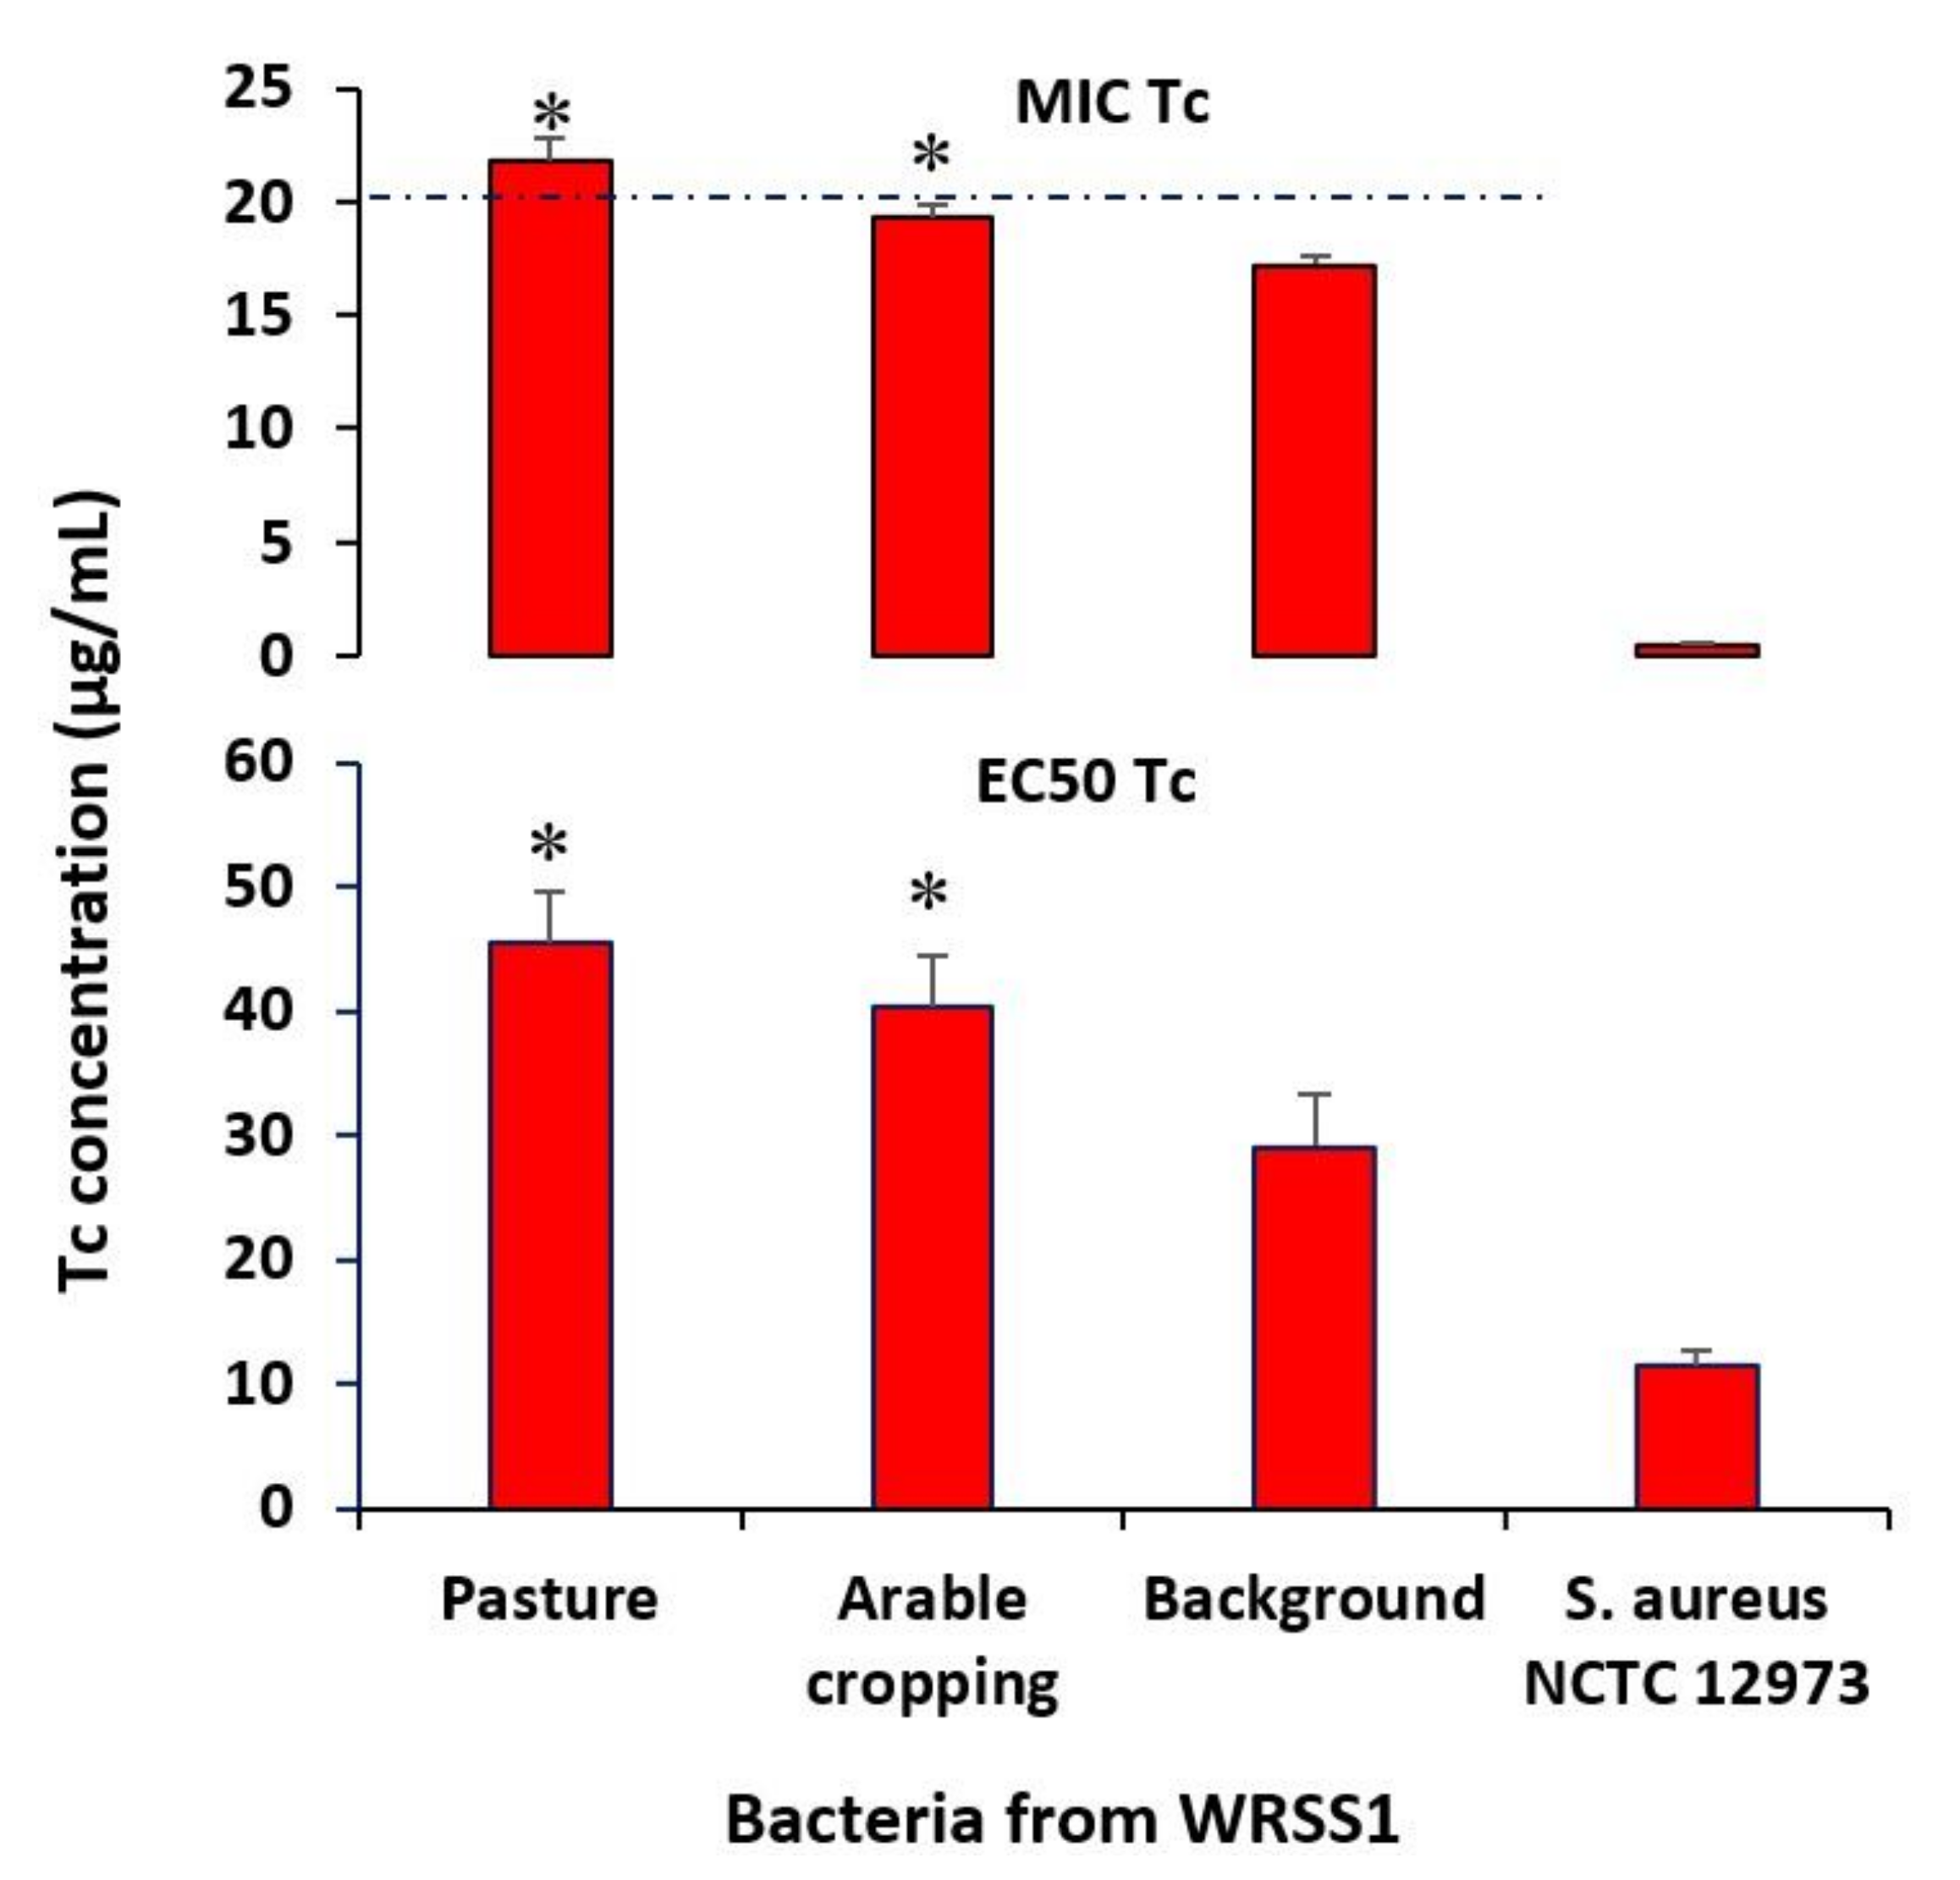
In addition, PICT analysis of MICs of bacterial consortia isolated from WRSS1 for Tc (Figure 5), Cm, Ery, Cb and Amp (Figure S7) revealed larger MIC and EC50 values for antibiotics for bacterial consortia from pastoral and arable soils, compared to those from background soil. Very similar results were obtained for consortia from the WRSS2 and WRSS3 soil sample sets (Figures S8-S11).

3.4. Characterisation of Resistant Isolates

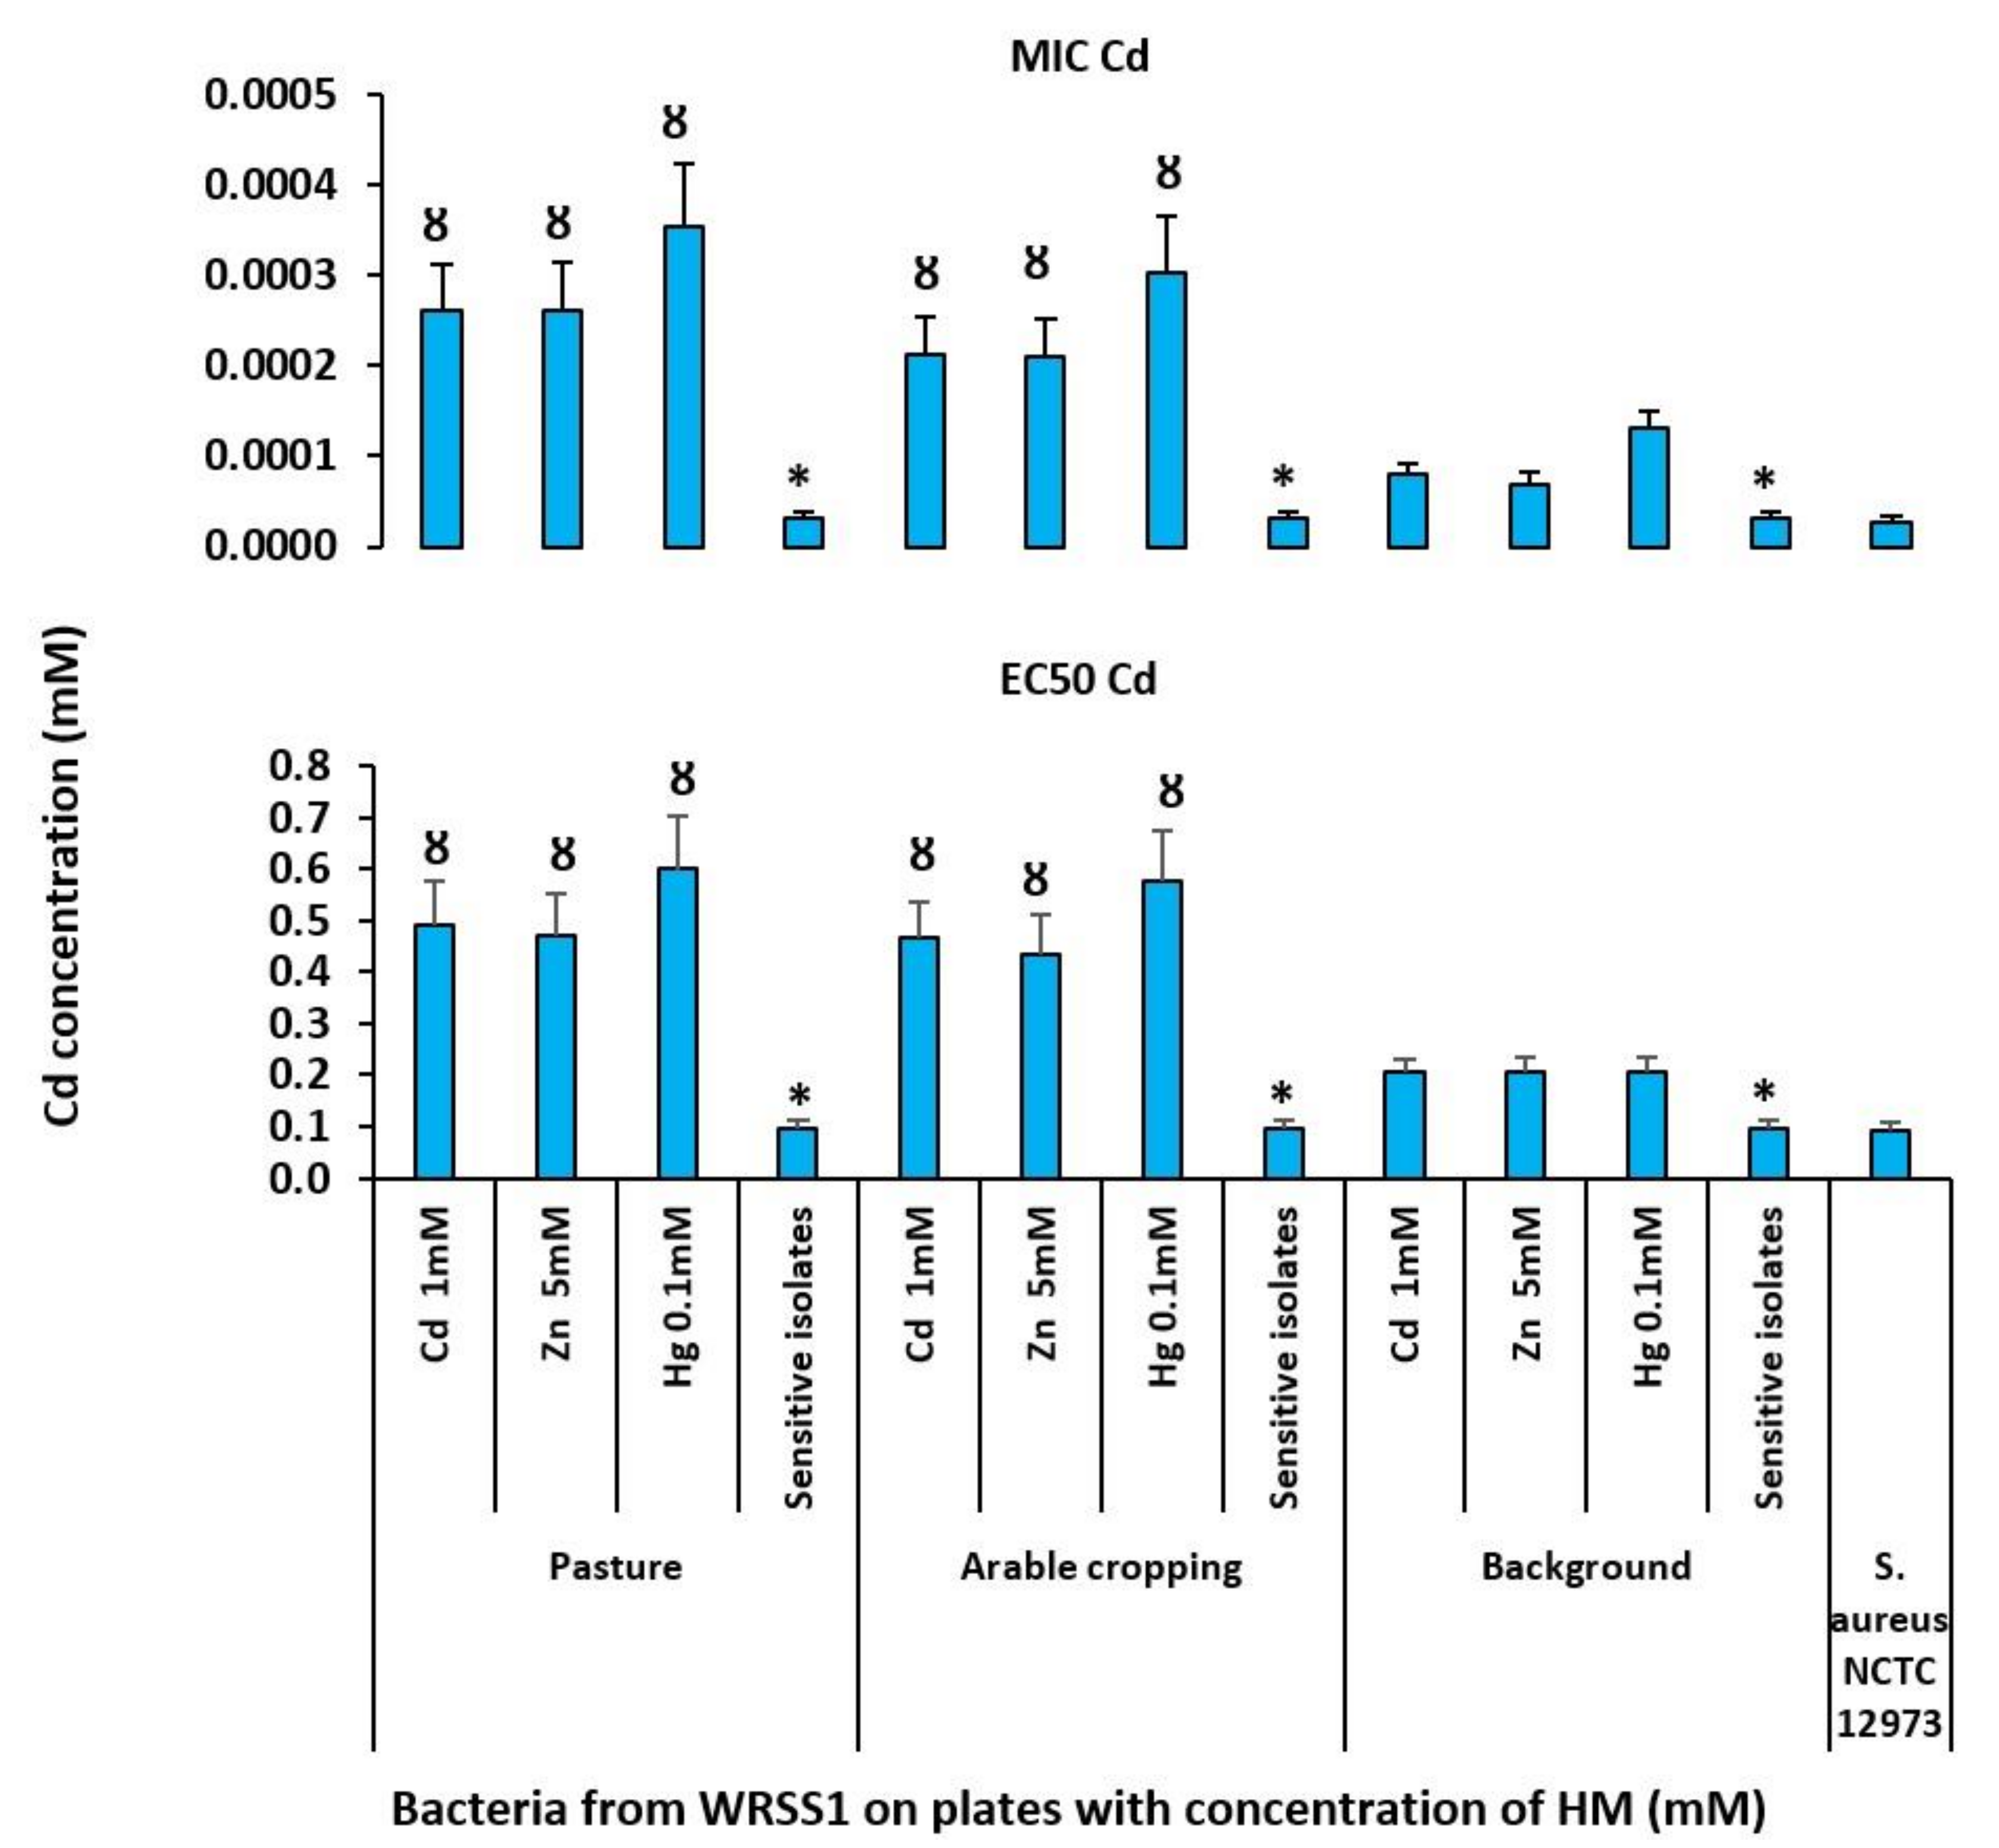
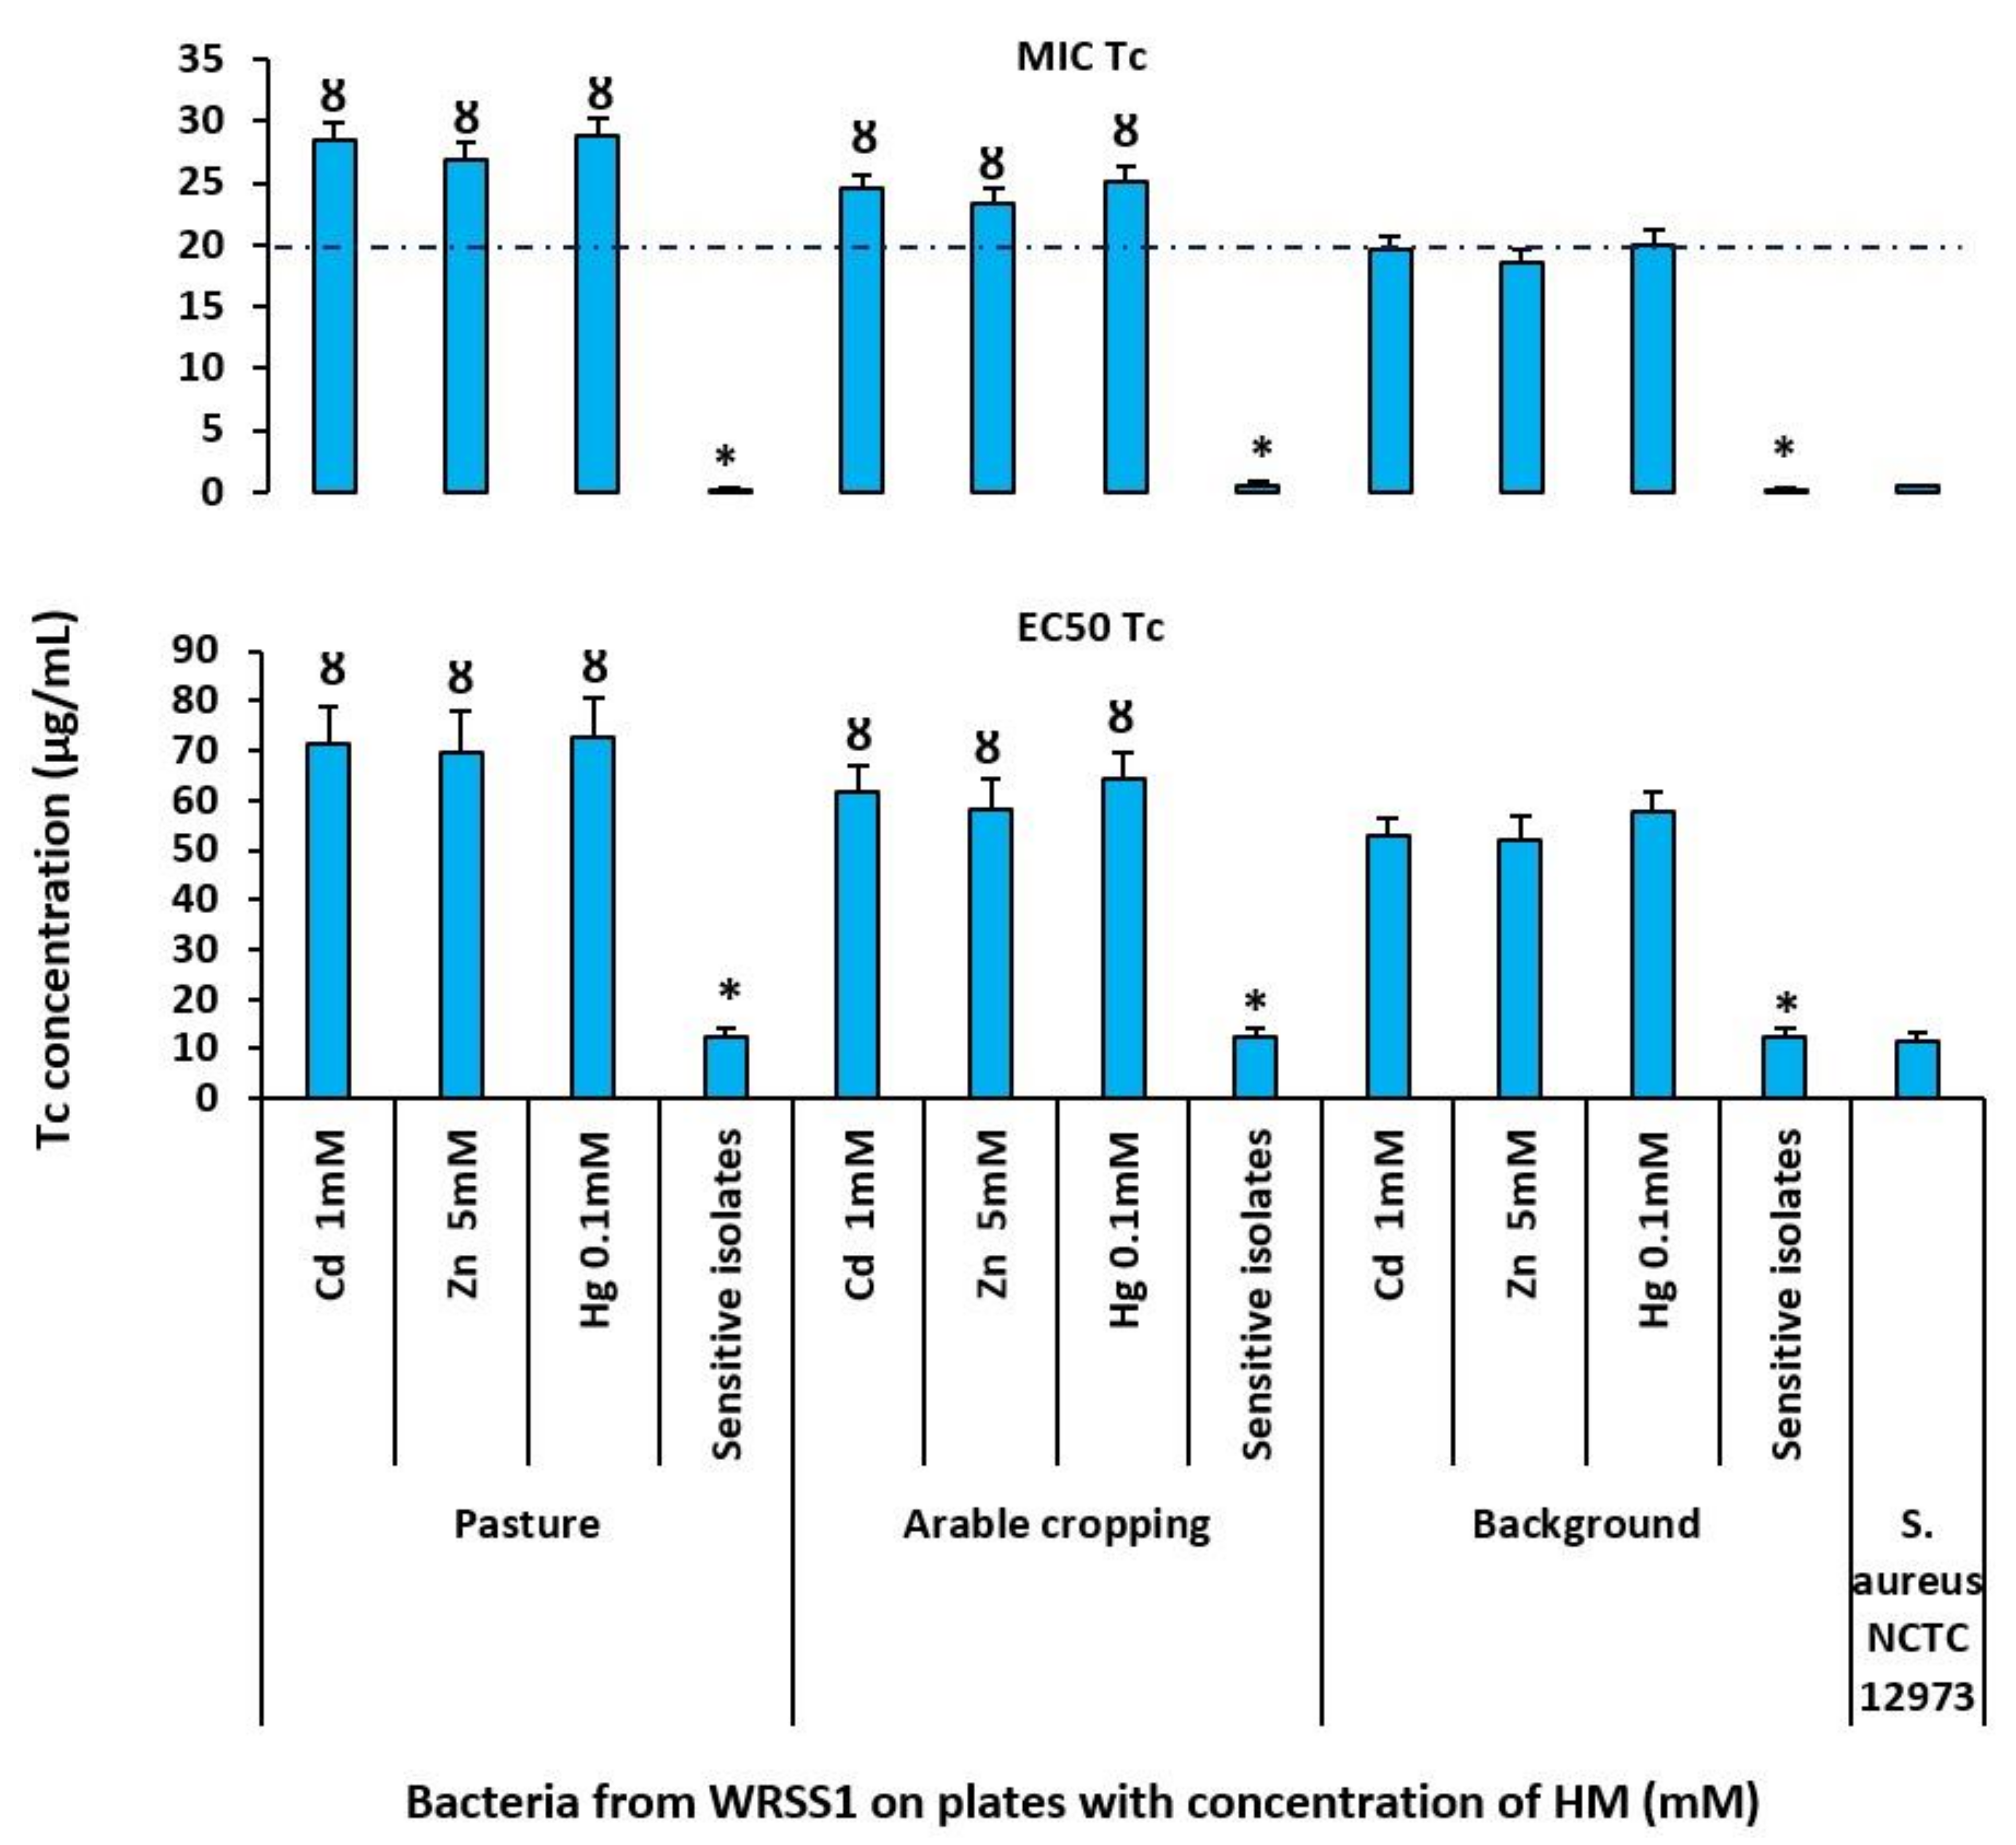
Resistance levels of representative isolates from the WRSS1 sample set were determined by broth microdilution assay. Greater MIC and EC50 values for Cd (Figure 6), Zn and Hg (Figure S12), and for Tc (Figure 7), Cm, Ery, Cb and Amp (Figures S13 and S14) for the TEoECR bacteria from the pastoral and arable soil isolates were found compared to those from background soil. There were higher MIC and EC50 values for the TEoEC and Ab for TEoECR isolates from WRSS1 pastoral, arable cropping and background compared to TEoEC sensitive isolates from these soil samples. Furthermore, the mean MIC and EC50 values for all five Ab for the TEoECR isolates from WRSS1 pastoral, arable and background soils were greater than those for the TEoEC-sensitive isolates from each WRSS1 soil sample (p < 0.05). Similar results were obtained for bacteria from the WRSS2 and WRSS3 soil sample sets for the TEoEC and Ab (Figures S15–S22).

3.5. Bacterial Community Structure Investigation

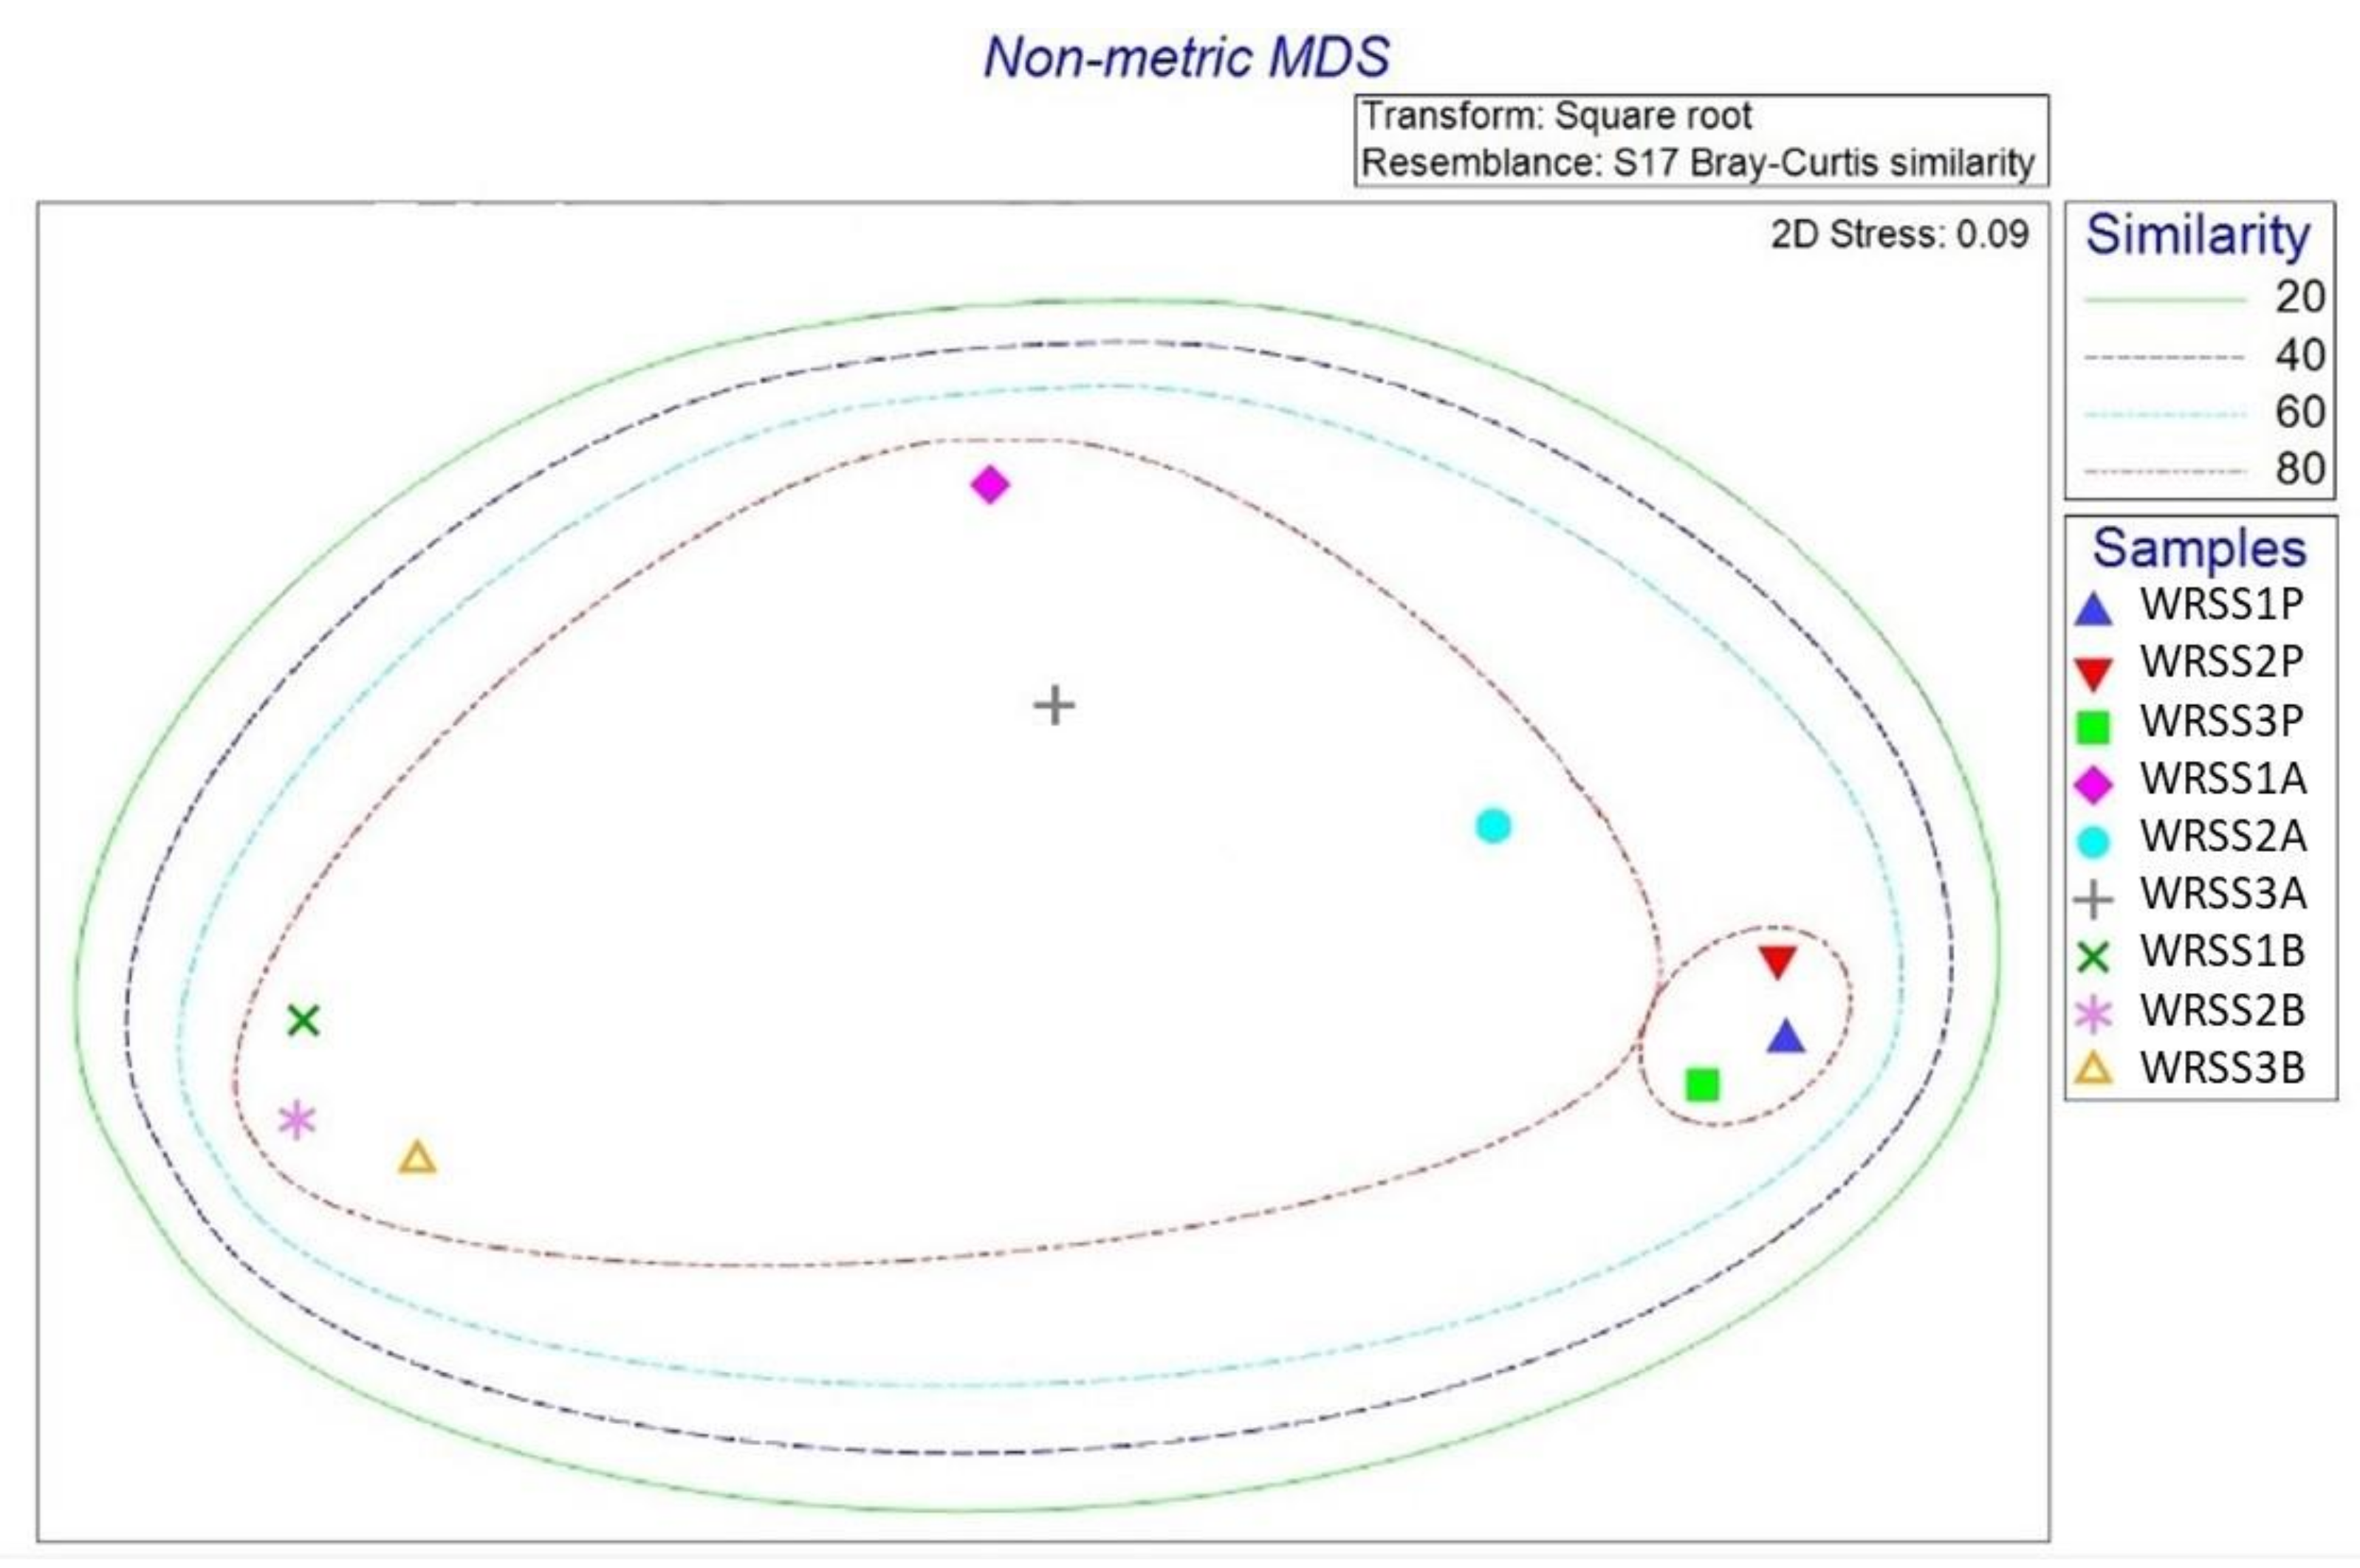
Community structures of bacteria in the soil samples sets were investigated by TRFLP analysis. The bacterial communities from pastoral soils shared <80% similarity with those from arable and background soil. The profile of terminal restriction fragments in pastoral soils’ bacterial communities was different from those for background and arable soils (p < 0.05) (Figure 8).

3.6. Characterisation of Cd Resistance Genes

A total of 19 bacterial isolates (14 %) from 135 selected CdR isolates carried czcA and two isolates (1.5 %) carried cadA. Table 3 lists the abundance of isolates carrying czcA and cadA genes amongst the CdR bacterial isolates tested.
Of the 21 bacterial isolates carrying cadA and/or czcA, 10 were found to transfer these genes to the recipient MUW001 (Table 4).
Transconjugants that received cadA or czcA were subjected to PCR validation. The cadA gene was amplified from both transconjugants that putatively received cadA, and czcA was amplified from all the recipients that received the czcA gene (n = 8).
Plate culturing showed both the transconjugants that received cadA were resistant to 1 mM Cd and 5 mM Zn, and one was resistant to 0.1 mM Hg. While one transconjugant showed resistance to Tc and Cm, both were resistant to Ery, Cb and Amp. Furthermore, all czcA+ transconjugants were resistant to 1 mM Cd and 5 mM Zn, and 75% of them showed resistance to 0.1 mM Hg (Figure 9). AbR profiles for the MUW001 czcA+ transconjugants and cadA+ transconjugants are shown in Figure 9.
The donor strains with mobilisable Cd resistance genes were identified by 16S rDNA sequencing. Table 5 lists identity of these isolates which were from the genera Rhodococcus, Pseudomonas, Chryseobacterium, Stenotrophomonas, Cupriavidus, Achromobacter, and Microbacterium.

4. Discussion

Analysis of physicochemical properties of the soil samples collected from the pastoral and arable cropping farms and the background site confirmed that for major variables, the three sites were largely similar. This was as intended, as they were selected as nearby sites with the same soil type, but different land uses. Levels of organic matter, total P and trace elements reflected the histories of land management practices on the three properties since European settlement. It is acknowledged that samples from the background site do not constitute a true control for the pastoral and arable sites, but represent a practical alternative, as no site in the region with similar soil type had been farmed and not amended with superphosphate for any length of time.
Most Cd in New Zealand’s pastoral soils came from superphosphate fertiliser. Historically, this fertiliser was derived from Nauru phosphate rock, which had high concentrations of Cd (~550 mg Cd kg−1 of P). Cd contamination of soils was a potential problem and this resulted in the formation of the Cadmium Working Group administered by the New Zealand Fertiliser Quality Council. Starting in 1995, the New Zealand fertiliser industry introduced voluntary limits for the level of Cd in fertiliser. Initially, a level of 340 mg Cd kg−1 P between July 1995–December 1996 was used, limit levels incrementally reduced to an upper limit of 280 mg Cd kg−1 P from Jan 1997 onwards [52]. To avoid the accumulation of Cd in soil, phosphate fertilizers would need to contain less than 50 mg Cd/kg P [23].
The concentration of TEoEC including Cd and Zn in this study trended higher from background soils to arable to pastoral soils. In pastoral soils, superphosphate fertiliser application has elevated P, S, Ca, Cd and F levels in soil; and several Zn-containing agrichemicals (e.g., facial eczema remedies for curing sporodesmin toxicity) have contributed to an elevated Zn content [29,30]. In arable soils the main sources of Cd and Zn are superphosphate and ammonium phosphate fertilisers, and Zn-containing thiocarbamate fungicide sprays, respectively. Ab concentrations in the soil samples were not determined, but would be expected to be low and largely generated by microbial activity, due to the accepted practice of segregating animals treated with antibiotics [53]. Direct application of antibiotics to crops on arable farms is not standard practice. Measurements of antibiotics concentrations in soil show them to be highly variable [54]. While soil temperature and water content at the sampling sites vary with season, soil pH was not significantly different.
Culture, PICT and other techniques, showed that elevated TEoEC in soils was associated with increased TEoECR. In addition, we also showed that TEoEC were significantly linked to AbR. There were no significant differences between bacterial numbers in WRSS1 compared to the other two sets, except between the arable soils from WRSS1 and WRSS2 (sites EW85 and EW86). However, there were higher ratios of TEoECR:total CFU from pastoral soils compared to arable and background soils. Hermans et.al. (2017) [55], and Fierer and Jackson (2005) [56], reported that variation in soil environment has a more substantial effect on soil bacterial communities than climate changes. It has been suggested that soil moisture content and pH are likely the main factors affecting bacterial community structures [57], and that different levels of metal contaminations in soils affect bacterial diversity [58]. The long-term usage of Cd and Zn-contained compounds has increased levels of TEoEC in soil. Bacterial resistance or tolerance to Cd may well result in higher levels of resistance to Zn and Hg as well, due to pleiotropic mutations and/or resistance genes encoding proteins involved in resistance to multiple metals (e.g., czc encoding cellular efflux pumps for Cd, Zn and Co) [59]. There were more Hg resistant bacteria in pastoral soils compared to those from arable and background soil, although there were no significant differences in the levels of Hg in pastoral soils compared to background soil; and Hg levels, in fact, were highest in arable soils. The low levels of Hg in NZ soils derive mainly from natural sources, particularly volcanism. We hypothesize that the higher level of bacterial resistance to Hg in pastoral soils compared to arable, is due to the higher levels of Cd and Zn [4]. Repetition of the pattern of the relative resistance following the order pastoral > arable > background is interesting, because in the case of Hg, levels in all soil samples were within their normal background ranges and there is no evidence for enrichment of Hg in farmed soils in New Zealand [60].
Plate culturing of bacteria isolated from soil samples showed higher levels of bacterial AbR in pastoral soils compared to arable and background soils. This suggests that the higher levels of Cd and Zn in pastoral soils and the higher levels of resistance to these TEoEC can induce the co-selection of resistance to these Ab. This observation is similar to previous reports [61,62] indicating that co-resistance may have arisen due to common mechanisms such as enhanced efflux or coregulation of resistance genes, and it is recognised that other contaminants may also select for AbR [12].
The PICT assays of bacterial communities from the soil samples revealed greater MIC and EC50 values for TEoEC and Ab in the pastoral soils’ consortia compared to those from background soil. The MIC values determined for bacterial consortia from pastoral soil were higher than the 20 µg mL−1 threshold, while MICs were lower than this threshold for bacteria from arable soil for Tc, and also for background soil for Tc and Cm. It has been reported that higher levels of TEoEC in soils, leads to greater resistance to TEoEC amongst bacterial isolates [63,64] The results of this study also found significant links between TEoECR and AbR. This resistance for Ab can occur in bacterial isolates with different levels of TEoECR. The introduction of resistant strains from stock manure is not thought to be involved, as animals treated with antibiotics are isolated. The MICs for Ab for the bacterial isolates from the pastoral and arable soils were higher than those of isolates from background soil. The higher MIC and EC50 values determined for pastoral and arable soils compared to background soils reflected the effects of higher levels of TEoEC in these soils and likely induced Ab resistance in the bacterial isolates from these soils [11].
MIC and EC50 values for TEoEC determined by broth microdilution assays for TEoECR isolates showed that individual isolates from pastoral and arable soils, which contain higher levels of TEoEC, were on average more resistant to the TEoEC than isolates from background soil. The levels of Ab resistance in TEoECR isolates were likely higher due to co-selection for AbR. This may occur due to various mechanisms (e.g., co-location of resistance genes) [25]. Henriques et. al., 2016 [65], suggest that the levels of Ab resistance in bacteria are significantly related to the levels of TEoEC in the environment. The higher levels of Cd and Zn in pastoral soils explain the subsequent co-selection of Ab resistance along with TEoEC resistance, as in recent reports [24]. Greater MIC and EC50 values for bacteria from the pastoral and arable soils compared to those from background soil showed higher levels of TEoEC resistance and AbR in bacteria. In a previous publication [66], the percentage of bacteria categorised as AbR amongst TEoECR isolates was significantly higher than the TEoEC-sensitive bacteria, which supports the phenomenon of TEoEC and Ab co-resistance.
TRFLP analysis of bacterial 16s rDNA gene profiles was used to compare soil microbial community structures TEoEC present in soil alters bacterial community structures [67]. TRFLP analysis on the soil samples revealed that higher levels of TEoEC in pastoral compared to background and arable soils were associated with distinct bacterial community structures suggesting the selection of particular species in the presence of high levels of TEoEC. High levels of TEoEC in pastoral and arable soils were a selective influence on many bacterial taxa [68]. We found relatively distinct clusters of terminal restriction fragments’abundance in pastoral samples compared to background and arable samples (Figure 8) in concordance with Brodie et. al. (2002) [69].
HGT through bacterial mobile genetic elements is an important mode of spread of TEoECR and AbR genes [70]. The cadA gene is carried either on plasmids [71] or chromosomes and encodes a Cd+2-ATPase protein transporter [47], also conferring Zn resistance [72]. We found only Gram-positive isolates including Rhodococcus sp. and a member of the Gram-variable Micobacterium genus amplified cadA as reported by others [73]. The czcA gene encodes a domain of efflux-RND proteins engaged in Zn2+, Co2+, and Cd2+ efflux [74]. The most abundant bacterial phyla carrying czcA are Proteobacteria (e.g., Pseudomonas and Cupriavidus), Actinobacteria, Verrucomicrobia, and Bacteroidetes (mainly Chryseobacterium) [75,76], in accordance with our findings. It has been suggested that the occurrence of cadA and czcA in soil bacteria can be selected by TEoEC contamination pressure [77]. Several of our CdR isolates could transfer czcA or cadA in conjugation assays and the transconjugants obtained were AbR at levels >20 μg mL−1.

5. Conclusions

In conclusion, this study showed that the abundance of the bacterial isolates resistant to TEoEC and Ab was greater in soils with higher levels of TEoEC, compared to those from soils with lower levels of TEoEC. AbR was strongly associated with soil with higher levels of TEoEC. Moreover, the structure of soil bacterial communities appeared changed under selective pressure associated with the presence of TEoEC. Cd resistance genes, in CdR bacterial isolates, were mobile and introduced co-resistance to a range of Ab to a laboratory strain, demonstrating the potential for resistance genes selected by TEoEC contamination to spread to human and animal pathogens.

Supplementary Materials

The following are available online at https://www.mdpi.com/article/10.3390/su14031790/s1, Sections S1–S6, Tables S1–S4, Figures S1–S22.

Author Contributions

Conceptualization, N.D.K. and B.R.P.; Data curation, A.H.; Formal analysis, A.H., N.D.K., A.S. and B.R.P.; Funding acquisition, N.D.K. and B.R.P.; Investigation, A.H.; Methodology, A.H., N.D.K., J.H., G.G., A.S., M.T., C.B. and B.R.P.; Project administration, N.D.K. and B.R.P.; Resources, N.D.K., J.H., A.S. and M.T.; Software, J.H.; Supervision, N.D.K., J.H., G.G., A.S., C.B. and B.R.P.; Visualization, A.H.; Writing—original draft, A.H., N.D.K. and B.R.P.; Writing—review & editing, A.H., N.D.K., J.H., G.G., A.S., M.T., C.B. and B.R.P. All authors have read and agreed to the published version of the manuscript.

Funding

This research was funded by Massey University Research Funding (MURF).

Institutional Review Board Statement

Not applicable.

Informed Consent Statement

All authors have read and agreed to the published version of the manuscript.

Data Availability Statement

The data presented in this study are available on request from the corresponding author.

Acknowledgments

The authors would like to express their sincere gratitude to Jackie Aislabie, Landcare Research Institute, Hamilton, New Zealand for advice, and laboratory staff at School of Health Sciences, Massey University Wellington for their help facilitating laboratory investigations of this project.

Conflicts of Interest

The authors declare no conflict of interest.

References

  1. Teitzel, G.M.; Parsek, M.R. Heavy metal resistance of biofilm and planktonic Pseudomonas aeruginosa. Appl. Environ. Microbiol. 2003, 69, 2313–2320. [Google Scholar] [CrossRef] [PubMed] [Green Version]
  2. Silver, S. Bacterial resistances to toxic metal ions—A review. Gene 1996, 179, 9–19. [Google Scholar] [CrossRef]
  3. Lemire, J.A.; Harrison, J.J.; Turner, R.J. Antimicrobial activity of metals: Mechanisms, molecular targets and applications. Nat. Rev. Microbiol. 2013, 11, 371–384. [Google Scholar] [CrossRef] [PubMed]
  4. Harrison, J.J.; Ceri, H.; Turner, R.J. Multimetal resistance and tolerance in microbial biofilms. Nat. Rev. Microbiol. 2007, 5, 928–938. [Google Scholar] [CrossRef]
  5. Seiler, C.; Berendonk, T.U. Heavy metal driven co-selection of antibiotic resistance in soil and water bodies impacted by agriculture and aquaculture. Front. Microbiol. 2012, 3, 399. [Google Scholar] [CrossRef] [Green Version]
  6. Sutton, N.B.; Maphosa, F.; Morillo, J.A.; Abu Al-Soud, W.; Langenhoff, A.A.; Grotenhuis, T.; Rijnaarts, H.H.; Smidt, H. Impact of long-term diesel contamination on soil microbial community structure. Appl. Environ. Microbiol. 2013, 79, 619–630. [Google Scholar] [CrossRef] [Green Version]
  7. Gullberg, E.; Albrecht, L.M.; Karlsson, C.; Sandegren, L.; Andersson, D.I. Selection of a multidrug resistance plasmid by sublethal levels of antibiotics and heavy metals. mBio 2014, 5, e01918-14. [Google Scholar] [CrossRef] [Green Version]
  8. Baker-Austin, C.; Wright, M.S.; Stepanauskas, R.; McArthur, J.V. Co-selection of antibiotic and metal resistance. Trends Microbiol. 2006, 14, 176–182. [Google Scholar] [CrossRef]
  9. Wales, A.D.; Davies, R.H. Co-Selection of Resistance to Antibiotics, Biocides and Heavy Metals, and Its Relevance to Foodborne Pathogens. Antibiotics 2015, 4, 567–604. [Google Scholar] [CrossRef] [Green Version]
  10. Dickinson, A.W.; Power, A.; Hansen, M.G.; Brandt, K.K.; Piliposian, G.; Appleby, P.; O'Neill, P.A.; Jones, R.T.; Sierocinski, P.; Koskella, B.; et al. Heavy metal pollution and co-selection for antibiotic resistance: A microbial palaeontology approach. Environ. Int. 2019, 132, 105117. [Google Scholar] [CrossRef]
  11. Chen, J.; Li, J.; Zhang, H.; Shi, W.; Liu, Y. Bacterial Heavy-Metal and Antibiotic Resistance Genes in a Copper Tailing Dam Area in Northern China. Front. Microbiol. 2019, 10, 1916. [Google Scholar] [CrossRef] [Green Version]
  12. Cen, T.; Zhang, X.; Xie, S.; Li, D. Preservatives accelerate the horizontal transfer of plasmid-mediated antimicrobial resistance genes via differential mechanisms. Environ. Int. 2020, 138, 105544. [Google Scholar] [CrossRef]
  13. Spain, A.; Alm, E. Implications of microbial heavy metal tolerance in the environment. Rev. Undergrad. Res. 2003, 2, 1–6. [Google Scholar]
  14. Al Salah, D.M.M.; Laffite, A.; Sivalingam, P.; Pote, J. Occurrence of toxic metals and their selective pressure for antibiotic-resistant clinically relevant bacteria and antibiotic-resistant genes in river receiving systems under tropical conditions. Environ. Sci. Pollut. Res. Int. 2021. [Google Scholar] [CrossRef]
  15. Taylor, M.; Kim, N.; Smidt, G. Trace element contaminants and radioactivity from phosphate fertiliser. In Phosphorus in Agriculture: 100% Zero; Schnug, E., De Kok, L.J., Eds.; Springer: Dordrecht, The Netherlands, 2016; pp. 231–266. [Google Scholar]
  16. Council, W.R. Cadmium and New Zealand Agriculture and Horticulture: A Strategy for Long-Term Risk Management; Ministry of Agriculture and Forestry: Wellington, New Zealand, 2011.
  17. Cavanagh, J. Working Towards New Zealand Risk-Based Soil Guideline Values for the Management of Cadmium Accumulation on Productive Land; Ministry for Primary Industries: Wellington, New Zealand, 2012.
  18. Vermeulen, V. Use of Zinc in Agriculture: An Assessment of Data for Evidence of Accumulation in Waikato Soils Surface Water and Sediments. Master Thesis, Massey University, Wellington, New Zealand, 2015. [Google Scholar]
  19. Alloway, B.J. Zinc in Soils and Crop Nutrition; International fertilizer Industry Association and International Zinc Association: Brussels, Belgium, 2004. [Google Scholar]
  20. McDowell, R.W.; Taylor, M.D.; Stevenson, B.A. Natural background and anthropogenic contributions of cadmium to New Zealand soils. Agric. Ecosyst. Environ. 2013, 165, 80–87. [Google Scholar] [CrossRef]
  21. Taylor, M.; Gibb, R.; Willoughby, J.; Hewitt, A.; Arnold, G. Soil Maps of Cadmium in New Zealand; Manaaki Whenua-Landcare Research: Wellington, New Zealand, 2007. [Google Scholar]
  22. Alloway, B.J. Copper and Zinc in soils: Too little or too much. In Proceedings of the New Zealand Trace Elements Group Conference, Hamilton, New Zealand, 13–15 February 2008; p. 10. [Google Scholar]
  23. Kim, N.; Robinson, B. Cadmium: A clandestine threat to food safety. Food Qual. Saf. 2015, 22, 49–51. [Google Scholar]
  24. Zhang, J.; Liu, J.; Lu, T.; Shen, P.; Zhong, H.; Tong, J.; Wei, Y. Fate of antibiotic resistance genes during anaerobic digestion of sewage sludge: Role of solids retention times in different configurations. Bioresour. Technol. 2019, 274, 488–495. [Google Scholar] [CrossRef]
  25. Ma, X.; Guo, N.; Ren, S.; Wang, S.; Wang, Y. Response of antibiotic resistance to the co-existence of chloramphenicol and copper during bio-electrochemical treatment of antibiotic-containing wastewater. Environ. Int.. 2019, 126, 127–133. [Google Scholar] [CrossRef]
  26. Soucy, S.M.; Huang, J.; Gogarten, J.P. Horizontal gene transfer: Building the web of life. Nat. Rev. Genet. 2015, 16, 472–482. [Google Scholar] [CrossRef]
  27. Derakshani, M.; Lukow, T.; Liesack, W. Novel bacterial lineages at the (sub)division level as detected by signature nucleotide-targeted recovery of 16S rRNA genes from bulk soil and rice roots of flooded rice microcosms. Appl. Environ. Microbiol. 2001, 67, 623–631. [Google Scholar] [CrossRef] [Green Version]
  28. Dubé, J.S.; Boudreault, J.P.; Bost, R.; Sona, M.; Duhaime, F.; Éthier, Y. Representativeness of laboratory sampling procedures for the analysis of trace metals in soil. Environ. Sci. Pollut. Res. Int. 2015, 22, 11862–11876. [Google Scholar] [CrossRef]
  29. Kim, N.D.; Taylor, M.D.; Drewry, J.J. Anthropogenic fluorine accumulation in the Waikato and Bay of Plenty regions of New Zealand: Comparison of field data with projections. Environ. Earth Sci. 2016, 75, 147. [Google Scholar] [CrossRef]
  30. Kim, N.D. Cadmium Accumulation in Waikato Soils.; Waikato Regional Council: Hamilton, New Zealand, 2008. [Google Scholar]
  31. Zealand, S.N. Nitrogen and Phosphorus in Fertilisers; Statistics New Zealand: Wellington, New Zealand, 2019. [Google Scholar]
  32. Hewitt, A.E. New Zealand Soil Classification, 3rd ed.; Manaaki Whenua Press: Lincoln, New Zealand, 2010; p. 136. [Google Scholar]
  33. IUSS Working Group WRB. World Reference Base for Soil Resources; Food and Agriculture Organization of the United Nations: Rome, Italy, 2015. [Google Scholar]
  34. Mohamed, R.M.; Abo-Amer, A.E. Isolation and characterization of heavy-metal resistant microbes from roadside soil and phylloplane. J. Basic Microbiol. 2012, 52, 53–65. [Google Scholar] [CrossRef]
  35. Craig Maclean, R. Adaptive radiation in microbial microcosms. J. Evolut. Biol. 2005, 18, 1376–1386. [Google Scholar] [CrossRef]
  36. Nishioka, T.; Elsharkawy, M.M.; Suga, H.; Kageyama, K.; Hyakumachi, M.; Shimizu, M. Development of Culture Medium for the Isolation of Flavobacterium and Chryseobacterium from Rhizosphere Soil. Microbes Environ. 2016, 31, 104–110. [Google Scholar] [CrossRef] [Green Version]
  37. EUCAST. MIC and Zone Diameter Distributions and Ecoffs. Available online: https://www.eucast.org/mic_distributions_and_ecoffs/ (accessed on 9 November 2021).
  38. Müsken, M.; Di Fiore, S.; Römling, U.; Häussler, S. A 96-well-plate–based optical method for the quantitative and qualitative evaluation of Pseudomonas aeruginosa biofilm formation and its application to susceptibility testing. Nat. Protoc. 2010, 5, 1460. [Google Scholar] [CrossRef]
  39. Ibekwe, A.M.; Papiernik, S.K.; Gan, J.; Yates, S.R.; Yang, C.H.; Crowley, D.E. Impact of fumigants on soil microbial communities. Appl. Environ. Microbiol. 2001, 67, 3245–3257. [Google Scholar] [CrossRef] [PubMed] [Green Version]
  40. Chen, S.; Li, X.; Sun, G.; Zhang, Y.; Su, J.; Ye, J. Heavy Metal Induced Antibiotic Resistance in Bacterium LSJC7. Int. J. Mol. Sci. 2015, 16, 23390–23404. [Google Scholar] [CrossRef] [Green Version]
  41. Rousk, J.; Rousk, K. Responses of microbial tolerance to heavy metals along a century-old metal ore pollution gradient in a subarctic birch forest. Environ. Pollut. 2018, 240, 297–305. [Google Scholar] [CrossRef]
  42. Marchesi, J.R.; Sato, T.; Weightman, A.J.; Martin, T.A.; Fry, J.C.; Hiom, S.J.; Dymock, D.; Wade, W.G. Design and evaluation of useful bacterium-specific PCR primers that amplify genes coding for bacterial 16S rRNA. Appl. Environ. Microbiol. 1998, 64, 795–799. [Google Scholar] [CrossRef] [Green Version]
  43. Hauben, L.; Vauterin, L.; Swings, J.; Moore, E.R. Comparison of 16S ribosomal DNA sequences of all Xanthomonas species. Int. J. Syst. Bacteriol. 1997, 47, 328–335. [Google Scholar] [CrossRef] [PubMed] [Green Version]
  44. Horswell, J.; Prosser, J.A.; Siggins, A.; van Schaik, A.; Ying, L.; Ross, C.; McGill, A.; Northcott, G. Assessing the impacts of chemical cocktails on the soil ecosystem. Soil Biol. Biochem. 2014, 75, 64–72. [Google Scholar] [CrossRef]
  45. Gielen, G.J.; Clinton, P.W.; Van den Heuvel, M.R.; Kimberley, M.O.; Greenfield, L.G. Influence of sewage and pharmaceuticals on soil microbial function. Environ. Toxicol. Chem. 2011, 30, 1086–1095. [Google Scholar] [CrossRef] [PubMed]
  46. Marsh, T.L.; Saxman, P.; Cole, J.; Tiedje, J. Terminal restriction fragment length polymorphism analysis program, a web-based research tool for microbial community analysis. Appl. Environ. Microbiol. 2000, 66, 3616–3620. [Google Scholar] [CrossRef] [Green Version]
  47. Oger, C.; Berthe, T.; Quillet, L.; Barray, S.; Chiffoleau, J.F.; Petit, F. Estimation of the abundance of the cadmium resistance gene cadA in microbial communities in polluted estuary water. Res. Microbiol. 2001, 152, 671–678. [Google Scholar] [CrossRef]
  48. Ausubel, F.M. Short Protocols in Molecular Biology: A Compendium of Methods from Current Protocols in Molecular Biology; Wiley: New York, NY, USA, 2002. [Google Scholar]
  49. Brophy, J.A.N.; Triassi, A.J.; Adams, B.L.; Renberg, R.L.; Stratis-Cullum, D.N.; Grossman, A.D.; Voigt, C.A. Engineered integrative and conjugative elements for efficient and inducible DNA transfer to undomesticated bacteria. Nat. Microbiol. 2018, 3, 1043–1053. [Google Scholar] [CrossRef]
  50. Aviv, G.; Rahav, G.; Gal-Mor, O. Horizontal Transfer of the Salmonella enterica Serovar Infantis Resistance and Virulence Plasmid pESI to the Gut Microbiota of Warm-Blooded Hosts. mBio 2016, 7, e01395-16. [Google Scholar] [CrossRef] [Green Version]
  51. Hung, C.W.; Martinez-Marquez, J.Y.; Javed, F.T.; Duncan, M.C. A simple and inexpensive quantitative technique for determining chemical sensitivity in Saccharomyces cerevisiae. Sci. Rep. 2018, 8, 11919. [Google Scholar] [CrossRef]
  52. Rys, G. A Cadmium Management Strategy for New Zealand. In Proceedings of the Fertiliser and Lime Conference, Palmerston North, New Zealand, 11–13 November 2011; p. 14. [Google Scholar]
  53. Association, N.Z.V. Antibiotic Judicious Use Guidelines for the New Zealand Veterinary Profession—Dairy; New Zealand Veterinary Association: Wellington, New Zealand, 2018. [Google Scholar]
  54. Cycon, M.; Mrozik, A.; Piotrowska-Seget, Z. Antibiotics in the Soil Environment-Degradation and Their Impact on Microbial Activity and Diversity. Front. Microbiol. 2019, 10, 338. [Google Scholar] [CrossRef]
  55. Hermans, S.M.; Buckley, H.L.; Case, B.S.; Curran-Cournane, F.; Taylor, M.; Lear, G. Bacteria as Emerging Indicators of Soil Condition. Appl. Environ. Microbiol. 2017, 83, e02826-16. [Google Scholar] [CrossRef] [Green Version]
  56. Fierer, N.; Jackson, R.B. The diversity and biogeography of soil bacterial communities. Proc. Natl. Acad. Sci. USA 2006, 103, 626–631. [Google Scholar] [CrossRef] [Green Version]
  57. Guo, D.; Fan, Z.; Lu, S.; Ma, Y.; Nie, X.; Tong, F.; Peng, X. Changes in rhizosphere bacterial communities during remediation of heavy metal-accumulating plants around the Xikuangshan mine in southern China. Sci. Rep. 2019, 9, 1947. [Google Scholar] [CrossRef] [Green Version]
  58. Wang, N.; Zhang, S.; He, M. Bacterial community profile of contaminated soils in a typical antimony mining site. Environ. Sci. Pollut. Res. Int. 2018, 25, 141–152. [Google Scholar] [CrossRef]
  59. Yu, Z.; Gunn, L.; Wall, P.; Fanning, S. Antimicrobial resistance and its association with tolerance to heavy metals in agriculture production. Food Microbiol. 2017, 64, 23–32. [Google Scholar] [CrossRef]
  60. Taylor, M.D.; Kim, N. Dealumination as a mechanism for increased acid recoverable aluminium in Waikato mineral soils. Austral. J. Soil Res. 2009, 47, 828–838. [Google Scholar] [CrossRef]
  61. Li, L.G.; Xia, Y.; Zhang, T. Co-occurrence of antibiotic and metal resistance genes revealed in complete genome collection. ISME J. 2017, 11, 651–662. [Google Scholar] [CrossRef]
  62. Zhao, Y.; Cocerva, T.; Cox, S.; Tardif, S.; Su, J.Q.; Zhu, Y.G.; Brandt, K.K. Evidence for co-selection of antibiotic resistance genes and mobile genetic elements in metal polluted urban soils. Sci. Total Environ. 2019, 656, 512–520. [Google Scholar] [CrossRef] [Green Version]
  63. Zhu, Y.; Zhang, W.; Schwarz, S.; Wang, C.; Liu, W.; Chen, F.; Luan, T.; Liu, S. Characterization of a blaIMP-4-carrying plasmid from Enterobacter cloacae of swine origin. J. Antimicrob. Chemother. 2019, 74, 1799–1806. [Google Scholar] [CrossRef]
  64. Liu, B.; Li, Y.; Gao, S.; Chen, X. Copper exposure to soil under single and repeated application: Selection for the microbial community tolerance and effects on the dissipation of antibiotics. J. Hazard. Mater. 2017, 325, 129–135. [Google Scholar] [CrossRef] [PubMed]
  65. Henriques, I.; Tacão, M.; Leite, L.; Fidalgo, C.; Araújo, S.; Oliveira, C.; Alves, A. Co-selection of antibiotic and metal(loid) resistance in gram-negative epiphytic bacteria from contaminated salt marshes. Mar. Pollut. Bull. 2016, 109, 427–434. [Google Scholar] [CrossRef]
  66. Bhullar, K.; Waglechner, N.; Pawlowski, A.; Koteva, K.; Banks, E.D.; Johnston, M.D.; Barton, H.A.; Wright, G.D. Antibiotic resistance is prevalent in an isolated cave microbiome. PLoS ONE 2012, 7, e34953. [Google Scholar] [CrossRef] [PubMed]
  67. Sandaa, R.A.; Enger, O.; Torsvik, V. Abundance and diversity of Archaea in heavy-metal-contaminated soils. Appl. Environ. Microbiol. 1999, 65, 3293–3297. [Google Scholar] [CrossRef] [PubMed] [Green Version]
  68. Reith, F.; Zammit, C.M.; Pohrib, R.; Gregg, A.L.; Wakelin, S.A. Geogenic Factors as Drivers of Microbial Community Diversity in Soils Overlying Polymetallic Deposits. Appl. Environ. Microbiol. 2015, 81, 7822–7832. [Google Scholar] [CrossRef] [Green Version]
  69. Brodie, E.; Edwards, S.; Clipson, N. Bacterial community dynamics across a floristic gradient in a temperate upland grassland ecosystem. Microb. Ecol. 2002, 44, 260–270. [Google Scholar] [CrossRef]
  70. Lu, X.M.; Lu, P.Z. Distribution of antibiotic resistance genes in soil amended using Azolla imbricata and its driving mechanisms. Sci. Total Environ. 2019, 692, 422–431. [Google Scholar] [CrossRef]
  71. Udo, E.E.; Jacob, L.E.; Mathew, B. A cadmium resistance plasmid, pXU5, in Staphylococcus aureus, strain ATCC25923. FEMS Microbiol. Lett. 2000, 189, 79–80. [Google Scholar] [CrossRef]
  72. Silver, S.; Phung, L.T. Bacterial heavy metal resistance: New surprises. Annu. Rev. Microbiol. 1996, 50, 753–789. [Google Scholar] [CrossRef]
  73. Fu, L.M.; Fu-Liu, C.S. Is Mycobacterium tuberculosis a closer relative to Gram-positive or Gram-negative bacterial pathogens? Tuberculosis 2002, 82, 85–90. [Google Scholar] [CrossRef]
  74. Nies, D.H. Efflux-mediated heavy metal resistance in prokaryotes. FEMS Microbiol. Rev. 2003, 27, 313–339. [Google Scholar] [CrossRef]
  75. Li, X.; Yan, Z.; Gu, D.; Li, D.; Tao, Y.; Zhang, D.; Su, L.; Ao, Y. Characterization of cadmium-resistant rhizobacteria and their promotion effects on Brassica napus growth and cadmium uptake. J. Basic Microbiol. 2019, 59, 579–590. [Google Scholar] [CrossRef]
  76. Karelová, E.; Harichová, J.; Stojnev, T.; Pangallo, D.; Ferianc, P. The isolation of heavy-metal resistant culturable bacteria and resistance determinants from a heavy-metal-contaminated site. Biologia 2011, 66, 18–26. [Google Scholar] [CrossRef]
  77. Kaci, A.; Petit, F.; Lesueur, P.; Boust, D.; Vrel, A.; Berthe, T. Distinct diversity of the czcA gene in two sedimentary horizons from a contaminated estuarine core. Environ. Sci. Pollut. Res. Int. 2014, 21, 10787–10802. [Google Scholar] [CrossRef] [PubMed]
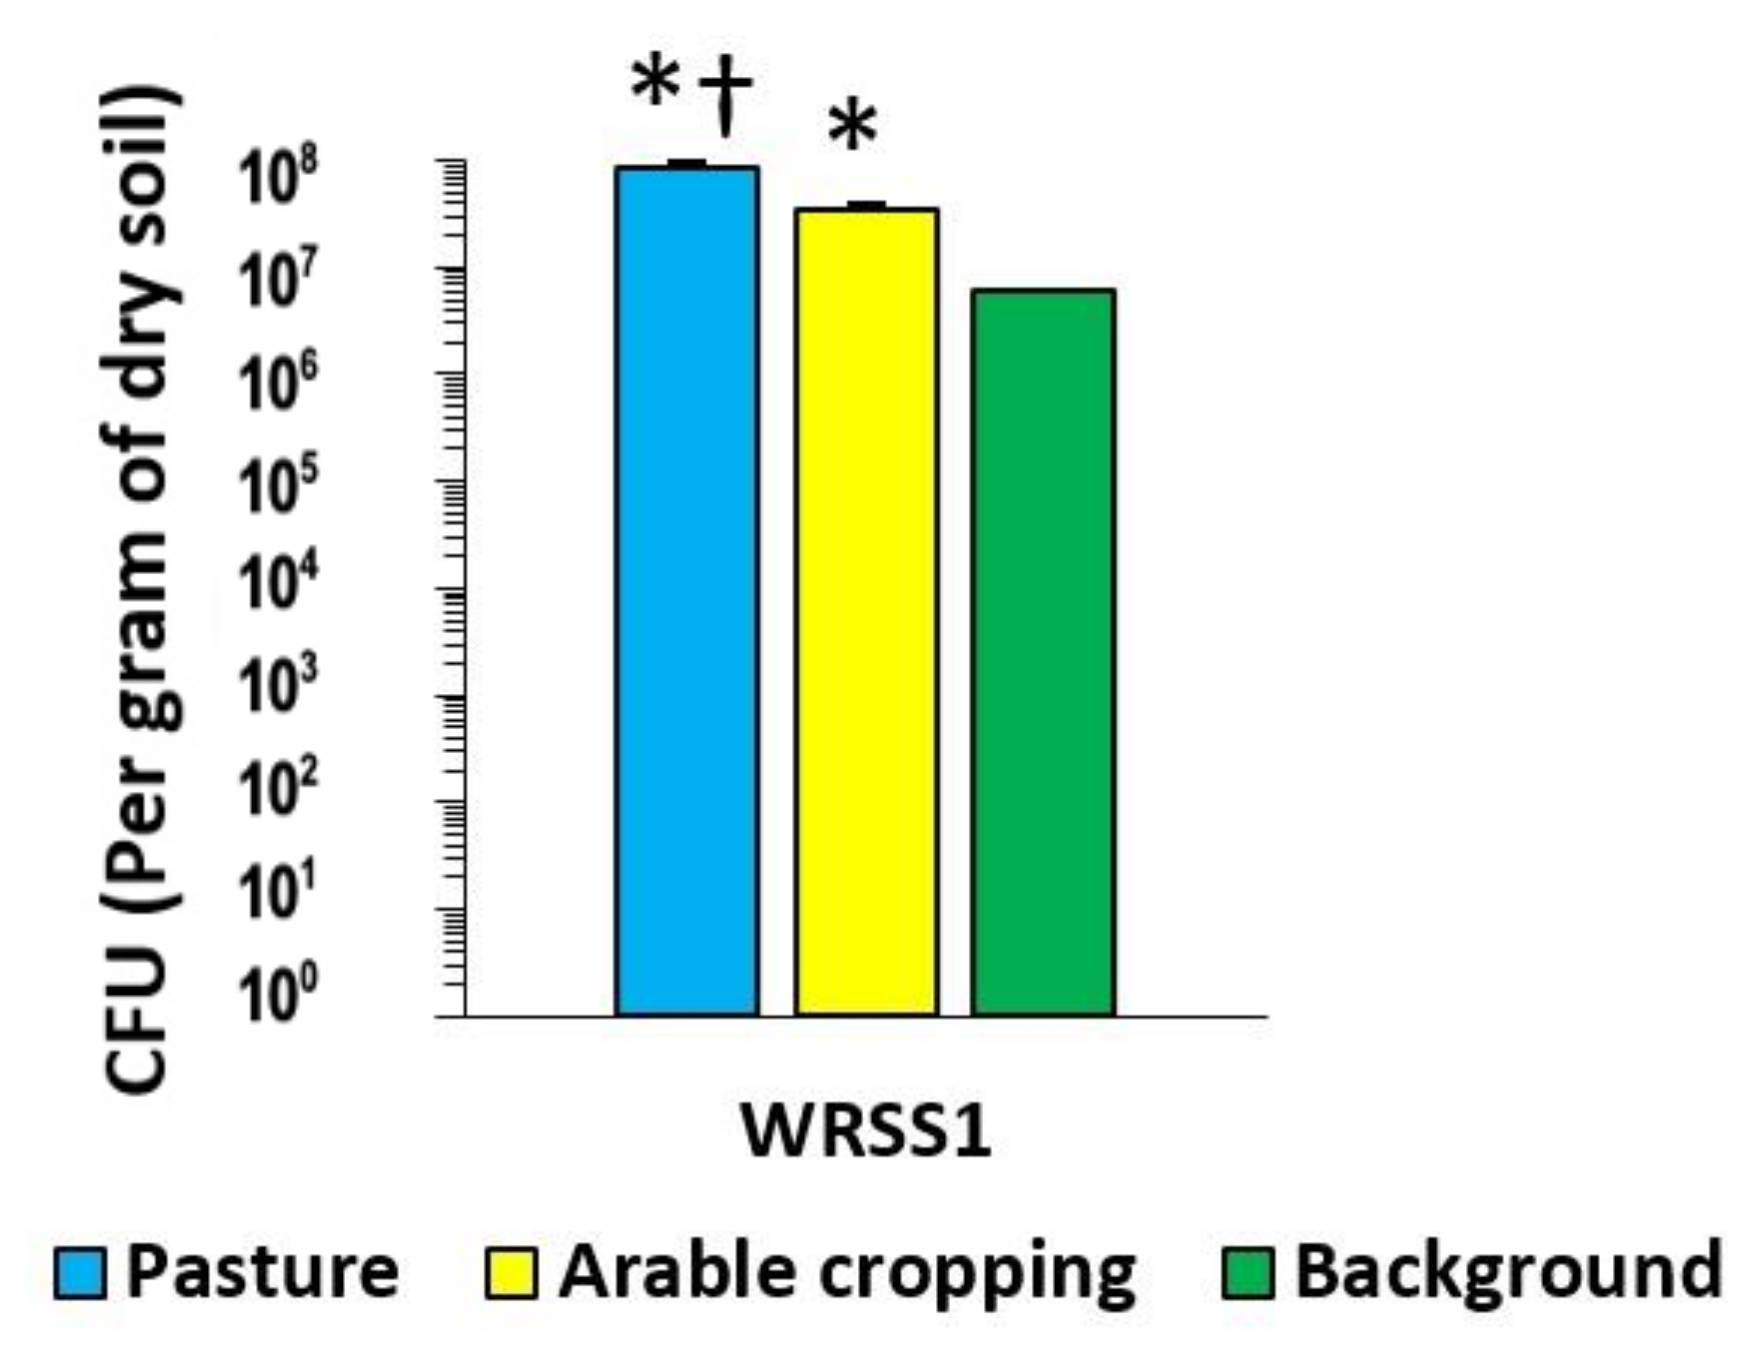
Figure 1. Total number of CFU (per gram of dry soil) from WRSS1 pastoral, arable and background soil samples, on R2A agar. * p < 0.05 compared to background soil bacteria total CFU; † p < 0.05 versus arable soil bacteria total CFU.
Sustainability 14 01790 g001
Figure 2. Mean ratios of TEoECR/total bacterial CFU (per gram of dry soil), selected on a range of Cd concentrations, for the three soil samples collected. * p < 0.05 versus background; † p < 0.05 versus arable.
Sustainability 14 01790 g002
Figure 3. Mean ratios of AbR/total bacterial CFUs, on a range of Tc concentrations, for WRSS1. * p < 0.05 versus background; † p < 0.05 versus arable.
Sustainability 14 01790 g003
Figure 4. Mean MIC and EC50 values of PICT assay with Cd for bacteria from WRSS1. * p < 0.05 compared to Cd MIC or EC50 values for bacteria from background soil.
Sustainability 14 01790 g004
Figure 5. Mean MIC and EC50 values of PICT assay with Tc for bacteria from WRSS1. * p < 0.05 compared to MIC or EC50 values from background soil. The dashed line defines the AbR level in soil bacteria.
Sustainability 14 01790 g005
Figure 6. Mean MIC and EC50 values from broth microdilution assay with Cd for TEoECR isolates from WRSS1. * p < 0.05 compared to value for TEoECR isolates from the same soil; Ȣ p < 0.05 compared to value for TEoECR isolates from background soil.
Sustainability 14 01790 g006
Figure 7. Mean MIC and EC50 values for broth microdilution assay with Tc for TEoECR isolates from WRSS1. * p < 0.05 compared to Tc MIC and EC50 values for TEoECR isolates from the same soil; Ȣ p < 0.05 compared to Tc MIC and EC50 values for isolates from background soil and selected on the same TEoEC concentration). The dashed line defines the Tc resistance level of soil bacteria.
Sustainability 14 01790 g007
Figure 8. Non-metric multidimensional scaling analysis plot of TRFLP relative peak height for WR soils’ bacterial communities’ data, using the Bray-Curtis similarity index. Significant difference (p < 0.05) between the two clusters characterised with >80% of similarity.
Sustainability 14 01790 g008
Figure 9. Percentage of transconjugant MUW001 carrying czcA and cadA genes resistant to (A) TEoEC (Cd 1 mM, Zn 5mM, Hg 0.1 mM) and (B) Ab (20 ug/mL).
Sustainability 14 01790 g009
Table 1. Waikato region soil sampling sites sampled for this study.
SamplesAcronymDate
Sampled
Indigenous
Forest Site
Arable SitePasture Site
1st sample setWRSS1February 2014EW-73EW-85EW-69
2nd sample setWRSS2August 2014EW-73EW-86 EW-135
3rd sample setWRSS3June 2015EW-73EW-85EW-69
Table 2. Waikato region soil sampling sites physicochemical information.
Site No.EW-73
(Indigenous Forest)
EW-85
(Arable)
EW-86
(Arable)
EW-69
(Pasture)
EW-135
(Pasture)
pH5.606.075.745.015.76
Total C (%)8.003.793.4010.108.63
Total N (%)0.480.300.300.940.84
C:N16.712.511.410.810.3
Olsen P *6.0011089.054.073.0
Cd *0.090.540.490.821.11
Hg * 0.190.310.420.200.21
Zn *27.0039.0040.0065.0062.00
Fe * 28,00042,00053,00059,00039,000
P * 2901850154023002500
* mg kg−1 of dry soil.
Table 3. Abundance of czcA and cadA genes amongst CdR bacterial isolates.
Soil Samples Number of CdR IsolatesCd Resistance Genes
cadAczcA
WRSS1 pasture151 (6.6%)4 (28.5%)
WRSS2 pasture1503 (20%)
WRSS3 pasture1503 (20%)
WRSS1 arable1503 (20%)
WRSS2 arable1502 (13.3%)
WRSS3 arable1502 (13.3%)
WRSS1 background151 (6.6%)1 (6.6%)
WRSS2 background1500
WRSS3 background1501 (6.6%)
Table 4. Mobilisation of cadA and czcA to recipient MUW001 by CdR isolates.
Soil Samples Number of Transconjugants Carrying Cd Resistance Genes
cadAczcA
WRSS1 pasture12
WRSS2 pasture01
WRSS3 pasture02
WRSS1 arable02
WRSS2 arable01
WRSS3 arable00
WRSS1 background10
WRSS2 background00
WRSS3 background00
Table 5. Individual bacterial isolates with mobilizable CdR identified by 16s rDNA sequencing.
Bacterial Isolate ID & SourceCd Resistance GeneDescriptionAccession NumberPercent Identity
MUW002 WRSS1, pasturecadARhodococcus erythropolis partial 16S rRNA gene, strain SBUG 107.FR745420.199.10%
MUW003 WRSS1, pastureczcAPseudomonas azotoformans strain P45A chromosome, complete genome.CP041236.199.80%
MUW004 WRSS1, pastureczcAChryseobacterium rhizosphaerae strain WTB5 16S ribosomal RNA gene, partial sequence.MK240433.198.90%
MUW005 WRSS2, pastureczcAStenotrophomonas maltophilia strain Tj 16S ribosomal RNA gene, partial sequence.MF280131.199.40%
MUW006 WRSS3, pastureczcABacterium strain BS1294 16S ribosomal RNA gene, partial sequence.MK824482.197.73%
MUW007 WRSS3, pastureczcAChryseobacterium lactis partial 16S rRNA gene, strain R-52618.LN995695.199.20%
MUW008 WRSS1, arable czcABacterium strain BS1294 16S ribosomal RNA gene, partial sequence.MK824482.199.32%
MUW009 WRSS1, arableczcACupriavidus sp. strain JS3054 16S ribosomal RNA gene, partial sequence.MH588163.199.40%
MUW010 WRSS2, arableczcAAchromobacter xylosoxidans strain E2 16S ribosomal RNA gene, partial sequence.MK849863.199.20%
MUW011 WRSS1, backgroundcadAMicrobacterium sp. strain PHIL_400ppmZn_ML16 16S ribosomal RNA gene, partial sequence.MK652511.199.59%
Publisher’s Note: MDPI stays neutral with regard to jurisdictional claims in published maps and institutional affiliations.