
Real-Time Energy Management and Load Scheduling with Renewable Energy Integration in Smart Grid


 , , and
Abstract
:1. Introduction
- A real-time framework is developed to solve energy management problems via residential load scheduling.
- The Energy Management Controller (EMC) of the developed framework is programmed using our proposed EDGE algorithm to schedule residential load.
- Real-Time Pricing (RTP) DR program is mathematically modelled and implemented to encourage consumers to solve energy management problems via scheduling residential load.
- To show the efficacy of the proposed EDGE algorithm, simulations are conducted in comparison with GA, BPSO, WDO, DE and EDE algorithms in aspects of objectives like energy cost, carbon emission, and PAR.
- Results validate that EDGE algorithm outperforms GA, BPSO, WDO, DE and EDE algorithms in aspects of power usage pattern, energy cost, PAR and carbon emission subjected to ensure user comfort.
2. Related Work
3. Methodology
3.1. Proposed Energy Management Framework
3.1.1. Framework Inputs
- Smart appliances: Residential homes have three categories of load like interruptible, non-interruptible, and hybrid loads. Water heater, AC, batteries, EVs and dishwasher can be placed in any category according to user lifestyle. The working cycle of the first class of appliances can be modified. On the other hand, non-interruptible appliances are those whose operation cannot be postponed. Mathematical modelling of major residential appliances and operational constraints are presented here. The operation time of all appliances is specified by:Devices such as AC and water heater try to maintain a temperature within desired range. Therefore, the following constraints are necessary to model these appliances properly.Here Equation (4) ensures that thermal appliances temperature lies within user-preferred ranges, and Equation (5) guarantee that if the temperature of a device before the model initialization is more than the upper limit, then the appliance is ON in first-time interval; otherwise, it will remain in OFF state. In addition to the constraints mentioned above, each appliance has a particular mathematical equation to model its operation, which is discussed as follows.
- AC: The model aims to maintain AC temperature within a specific range while considering all the major aspects that can affect its cooling, such as activity level, the difference in indoor, outdoor temperatures, and the number of occupants. Operational constraints of AC are presented by the equation as follows:The dynamics of the indoor temperature of AC is presented by Equation (6). The equation shows that the indoor temperature at a specific interval depends on the initial temperature, the household’s activity level, the difference between indoor and outdoor temperatures, and the ON/OFF state of the appliance. The cooling effect of AC due to ON state is represented by . represent the effect of temperature difference, occupants’ number, and activity level on given temperature, respectively. The model also considers the temperature threshold, i.e., upper and lower levels in which temperature variation can be acceptable for consumers.
- Water heater: The magnitude of hourly usage of hot water in different houses varies. It is also observed that usage pattern changes significantly in normal and weak days. Thus, this issue is considered while developing the water heater model. The operational constraints of the water heater are shown below:The temperature of the water heater at a specific interval t is a function of water temperature in the previous hour, its usage pattern and the effect of the ON/OFF state in its internal temperature.
- Battery and EVs: Nowadays, the residential sector is equipped with storing devices such as batteries and EVs. They store energy to reduce peak demand during specific hours when there is a shortage of grid energy. To develop a model of each appliance, we assume that energy charge and discharge in each interval is known. The general model for energy storing devices is given by:
- Dishwasher, Washing machine, Cloth dryer: The operational constraints of the dishwasher, washing machine and cloth dryer is as follows:In addition to the total timeslots over which the devices required to operate according to end-user choice during a day is given in Equation (11), additional constraints are considered in modelling such as maximum successive operation time, coordination of washing machine and cloth dryer in such a way that both appliances will not start simultaneously. The dryer will start its operation when the washing machine completes its working hours. The Equation (12) given below validates the consecutive operation of appliance to handle the second category of appliances known as uninterruptible appliances:The Equation (13) avoid the cloth dryer and washing machine to operate simultaneously. The last constraint guarantees the start of operation of appliance i2 after the end of total working hours of appliance i1.
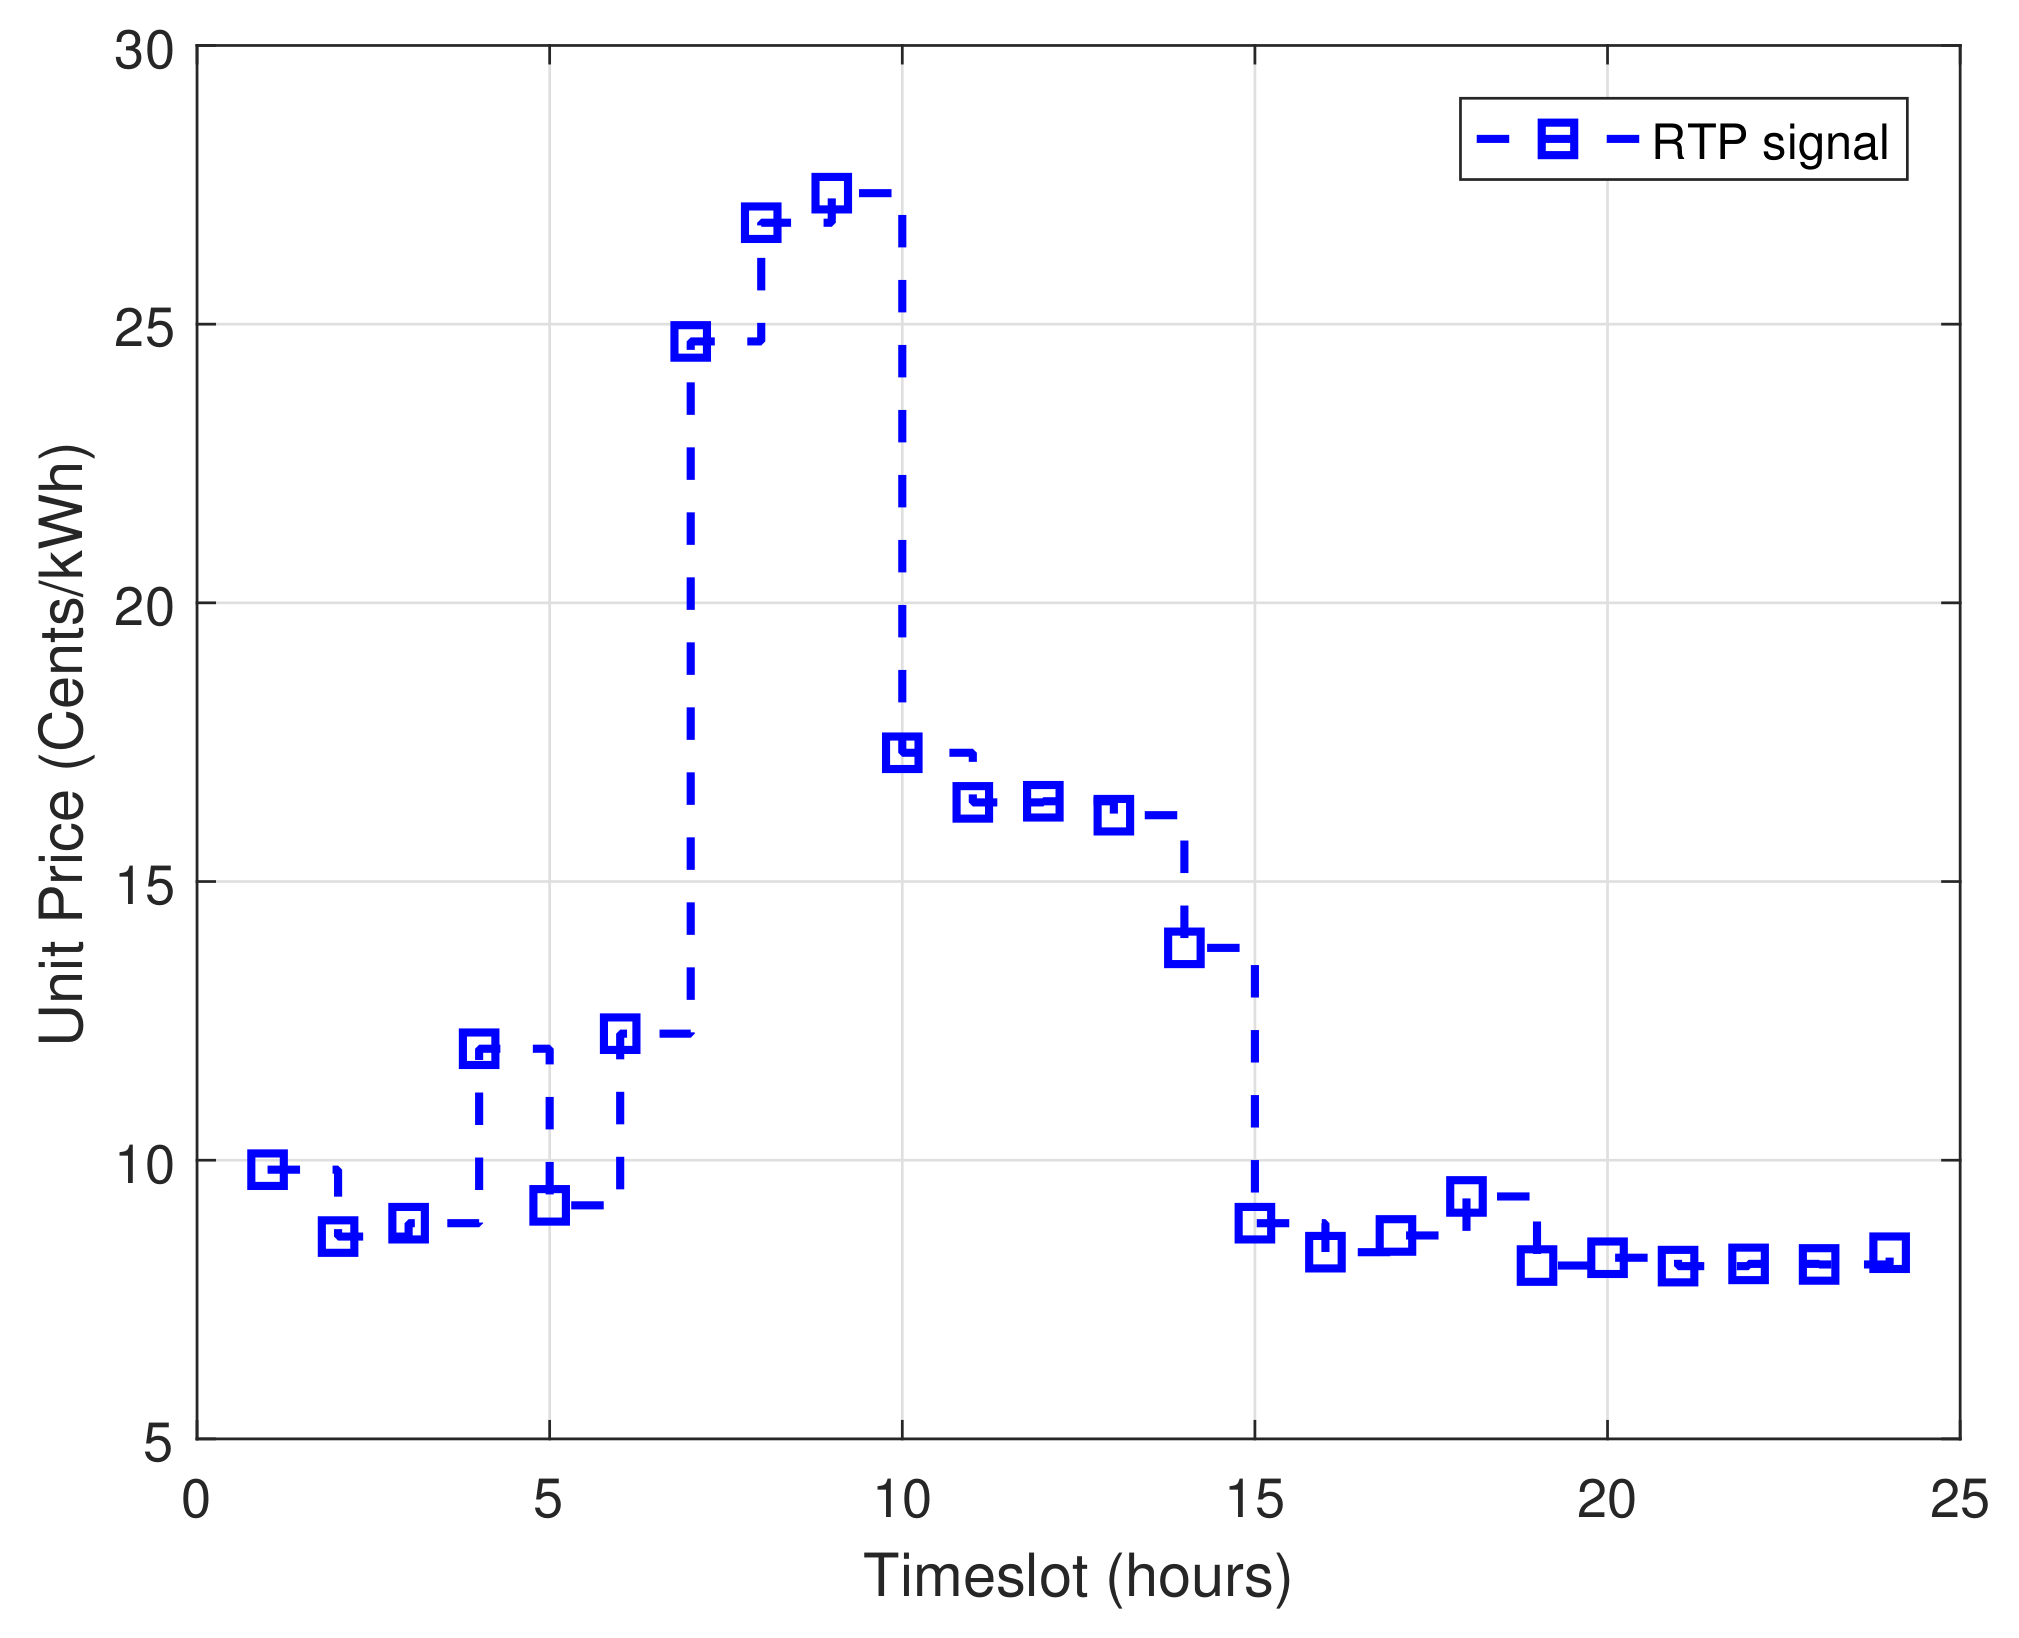
- RTP signal: The EMC based on the EDGE algorithm of the proposed framework uses the RTP signal as an input to schedule the power usage pattern of home appliances. The utility company broadcasts this RTP signal to EMC for power usage scheduling of users. This RTP signal used in this work is taken from the federal energy regulating commission [40].
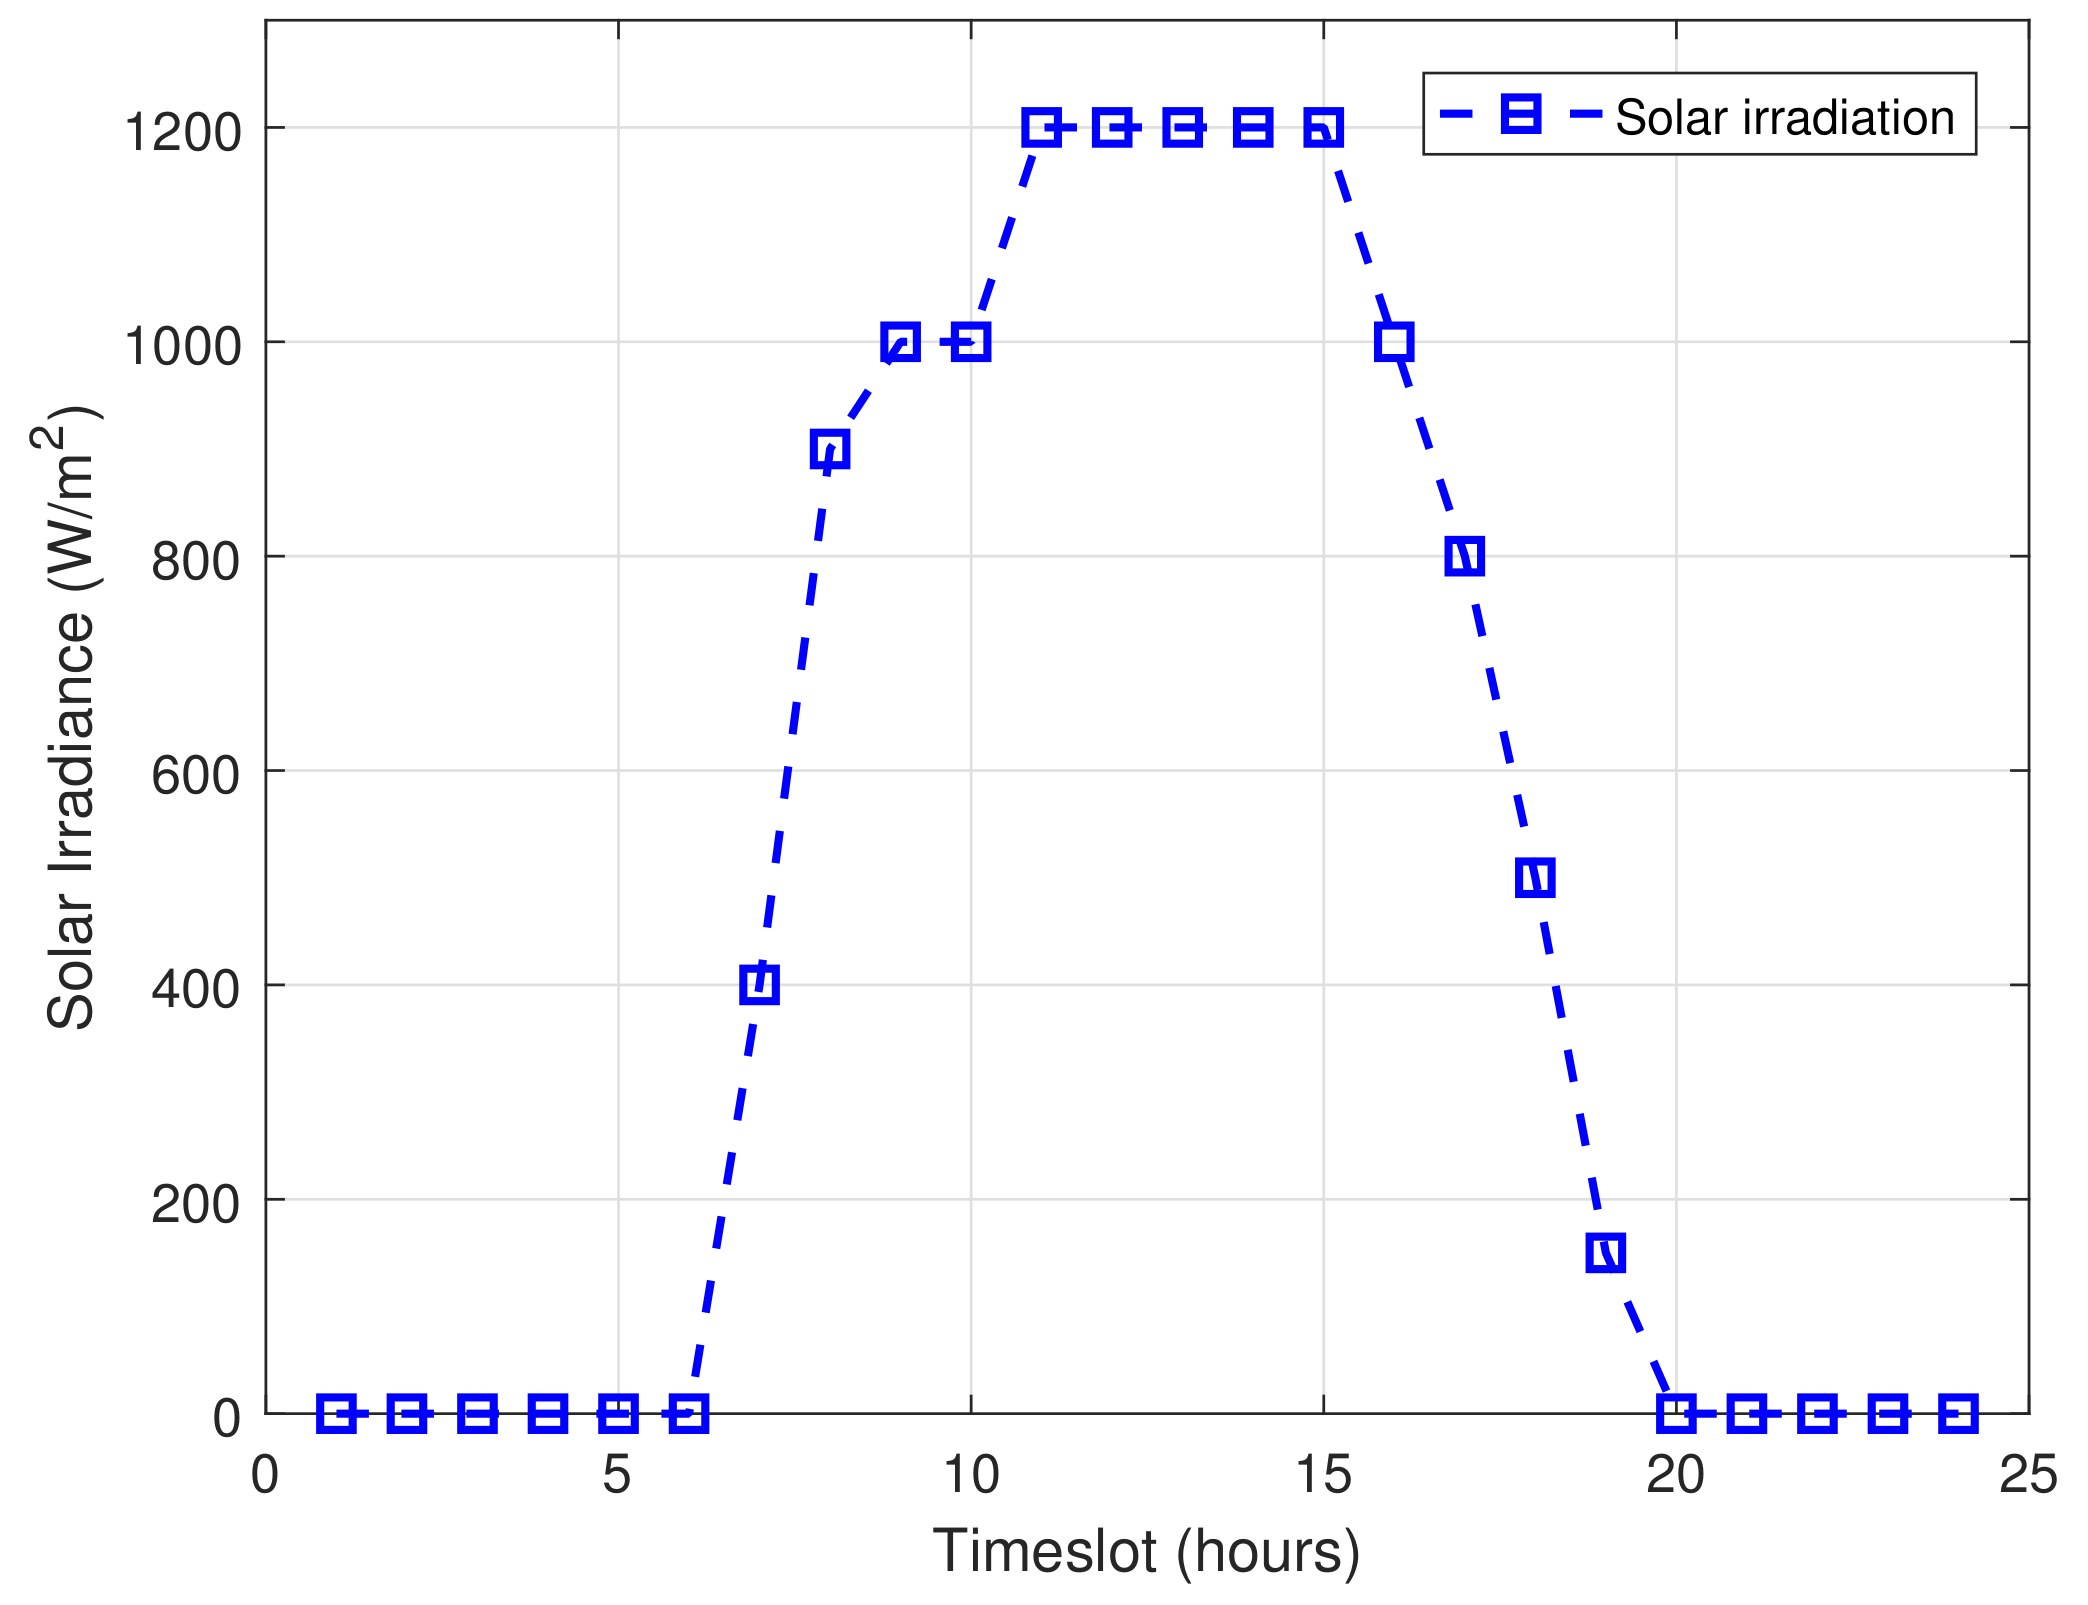
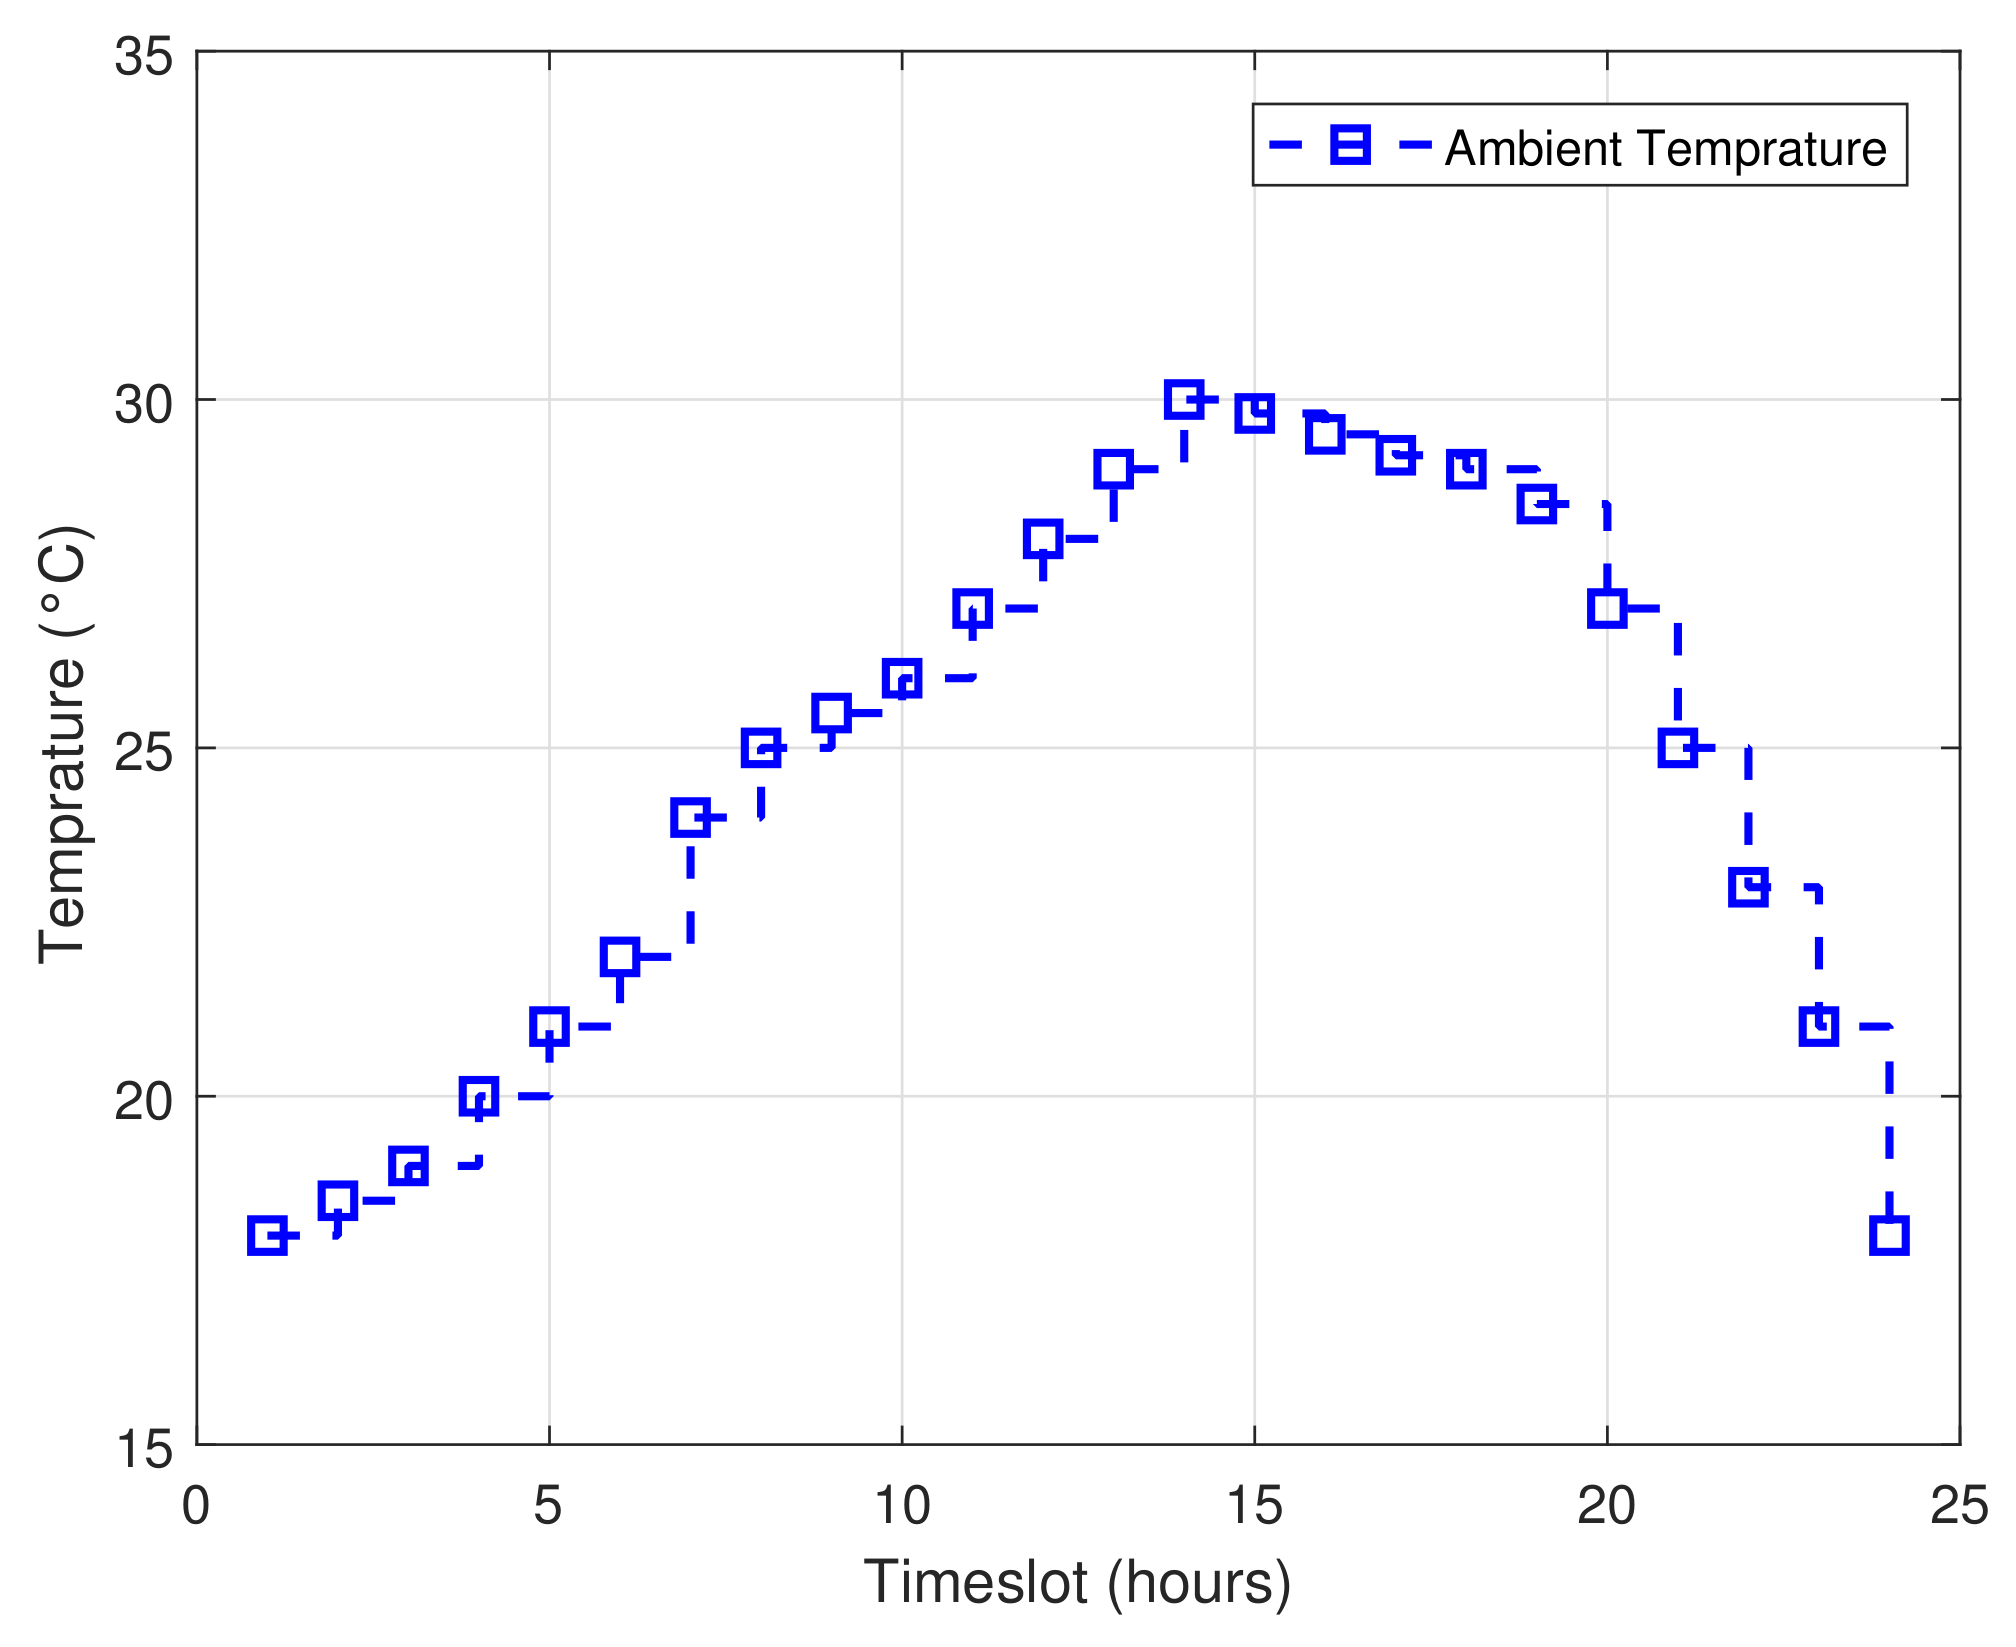
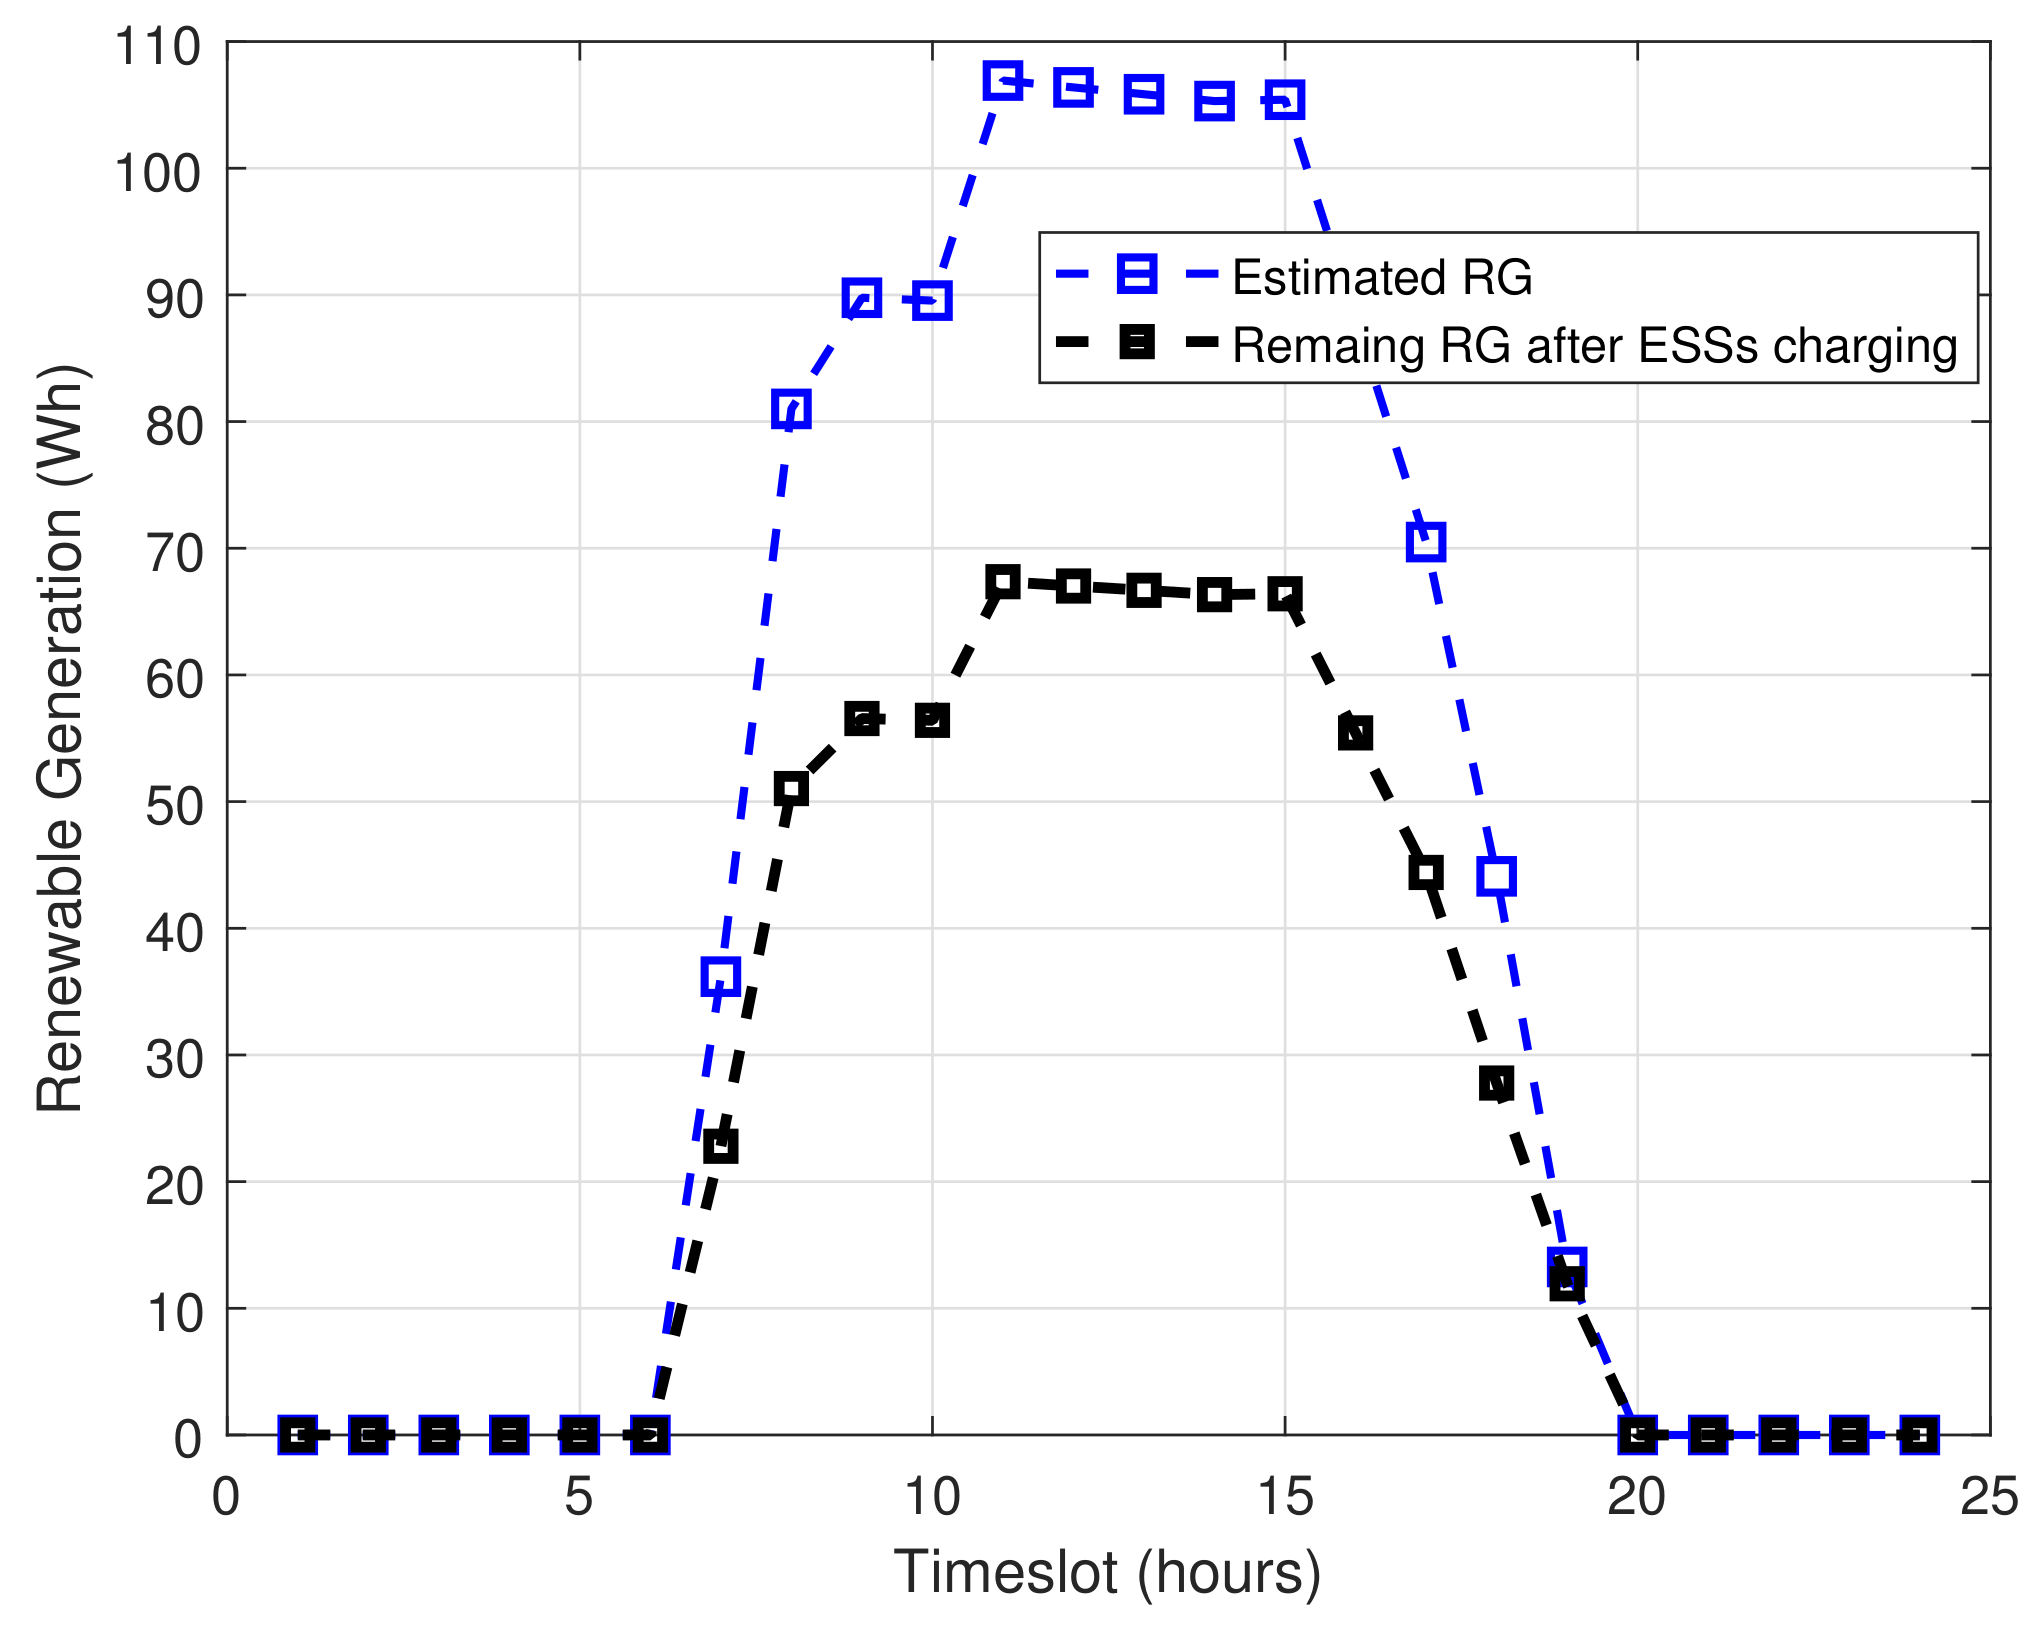
3.1.2. Renewable Power Generation Sources
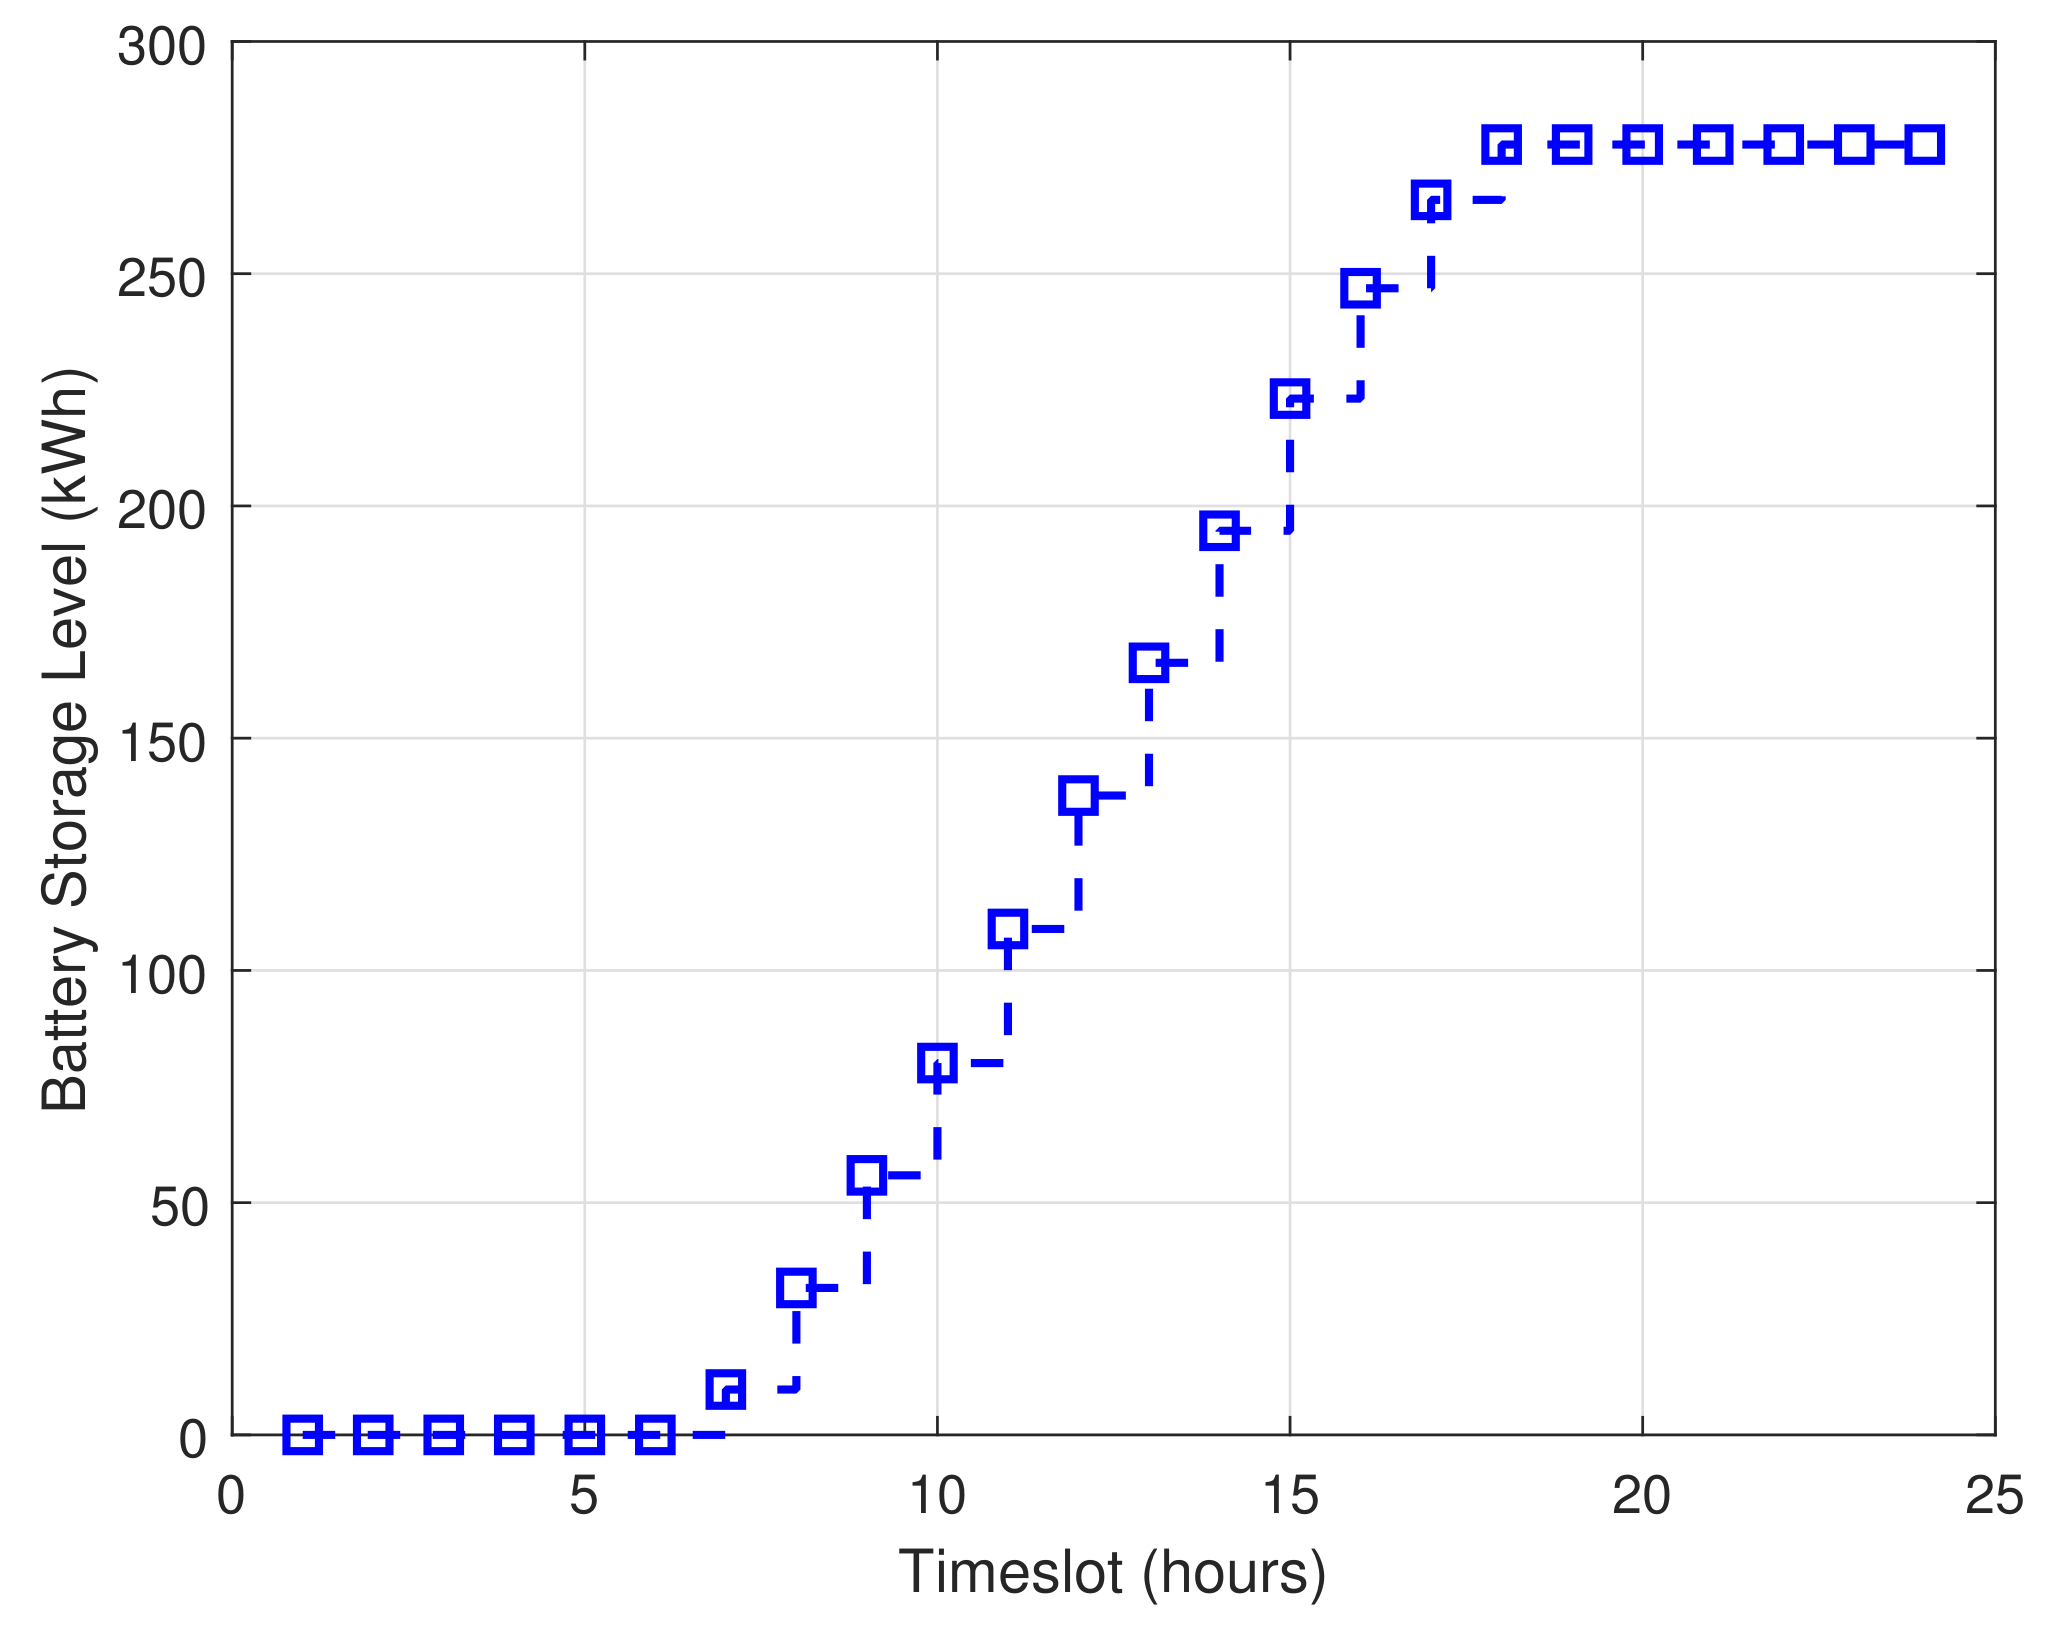
3.1.3. Batteries as Energy Storage System
3.1.4. Framework Outputs
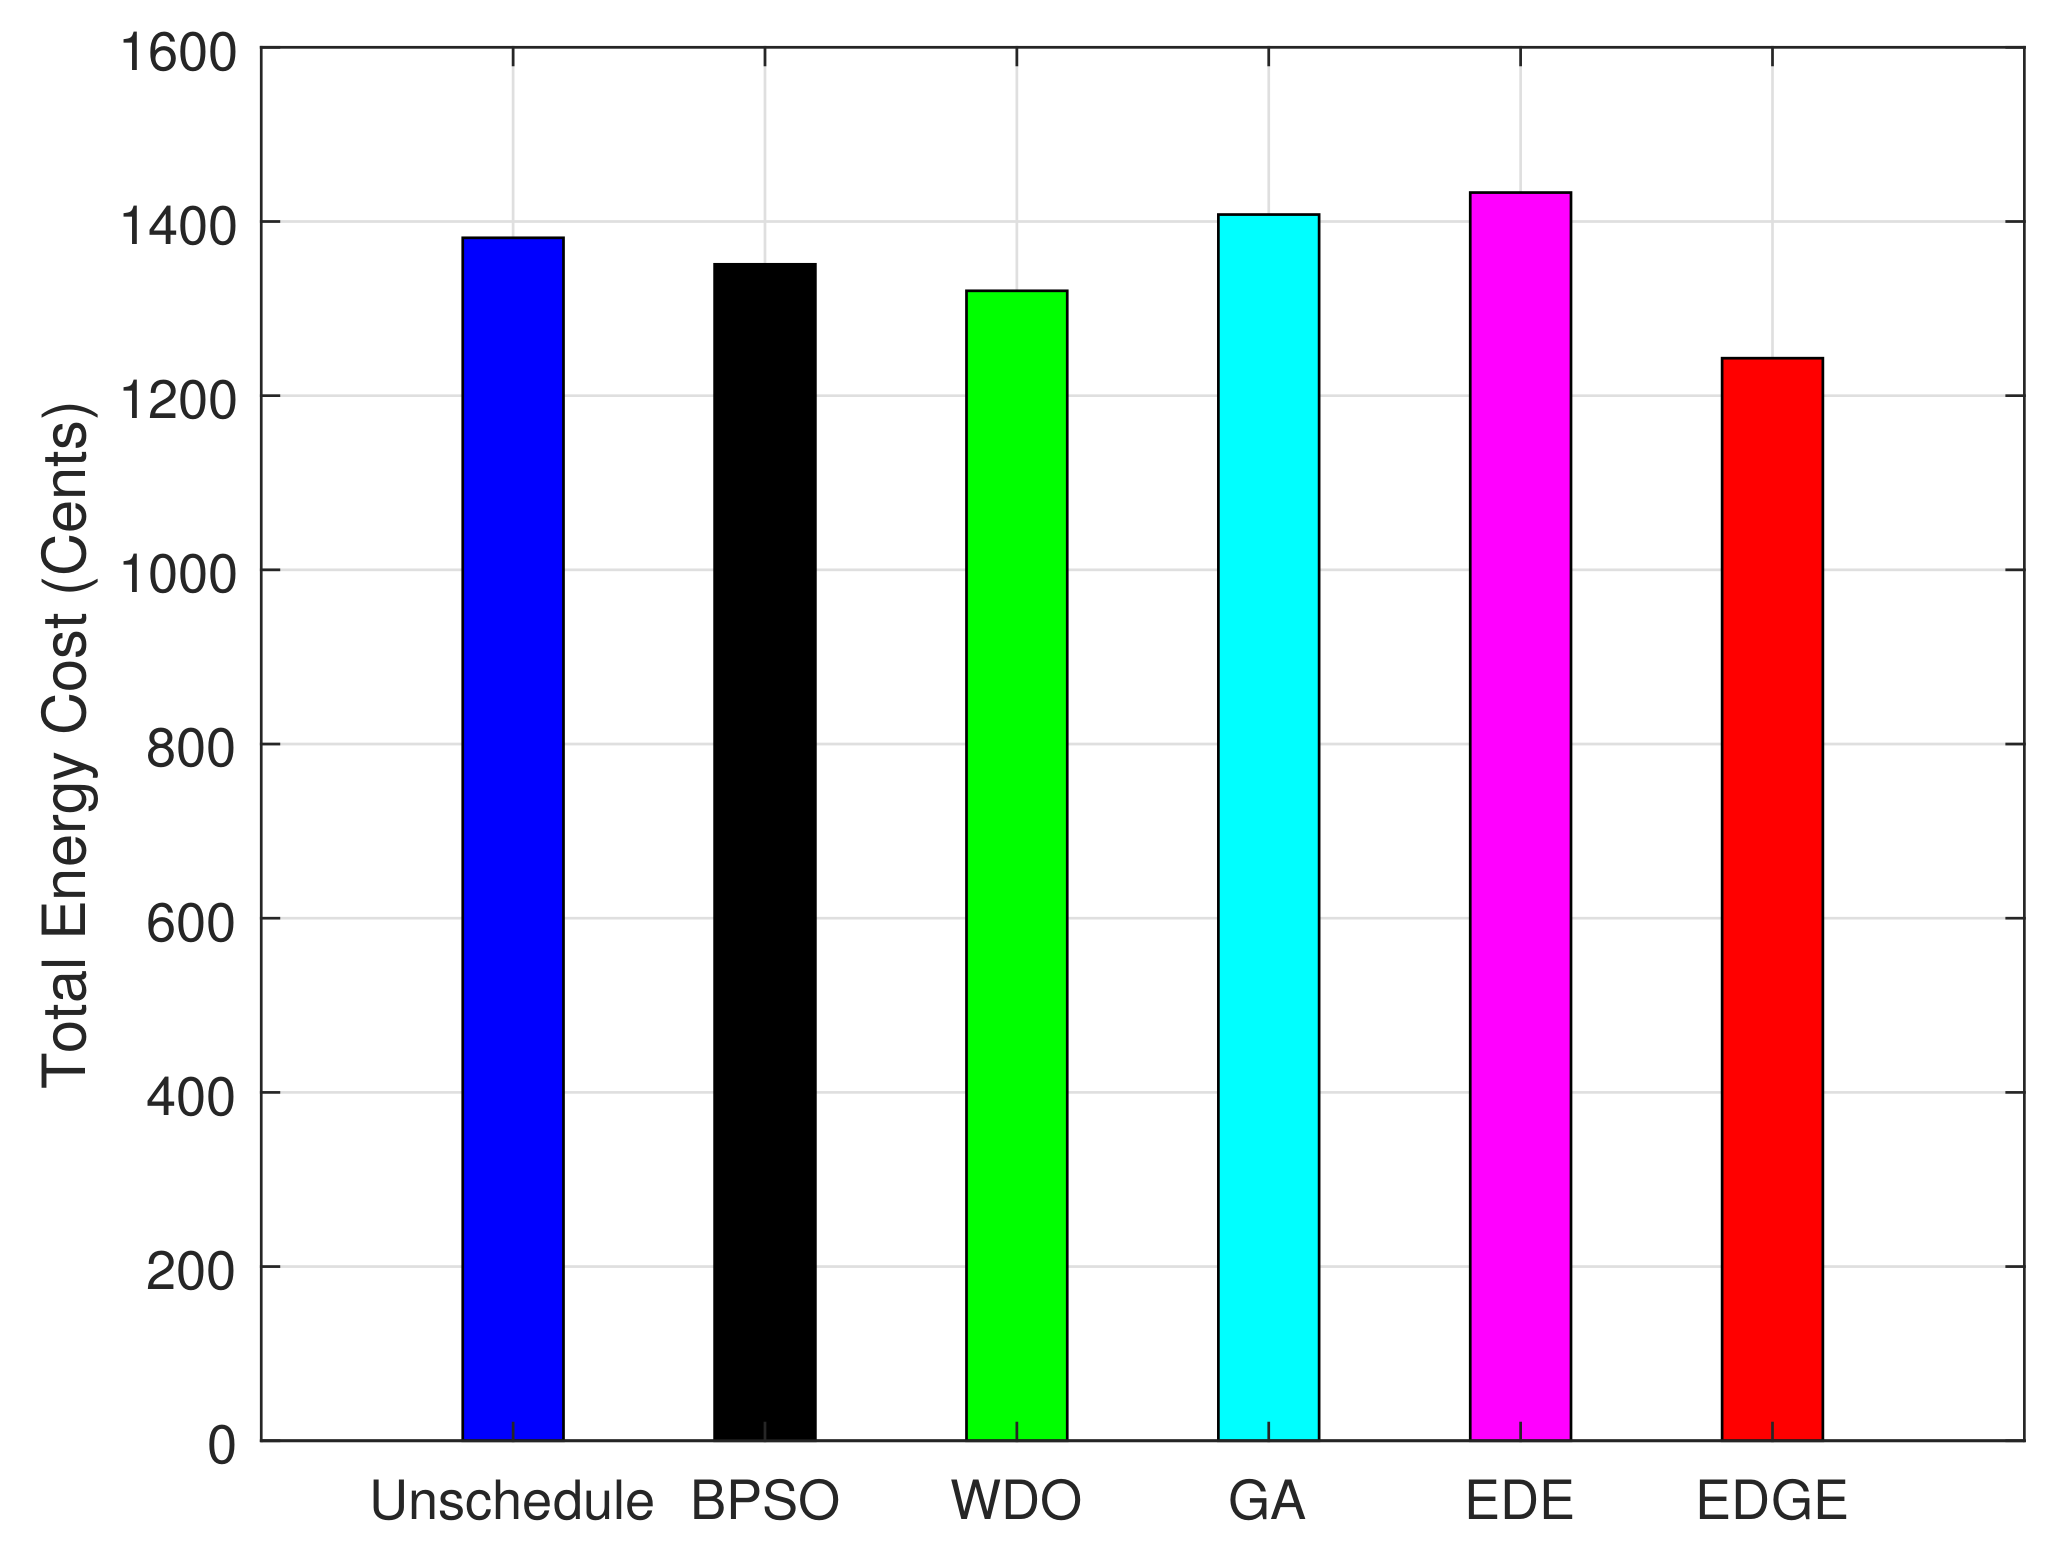
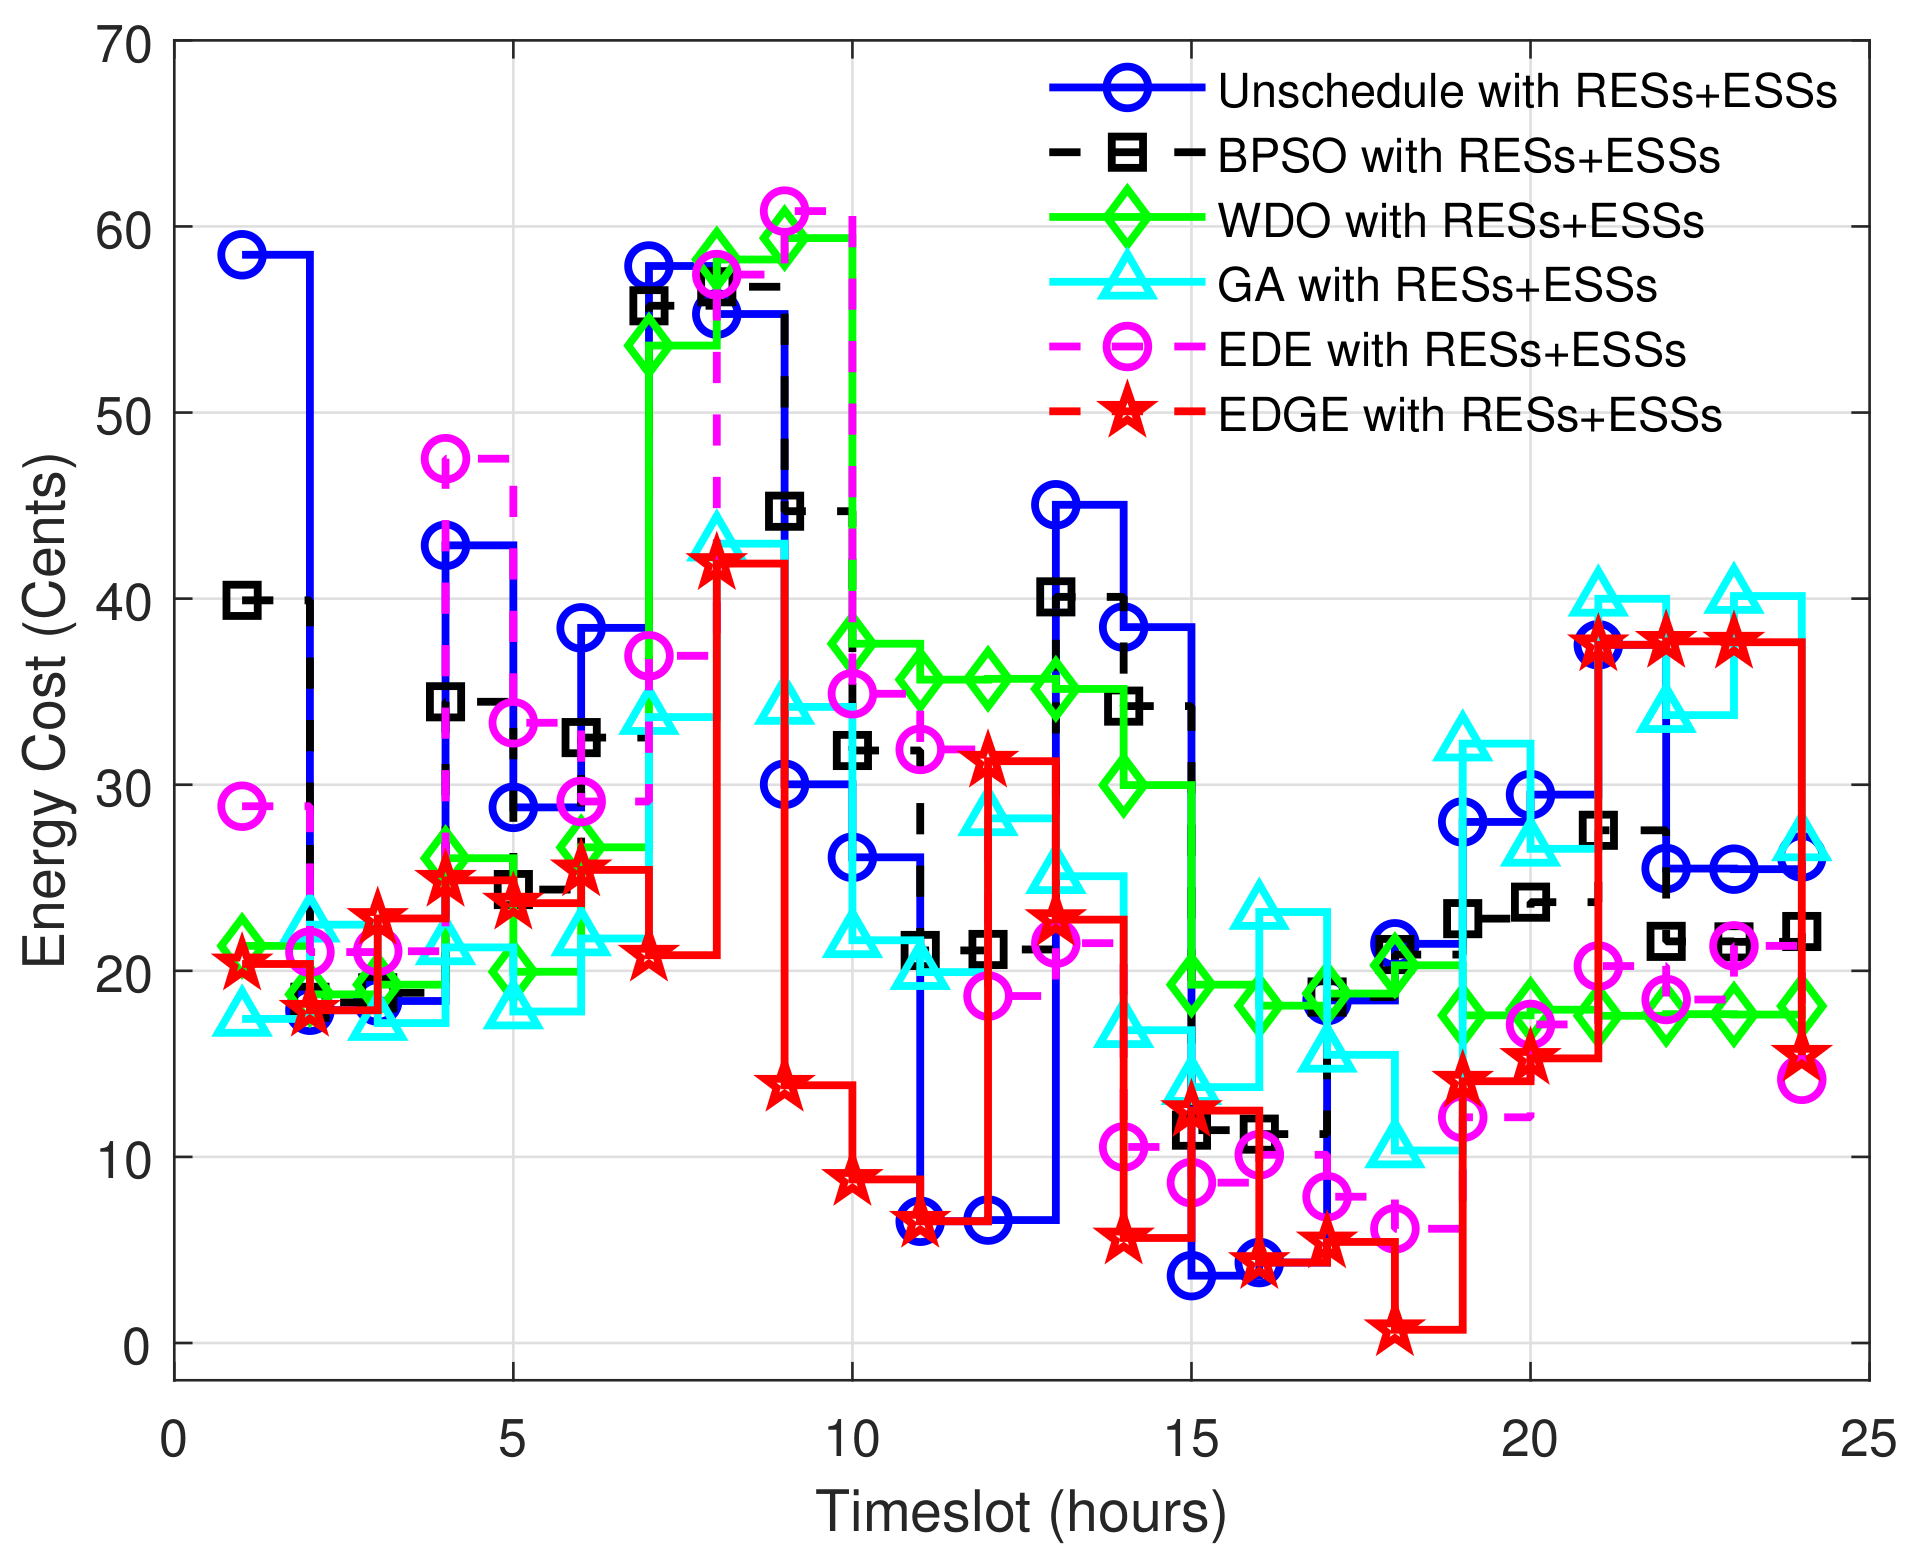
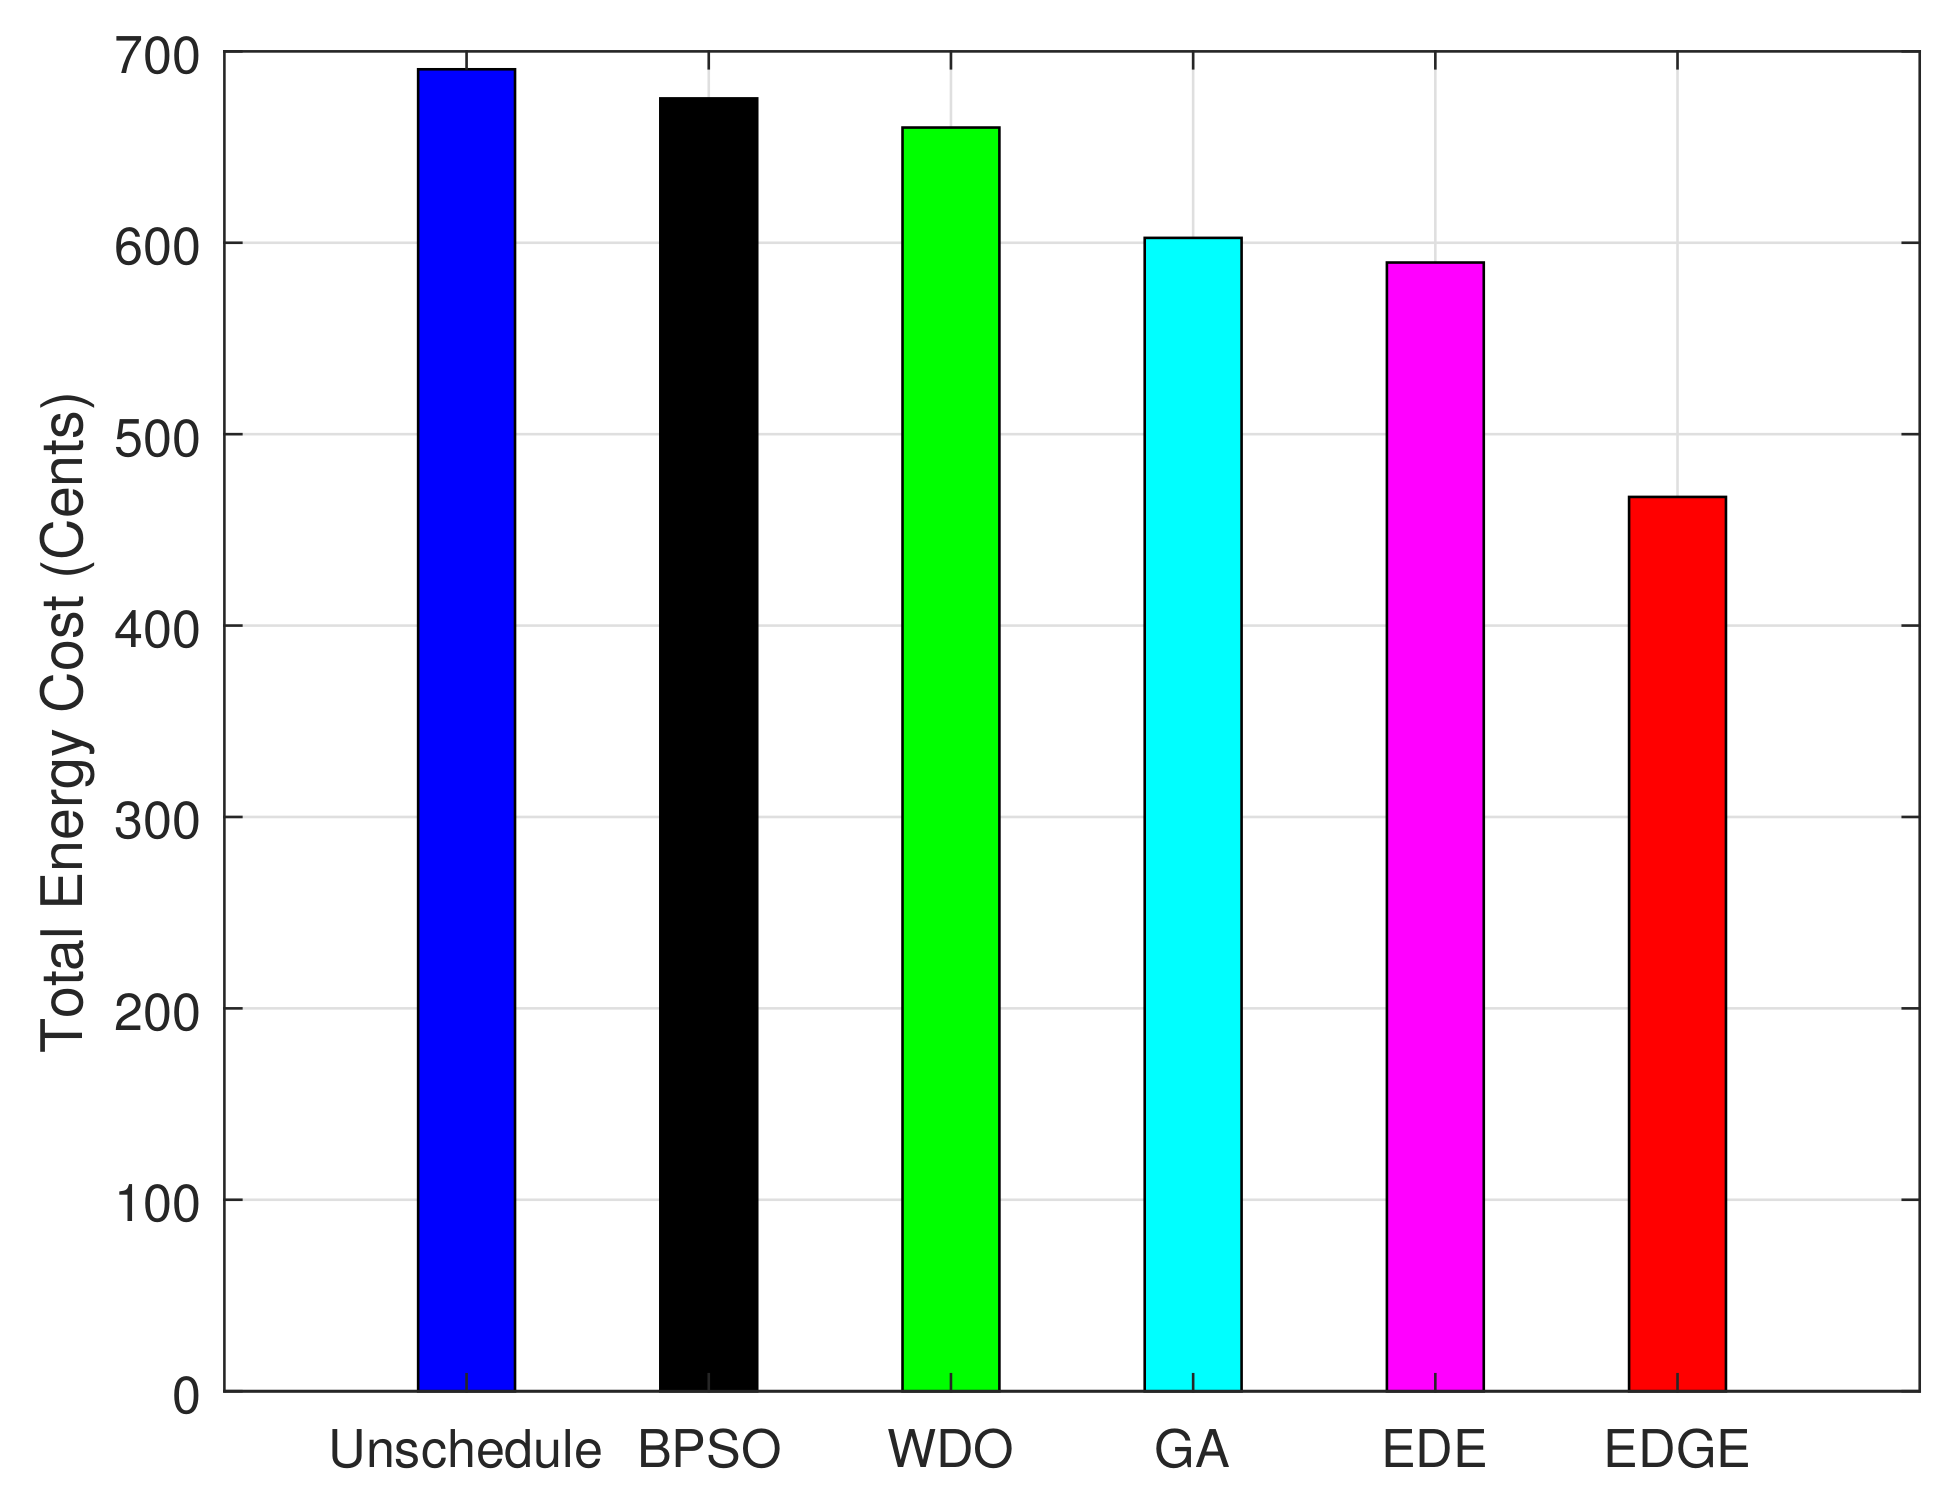
- Energy cost is a monetary bill to be paid by consumers to utility companies for consuming energy for a unit time horizon. The energy cost is computed using RTP signal broadcasted by utility company. In 2010 FERC recorded a note that consumers who utilized RTP signal of DR program for scheduling (shifting load from on- to off-peak timeslots) obtained 70% monetary savings in bill. The bill deposited by consumers to utility company for energy consumption with RTP signal is computed as follows:where in Equation (21) shows objective 1 which is energy cost that is to deposited by consumers to utility company. One of the major objectives is energy cost reduction. This objective is achieved via optimal energy consumption scheduling, which is achieved by the proposed EDGE algorithm.
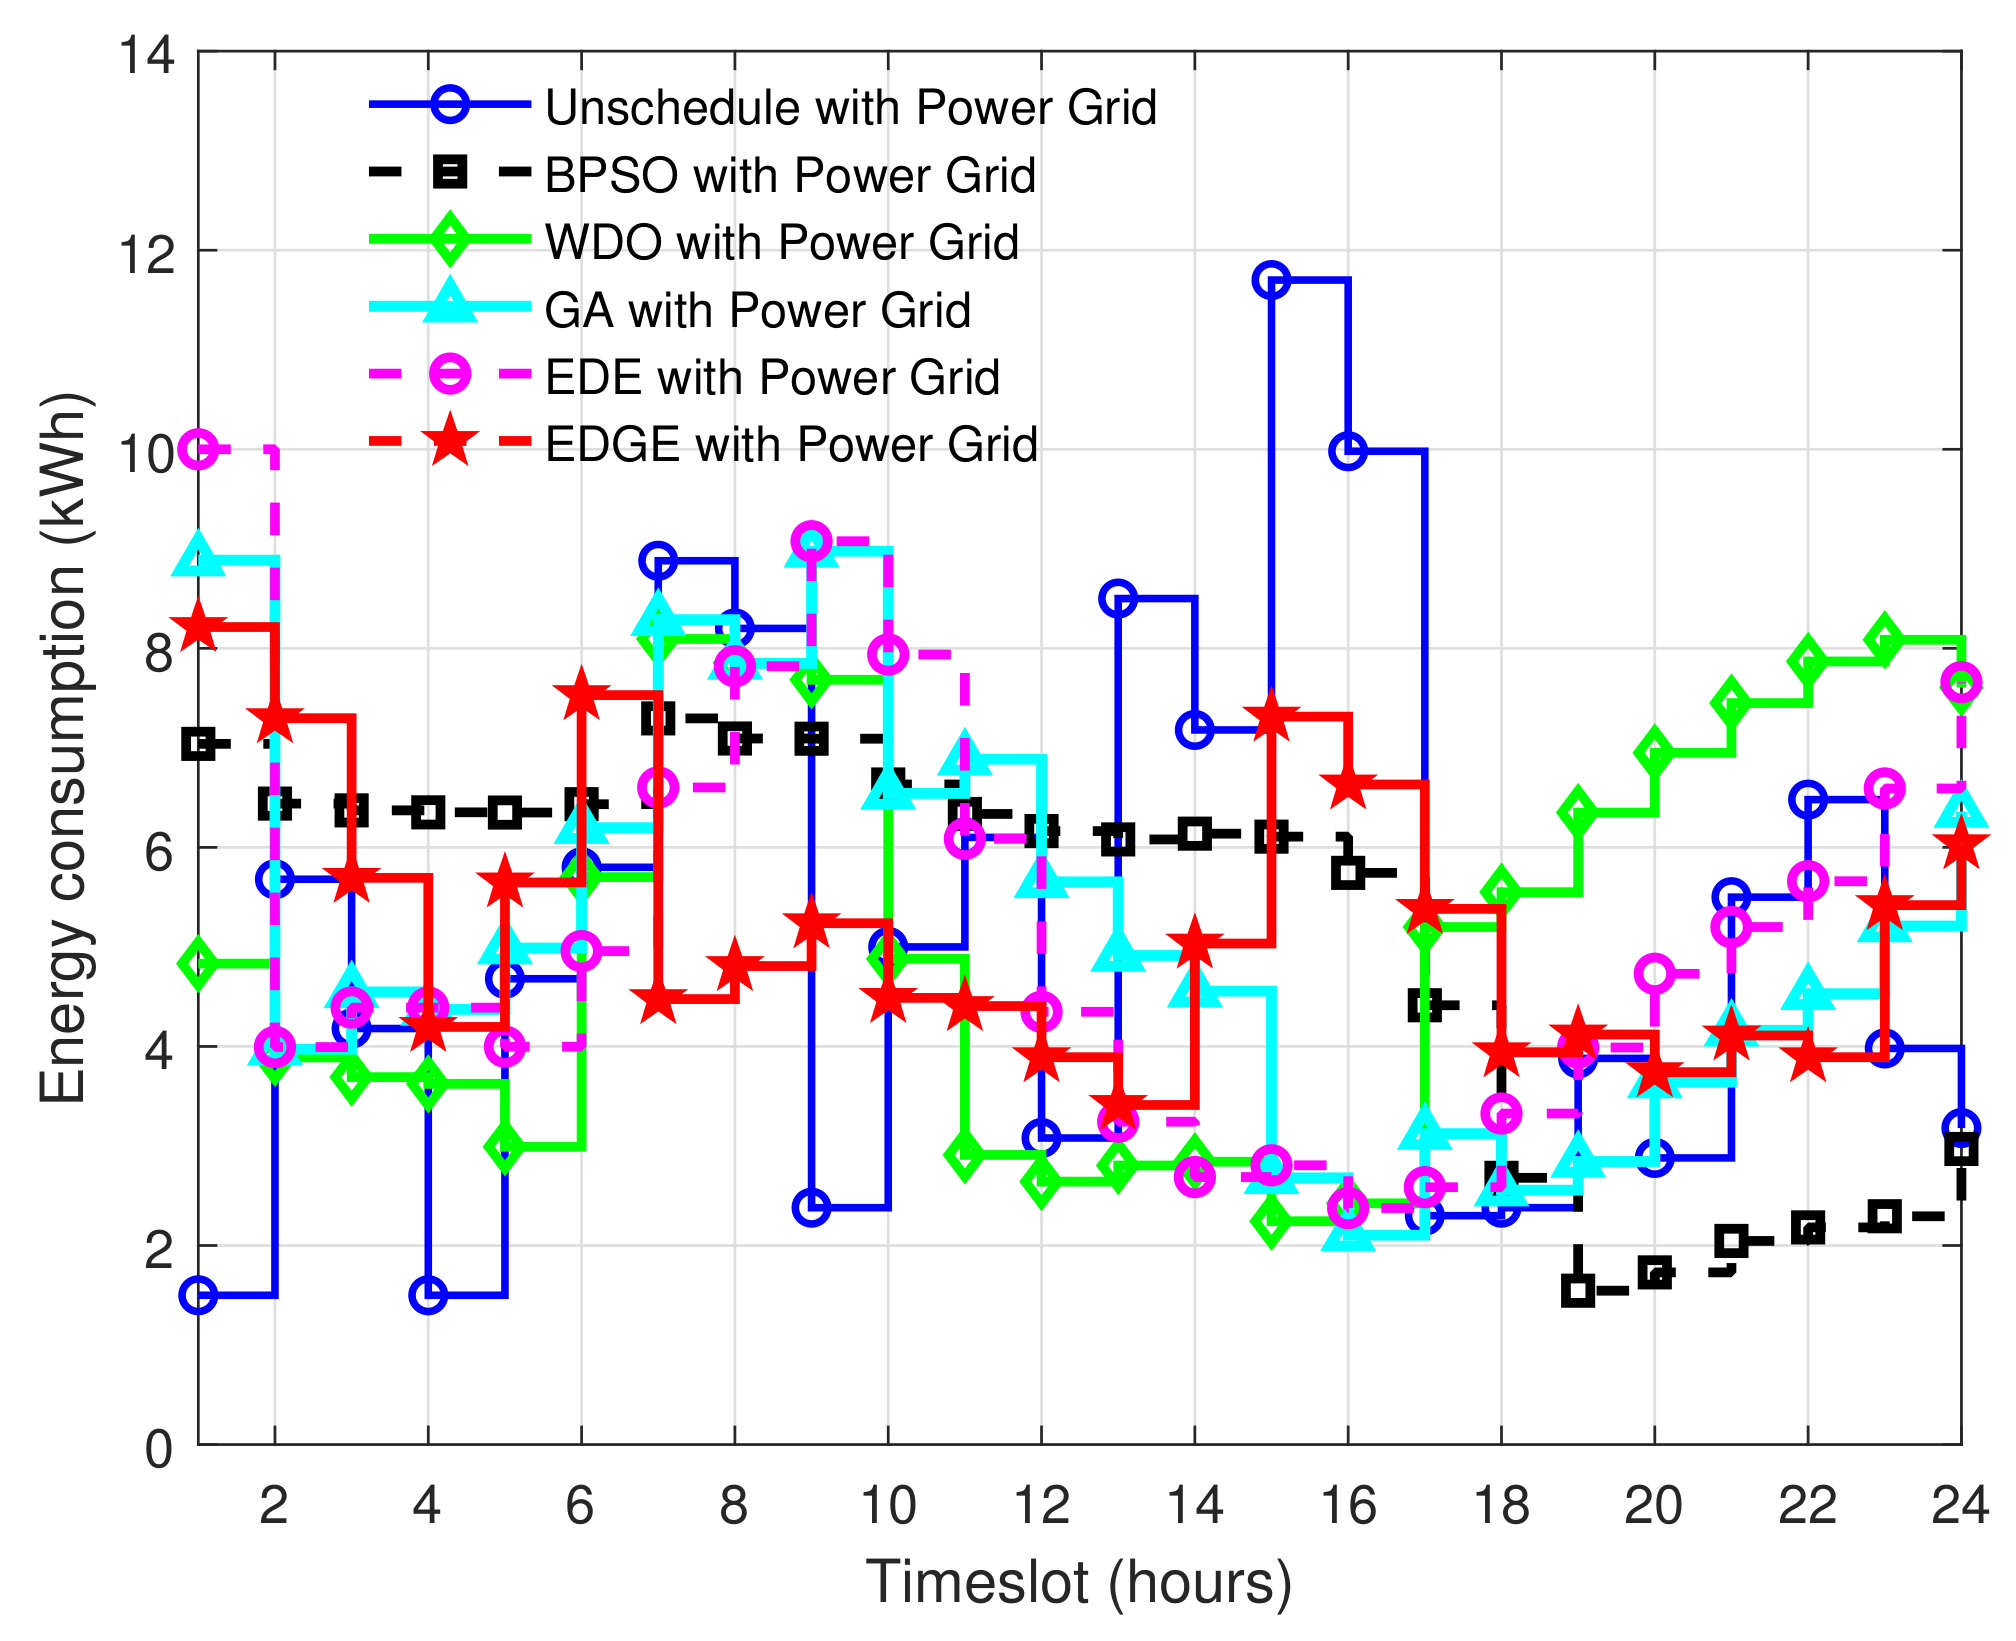
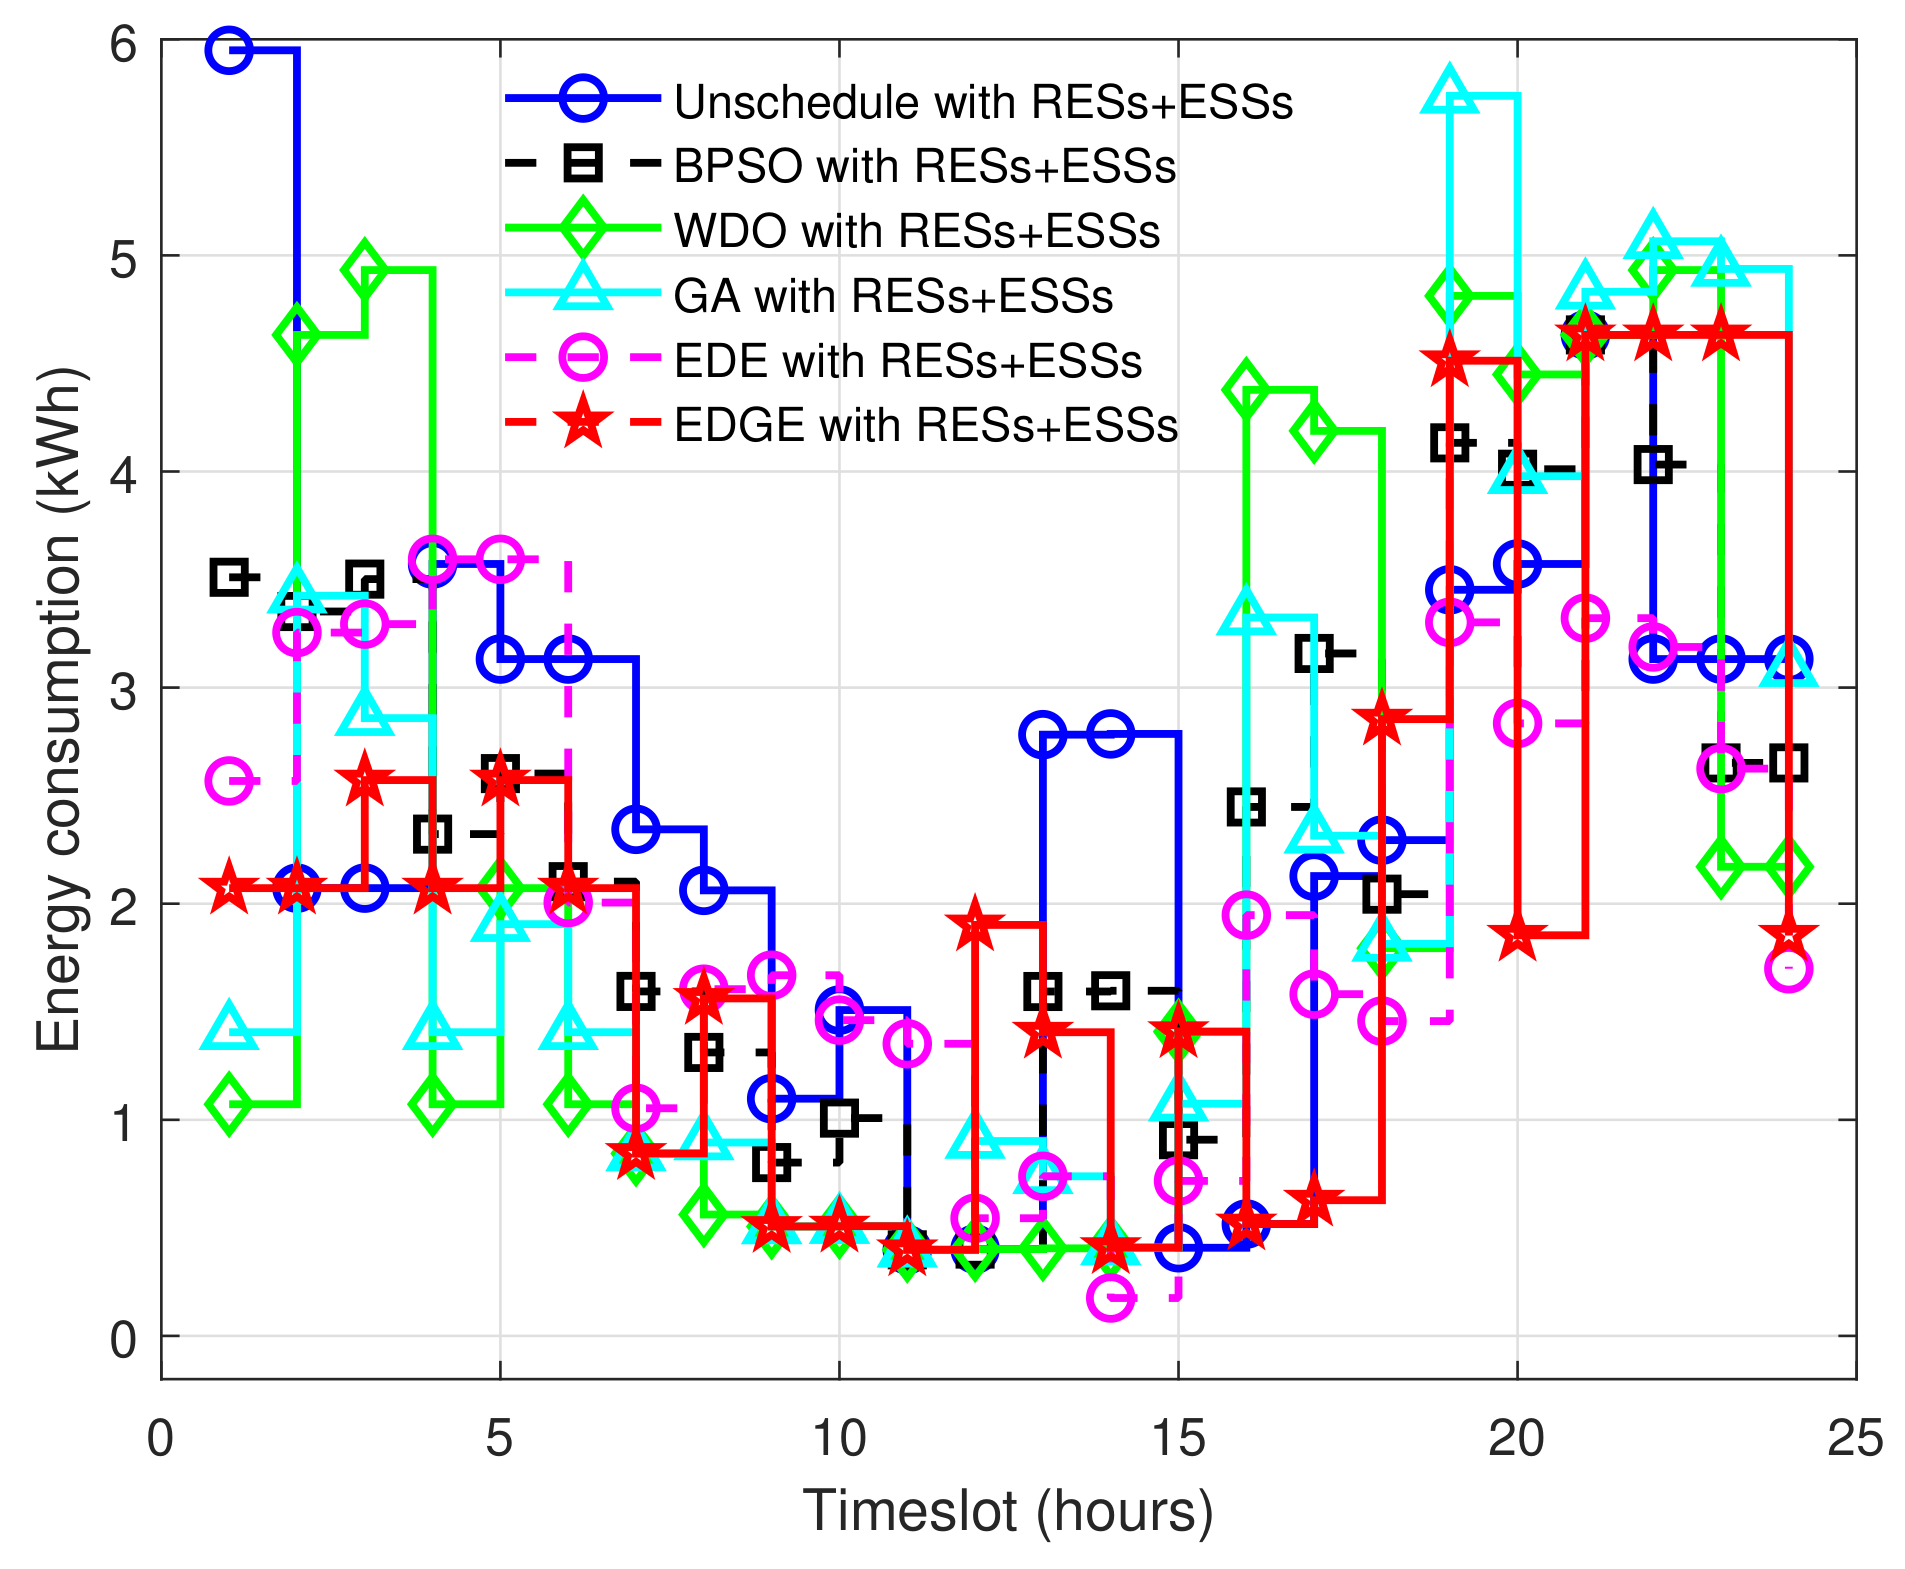
- Energy consumption is electricity that has used by consumers via operating appliances like interruptible, non-interruptible, hybrid appliances for specific activity and timeslot within a home.First interruptible appliances are also known as time adjustable appliances, and their per timeslot energy consumption is computed as follows.where is per timeslot energy consumption, shows power rating, and is status indicator for interruptible load. Net energy consumption of interruptible appliances is computed as follows.Energy consumption of non-interruptible appliances per timeslot is computed as follows:where represents energy consumption per timeslot t, denotes power rating, and is status indicator of non interruptible appliances. The total energy consumption per timeslot for all appliances is computed as follows:Thus, the net daily energy consumption of appliances within a home is formulated as follows:where and denote per day energy consumption of interruptible appliances and non-interruptible appliances, respectively, the represents the net energy consumption of appliances.
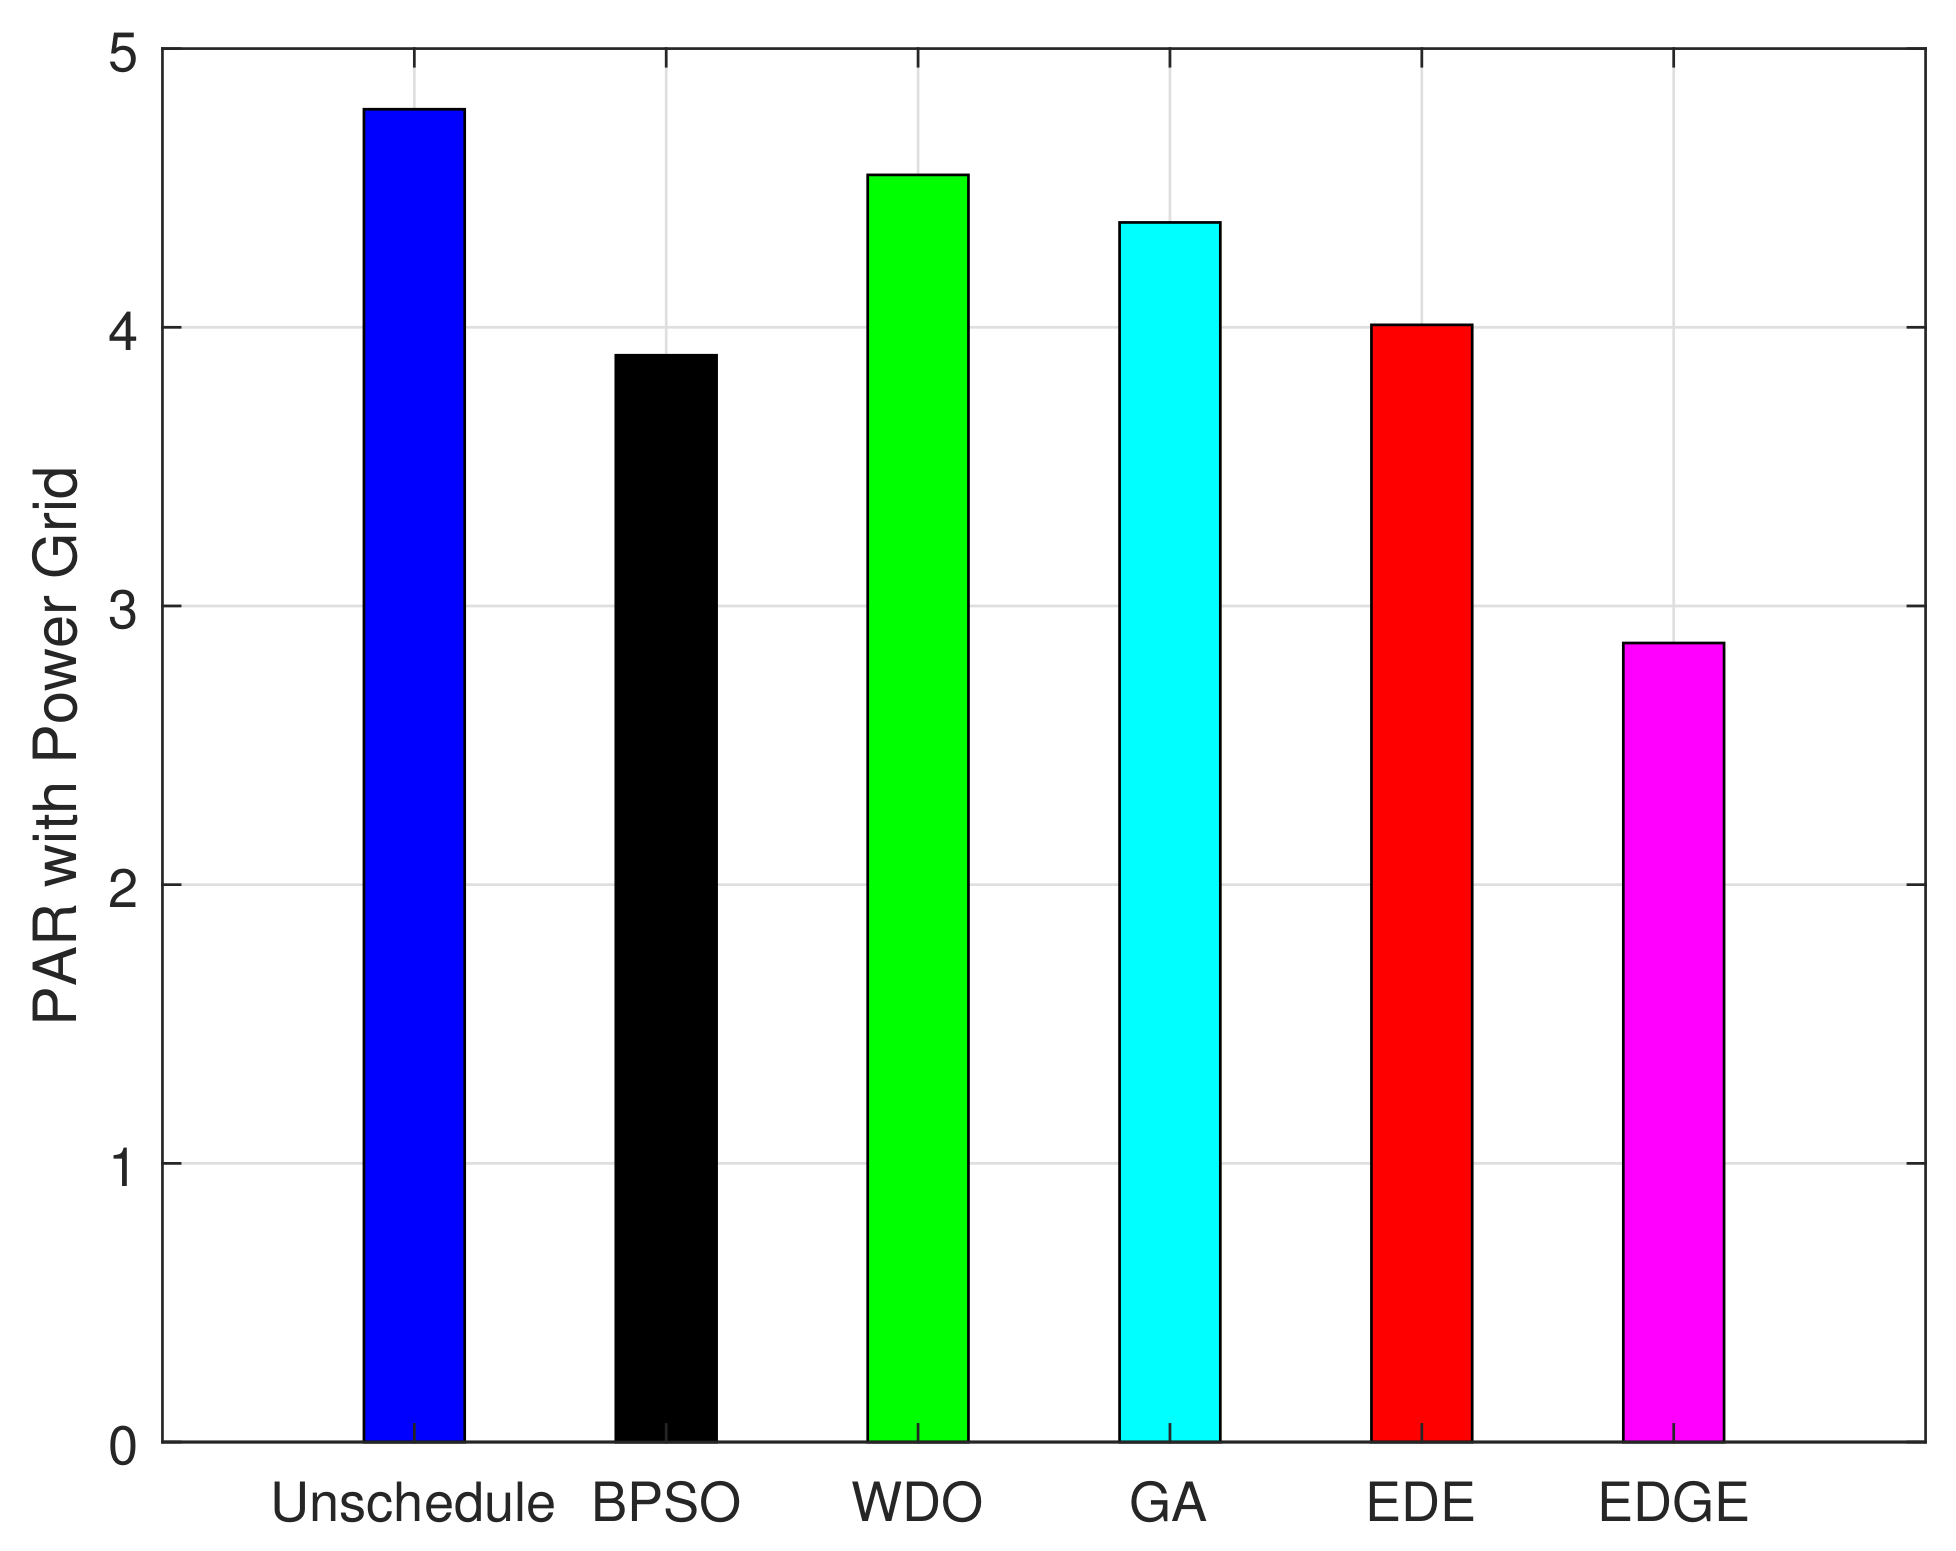
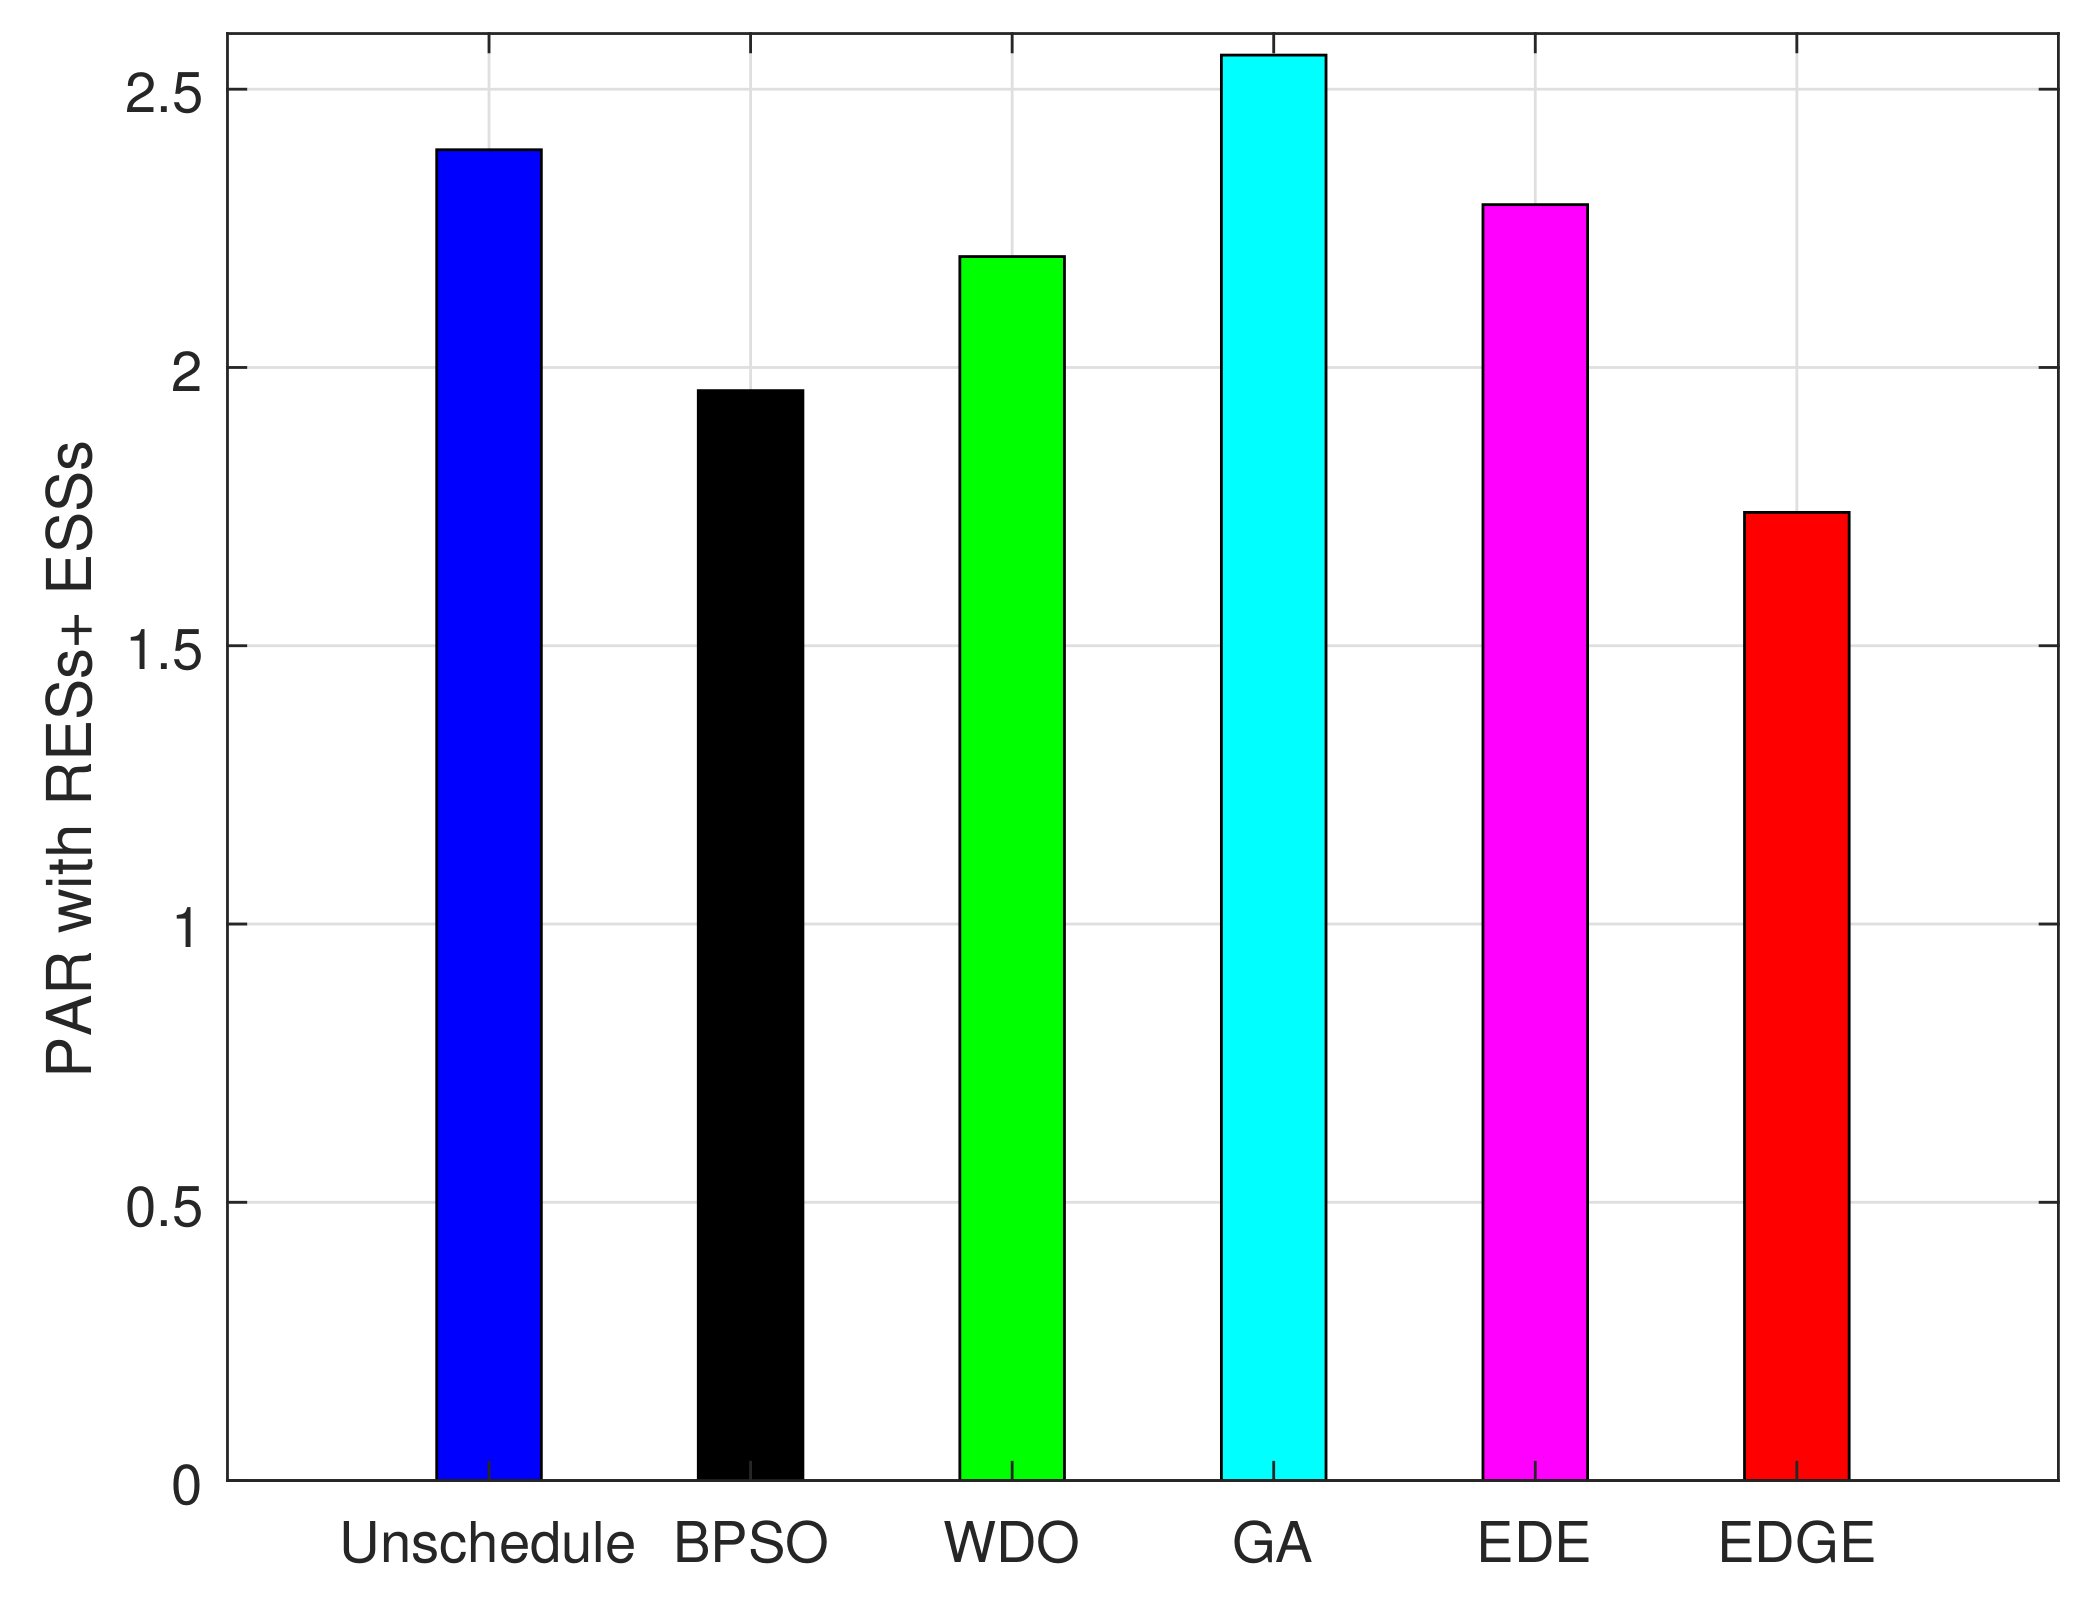
- PAR is a ratio of peak energy consumption to average energy consumption during a specific time horizon. Utility companies stimulate consumers to schedule load (shift energy consumption from on- to off-peak timeslots) to mitigate PAR, i.e., peak load to avoid peak power plants operation. PAR minimization is beneficial for a utility company and consumers for two reasons: smoothen out the load curve, alleviate peaks in the demand load curve, and minimize consumers energy cost. The PAR is computed as follows.where shows PAR, and represents net energy consumption.The PAR reduction is the third objective ultimate objective that enhances the stability of the power grid.
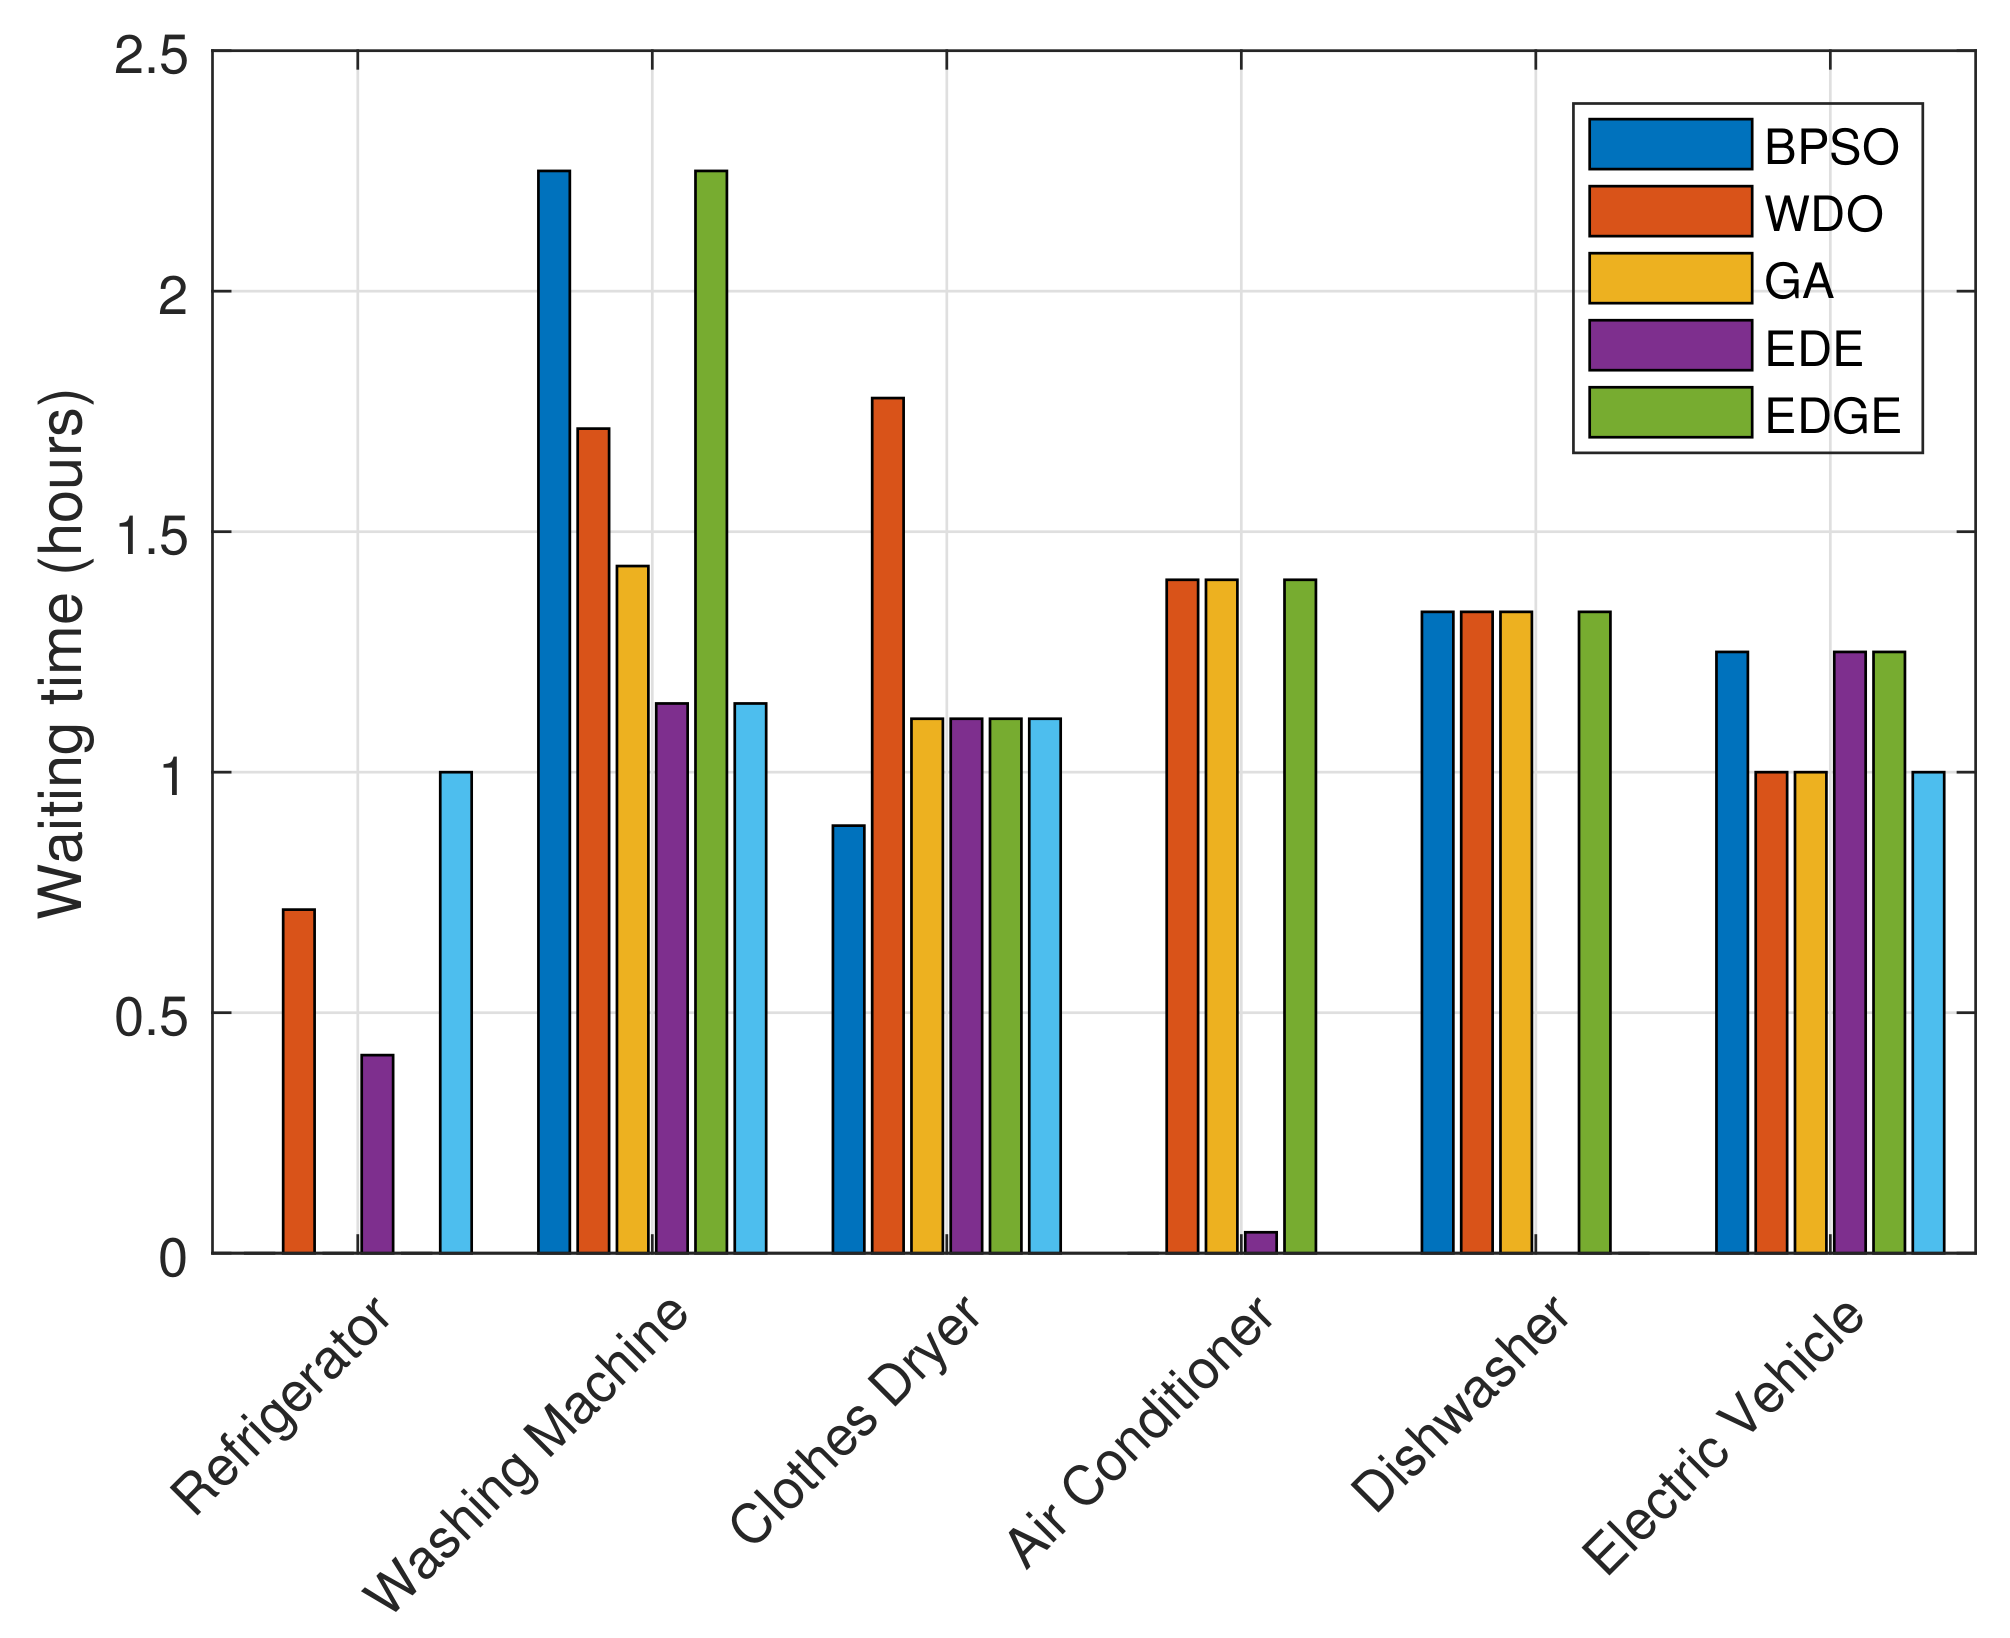
- User comfort can be measured in terms of delay time rate, energy usage, illumination, temperature, humidity, air quality, sound, and residents demographic profile [43,44]. User comfort in this work is measured in aspects of delay or waiting time a consumer confront for an activity when their loads are shifted from on- to off-peak timeslots. The users face frustration/discomfort when their loads are shifted from on- to off-peak timeslots. Trade-off exists between energy cost and waiting time, when energy cost reduces waiting time, will be increasing and vice versa. The user comfort in aspects of waiting time is computed as:where is waiting time/delay that an appliance a face due to scheduling, is before scheduling status of an appliance, is after scheduling status of an appliance, and is net operation time. The EMC based on the EDGE algorithm shifts the load from on- to off-peak timeslots in reply to RTP tariff and consumer’s priority. A maximum waiting time/delay time rate that consumers can endure is computed as follows.where denotes maximum delay users face in shifting load from on- to off-peak timeslots, and is net time interval. The user discomfort is maximum when = ; usually, this case does not happen (worst case). The user discomfort in % is computed below.Waiting time and energy cost are two conflicting objectives. Some customers are interested in energy costs, and some want to use the appliance as soon as possible. Customers have to pay more to complete his task sooner and vice versa.
- Multiple objective optimization: The above mentioned individual objective function, some of these are used simultaneously in HEMS. The general representation of a multi-objective function is as follows.where , , , and represent objective functions of energy cost, energy consumption, PAR and user comfort, respectively. The , , and denote weighting factors associated with objective functions. Weights decide which objective is to choose, thus giving a sense of interest and motivation. The multi-objective function aims to simultaneously solve multiple objective optimization problems considering user priorities and preferences.
4. Proposed and Existing Algorithms
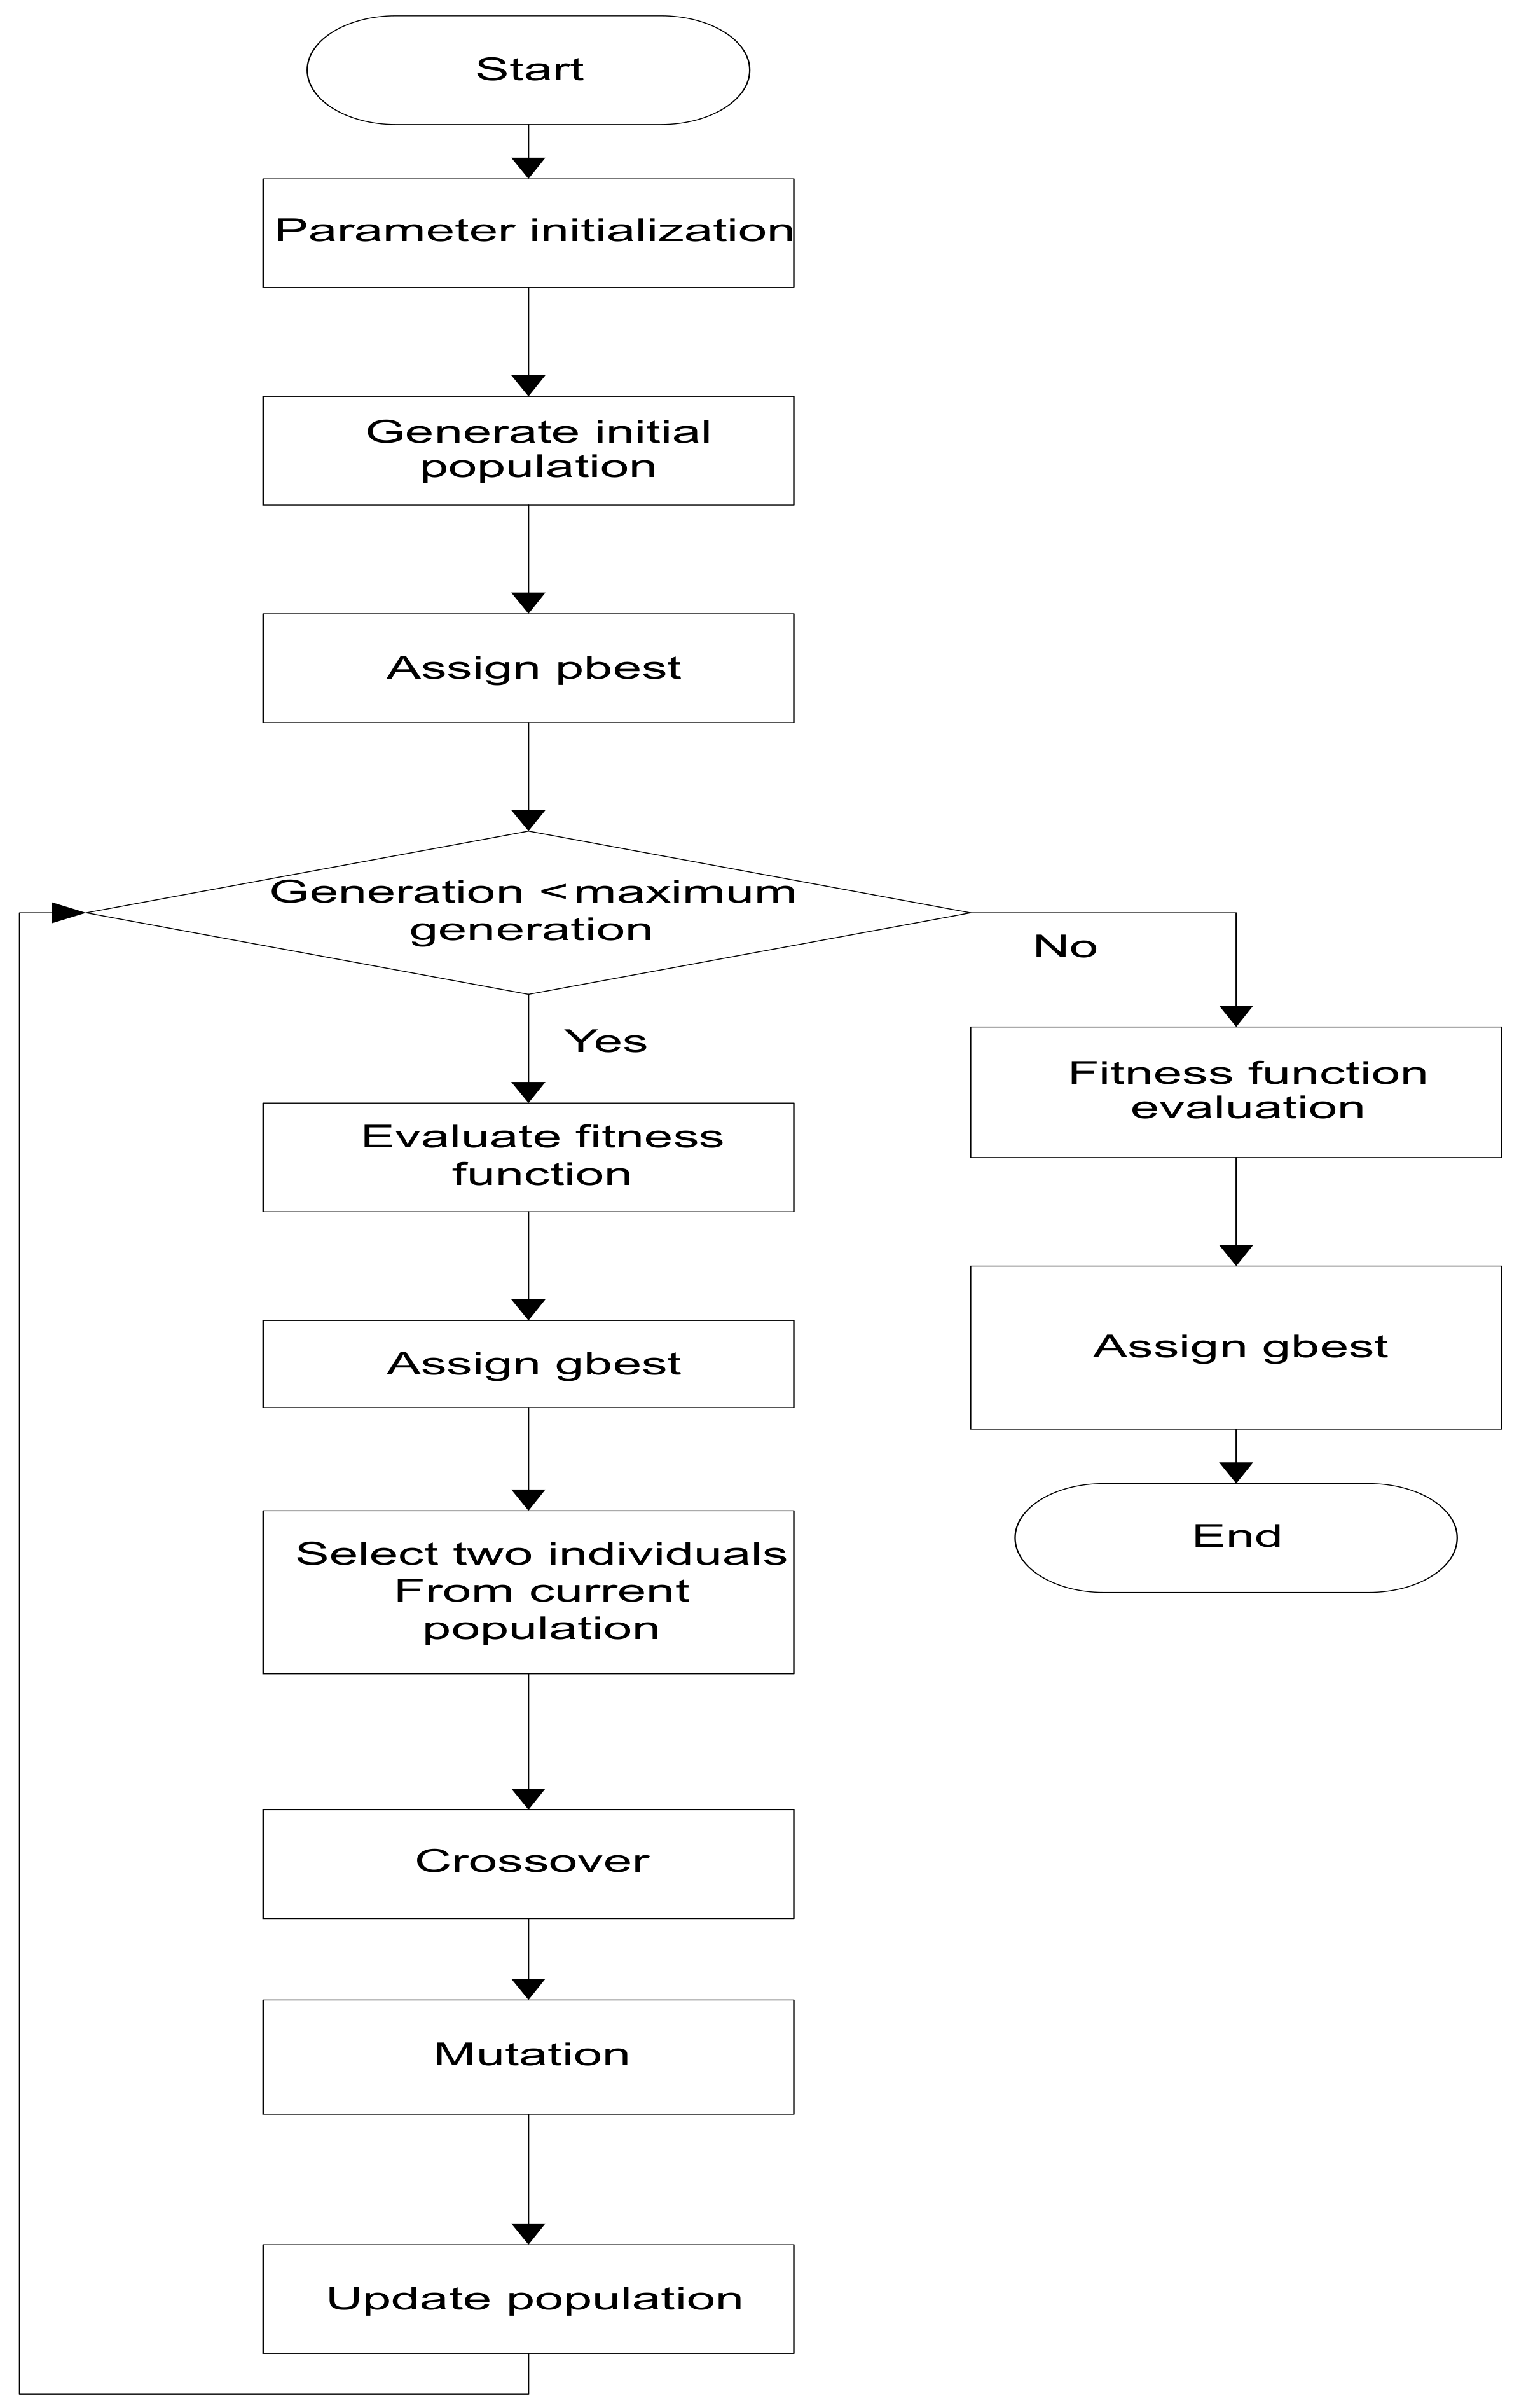
4.1. GA
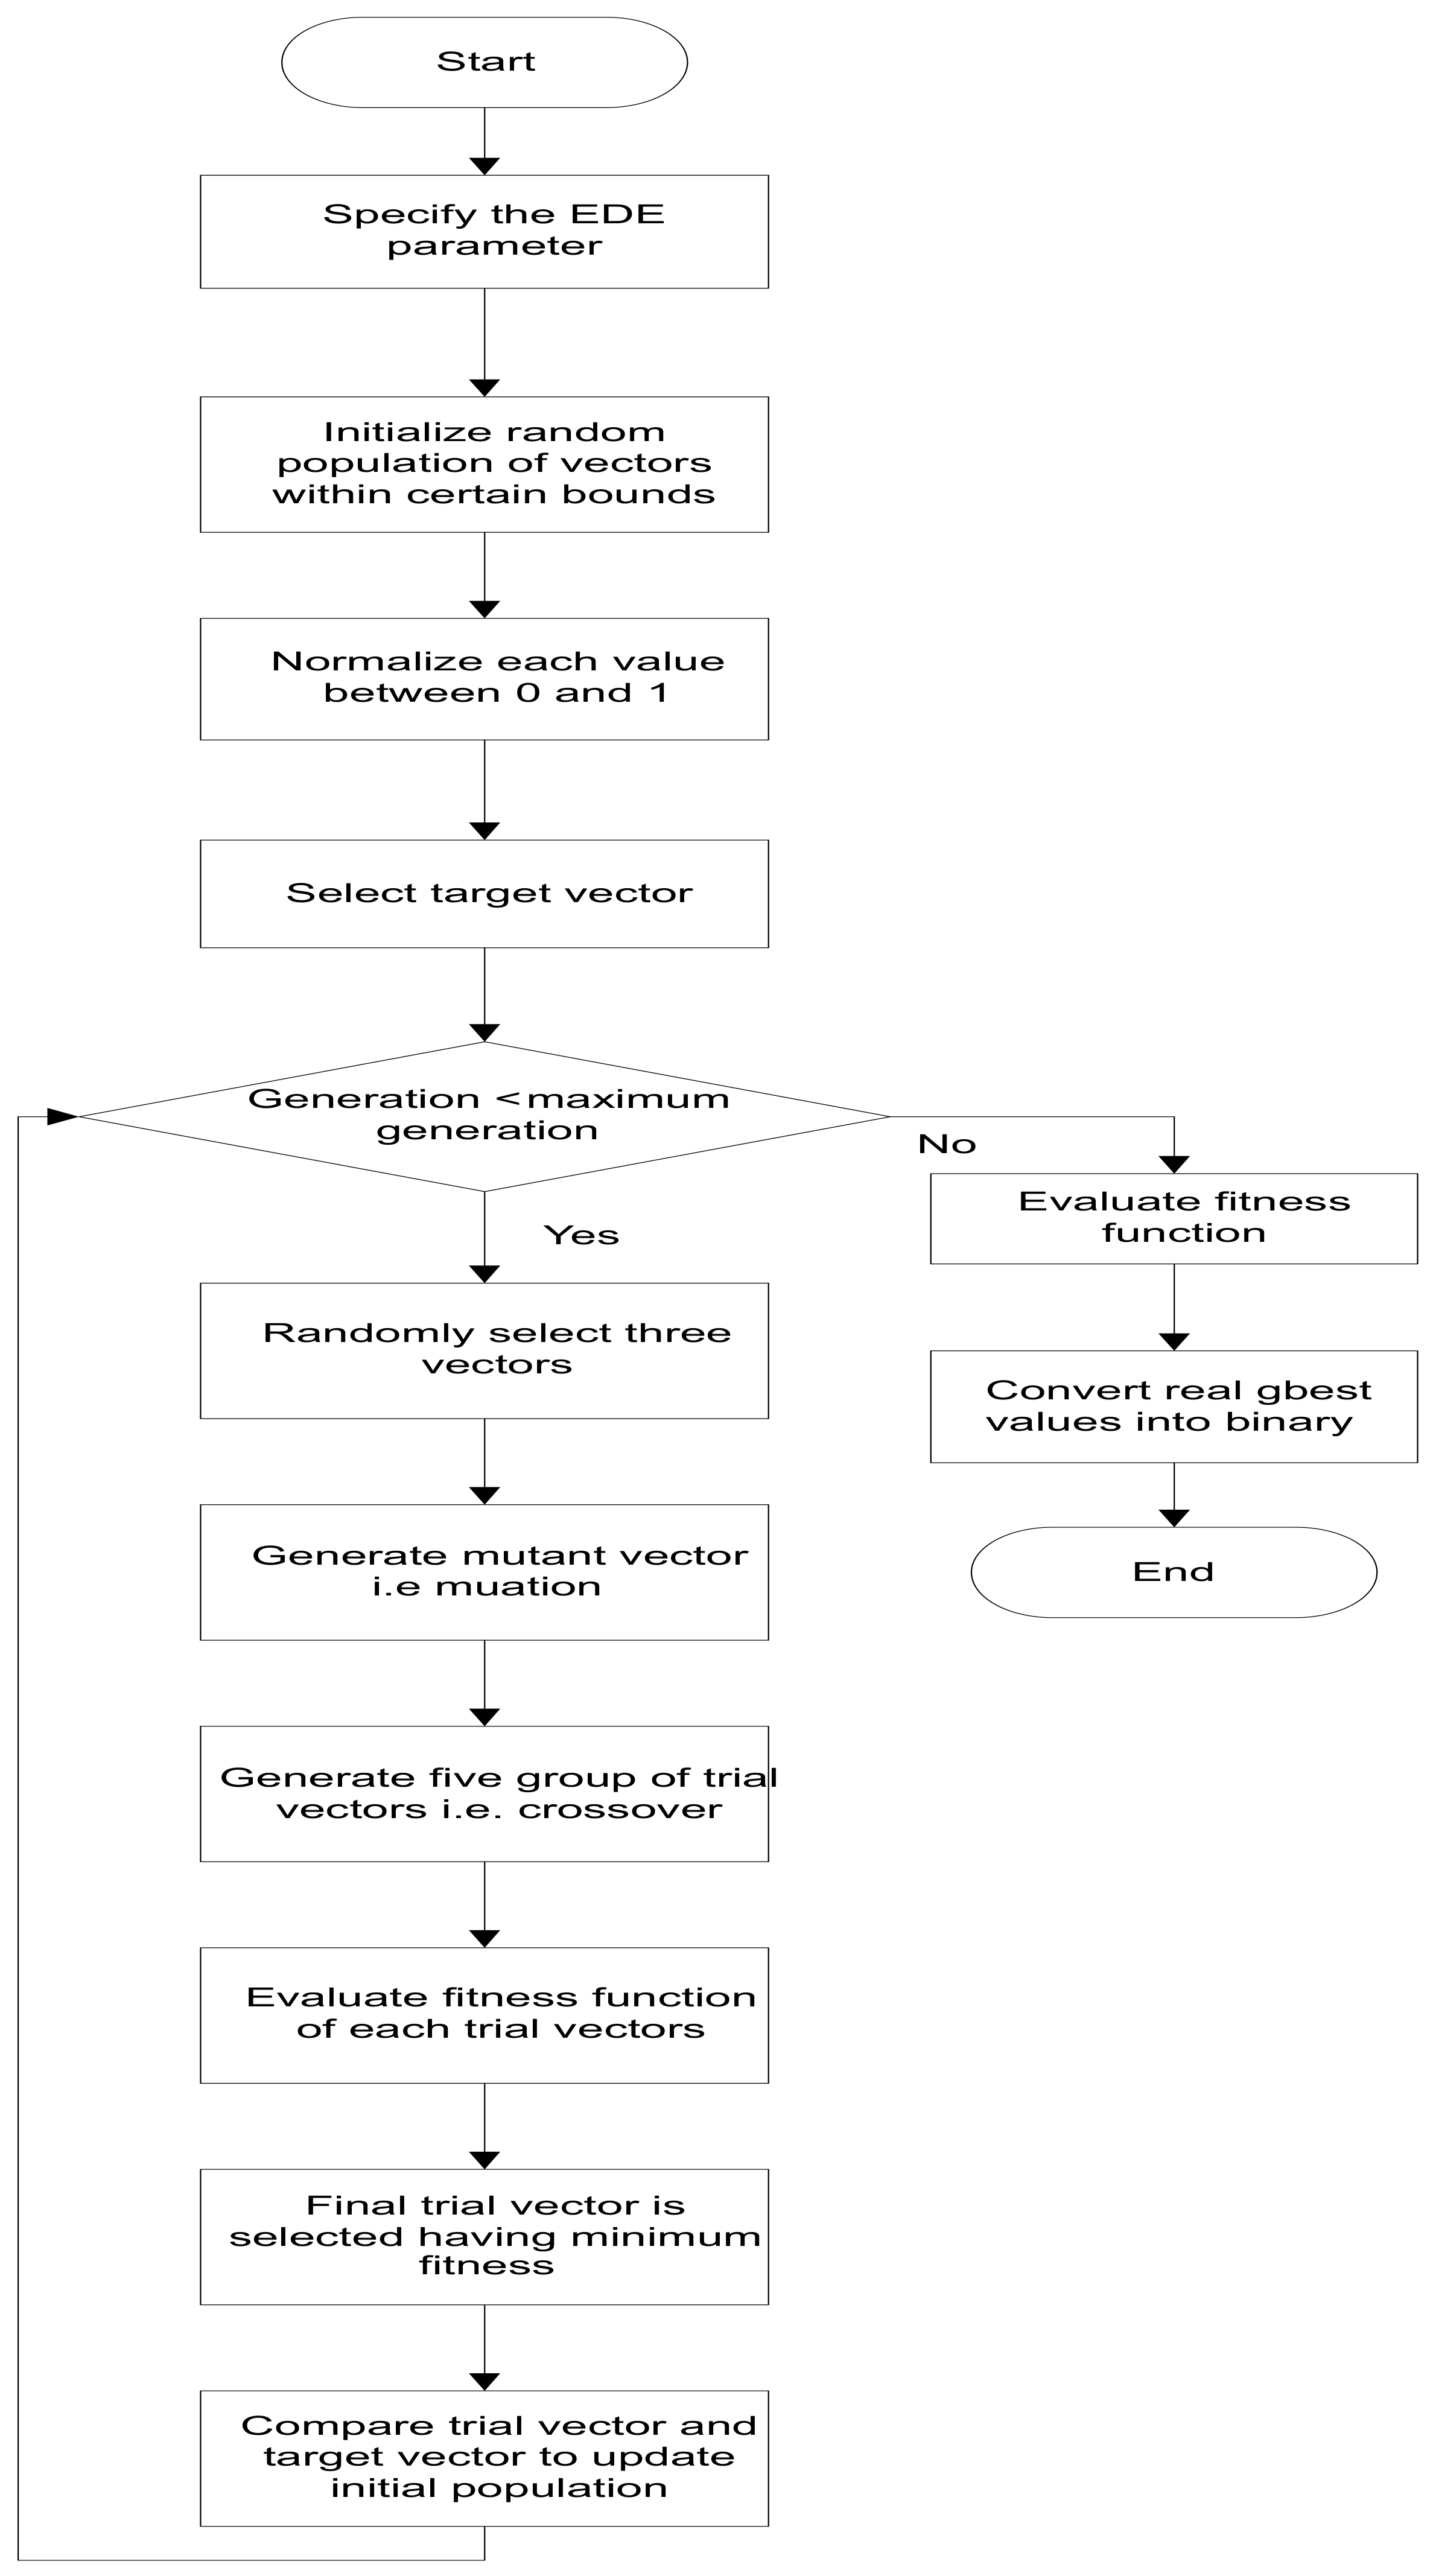
4.2. EDE
4.3. Proposed EDGE Algorithm
5. Simulations and Discussion
5.1. Case Study I: With Power Grid Only
5.1.1. Generated Power Usage Schedule Pattern for Energy Cost Minimization
5.1.2. PAR
5.2. Case Study II: With RESs and ESSs
5.2.1. Energy Cost per Timeslot and Net Minimization Evaluation
5.2.2. PAR Minimization Evaluation
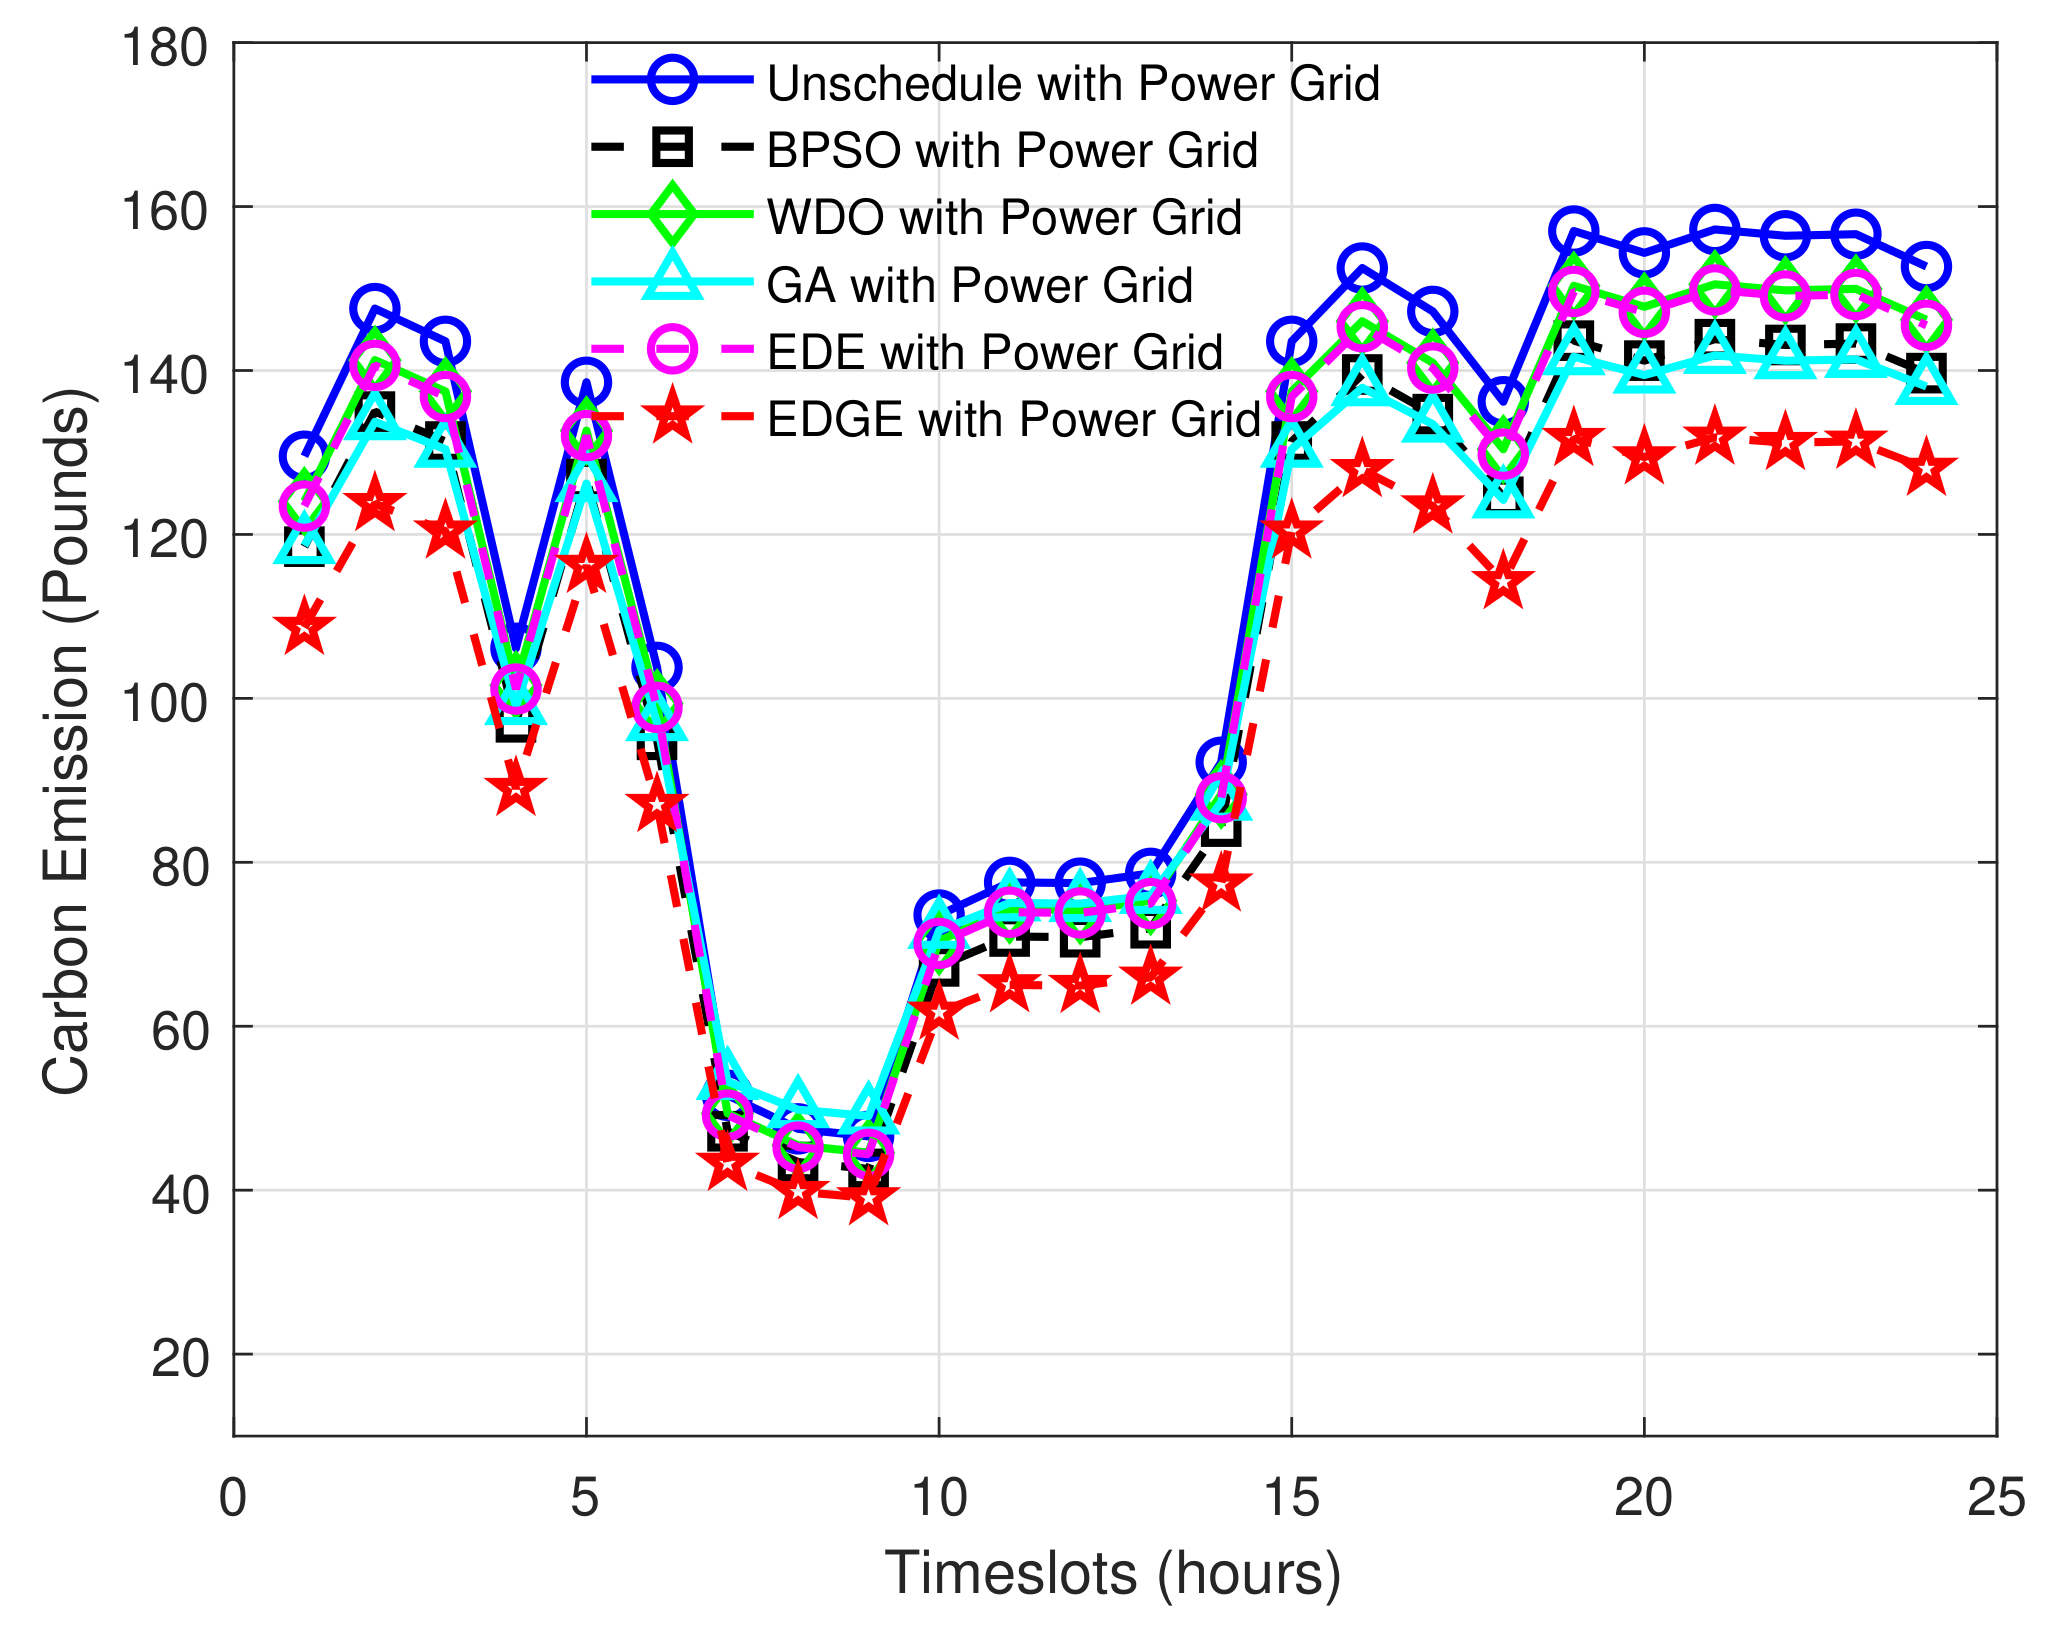
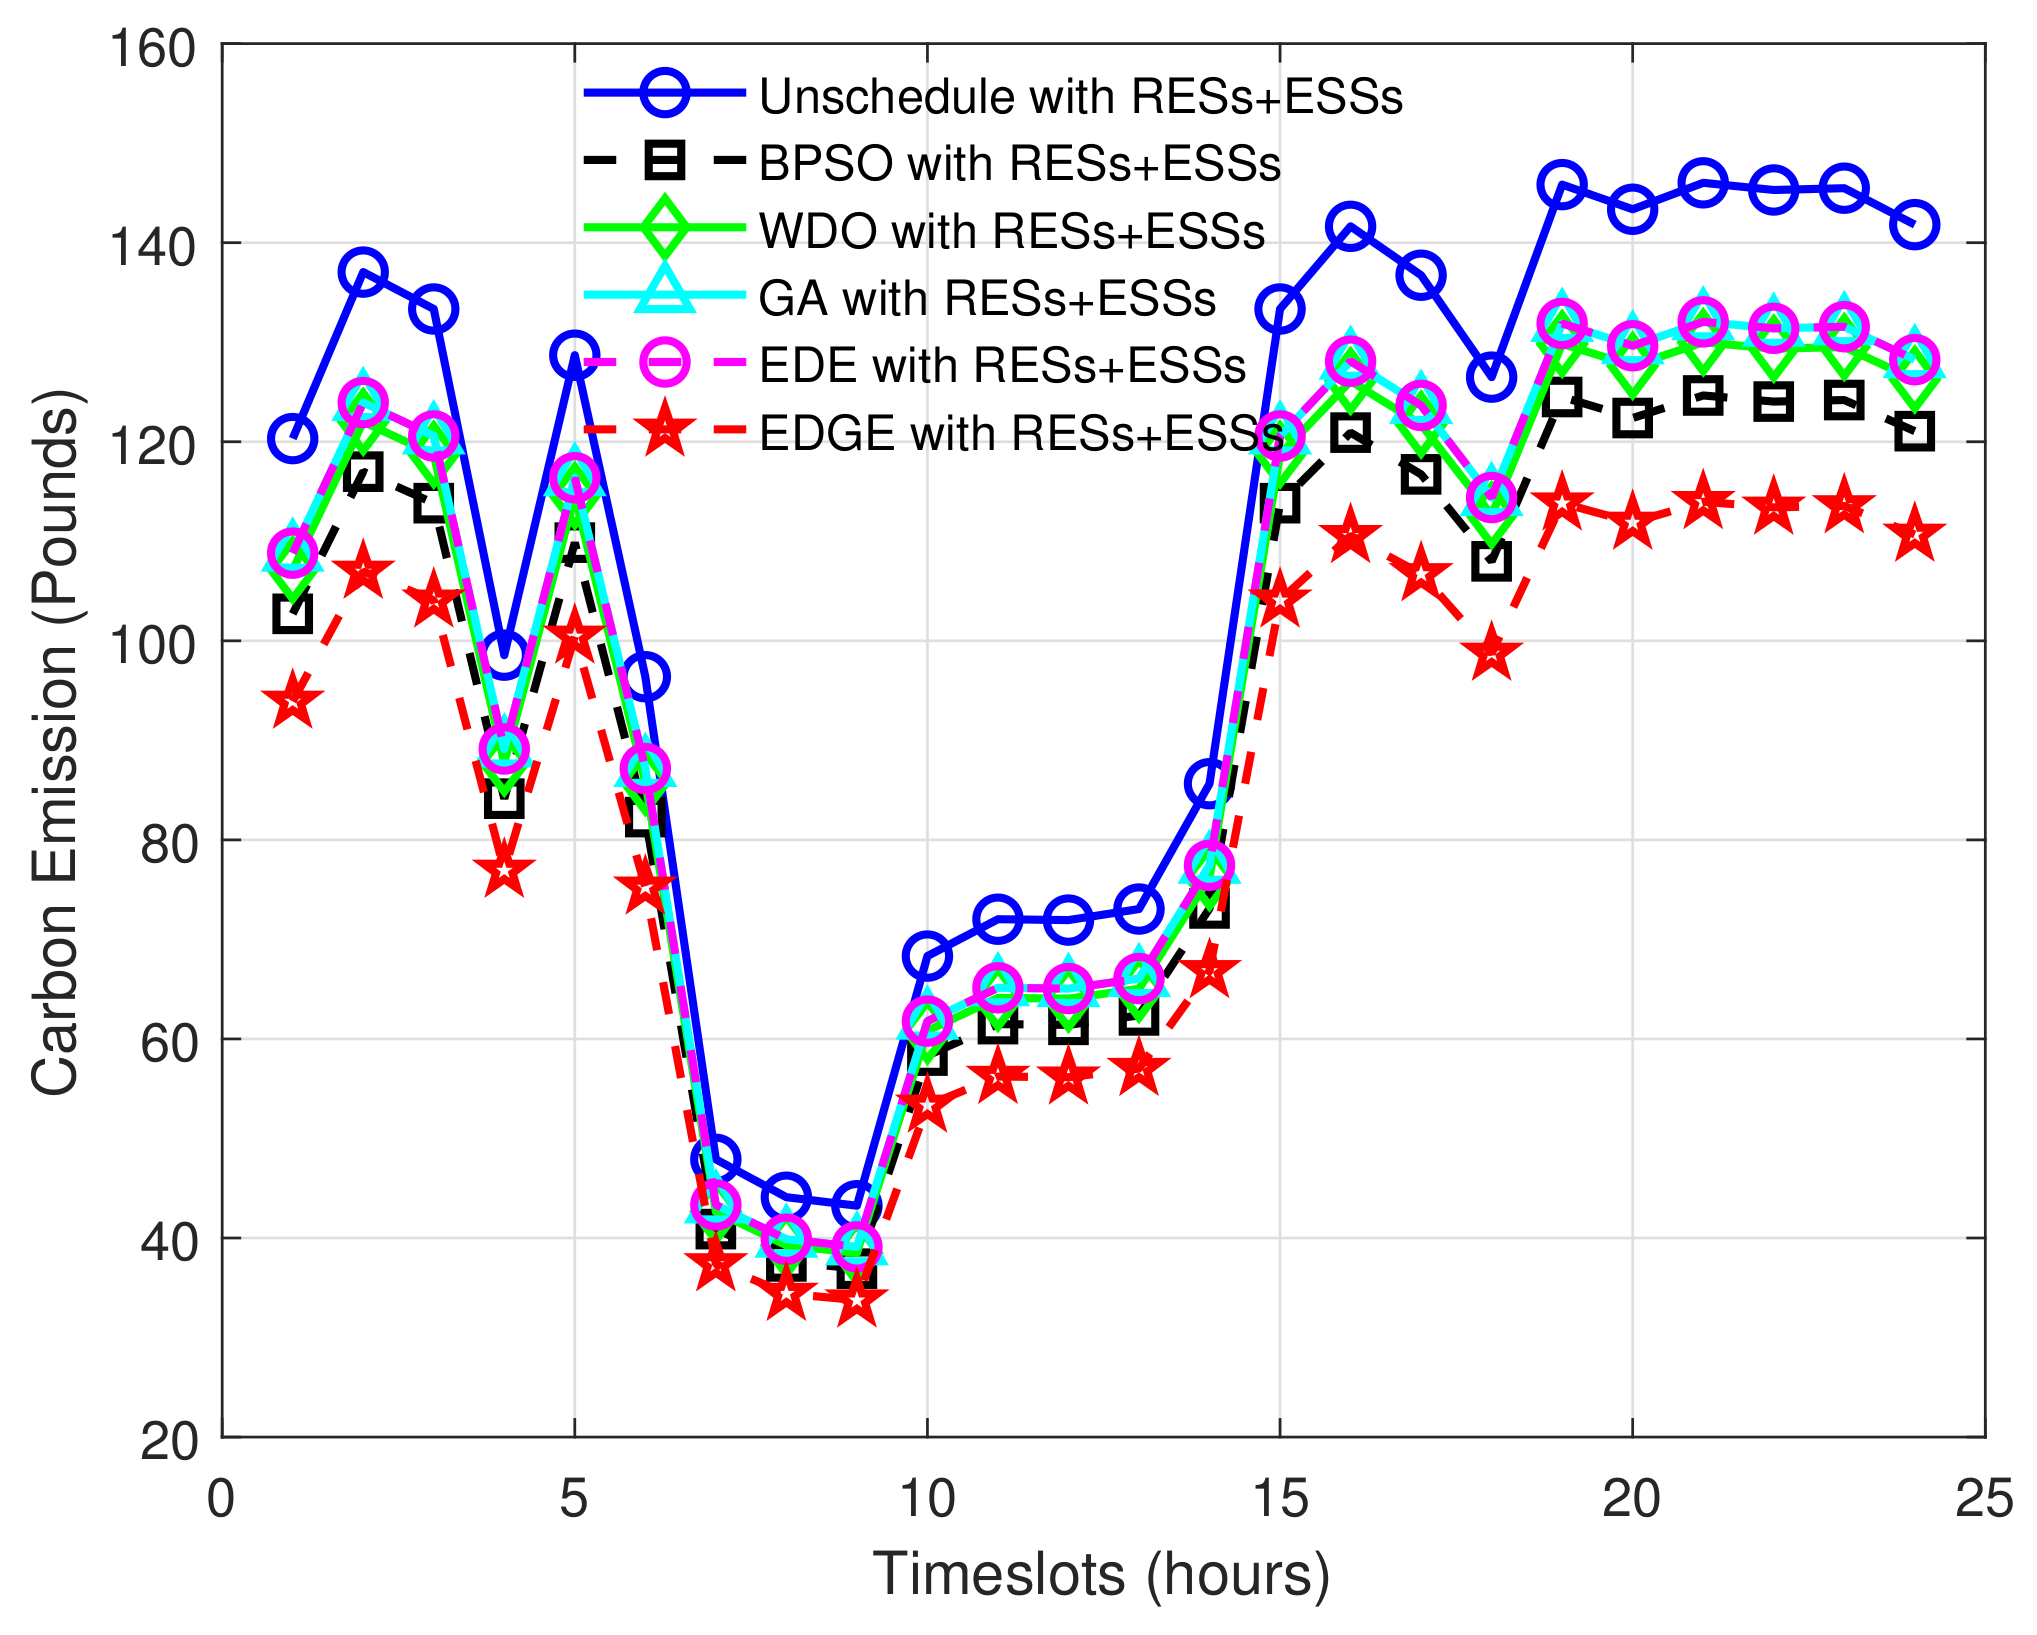
5.2.3. Carbon Emission Evaluation
5.2.4. User Comfort/Discomfort in Terms of Waiting Time
5.3. Performance Trade-Off Evaluation
6. Conclusions and Future Work
- Lapunov optimization technique will be employed for online scheduling where onsite events and requests will be responded to to solve energy management problems in realtime.
- Multi-objective optimization algorithms will be adapted to solve energy management problems via dynamic scheduling.
- Fog- and cloud-based environments will be developed to solve energy management via scheduling under DR programs.
Author Contributions
Funding
Institutional Review Board Statement
Informed Consent Statement
Data Availability Statement
Acknowledgments
Conflicts of Interest
Abbreviations
| ACO | Ant Colony Optimization |
| AMI | Advanced Metering Infrastructure |
| BPSO | Binary Particle Swarm Optimization |
| CR | Crossover Rate |
| CPP | Critical Peak Pricing |
| DR | Demand Response |
| DLC | Direct Load Control |
| DE | Differential Evolution |
| DSM | Demand Side Management |
| EVs | Electric Vehicles |
| ESSs | Energy Storage Systems |
| EMS | Energy Management System |
| EMC | Energy Management Controller |
| EDE | Enhanced Differential Evolution |
| EDGE | Enhanced Differential Genetic Evolution |
| FERC | Federal Energy Regulation Commission |
| GA | Genetic Algorithm |
| GWASA | Grey Wolf Accretive Satisfaction Algorithm |
| HAN | Home Area Network |
| HEMS | Home Energy Management System |
| IHD | In-home Display |
| IPSO | Improved PSO |
| K-WDO | Knapsack-WDO |
| LASIE | Intelligent Energy System Laboratory |
| MINLP | Mixed-Integer Nonlinear Programming |
| MILP | Mixed Integer Linear Programming |
| MF | Mutation Factor |
| PAR | Peak to Average Ratio |
| PSO | Particle Swarm Optimization |
| RTP | Real-Time Pricing |
| PHEVs | Plug-in Hybrid Electric Vehicles |
| PV | Photovoltaic |
| RESs | Renewable Energy Sources |
| SCADA | Supervisory Control And Data Acquisition |
| TOU | Time of Use |
| WDO | Wind Driven Optimization |
References
- Ullah, M.N.; Javaid, N.; Khan, I.; Mahmood, A.; Farooq, M.U. Residential energy consumption controlling techniques to enable autonomous demand side management in future smart grid communications. In Proceedings of the 2013 Eighth International Conference on Broadband and Wireless Computing, Communication and Applications, Compiegne, France, 28–30 October 2013; IEEE: Piscataway, NJ, USA, 2013; pp. 545–550. [Google Scholar]
- Logenthiran, T.; Srinivasan, D.; Shun, T.Z. Demand side management in smart grid using heuristic optimization. IEEE Trans. Smart Grid 2012, 3, 1244–1252. [Google Scholar] [CrossRef]
- Lee, J.Y.; Choi, S.G. Linear programming based hourly peak load shaving method at home area. In Proceedings of the 16th International Conference on Advanced Communication Technology, Pyeongchang, Korea, 16–19 February 2014; IEEE: Piscataway, NJ, USA, 2014; pp. 310–313. [Google Scholar]
- Elazab, R.; Saif, O.; Metwally, A.M.A.; Daowd, M. Mixed integer smart off-grid home energy management system. Energy Rep. 2021, 7, 9094–9107. [Google Scholar] [CrossRef]
- Huang, Y.; Wang, W.; Hou, B. A hybrid algorithm for mixed integer nonlinear programming in residential energy management. J. Clean. Prod. 2019, 226, 940–948. [Google Scholar] [CrossRef]
- Moser, A.; Muschick, D.; Gölles, M.; Nageler, P.; Schranzhofer, H.; Mach, T.; Tugores, C.R.; Leusbrock, I.; Stark, S.; Lackner, F.; et al. A MILP-based modular energy management system for urban multi-energy systems: Performance and sensitivity analysis. Appl. Energy 2020, 261, 114342. [Google Scholar] [CrossRef]
- Rahmani-Andebili, M. Scheduling deferrable appliances and energy resources of a smart home applying multi-time scale stochastic model predictive control. Sustain. Cities Soc. 2017, 32, 338–347. [Google Scholar] [CrossRef]
- Fernandez, E.; Hossain, M.J.; Nizami, M.S.H. Game-theoretic approach to demand-side energy management for a smart neighbourhood in Sydney incorporating renewable resources. Appl. Energy 2018, 232, 245–257. [Google Scholar] [CrossRef]
- Srinivasan, D.; Rajgarhia, S.; Radhakrishnan, B.M.; Sharma, A.; Khincha, H.P. Game-Theory based dynamic pricing strategies for demand side management in smart grids. Energy 2017, 126, 132–143. [Google Scholar] [CrossRef]
- Yu, M.; Hong, S.H. Supply–demand balancing for power management in smart grid: A Stackelberg game approach. Appl. Energy 2016, 164, 702–710. [Google Scholar] [CrossRef]
- Ali, S.; Khan, I.; Jan, S.; Hafeez, G. An Optimization Based Power Usage Scheduling Strategy Using Photovoltaic-Battery System for Demand-Side Management in Smart Grid. Energies 2021, 14, 2201. [Google Scholar] [CrossRef]
- Rehman, A.U.; Wadud, Z.; Elavarasan, R.M.; Hafeez, G.; Khan, I.; Shafiq, Z.; Alhelou, H.H. An Optimal Power Usage Scheduling in Smart Grid integrated with Renewable Energy Sources for Energy Management. IEEE Access 2021, 9, 84619–84638. [Google Scholar] [CrossRef]
- Cheng, P.H.; Huang, T.H.; Chien, Y.W.; Wu, C.L.; Tai, C.S.; Fu, L.C. Demand-side management in residential community realizing sharing economy with bidirectional PEV while additionally considering commercial area. Int. J. Electr. Power Energy Syst. 2020, 116, 105512. [Google Scholar] [CrossRef]
- Ayub, S.; Ayob, S.M.; Tan, C.W.; Ayub, L.; Bukar, A.L. Optimal residence energy management with time and device-based preferences using an enhanced binary grey wolf optimization algorithm. Sustain. Energy Technol. Assess. 2020, 41, 100798. [Google Scholar] [CrossRef]
- Zhao, Z.; Lee, W.C.; Shin, Y.; Song, K.B. An optimal power scheduling method for demand response in home energy management system. IEEE Trans. Smart Grid 2013, 4, 1391–1400. [Google Scholar] [CrossRef]
- Karaboğa, D.; Ökdem, S. A simple and global optimization algorithm for engineering problems: Differential evolution algorithm. Turk. J. Electr. Eng. Comput. Sci. 2004, 12, 53–60. [Google Scholar]
- Arafa, M.; Sallam, E.A.; Fahmy, M.M. An enhanced differential evolution optimization algorithm. In Proceedings of the 2014 Fourth International Conference on Digital Information and Communication Technology and its Applications (DICTAP), Bangkok, Thailand, 6–8 May 2014; IEEE: Piscataway, NJ, USA, 2014; pp. 216–225. [Google Scholar]
- Samadi, P.; Mohsenian-Rad, A.H.; Schober, R.; Wong, V.W.; Jatskevich, J. Optimal real-time pricing algorithm based on utility maximization for smart grid. In Proceedings of the 2010 First IEEE International Conference on Smart Grid Communications, Gaithersburg, MD, USA, 4–6 October 2010; IEEE: Piscataway, NJ, USA, 2010; pp. 415–420. [Google Scholar]
- Abdollahi, A.; Moghaddam, M.P.; Rashidinejad, M.; Sheikh-El-Eslami, M.K. Investigation of economic and environmental-driven demand response measures incorporating UC. IEEE Trans. Smart Grid 2012, 3, 12–25. [Google Scholar] [CrossRef]
- Shirazi, E.; Jadid, S. Optimal residential appliance scheduling under dynamic pricing scheme via HEMDAS. Energy Build. 2015, 93, 40–49. [Google Scholar] [CrossRef]
- Adika, C.O.; Wang, L. Smart charging and appliance scheduling approaches to demand side management. Int. J. Electr. Power Energy Syst. 2014, 57, 232–240. [Google Scholar] [CrossRef]
- Vardakas, J.S.; Zorba, N.; Verikoukis, C.V. Power demand control scenarios for smart grid applications with finite number of appliances. Appl. Energy 2016, 162, 83–98. [Google Scholar] [CrossRef]
- Del Valle, Y.; Venayagamoorthy, G.K.; Mohagheghi, S.; Hernandez, J.C.; Harley, R.G. Particle swarm optimization: Basic concepts, variants and applications in power systems. IEEE Trans. Evol. Comput. 2008, 12, 171–195. [Google Scholar] [CrossRef]
- Yang, H.T.; Yang, C.T.; Tsai, C.C.; Chen, G.J.; Chen, S.Y. Improved PSO based home energy management systems integrated with demand response in a smart grid. In Proceedings of the 2015 IEEE Congress on Evolutionary Computation (CEC), Sendai, Japan, 25–28 May 2015; IEEE: Piscataway, NJ, USA, 2015; pp. 275–282. [Google Scholar]
- Fernandes, F.; Sousa, T.; Silva, M.; Morais, H.; Vale, Z.; Faria, P. Genetic algorithm methodology applied to intelligent house control. In Proceedings of the 2011 IEEE Symposium on Computational Intelligence Applications in Smart Grid (CIASG), Paris, France, 11–15 April 2011; IEEE: Piscataway, NJ, USA, 2011; pp. 1–8. [Google Scholar]
- Supriya, P.; Nambiar, T.N.P.; Charu, R.; Tyagi, A.; Nagadharni, V.; Deepika, M. A laboratory prototype of a smart grid based demand side management. In Proceedings of the Innovative Smart GridTechnologies-India (ISGT India), 2011 IEEE PES, Kollam, India, 1–3 December 2011; IEEE: Piscataway, NJ, USA, 2011; pp. 28–31. [Google Scholar]
- Rasheed, M.B.; Javaid, N.; Ahmad, A.; Khan, Z.A.; Qasim, U.; Alrajeh, N. An Efficient Power Scheduling Scheme for Residential Load Management in Smart Homes. Appl. Sci. 2015, 5, 1134–1163. [Google Scholar] [CrossRef] [Green Version]
- Bozchalui, M.C.; Hashmi, S.A.; Hassen, H.; Canizares, C.A.; Bhattacharya, K. Optimal operation of residential energy hubs in smart grids. IEEE Trans. Smart Grid 2012, 3, 1755–1766. [Google Scholar] [CrossRef]
- Hassan, R.; Cohanim, B.; De Weck, O.; Venter, G. A comparison of particle swarm optimization and the genetic algorithm. In Proceedings of the 1st AIAA Multidisciplinary Design Optimization Specialist Conference, Austin, TX, USA, 18–21 April 2005; pp. 18–21. [Google Scholar]
- Khomami, H.P.; Javidi, M.H. An efficient home energy management system for automated residential demand response. In Proceedings of the 2013 13th International Conference on Environment and Electrical Engineering (EEEIC), Wroclaw, Poland, 1–3 November 2013; IEEE: Piscataway, NJ, USA, 2013; pp. 307–312. [Google Scholar]
- Vivekananthan, C.; Mishra, Y.; Ledwich, G.; Li, F. Demand response for residential appliances via customer reward scheme. IEEE Trans. Smart Grid 2014, 5, 809–820. [Google Scholar] [CrossRef]
- Ali, M.M. Differential evolution with preferential crossover. Eur. J. Oper. Res. 2007, 181, 1137–1147. [Google Scholar] [CrossRef]
- Ali, M.; Pant, M.; Abraham, A. Simplex differential evolution. Acta Polytech. Hung. 2009, 6, 95–115. [Google Scholar]
- Alimohammadisagvand, B. Influence of Demand Response Actions on Thermal Comfort and Electricity Cost for Residential Houses. Ph.D. Article Dissertation, Aalto University, Espoo, Finland, 2018. Available online: https://aaltodoc.aalto.fi/handle/123456789/33143 (accessed on 1 April 2021).
- Alimohammadisagvand, B.; Alam, S.; Ali, M.; Degefa, M.; Jokisalo, J.; Sirén, K. Influence of energy demand response actions on thermal comfort and energy cost in electrically heated residential houses. Indoor Built Environ. 2017, 26, 298–316. [Google Scholar] [CrossRef]
- Alimohammadisagvand, B.; Jokisalo, J.; Kilpeläinen, S.; Ali, M.; Sirén, K. Cost-optimal thermal energy storage system for a residential building with heat pump heating and demand response control. Appl. Energy 2016, 174, 275–287. [Google Scholar] [CrossRef]
- Alimohammadisagvand, B.; Jokisalo, J.; Sirén, K. The potential of predictive control in minimizing the electricity cost in a heat-pump heated residential house. In Proceedings of the 3rd IBPSA-England Conference BSO, Newcastle, UK, 12–14 September 2016. [Google Scholar]
- Alimohammadisagvand, B.; Jokisalo, J.; Sirén, K. Comparison of four rule-based demand response control algorithms in an electrically and heat pump-heated residential building. Appl. Energy 2018, 209, 167–179. [Google Scholar] [CrossRef] [Green Version]
- Arabzadeh, V.; Alimohammadisagv, B.; Jokisalo, J.; Siren, K. A novel cost-optimizing demand response control for a heat pump heated residential building. In Building Simulation; Springer: Berlin/Heidelberg, Germany, 2018; Volume 11, pp. 533–547. [Google Scholar]
- Real-Time Pricing for Residential Customers, MISO Daily Report Archives. 2017. Available online: http://www.ferc.gov/market-oversight/mkt-electric/midwest/miso-archives.asp (accessed on 5 January 2021).
- Sarker, E.; Halder, P.; Seyedmahmoudian, M.; Jamei, E.; Horan, B.; Mekhilef, S.; Stojcevski, A. Progress on the demand side management in smart grid and optimization approaches. Int. J. Energy Res. 2021, 45, 36–64. [Google Scholar] [CrossRef]
- Climate Central Solutions Brief: Battery Energy Storage. Available online: https://www.climatecentral.org/news/climate-central-solutions-brief-battery-energy-storage (accessed on 5 April 2021).
- Asif, K.; Javaid, N.; Khan, M.I. Time and device based priority induced comfort management in smart home within the consumer budget limitation. Sustain. Cities Soc. 2018, 41, 538–555. [Google Scholar]
- Bilal, H.; Javaid, N.; Hasan, Q.U.; Javaid, S.; Khan, A.; Malik, S.A. An inventive method for eco-efficient operation of home energy management systems. Energies 2018, 11, 3091. [Google Scholar]


| Parameters | Values | Parameters | Values |
|---|---|---|---|
| Nitra | 300 | 0.9 | |
| Popsize | 10 | 0.1 | |
| n | 7 | insite | 2 |
| Parameter | Values | Parameter | Values |
|---|---|---|---|
| Nitra | 100 | 50 | |
| Popsize | 30 | 100 | |
| n | 7 |
| Smart Appliances | Power Rating (kWh) | Smart Appliances | Power Rating (kWh) |
|---|---|---|---|
| AC | 1.5 | Iron | 1 |
| Dishwasher | 1.5 | Washing machine | 0.7 |
| EVs | 5.5 | Cloth dryer | 4 |
| Battery | 1.6 |
| Scheduling Algorithms | Energy Cost (Cents) | Difference (Cents) | Decrements in Cost (%) |
|---|---|---|---|
| Unscheduled | 1390 | - | - |
| BPSO | 1350 | 40 | 2.87 |
| WDO | 1300 | 90 | 6.47 |
| GA | 1405 | −15 | −1.079 |
| EDE | 1420 | −30 | −2.15 |
| EDGE | 1225 | 165 | 11.87 |
| Scheduling Algorithms | PAR | Difference | Decrement in PAR (%) |
|---|---|---|---|
| Unscheduled | 4.8 | - | - |
| BPSO | 3.9 | 0.9 | 18.75 |
| WDO | 4.6 | 0.2 | 4.16 |
| GA | 4.4 | 0.4 | 8.33 |
| EDE | 4.8 | 0.8 | 16.66 |
| EDGE | 2.8 | 2 | 41.66 |
| Scheduling Algorithms | Carbon Emission (Pounds) | Difference (Pounds) | Reduction (%) |
|---|---|---|---|
| Unscheduled | 158 | - | - |
| BPSO | 144 | 14 | 8.86 |
| WDO | 150 | 08 | 05.06 |
| GA | 141 | 17 | 10.75 |
| EDE | 150 | 08 | 05.06 |
| EDGE | 134 | 24 | 15.18 |
| Scheduling Algorithms | Energy Cost (Cents) | Difference | Reduction (%) |
|---|---|---|---|
| Unscheduled | 690 | - | - |
| BPSO | 670 | 20 | 2.89 |
| WDO | 660 | 30 | 4.34 |
| GA | 605 | 85 | 12.31 |
| EDE | 590 | 100 | 14.49 |
| EDGE | 470 | 220 | 31.88 |
| Scheduling Algorithms | PAR | Difference | Reduction (%) |
|---|---|---|---|
| Unscheduled | 2.4 | - | - |
| BPSO | 1.95 | 0.45 | 18.75 |
| WDO | 2.2 | 0.2 | 8.33 |
| GA | 2.6 | −0.2 | −8.33 |
| EDE | 2.3 | 0.1 | 4.16 |
| EDGE | 1.75 | 0.65 | 27.08 |
| Scheduling Algorithms | Carbon Emission (Pounds) | Difference | Reduction (%) |
|---|---|---|---|
| Unscheduled | 147 | - | - |
| BPSO | 125 | 22 | 14.9 |
| WDO | 130 | 17 | 11.56 |
| GA | 132 | 15 | 10.20 |
| EDE | 132 | 15 | 10.20 |
| EDGE | 114 | 33 | 22.44 |
| Scheduling Algorithms | Energy Cost (Cents) | PAR | Waiting Time (Hours) | Carbon Emission (Pounds) |
|---|---|---|---|---|
| Unscheduled | 1390 | 4.8 | - | 158 |
| BPSO | 1350 | 3.9 | 0.983 | 144 |
| WDO | 1300 | 4.6 | 1.31 | 150 |
| GA | 1405 | 4.4 | 1.03 | 141 |
| EDE | 1420 | 4.8 | 0.667 | 150 |
| EDGE | 1225 | 2.8 | 1.225 | 134 |
| Scheduling Algorithms | Energy Cost (Cents) | PAR | Waiting Time (Hours) | Carbon Emission (Pounds) |
|---|---|---|---|---|
| Unscheduled | 690 | 2.4 | - | 147 |
| BPSO | 670 | 1.95 | 0.983 | 125 |
| WDO | 660 | 2.2 | 1.31 | 130 |
| GA | 605 | 2.6 | 1.03 | 132 |
| EDE | 590 | 2.3 | 0.667 | 132 |
| EDGE | 470 | 1.75 | 1.225 | 114 |
Publisher’s Note: MDPI stays neutral with regard to jurisdictional claims in published maps and institutional affiliations. |
© 2022 by the authors. Licensee MDPI, Basel, Switzerland. This article is an open access article distributed under the terms and conditions of the Creative Commons Attribution (CC BY) license (https://creativecommons.org/licenses/by/4.0/).
Share and Cite
Albogamy, F.R.; Khan, S.A.; Hafeez, G.; Murawwat, S.; Khan, S.; Haider, S.I.; Basit, A.; Thoben, K.-D. Real-Time Energy Management and Load Scheduling with Renewable Energy Integration in Smart Grid. Sustainability 2022, 14, 1792. https://doi.org/10.3390/su14031792
Albogamy FR, Khan SA, Hafeez G, Murawwat S, Khan S, Haider SI, Basit A, Thoben K-D. Real-Time Energy Management and Load Scheduling with Renewable Energy Integration in Smart Grid. Sustainability. 2022; 14(3):1792. https://doi.org/10.3390/su14031792
Chicago/Turabian StyleAlbogamy, Fahad R., Sajjad Ali Khan, Ghulam Hafeez, Sadia Murawwat, Sheraz Khan, Syed Irtaza Haider, Abdul Basit, and Klaus-Dieter Thoben. 2022. "Real-Time Energy Management and Load Scheduling with Renewable Energy Integration in Smart Grid" Sustainability 14, no. 3: 1792. https://doi.org/10.3390/su14031792
APA StyleAlbogamy, F. R., Khan, S. A., Hafeez, G., Murawwat, S., Khan, S., Haider, S. I., Basit, A., & Thoben, K.-D. (2022). Real-Time Energy Management and Load Scheduling with Renewable Energy Integration in Smart Grid. Sustainability, 14(3), 1792. https://doi.org/10.3390/su14031792