Article

Ecotoxicity of Concrete Containing Fine-Recycled Aggregate: Effect on Photosynthetic Pigments, Soil Enzymatic Activity and Carbonation Process

1
Research Team Architecture and the Environment, University Centre for Energy Efficient Buildings of Czech Technical University in Prague, Trinecka 1024, 273 43 Bustehrad, Czech Republic
2
Department of Environmental Chemistry, Faculty of Environmental Technology, University of Chemistry and Technology, Technicka 5, 166 28 Prague, Czech Republic
3
School of Civil and Chemical Engineering, Manipal University Jaipur, Dehmi Kalan, Jaipur 303 007, India
*
Author to whom correspondence should be addressed.
Sustainability 2022, 14(3), 1732; https://doi.org/10.3390/su14031732
Submission received: 10 December 2021 / Revised: 26 January 2022 / Accepted: 31 January 2022 / Published: 2 February 2022
(This article belongs to the Special Issue Construction and Demolition Waste: Challenges and Opportunities)

Abstract

:
Recycling of materials such as masonry or concrete is one of the suitable ways to reduce amount of disposed construction and demolition waste (CDW). However, the environmental safety of products containing recycled materials must be guaranteed. To verify overall environmental benefits of recycled concrete, this work considers ecotoxicity of recycled concrete, as well as potential environmental impacts of their life cycle. Moreover, impacts related with carbonation of concrete is considered in terms of durability and influence of potential CO2 uptake. Concrete containing fine recycled aggregate from two different sources (masonry and concrete) were examined experimentally at the biochemical level and compared with reference samples. Leaching experiments are performed in order to assess physicochemical properties and aquatic ecotoxicity using water flea, freshwater algae and duckweed. The consequences, such as effects of material on soil enzymatic activity (dehydrogenase activity), photosynthetic pigments (chlorophylls and carotenoids), and the carbonation process, are verified in the laboratory and included in the comparison with the theoretical life cycle assessment. As a conclusion, environmental safety of recycled concrete was verified, and its overall potential environmental impact was lower in comparison with reference concrete.

1. Introduction

Construction and demolition waste (CDW) constituted approximately 35.9% of the total waste production in the EU in 2018. CDW, as one of the highest waste streams, consists of materials like red bricks, mortar, masonry, and concrete, which can be recycled and used as secondary raw materials. This approach reduces not only waste but also the demand for primary resources. However, there is a risk of using recycled materials with content, which is potentially harmful to human health or the environment. Therefore, prior to their use, the ecotoxicity of such materials must be tested using ecotoxicological bioassays and their potential environmental impact should be assessed.
To evaluate the ecotoxicological impact of concrete containing recycled materials, bioassays according to the European law system can be performed. These tests are designed to determine the potential influence of various chemicals or their mixtures, along with the transport from the source to the reservoir. To model this transport, the leachates of considered materials are prepared. However, just the impact caused by bioavailable chemicals can be evaluated using these tests.
Ecotoxicity of construction waste or materials was assessed in previous studies, which were carried out with a simple test design, such as the freshwater algae growth test, seed germination test, crustacean acute assay, marine bacteria bioluminescence test, or the yeast growth test [1,2,3,4,5]. Nevertheless, tests with these organisms are focused on the influence of chemicals on water ecosystems only.
Green plants (algae, aquatic and terrestrial plants) are usually examined not only at morphological level, such as growth rate or yield. Photosynthetic pigments represent the most typical chemicals in plants. Chlorophylls are closely related to primary production, while carotenoids serve as protection against adverse effects of the environment. Both groups of pigments are known to be sensitive to contamination, alkaline pH, and consequently oxidative stress [6,7,8]. With a significant decrease in chlorophyll, it is likely that plant growth will also decrease. An increase in total carotenoids indicates internal oxidative stress, which can result from lack of nutrients, heavy metal accumulation, and other stresses associated with the formation of reactive oxygen species (ROS) [9].
Impacts on soil ecosystems can be assessed using tests focused on nonspecified microbial communities where a selected metabolic activity is determined. Soil enzymes are produced mainly by bacteria and fungi, and are suitable for the determination of various external effects on the soil microbiota [10]. Various methods for the determination of soil enzymes, such as oxidoreductases, hydrolases, transferases, etc., have been described [10], but the most often found soil enzymes belongs to the group of dehydrogenases (DHA). In contrast to most soil enzymes, DHA are intracellular, and so DHA can be used as an indicator of living (active) cells [11].
Besides ecotoxicological impact, other environmental impacts, such as an impact on climate change, should be assessed. The impact of CO2 emissions is one of the most discussed issues in the European Union. The EU aims to reduce CO2 emissions values by 40% by 2030 [12]. Moreover, up to 9% of CO2 emissions are directly related to the construction industry, and about 3% specifically to concrete [13]. This is also associated with a large amount of energy consumption, which is spent on the construction process (from material production, building the construction, construction life, and also demolition). This amount is estimated to be up to 40% of total energy consumption [14].
On the other hand, one of the beneficial influences of concrete is the absorption of CO2 during a slow process called carbonation, in which CO2 reacts with the cement matrix, mainly portlandite. Limit conditions for this reaction are the environment, the amount of carbon dioxide in the air, and the type of concrete (great influence, e.g., porosity) [15,16,17,18,19,20]. The CO2 and moisture of the environment neutralize concrete by forming calcium carbonate and reducing alkaline balance, which means that the initial properties are rapidly changing during the carbonation process. During the reaction, the pH values decrease from 12–12.5 to 9, and as a result the protective properties of the material are weakened and a suitable environment appears for the development of corrosion [21]. These effects decrease the quality and possible utilization of concrete, and so the speed of carbonation is used to characterize the concrete quality. Thus, many researchers have stated that the durability of concrete is better with slower carbonation speed [22,23]. However, even concrete with a higher speed of carbonation can be used in some applications. Thus, subsequent absorption of CO2 by concrete should be assessed as a potential benefit and compared with other environmental impacts in the life cycle of concrete.
Potential environmental impacts caused by recycled concrete can be assessed using the Life Cycle Assessment (LCA) method. The LCA is used to analyze not only the life cycle of the concrete itself, but also material and energy flows between the concrete and the environment, as well as the impact of these flows. In life cycle assessment, it is necessary to take into account the issue of care for the structure at the end of its life, and also benefits such as CO2 uptake.
This study aims to verify the environmental safety of different types of concrete containing recycled aggregates in two strength classes. Each strength class had its own reference sample (control) with which the recycled mixtures were compared. These environmentally friendly mixtures have been designed with regard to the properties of individual materials and are intended for use in the construction sector, for example, as the foundations of buildings. In addition to the influence of leachates on aquatic plants and invertebrates, this research deals with the determination of photosynthetic pigments and impact on soil enzymes. Recycled concretes were exposed to the carbonation test, to analyze the impact of the environment on the samples. The rate of CO2 absorption was measured according to the valid Czech standard ČSN EN 12390-12 (73 1302) [24]. Following the gained practical knowledge from laboratory experiments, the theoretical level was evaluated in the form of life cycle analysis.

2. Materials and Methodology
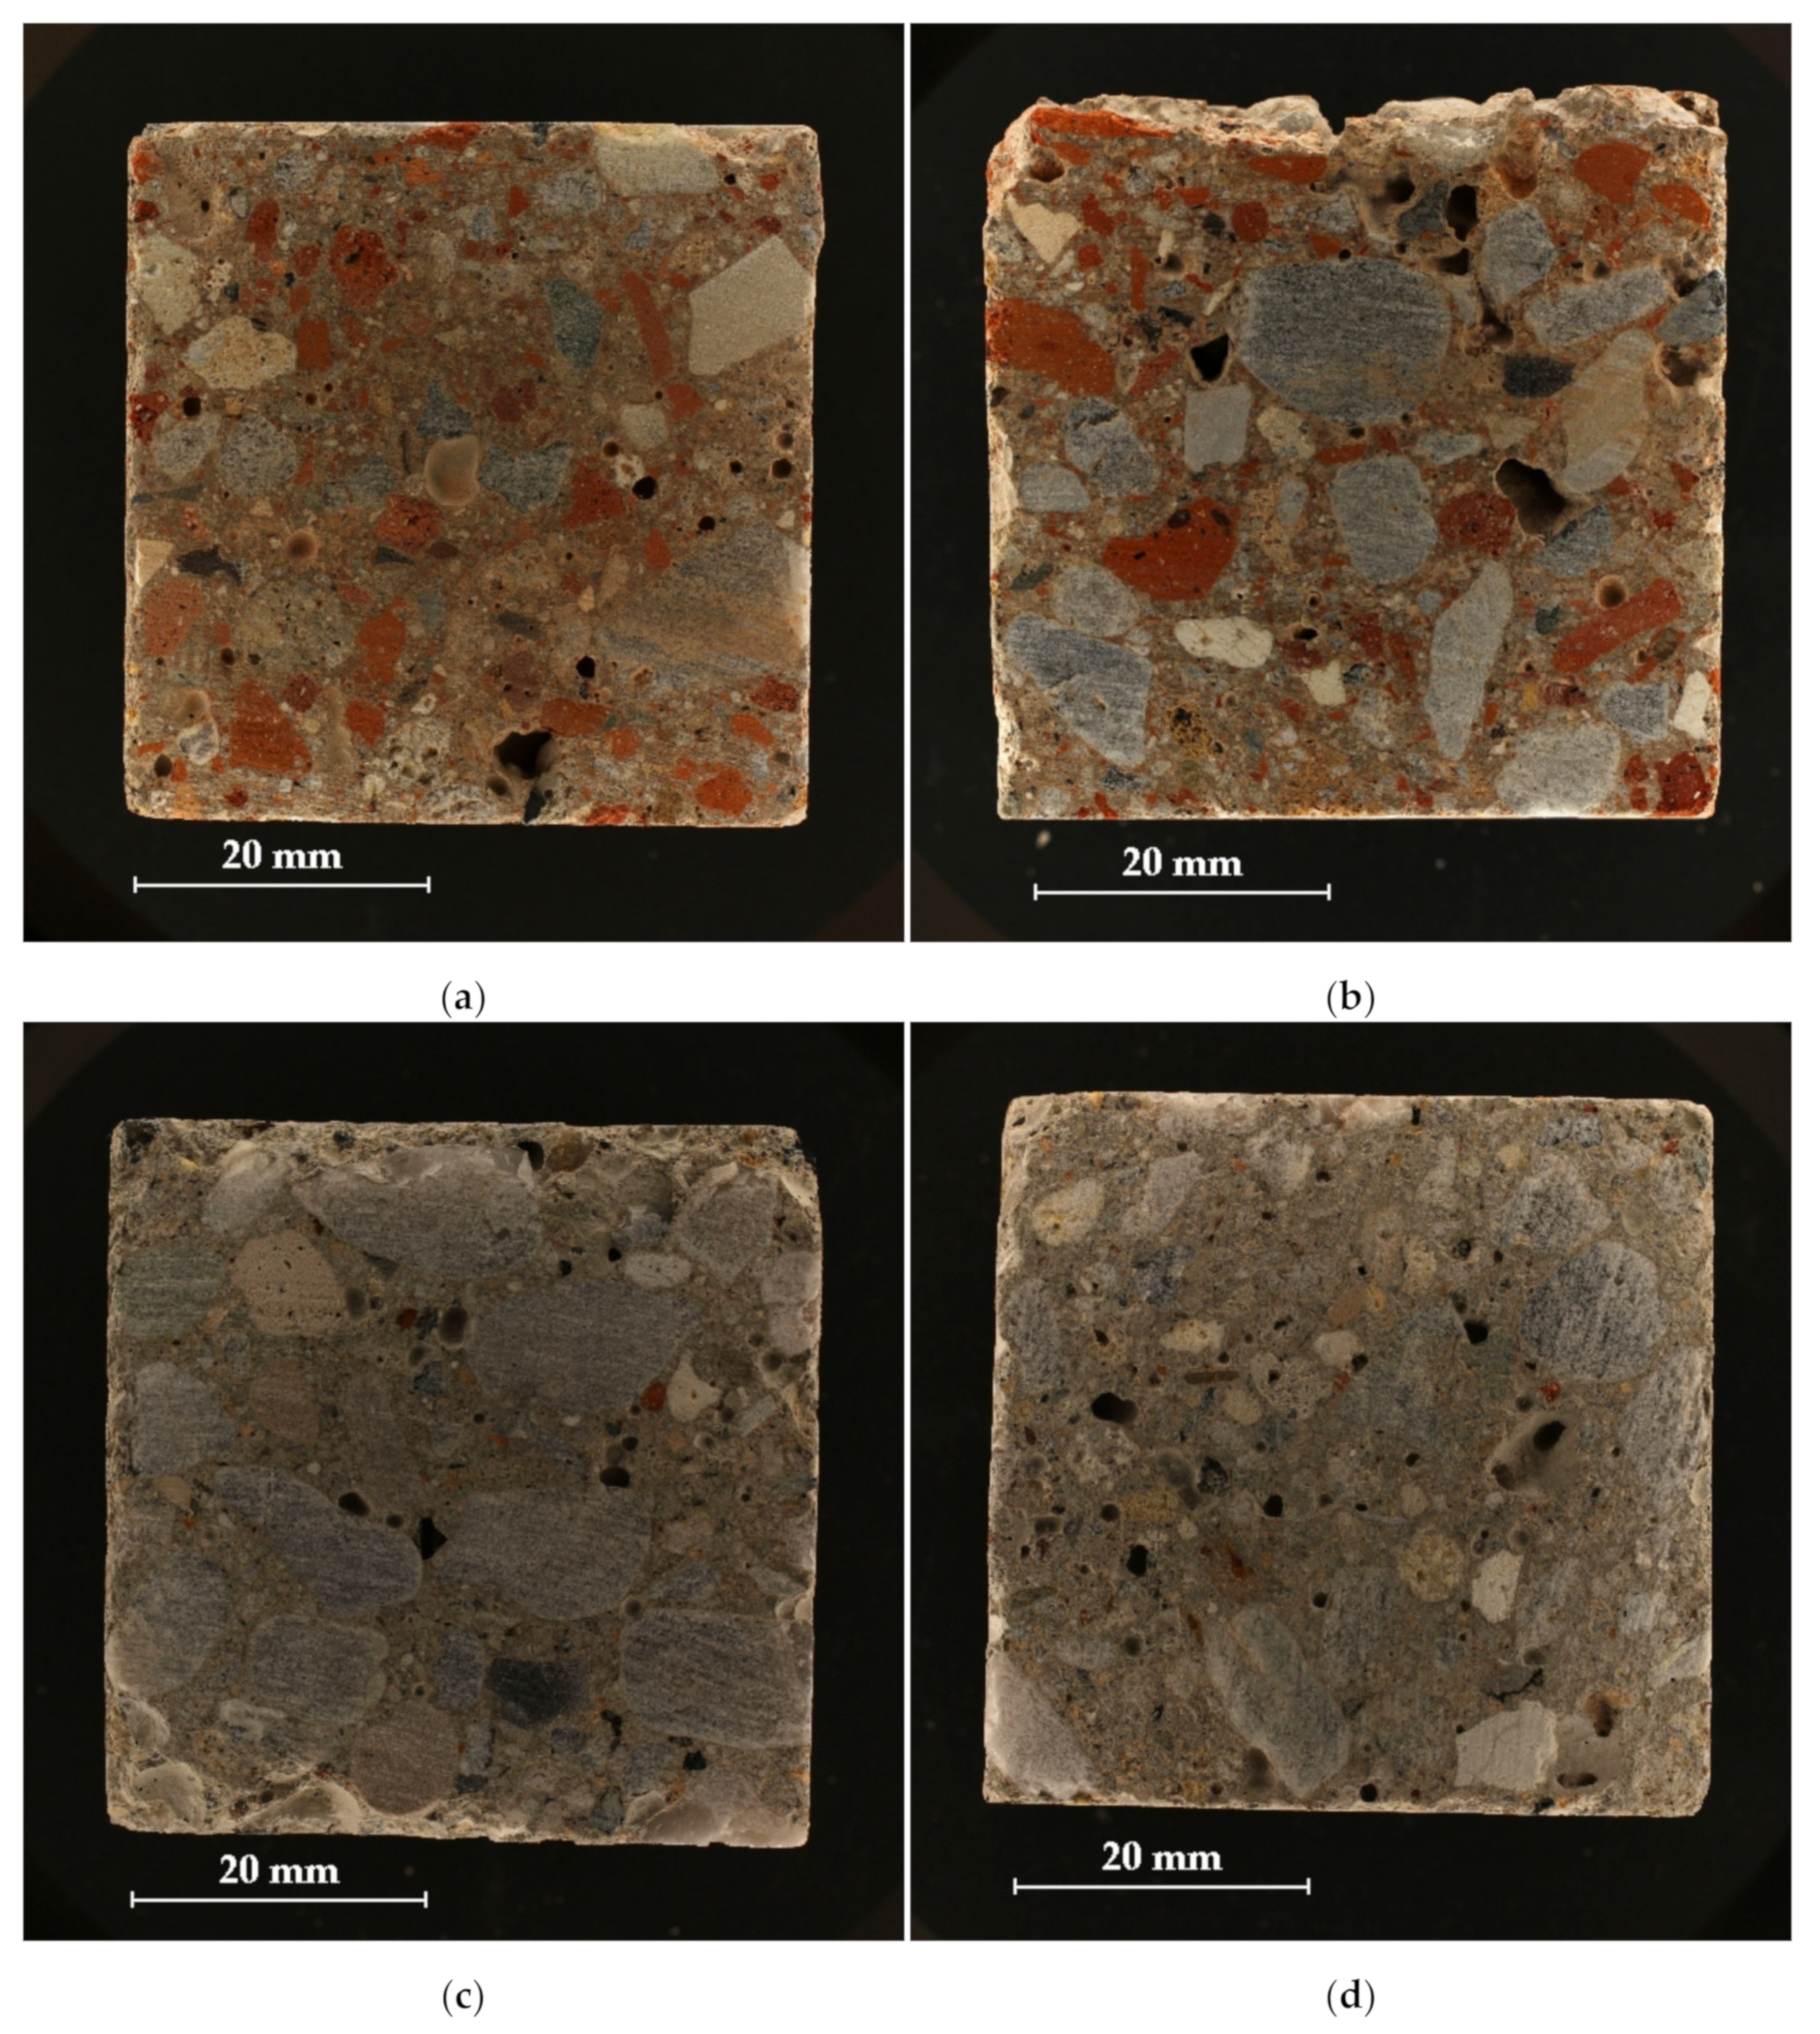
2.1. Materials

This work is based on the solid foundations of previous research, which verified the chemical analysis and ecotoxicity of selected waste materials from different sources [25]. The authors investigated four types of waste materials, and after evaluation and verification, two types were picked and used in this investigation as a substitute for natural aggregate. Natural aggregate concrete (NAC), which contains natural aggregate, was used as a reference sample in both strength classes.
Two types of strength class were tested to compare the properties:
  • Strength class I—corresponds to ordinary concrete in strength class C16/20
  • Strength class II—corresponds to ordinary concrete in strength class C25/30
In each strength class was the reference sample containing natural aggregate and two types of samples with recycled aggregate. Therefore, there were a total of three samples in each strength class (reference sample and two mixtures with recycled aggregate). Thus, a total of six mixtures were tested (two strength classes of three mixtures each).
The first type of recycled aggregate used originates from masonry structures and contains mainly red bricks, mortar, and plasters (RA4) [25]. It was prepared from reinforcement concrete at the recycling center using the two-step recycling process and used in recycled masonry aggregate concrete (RMAC) in this research. This type of concrete was made in two mixtures with different strength classes (RMAC-I, RMAC-II).
The second type of aggregate used was prepared from reinforcement concrete in the recycling center by the two-step recycling process (RA1) [25]. The crushed and separated recycled aggregate of fraction 16/128 mm from the first step of the recycling process was crushed and sieved into fractions in the second step. Two concrete mixtures containing RA1 were prepared (RCAC-I, RCAC-II).
In general, six concrete mixtures were made and tested in the field of ecotoxicity at the biochemical level with regard to environmental impacts; specifically, a comparison of actual exposure and potential life cycle was examined.
  • NAC-I, as a reference concrete sample for strength class C16/20
  • RMAC-I, as recycled concrete containing RA4, strength class C16/20.
  • RCAC-I, as recycled concrete containing RA1, strength class C16/20.
  • NAC-II, as a reference concrete sample for the C25/30 strength class
  • RMAC-II, as a recycled concrete containing RA4, strength class C25/30
  • RCAC-II, as recycled concrete containing RA1, strength class C25/30.
The tested samples containing recycled aggregates are shown in Figure 1.

2.2. Methodology

In this research, recycled aggregate was used that has been tested in previous research [25] with the aim of proving the possibility of replacing normally used raw materials in concrete with secondary raw materials. On the basis of the results from previous research, materials were selected and concrete mixtures were designed, which were subsequently exposed to the experiments on the basis of the international standards. All samples were tested according to the valid Czech standards as well.

2.3. Ecotoxicology

2.3.1. Chemical and Ecotoxicological Analysis of Leachate

The concrete cubes were leached as described in [26]. The concentrations of Na, Mg, Al, K, Ca, Cr, Mn, Fe, Co, Ni, Cu, Zn, As, Se, Sr, Mo, Cd, Ba, Hg, and Pb were determined in leachates acidified to pH 2.0 using inductively coupled plasma optical emission spectrometry (Integra 6000, GBC, Melbourne, Australia).
Aquatic ecotoxicity tests were performed with non-treated leachates in the concentration range from 510 to 1000 mL.L−1, and nutrient-amended leachates diluted 10 times (100 + n mL.L−1). The water flea (Daphnia magna) acute immobilization test followed the methodology described in [26]. The algal toxicity test using Desmodesmus subspicatus and the duckweed (Lemna minor) test were conducted according to [25] with minor changes. In algae, growth rate was determined based on optical density measurements at 750 nm using a UV/VIS spectrophotometer UV-1900 (Shimadzu Corporation, Kyoto, Japan).

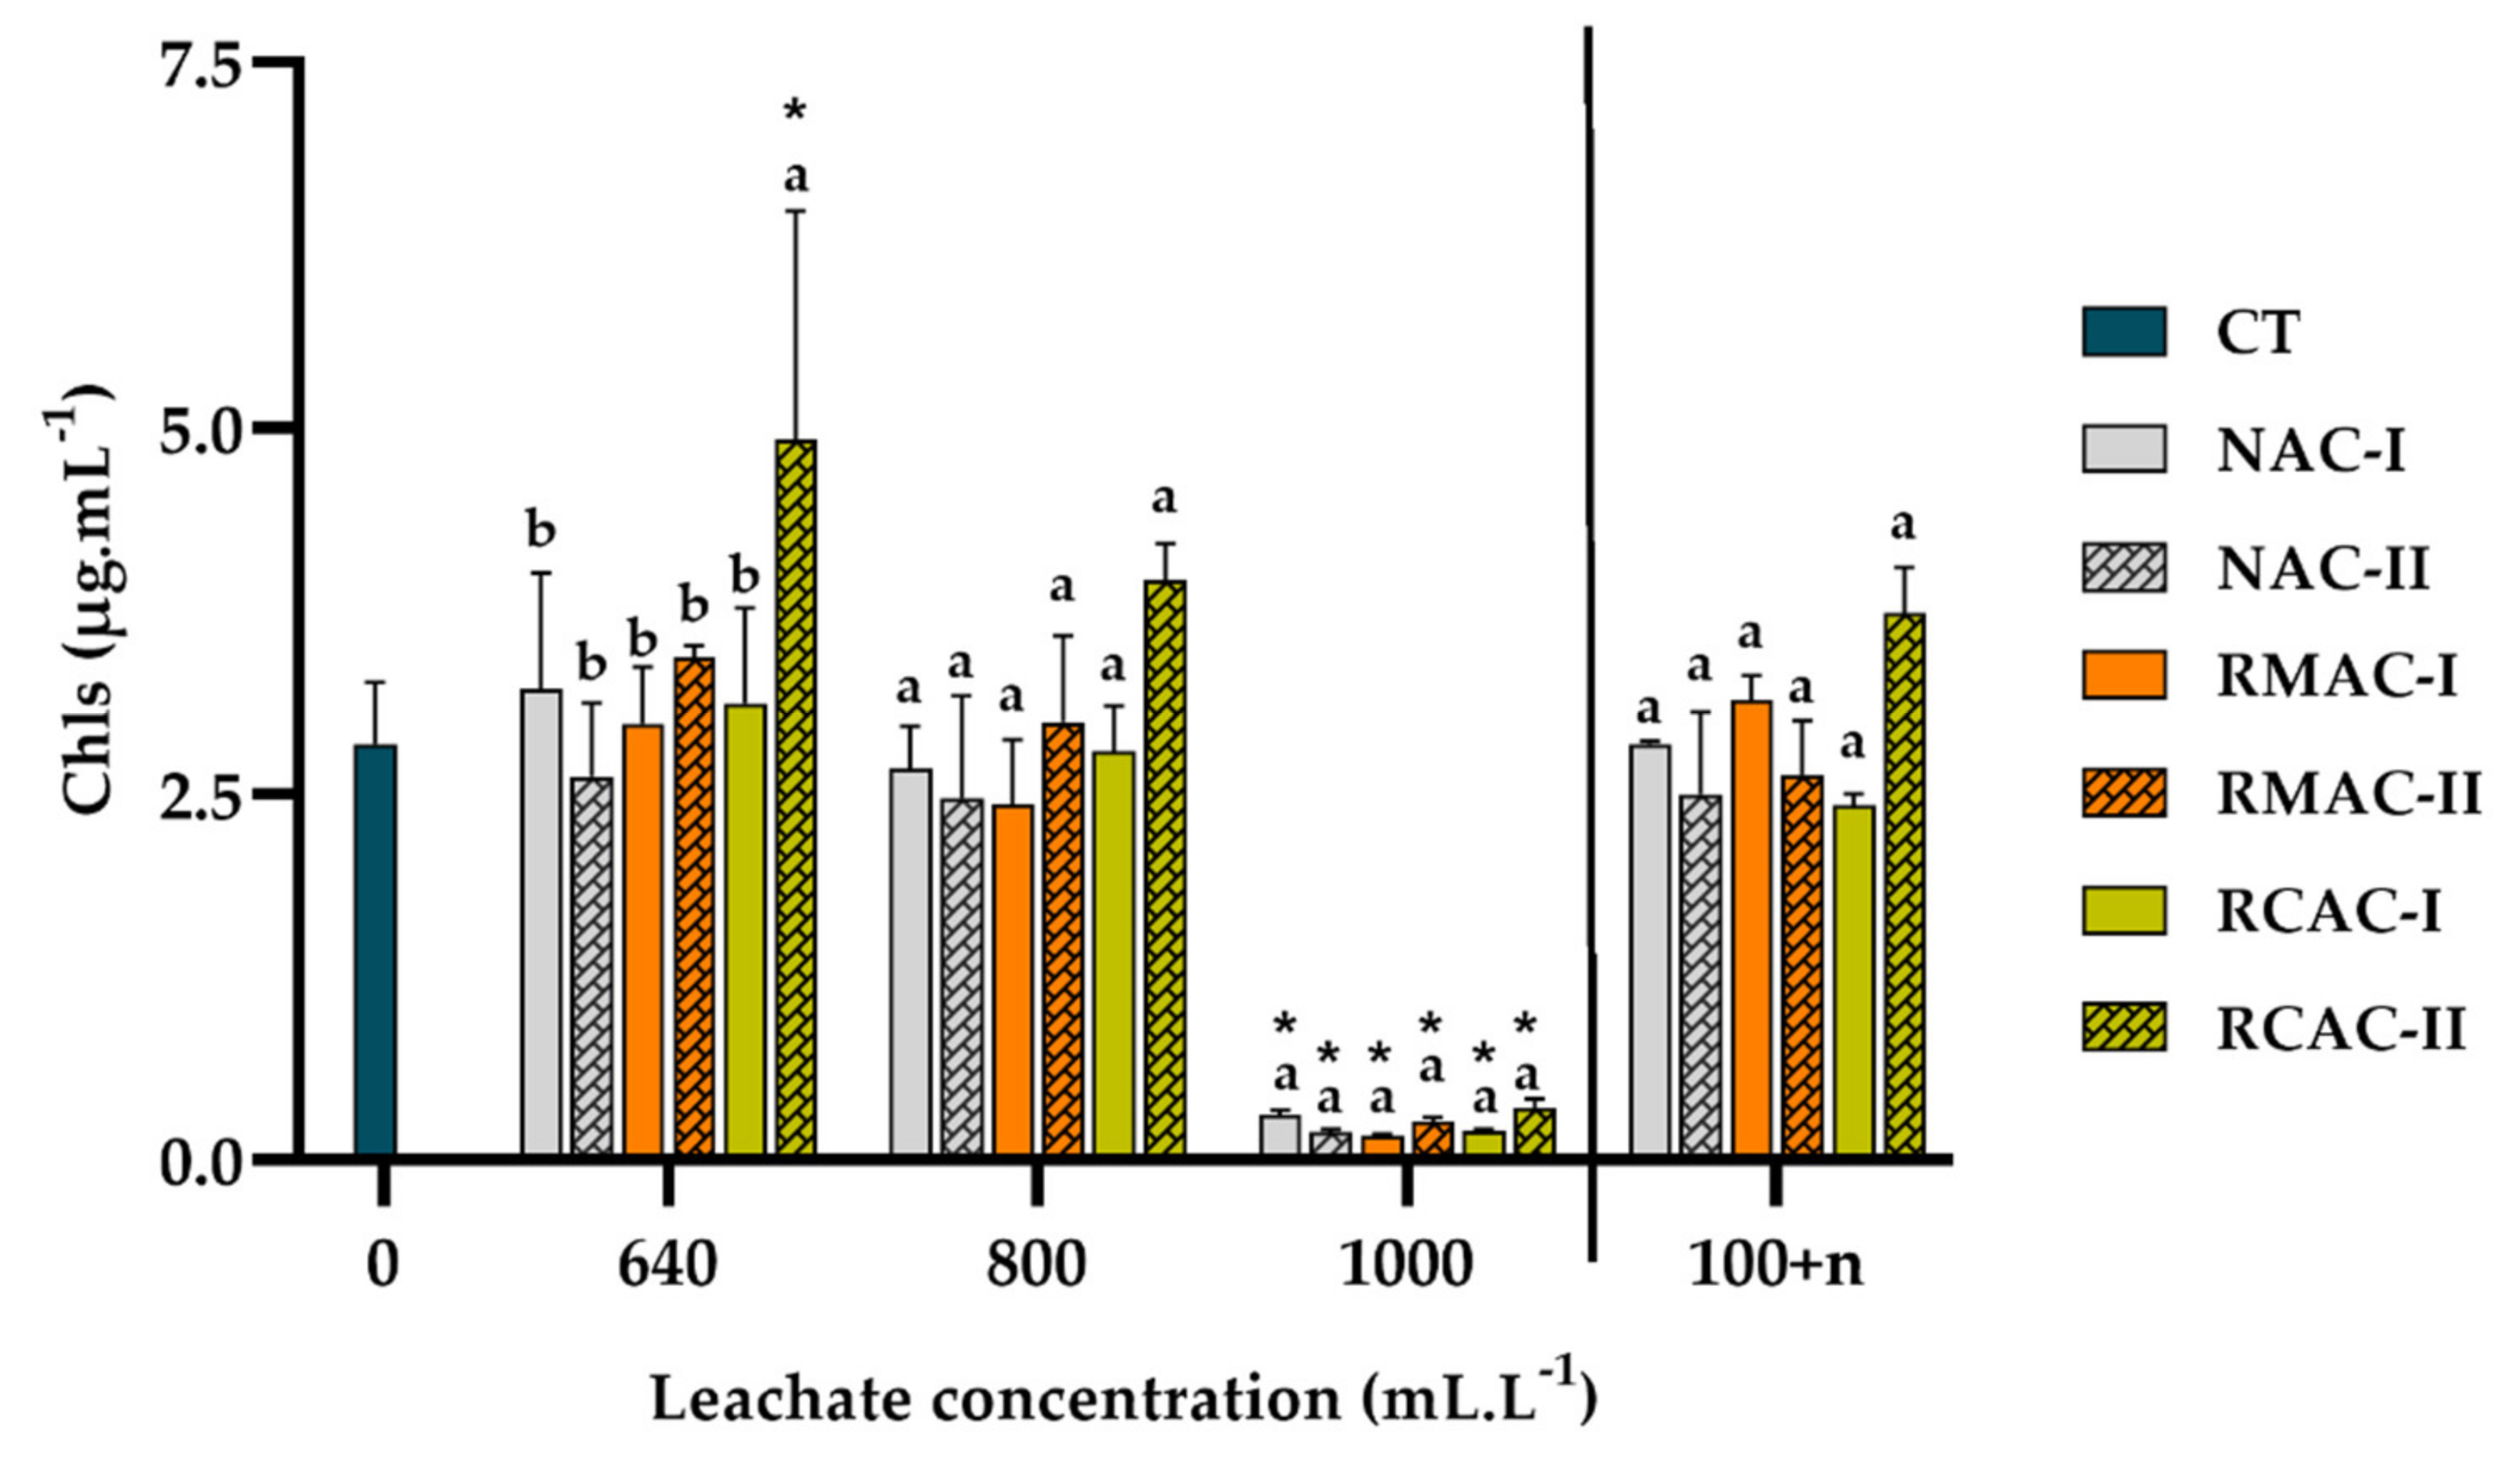
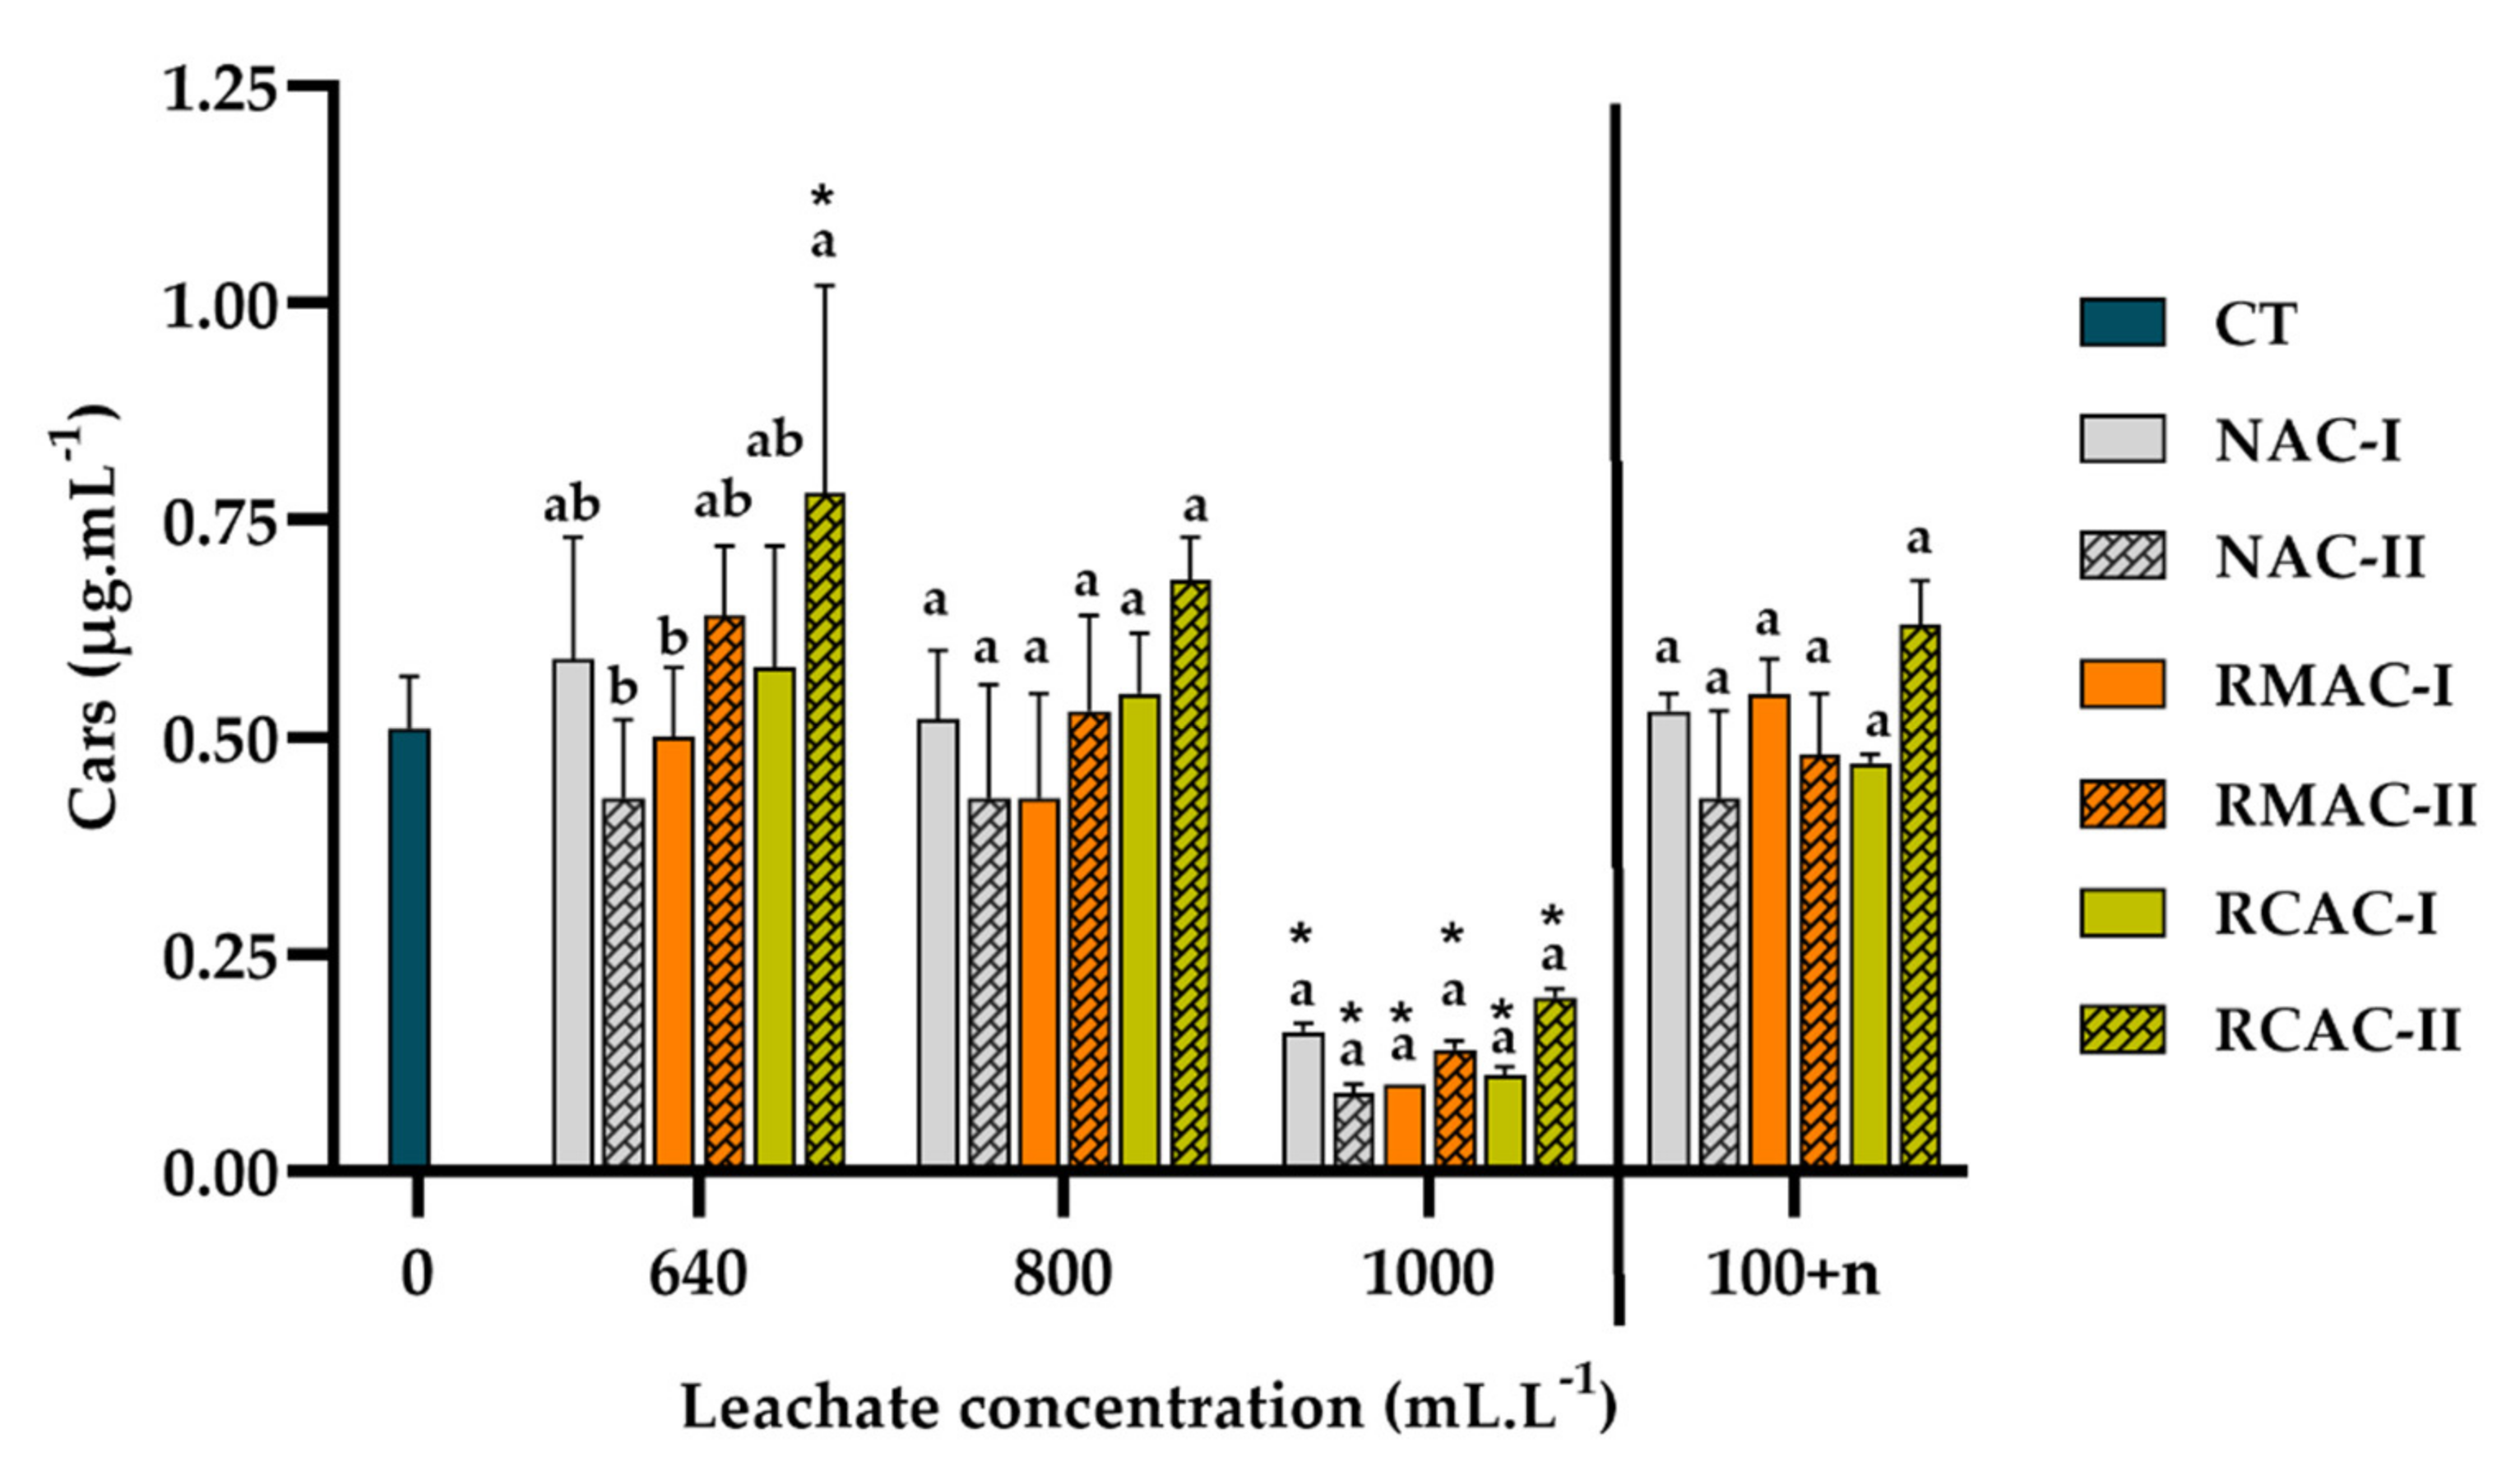
2.3.2. Determination of Photosynthetic Pigments

In the algal and duckweed test, the total chlorophyll a + b (Chls) and total carotenoid (Cars) content was determined after the exposition and growth rate determination.
First, 10 mL of algal suspension was transferred to 15 mL Falcon tubes and centrifuged (2360× g, 10 min, 4 °C). The supernatant was disposed of and 5 mL of 99.5% methanol (Lach-Ner) was added. The samples were homogenized in a vortex homogenizer for 15 s and placed in an ultrasound bath with ice-cooled water for 15 min. The extracts were homogenized again and centrifuged (2360× g, 10 min, 4 °C). The absorbance in the supernatants was determined at 470, 653, and 666 nm. Total chlorophylls and carotenoids were calculated according to [27] and expressed as pigment content per unit of algal suspension volume and as the Chls/Cars ratio.
In the duckweed test, the total frond material from a test vessel was transferred to a 15 mL centrifugation tube, covered with 3–8 mL of pure methanol (according to the total frond amount) and placed in the dark and 4 °C for 24–48 h. After extraction, the samples were centrifuged (2360× g, 10 min, 4 °C) and the absorbance in the supernatants was determined at 470, 653 and 666 nm. Total chlorophylls and carotenoids were calculated according to [27] and expressed as pigment content per unit of frond area and as the Chls/Cars ratio.
The absorbance was determined using the UV/VIS UV-1900 spectrophotometer (Shimadzu, Kyoto, Japan).

2.3.3. Soil Enzymatic Test

To determine the influence on soil enzymes, leachates were added to Lufa soil 2.4, characterized as clayey loam type (LUFA Speyer, Speyer, Germany). Fifty grams of air-dried soil were properly mixed with 15.3 g of nondiluted and untreated leachate in a sterile glass jar to achieve 70% WHC. Pure distilled water was used as a control sample. The containers were covered with sterile aluminum and placed under stable conditions (20 °C, light cycle 16 h/8 h; 1000 lux). The samples were left without humidity treatment for 56 days. Dry mass content (DM), pH, and soil dehydrogenase activity were determined 7, 28, and 56 days after soil contamination.
For the DM content, approximately 2.5 g was dried at 105 °C for 2 h and weighed. For this measurement, two replicates were prepared. DM was calculated as the fresh mass/dry mass ratio. The soil pH was determined in soil suspensions in 0.01M CaCl2, as described in [28].
Soil dehydrogenase activity (DHA) was determined using triphenyltetrazolium chloride (TTC; Sigma-Aldrich) as a substrate for the reaction. The procedure followed ISO Guideline No. 23753-1 [29] with some adjustments. For each sample, 2.00 ± 0.05 g was transferred to a sterile glass tube and 2 mL of 1% TTC solution in Tris buffer (pH of 7.8) was added. Each sample was prepared in triplicate, plus one blank (2.00 ± 0.05 g of soil, 2 mL of Tris buffer). The samples and blanks were carefully homogenized for 10 s and placed on a dark thermostat (25 °C) for 20 h. After that, each sample was extracted using 10 mL of 99.5% acetone (Lach-ner) and homogenized three times, every 60 min. Finally, the extracts were centrifuged (2360× g, 10 min, 4 °C) and the absorbance at 485 nm was determined (UV/VIS spectrophotometer (Shimadzu, Kyoto, Japan). The DHA was expressed as the amount of product formation, i.e., triphenyltetrazolium formazan per soil DM and time. Consequently, the data obtained were compared to the control values and recalculated as % inhibition/stimulation, as described in [26].

2.3.4. Statistical Analysis and Data Evaluation

A one-way ANOVA was performed on all ecotoxicity data sets. Normality was tested using the Shapiro–Wilk test. ANOVA was followed by Tukey’s post-hoc test to determine significant differences between samples. The nonparametric Kruskal–Wallis test followed by Dunn’s post-hoc test was used when the data did not meet the normal distribution. Ecotoxicity based on EC50 and NOEC values was evaluated according to the scale formulated in a previous study [26]. All statistical analysis was performed using GraphPad Prism, v9.1 (GraphPad Software, San Diego, CA, USA).

2.4. Carbonation Testing Process

Concrete structures need to be durable to ensure that service life is achieved; This plays a significant role in resistance to corrosion. This phenomenon is caused by carbonation; consequently, carbonation behavior is an important attribute to measure.
The simplified carbonation reaction of concrete:
Ca(OH) 2 + CO2 = CaCO3 + H2O
The Czech standard ČSN EN 12390-12 (73 1302) describes the carbonation resistance of concrete using test conditions that accelerate the rate of carbonation [24]. The method used in this research is inspired by this standard, but the conditions were slightly different.

Czech Standard ČSN EN 12390-12 (73 1302)

This document quantifies the carbonation resistance of concrete. The test conditions used an accelerated the rate of carbonation. The experiment is carried out under controlled exposure of carbon dioxide to an increased level after 28 days of hardening concrete samples. The carbon dioxide concentration should be within ±0.5% by volume of the target value.
For each test, the reference sample of concrete should be used. Samples for one test should be made from one concrete mixture. The concrete cubes are cast and cured for 28 days (in accordance with EN 12390-2 [30]), then placed in a storage chamber with carbon dioxide under normal conditions: 1 013 mbar at 25 °C, temperature 20 ± 2 °C, relative humidity 57 ± 3. In addition, 0.8 g of phenolphthalein powder was dissolved in a solution of 70 mL of ethanol and 30 mL of deionized water. Phenolphthalein was used as an indicator.
After the exposure period, which is 28 days, the carbonation depth is measured at three points on each of the four faces of the cube. To locate these points, the length of the edge is divided into four equal distances. Three samples of each mixture were measured and the mean carbonation depth at time t in mm was calculated as a result.

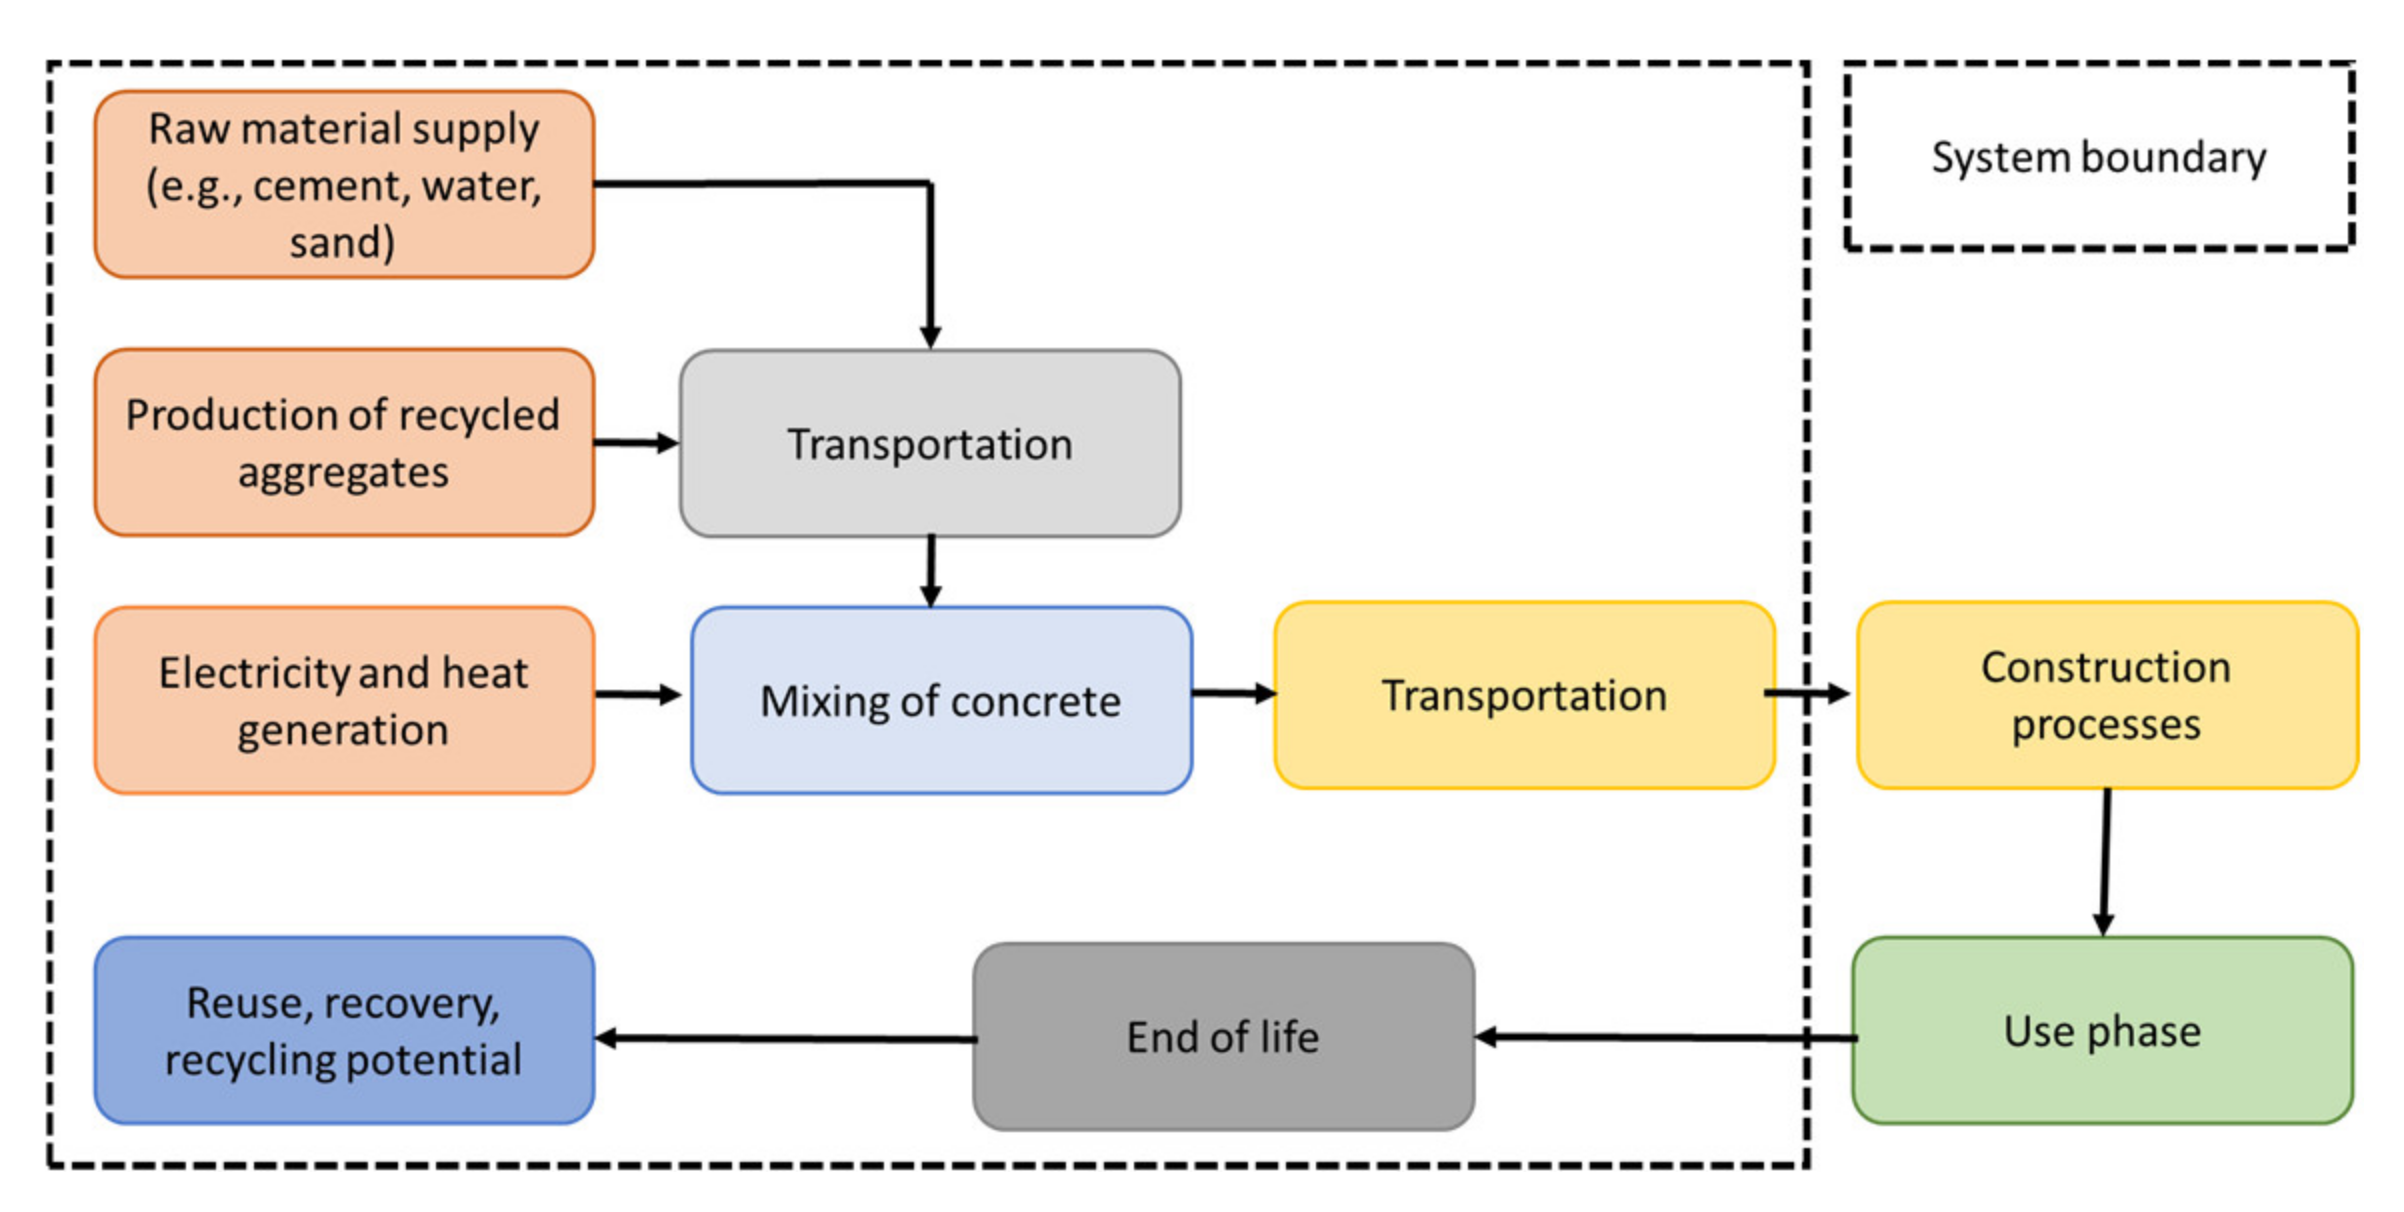
2.5. Life Cycle Assessment

To analyze the environmental performance of the described mixtures from the perspective of their entire life cycle, the life cycle assessment (LCA) method was applied as an analytical tool [31], which is used primarily to assess the environmental impacts caused by processes throughout the life cycle of a product or service according to the international standards ISO 14 040 and ISO 14 044 [32,33]. According to these standards, the LCA method consists of four steps: definition of goals and scope, inventory analysis, impact assessment, and interpretation.
Taking into account the scope and other conditions for the environmental assessment described in EN 15 804 + A2 for construction products [34], the LCA method was used to evaluate all elementary flows, including the inputs and outputs of materials and energy to the environment in the phases of raw resource production, transport of resources to the facility, production of ready mix concrete, and disassembly of concrete and its disposal in landfill.

2.5.1. System Boundaries and Functional Unit

The environmental impacts of the mixtures were related to the declared unit, which was defined as 1 m3 of the concrete mixture. The system boundaries of the compared concrete mixtures include raw material supply (cement production, water production, production of primary or recycled aggregate), transport of resources to a facility, mixing of materials, and their transport to site. The phase of use of concrete mixtures was not included according to EN 15 804 + A2. The boundaries of the system also include the end-of-life phase (EoL), which consists of the excavation of concrete in the process of deconstruction, the transportation and demolition of concrete waste in the landfill, and the disposal of waste in the landfill. The investigated system boundaries are described in Figure 2.

2.5.2. Life Cycle Inventory

To create the environmental model of the life cycle of the mixtures, GaBi software was used [35]. The mixtures were modelled according to the proportions described in Table 1. To model upstream processes, generic data from the GaBi database were used to describe the environmental impacts of resource production [36]. In addition, the end-of-life processes of concrete were modelled using the mentioned generic data. The energy supply was modelled using the Czech energy mix according to data from the reference year 2016. The transport processes were modelled as transporting on a 50 km distance using a truck trailer (EURO 3, up to 28 t gross weight).

2.5.3. Influence of Carbonation

As an alternative scenario, the CO2 uptake potential in concrete was calculated according to EN 16 757 [37]. The expected service life of concrete blocks made of the considered mixtures was assumed to be 50 years. The maximum theoretical uptake of CO2 was estimated for the cement used as 0.49 kg CO2/kg of cement. The assumed degree of carbonation was estimated at 0.85 on the basis of the potential future use of concrete as a foundation structure, which will be covered by ground.

2.5.4. Environmental Assessment

To evaluate the impacts of inputs and outputs on the environment, these elementary flows were classified and characterized using the Product Environmental Footprint 3.0 method [38]. This impact assessment method is recommended by the European Commission and uses several environmental indicators [39].

2.5.5. Normalization and Weighting

Taking into account the spectrum of environmental indicators, the results were normalized and weighted to obtain a single score evaluation of the mixtures considered. Normalized values were calculated by dividing the indicators’ results by normalized contributions for each indicator according to the normalization data set described in the PEF 3.0 method [39]. Similarly, the weighted values were calculated by multiplying the normalized results using weighting factors. Weighing is used to express the relative importance of each indicator. The data set of the weighing indicators is based on expert opinion and is described in the PEF 3.0 method [39].

3. Results

3.1. Physicochemical Properties of Concrete Leachates

Table 2 shows the results of the chemical analysis of the leachates. Mn, Co, Ni, Cu, As, Se, Mo, Cd, Ba, Hg, and Pb were below the detection limit; Cr was found only in NAC I. The main elements found in the leachates were Ca, K, and Na, while the concentration of Mg, Al, Fe, Zn, and Sr was below 0.5 mg.L−1. The chemical composition of the leachates was generally relatively similar. Only Zn content showed different patterns, with the highest content in RMAC I and the lowest content in NAC I. All leachates had similar pH (10.5–10.7), as well as electrical conductivity (162–232 µS.cm−2). The initial pH value decreased to 7.5–8.4 after both dilution and seven-day exposure under the light cycle and 24 ± 1 °C in the duckweed assay (Supplementary Materials, Table S1).

3.2. Aquatic Ecotoxicity

Basic ecotoxicity tests performed with water flea, algae, and duckweed showed similar dose-response patterns in all leachates (Tables S2–S4). The duckweed growth rate was the most sensitive endpoint, while the algal growth was the least sensitive.
For most samples, NOEC was found to be 800 mL.L−1 in the acute test for algae and water fleas, and 640 mL.L−1 in the growth rate of duckweed. Therefore, according to ecotoxicity indexes, all leachates were classified as non-toxic (Table 3).

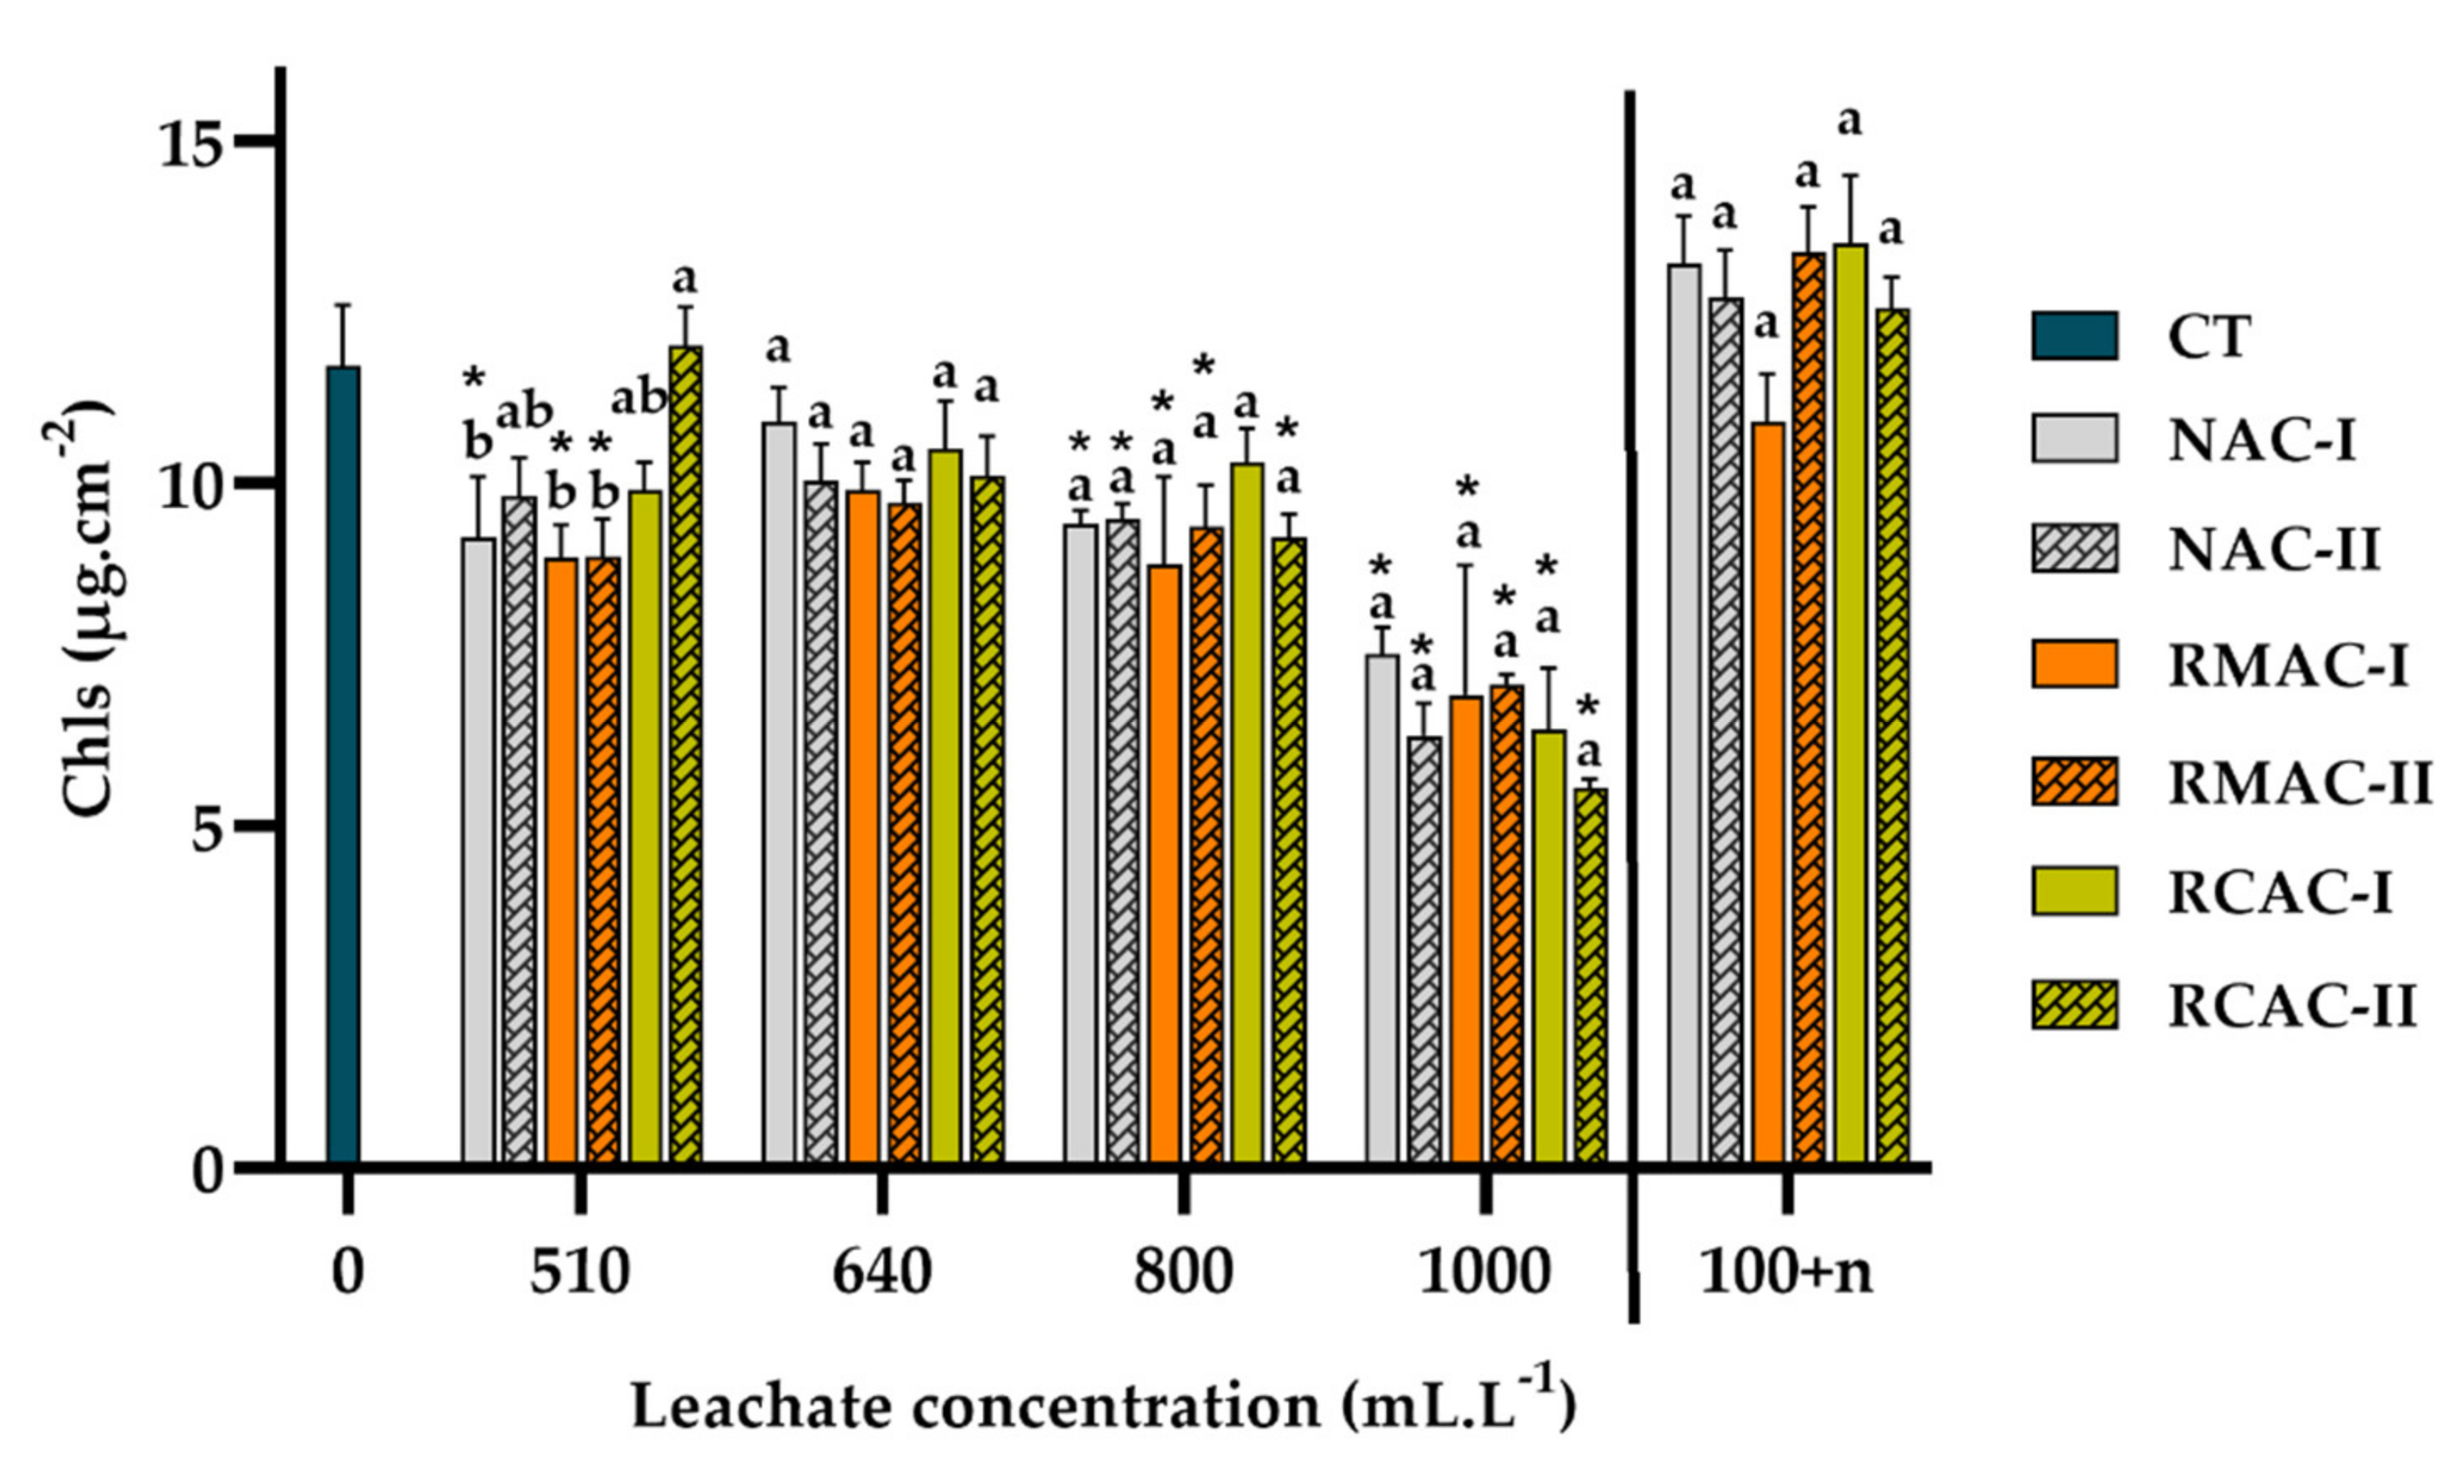
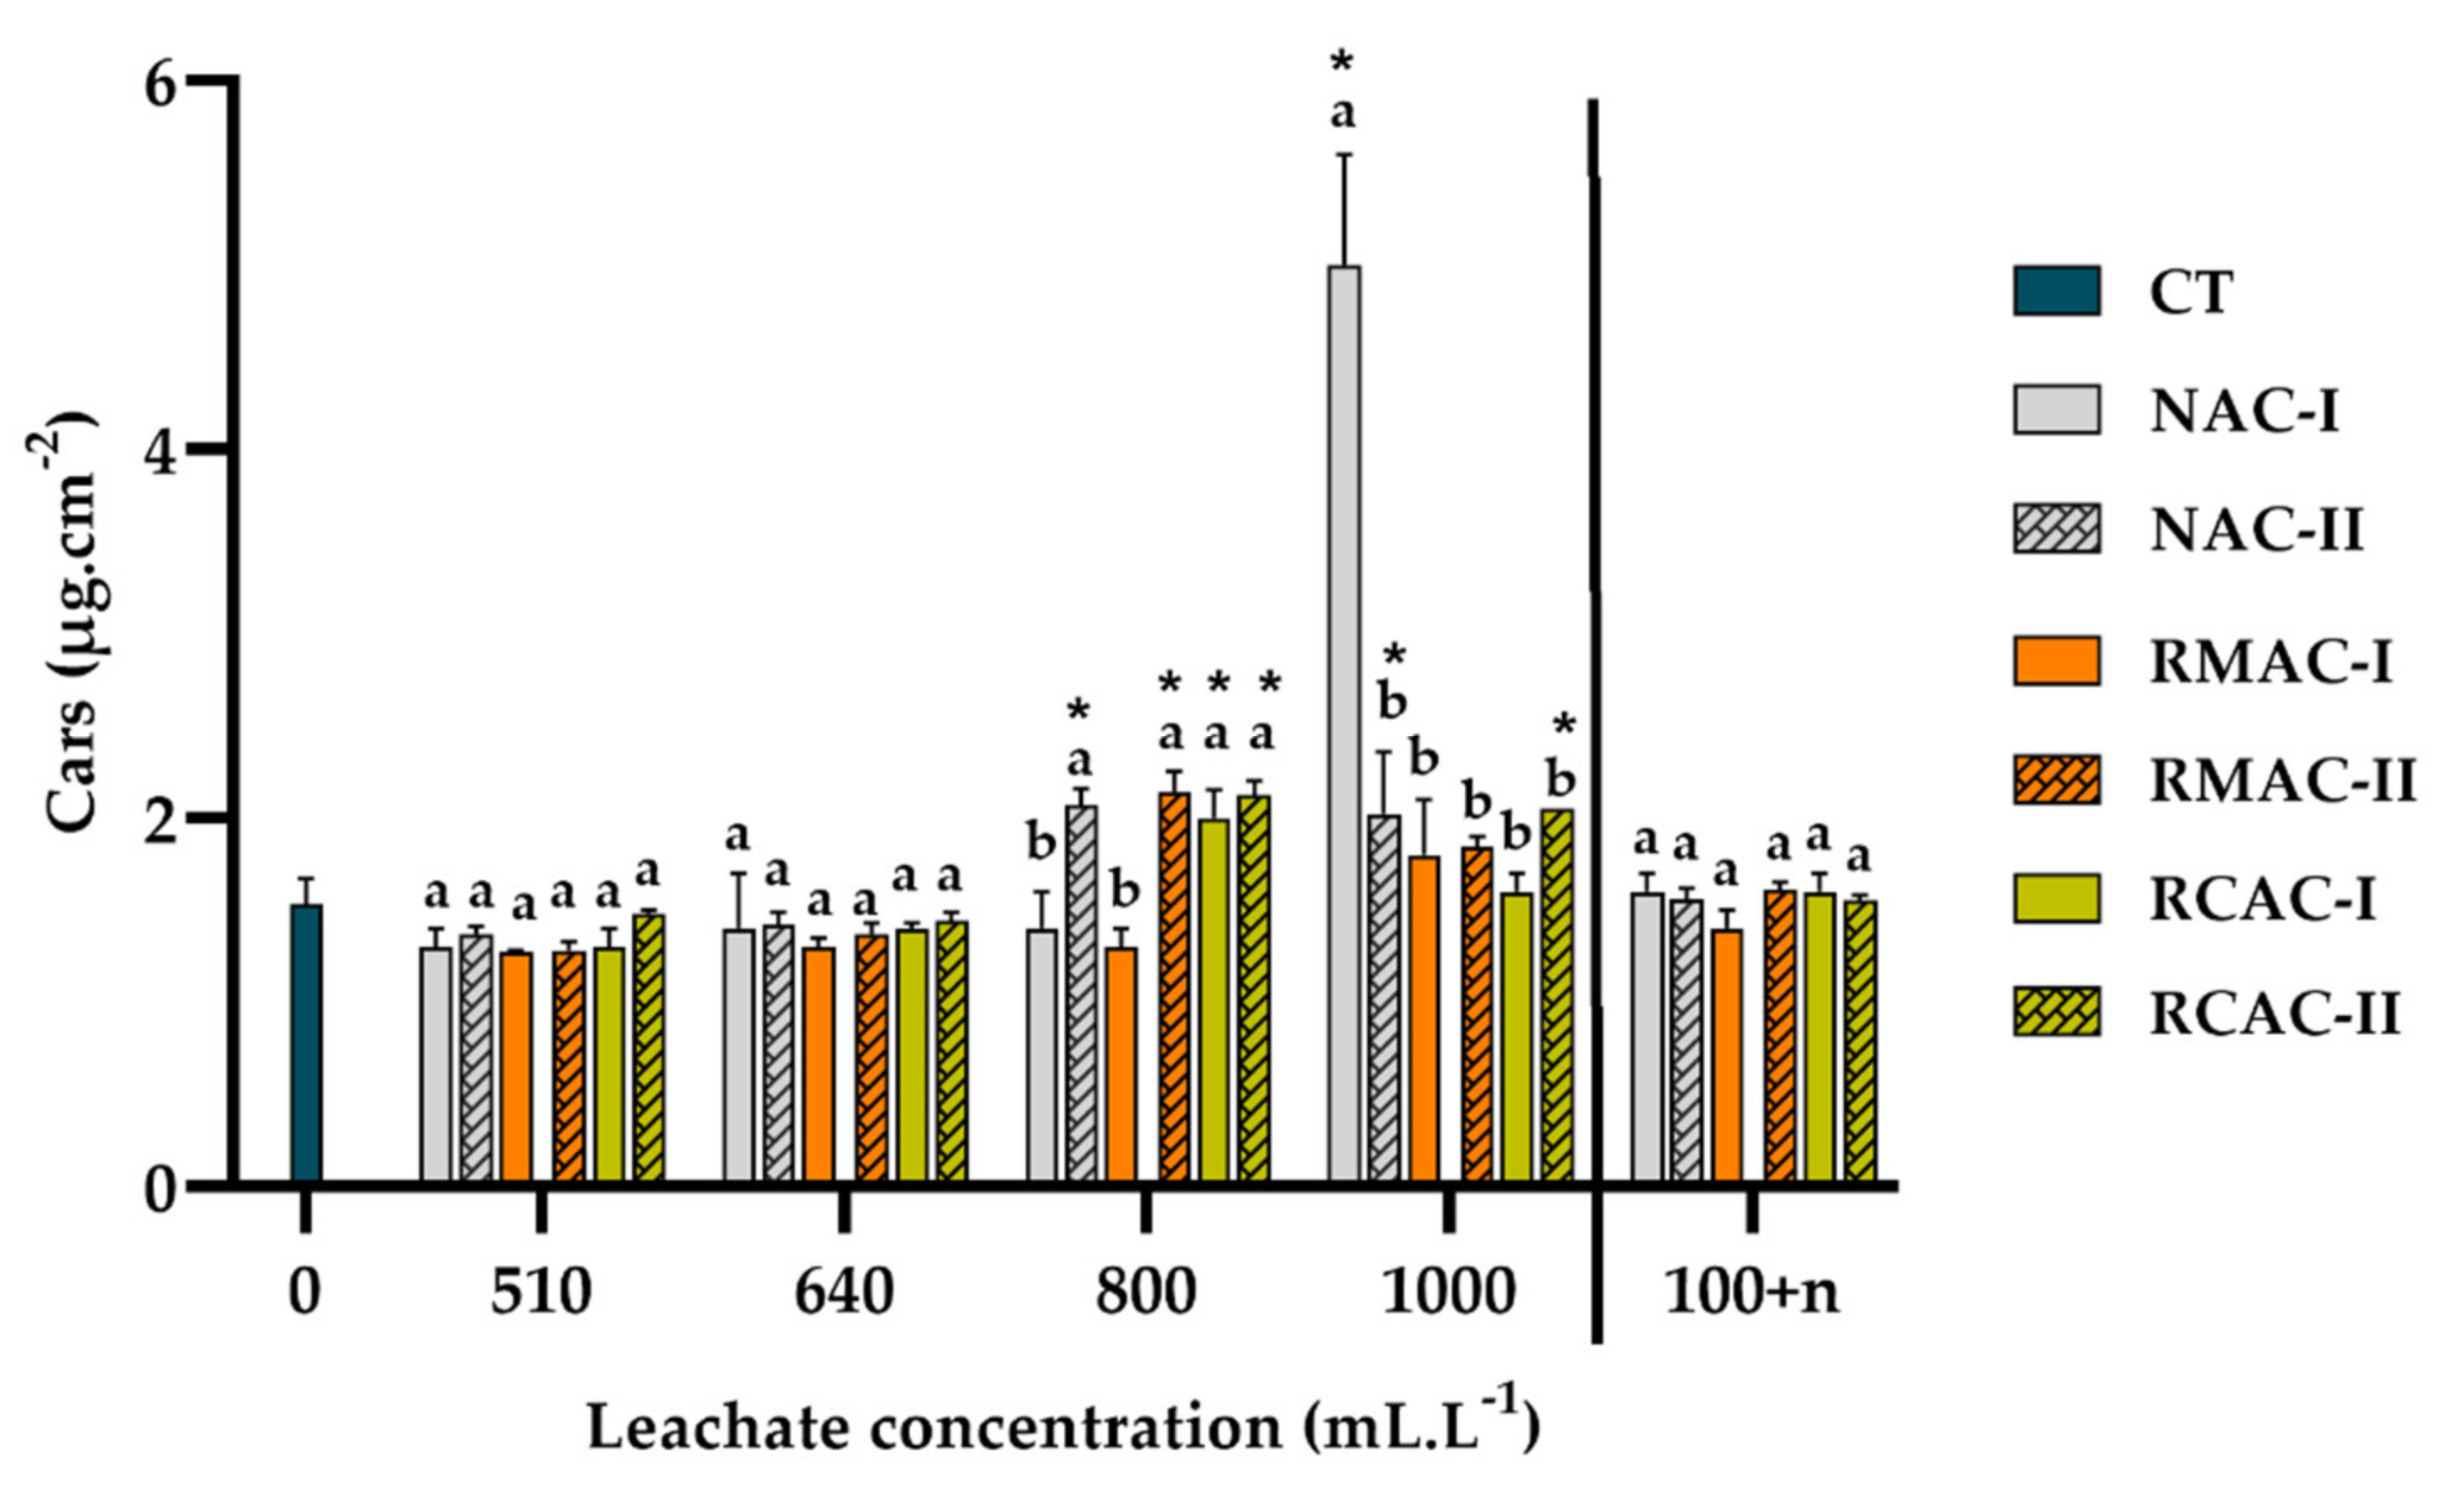
3.3. Photosynthetic Pigments

The evaluation of photosynthetic pigments in algae and duckweed was in accordance with observations at the morphological level. As shown in Table 4 and Table 5, the pigment ratio (total chlorophyll/total carotenoids) was significantly reduced only in non-diluted leachates in algae, and in 800 and 1000 mL.L−1 in duckweed with two exceptions (in NAC-I and RMAC-I diluted to 800 mL.L−1, the change in pigment ratio was not significant). The change in pigment ratio was caused by a decrease in both chlorophylls and carotenoids in algal suspension, where the negative effect of concentrated leachates was more pronounced in chlorophylls than in carotenoids (Figure 3 and Figure 4). The change in the pigment ratio in duckweed was caused by a decrease in total chlorophyll and an increase in total carotenoids at the same time (Figure 5 and Figure 6). The highest carotenoid content per frond was found in duckweed exposed to nondiluted NAC I leachate, which led to the lowest Chls/Cars ratio (Table 5).

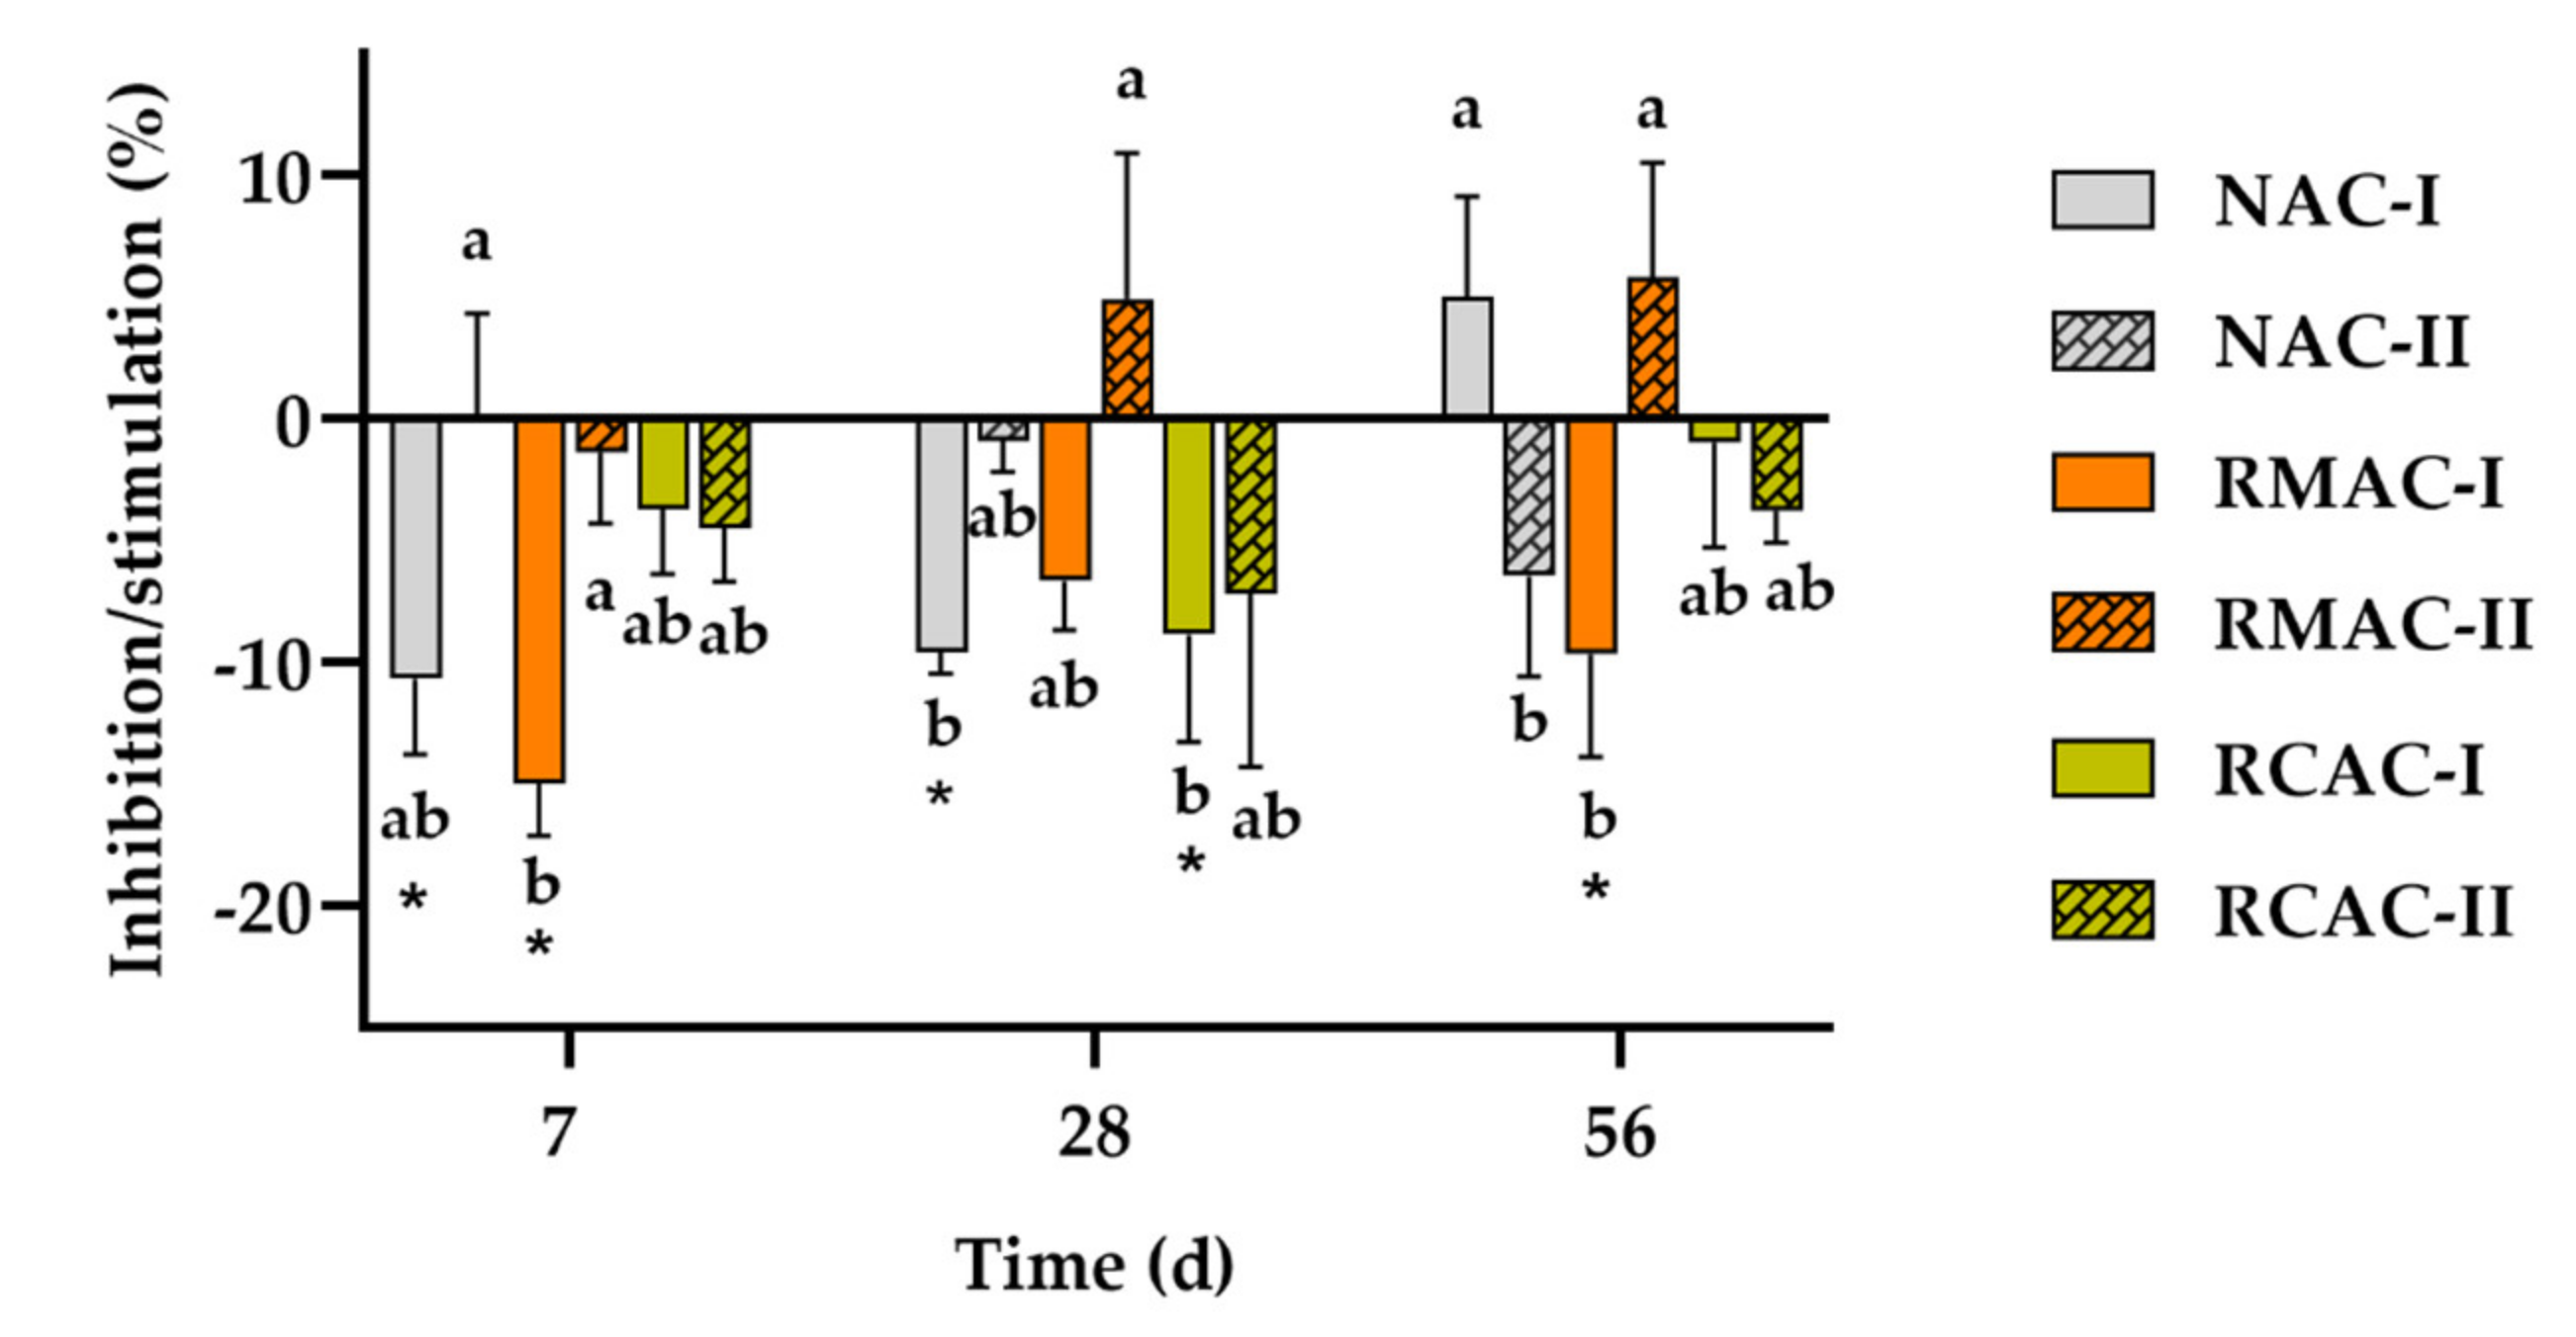
3.4. Soil Dehydrogenase Activity

The results of DHA in the soil are summarized in Figure 7. With a few exceptions, the enzymatic activity was slightly stimulated in soils amended with leachates. Stimulation was more pronounced in soils amended with concrete leachates of strength class I. However, the differences among samples, as well as the stimulation, were usually not significant. RMAC II was the only leachate that caused slight inhibition in all measurements, while soils contaminated with NAC I leachate changed their reaction from significant stimulation (−11% and −10% after 7 and 28 days, respectively) to low inhibition (5%) at the end of the exposure. The highest stimulation was observed in soil contaminated with RMAC I leachate after seven days (15%). Generally, it can be said that undiluted leachates did not significantly affect soil microbial activity, or caused a slight increase of up to 15%. The pH of the soil mixtures was relatively similar to that of the control soils (Table S5). The soil pH ranged between 5.7 and 6.0 after seven days and dropped to 5.3–5.6 after 56 days of exposure; therefore, according to the soil pH [29], all samples and the control remained acidic during the whole experiment.

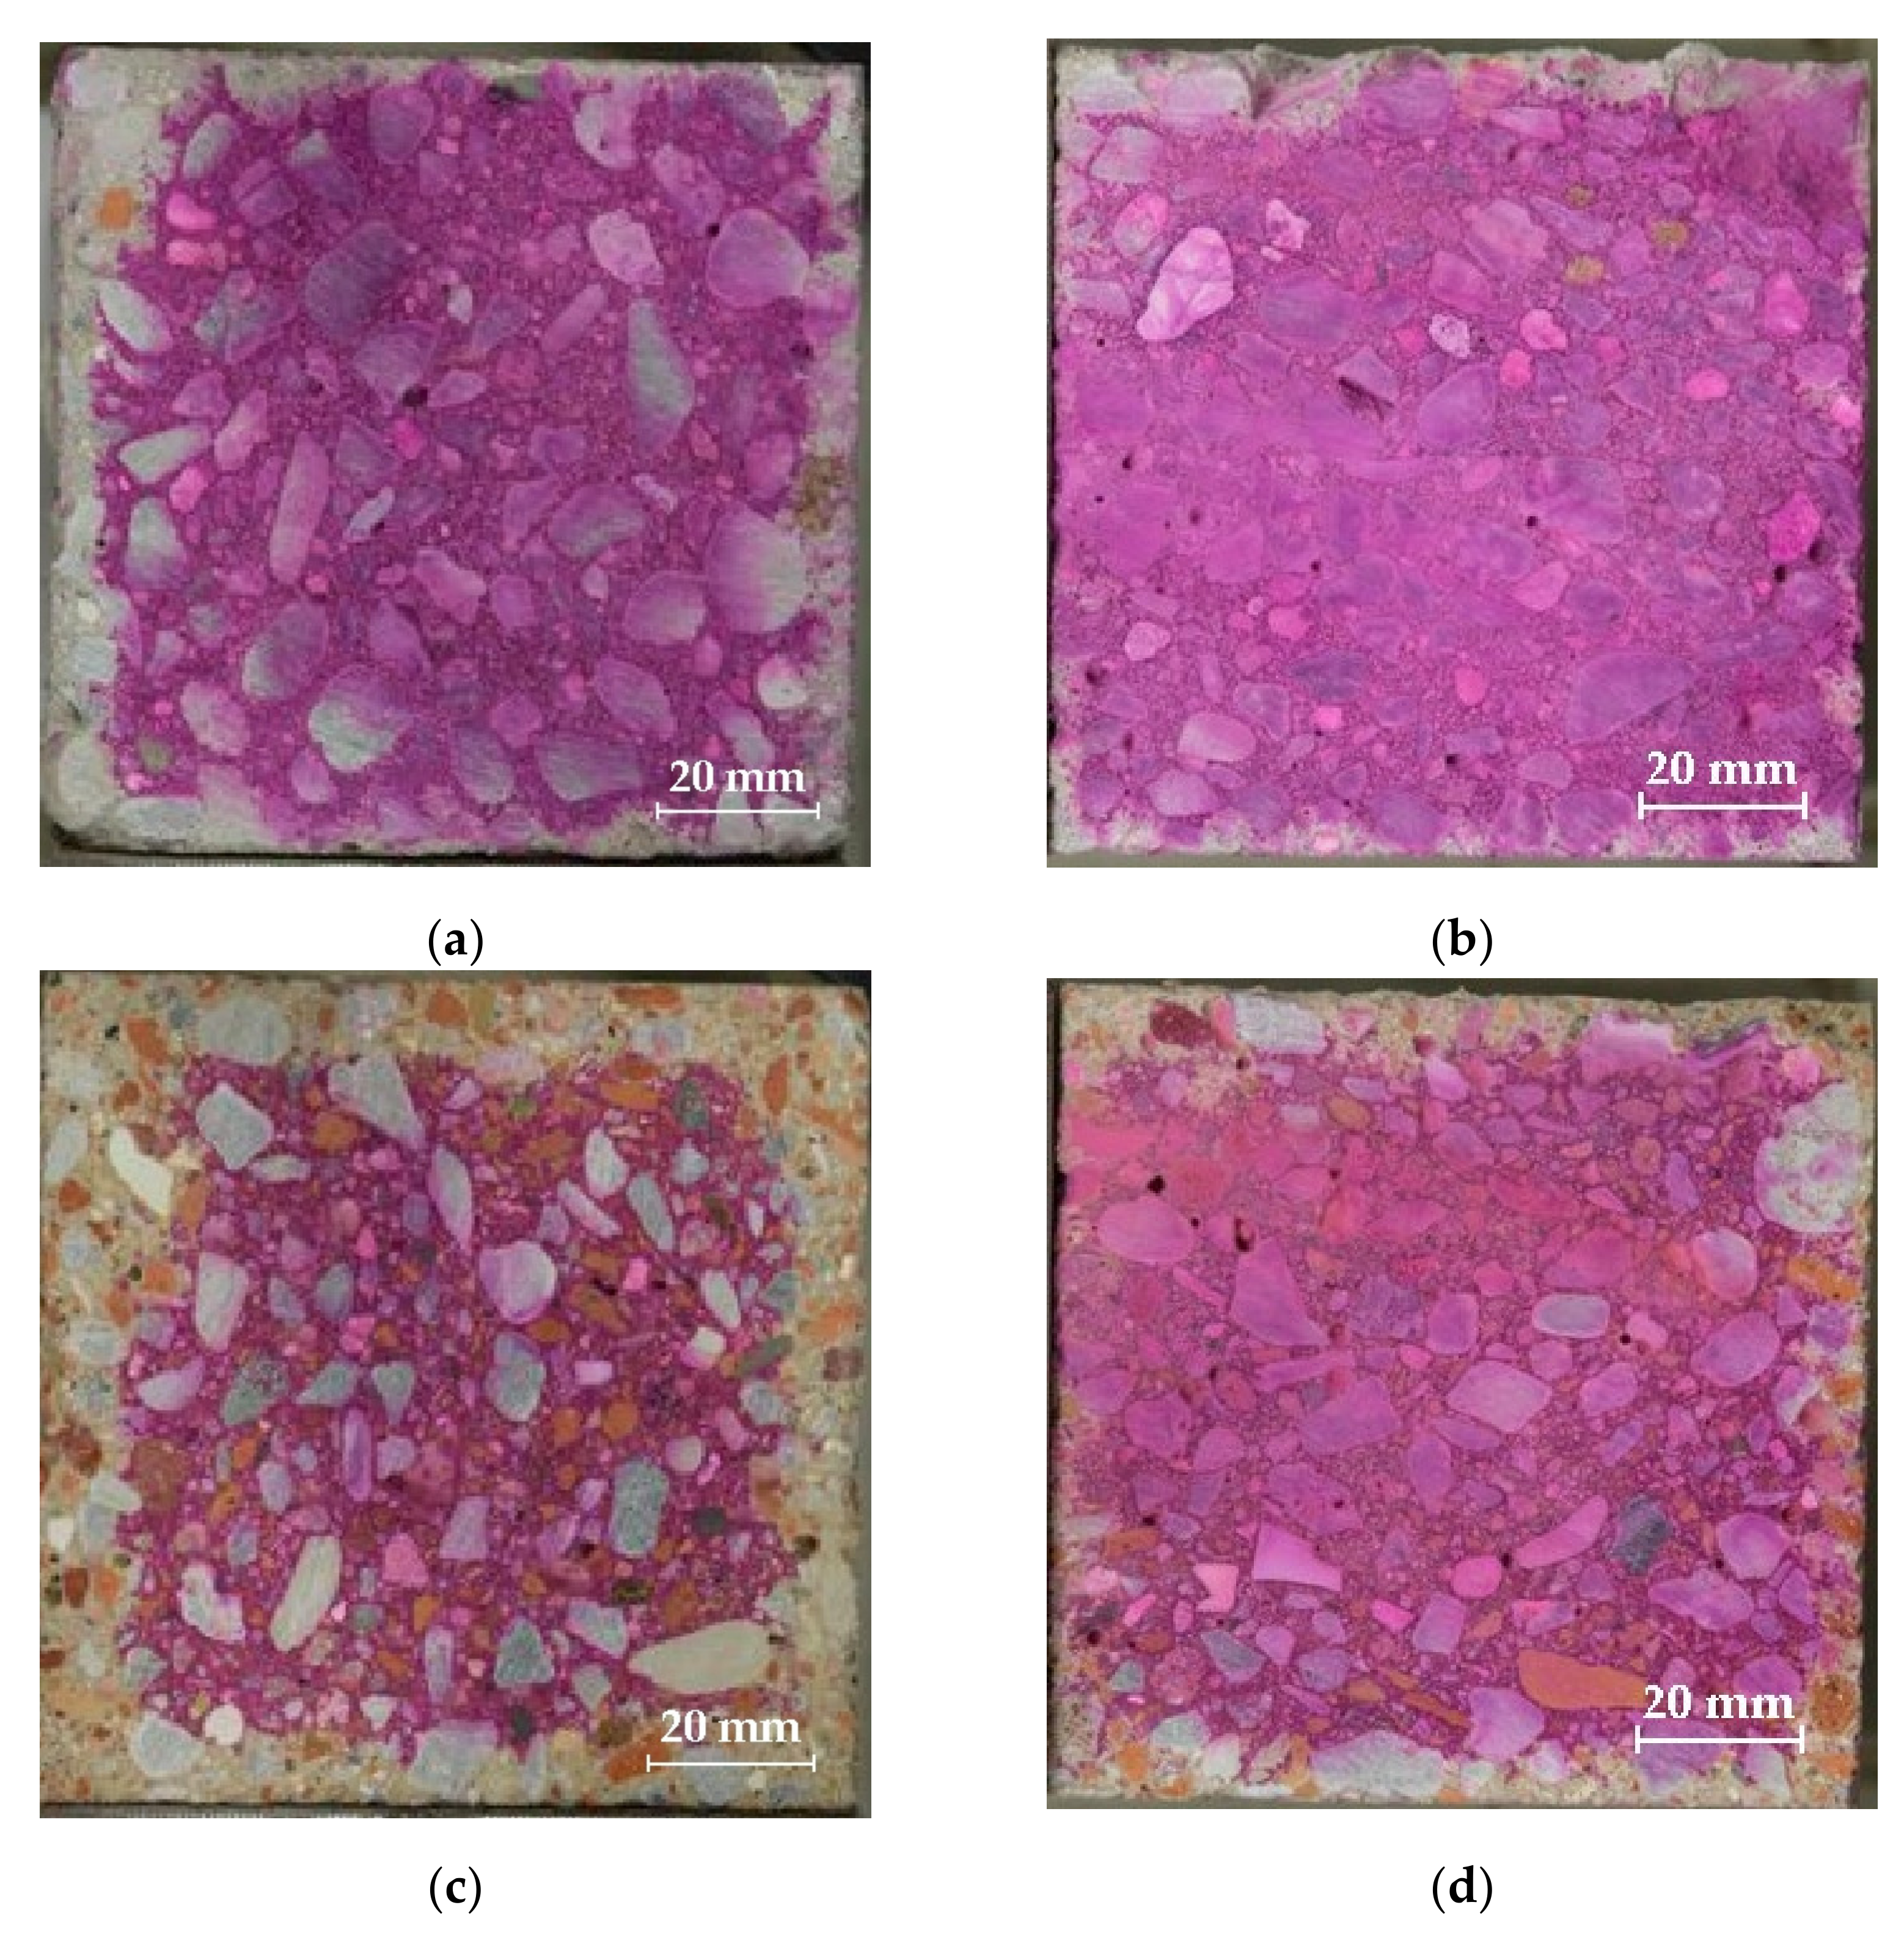
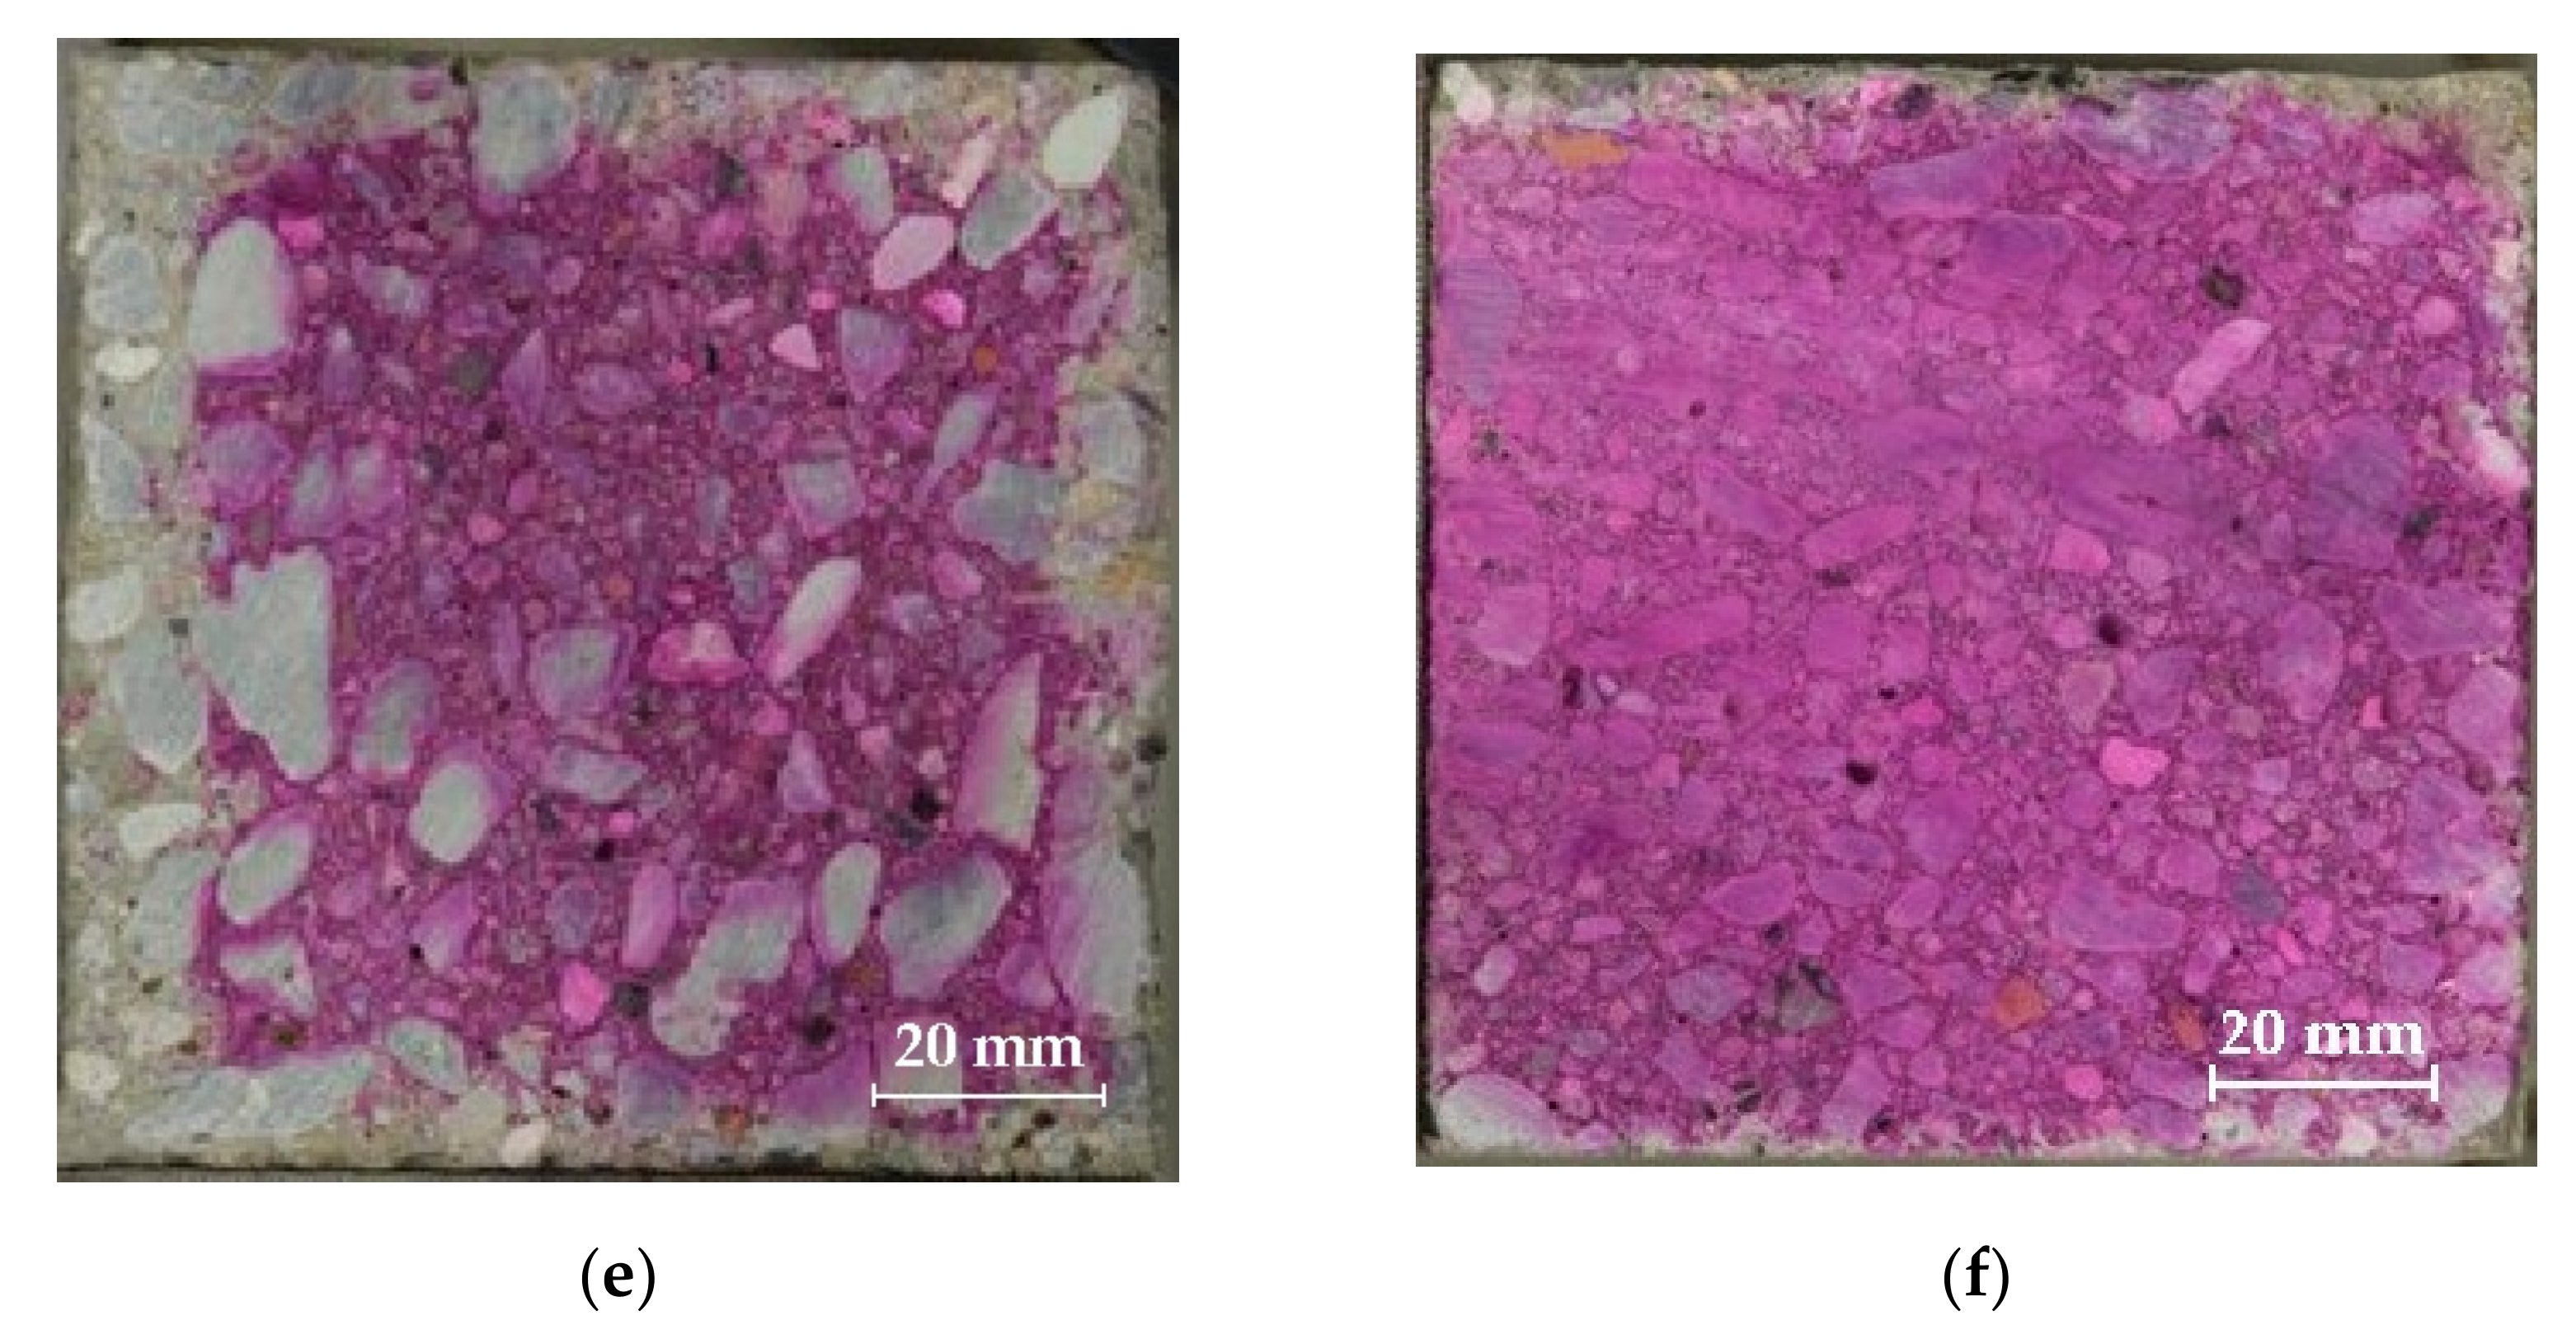
3.5. Carbonation Effect

There are four basic stages of carbonation; most structures reach the maximum of the second stage. The amount of calcium carbonate formed does not completely characterize the carbonation stage [40]. By finding out in what form CaCO3 is present, it is possible to characterize the carbonation process and, at the same time, assess the situation of carbonated concrete. Studies that consider concrete carbonation in general show that concretes of the lower strength class (C16/20) reach deeper carbonation depths compared to the higher strength class (C25/30) [40,41,42]. This fact is also connected with factors such as porosity and density beside concrete strength [43,44,45]. Research dealing with carbonation effect has proved that with increasing porosity and density, the carbonation effect is decreased. This phenomenon is also confirmed in this research (Figure 8). The purple-red color adheres to the noncarbon part of the sample, where the concrete is highly alkaline. There was no coloration in places with reduced concrete alkalinity. Mixtures NAC-I, RMAC-I, and RCAC-II have shown deeper penetration compared to the corresponding higher-class concrete (NAC-II, RMAC-II, and RCAC-II). Carbonation depth was determined by image analysis using NIS Elements (v5.20, Laboratory Imaging, Prague, Czech Republic).
The results of the carbonation depth are summarized in Table 6. The NAC-I value 4.41 mm was more than one and a half times higher compared to the same mixture in the higher concrete class NAC-II 2.65 mm. This trend appears similarly in the other mixtures as well, but the ratio increases from 1.6 to 2.9 with RMAC, and to 3.6 with RCAC. In general, the deepest penetration was observed in RMAC in both evaluated grades (10.04 mm and 3.37 mm). However, the RCAC-I was extremely high compared to that of NAC-I. Meanwhile, RCAC-II (with the value 2.45) was almost comparable with NAC-II (2.65).

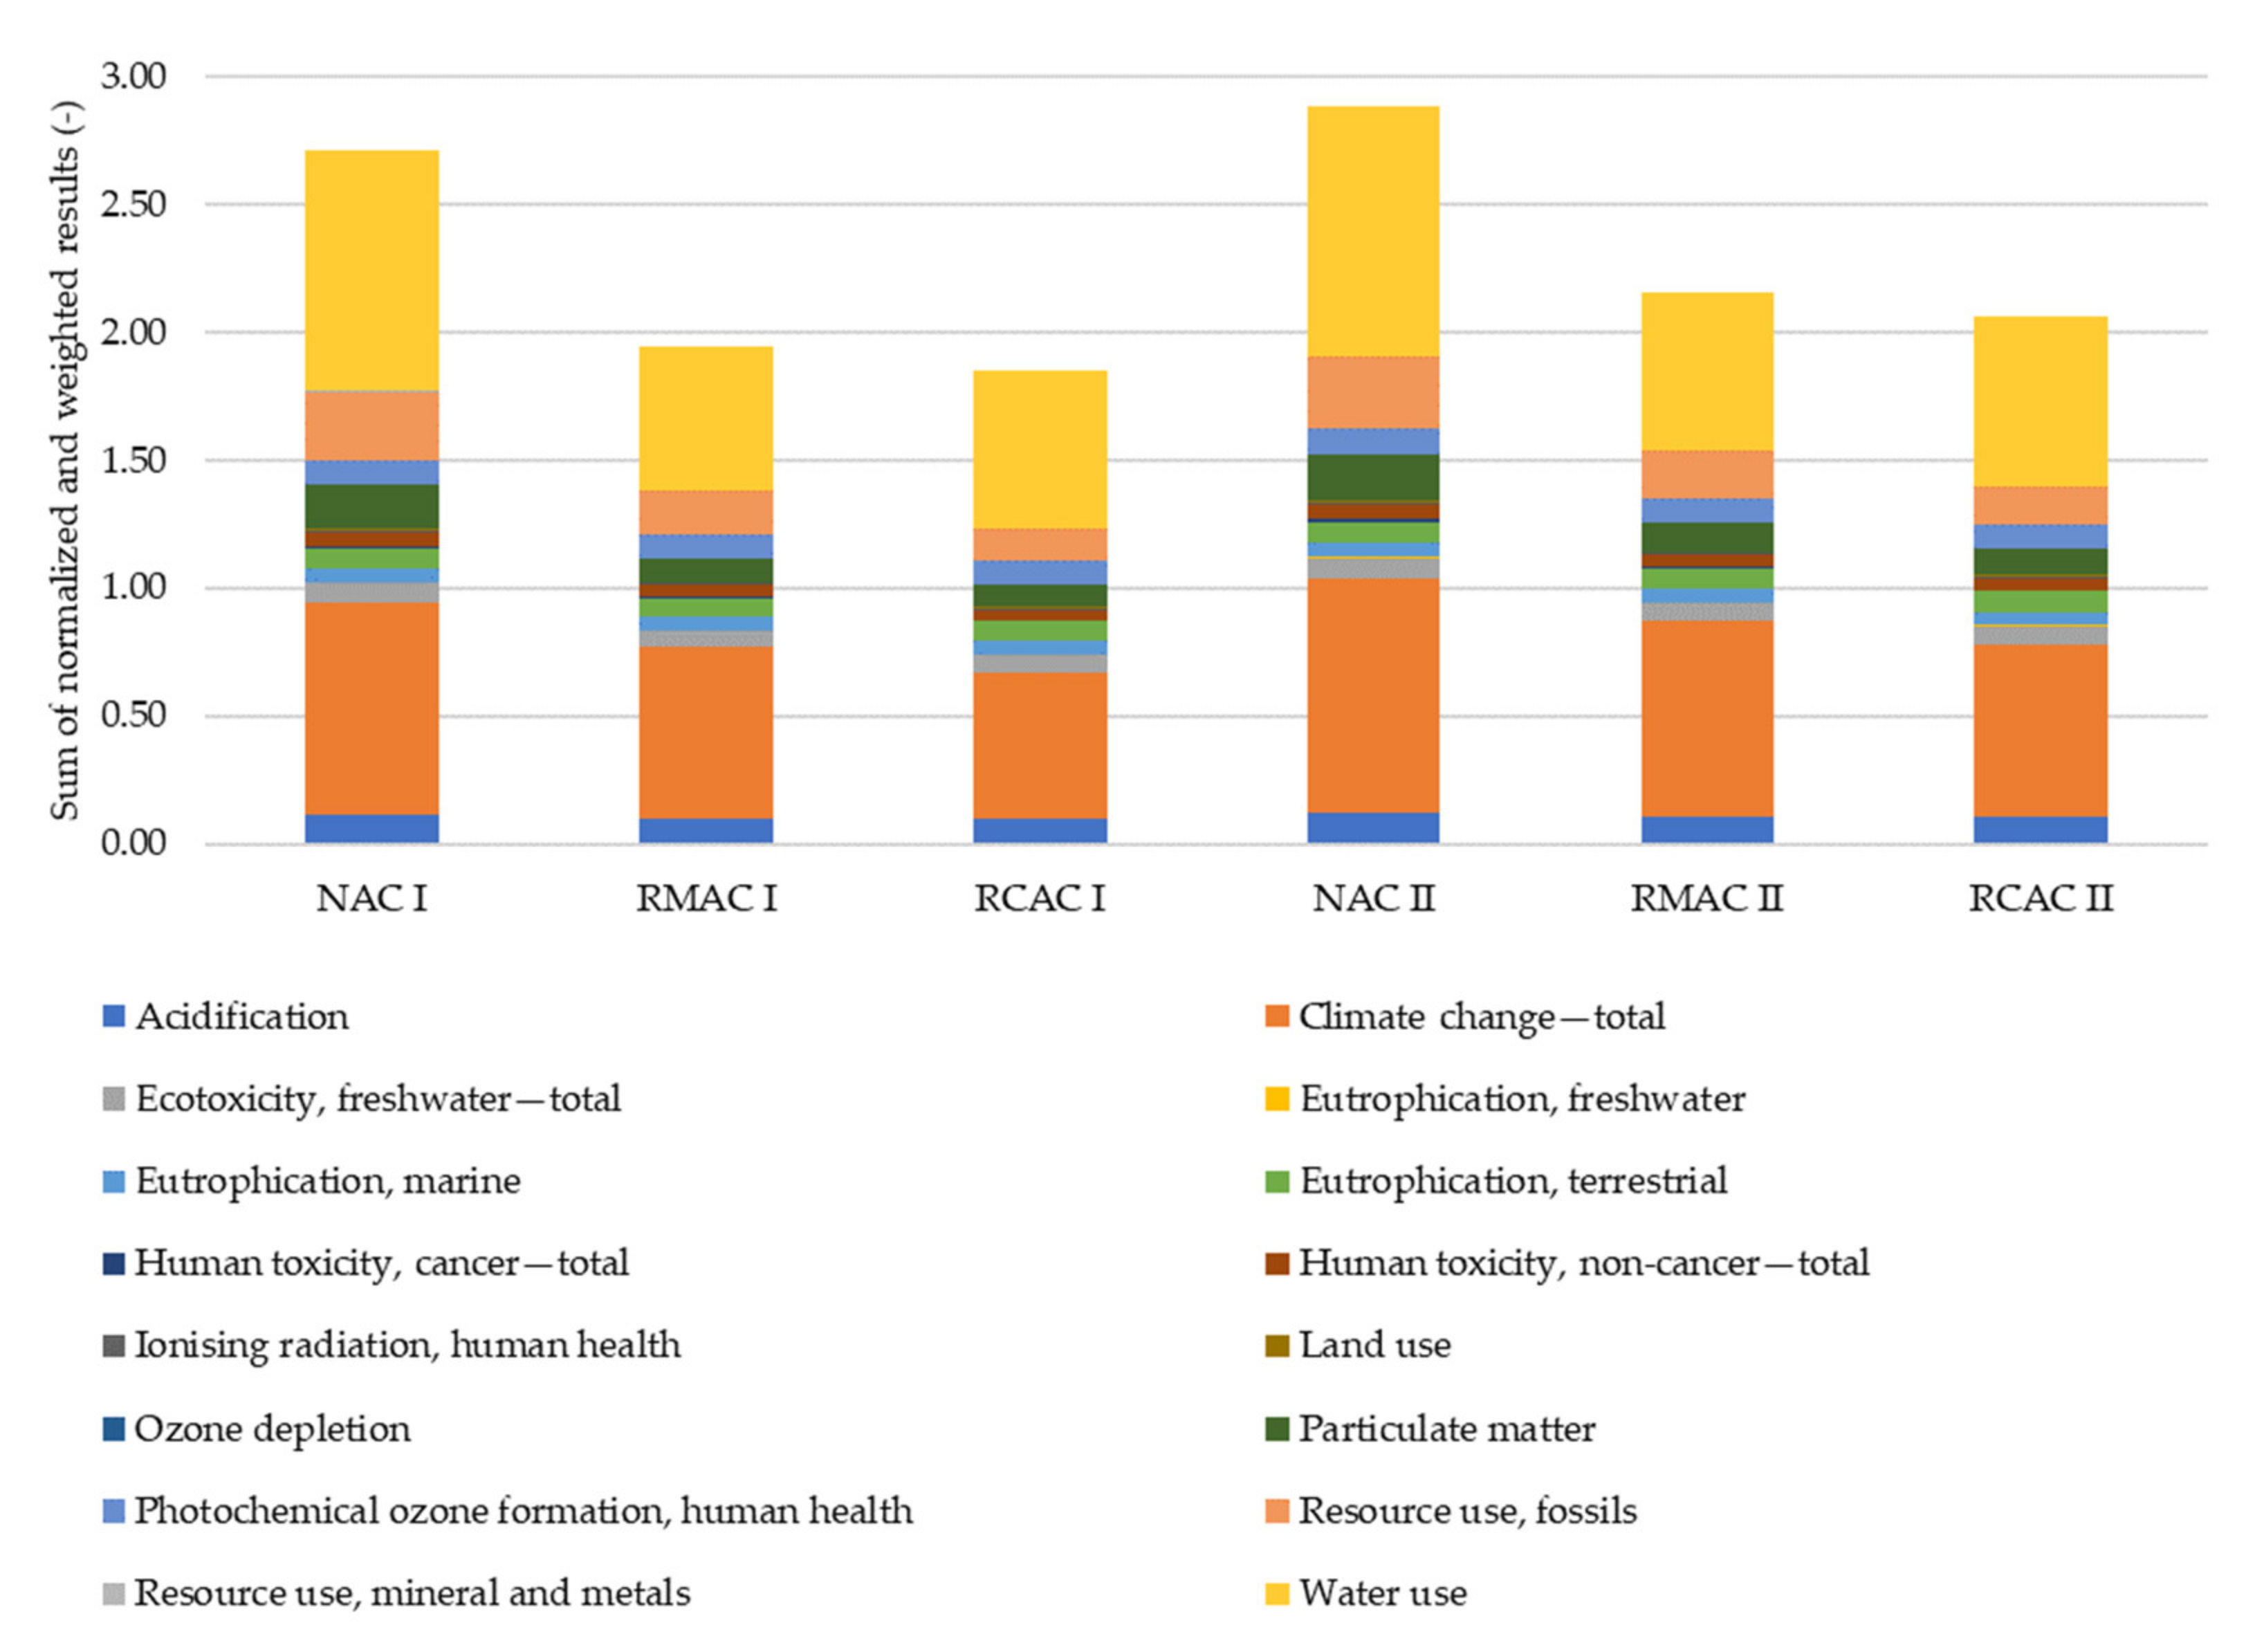
3.6. Results of Environmental Assessment

The environmental assessment was performed using the LCA method and the potential environmental impacts were calculated using PEF 3.0. The results of this assessment are given in Table 7.
Taking into account the climate change (total) indicator, which describes the potential impact on one of the key categories, mixtures with natural aggregates cause a higher impact than mixtures with recycled aggregates in the same strength class. Similarly, NAC has a greater impact in most categories. This is affected by the dominant influence of cement. Mixtures in the same strength class are designed with the same amount of cement, so their potential impact is mainly affected by this. However, there is also the influence of the beneficial impact of recycled aggregates, which are used as replacements for natural gravel in the mixture.
In comparison of the two types of recycled aggregates, recycled concrete aggregate has a more beneficial impact than recycled masonry aggregate. This is mainly affected by the higher amount of iron scrap, which can be recycled from concrete structures with steel reinforcement.

4. Discussion

4.1. Impact of Chemical Composition on Leachate Ecotoxicity

Except for reference samples, the concentration of leached elements from concrete cubes was significantly lower compared to leaching patterns of homogenized recycled aggregates, as expected (Table 2, [25]). However, the general proportion of leached elements was similar for primary materials and construction applications. Heavy metals which are non-essential for organisms, i.e., hazardous at any concentration (As, Ba, Cd, Hg, Ni, and Pb), were below the detection limit. Ca, Na, and K that belong to the main metals released in concrete leachates [4] are not considered toxic; in fact, quite the opposite, as they are essential mineral macroelements that are included in the culture media for both crustacean and aquatic plants [46,47,48]. Mg, Fe and Zn represent other mineral nutrients required especially by plants. However, Zn is included in risk metals and therefore has to be analyzed in wastewaters, sludge or waste leachates [49,50]. Moreover, secondary salinization of surface waters and soils caused by increasing concentration of ions including Na+, Mg2+, Ca2+, K+ and Fe ions together with climate change is an issue of growing concern [51,52,53]. In this study, the essential minerals were often below the concentration required in growth media.
The results from ecotoxicity tests indicate that the high growth inhibition/immobilization in original untreated leachates was caused most particularly by lack of nutrients. This can be considered as a favorable result because abundant elements in eluates entering aquatic or terrestrial environment can cause ecological imbalance [54,55].

4.2. Selection of Leaching and Ecotoxicity Testing Design

Various leaching test methods have been reported from batch tests in one stage, percolation tests, and long-term tests with leachant renewal [56]. For the leaching experiment, we have chosen the simple batch design in one stage that was already applied in the previous study [26] to compare the ecotoxic potential of recycled glass waste in the form of homogenized material and its subsequent use in concrete cubes. This 24-h leaching design was also chosen to prevent potential metal sorption on glass vessels, change of the leachate pH in time, biocontamination, as well as potential biodegradation of the leached compounds.
Ecotoxicity tests are usually based on a simple experimental design with acute exposure that provide quick screening of potential environmental risks. However, acute exposure which usually lasts several hours to several days is suitable mainly for detection of larger amounts of hazardous substances affecting living organisms. To detect the potential risk of lower concentrations of toxicants, chronic ecotoxicity tests may be used. Such methods are time-, space- and sample-consuming, and thus can be problematic for routine application. The use of semi-chronic tests provides a suitable solution.
Ecotoxicological impact of concrete leachates is usually tested by a set of two or three aquatic bioassays. In consumers, the most popular test is immobilization of freshwater or marine crustaceans [1,2,3,4,5,57,58]. The embryonic stage of zebrafish eggs (Danio rerio) represents another possibility of how to avoid problematic animal models, as the early developmental stage is not protected by regulatory framework [59]. In the inter-laboratory study, tests with zebrafish eggs was applied, but was evaluated as the least sensitive model [57]. Marine luminescent bacteria Aliivibrio fischeri (previously Vibrio fischeri) is often used in concrete leachate testing [1,57,60] as the test design is simple, short-term (30 min exposure), and easy to perform using modern luminometers [61]. Heisterkamp et al. [57] reported the bacterial luminescent test as the most sensitive for construction product evaluation. Plant models can be examined at both the individual (lethality, necrosis) and population (reproduction) levels, making them semi-chronic tests. At the same time, additional endpoints at the biochemical level [9,60] can be determined. As duckweed and unicellular algae reproduce asexually, they represent genetically homogeneous plant material and have another advantage over seed germination tests [9].

4.3. Photosynthetic Pigment Ratio as Stress Indicators in Aquatic Plants

Aquatic plants growing in metal-contaminated waters are able to accumulate heavy metals [62]. Besides the negative effect on plant growth, metal contamination also causes oxidative stress, as reported for duckweed exposed to Cd, Cu, Cr, and Hg [63,64]. Oxidative stress in aquatic plants can be detected by increased activity of antioxidative enzymes, malondialdehyde, or changes in total carotenoids content [64,65]. However, deficiency of essential metals such as Cu also has a negative impact on photosynthetic pigments [66]. Duckweed exposed to heavy metals in industrial wastewater was more seriously affected at the morphological level (growth rate based on the frond number and weight) than in the chlorophyll content [9]. This is in agreement with our results (Table S4, Figure 5).
Another task is to determine how the pigment content is expressed. Calculation per weight unit or frond area may be subject to error in the event that the water content in the fronds differs or the fronds overlap. The effect of heavy metal pollution in wastewaters lead to changes in chlorophyll a and b, and the total carotenoids exceeded the total chlorophyll content in duckweed, which indicated internal oxidative stress [65]. Hence, Chls/Cars ratio can be easily used for comparison among various samples and control. In this study, a significant decrease of Chls/Cars was generally in accordance with significant growth inhibition in duckweed (Table 5, Table S4). Besides, by determination of the pigment ratio, both the actual state of the plant and the prediction of the future plant response can be considered.
Traditional algal assays are often based on indirect estimation of biomass or population growth through cell counting under a microscope, flow cytometry, or optical density measurement [67,68]. These approaches do not take into account the cell size and the cell quality, including colour, i.e., pigment profile.
Direct biomass determination on the cell dry mass basis is usually impossible due to the very low dry matter content. At the same time, the extraction of photosynthetic pigments enables the quantification of algal production at the biochemical level (Chls/mL), and the level of stress pronounced by changes in Cars. Another guideline for measuring aquatic ecotoxicity describes the determination of chlorophyll a in algae using ethanol extraction [69]. However, as summarized in [70], hydrophilic carotenoids are not easily extracted by ethanol. Osorio et al. reported acid-free methanol as a suitable solvent for quantitative extraction for carotenoids in various macro- and micro-algae [71]. For this reason, a similar approach for pigment extraction and measurement as applied in the duckweed assay was chosen in the algal experiment also.

4.4. Effect of Leachates on Soil Dehydrogenase Activity

Soil represents an important part of the environment. The balanced functioning of soil is strongly dependent on the soil microbial community. Soils are considered one of the sinks for various kinds of pollutants, including those coming from the construction sector [72]. The release of alkalizing compounds from cement and concrete contributes to the increase of soil pH [73]. Soil pH was reported to be a significant factor influencing the composition of the soil microbiome [74]. Our hypothesis was that the addition of leachates into natural soil would lead to a change in microbial activity in response to metal input. This was observed in most samples, especially seven days after soil contamination (Figure 6). The slight stimulation effect is not surprising, since the total amount of metals leached from concrete was relatively low. Leachate alkalinity also did not affect soil pH significantly, although the pH value decreased slightly over time (Table S5). As the stimulation/inhibition effect of concentrated concrete leachates on DHA was very low (though significant in several cases), addition of diluted leachates was not tested. To our knowledge, there is no study on the addition of concrete leachate to soil. Soil enzymes were not inhibited in soils located near landfills or soils amended with landfill leachates [75,76].
The DHA experiment was performed using only one selected type of an acidic soil material. However, soils located in urban sites vary in physicochemical characteristics [77] and thus may give different results. Furthermore, impact on other components of the soil ecosystem, plants and invertebrates may be also included. The performed type of experiment was the first of its kind due to the untraceable studies in this field. Thus, more research is necessary on terrestrial ecotoxicology of construction products.

4.5. Impact of the Carbonation Process on Concrete

The real trigger mechanism is water and oxygen, which means the process of carbonation itself (high CO2 content) does not cause corrosion. Carbonation is one of the chemical mechanisms that can cause concrete failure, and one of the main factors effecting the process is relative humidity of the environment. In a wet environment (humidity higher than 95%), the carbonation process is inefficient or not going at all [45,78]. However, structures in a very dry environment (relative humidity up to 30%), as well as structures fully immersed in water, show no signs of carbonation or corrosion. This is caused by the absence of oxygen to fill the capillary pores [23]. The definition of the effect of relative humidity on the carbonation process in concrete is an important topic in the scientific field; the research in this area is examined by Matoušek et al. [40]. According to [40], the carbonation process is more intense between 50 and 95% of relative humidity, and between 75 and 95% strongly unsolicited [42]. However, the reduction of concrete alkalinity could be (beside carbon dioxide) caused by nitrogen oxides or sulfur dioxide, which are also pollutants affecting concrete. This scenario could appear with outdoor exposure.
Some studies have also shown refinement of pore structure, but this factor was dependent on the relative humidity. However, the research [78] validates that carbonation of concrete before its utilization could lead to a decrease in water absorption as well. These conclusions are also connected with better durability, e.g., freeze-thaw resistance, which is an important factor for concrete structures in general.
Another factor that affects the carbonation depth could be a higher cement ratio. Studies have shown that carbonation on these samples was negligible [21,79]. This study confirms the prediction that concrete in the lower strength grade has deeper penetration and the extent of carbonation is more significant. However, phenolphthalein as an indicator reveals that the pH level is in fact below 9 (not the real carbonation depth) [79,80].
When dealing with cement, there is also the possibility of using alkali-activated materials. There are studies [81,82] dealing with a high MgO ratio in in alkali-activated slag. With hydrotalcite as the main secondary product, this can effect and reduce the carbonation process, and this whole case can lead to an increase of the durability of concrete [82].
If focusing purely on carbonation without corrosion, e.g., reinforcement, the process can be considered environmentally beneficial. Carbon dioxide absorption by concrete structures can reduce these emissions. With regard to this theory, it can be said that the recycled concrete that has been investigated in this work will hold more CO2 than conventional reference concrete in the same strength grade. The usual CO2 content in the air is 0.03% by volume, depending on the area. In cities, this number could be up to three times higher [42].
In general, based on the results of this research, the investigated recycled concretes can be evaluated as suitable for use in concrete structures that will not have a negative environmental impact higher than similar reference concretes of the same strength class.

4.6. Environmental Assessment of the Alternative Scenario Considering CO2 Uptake

The alternative scenario describes the potential of concrete mixtures to capture CO2 as a consequence of carbonation. The approach for this calculation is described in Section 2.5. In this chapter, the assumed factors for the calculation were described to characterize the potential of the mixtures to take up CO2. The results of the calculation of the total potential uptake are described in Table 8.
The calculated uptake contribution can be used as a benefit of the concrete structure, and it can be declared together with the results of the environmental assessment of the entire life cycle. However, assumptions describing expected service life or future utilization or the surface of the cube available for carbonation are highly uncertain. Therefore, the results of this calculation are stated as an alternative scenario which describes the possible use of such concrete. Furthermore, the potential total CO2 uptake is not considered in comparison with the total impact in the category of climate change, which is mainly influenced by cement production.
Carbonation of concrete also continues after its service life and CO2 can be absorbed in recycled concrete aggregate. After gridding of recycled concrete to particle size 0–40 mm, the rate of CO2 can reach even 5.5% of overall CO2 emissions realized during the life cycle of concrete [83]. The amount of absorbed CO2 after four months, in which concrete is crushed into the typical size of concrete aggregate, can reach even 20% of the total amount of CO2 realized during calcination of used cement [84]. A similar result was reported by Yang et al., who calculated the CO2 uptake during life expectancy of 40 years and recycling span of 60 years as 18–21% of the CO2 emissions from the production of ordinary Portland cement [85].

4.7. Overall Potential Impact on the Environment

Based on the normalized and weighted results, the overall potential impact can be calculated, and the sums of normalized and weighted results are presented in Figure 9. The highest environmental impact is related to the considered life cycle of NAC II. Mixtures with the same strength class, which were designed with the use of recycled aggregates, cause a smaller potential impact. The same relation is seen among the mixtures designed for the lower strength class.
Regarding the comparison of mixtures containing recycled concrete aggregate and recycled masonry aggregate, the lowest overall impact is reached in the case of RCAC mixtures. The similar conclusion was reported by Marinkovic et al., who, in two scenarios, in which recycled aggregate and natural aggregate concrete were compared, calculated that lower normalized and weighted results of environmental indicators was reached by recycled aggregate concrete [86]. In addition, a study published by Colangelo et al. shows that concrete with 25% recycled aggregates is the best solution from an environmental point of view [87].
The overall impact is significantly affected by the contribution in the water use category. The impact in this category is caused mainly by gravel production, and the production of recycled aggregates has a beneficial impact in this category. This beneficial impact represents the environmental credits, which are connected to the recycling of iron scrap from construction and demolition waste.
Another important contribution to the overall impact is related to the results in the climate change category. The major impact in this category is caused by the production of cement.

5. Conclusions

In this study, the experimental verification of the reaction between concrete and the environment, from the biochemical level up to the mechanical and theoretical levels, was performed. Laboratory leaching experiments that determine the toxic effect of the concrete structure on the environment (water and soil) were combined with evaluation of the environment (air or water) on the concrete structure, through the carbonation process. All of the obtained experimental data were then theoretically compared with results of the life-cycle assessment.
As a conclusion of the observation at both the ecotoxicological and biochemical levels, it is possible to say that all assumptions were confirmed. With a smaller surface, the leachability of both toxic compounds and trace elements also decreases. The effect of concrete leachates on photosynthetic pigment ratio (Chls/Cars) was in accordance with the effect on plant growth. Addition of leachates to natural soil had a very low effect on soil DHA and did not change soil pH. Hence, from an ecotoxicological point of view, concrete containing fine recycled aggregate does not disturb the balance in the ecosystem and is as nontoxic as reference samples.
At the same time, some types of recycled concrete (mainly RCAC-II) have been proven to reach carbonation depths similar to those of the reference sample, while RMAC-I and RMAC-II showed a deeper penetration of CO2. In general, it is possible to say that, based on the performed experiments and assumptions from foreign studies, the increasing depth of carbonation with the decreasing strength class was confirmed, regardless of whether it is a reference concrete with natural aggregates or concrete with recycled aggregates.
The potential scenario of CO2 uptake is evaluated in the LCA, and the captured CO2 value was evaluated as negligible compared to the value of CO2 in cement production. However, the assumption of CO2 capture could be useful given the effort to eliminate environmentally non-friendly materials, such as cement in concrete production, and replace them with waste or recycled materials.
After an overall evaluation of the LCA, recycled concrete (RMAC-I, RCAC-I, RMAC-II, RCAC-II) were evaluated as more environmentally friendly compared to the reference samples (NAC-I, NAC-II). These results will be used as a basis for the subsequent verification of other specific properties of recycled concrete with the aim of implementing them in the industry sector.

Supplementary Materials

The following supporting information can be downloaded at: https://www.mdpi.com/article/10.3390/su14031732/s1, Table S1: pH of the leachates (mean values ± SD) at the end of the duckweed toxicity test (after 7 days of exposition). 100 + n—leachates (100 mL.L−1) amended with nutrients; Table S2: The results of the water flea toxicity tests. Mean (±SD) values of immobilization (%). 100 + n—leachates (100 mL.L−1) amended with nutrients. The letters indicate significant differences between values (post-hoc test; α = 0.05) within the same column (uppercase) and within the same row (lowercase), and the asterisks indicate differences between sample and control (zero values); Table S3: The results of algae toxicity tests. Mean (±SD) values of inhibition/stimulation (%) of growth rate based on optical density at 750 nm. 100 + n—leachates (100 mL.L−1) amended with nutrients. Negative values indicate growth stimulation. The letters indicate significant differences between values (post-hoc test; α = 0.05) within the same column (uppercase) and within the same row (lowercase), and the asterisks indicate differences between sample and control (zero values); Table S4: The results of duckweed toxicity tests. Mean (±SD) values of inhibition/stimulation (%) of the growth rate based on the total area of the frond. 100 + n—leachates (100 mL.L−1) amended with nutrients. Negative values indicate growth stimulation. The letters indicate significant differences between values (post-hoc test; α = 0.05) within the same column (uppercase) and within the same row (lowercase), and the asterisks indicate differences between the sample and control (zero values); Table S5: pH (mean values ± SD) measured in soils amended with leachates after 7, 28, and 56 days.

Author Contributions

Conceptualization, D.M.; methodology, K.A.M. and D.M.; validation, T.P., K.A.M., D.M., B.T., K.F. and P.H.; investigation, T.P., K.A.M., D.M., J.P. and K.F.; resources, D.M. and K.A.M.; data curation K.F., K.A.M., J.P. and D.M.; writing—original draft preparation, D.M. and K.A.M.; writing—review and editing, K.F., K.A.M., T.P., P.H., B.T., J.P. and D.M.; visualization, D.M., K.F. and T.P.; project administration, T.P. and P.H. All authors have read and agreed to the published version of the manuscript.

Funding

This work is part of the project “Design of performance-based concrete using sand reclaimed from construction and demolition wastes”, LTAIN19205, supported by the Ministry of Education, Youth and Sports of the Czech Republic, through the program INTER-EXCELLENCE.

Institutional Review Board Statement

Not applicable.

Informed Consent Statement

Not applicable.

Data Availability Statement

Data available in a publicly accessible repository.

Conflicts of Interest

The authors declare no conflict of interest.

References

  1. Vytlacilova, V. Testing ecological suitability for the utilization of recycled aggregates. Green Process. Synth. 2017, 6, 225–234. [Google Scholar] [CrossRef]
  2. Rodrigues, P.; Silvestre, J.D.; Flores-Colen, I.; Viegas, C.A.; Ahmed, H.H.; Kurda, R.; De Brito, J. Evaluation of the Ecotoxicological Potential of Fly Ash and Recycled Concrete Aggregates Use in Concrete. Appl. Sci. 2020, 10, 351. [Google Scholar] [CrossRef] [Green Version]
  3. Rodrigues, P.; Silvestre, J.D.; Flores-Colen, I.; Viegas, C.A.; De Brito, J.; Kurad, R.; Demertzi, M. Methodology for the Assessment of the Ecotoxicological Potential of Construction Materials. Materials 2017, 10, 649. [Google Scholar] [CrossRef] [Green Version]
  4. Couvidat, J.; Diliberto, C.; Meux, E.; Cotelle, S.; Bojic, C.; Izoret, L.; Lecomte, A. Greening effect of slag cement-based concrete: Environmental and ecotoxicological impact. Environ. Technol. Innov. 2021, 22, 101467. [Google Scholar] [CrossRef]
  5. Barbosa, R.; Lapa, N.; Dias, D.; Mendes, B. Concretes containing biomass ashes: Mechanical, chemical, and ecotoxic performances. Constr. Build. Mater. 2013, 48, 457–463. [Google Scholar] [CrossRef]
  6. Naaz, S.; Pandey, S.N. Effects of industrial waste water on heavy metal accumulation, growth and biochemical responses of lettuce (Lactuca sativa L.). J. Environ. Biol. 2010, 31, 273–276. [Google Scholar]
  7. Gao, Z.; Han, J.; Mu, C.; Lin, J.; Li, X.; Lin, L.; Sun, S. Effects of Saline and Alkaline Stresses on Growth and Physiological Changes in Oat (Avena sativa L.) Seedlings. Not. Bot. Horti Agrobot. 2014, 42, 357–362. [Google Scholar] [CrossRef] [Green Version]
  8. Guo, R.; Zhou, J.; Hao, W.; Gu, F.; Liu, Q.; Li, H.; Xia, X.; Mao, L. Germination, Growth, Chlorophyll Fluorescence and Ionic Balance in Linseed Seedlings Subjected to Saline and Alkaline Stresses. Plant Prod. Sci. 2014, 17, 20–31. [Google Scholar] [CrossRef] [Green Version]
  9. Radić, S.; Stipaničev, D.; Cvjetko, P.; Mikelić, I.L.; Rajčić, M.M.; Širac, S.; Pevalek-Kozlina, B.; Pavlica, M. Ecotoxicological assessment of industrial effluent using duckweed (Lemna minor L.) as a test organism. Ecotoxicology 2009, 19, 216–222. [Google Scholar] [CrossRef]
  10. Schinner, F.; Öhlinger, R.; Kandeler, E.; Margesin, R. (Eds.) Methods in Soil Biology; Springer: Berlin/Heidelberg, Germany, 1996; ISBN 9783642646331. [Google Scholar]
  11. Dick, R.P.; Breakwell, D.P.; Turco, R.F. Soil Enzyme Activities and Biodiversity Measurements as Integrative Microbiological Indicators. In SSSA Special Publications; Wiley: Hoboken, NJ, USA, 2015; pp. 247–271. ISBN 978-0-89118-944-2. [Google Scholar]
  12. Delreux, T.; Ohler, F. Climate Policy in European Union Politics. In Oxford Research Encyclopedia of Politics; Oxford University Press: Oxford, UK, 2019; ISBN 9780190228637. [Google Scholar]
  13. Monteiro, P.J.M.; Miller, S.; Horvath, A. Towards sustainable concrete. Nat. Mater. 2017, 16, 698–699. [Google Scholar] [CrossRef]
  14. GREEN Solution, s.r.o. Green Solution s.r.o. Program Předcházení Vzniku Odpadu; Publisher Ministry of the Environment: Prague, Czech Republic, 2017. [Google Scholar]
  15. Papadakis, V.G.; Vayenas, C.G.; Fardis, M. Experimental investigation and mathematical modeling of the concrete carbonation problem. Chem. Eng. Sci. 1991, 46, 1333–1338. [Google Scholar] [CrossRef]
  16. Xuan, D.; Zhan, B.; Poon, C.S. Assessment of mechanical properties of concrete incorporating carbonated recycled concrete aggregates. Cem. Concr. Compos. 2016, 65, 67–74. [Google Scholar] [CrossRef]
  17. Villain, G.; Thiery, M.; Platret, G. Measurement methods of carbonation profiles in concrete: Thermogravimetry, chemical analysis and gammadensimetry. Cem. Concr. Res. 2007, 37, 1182–1192. [Google Scholar] [CrossRef]
  18. Papadakis, V.G.; Vayenas, C.G.; Fardis, M.N. Fundamental Modeling and Experimental Investigation of Concrete Carbonation. ACI Mater. J. 1991, 88, 363–373. [Google Scholar] [CrossRef]
  19. Papadakis, V.G.; Vayenas, C.G.; Fardis, M.N. Physical and Chemical Characteristics Affecting the Durability of Concrete. ACI Mater. J. 1991, 88, 186–196. [Google Scholar] [CrossRef]
  20. Parrott, L.; Killoh, D. Carbonation in a 36 year old, in-situ concrete. Cem. Concr. Res. 1989, 19, 649–656. [Google Scholar] [CrossRef]
  21. Collepardi, M. The Influence of Slag and Fly Ash on the Carbonation of Concrete. In Proceedings of the Eighth CANMET/ACI International Conferance on Fly Ash, Silica Fume, Slag, and Natural Pozzolans in Concrete, Las Vegas, NV, USA, 23–29 May 2004; Volume 2004, pp. 221–229. [Google Scholar]
  22. Matthews, S. Design of Durable Concrete Structures; BRE Trust: Glasgow, UK, 2014. [Google Scholar] [CrossRef]
  23. Chang, C.-F.; Chen, J.-W. The experimental investigation of concrete carbonation depth. Cem. Concr. Res. 2006, 36, 1760–1767. [Google Scholar] [CrossRef]
  24. ČSN EN 12390-12 (73 1302). Testing Hardened Concrete—Part 12: Determination of the Resistance of Concrete to Carbonation—Accelerated Carbonation Method; Office for Technical Standardization, Metrology and State Testing: Prague, Czech Republic, 2020. [Google Scholar]
  25. Mariaková, D.; Mocová, K.A.; Fořtová, K.; Ryparová, P.; Pešta, J.; Pavlů, T. Ecotoxicity and Essential Properties of Fine-Recycled Aggregate. Materials 2021, 14, 463. [Google Scholar] [CrossRef]
  26. Mariaková, D.; Mocová, K.A.; Fořtová, K.; Pavlů, T.; Hájek, P. Waste Glass Powder Reusability in High-Performance Concrete: Leaching Behavior and Ecotoxicity. Materials 2021, 14, 4476. [Google Scholar] [CrossRef]
  27. Wellburn, A.R. The Spectral Determination of Chlorophylls a and b, as well as Total Carotenoids, Using Various Solvents with Spectrophotometers of Different Resolution. J. Plant Physiol. 1994, 144, 307–313. [Google Scholar] [CrossRef]
  28. ISO 10390:2021. Soil, Treated Biowaste and Sludge—Determination of PH; ISO: Geneva, Switzerland, 2021; p. 8. [Google Scholar]
  29. ISO 23753-1:2005. Soil Quality—Determination of Dehydrogenase Activity in Soils—Part 1: Method Using Triphenyltetrazolium Chloride (TTC); ISO: Geneva, Switzerland, 2005; p. 5. [Google Scholar]
  30. ČSN EN 12390-2. Testing Hardened Concrete—Part 2: Making and Curing Specimens for Strength Tests; Office for Technical Standardization, Metrology and State Testing: Prague, Czech Republic, 2020. [Google Scholar]
  31. Guinée, J. Handbook on life cycle assessment—Operational guide to the ISO standards. Int. J. Life Cycle Assess. 2001, 6, 255. [Google Scholar] [CrossRef]
  32. International Organization for Standardization. Environmental Management. Life Cycle Assessment. Principles and Framework; Standard ISO 14040; International Organization for Standardization: Geneva, Switzerland, 2006; Available online: https://www.iso.org/standard/37456.html (accessed on 27 March 2020).
  33. International Organization for Standardization. ISO 14040 Environmental Management-Life Cycle Assessment-Principles and Framework. Available online: https://www.iso.org/standard/38498.html (accessed on 13 December 2019).
  34. CEN EN 15804:2012+A2:2019 Sustainability of Construction Works—Environmental Product Declarations—Core Rules for the Product Category of Construction Products. Available online: https://standards.cen.eu/dyn/www/f?p=204:110:0::::FSP_PROJECT:70014&cs=1CFE7BDC38149F238F05C4C13E0E3B4C2 (accessed on 27 November 2020).
  35. Life Cycle Assessment LCA Software: Gabi Software. Available online: http://www.gabisoftware.com/ (accessed on 30 October 2020).
  36. Kupfer, T.; Baitz, M.; Colodel, C.M.; Kokborg, M.; Schöll, S.; Rudolf, M.; Thellier, L.; Bos, U.; Bosch, F.; Gonzalez, M.; et al. GaBi Database and Modelling Principles. Available online: http://www.gabi-software.com/fileadmin/gabi/Modelling_Principles/Modeling_Principles_-_GaBi_Databases_2020_2.pdf (accessed on 1 December 2020).
  37. ČSN EN 16757. Sustainability of Construction Works—Environmental Product Declarations—Product Category Rules for Concrete and Concrete Elements; Office for Technical Standardization, Metrology and State Testing: Prague, Czech Republic, 2018. [Google Scholar]
  38. Product Environmental Footprint (PEF) Guide. Available online: https://ec.europa.eu/environment/archives/eussd/pdf/footprint/PEF%20methodology%20final%20draft.pdf (accessed on 7 October 2020).
  39. Environmental Footprint 3.0. Available online: https://eplca.jrc.ec.europa.eu//EnvironmentalFootprint.html (accessed on 1 November 2021).
  40. Matoušek, M.; Drochytka, R. Atmosférická Koroze Betonu; ČKAIT a IKAS: Prague, Czech Republic, 1998. [Google Scholar]
  41. Teplý, B.; Chromá, M.; Rovnanik, P. Durability assessment of concrete structures: Reinforcement depassivation due to carbonation. Struct. Infrastruct. Eng. 2010, 6, 317–327. [Google Scholar] [CrossRef]
  42. Pašek, J.; Vejvara, L. Karbonatace Betonových a Železobetonových Obvodových Konstrukcí. In Proceedings of the Poruchy a Obnova Obalových Konštrukcií Budov, Vysoké Tatry, Slovakia, 4 April 2004; pp. 86–91. [Google Scholar]
  43. Kurda, R.; de Brito, J.; Silvestre, J.D. Carbonation of concrete made with high amount of fly ash and recycled concrete aggregates for utilization of CO2. J. CO2 Util. 2018, 29, 12–19. [Google Scholar] [CrossRef]
  44. Lu, B.; Shi, C.; Cao, Z.; Guo, M.; Zheng, J. Effect of carbonated coarse recycled concrete aggregate on the properties and microstructure of recycled concrete. J. Clean. Prod. 2019, 233, 421–428. [Google Scholar] [CrossRef]
  45. Liang, C.; Lu, N.; Ma, H.; Ma, Z.; Duan, Z. Carbonation behavior of recycled concrete with CO2-curing recycled aggregate under various environments. J. CO2 Util. 2020, 39, 101185. [Google Scholar] [CrossRef]
  46. Bold, H.C. The Morphology of Chlamydomonas chlamydogama, Sp. Nov. Bull. Torrey Bot. Club 1949, 76, 101. [Google Scholar] [CrossRef]
  47. Ebert, D.; Zschokke-Rohringer, C.D.; Carius, H.J. Within- and between-population variation for resistance of Daphnia magna to the bacterial endoparasite Pasteuria ramosa. Proc. R. Soc. B Boil. Sci. 1998, 265, 2127–2134. [Google Scholar] [CrossRef]
  48. ISO (International Organisation for Standardization). 2005 ISO 20079 Water Quality—Determination of Toxic Effect of Water Constituents and Waste to Duckweed (Lemna Minor)—Duckweed Growth Inhibition Test; ISO: Geneva, Switzerland, 2005. [Google Scholar]
  49. Mor, S.; Ravindra, K.; Dahiya, R.P.; Chandra, A. Leachate Characterization and Assessment of Groundwater Pollution Near Municipal Solid Waste Landfill Site. Environ. Monit. Assess. 2006, 118, 435–456. [Google Scholar] [CrossRef]
  50. Vriens, B.; Voegelin, A.; Hug, S.J.; Kaegi, R.; Winkel, L.H.E.; Buser, A.M.; Berg, M. Quantification of Element Fluxes in Wastewaters: A Nationwide Survey in Switzerland. Environ. Sci. Technol. 2017, 51, 10943–10953. [Google Scholar] [CrossRef]
  51. Rengasamy, P. World salinization with emphasis on Australia. J. Exp. Bot. 2006, 57, 1017–1023. [Google Scholar] [CrossRef] [Green Version]
  52. Cañedo-Argüelles, M.; Kefford, B.J.; Piscart, C.; Prat, N.; Schäfer, R.B.; Schulz, C.-J. Salinisation of rivers: An urgent ecological issue. Environ. Pollut. 2013, 173, 157–167. [Google Scholar] [CrossRef] [PubMed]
  53. Schuler, M.S.; Cañedo-Argüelles, M.; Hintz, W.D.; Dyack, B.; Birk, S.; Relyea, R.A. Regulations are needed to protect freshwater ecosystems from salinization. Philos. Trans. R. Soc. B Biol. Sci. 2018, 374, 20180019. [Google Scholar] [CrossRef] [PubMed] [Green Version]
  54. Baberschke, N.; Irob, K.; Preuer, T.; Meinelt, T.; Kloas, W. Potash mining effluents and ion imbalances cause transient osmoregulatory stress, affect gill integrity and elevate chronically plasma sulfate levels in adult common roach, Rutilus rutilus. Environ. Pollut. 2019, 249, 181–190. [Google Scholar] [CrossRef] [PubMed]
  55. Herrmann, M.C.; Entrekin, S.A.; Evans-White, M.A.; Clay, N.A. Salty water and salty leaf litter alters riparian detrital processes: Evidence from sodium-addition laboratory mesocosm experiments. Sci. Total Environ. 2021, 806, 151392. [Google Scholar] [CrossRef]
  56. Bandow, N.; Gartiser, S.; Ilvonen, O.; Schoknecht, U. Evaluation of the impact of construction products on the environment by leaching of possibly hazardous substances. Environ. Sci. Eur. 2018, 30, 14. [Google Scholar] [CrossRef] [Green Version]
  57. Heisterkamp, I.; Ratte, M.; Schoknecht, U.; Gartiser, S.; Kalbe, U.; Ilvonen, O. Ecotoxicological evaluation of construction products: Inter-laboratory test with DSLT and percolation test eluates in an aquatic biotest battery. Environ. Sci. Eur. 2021, 33, 1–14. [Google Scholar] [CrossRef]
  58. Choi, J.B.; Bae, S.M.; Shin, T.Y.; Ahn, K.Y.; Woo, S.D. Evaluation of Daphniamagna for the Ecotoxicity Assessment of Alkali Leachate from Concrete. Int. J. Ind. Èntomol. 2013, 26, 41–46. [Google Scholar] [CrossRef] [Green Version]
  59. Strähle, U.; Scholz, S.; Geisler, R.; Greiner, P.; Hollert, H.; Rastegar, S.; Schumacher, A.; Selderslaghs, I.; Weiss, C.; Witters, H.; et al. Zebrafish embryos as an alternative to animal experiments—A commentary on the definition of the onset of protected life stages in animal welfare regulations. Reprod. Toxicol. 2012, 33, 128–132. [Google Scholar] [CrossRef]
  60. Jalal, K.; Shamsuddin, A.; Rahman, M.; Nurzatul, N.; Rozihan, M. Growth and Total Carotenoid, Chlorophyll a and Chlorophyll b of Tropical Microalgae (Isochrysis sp.) in Laboratory Cultured Conditions. J. Biol. Sci. 2012, 13, 10–17. [Google Scholar] [CrossRef] [Green Version]
  61. ISO 11348 (2007–12). Water Quality—Determination of the Inhibitory Efect of Water Samples on the Light Emission of Vibrio Fscheri (Luminescent Bacteria Test)—Part 1: Method Using Freshly Prepared Bacteria, Part 2: Method Using Liquid-Dried Bacteria, Part 3: Method Using Freeze-Dried Bacteria; ISO: Geneva, Switzerland, 2007. [Google Scholar]
  62. Ladislas, S.; El-Mufleh, A.; Gérente, C.; Chazarenc, F.; Andrès, Y.; Béchet, B. Potential of Aquatic Macrophytes as Bioindicators of Heavy Metal Pollution in Urban Stormwater Runoff. Water Air Soil Pollut. 2011, 223, 877–888. [Google Scholar] [CrossRef]
  63. Leblebici, Z.; Aksoy, A.; Duman, F. Influence of nutrient addition on growth and accumulation of cadmium and copper in Lemna gibba. Chem. Speciat. Bioavailab. 2010, 22, 157–164. [Google Scholar] [CrossRef]
  64. Varga, M.; Horvatić, J.; Čelić, A. Short term exposure of Lemna minor and Lemna gibba to mercury, cadmium and chromium. Open Life Sci. 2013, 8, 1083–1093. [Google Scholar] [CrossRef]
  65. Hegazy, A.K.; Kabiel, H.F.; Fawzy, M. Duckweed as heavy metal accumulator and pollution indicator in industrial wastewater ponds. Desalination Water Treat. 2009, 12, 400–406. [Google Scholar] [CrossRef]
  66. Thomas, G.; Stärk, H.-J.; Wellenreuther, G.; Dickinson, B.C.; Küpper, H. Effects of nanomolar copper on water plants—Comparison of biochemical and biophysical mechanisms of deficiency and sublethal toxicity under environmentally relevant conditions. Aquat. Toxicol. 2013, 140-141, 27–36. [Google Scholar] [CrossRef] [PubMed] [Green Version]
  67. ISO. ISO In Water Quality—Fresh Water Algal Growth Inhibition Test with Unicellular Green Algae; ISO: Geneva, Switzerland, 2012; p. 21. [Google Scholar]
  68. OECD. OECD Test No. 201: Alga, Growth Inhibition Test; OECD Guidelines for the Testing of Chemicals, Section 2: Effects on Biotic Systems; OECD Publishing: Paris, France, 2006; ISBN 978-92-64-06992-3. [Google Scholar]
  69. ISO 10260:1992. Water Quality—Measurement of Biochemical Parameters—Spectrometric Determination of the Chlorophyll-a Concentration; ISO: Geneva, Switzerland, 1992; p. 6. [Google Scholar]
  70. Poojary, M.M.; Barba, F.J.; Aliakbarian, B.; Donsì, F.; Pataro, G.; Dias, D.A.; Juliano, P. Innovative Alternative Technologies to Extract Carotenoids from Microalgae and Seaweeds. Mar. Drugs 2016, 14, 214. [Google Scholar] [CrossRef]
  71. Osório, C.; Machado, S.; Peixoto, J.; Bessada, S.; Pimentel, F.B.; Alves, R.C.; Oliveira, M.B.P.P. Pigments Content (Chlorophylls, Fucoxanthin and Phycobiliproteins) of Different Commercial Dried Algae. Separations 2020, 7, 33. [Google Scholar] [CrossRef]
  72. Ananyeva, N.D.; Ivashchenko, K.V.; Sushko, S.V. Microbial Indicators of Urban Soils and Their Role in the Assessment of Ecosystem Services: A Review. Eurasian Soil Sci. 2021, 54, 1517–1531. [Google Scholar] [CrossRef]
  73. Goodwin, D. Urban soils and functional trees. In The Urban Tree; Taylor and Francis Group: London, UK, 2017; pp. 56–89. [Google Scholar] [CrossRef]
  74. Qi, D.; Wieneke, X.; Tao, J.; Zhou, X.; DeSilva, U. Soil pH Is the Primary Factor Correlating with Soil Microbiome in Karst Rocky Desertification Regions in the Wushan County, Chongqing, China. Front. Microbiol. 2018, 9, 1027. [Google Scholar] [CrossRef] [Green Version]
  75. Kuwano, B.H.; Nogueira, M.A.; Santos, C.A.; Fagotti, D.S.; Santos, M.B.; Lescano, L.E.; Andrade, D.S.; Barbosa, G.M.; Tavares-Filho, J. Application of Landfill Leachate Improves Wheat Nutrition and Yield but Has Minor Effects on Soil Properties. J. Environ. Qual. 2017, 46, 153–159. [Google Scholar] [CrossRef] [Green Version]
  76. Shailaja, G.S.J.; Srinivas, N.; Rao, P.P.V.V. Effect of Municipal Solid Waste Leachate on Soil Enzymes. Nat. Environ. Pollut. Technol. 2021, 20. [Google Scholar] [CrossRef]
  77. Kazlauskaitė-Jadzevičė, A.; Volungevičius, J.; Gregorauskienė, V.; Marcinkonis, S. The role of PH in heavy metal contamination of urban soil. J. Environ. Eng. Landsc. Manag. 2014, 22, 311–318. [Google Scholar] [CrossRef]
  78. Gholizadeh-Vayghan, A.; Bellinkx, A.; Snellings, R.; Vandoren, B.; Quaghebeur, M. The effects of carbonation conditions on the physical and microstructural properties of recycled concrete coarse aggregates. Constr. Build. Mater. 2020, 257, 119486. [Google Scholar] [CrossRef]
  79. Ho, D.W.S.; Lewis, R.K. Carbonation of concrete and its prediction. Cem. Concr. Res. 1987, 17, 489–504. [Google Scholar] [CrossRef]
  80. Malati, M.A. Experimental Inorganic/Physical Chemistry; Woodhead Publishing Limited, Abington Hall: Cambridge, UK, 1999; p. 338. [Google Scholar]
  81. Bernal, S.A.; San Nicolas, R.; Myers, R.J.; Mejía de Gutiérrez, R.; Puertas, F.; van Deventer, J.S.J.; Provis, J.L. MgO content of slag controls phase evolution and structural changes induced by accelerated carbonation in alkali-activated binders. Cem. Concr. Res. 2014, 57, 33–43. [Google Scholar] [CrossRef] [Green Version]
  82. Xiao, R.; Jiang, X.; Zhang, M.; Polaczyk, P.; Huang, B. Analytical investigation of phase assemblages of alkali-activated materials in CaO-SiO2-Al2O3 systems: The management of reaction products and designing of precursors. Mater. Des. 2020, 194, 108975. [Google Scholar] [CrossRef]
  83. Kikuchi, T.; Kuroda, Y. Carbon Dioxide Uptake in Demolished and Crushed Concrete. J. Adv. Concr. Technol. 2011, 9, 115–124. [Google Scholar] [CrossRef] [Green Version]
  84. Dodoo, A.; Gustavsson, L.; Sathre, R. Carbon implications of end-of-life management of building materials. Resour. Conserv. Recycl. 2009, 53, 276–286. [Google Scholar] [CrossRef]
  85. Yang, K.-H.; Seo, E.-A.; Tae, S.-H. Carbonation and CO2 uptake of concrete. Environ. Impact Assess. Rev. 2014, 46, 43–52. [Google Scholar] [CrossRef]
  86. Marinković, S.; Dragaš, J.; Ignjatović, I.; Tošić, N. Environmental assessment of green concretes for structural use. J. Clean. Prod. 2017, 154, 633–649. [Google Scholar] [CrossRef]
  87. Colangelo, F.; Navarro, T.G.; Farina, I.; Petrillo, A. Comparative LCA of concrete with recycled aggregates: A circular economy mindset in Europe. Int. J. Life Cycle Assess. 2020, 25, 1790–1804. [Google Scholar] [CrossRef]
Figure 1. Tested samples containing recycled aggregates: (a) RMAC I, (b) RMAC II, (c) RCAC I, and (d) RCAC II.
Sustainability 14 01732 g001
Figure 2. Description of the boundaries of the system.
Sustainability 14 01732 g002
Figure 3. Mean (±SD) total chlorophyll (a + b) content in algal suspension. CT (control)—Bold’s Basal medium. 100 + n—leachates (100 mL.L−1) with amended nutrients. Lowercase letters indicate significant differences between samples of a given concentration, and asterisks (*) indicate significant differences between sample and control (post-hoc test; α = 0.05).
Sustainability 14 01732 g003
Figure 4. Mean (±SD) total carotenoid content in algal suspension. CT (control)—Bold’s Basal medium. 100 + n—leachates (100 mL.L−1) with amended nutrients. Lowercase letters indicate significant differences between samples of a given concentration, and asterisks (*) indicate significant differences between sample and control (post-hoc test; α = 0.05).
Sustainability 14 01732 g004
Figure 5. Mean (±SD) total chlorophyll (a + b) content in duckweed. CT (control)—Steinberg medium. 100 + n—leachates (100 mL.L−1) with amended nutrients. Lowercase letters indicate significant differences between samples of a given concentration, and asterisks (*) indicate significant differences between sample and control (post-hoc test; α = 0.05).
Sustainability 14 01732 g005
Figure 6. Mean (±SD) total carotenoid content in duckweed. CT (control)—Steinberg medium. 100 + n—leachates (100 mL.L−1) with amended nutrients. Lowercase letters indicate significant differences between samples of a given concentration, and asterisks (*) indicate significant differences between sample and control (post-hoc test; α = 0.05).
Sustainability 14 01732 g006
Figure 7. Mean (±SD) inhibition/stimulation of soil dehydrogenase activity measured in soil contaminated with leachates after 7, 28 and 56 days. Different letters indicate significant differences among samples within a given time point. Asterisks (*) indicate significant differences between the sample and control, that is, zero values (post-hoc test; α = 0.05).
Sustainability 14 01732 g007
Figure 8. Samples after carbonation test colored with phenolphthalein: (a) NAC-I, (b) NAC-II, (c) RMAC-I, (d) RMAC-II, (e) RCAC-I, and (f) RCAC-II.
Sustainability 14 01732 g008aSustainability 14 01732 g008b
Figure 9. Sum of normalized and weighted results calculated using the PEF 3.0 method.
Sustainability 14 01732 g009
Table 1. Composition of concrete mixes.
Material (kg)III
NACRMACRCACNACRMACRCAC
Cement260260260300300300
Nature Sand709--671--
Gravel 4/838--28--
Gravel 8/1610927669491139822994
Recycled Aggregate 0/4-971843-920800
Water169187186165182181
Table 2. Physicochemical properties of leachates.
Element (mg.L−1)III
NACRMACRCACNACRMACRCAC
Na3.04 ± 0.053.96 ± 0.09<2.5<2.54.16 ± 0.17<2.5
Mg0.20 ± 0.010.29 ± 0.010.24 ± 0.010.18 ± 0.010.20 ± 0.010.20 ± 0.01
Al<0.5<0.5<0.5<0.5<0.5<0.5
K17.27 ± 0.3215.66 ± 0.6314.20 ± 0.4614.03 ± 0.4919.19 ± 0.3212.82 ± 0.11
Ca28.85 ± 0.2329.44 ± 0.9524.68 ± 0.4921.19 ± 0.5919.75 ± 0.3322.13 ± 0.49
Cr 1<0.500000
Fe~0.04~0.08~0.03~0.02~0.04~0.02
Zn 2~0.0080.182 ± 0.0070.016 ± 0.0010.033 ± 0.0010.055 ± 0.0020.015 ± 0.001
Sr<0.03~0.08~0.03~0.03~0.03~0.03
pH10.7 ± 0.110.6 ± 0.110.7 ± 0.110.6 ± 010.6 ± 0.110.5 ± 0.1
el. conductivity (µS.cm−2)225 ± 12232 ± 24191 ± 11183 ± 6211 ± 38162 ± 17
1 Limit value in waste leachates 7 mg.L−1. 2 Limit value in waste leachates 20 mg.L−1.
Table 3. Ecotoxicity assessment of concrete leachates: EC50 with 95% CI (confidence interval) and coefficient of determination (R2), NOEC values. GR—growth rate; TC—toxicity class [26]; n.c.—not calculable. EC50 and NOEC values are expressed in mL.L−1.
Concrete MixValueWater FleaAlgae GRDuckweed GRToxicity Level
NAC IEC50931˃1000870
CI 95%890–n.c.-833–912
R20.890.800.94
NOEC800800640
TCNT-1NT-1NT-2Non-toxic
RMAC IEC50929˃1000896
CI 95%894–n.c.-838–966
R20.96-0.86
NOEC800800640
TCNT-1NT-1NT-2Non-toxic
RCAC IEC50˃1000˃1000911
CI 95%n.c.-864–971
R20.690.770.92
NOEC800800640
TCNT-1NT-1NT-2Non-toxic
NAC IIEC50˃1000˃1000844
CI 95%--829–861
R20.110.820.99
NOEC640800510
TCNT-2NT-1NT-2Non-toxic
RMAC IIEC50992˃1000926
CI 95%976–n.c.n.c.909–943
R20.940.760.99
NOEC800800640
TCNT-1NT-1NT-2Non-toxic
RCAC IIEC50˃1000˃1000928
CI 95%--895–966
R20.650.770.95
NOEC800800640
TCNT-1NT-1NT-2Non-toxic
Table 4. Total chlorophyll to total carotenoid ratio in algae (mean values ± SD). 100 + n—leachates (100 mL.L−1) amended with nutrients. The letters indicate significant differences between the values (post-hoc test; α = 0.05) within the same column (uppercase) and within the same row (lowercase).
mL.L−1III
NACRMACRCACNACRMACRCAC
0A5.6 ± 0.4 A5.6 ± 0.4 A5.6 ± 0.4 A5.6 ± 0.4 A5.6 ± 0.4 A5.6 ± 0.4
640A5.5 ± 0.1 aA6.0 ± 0.2 aA5.4 ± 0.2 aA6.2 ± 0.1 aA5.4 ± 0.7 aA6.3 ± 0.1 a
800A5.1 ± 0.2 aA5.8 ± 0.8 aA5.1 ± 0.2 aA5.8 ± 0.3 aA5.6 ± 0.1 aA5.9 ± 0.1 a
1000B1.9 ± 0.1 aB1.7 ± 0.2 aB1.8 ± 0.1 aB2.0 ± 0.1 aB1.9 ± 0.2 aB1.8 ± 0.2 a
100 + nA5.4 ± 0.2 aA5.7 ± 0.2 aA5.2 ± 0.0 aA5.9 ± 0.1 aA5.5 ± 0.1 aA5.9 ± 0.1 a
Table 5. Total chlorophyll to total carotenoid ratio in duckweed (mean values ± SD). 100 + n—leachates (100 mL.L−1) amended with nutrients. The letters indicate significant differences between the values (post-hoc test; α = 0.05) within the same column (uppercase) and within the same row (lowercase).
mL.L−1III
NACRMACRCACNACRMACRCAC
0A7.9 ± 0.2 A7.9 ± 0.2A7.9 ± 0.2A7.9 ± 0.2A7.9 ± 0.2A7.9 ± 0.2
510A7.0 ± 0.3 aA7.0 ± 0.5 aA7.6 ± 0.6 aA7.2 ± 0.2 aA7.0 ± 0.3 aA8.1 ± 0.4 a
640A7.9 ± 1.0 aA7.4 ± 0.3 aA7.7 ± 0.5 aA7.1 ± 0.3 aA7.1 ± 0.4 aA7.0 ± 0.3 a
800A6.9 ± 1.0 aA7.0 ± 0.9 aB5.1 ± 0.1 bB4.6 ± 0.2 bB4.4 ± 0.1 bB4.4 ± 0.1 b
1000B1.5 ± 0.1 bB3.8 ± 0.5 aC3.9 ± 0.4 aB3.2 ± 0.7 aB3.8 ± 0.1 aC2.8 ± 0.2 ab
100 + nA8.2 ± 0.1 aA7.7 ± 0.2 aA8.6 ± 0.3 aA8.1 ± 0.3 aA8.3 ± 0.3 aA8.1 ± 0.1 a
Table 6. Average carbonation depth results of samples tested containing natural and recycled aggregate.
Mean
Carbonation Depth (mm)
III
NACRMACRCACNACRMACRCAC
d12.9912.699.662.501.182.56
d26.828.417.995.253.741.87
d33.667.356.270.343.374.10
d44.1711.7312.14 2.506.251.30
dk4.40 ± 1.4510.04 ± 2.229.01 ± 2.162.65 ± 1.743.37 ± 1.792.45 ± 1.05
Table 7. Results of the selected impact indicators for 1 m3 of concrete mixtures; the environmental impact assessment was carried out according to the PEF 3.0 method.
III
NAC RMACRCACNACRMACRCA
Acidification (Mole of H+ eq.)9.96 × 10−18.99 × 10−18.64 × 10−11.069.66 × 10−19.34 × 10⁻¹
Climate Change—total (kg CO2 eq.)3.21 × 1022.59 × 1022.21 × 1023.54 × 1022.95 × 1022.59 × 102
Climate Change, biogenic (kg CO2 eq.)3.62 × 10−13.18 × 10−13.69 × 10−13.88 × 10−13.47 × 10−13.95 × 10−1
Climate Change, fossil (kg CO2 eq.)3.20 × 1022.58 × 1022.20 × 1023.53 × 1022.94 × 1022.58 × 102
Climate Change, LULUC (kg CO2 eq.)6.12 × 10−16.35 × 10−16.95 × 10−16.29 × 10−16.51 × 10−17.09 × 10−1
Ecotoxicity, freshwater—total (CTUe)1.71 × 1031.39 × 1031.57 × 1031.77 × 1031.47 × 1031.65 × 103
Eutrophication, freshwater (kg P eq.)1.07 × 10−37.31 × 10−48.75 × 10−41.12 × 10−37.91 × 10−49.28 × 10−4
Eutrophication, marine (kg N eq.)3.42 × 10−13.25 × 10−13.30 × 10−13.59 × 10−13.43 × 10−13.48 × 10−1
Eutrophication, terrestrial (Mole of N eq.)3.763.593.663.953.783.85
Human toxicity, cancer—total (CTUh)9.03 × 10−84.41 × 10−82.19 × 10−89.24 × 10−84.87 × 10−82.77 × 10−8
Human toxicity, non-cancer—total (CTUh)6.75 × 10−65.62 × 10−65.31 × 10−67.12 × 10−66.05 × 10−65.76 × 10−6
Ionising rad., human health (kBq U235 eq.)6.494.836.296.995.416.80
Land use (Pt)5.57 × 1024.66 × 1025.30 × 1025.88 × 1025.01 × 1025.63 × 102
Ozone depletion (kg CFC-11 eq.)3.73 × 10−72.53 × 10−73.13 × 10−73.85 × 10−72.71 × 10−73.28 × 10−7
Particulate matter (Disease incidences)1.12 × 10−56.37 × 10−65.74 × 10−61.20 × 10−57.43 × 10−66.83 × 10−6
Photochem. ozone form., hum. health (kg NMVOC eq.)8.52 × 10−17.98 × 10−17.80 × 10−19.02 × 10−18.51 × 10−18.35 × 10−1
Resource use, fossils (MJ)2.08 × 1031.31 × 1039.71 × 1022.17 × 1031.44 × 1031.12 × 103
Resource use, mineral and metals (kg Sb eq.)3.05 × 10−56.43 × 10−51.81 × 10−43.30 × 10−55.68 × 10−51.67 × 10−4
Water use (m3 world equiv.)1.27 × 1037.67 × 1028.40 × 1021.31 × 1038.35 × 1029.03 × 102
LULUC–Land use and land use change
Table 8. The potential total CO2 uptake calculated for concrete cubes (a = 1 m) that have 5 m2 of the surface below the ground, according to EN 16757.
NAC IRMAC IRCAC INAC IIRMAC IIRCAC II
Total CO2 potential uptake
(kg CO2 per cube)
4.214.214.213.533.533.53
Publisher’s Note: MDPI stays neutral with regard to jurisdictional claims in published maps and institutional affiliations.

