1. Introduction
Clive Humby (2008) [
1]—of Tesco Clubcard fame once declared that ‘data is the new oil’, broadly connecting the digital collection and analysis of ‘big’ data—and behavioural data generated by human activity in particular—to a nascent Fourth Industrial Revolution [
2]. In an urban context, big data has been linked to the smart city, the Internet of Things (IoT), and, more recently, to the revival of the ‘Digital Twin” [
3]. This ‘new oil’ has fuelled increasingly complex and dynamic city analytics, as well as displacing survey data historically collected to understand demographic change and human behaviour. In its progress, there is promise of big data to better support management of existing infrastructures and, in theory, the planning and sustainable development of the cities of tomorrow. Of course, a more nuanced understanding of the strengths and limitations of big data point to the essential ongoing role of purposive data collection, such as via the national census and household travel survey, in providing insights that underpin a rich tapestry of urban research and real-world policy and decision-making.
In this research, we trace a number of opportunities and challenges in the exploitation of big data within a land-use and transportation planning context. We take a long view of ‘big data’, considering a number of definitions, and developing a ‘potted history’ of the co-evolution of data, tools, methods, and research inquiries. We then introduce a case study using public smartcard transport data and explore its application to the ’30-min city’ concept as a cornerstone of Sydney’s Metropolitan Planning Strategy. Lastly, we provide a critical reflection on the promise of big data, and on the opportunity and challenges in its access and its use in planning our future cities.
2. Defining Big Data and Its Role in the City
Batty (2013) [
4] once defined big data as ‘any data that cannot fit into an Excel spreadsheet’. In this new age, this tongue-in-cheek definition now seems feels very much like saying the definition of an ocean is that it does not fit into a teacup. However, it is clear that data volumes have grown disproportionately to the progress made by commercial and consumer software tools, and now require the development of novel analytical approaches in order to be collected, processed, and analysed. Gantz and Reinsel (2011, p.6) [
5], as such, define big data as ‘a new generation of technologies and architecture, designed to economically extract value from very large volumes of a wide variety of data by enabling the high velocity capture, discover and/or analysis’.
Early big data research used the 3Vs model: volume, velocity, and variety [
6]. Additionally, since then, a host of new alliterative additions have been made, including Variability, Value [
7] and Veracity [
8]. From a planning perspective, Kitchin and McArdle (2016) [
9] added to these: exhaustivity (striving to capture entire populations), resolution (aiming to be as detailed as possible), indexicality (uniquely identifying), relationality (containing common fields that enable the conjoining of different datasets), and extensionality (adding new fields easily). These are variable definitions that encapsulate the link between data, the available hardware and software, and their value in appending new, relevant information as they are generated to existing structures.
This ease in which data is now generated, processed and restructured has been crucial in describing and understanding a multiplicity of processes. It has shifted us t towards a ‘network society’, which has already been signposted by the embedding of low-powered, network-ready digital sensors in almost everything and its impact on the fields of geography and planning (see, for example, discussion in [
10]. Importantly, the ‘Internet of Things’ heralds an age in which data produced as a by-product of machines interacting with other machines dwarfs the volume of data generated by people talking to people. Additionally, while most of such data is accidental [
11] or, perhaps, incidental in the sense of being little more than ‘data exhaust’ [
12], the fact that this is everywhere leads many to hope for new insights into city form and function, as well as a wide range of daily activities undertaken by its residents and visitors.
These trends therefore connect to the notion of an emerging ‘fourth paradigm’ of data-intensive scientific discovery [
13] and this idea is, in turn, often linked to the emergence of machine-learning and other novel analytical approaches in urban management [
14]. There is, in other words, a quasi-Kuhnian presumption [
15]—
pace Aral (in Cukier, 2010, p.2) [
16]—that a revolution in our ability to measure the city will bring about a revolution in our ability to understand it. What is less clear, however, is whether this approach is applicable when complex trade-offs are called for and ‘optimisation’ subject of political, not just technical, decision-making. As such, we turn towards history, and the evolution of ideas about data-driven cities in order to inform thinking about the evolution of the smart city and beyond.
3. A History of Big Data in Understanding Cities
The application of data to the governance of cities and regions can be traced back far beyond the origins of computers: Van Rijmenam (2014) [
17] highlights the earliest use of written records, dating back more than 7000 years, as part of the administration of ancient Mesopotamia. The Romans too are well known for their administrative acumen, with the census perhaps best known for its role in Christianity’s origin story. Around the same time, in 2CE, the Han Dynasty were performing their own census recording data about a Chinese population of more than 57 million in 12 million households, larger than the current Australian census, without the benefit of computers [
18,
19].
The modern census—with its goal of recording every member of the population at regular intervals—is often associated with the rise of the nation state and the use of statistical tables for the purpose of governance and planning [
20]. We suggest, however, that it is perhaps more relevant to trace the modern idea of ‘big data’ back to the US Census of 1896 and the use of Herman Hollerith’s punch card tabulation machines [
21]. These machines, the precursor to IBM’s mainframes, were central to the development of modern computers [
22] and marked a radical shift towards the use of ‘machines’–mechanical, electrical, and, finally, digital–in the processing of data.
Barnes (2013) [
23] noted that big data research and analytics are often divorced from the past, suggesting that ‘big data has little history’. We suggest instead that these early examples of data collection and analytics were accompanied by methodological advances: Arribas-Bel and Reades (2018) [
10] have also noted a close, though not causal, connection between computing infrastructures and the objects of geographical enquiry. In other words, new data, applied to new questions, has stimulated the development of new analytical methods and tools for planning and managing our cities.
4. Urban Modelling and Big Data
The history of Large-Scale Urban Models (LSUM) reflects the linkage of new data and new tools to new planning approaches. Rooted in the premise that computer models of urban land use and transportation could contribute to more rational urban planning, early LSUM improved our understanding of model building, its limitations, and its relationship to policy. Strong contemporary criticism by Lee (1973) [
24] stressed that these efforts largely failed to deliver: they were too ‘hungry’ for disaggregated data and, at the same time, too coarse in their results to be useful in addressing issues that they were intended to solve. Lee also noted that too much emphasis was put on data and rationality, and that this was not supported by the theoretical underpinnings of such models.
Twenty years later, considering changes in society, information technologies, and computing, researchers began to revisit LSUMs [
25,
26]. The desktop computer gave planners ready access to more data, greater computational power, and dramatically better graphics, all accompanied by new software tools. Wegener (1994) [
27] emphasised that by the mid-1990s many LSUMs were being applied to real-life metropolitan regions for the purpose of research and/or policy analysis. Batty (1994) [
28] argued that the evolution of urban modelling, integrating theory and method, was an essential element of the movement towards a ‘science of planning’. New paradigms, such as complexity, started affecting the way urban systems were conceptualised and were accompanied by new modelling techniques such as cellular automata (CAs) and agent-based modelling (ABMs), used to understand the complex interplay between land use and transport dynamics and flows across the city.
A further twenty years later, Batty (2014) [
29] revisited this theme in the light of the smart cities concept (see also Townsend 2013 [
30]), noting the same kind of ‘euphoria’ as was associated with LSUMs in the 1960s, and stressing the need to learn from history and to recognise the limits of such approaches. Yes, computational and sensing devices—both fixed and mobile—are now distributed across the city fabric and are connected to one another by digital networks; however, much of the data generated via these interactions is unstructured and the analyst must either discover order, or impose it, using other data and/or theory for guidance.
The ‘Digital Twin’ initiative can be seen as a way to reintegrate the concept of LSUMs in the current context and it and embodiment of urban big data. At its most basic, the digital twin is a virtual model of physical assets that can be used for predictive maintenance. Crucially, through the use of big data generated by IoT devices, high resolution city imagery of building and real-time traffic feeds the model is no longer really distinct from the city that it represents. The data generated by this infrastructure enables the model to continuously adapt to changes in its environment and the model can, in turn, inform the environment and its infrastructures. In other words, through feedback effects the distinction between the physical world and its digital simulacrum is breaking down. This might not be a new idea for readers of post-modern theorists such as Baudrillard (1994) [
31], but the convergence of IoT, big data, and machine learning puts planning on a very different footing (again) and holds out the promise of predicting and shaping the future [
32], even if the event horizon is measured in minutes, hours, or days, rather than the more usual planning horizon of years or decades [
33].
5. Data for Future Cities
This trend towards more real-time data and analytics seems to point to the ultimate emergence of a ‘smart’ city in which individuals and instrumentation serve as the eyes, ears, and actuators of a kind of city-scale artificial intelligence (AI). If we consider Townsend’s (2013) [
30] definition of smart cities as being ‘where information technology is wielded to address the myriad problems facing society through the collection and analysis of data about the behaviour of people, precincts, and infrastructure’, the promise here is of ‘better’ decision-making and the realisation of more liveable cities where citizens spend less time commuting and have more time for work and leisure. However, as more critical scholars have pointed out, this can strip plan-making of its political features and reframe it as a purely technocratic problem that is centred on simply selecting the most appropriate optimisation criteria.
Regardless, data-driven approaches to urban management are unquestionably becoming more common. Engin et al. (2019) [
14] mapped this landscape and highlighted three categories of application: (i) real-time management; (ii) evidence-based planning decisions; and (iii) framing the future. The data required to support these data-driven approaches are captured through combination of traditional government and industry data capture programs coupled with volunteered geographic information [
34],which Ratti and Claudel (2016) [
35] term ‘opportunistic sensing’ and with data from authoritative data capture programs.
However, the ethics of such (re)use of VGI and opportunistic data is of considerable interest to government and citizens; most notable and controversial has been the use of harvested Facebook profiles by Cambridge Analytica [
36]. Nevertheless, the approach seems here to stay and will likely play a significant role in future collection and curation of urban big data: even Mastercard has become an urban mobiilty solutiona provider through theirr City Possible programme, partnering with Cubic to delivering a contactless payment system for both ‘open loop’ and ‘closed loop’ systems in cities such as Sydney and London. s. Such urban mobility data products are made possible through the collection and aggregation of individual transactions which can be considered as digital traces consumers leave in daily activity. In the last two decades alone, data from providers, such as Mastercard, have uncovered previously unrealised patterns of activities (e.g., in e-commerce), which taken as a whole, has challenged what was previously understood of land-use planning, urban mobility, and other demographic and location connections [
37].
Owing to this, questions of data ownership and access for a variety of purposes—commercial, academic, and governmental—have been widely debated in relation to online services, but similar notions can also be applied to data on the built-environment itself. Valuable information, ranging from property values and building characteristics, to the demographic make-up of their residents and users are often still held tightly by institutions, but alternative systems of data collection, such as Colouring London [
38], have sought to ‘open’ big data by leveraging on crowdsourcing and participatory mapping. The democratisation of urban data by such platforms heralds a new evolution of informed decision-making, replacing outdated legacy systems with novel connected and accessible models that have the potential to reshape administrative and municipal functions. Indeed, if used judiciously, we believe the availability of such data might address some of the complex problems facing our cities by enabling an informed approach towards tackling congestion and realising more integrated public transport solutions for our rapidly urbanising planet.
6. Urban Data for Transport Planning
Indeed, urbanisation generates no shortage of complex problems: it has been estimated that in Australian cities alone, the cost of avoidable congestion was
$12.8 billion in 2015. This figure is expected to more than double to approximately
$30 billion by 2030, driven by the rapid growth of Sydney, Melbourne, Brisbane, and Perth [
39]. Getting commuters off roads and using public transport has also been reported to have significant environmental benefits in realising more sustainable cities [
40] However, this is not a new problem. As early as the 1970s, the Sydney Coordinated Adaptive Traffic System (SCATS) was deployed sensors at each traffic signal to detect vehicle and pedestrian presence. The system—operating in real time—adjusts traffic signals in response to variations in demand and system capacity. SCATS is now the leading traffic management system in the world, which is used to quietly monitor and control over 37,000 intersections across 27 countries [
41]. In this sense, it may perhaps be fair to frame SCATS as a big data, smart city ‘solution’ that predates the existence of these terms.
7. Rise of the Mobile Phone
A step change in the availability of data about urban mobility came with the maturation of the GPS system. It then became possible not just to count, but to track, vehicles including private cars, freight, and public transport. Following suit, the uptake of GPS- and data- enabled smartphones has since furthered this process. The inherently personal nature of such devices holds out promise of understanding individual behaviours through their movement. Certainly, smartphone applications, such as Riderlog [
42] and SafetiPin [
43] has enabled the collection, analysis, and visualisation of individual movement at scale; and, collectively, these apps point towards the possibility of a ‘cellular census’ [
44].
Social media is another frequently used source of big data for urban analytics with the analysis of geographically encoded ‘tweets’ as one research pathway [
45]. These novel datasets have seen applications in the quantification of transport- and demographic migration models, often exhibiting more relevance to planning than traditional models hinging on cyclical data collection [
46,
47]. Volunteered geographic data, in tandem with the widespread use of mobile phones has, more than ever before, enabled researchers to begin to make sense of this unpredictability. Following this line of thinking, other investigators have also incorporated natural language processing techniques such as sentiment analyses [
48] and topic modelling [
49] to provide a level of rationalisation of the complexity associated with big data.
In the context of transport, the role of big data consumers in the standardisation of data about urban mobility has often been overlooked. Principal amongst these has been Google and its role in the development of the General Transit Feed Specification (GTFS) in collaboration with Portland’s TriMet public transport operator [
50]. Designed with multi-modal journey planning in mind, GTFS has become the de facto standard for sharing data about subway, rail, and bus schedules because of Google’s pre-eminence in end-user mapping and trip planning.
The standard has, of course, made Google Maps more useful to its customers, reinforced the value of the standard to the operators and encouraged yet more of them to converge on this format as the means for publishing their own timetables. Google can, in turn, combine journey planner requests with real-time location data from phones to prompt a user to input valuable real-time information on the crowdedness of the train or bus and any delays impacting the service. This is an unusually virtuous circle: the phone serves both to access and generate data, yielding ever-more nuanced and exhaustive insights into city-scale mobility and, in turn, allowing users and planners to make ever-better use of a limited resource though few outside of Google are ever likely to see this data ‘in full’.
Not all data aggregators have approached this in quite the same way: Strava collects and provides data—for a price—to help cities understand people’s cycling patterns and drive new research into active travel behaviour [
51,
52]. Their data has, for instance, assisted with cycle infrastructure planning by Miami-Dade County, Florida [
53]. Of course, the degree to which an exercise app’s user base can substitute for the population of pedestrians or cyclists in an urban area is very much an open question, and one to which we will return below.
8. The Mixed Value of Smartcard Data
A source of (relatively) more accessible data on urban mobility, particularly in a public transport context, has been the Smart Card Automated Fare Collection (SCAFC) systems such as Hong Kong’s Octopus, London’s Oyster, Sydney’s Opal, and Singapore’s EZ-link cards (see, for example, Zhong et al., 2016 [
54]; Reades et al., 2016 [
55]). Unlike app and network data, SCAFC data is often ultimately owned by the transport operator, although in the early days of the smart ticketing ‘revolution’ not all operators negotiated with their suppliers the right to exploit their ‘own’ data.
The contractual structures governing smart card ticketing create new opportunities for data sharing and re-use for planning, research, and even commercial, purposes. Transport for London was one of the first movers in this area, making some aggregated data available through the London Data Store and other tranches of disaggregated data available to research partners in academia to support modelling of multi-modal journeys, the analysis of variability at the individual level [
56], and the behavioural changes induced by mega-events such as the London Olympics [
57].
A recurrent challenge in such analysis, however, is that these systems were designed to bill users correctly—potentially with a bias towards under- or over-billing them depending on political judgements about their acceptability—not to support fine-grained origin/destination (O/D) analysis. It might seem obvious that users of smart card systems ‘tap in’ at one location and ‘tap out’ at another, but real life is rarely so simple: London does not require users to tap out of buses but does for trains. New York, meanwhile, has not normally collected data about destinations because the system was designed with a fixed charge in mind. Intermediate validations, re-entries, re-exits, automatic termination, and charge-free transfers add to the complexity. Each infrastructure is unique and, consequently, each carries its own set of limitations and qualifications.
This complexity is a challenge often overlooked by proponents of ‘open data’ and the provision of such data to researchers can carry substantial costs: the maintenance and validation of data feeds, and the costs associated with ad hoc requests for support documents or updated feeds, are far from inconsequential. It is imporant to note that many open data sites also have a disclaimer about the veracity and timeliness of the data, asking users “to use at their own risk”.
The proliferation of ‘curiosity-driven research’ by academics and the lack of obvious planning or efficiency return benefits to operators can lead to the creation of gatekeepers who filter out requests not seen as directly contributing to the operator’s bottom line. This approach reduces costs but also the range of actors working with these data and organisations. However, operators are beginning to release new products that are much more relevant to researchers than anything previously available.
Historically, transport studies—such as those of individual travel budgets—were based on sample surveys using travel diaries [
58], but big data cover larger areas of the city and proportions of the population and typically capture date, time and location with greater accuracy than self-reporting methods [
59]. With these benefits in mind, it’s easy to see why transport has become one of the most significant components of the contemporary smart city. Some recent examples include the work of Rashidi et al. (2017) [
60] using social media data, Kung et al. (2014) [
61] applying mobile phone data, and Leao et al. (2021) [
59] using public transport smart card data to better understand travel behaviour through cities. At the same time, such work has also highlighted the limits of big data, and the challenges that need to be addressed to overcome these.
9. Big Data Applications in Practice
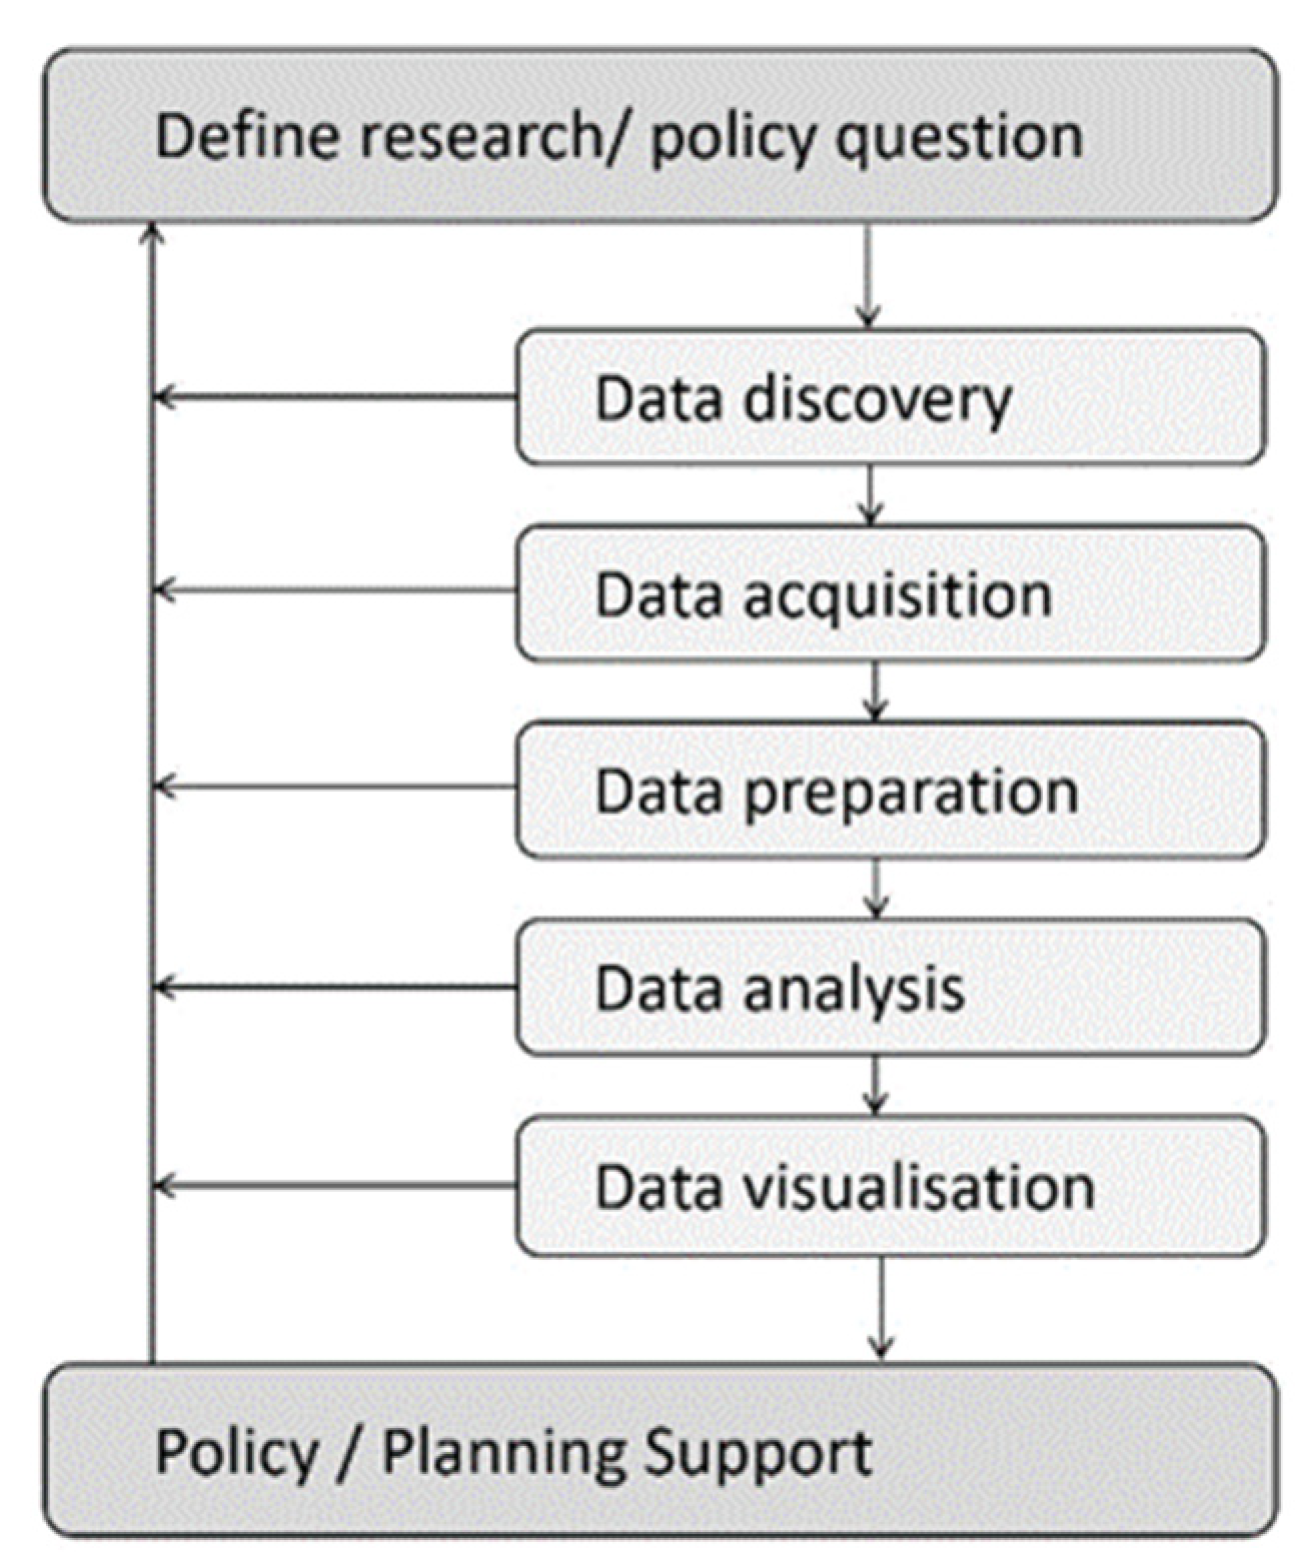
We here present a case study focussed on Sydney’s SCAFC, Opal, introduced in 2012 and made compulsory in 2016. Between 2016 and 2020, a series of planning exercises underpinned by Opal Smart Card and other datasets were undertaken to better understand accessibility to jobs and services as part of the Greater Sydney Commission’s vision of a 30 min city. A standard analytical workflow developed by Pettit et al. (2017) [
62] frames the case study from the perspective of a big data user/urban researcher (ref.
Figure 1). This enables critical reflection and the researchers’ experiential insights to be systematically and logically documented.
10. Research/Policy Question
The first step of this approach is to define a research and policy question. The city’s vision builds on the idea that people aim to optimise their travel, budgeting for no more than one hour per day (see for example Marchetti, 1994 [
63]); this figure has become a cornerstone of the Sydney Metropolitan Plan [
64] and Sydney’s Future Transport Strategy [
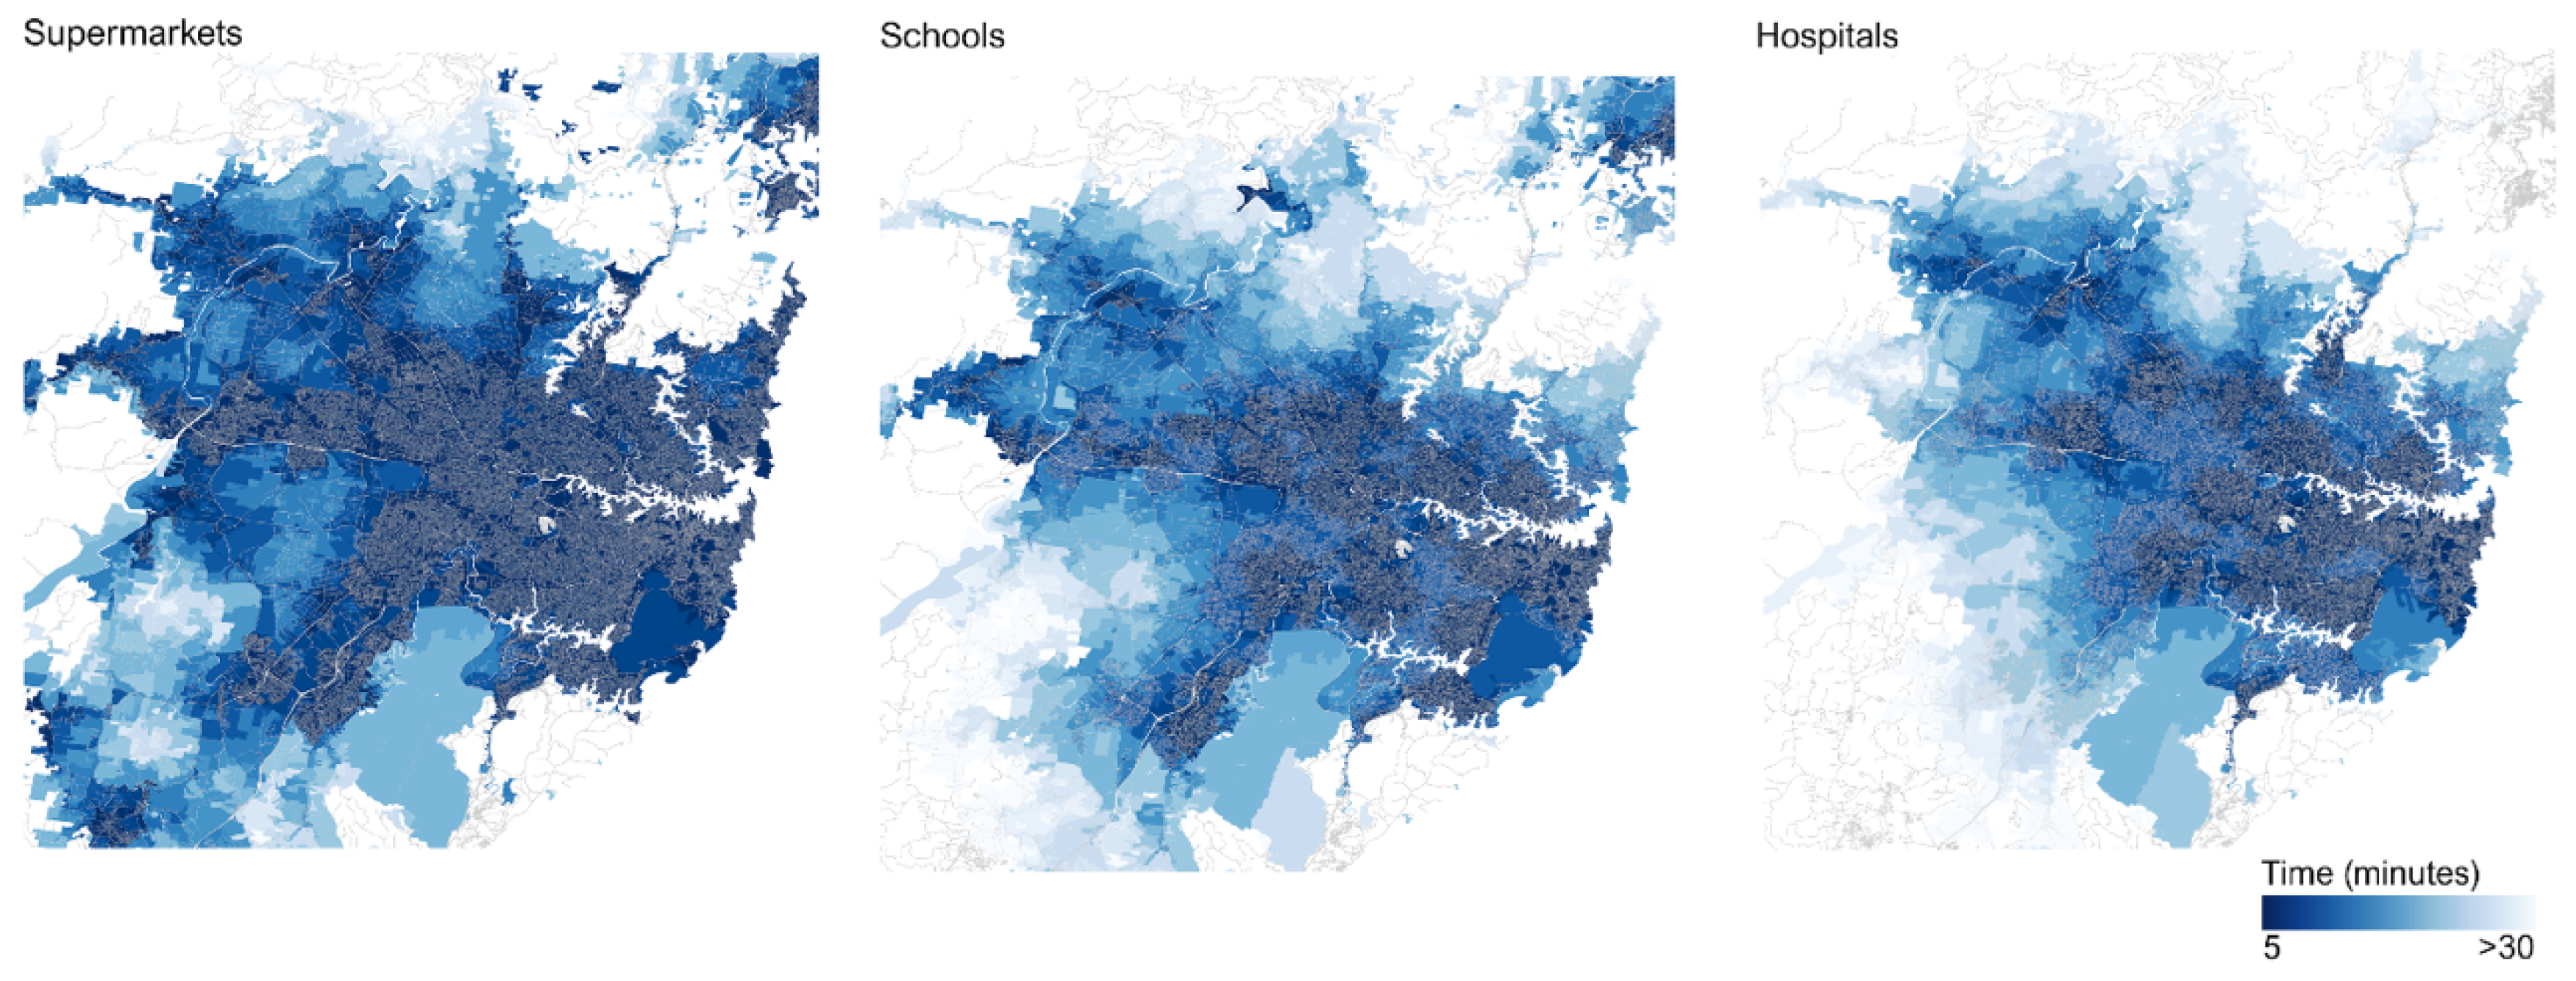
65]. Essentially, the idea is that that anyone within the city should be able to reach essential services and opportunities, such as employment, healthcare, recreational activities and education, within 30 min’ travel time (see
Figure 2). As defined by the Greater Sydney Commission’s 30 min city indicator, their policy purpose is to measure: ‘the proportion of residents able to reach their nearest metropolitan centre/cluster or strategic centre using public transport and/or walking within 30 min’ [
66]. This policy has inherent sustainability drivers too, in focusing on reducing travel time to within 30 min and thereby reducing the carbon footprint of a city induced by travel.
Sydney’s 30 min city puts forth the notion of planning by time [
59], which brings to the forefront the relationships between mobility accessibility, and the city’s locational attributes, built structures, and transport networks. Critically, however, these relationships are complex, and the requisite data to describe these relationships may yet still be fragmented and may not display any discernible patterns. As such, it can be argued how big data, facilitated by current technological advancements, may bridge the gap in data collection and analysis of these dimensions still remains to be seen—particularly in the realms of land-use planning, transport planning, and service delivery.
However, as opined by Moreno et al. (2021) [
67], there may perhaps still be value in understanding many different outcomes of such chrono-urban models in these spheres as is the case of Sydney. Further work is therefore required to understand such complexities in the city in light of the city’s ambitious planning futures; thus, indicating the opportunities for big data to better aid and disentangle these uncertainties, in this vein, the present paper provides a critical reflection of the use of big data for urban planning and policy-making with a case study of the 30 min city to support the NSW Government in understanding and planning for these. In particular, this research sought to identify to what extent current infrastructure was encouraging and enabling the policy objective. For an in-depth analysis of the 30 min city methodology and data, refer to the paper by Leao et al., (2021) [
59].
11. Data Discovery
For big data to be used, it needs to be found (or ‘discovered’) in the first place, and this requires an infrastructure to support data storage, search functionalities, metadata records, and tools to remotely access to data, including APIs (Application Programming Interfaces). Examples of such infrastructure at a national level in Australia include the Data Gov Portal (
https://data.gov.au/data/) (accessed on 15 November 2021) and AURIN, the Australian Urban Research Information Network (
https://aurin.org.au/) (accessed on 15 November 2021). The AURIN online workbench provides access to over 5000 urban datasets to support data-driven urban studies [
68]. While supporting the open data policies by providing easy access to published data, AURIN also works as a catalyst triggering the publication of more and better-quality data.
Opal data is discoverable and accessible in one form through the Transport for NSW Open Data Gov Portal (
https://opendata.transport.nsw.gov.au/) (accessed on 15 November 2021). To protect the privacy of travellers, the raw data collected through the ticketing system is simplified and aggregated to stop-based rather than trip-based, giving non-identifiable metrics in reduced sample time bins. The ‘raw’ Opal Card data is also available through ‘human’ access via a data request process, which is assessed by the Department. Data provided through the ‘human’ rather than ‘automated’ channel provides a richer source of trip-based data and is the basis of the urban analysis discussed in the ensuing sections of this paper.
12. Data Acquisition
Both the open and closed versions of the Opal card data is supplied as a cross-sectional output, rather than as a live data stream for specific stops, routes, or areas of the city. For this work, an agreement was reached between the research teams at the University and the NSW Government. The initial data license provided access to an anonymised dataset spanning a three-month period in 2016 and retained the origin-destination link. The data license was established over a two-week period and data was provided on a secure USB stick for the research team to access.
A further request in 2018 for an update to this data for time-series analysis resulted in a much longer processes for data acquisition. Securing this next license took nearly six months of negotiation and documentation. Due to more strict data privacy policies, further aggregation and simplification of the data were required, even for licensed data, and more recent releases obtained for the project did not provide the same level of resolution as the 2016 data cut. This presented challenges in undertaking temporal analysis. In short, the absence of an agreed format for the life of a project can potentially hamper research, even though the government itself supports the research. As data privacy concerns continue to escalate, access to consistent urban big data, such as the Opal Card data, is not necessarily possible. This limits the spatial-temporal resolution of research analysis and its potential to support the collective planning and policymaking of more sustainable future cities.
13. Data Preparation
A survey by Forbes in 2016 reported that data scientists typically spend 80% of their time on preparing data, before analysing it [
69]. As Opal Card data is an official government system used in the whole State of NSW, it has several advantages: it is a structured, complete, and maintained dataset. The Opal Card data required relatively little cleaning but did include more tap-ons than tap-offs (potentially due to the traveller forgetting to tap-off or to malfunction of the Opal reader), and a few outliers with short distance trips taking a very long travel time (potentially due to disruption of the transport system, or malfunction of the card system). In contrast, crowd sourced mobility data from fitness apps, for example, is intrinsically incomplete, often as a result of recruitment biases.
This does not mean that Opal Card data are without their challenges: there was only a limited period of time period during which Opal was the primary form of payment for public transport in Sydney. When Opal was rolled out in 2012, it did not immediately become the only method of payment, magnetic stripe tickets were still in wide circulation until August 2016. Since mid-2019 American Express, Mastercard and Visa credit or debit card users—as well those with phones supporting Near Field Communications—have been able to pay for their travel without an Opal Card, further complicating the analysis. The fragmentation of payment technologies and vendors can create access and ownership issues, reducing the utility of big data as a replacement for traditional survey instruments.
Balancing the desire for recency and completeness, we chose to use August 2016 data since it captured the most complete record of the public transport system though, of course, it did not capture annual cycles in transport use. Additional considerations include whether to suppress special event or weather conditions. Data linkage to generate O/D matrices, incorporating different levels of resource access, also included allowance for transfer times in multi-modal journeys (e.g., bus + train or ferry + bus). An additional step was the association of Opal data with Census information by assigning an ‘SA1 area’—a standard Census unit—to each public transport trip. The costs of data preparation are high and sometimes prohibitive: our study required a highly skilled team of data scientists and used a range of specialist software including R studio and ESRI’s ArcGIS.
It is important to note some limitations of the data preparation process. First, the calculated travel time based on Opal Card data is indeed an underestimation, as walking or driving time to and from train/bus stations was not included. Further, ‘tapping on’ happens on entering a train station, usually well before boarding, but when a bus arrives-potentially making bus trips seem shorter relative to trains. The simplification of using a weekday and morning peak as reference for commuting does not account for weekend or night-shift workers, and may also include non-commuters.
14. Data Analysis
Data analysis is the process of extracting ‘value’ from the data, producing meaningful insights or assisting in decision-making by individuals or organisations. In this study, we first calculated the traditional ‘mean travel time budget’ as an aggregated indicator for Greater Sydney, as a way to ensure comparability with conventional travel budget methodologies. The literature, however, indicates that although results are robust at the aggregate level, the idea of a stable travel budget has not been as strongly confirmed in disaggregated studies in contemporary cities [
61]. We therefore proposed and calculated five new travel time related indicators for the 30 min city [
59] in the hopes of bringing to the surface spatial variations and inequalities which were, prior to access to big data, hidden inside the aggregated travel budget. For each destination, among 15 strategic town centres across Greater Sydney, the five new indicators included: (1) median travel time budget; (2) interquartile range of the travel time budget; (3) percentage of workers with travel time shorter or equal to 30 min; (4) percentage of workers with travel time shorter or equal to 30 min by range of worker’s income; and (5) correlation coefficient between workers’ travel time and mean income. Together, these indicators provided a rich picture of geographic differences and inequalities in urban accessibility.
One challenge was the storage and computing power required: although not enormous in terms of length, the complete data for a single day in Greater Sydney nonetheless spanned 5 million rows (individual trips), each with 60 columns of ‘width’ (the attributes of each trip, including date, time, card type, locations, lines, operators, area codes, etc.). This certainly passed Batty’s ‘Excel test’ and also required a balance between subject knowledge and advanced digital skills for meaningful interpretation along the data analysis pipeline.
Moreover, understanding the limits of individual datasets, and how data integration processes can overcome some of these limitations, is an important dimension in big data analytics. Enrichment with survey instruments is one way to add other dimensions or resolve challenges. For example, in an area with low frequency services a customer may wait 15 min at the start of their supposed 30 min journey. This can be ameliorated by combining O/D data with scheduling or frequency data (such as GTFS, mentioned earlier). Data on weather conditions, public transport disruptions, major sporting or cultural events, school holidays, and so on can provide analytical context and interpretive depth.
The potential of big data is endless, within the capabilities, goals, skills and analytical maturity of the organisation as a consumer, ranging from descriptive, inquisitive, predictive and prescriptive, to pre-emptive analytics [
70]. We have focused mostly on a descriptive analysis (identifying travel times across the region for selected employment hubs), and slowly moved towards more inquisitive approaches (How do social spatial inequalities relate to accessibility across the region?).
Interestingly, we found a large variation of travel time, and also a geographic divide, in Greater Sydney. In the East/Centre region, the higher the income of the commuter, the shorter their travel time; while in the West, the opposite was found, with higher income commuters leading having longer commuting times [
59]. This divide reflects complex socio-economic inequalities, that manifest geographically in the city shape, and should be taken into consideration in future plans for urban growth and accessibility.
15. Data Visualisation
In the early stages of an analysis, data visualisation can assist in the identification of missing, erroneous or duplicate values. In intermediate stages, it can assist users in ‘sense-making’ through querying of the data and assessing the results through visual outputs. In the final stages, it can be a means to organise the data to best communicate insights. In short, although we’ve positioned it as the penultimate stage in the pipeline for simplicity, data visualisation can be integral to many of the stages in this workflow.
Agrawal et al. (2015) [
71] divide the challenges of big data visualisation in three categories: perceptual scalability (associated with the human eye’s perceptual limits and also the limited screen sizes of some of our ubiquitous devices); real-time scalability (related to limits of computational memory, query, and processing for big real-time data streams); and interactive scalability (associated with the computation limits of complex algorithms being interactively applied by multiple simultaneous, potentially mobile, users). Additional data visualisation complexities include privacy protection of subjects illustrated graphically, and security against hacking of the datasets behind visualisation dashboards.
Using the ‘semi-interactive’ ESRI StoryMap platform, we developed a visualisation allowing users to select specific job destinations in Greater Sydney and review a series of related data analyses through graphs and maps. Visualising every origin-destination data point of the study area would lead to over-plotting, overlapping lines, and would overwhelm users’ perceptual and cognitive capacities. We therefore combined nearby stations and stops into the standard Travel Zone geography used for Census analysis and eliminated origins within Greater Sydney with less than five trips. The minimum threshold serves to reinforce the key findings while also acting to protect individual user privacy. Presenting the results of the 30 min city analysis in this aggregated form makes it possible to communicate the results via an online urban dashboard to government, industry and citizens. Such dashboards potentially encourage and support greater participation of citizens in the planning process [
72].
16. Policy and Planning Support
The full cycle of big data analytics is completed when the insights from the analytical process are used to inform policy and planning decision-making. The literature on big data suggests abundant potential for better decision-making. In the private sector, big data analytics for decision making have significantly increased (4–6%) productivity [
73]. In the public sector, big data’s potential for rational decision-making has been both advocated and criticized in the public administration debate [
74]. City planning can be very complex, due to the mix between technical and political contexts, and the multiple actors with different roles and goals. In cities, what is generally sought is not simply an optimised solution, but a compromise that generates the best possible overall ‘good’ for a varied society, subject to existing built stock and infrastructure, socio-economic context, and limited resources. Beyond the goal of increased revenues or reduced costs pursued by businesses, the public sector needs to deal with goals related to sustainability, equity, productivity, and liveability, while incorporating participation and transparency.
The adoption of digital planning tools to support evidence-based policy and decision making thus remains a challenge [
75]. The analysis of the Opal card data characterised Greater Sydney as a 32 min city. However, based on the proposed five indicators for individual destinations, accessibility varied from a maximum in which ¾ of the public transport commuters reached work in less than 30 min, to a minimum in which only ¼ of the workers could do the same. Moreover, a distinctive pattern dividing Sydney in two halves was found when analysing the disaggregated correlation between workers’ travel time and mean income. In the East/Centre region, the higher the income of the commuter, the shorter their travel time; while in the West, the opposite was found, with higher-income commuters having longer-duration commuting trips. In other words, Sydney is a ‘somewhat 30-min city’ on the west region only for the lower-income workers, and on the centre/ eastern regions only for the higher-income workers. This divide found in Sydney reflects the complex socio-economic inequalities that manifest geographically in the city shape. The 30 min city dashboard is a digital planning tool developed with the specific aim of providing data-driven insights into the planning of Future Sydney, communicating the findings described above, see
Figure 3. The dashboard has provided insights to many planners and policy-makers who have interacted with the dashboard, both in co-design workshops hosted in the City Analytics Lab [
76] and through the ability of individuals to directly explore the visualisations via the publicly accessible online dashboard in their own time. Furthermore, the findings from the 30 min analysis has informed the formulation of district level strategic planning by the Greater Sydney Commission. The District Plans, later publicly published (
https://www.greater.sydney/western-city-district-plan) (accessed on 30 November 2021), reference the goal of increasing 30 min access to key employment clusters, as incorporated into the 30 min city dashboard. Further, the dashboard has been published for open online access, since the release of the District Plans, accompanied by the support of the government and media coverage (
https://www.smh.com.au/national/nsw/opal-card-data-turns-up-surprise-for-sydneysiders-wanting-30minute-commute-20170215-gudakb.html) (accessed on 30 November 2021). It remains a resource for government, industry and citizens to use.
The study summarised here was an early attempt to utilise new, big data (Opal card) to approach a new government goal (30 min city). Since then, multiple dashboards, analytics and interpretations on the same theme have been developed, making it challenging to provide a clear and definitive message. These include ARUP’s 30 min city analytics and visualisation work, based on accessibility modelling using GTFS data [
77], and many others. In fact, one of the opportunities and challenges in providing access to open city data is that a ‘thousand flowers’ may bloom with different results prevailing. In relation to big data, this is a key challenge-ensuring quality control, cross-validation, and scalability [
78].
17. Conclusions
As we plan for more liveable, productive, sustainable and resilient cities the power of urban big data should help politicians, planners and the community work together to address the myriad of ‘complex problems’ facing our cities: including congestion, social inequality, an ageing population and the impacts of a changing climate. However, one of the challenges is that significant big data repositories are driven by strong commercial interests. Social media data from companies such as Twitter, Facebook and WeChat have not been created to solve the challenges facing our cities, rather they have arisen to connect people and generate profit through advertising and selling products. Likewise, Smart Card systems have not been devised specifically to assist city planners in shaping future cities, rather as an efficiency mechanism to reduce friction and people costs in public transport systems. Nevertheless, it is the ability to access and analyse such repositories of big data that can potentially provide new insights into the form and function of our cities. The ‘opportunistic’ use of such data is an engine to power our future cities. Yet, the growth of data as a commodity through e-commerce and social media platforms is creating a digital divide for those who cannot afford to access such data. Thus, there is an opportunity, and somewhat of an imperative, for government and industry to address this rising social inequality and to forge new partnerships with communities and researchers to inclusively and collaboratively work on solving urban problems.
In this paper we have considered the evolution of data sources and analytics towards the so called ‘Smart City’. This is fuelled by rapidly increasing data volumes from an eclectic array of sensors. In this research, we have taken a critical reflective approach focusing on Sydney as a case study. Specifically, we examined how big data, derived from the Opal Smart Card, is being used in planning for a 30 min city, which is a cornerstone of the Greater Sydney Commission’s and Transport for NSW’s Metropolitan Plan. The paper documents several important insights and lessons from this Sydney case study including the increasingly important and complex problem of accessing big data and deriving new insights without comprising the privacy of individuals. There remain many opportunities and challenges arising from urban big data; only time will tell how these unfold as the divide between the digital and real world continues to diminish.
Author Contributions
Conceptualization, C.J.P., S.Z.L. and J.R.; methodology, C.J.P., S.Z.L., O.L.; software, S.Z.L. and M.N.; validation, S.Z.L. and M.N.; formal analysis, C.J.P., S.Z.L., O.L., M.N., J.R.; investigation, C.J.P., S.Z.L., O.L., M.N., J.R.; resources, C.J.P. and J.R.; data curation, S.Z.L., M.N.; writing—original draft preparation, C.J.P., S.Z.L., O.L., J.R.; writing—review and editing, C.J.P., S.Z.L., O.L., M.N., J.R.; visualization, S.Z.L., and M.N.; supervision, C.J.P.; project administration, C.J.P., S.Z.L.; funding acquisition, C.J.P., S.Z.L., J.R. All authors have read and agreed to the published version of the manuscript.
Funding
This research received no external funding.
Data Availability Statement
Conflicts of Interest
The authors declare no conflict of interest.
References
- Humby, C.; Hunt, T.; Phillips, T. Scoring Points: How Tesco Continues to Win Customer Loyalty; Kogan Page Publishers: London, UK, 2008. [Google Scholar]
- Schwab, K. The Fourth Industrial Revolution, What It Means and How to Respond. Foreign Affairs. 2015. Available online: https://www.foreignaffairs.com/articles/2015-12-12/fourth-industrial-revolution (accessed on 20 September 2021).
- Batty, M. Digital twins. Environ. Plan. B Urban Anal. City Sci. 2018, 45, 817–820. [Google Scholar] [CrossRef]
- Batty, M. Big data, smart cities and city planning. Dialogues Hum. Geogr. 2013, 3, 274–279. [Google Scholar] [CrossRef]
- Gantz, J.; Reinsel, D. Extracting Value from Chaos. IDC iView 2011, 2011, 1–12. [Google Scholar]
- Laney, D. 3-D data management: Controlling data volume, velocity and variety. META Group Res. Note 2001, 6, 1. [Google Scholar]
- Katal, A.; Wazid, M.; Goudar, R.H. Big data: Issues, challenges, tools and good practices. In Proceedings of the 2013 Sixth International Conference on Contemporary Computing (IC3), Noida, India, 8–10 August 2013; pp. 404–409. [Google Scholar]
- Rubin, V.; Lukoianova, T. Veracity roadmap: Is big data objective, truthful and credible? Adv. Classif. Res. Online 2013, 24, 4. [Google Scholar]
- Kitchin, R.; McArdle, G. What makes Big Data, Big Data? Exploring the ontological characteristics of 26 datasets. Big Data Soc. 2016, 3, 1–10. [Google Scholar] [CrossRef]
- Arribas-Bel, D.; Reades, J. Geography and computers: Past, present, and future. Geogr. Compass 2018, 12, e12403. [Google Scholar] [CrossRef]
- Arribas-Bel, D. Accidental, open and everywhere: Emerging data sources for the understanding of cities. Appl. Geogr. 2014, 49, 45–53. [Google Scholar] [CrossRef] [Green Version]
- Harford, T. Big Data: A Big Mistake? Significance 2014, 11, 14–19. [Google Scholar] [CrossRef]
- Hey, T.; Tansley, S.; Tolle, K. The Fourth Paradigm: Data-Intensive Scientific Discovery. Microsoft Research. 2009. Available online: https://www.microsoft.com/en-us/research/publication/fourth-paradigm-data-intensive-scientific-discovery/?from=http%3A%2F%2Fresearch.microsoft.com%2Fen-us%2Fcollaboration%2Ffourthparadigm%2Fdefault.aspx (accessed on 20 September 2021).
- Engin, Z.; van Dijk, J.; Lan, T.; Longley, P.A.; Treleaven, P.; Batty, M.; Penn, A. Data-driven urban management : Mapping the landscape. J. Urban Manag. 2020, 9, 140–150. [Google Scholar] [CrossRef]
- Kuhn, T.S. The Structure of Scientific Revolutions; University of Chicago Press: Chicago, IL, USA, 1962. [Google Scholar]
- Cukier, K. Data, data everywhere: A special report on managing information. Economist 2010, 394, 3–5. [Google Scholar]
- Van Rijmenam, M. Think Bigger: Developing a Successful Big Data Strategy for Your Business; Amacom: New York, NY, USA, 2014. [Google Scholar]
- Nishijima, S. The economic and social history of Former Han. Camb. Hist. China 1986, 1, 545–607. [Google Scholar]
- Schinz, A. The Magic Square: Cities in Ancient China; Edition Axel Menges: Fellbach, Germany, 1996. [Google Scholar]
- Baffour, B.; King, T.; Valente, P. The modern census: Evolution, examples and evaluation. Int. Stat. Rev. 2013, 81, 407–425. [Google Scholar] [CrossRef] [Green Version]
- Hollerith, H. The electrical tabulating machine. J. R. Stat. Soc. 1894, 57, 678–689. [Google Scholar] [CrossRef]
- Yost, J.R. The IBM Century: Creating the IT Revolution; IEEE Computer Society Press: Washington, DC, USA, 2011. [Google Scholar]
- Barnes, T.J. Big data, little history. Dialogues Hum. Geogr. 2013, 3, 297–302. [Google Scholar] [CrossRef]
- Lee, D.B., Jr. Requiem for large-scale models. J. Am. Inst. Plan. 1973, 39, 163–178. [Google Scholar] [CrossRef]
- Klosterman, R.E. Large-scale urban models retrospect and prospect. J. Am. Plan. Assoc. 1994, 60, 3–6. [Google Scholar] [CrossRef]
- Harris, B. The real issues concerning Lee’s ‘Requiem’. J. Am. Plan. Assoc. 1994, 60, 31–34. [Google Scholar] [CrossRef]
- Wegener, M. Operational urban models state of the art. J. Am. Plan. Assoc. 1994, 60, 17–29. [Google Scholar] [CrossRef]
- Batty, M.; Xie, Y. From cells to cities. Environ. Plan. B Plan. Des. 1994, 21, S31–S48. [Google Scholar] [CrossRef]
- Batty, M. Can it happen again? Planning support, Lee’s Requiem and the rise of the smart cities movement. Environ. Plan. B Plan. Des. 2014, 41, 388–391. [Google Scholar] [CrossRef]
- Townsend, A.M. Smart Cities: Big Data, Civic Hackers, and the Quest for a New Utopia, 1st ed.; W.W. Norton & Company: New York, NY, USA, 2013. [Google Scholar]
- Baudrillard, J. Simulacra and Simulation; University of Michigan Press: Ann Arbor, MI, USA, 1994. [Google Scholar]
- Kaur, M.J.; Mishra, V.P.; Maheshwari, P. The convergence of digital twin, IoT, and machine learning: Transforming data into action. In Digital Twin Technologies and Smart Cities, Internet of Things; Farsi, M., Daneshkhah, A., Hosseinian-Far, A., Jahankhani, H., Eds.; Springer Nature: Cham, Switzerland, 2020; pp. 3–17. [Google Scholar]
- Batty, M. Inventing Future Cities; MIT Press: Cambridge, MA, USA, 2018. [Google Scholar]
- Goodchild, M.F. Citizens as sensors: The world of volunteered geography. GeoJournal 2007, 69, 211–221. [Google Scholar] [CrossRef] [Green Version]
- Ratti, C.; Claudel, M. The City of Tomorrow: Sensors, Networks, Hackers, and the Future of Urban Life; Yale University Press: London, UK, 2016. [Google Scholar]
- Cadwalladr, C.; Graham-Harrison, E. Revealed: 50 million Facebook profiles harvested for Cambridge Analytica in major data breach. Guardian 2018, 17, 22. [Google Scholar]
- Nahiduzzaman, K.M.; Holland, M.; Sikder, S.K.; Shaw, P.; Hewage, K.; Sadiq, R. Urban Transformation Toward a Smart City: An E-Commerce–Induced Path-Dependent Analysis. J. Urban Plan. Dev. 2021, 147, 04020060. [Google Scholar] [CrossRef]
- Hudson, P.; Dennett, A.; Russell, T.; Smith, D. Colouring London–a crowdsourcing platform for geospatial data related to London’s building stock. In Proceedings of the 27th Annual Gis Research UK Conference, Newcastle University, Newcastle, UK, 23–26 April 2019; pp. 23–26. [Google Scholar]
- BITRE. BITRE Traffic and Congestion Cost Trends for Australian Capital Cities. 2015. Available online: https://bitre.gov.au/publications/2015/files/is_074.pdf (accessed on 20 November 2020).
- Newman, P.; Kenworthy, J. Sustainability and Cities: Overcoming Automobile Dependence; Island Press: Washington, DC, USA, 1999. [Google Scholar]
- SCATS. SCATs-Performance Statistics. 2019. Available online: https://www.scats.com.au/why-choose-scats-performance.html (accessed on 22 January 2019).
- Pettit, C.J.; Lieske, S.N.; Leao, S.Z. Big bicycle data processing: From personal data to urban applications. In Proceedings of the ISPRS XXIII Congress, Prague, Czech Republic, 12–19 July 2016. [Google Scholar]
- Hawken, S.; Leao, S.; Gudes, O.; Izadpanahi, P.; Viswanath, K.; Pettit, C. Safer cities for women: Global and local innovation with open data and civic technology. In Open Cities Open Data: Collaborative Cities in the Information Era; Hawken, S., Han, H., Pettit, C., Eds.; Palgrave Macmillan: Melbourne, Austria, 2020; pp. 85–103. [Google Scholar]
- Reades, J.; Calabrese, F.; Sevtsuk, A.; Ratti, C. Cellular census: Explorations in urban data collection. IEEE Pervasive Comput. 2007, 6, 30–38. [Google Scholar] [CrossRef] [Green Version]
- Frank, M.R.; Mitchell, L.; Dodds, P.S.; Danforth, C.M. Happiness and the patterns of life: A study of geolocated tweets. Sci. Rep. 2013, 3, 2625. [Google Scholar] [CrossRef] [Green Version]
- Johansson, B.; Klaesson, J.; Olsson, M. Commuters’ non-linear response to time distances. J. Geogr. Syst. 2003, 5, 315–329. [Google Scholar] [CrossRef]
- O’Kelly, M.E.; Niedzielski, M.A.; Gleeson, J. Spatial interaction models from Irish commuting data: Variations in trip length by occupation and gender. J. Geogr. Syst. 2012, 14, 357–387. [Google Scholar] [CrossRef]
- Pang, B.; Lee, L. Opinion mining and sentiment analysis. Found. Trends® Inf. Retr. 2008, 2, 1–135. [Google Scholar] [CrossRef] [Green Version]
- Himelboim, I.; Smith, M.A.; Rainie, L.; Shneiderman, B.; Espina, C. Classifying Twitter topic-networks using social network analysis. Soc. Media Soc. 2017, 3, 2056305117691545. [Google Scholar] [CrossRef] [Green Version]
- McHugh, B. Pioneering open data standards: The GTFS Story. In Beyond Transparency: Open Data and the Future of Civic Innovation; Code for America Press: San Fransisco, CA, USA, 2013; pp. 125–135. [Google Scholar]
- Haworth, J. Investigating the potential of activity tracking app data to estimate cycle flows in urban areas. In XXIII ISPRS Congress: Commission II [Proceedings]; Halounova, L., Li, S., Safar, V., Tomkova, M., Rapant, P., Brazdil, K., Shi, W., Eds.; Copernicus Gesellschaft MBH: Göttingen, Germany, 2016; pp. 515–519. [Google Scholar]
- Roy, A.; Nelson, T.A.; Fotheringham, A.S.; Winters, M. Correcting bias in crowdsourced data to map bicycle ridership of all bicyclists. Urban Sci. 2019, 3, 62. [Google Scholar] [CrossRef] [Green Version]
- Hochmair, H.H.; Bardin, E.; Ahmouda, A. Estimating bicycle trip volume for Miami-Dade county from Strava tracking data. J. Transp. Geogr. 2019, 75, 58–69. [Google Scholar] [CrossRef]
- Zhong, C.; Batty, M.; Manley, E.; Wang, J.; Wang, Z.; Chen, F.; Schmitt, G. Variability in Regularity: Mining Temporal Mobility Patterns in London, Singapore and Beijing Using Smart-Card Data. PLoS ONE 2016, 11, e0149222. [Google Scholar] [CrossRef] [PubMed] [Green Version]
- Reades, J.; Zhong, C.; Manley, E.D.; Milton, R.; Batty, M. Finding pearls in London’s oysters. Built Environ. 2016, 42, 365–381. [Google Scholar] [CrossRef] [Green Version]
- Zhong, C.; Manley, E.; Arisona, S.M.; Batty, M.; Schmitt, G. Measuring variability of mobility patterns from multiday smart-card data. J. Comput. Sci. 2015, 9, 125–130. [Google Scholar] [CrossRef]
- Reades, J. An Early Look at the Public Transit Legacy’ at UCL’s Transport & the Olympic Legacy in London. UK. 2012. [Google Scholar]
- Ahmed, A.; Stopher, P. Seventy minutes plus or minus 10–a review of travel time budget studies. Transp. Rev. 2014, 34, 607–625. [Google Scholar] [CrossRef]
- Leao, S.Z.; Hassan, M.N.; Rashid, T.H.; Pettit, C.J. Is Sydney a 30-minute city? Analysing travel time to job centres with public transport smart card data. In Applications of Big Data in Geography and Planning; Clarke, G., Birkin, M., Corcoran, J., Stimson, B., Eds.; Edward Elgar Publishers: Jotham, UK, 2021. [Google Scholar]
- Rashidi, T.H.; Abbasi, A.; Maghrebi, M.; Hassan, S.; Waller, T. Exploring the capacity of social media data for modelling travel behaviour: Opportunities and challenges. Transp. Res. Part C Emerg. Technol. 2017, 75, 197–211. [Google Scholar] [CrossRef]
- Kung, K.S.; Greco, K.; Sobolevsky, S.; Ratti, C. Exploring universal patterns in human home-work commuting from mobile phone data. PLoS ONE 2014, 9, e96180. [Google Scholar] [CrossRef] [Green Version]
- Pettit, C.J.; Tanton, R.; Hunter, J. An online platform for conducting spatial-statistical analyses of national census data across Australia. Comput. Environ. Urban Syst. 2017, 63, 68–79. [Google Scholar] [CrossRef]
- Marchetti, C. Anthropological invariants in travel behaviour. Technol. Forecast. Soc. Change 1994, 47, 75–88. [Google Scholar] [CrossRef] [Green Version]
- Greater Sydney Commission [GSC]. Greater Sydney Region Plan-A Metropolis of Three Cities-Connecting People, NSW Government. 2018. Available online: https://www.greater.sydney/metropolis-of-three-cities (accessed on 22 January 2020).
- Transport for NSW [TfNSW]. Three Cities for Sydney. Future Transport. 2018. Available online: https://future.transport.nsw.gov.au/designing-future/three-cities-for-sydney (accessed on 30 November 2021).
- Greater Sydney Commission [GSC]. Performance Indicator: 30-Minute City. 2018. Available online: https://www.greater.sydney/performance-indicator-30-minute-city (accessed on 22 January 2020).
- Moreno, C.; Allam, Z.; Chabaud, D.; Gall, C.; Pratlong, F. Introducing the “15-Minute City”: Sustainability, Resilience and Place Identity in Future Post-Pandemic Cities. Smart Cities 2021, 4, 93–111. [Google Scholar] [CrossRef]
- Sinnott, R.O.; Bayliss, C.; Bromage, A.; Galang, G.; Grazioli, G.; Greenwood, P.; Macauley, G.; Mannix, D.; Morandini, L.; Nino-Ruiz, M.; et al. The Australia Urban Research Gateway, Concurrency and Computation. Pract. Exp. 2014, 27, 358–375. [Google Scholar]
- Konstantinou, N.; Abel, E.; Bellomarini, L.; Bogatu, A.; Civili, C.; Irfanie, E.; Koehler, M.; Mazilu, L.; Sallinger, E.; Fernandes, A.A.A.; et al. VADA: An architecture for end user informed data preparation. J. Big Data 2019, 6, 74. [Google Scholar] [CrossRef]
- Sivarajah, U.; Kamal, M.M.; Irani, Z.; Weerakkody, V. Critical analysis of big data challenges and analytical methods. J. Bus. Res. 2017, 70, 263–286. [Google Scholar] [CrossRef] [Green Version]
- Agrawal, R.; Kadadi, A.; Dai, X.; Andres, F. Challenges and opportunities with big data, MEDES’15. In Proceedings of the 7th International Conference on Management of Computational and Collective Intelligence in Digital Ecosystems, Caraguatatuba, Brazil, 25–29 October 2015. [Google Scholar] [CrossRef]
- Lock, O.; Bednarz, T.; Leao, S.Z.; Pettit, C. A review and reframing of participatory urban dashboards. City Cult. Soc. 2019, 20, 100294. [Google Scholar] [CrossRef]
- Brynjolfsson, E.; Hitt, L.M.; Kim, H.H. Strength in Numbers: How Does Data-Driven Decision Making Affect Firm Performance? Working Paper, 2011. SSRN Working Paper. Available online: http://ssrn.com/abstract=1819486 (accessed on 20 November 2020).
- van der Voort, H.G.; Klievink, A.J.; Arnaboldi, M.; Meijer, A.J. Rationality and politics of algorithms. Will the promise of big data survive the dynamics of public decision making? Gov. Inf. Q. 2019, 36, 27–38. [Google Scholar] [CrossRef]
- Russo, P.; Lanzilotti, R.; Costabile, M.F.; Pettit, C.J. Towards satisfying practitioners in using Planning Support Systems. Comput. Environ. Urban Syst. 2018, 67, 9–20. [Google Scholar] [CrossRef]
- Punt, E.; Geertman SAfrooz AWitteb PPettit, C.J. Life is a scene and we are the actors: Assessing the usefulness of planning support theatres for smart city planning. Comput. Environ. Urban Syst. 2020, 82, 101485. [Google Scholar] [CrossRef]
- Lock, O. Using open-source data and transit network tools to improve our understanding of accessibility—A case study of the Sydney ‘30-minute city’. In Proceedings of the 10th International Symposium on Digital Earth and Locate 17, Sydney, Australia, 3–6 April 2017. [Google Scholar] [CrossRef]
- Lovelace, R.; Cross, P.; Clarke, M.; Birkin, M. ‘From big noise to big data: Towards the verification of large datasets for understanding regional retail flows’. Geogr. Anal. 2016, 48, 59–81. [Google Scholar] [CrossRef]
| Publisher’s Note: MDPI stays neutral with regard to jurisdictional claims in published maps and institutional affiliations. |
© 2022 by the authors. Licensee MDPI, Basel, Switzerland. This article is an open access article distributed under the terms and conditions of the Creative Commons Attribution (CC BY) license (https://creativecommons.org/licenses/by/4.0/).


 ,
, 