Article

Minimum Rainfall Inter-Event Time to Separate Rainfall Events in a Low Latitude Semi-Arid Environment

by
José Bandeira Brasil
1,
Maria Simas Guerreiro
2,*,
Eunice Maia de Andrade
3,
Helba Araújo de Queiroz Palácio
4,
Pedro Henrique Augusto Medeiros
4 and
Jacques Carvalho Ribeiro Filho
1
1
Department of Agricultural Engineering, Federal University of Ceará–UFC, Fortaleza 60020-181, Brazil
2
FP-ENAS, University Fernando Pessoa, 4249-004 Porto, Portugal
3
Department of Soil and Water Conservation, Federal University of the Semi-Arid Region, Mossoró 59625-900, Brazil
4
Federal Institute of Education, Science and Technology of Ceará, Iguatu 63500-000, Brazil
*
Author to whom correspondence should be addressed.
Sustainability 2022, 14(3), 1721; https://doi.org/10.3390/su14031721
Submission received: 21 December 2021 / Revised: 26 January 2022 / Accepted: 28 January 2022 / Published: 2 February 2022

Abstract

:
Water scarcity in dry tropical regions is expected to intensify due to climate change. Characterization of rainfall events is needed for a better assessment of the associated hydrological processes, and the proposition of adaptation strategies. There is still no consensus on the most appropriate method to separate rainfall events from a continuous database, although the minimum inter-event time (MIET) is a commonly used criterion. Semi-arid regions of low latitudes hold a distinct rainfall pattern compared to their equivalent at higher latitudes; these seasonally dry tropical forests experience strong spatial–temporal variability with intense short-duration rainfall events, which, in association with high energy surplus and potential evaporation, leads to an atmospheric water deficit. In this study, we identified the most adequate MIET based on rainfall data continuously measured at 5-min intervals over the last decade (2009–2020) in the semi-arid northeast of Brazil. The rainfall events were grouped according to different MIETs: 15 min, 1 h, 2 h, 3 h, 6 h, 12 h, and 24 h to determine rainfall depth, duration and intensity at intervals of 5, 30, and 60 min, time between events, and respective temporal distribution, with and without single tip events. Including single tip events in the dataset affected the number of rainfall events and respective characteristics up to a MIET of 3 h. A MIET of 6 h is the most appropriate to characterize the rainfall distribution in this tropical semi-arid region. Three classes were defined based on rainfall depth, duration, and intensity: I-small events (77% below 40 mm and 32 mm/h), II-high intensity events (3% between 36 and 76 mm/h), III-longer events of higher depth (20%). This study is useful for understanding how the MIET relates to other ecohydrological processes and provides more precise information on the rainfall characteristics at the event scale.

1. Introduction

Dry regions lie on approximately 47% of the earth’s surface [1] and are concentrated at latitudes above 25°, although they exist in almost all biomes and climatic zones of the globe. In the northeast of Brazil, an extensive area of approximately 1 Mkm2, extending from latitudes −3° to −16°, represents the main tropical semi-arid ecoregion in South America and is home to over 26 million inhabitants [2].
Rainfall depth, duration, and intensity have an impact on hydrologic processes such as interception [3,4,5,6,7,8], infiltration [9], runoff [10,11,12], soil loss [13,14,15], soil moisture [16,17,18], and an impact on ecosystem services [19,20]. In view of the challenging climate change scenarios projected for semi-arid regions, the spatial and temporal variability of rainfall need to be characterized on an event basis for a better understanding of the associated hydrological processes and in order to cope with water scarcity.
Most rainfall event separation methods are defined based on runoff [21], despite its importance for other hydrological processes as well [22,23]. Still, there is no consensus on the most appropriate method to separate rainfall events from a continuous database [21,22,24]. A common criterion to separate rainfall events in hydrological studies is the minimum inter-event time (MIET) [21,22,24,25,26,27,28,29,30,31], which consists of the minimum dry period between rainfall occurrences that characterizes them as independent events [22]. Hence, two rainfall occurrences separated by a rainless period smaller than MIET is considered as a unique event [25,32,33].
MIET values presented in the literature vary from 15 min to 24 h [22,27]. The MIET has an impact on the number of rainfall events, and respective characteristics, like total rainfall, average intensity, and duration [24]. However, in arid and semi-arid regions, studies on MIET are scarce and with no consensus on the best separation method [21,22,28].
One criterion is to separate events based on fixed durations, usually according to the resolution of data acquisition. For instance, the most consistent and comprehensive rainfall database in Brazil consists of daily monitoring of rainfall, which was initiated in the semi-arid northeast region in the early 20th century. In such cases, rainfall events are usually separated based on a fixed time interval of 24 h [6,9,12,15]. This method might be inadequate, as 24-h intervals may contain fractions of an event or multiple events, which affects the analysis of the associated hydrological processes.
Given the scarcity of information and lack of agreement, the objective of this study was to determine the best MIET that separates statistically independent rainfall events in a low latitude semi-arid region, and to assess the characteristics of rainfall events (with and without single tip events (STE)). Upon separation of the rainfall events, additional information can be obtained, such as the effects of event characteristics (rainfall intensity, duration, and frequency) on hydrological and erosion processes, as well as environmental services. Furthermore, considering the predicted changes in precipitation due to climate change [22], comprehension of rainfall patterns and the characteristics of events is needed for the proposition of adaptive measures in accordance with the Sustainable Development Goals (UN, 2021-https://sdgs.un.org/goals, accessed 12 June 2021).

2. Material and Methods
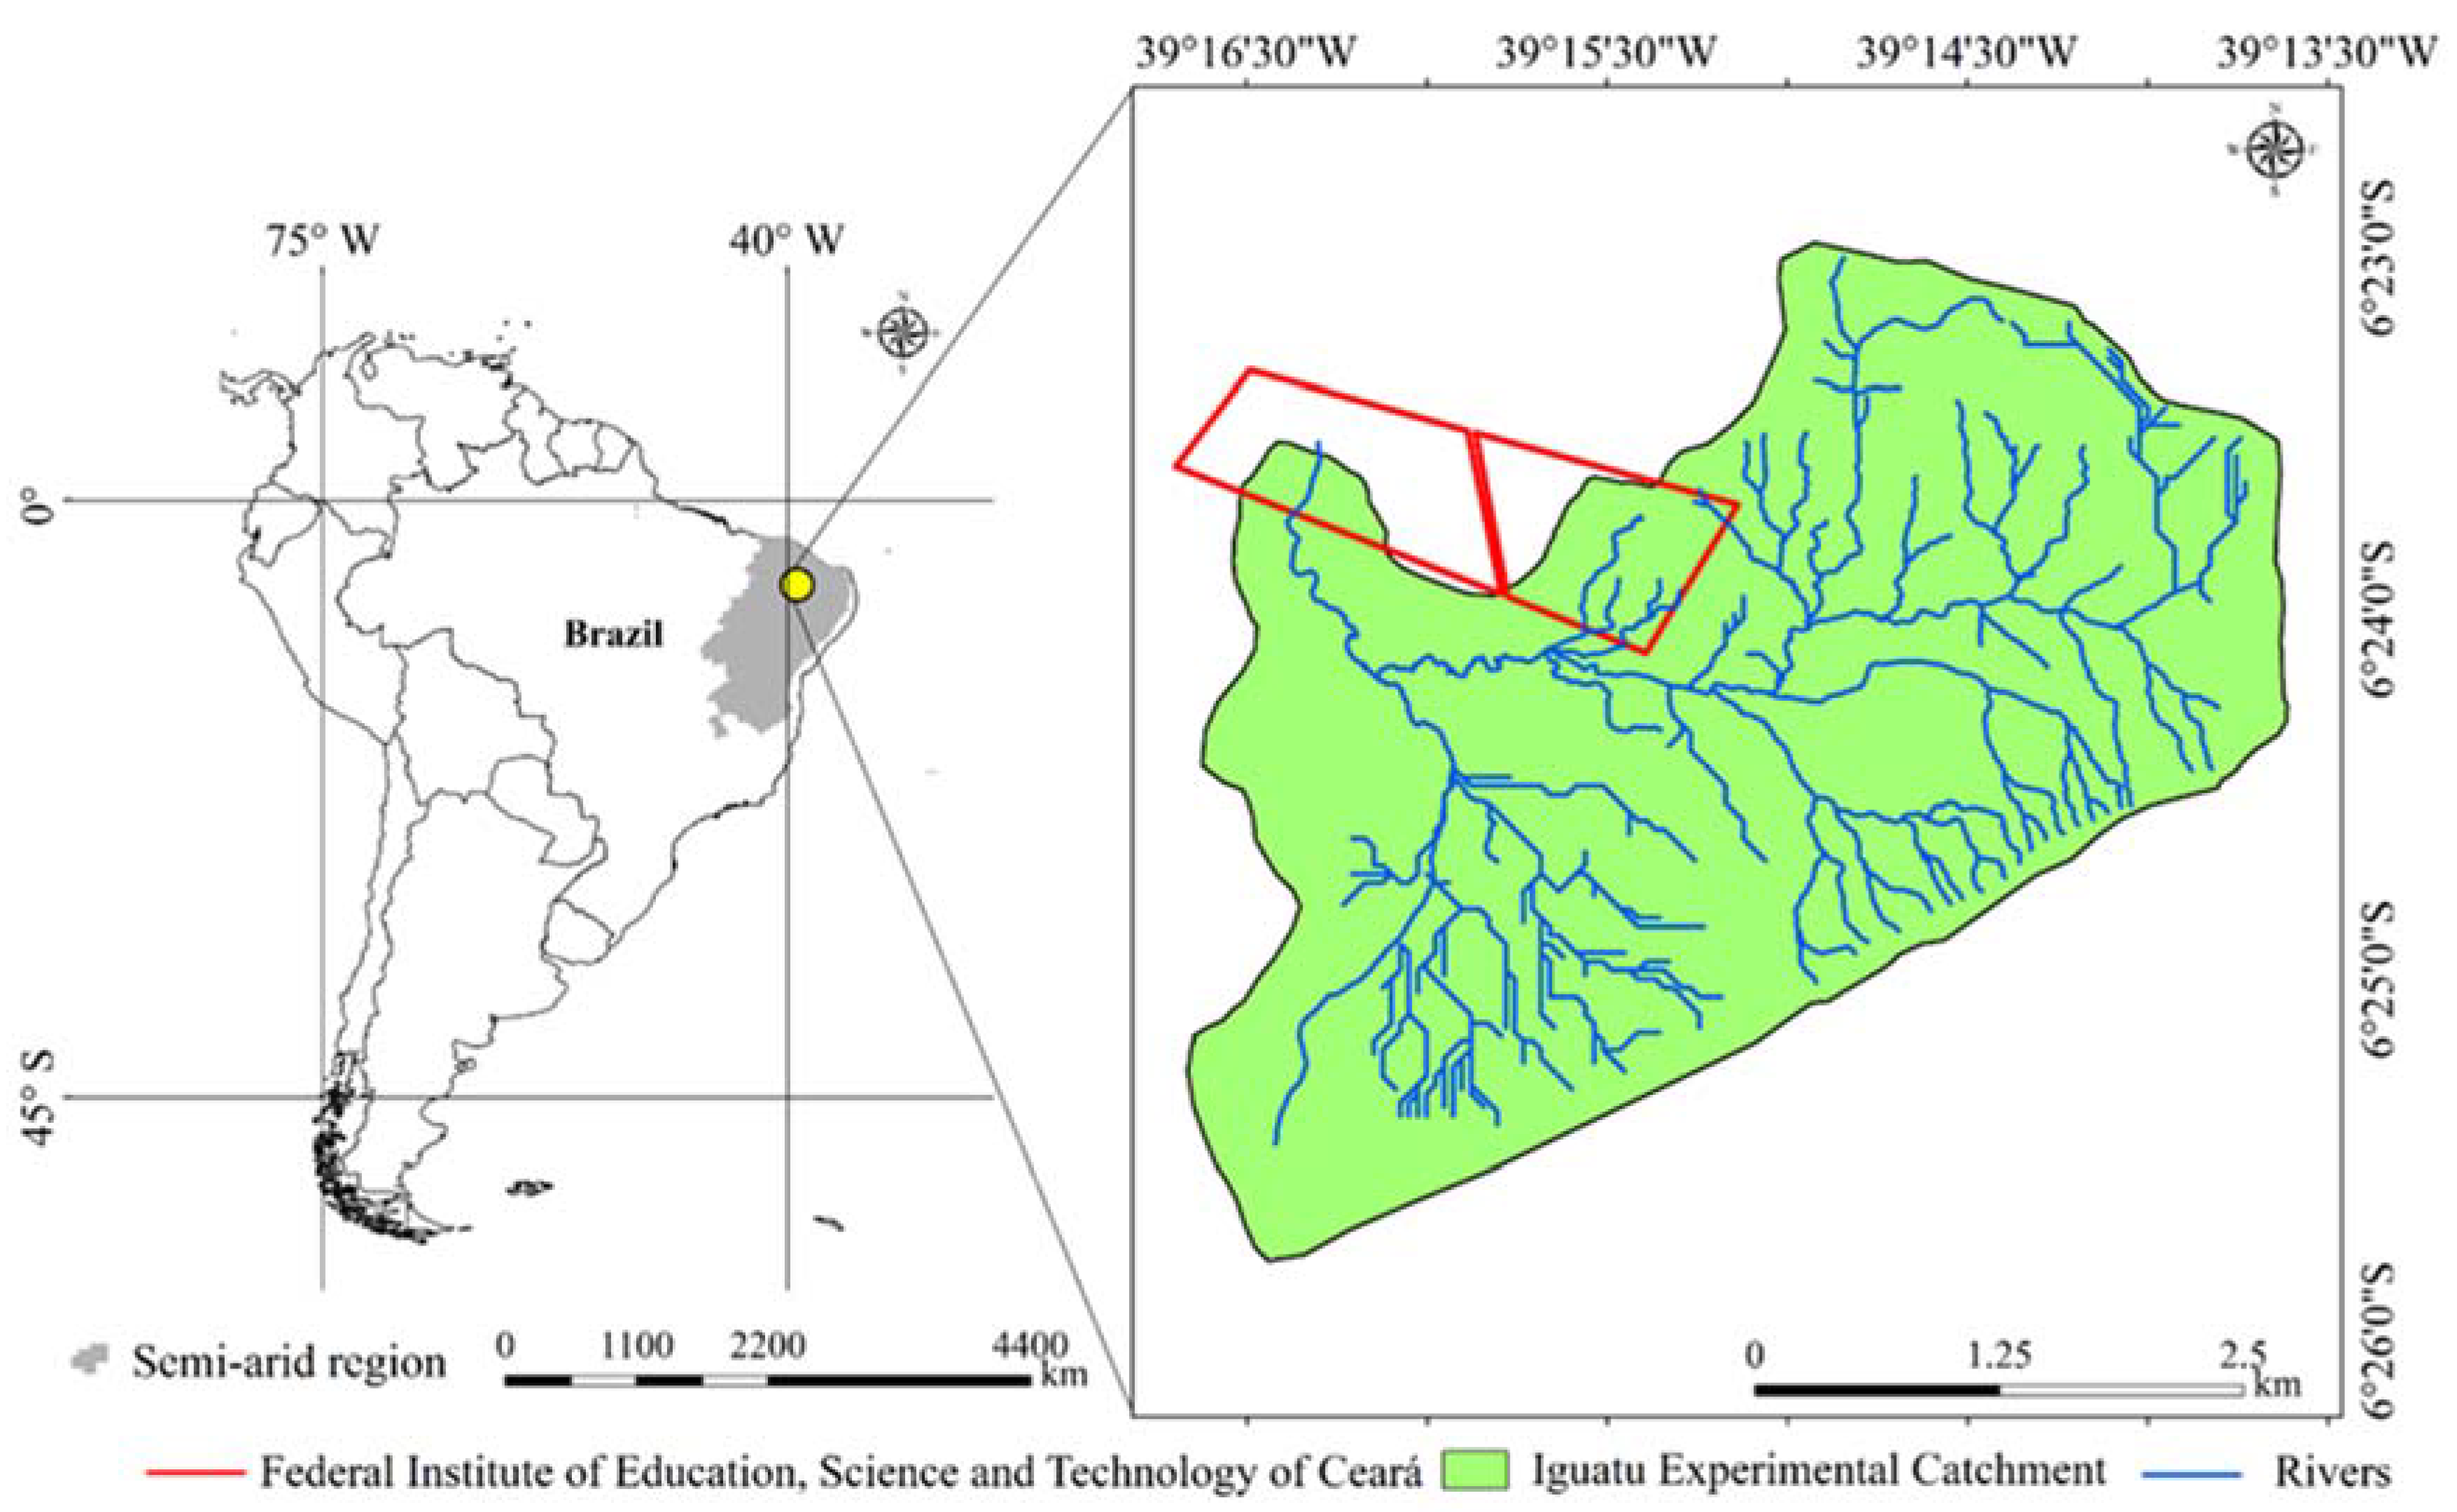
2.1. Study Area

The study was conducted in an experimental catchment of 16.74 km2 in Iguatu, state of Ceará, in northeast Brazil (Figure 1), within the coordinates 6°23′0″ to 6°26′0″ S and 39°13′30″ to 39°16′30″ W. This area belongs to the Federal Institute of Education, Science and Technology of Ceará-IFCE (Figure 1), and has been monitored in terms of water and sediment fluxes since 2009.
The climate is a BSw′h′ (semi-arid hot), with an average monthly temperature that is always above 18 °C in the coldest month, as well as well-defined rainy and dry seasons. The region presents an atmospheric water deficit during nine months of the year on average [20], and high spatial and temporal variability of rainfall [34]. The average annual rainfall of 863 mm (110 years dataset) is concentrated in the rainy season (84% of total annual rainfall). Forty three percent of the 24-h rainfall occurs in the months of March and April [6], alternating with short-duration dry spells [35,36], which are expected to intensify with the predicted climate changes [37]. The driest months are from June to December, with only 1% of the total annual rainfall [6], showing the high temporal variability of precipitation [13,35,38].
Due to its low latitudes (3° S to 16° S), the Brazilian semi-arid region has high temperatures (average monthly temperature always above 18 °C), high luminosity (2800–3000 h year−1), and high solar radiation intensity (annual average 18–20 MJ/m2·day). Such energy input promotes potential evapotranspiration in the order of 2000 mm year−1 [19,39], resulting in an aridity index (IA) as proposed by [40] of 0.48, thereby classifying the region as semi-arid in spite of the average annual precipitation of over 800 mm.
The predominant vegetation is a regenerating seasonally dry tropical forest, locally known as the Caatinga and endemic to this region. The most prevalent soil class is a typical carbonatic ebanic vertisol with high concentrations of clay and silt [41]. For more information about the characteristics and studies at the Iguatu Experimental Catchment, see the studies carried out by [6,12,14,19,42,43].

2.2. Rainfall Data

Rainfall was monitored from 2009 to 2020 with a HOBO Rain Gauge Data Logger (Measurement Systems Ltd., Newbury, UK), which is a tipping bucket rain gauge that records the time to discharge the equivalent of 0.2 mm precipitation. Although the study period is not a climatological normal (30 years), it consists of a valuable 12-year database of continuous rainfall registers, which is very scarce in the study area and other similar regions worldwide.
To define and classify rainfall events, we analyzed the following rainfall characteristics: depth (mm); duration (min); mean intensity (mm h−1); maximum intensity at intervals of 5, 30, and 60 min (I5, I30, I60 mm h−1); and inter-event time (h). Datasets with and without single tip events (STE) were considered. STE are low-volume events with only one record in the tipping bucket rain gauge (p ≤ 0.2 mm) [21,22], separated from at least the MIET from the previous and the next tip.

2.3. MIET

Hydrologists have not reached a consensus on how to define a rainfall event [21,22,24]. Therefore, we have adopted the minimum time between events (MIET) as a criterion to separate statistically independent rainfall events, being the most commonly used method in hydrological studies [21,22,24,25,26,27,28,29].
MIET is defined as the minimum period without rain before the next independent rainfall event [22]. Thus, two rain gauge tippings separated by a rainless period less than a specified MIET value are considered a single event [25,32,33]. We analyzed both datasets with and without the STE.
The rainfall events that make up the studied historical series were grouped according to the following MIETs: 15 min, 1 h, 2 h, 3 h, 6 h, 12 h, and 24 h. Rainfall events characteristics (Table 1) were determined for each event and each MIET, and their temporal distribution was analyzed.
To define the MIET that best represented the rainfall characteristics of the study area with and without STE, we adjusted five probability distribution functions (Table 2) for the rainfall events defined in each MIET [44,45,46,47,48].
The Normal, Log-Normal, Gamma, Exponential, and Weibull distributions were used in this study because they provide satisfactory adjustments in the analysis of hydrological and climatic events [44,45,46,47,48]. The adequacy of the probability distribution functions was assessed using Anderson–Darling (AD) goodness of fit tests, which are accepted as a suitable test with levels of significance ranging between 95% and 99% [45,47,49]. The results were compared with the Kolmogorov–Smirnov and Lilliefors goodness of fit tests.

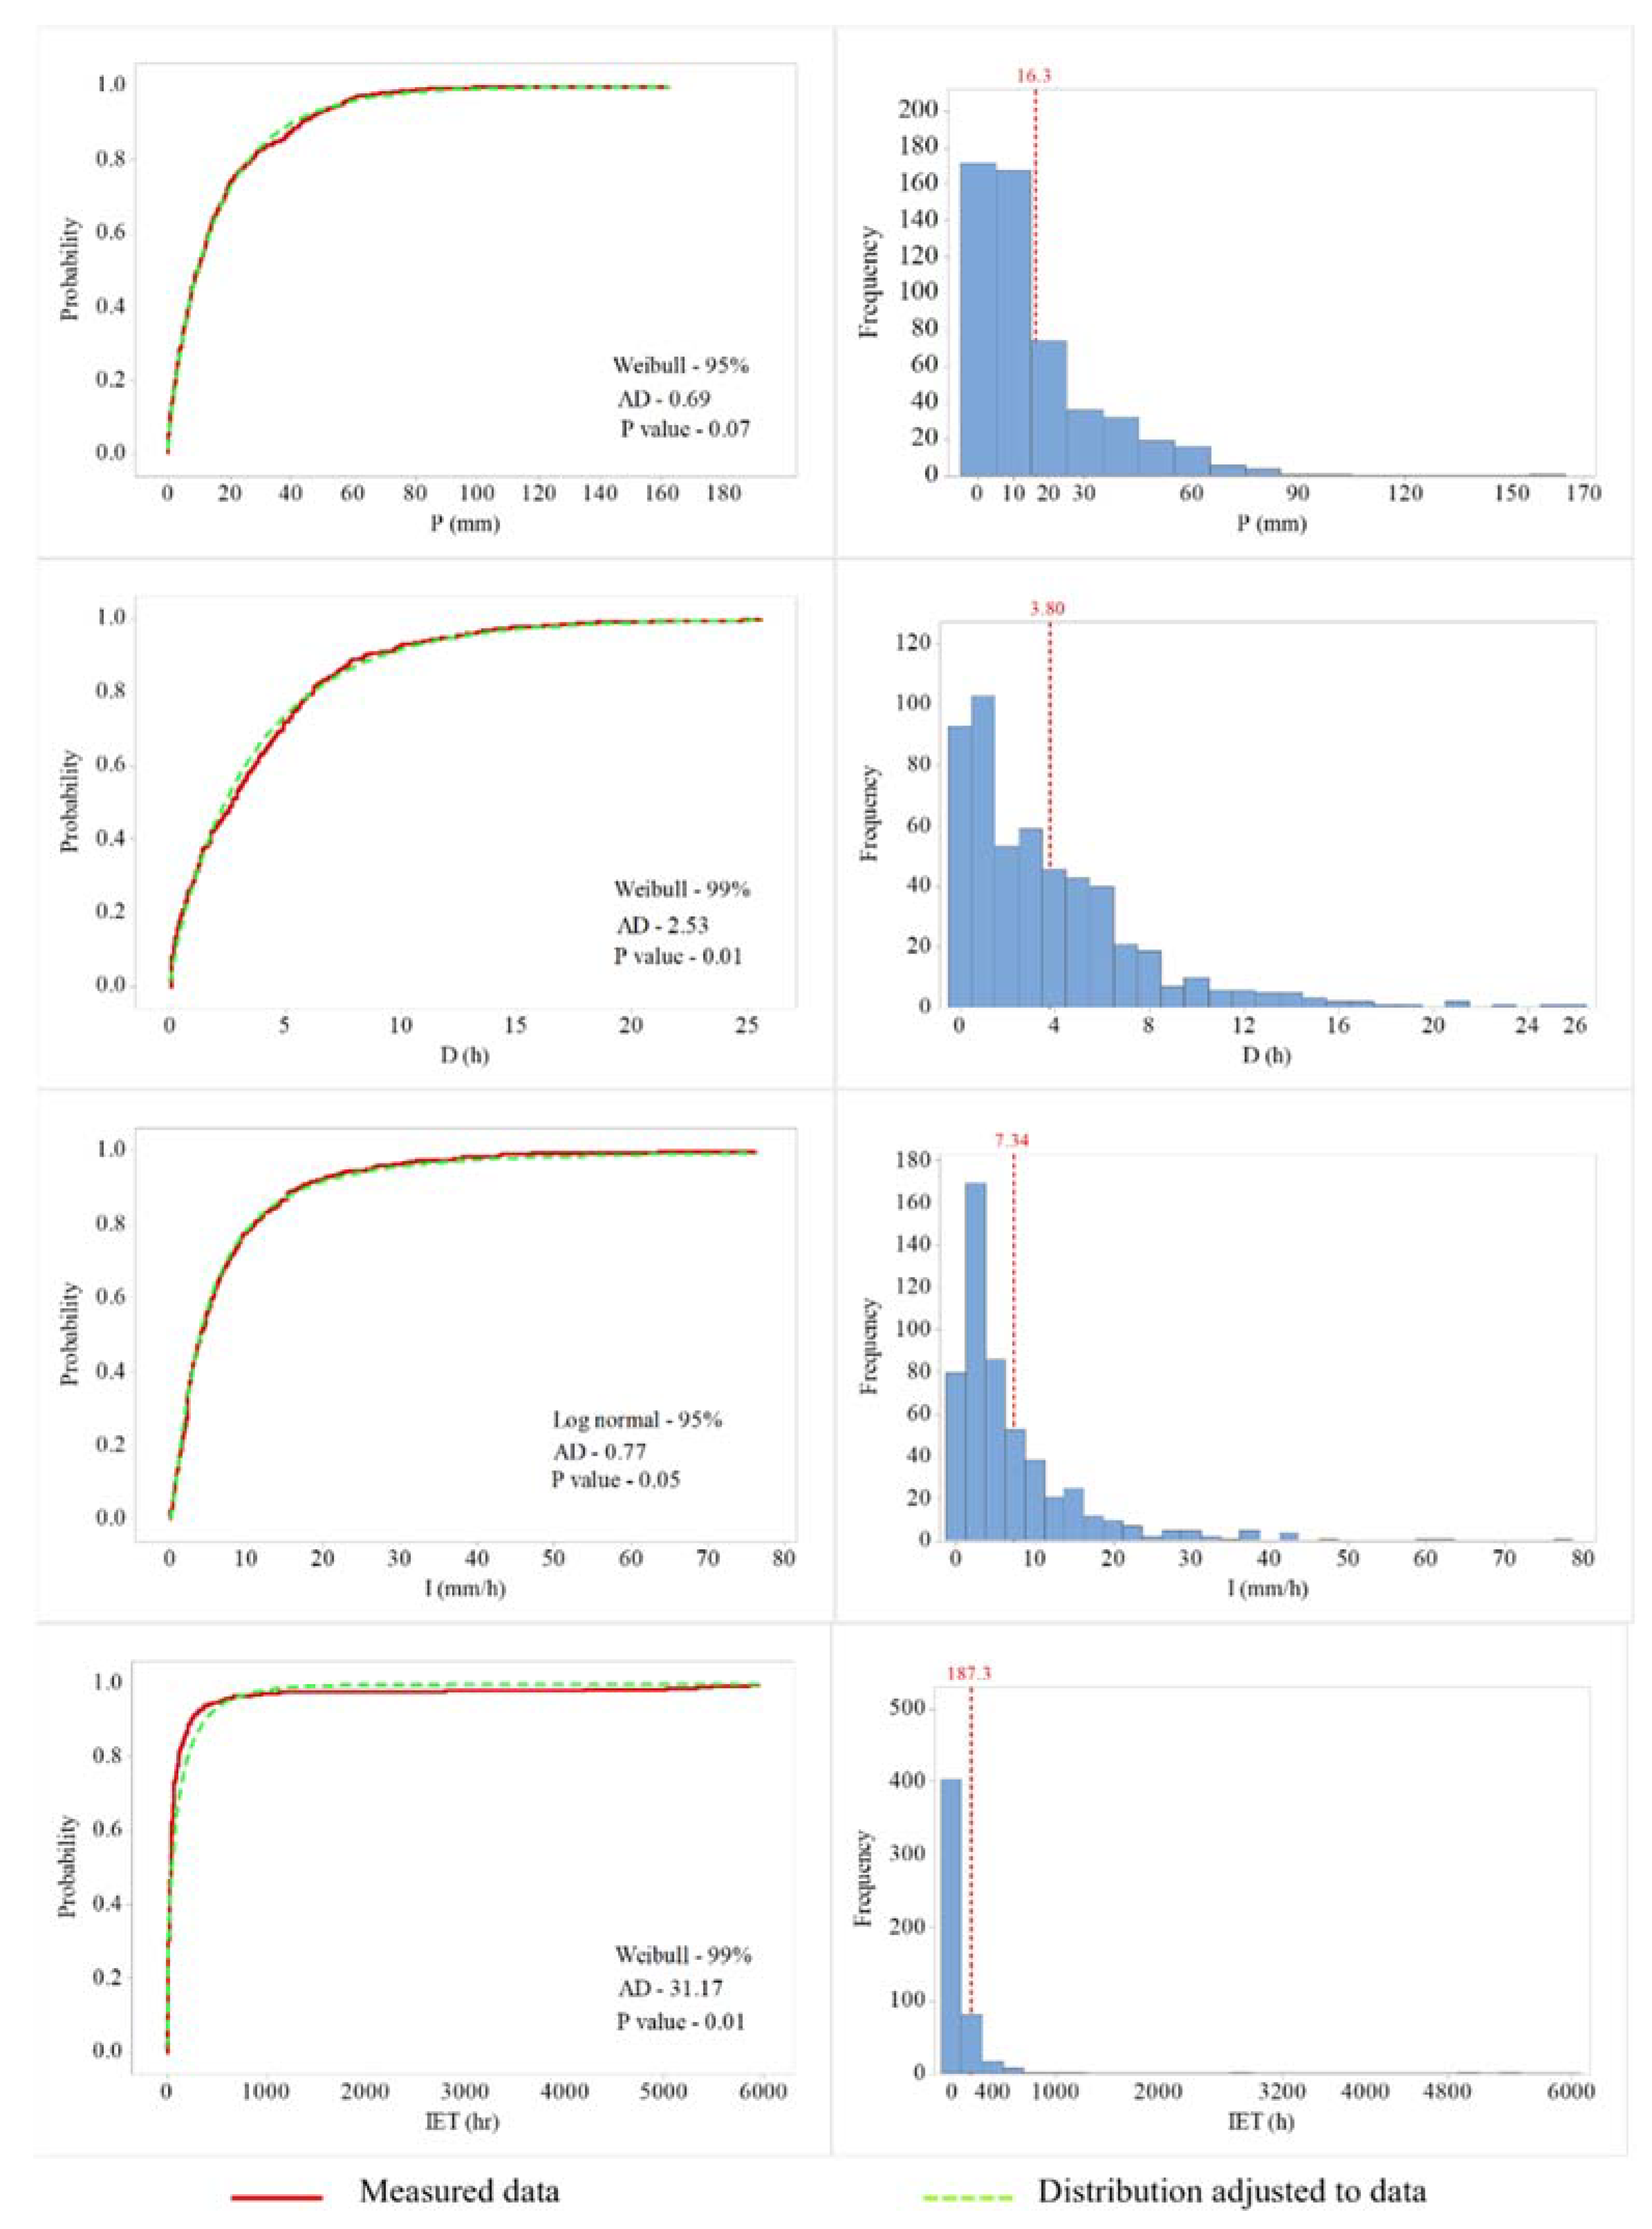
2.4. Statistical Analysis

Rainfall characteristics (Table 1) with and without STE for the different MIETs were analyzed using descriptive statistical and boxplot graphics. The non-normality of the datasets, determined by the Kolmogorov–Smirnov test, led to the adoption of the non-parametric Wilcoxon rank test to compare the medians of the events’ characteristics with and without STE with a 99% confidence level.
Once the most adequate MIET was determined, the rainfall events for this MIET were grouped using the Hierarchical Cluster Analysis technique based on the rainfall event’s depth (mm), duration (hours), and average intensity (mm h−1)—the Ward method clustering algorithm and the square Euclidean distance were used to define similar rainfall events. The events were grouped based on their similarity, which was defined by the variation of group coefficients in two consecutive groups [50].
The data were standardized by the z-score method to reduce errors due to the scale and units. The distinctive characteristics of each group were examined with the Kruskal–Wallis non-parametric test with a 95% confidence level.
All statistical analyses were performed with the Statistical Package for the Social Sciences (SPSS) version 16.0, MINITAB version 18, Matlab version R2015a, and Microsoft Excel.

3. Results and Discussion

3.1. Rainfall Events with and without Single Tip Events (STE)

The average rainfall characteristics (Table 1) varied with the minimum inter-event time (MIET) and when STE were included (Table 3 and Figure 2). The dynamics of the rainfall events indicate that careful attention should be given to studies that adopt data analysis based on the scale of events [21,22,24,28,42], considering that these characteristics influence the assessment of interception [3,4,5,6,7,8], water infiltration in the soil [9], runoff [10,11,12], soil loss [13,14,15], kinetic energy [43], soil moisture content [16,17,18], and ecosystem services [19,20].
The database shows that the impact of STE on rainfall characterization depends on the MIET defined for the analysis (Figure 3). Adopting a MIET of 15 min, the frequency of occurrence of STE is corresponds to 41% of a total of 199 mm (2.3% of the total precipitation), and decreases to two STE events out of 307 total events for a MIET of 24 h (0.03% of the total precipitation) (Figure 3).
The increase of MIET for event separation implies a decrease in the number of STE and, consequently, the precipitation associated with single-tip events [21]. The Wilcoxon non-parametric test indicated a significant difference in the variables for a MIET equal to or less than 3 h (Table 4), as the medians of the events with or without STE do not correspond to the same distribution with a 99% confidence level. The total rainfall expected by STE, assuming a MIET of 6 h (when there is no more statistical difference), is 10.7 mm for the entire study period (2009 to 2020). Therefore, these results suggest that the best MIET to characterize statistically independent rainfall events in the region must be equal to or greater than 6 h, since the STE no longer interferes with the choice of MIET (Table 4)—with a level of confidence of 99%.
A power curve best fits the relationship between the number of events and MIET with and without STEs (Figure 4). Both expressed high correlations, with an R² of 0.98 and 0.97 for events with STE without STE, respectively. For lower values of MIET, more rainfall is separated into STE, which is contrary to higher values of MIET that will include these STE in longer events [21,22,26,27].
Results show a smaller difference in the total number of rainfall events for MIET values above 6 h (Figure 4) in both tested conditions, which represent approximately 96% of the total rainfall events (Figure 3)—characterizing the occurrence of a higher number of smaller events. The derivative of the number of events by MIET decreases significantly with the increase in MIET (Figure 4), with a hundredfold decrease in value between 6 and 9 h. For MIETs greater than 6 h, the two curves of the number of events with and without STE are similar (Figure 4) and the derivative is in a slowing decreasing pattern.
Studies carried out in arid and semi-arid environments did not use the STE to evaluate the average rainfall characteristics, as they considered this data uncertain [21,22,51]. However, STE can be crucial for studies in tropical dry forests focusing, for instance, on canopy interception [3,7], soil moisture dynamics [17], soil cracking, and runoff generation—particularly in vertisols [11]—as well as water fluxes in the soil–atmosphere interface [52] and ecological processes such as root shrinkage and expansion [53]. Therefore, it is important that STE be investigated in studies of rainfall characterization to better define MIET in semi-arid regions with high temporal [13,38] and spatial variability [24,34,35].

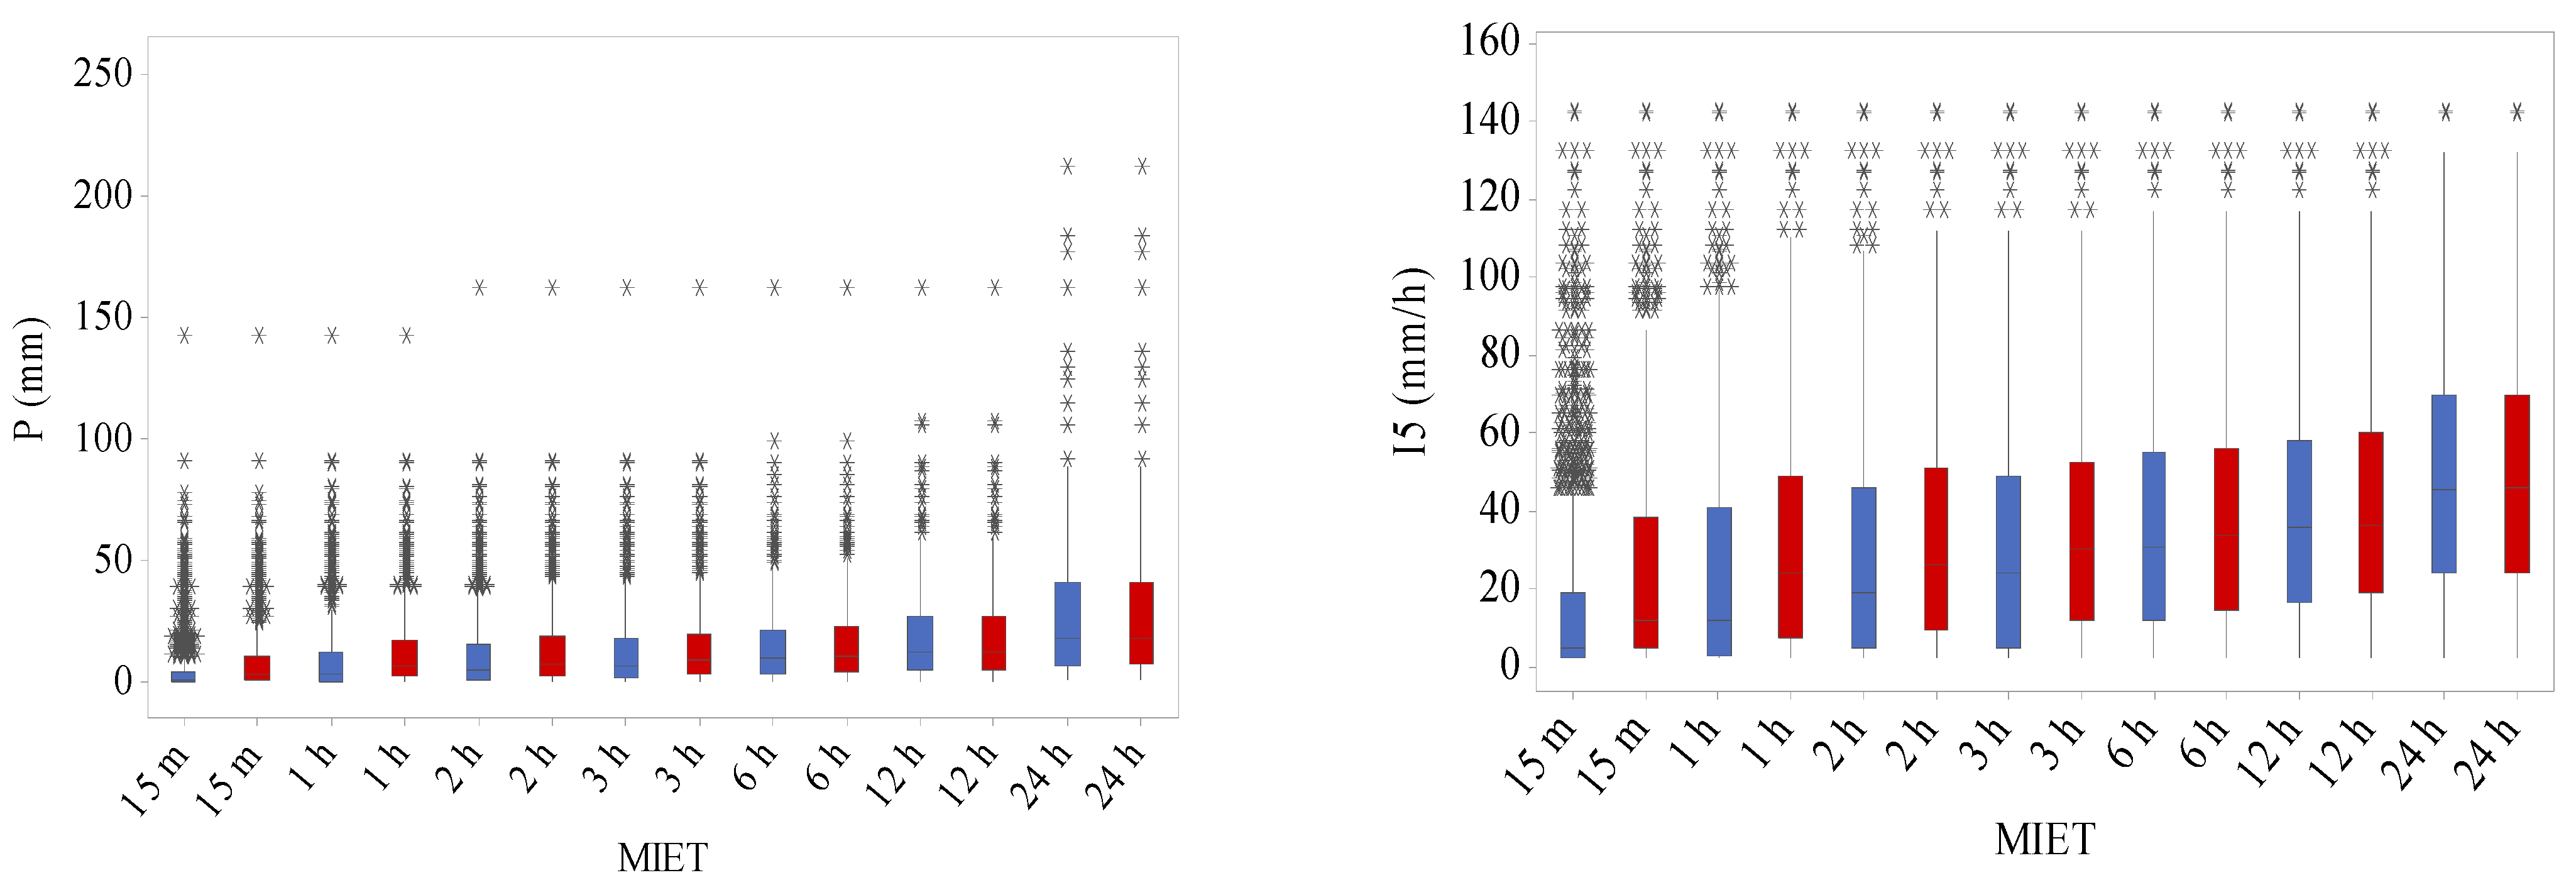
3.2. Characteristics of Rainfall Events

Descriptive statistics of events with and without STEs are presented in Table 3 and the variability of the average rainfall event characteristics as a function of MIET is in Figure 2. For all rainfall events, the average total rainfall ranged from 5.1 to 28.2 mm for 15-min and 24-h MIETs, respectively (Table 3)—which is a fivefold difference. The average duration of rainfall events ranged from 0.5 h (MIET = 15 min) to 16.4 h (MIET = 24 h), i.e., an increase of over 32 times (Table 3). The highest coefficients of variation were recorded at the 15-min MIET.
Rainfall duration tends to increase as the MIET value increases, with the highest values at MIET above 6 h (Figure 2). The greatest range for rainfall duration occurs for a larger rainfall separation time of approximately one day [26]. However, the average rainfall intensity is reduced by 24.3% at a MIET of 24 h (Table 3; Figure 2). The average values of intensity and CV remain almost constant, regardless of the MIET value, as also shown by [26].
In general, rainfall events have a longer duration, higher total precipitation and lower average intensity for higher MIETs (Table 3; Figure 2) due to the larger number of continuous records incorporated into the events [32]. For higher MIETs, the average intensity of the rainfall events shows greater intra-event variability (Table 3) because increasingly larger time intervals are included in the events [22].
For the maximum rainfall intensities at different time intervals (I5 to I60), the maximum intensity at 5 min (I5 max) was the most variable (higher values of CV, asymmetry, and kurtosis), as also shown by [21], and with greater amplitudes, as observed in the study by [7]. As the time interval increases, the maximum intensities decrease, with lower variability for different MIETs, indicating an attenuation of the rainfall intensity at larger intervals and less variation in the CV (Table 3; Figure 2).
In all the analyzed variables (Table 3), the highest and most positive values of the kurtosis and skewness coefficient recorded in the lowest MIETs indicate a higher concentration of intermediate values. These characteristics define a higher coefficient of variation of the data and a non-normal distribution, since the values are not close to zero, indicating that the data are not distributed equally around the mean [47].
For longer MIETs, for example 24 h, the characteristics of rainfall events present greater intra-event variability [22] and, with this, an ecohydrological processes analysis may differ. For example, in studies of soil erosion that use average rainfall intensity to represent the ability of rain to cause erosion through empirical relationships [12,13,14,15,43,54] and obtain the erosivity index, careful attention is essential, and it should be taken into account that the results generated for each MIET are different.

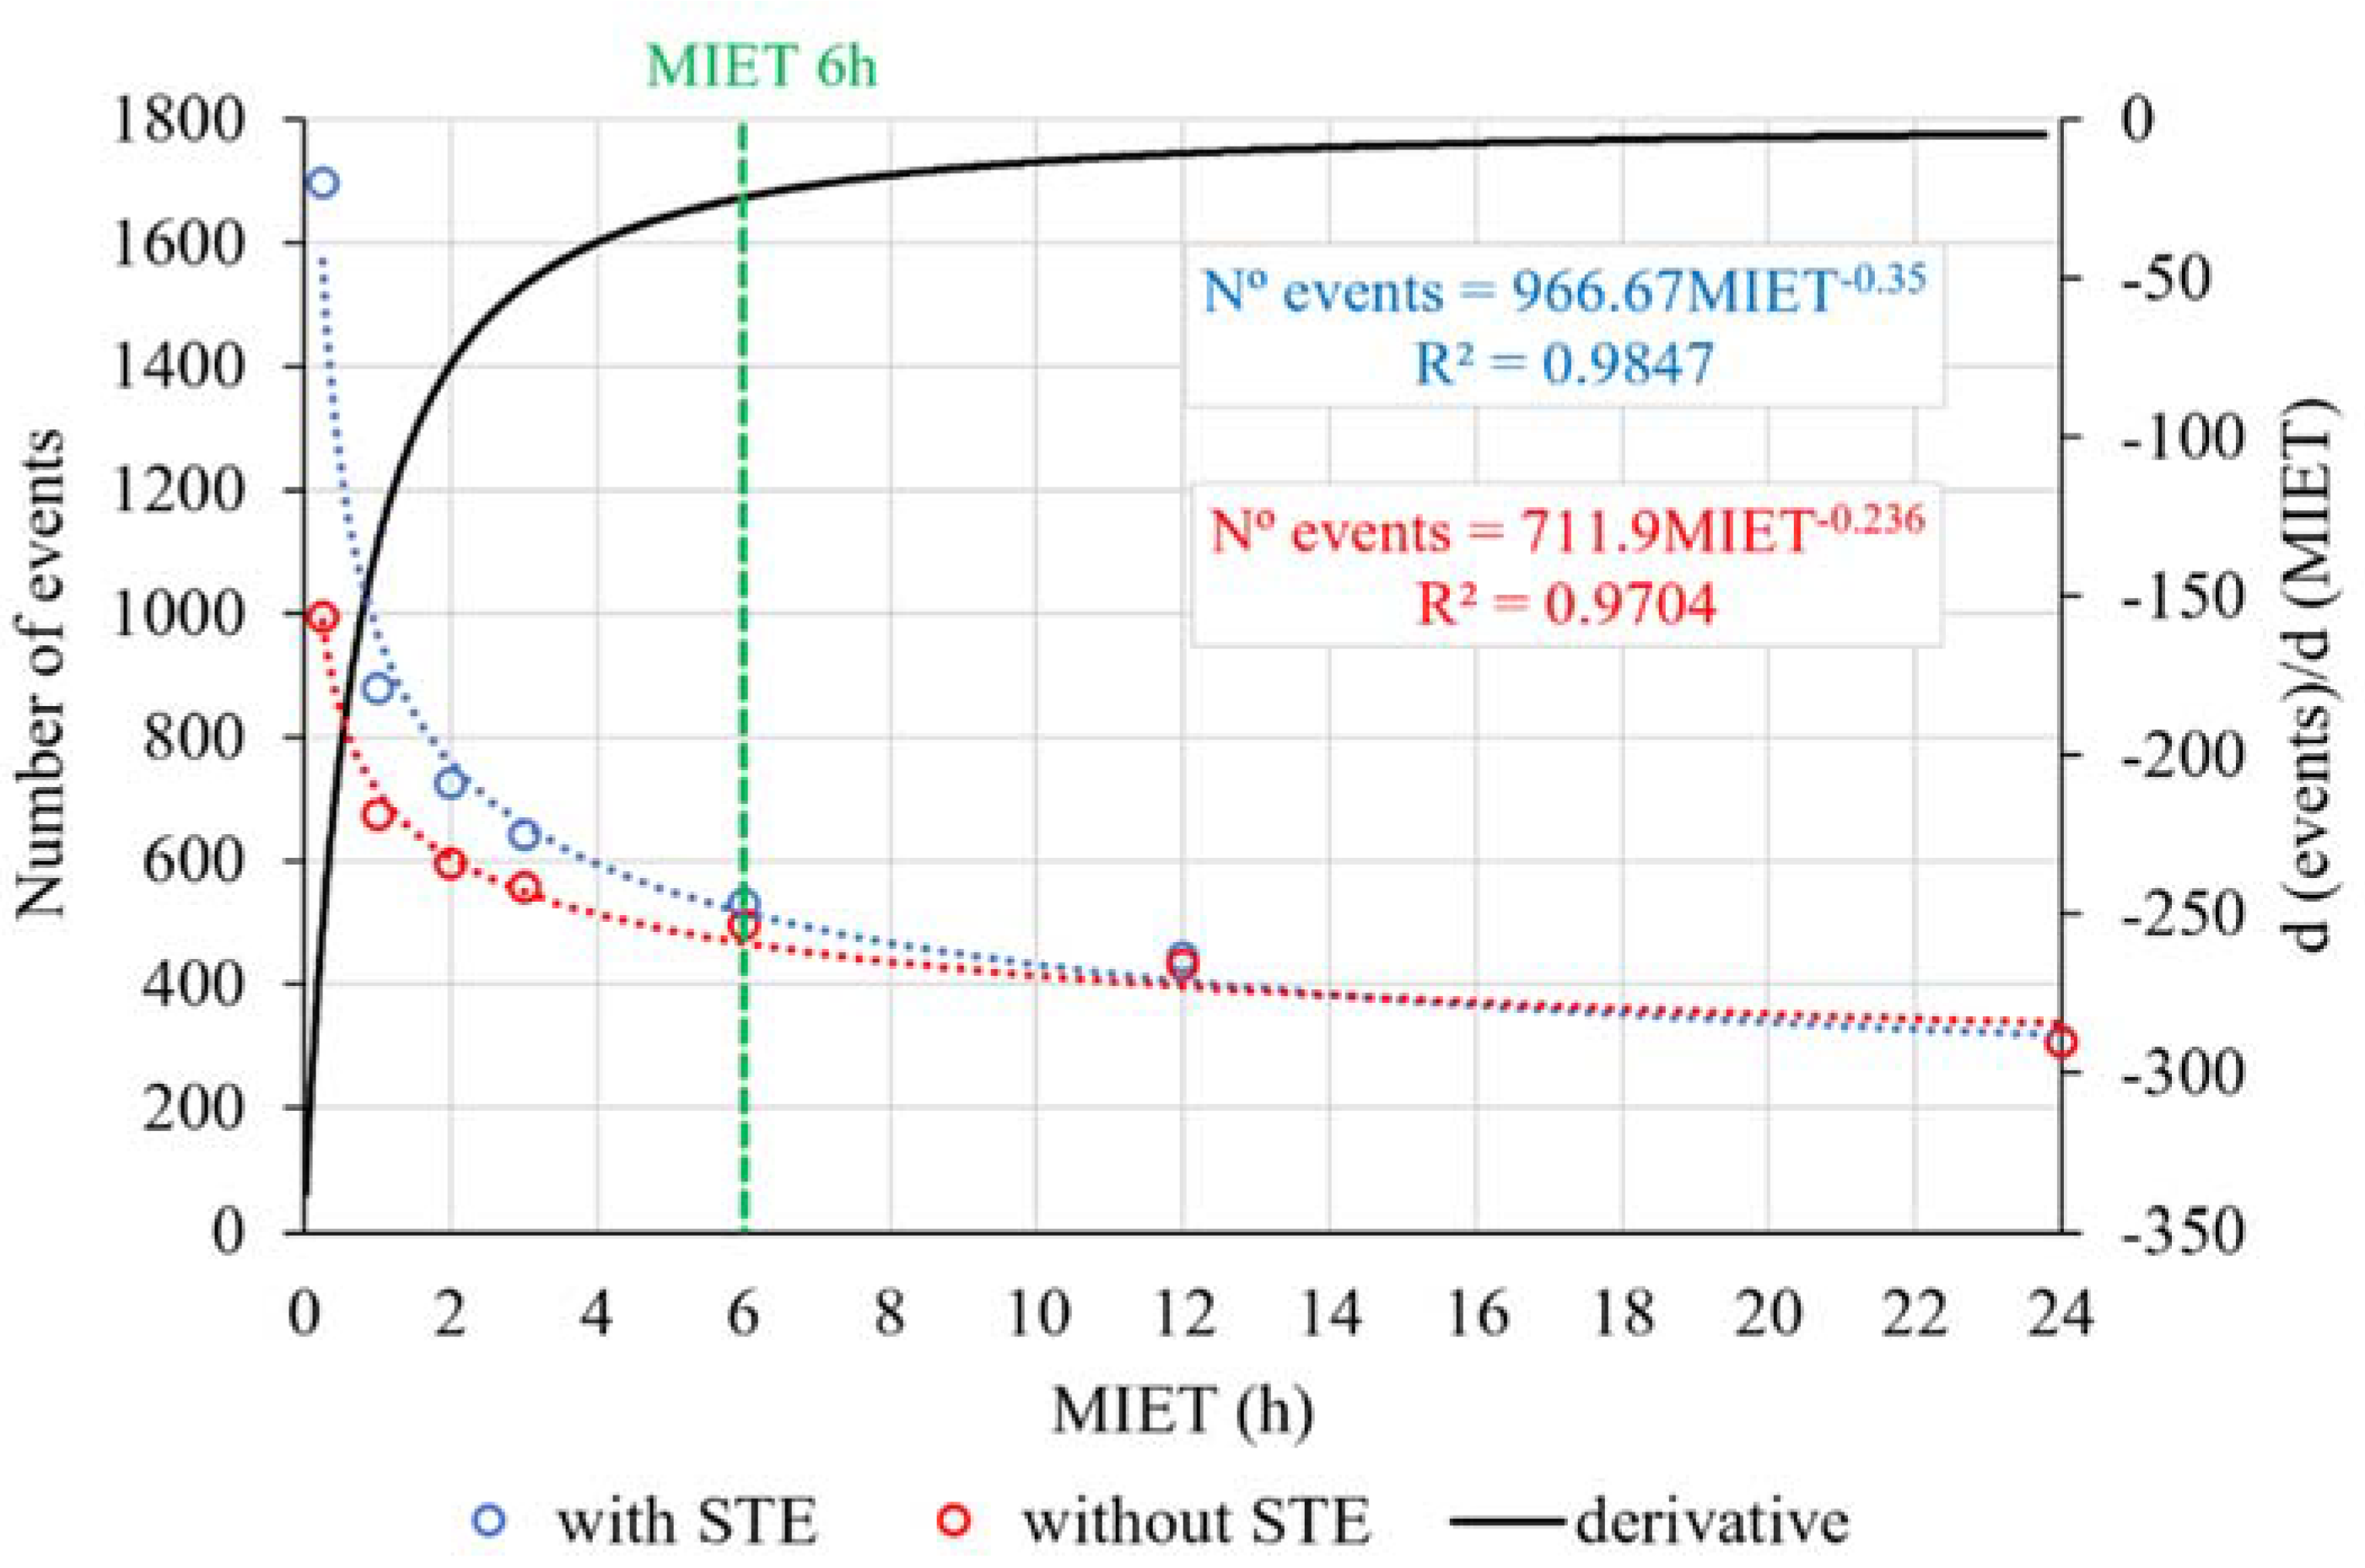
3.3. Minimum Inter-Event Time (MIET)

The probability distribution functions were adjusted for the event variables: total rainfall, duration, average intensity and inter-event time (IET) at each MIET (Appendix A Table A1). Lower MIETs are farther from the 95% confidence interval of the variable’s frequency distribution (Appendix A Table A1) because STE occurs more frequently up to a MIET of 3 h (Figure 3; Table 4) [21]. As the MIET increases from 6 to 24 h, STE events decrease, presenting a lower coefficient of variation (Table 3). Both series show a similar distribution pattern (Figure 4) with statistically equal median values (Table 4), which were detected by the Wilcoxon non-parametric test with a 99% confidence level.
Among the tested distributions (Normal, Log-Normal, Gamma, Exponential, and Weibull), the Weibull distribution was the one that best fit the data on total rainfall, duration, and IET, and the Log-Normal distribution on the average rainfall intensity (Figure 5), as also showed in recent studies [45,46,47,48].
According to the Anderson–Darling (AD) goodness of fit test, the 6 h MIET (Appendix A Table A1; Figure 5) was the one with the best fit (AD = 0.69 and p = 0.07) for rainfall depth, implying that a MIET of 6 h is the most suitable to characterize the distribution of rainfall in the study region. For the other variables analyzed and for a 6-h MIET, the curves were well adjusted by the AD test, with significance levels ranging between 95% and 99% (Appendix A Table A1; Figure 5).
Research in different parts of the globe highlight that a 6-h MIET is widely adopted in hydrological studies [22,29,54,55,56]. As in this study, changing the MIET value substantially alters the number and properties of rainfall events in an arid region of Australia [22]. However, there is still not a consensus on the best MIET to characterize rainfall events in arid and semi-arid environments, and hydrological criteria have been used. In the semi-arid region of Spain, studies show that the optimum MIET is 1 h, as it is the minimum period necessary for water in larger macropores to drain and sufficiently modify the effect of soil moisture on the runoff generation process [21]. For the semi-arid region of northeast Brazil, studies indicate that the 30-min MIET is the most representative and characterizes the main properties of rain by type of hietogram [28].
Inter-event dry periods (IET) increase with MIET. For the 6-h MIET, the average IET was 187.3 h (fiftyfold of the average event duration). In all cases, the largest gap between events was a 248-day rainless interval (Figure 5); this long period of continuous dry days is expected for this location, with more than 80% of the rains concentrated in the rainy season (January-April) [36], showing the high temporal variability of precipitation [6,35,38].

3.4. Rainfall Characterization for a 6-h Minimum Inter-Event Time (MIET)

After identifying the 6-h MIET as the most adequate to characterize the distribution of rainfall in the region, the events were clustered based on total rainfall (mm), duration (hours), and average intensity (mm h−1), resulting in three statistically different classes (Table 5; Figure 6). The class represented by group I, Class I was composed of events with lower rainfall depth, intermediate durations, and lower than average rainfall intensity (Table 5, Figure 6). This class is composed of a high frequency of small events (88.7% of the events registered a rainfall below 20 mm) with low average intensity (Table 5) and represents 77.4% of the total events and 42.4% of the total rainfall. The high occurrence of small events and high temporal variability is a common feature of rainfall events in this tropical semi-arid region [6,12].
Class II is represented by 14 short duration events (median 0.3 h) (Table 5) and high rainfall intensities (average 45.9 mm h−1) (Table 5). These results are attributed to the convective rains, with high intensity and short durations [12,43] that are common in semi-arid regions. For the tropical semi-arid study region, short-duration rainfall events with high intensities play an important role in hydrological processes [12,13,42], particularly on the generation of Hortonian-type runoff [9] and on the onset of the rainy season where vertisols prevail [11].
Class III has the events with the highest rainfall depths, with a maximum of 161.9 mm, average of 45.1 mm, and median of 43.2 mm (Table 5, Figure 6). Longer rainfall events (approximately 1 day) with an average of 8.1 h (Table 5, Figure 6) were also observed for this class. The higher magnitude rainfall events during the rainy season are due to the atmospheric systems in the region, where the rainfall distribution is mainly related to the displacement of the Intertropical Convergence Zone (ITCZ) to the south during the months of February to May [35] and the frontal rainfall systems [57]. For the study area, high magnitude rainfall events are hydrologically important so that the vegetation canopy exceeds its interception capacity and saturates, generating a redistribution of rainfall to the soil, favoring infiltration, increasing soil moisture, and contributing to other ecohydrological processes [6,7,19]. We highlight the importance of this study, as previous works in the region classified rainfall events differently [6,12] and were supported by daily records of rainfall (total rainfall within 24 h intervals) for their characterization. The present work verified significant differences in events characteristics based on MIET values, and, therefore, the importance of defining adequately the MIET for event separation for the hydrologic processes assessment based on rainfall events.

4. Conclusions

Twelve consecutive years of 5-min interval rainfall data was gathered and grouped in different minimum inter-event time (MIETs) in the Iguatu Experimental Catchment, in the tropical semi-arid region of northeast Brazil. Including or excluding single tip events (STE) in choosing the most adequate MIET affected the number of rainfall events and respective characteristics—the number of single tip events decreased up to a MIET of 3 h, but showed no difference above a MIET of 6 h. None of the investigated variables show a significant difference by including or not including STEs for MIETs of 6 h and above. The 6 h MIET is the most appropriate to characterize the rainfall distribution, and the Weibull distribution is the best fit for total event rainfall, duration, and inter-event time in this tropical semi-arid region of Brazil.
Our study brings insights on the definition of rainfall events based on the minimum inter-event time (MIET) criterion, particularly for semi-arid environments where continuous long-term rainfall records are usually scarce. By providing information on the characteristics of rainfall on a statistically independent scale of events for MIET of 6 h, this study contributes to the comprehension of ecohydrological processes and provides the means to improve hydrological and sedimentological simulations that have rainfall intensities as a major driver.

Author Contributions

M.S.G., E.M.d.A. and H.A.d.Q.P. coordinated the project and conceived the idea presented therein. J.B.B. carried out the measurements, processed the experimental data, performed the analyses, designed the figures and drafted the manuscript. M.S.G., E.M.d.A., H.A.d.Q.P., P.H.A.M. and J.C.R.F. helped in interpreting the results and in preparing and revising the manuscript. All authors have read and agreed to the published version of the manuscript.

Funding

This research was funded by CNPq-Conselho Nacional de Desenvolvimento Científico e Tecnológico, Brazil, grant number 558135/2009-9.

Institutional Review Board Statement

Not applicable.

Informed Consent Statement

Not applicable.

Data Availability Statement

The data that support the findings of this study are available upon request from the corresponding author.

Acknowledgments

The authors would like to thank the Brazilian National Council for Scientific and Technological Development (CNPq), the Coordination for the Improvement of Higher Education Personnel-Brazil (CAPES), and the Ceará State Foundation of Support for Scientific and Technological Development (FUNCAP) for their financial support of this research.

Conflicts of Interest

The authors declare that they have no conflict of interest.

Appendix A

Table A1. Probability distribution functions adjusted to the rainfall data for different the minimum inter-event time (15 min to 24 h) according to the Anderson-Darling statistic.
AD–PAD-I
Fn15 m1 h2 h3 h6 h12 h24 hFn15 m1 h2 h3 h6 h12 h24 h
N285.3095.6066.9051.5034.4026.6017.90N192.5081.2068.7052.3045.6039.4037.00
LN63.7015.3012.7010.406.902.601.50LN64.008.904.501.800.800.700.50
G111.9015.506.503.100.801.201.20G97.1022.0015.107.304.503.406.40
EX600.80149.4076.6040.907.801.701.20EX86.6020.2014.006.904.906.2018.40
WE77.0011.505.703.000.691.001.00WE88.6020.3013.806.503.602.203.80
p-valuep-value
Fn15 m1 h2 h3 h6 h12 h24 hFn15 m1 h2 h3 h6 h12 h24 h
N0.000.000.000.000.000.000.00N0.000.000.000.000.000.000.00
LN0.000.000.000.000.000.000.00LN0.000.000.000.000.050.000.00
G0.000.000.000.000.000.000.00G0.000.000.000.000.000.000.00
EX0.000.000.000.000.000.000.10EX0.000.000.000.000.000.000.00
WE0.000.000.000.000.070.000.00WE0.000.000.000.000.000.000.00
AD–DAD-IET
Fn15 m1 h2 h3 h6 h12 h24 hFn15 m1 h2 h3 h6 h12 h24 h
N236.5069.3044.6029.6023.9036.1023.10N535.80256.00207.40183.10148.40121.9081.20
LN122.8027.2019.7017.7011.803.603.10LN47.508.505.305.808.3011.109.40
G138.9020.309.806.102.101.301.90G208.7078.3064.6060.5055.0049.8035.90
EX187.6058.6033.7018.205.608.2022.20EX1965.70504.00324.30248.10165.80118.1060.10
WE118.5018.5010.207.202.500.601.60WE88.6029.8027.1028.7031.2031.7026.00
p-valuep-value
Fn15 m1 h2 h3 h6 h12 h24 hFn15 m1 h2 h3 h6 h12 h24 h
N0.000.000.000.000.000.000.00N0.000.000.000.000.000.000.00
LN0.000.000.000.000.000.000.00LN0.000.000.000.000.000.000.00
G0.000.000.000.000.000.000.00G0.000.000.000.000.000.000.00
EX0.000.000.000.000.000.000.00EX0.000.000.000.000.000.000.00
WE0.000.000.000.000.010.000.00WE0.000.000.000.000.010.000.00
P-rainfall depth (mm); D-rainfall duration (h); I-rainfall intensity (mm h−1); IET-inter-event time (h); Anderson-Darling statistic. Fn-function: N–Normal; LN–Log-normal; G–Gamma; Ex–Exponential; WE–Weibull.

References

  1. Koutroulis, A.G. Dryland changes under different levels of global warming. Sci. Total Environ. 2019, 655, 482–511. [Google Scholar] [CrossRef] [PubMed]
  2. Sudene. Superintendência do Desenvolvimento do Nordeste. Resolução 115, de 23 de Novembro de 2017. Available online: http://antigo.sudene.gov.br/delimitacao-do-semiarido (accessed on 14 April 2021).
  3. Medeiros, P.H.A.; de Araujo, J.C.; Bronstert, A. Interception measurements and assessment of Gash model performance for a tropical semi-arid region. Rev. Ciênc. Agron. 2009, 40, 165–174. [Google Scholar]
  4. Zhang, Y.F.; Wang, X.P.; Hu, R.; Pan, Y.X.; Paradeloc, M. Rainfall partitioning into throughfall, stemflow and interception loss by two xerophytic shrubs within a rain-fed re-vegetated desert ecosystem, northwestern China. J. Hydrol. 2015, 527, 1084–1095. [Google Scholar] [CrossRef]
  5. Zhang, Z.S.; Zhao, Y.; Li, X.R.; Huang, L.; Tan, H.J. Gross rainfall amount and maximum rainfall intensity in 60-minute influence on interception loss of shrubs: A 10-year observation in the Tengger Desert. Sci. Rep. 2016, 6, 26030. [Google Scholar] [CrossRef] [Green Version]
  6. Brasil, J.B.; Andrade, E.M.; Palácio, H.A.Q.; Medeiros, P.H.A.; dos Santos, J.C.N. Characteristics of precipitation and the process of interception in a seasonally dry tropical forest. J. Hydrol. Reg. Stud. 2018, 19, 307–317. [Google Scholar] [CrossRef]
  7. Brasil, J.B.; Andrade, E.M.; Palácio, H.A.Q.; Santos, J.C.N.D.; Medeiros, P.H.A. Temporal variability of throughfall as a function of the canopy development stage: From seasonal to intra-event scale. Hydrol. Sci. J. 2020, 65, 1640–1651. [Google Scholar] [CrossRef]
  8. Návar, J. Modeling rainfall interception loss components of forests. J. Hydrol. 2020, 584, 124449. [Google Scholar] [CrossRef]
  9. Figueiredo, J.V.; de Araújo, J.C.; Medeiros, P.H.A.; Costa, A.C. Runoff initiation in a preserved semiarid Caatinga small watershed, Northeastern Brazil. Hydrol. Processes 2016, 30, 2390–2400. [Google Scholar] [CrossRef]
  10. Pathak, P.; Sudi, R.; Wani, S.P.; Sahrawat, K.L. Hydrological behavior of Alfisols and Vertisols in the semi-arid zone: Implications for soil and water management. Agric. Water Manag. 2013, 118, 12–21. [Google Scholar] [CrossRef] [Green Version]
  11. Santos, J.C.N.; Andrade, E.M.; Guerreiro, M.J.S.; Medeiros, P.H.A.; Palácio, H.A.Q.; Araújo Neto, J.R. Effect of dry spells and soil cracking on runoff generation in a semiarid micro watershed under land use change. J. Hydrol. 2016, 541, 1057–1066. [Google Scholar] [CrossRef]
  12. Santos, J.C.N.; Andrade, E.M.; Medeiros, P.H.A.; Guerreiro, M.J.S.; Palácio, H.A.Q. Effect of rainfall characteristics on runoff and water erosion for different land uses in a tropical semiarid region. Water Resour. Manag. 2017, 31, 173–185. [Google Scholar] [CrossRef]
  13. Medeiros, P.H.A.; de Araújo, J.C. Temporal variability of rainfall in a semiarid environment in Brazil and its effect on sediment transport processes. J. Soils Sediments 2014, 14, 1216–1223. [Google Scholar] [CrossRef]
  14. Ribeiro Filho, J.C.; Palácio, H.A.Q.; Andrade, E.M.; Santos, J.C.N.; Brasil, J.B. Rainfall characterization and sedimentological responses of watersheds with different land uses to precipitation in the semiarid region of Brazil. Rev. Caatinga 2017, 30, 468–478. [Google Scholar] [CrossRef] [Green Version]
  15. Santos, J.C.N.D.; Andrade, E.M.; Palácio, H.A.D.Q.; Araújo Neto, J.R.D.; Ribeiro Filho, J.C. Erosive process control in the brazilian semiarid region. Rev. Caatinga 2018, 31, 695–703. [Google Scholar] [CrossRef] [Green Version]
  16. Costa, C.A.G.; Lopes, J.W.B.; Pinheiro, E.A.R.; Araújo, J.C.D.; Gomes Filho, R.R. Spatial behaviour of soil moisture in the root zone of the Caatinga biome. Rev. Ciênc. Agron. 2013, 44, 685–694. [Google Scholar] [CrossRef] [Green Version]
  17. Costa, C.A.G.; Araújo, J.C.D.; Lopes, J.W.B.; Pinheiro, E.A.R. Permanence of water effectiveness in the root zone of the Caatinga biome. Rev. Caatinga 2016, 29, 692–699. [Google Scholar] [CrossRef] [Green Version]
  18. Rascón-Ramos, A.E.; Martínez-Salvador, M.; Sosa-Pérez, G.; Villarreal-Guerrero, F.; Pinedo-Alvarez, A.; Santellano-Estrada, E.; Corrales-Lerma, R. Soil Moisture Dynamics in Response to Precipitation and Thinning in a Semi-Dry Forest in Northern Mexico. Water 2021, 13, 105. [Google Scholar] [CrossRef]
  19. Andrade, E.M.; Guerreiro, M.J.S.; Palácio, H.A.Q.; Campos, D.A. Ecohydrology in a Brazilian tropical dry forest: Thinned vegetation impact on hydrological functions and ecosystem services. J. Hydrol. Reg. Stud. 2020, 27, 100649. [Google Scholar] [CrossRef]
  20. Guerreiro, M.S.; Andrade, E.M.; Palácio, H.A.Q.; Brasil, J.B.; Ribeiro Filho, J.C. Enhancing Ecosystem Services to Minimize Impact of Climate Variability in a Dry Tropical Forest with Vertisols. Hydrology 2021, 8, 46. [Google Scholar] [CrossRef]
  21. Molina-Sanchis, I.; Lázaro, R.; Arnau-Rosalén, E.; Calvo-Cases, A. Rainfall timing and runoff: The influence of the criterion for rain event separation. J. Hydrol. Hydromech. 2016, 64, 226–236. [Google Scholar] [CrossRef] [Green Version]
  22. Dunkerley, D. Identifying individual rain events from pluviograph records: A review with analysis of data from an Australian dryland site. Hydrol. Processes 2008, 22, 5024–5036. [Google Scholar] [CrossRef]
  23. Ignaccolo, M.; De Michele, C. A point based Eulerian definition of rain event based on statistical properties of inter drop time intervals: An application to Chilbolton data. Adv. Water Resour. 2010, 33, 933–941. [Google Scholar] [CrossRef]
  24. Freitas, E.D.S.; Coelho, V.H.R.; Xuan, Y.; de CDMelo, D.; Gadelha, A.N.; Santos, E.A.; Galvão, C.D.O.; Ramos Filho, G.M.; Barbosa, L.R.; Huffman, G.J.; et al. The performance of the IMERG satellite-based product in identifying sub-daily rainfall events and their properties. J. Hydrol. 2020, 589, 125128. [Google Scholar] [CrossRef]
  25. Restrepo-Posada, P.J.; Eagleson, P.S. Identification of independent rainstorms. J. Hydrol. 1982, 55, 303–319. [Google Scholar] [CrossRef]
  26. Medina-Cobo, M.T.; García-Marín, A.P.; Estévez, J.; Ayuso-Muñoz, J.L. The identification of an appropriate Minimum Inter-event Time (MIT) based on multifractal characterization of rainfall data series. Hydrol. Processes 2016, 30, 3507–3517. [Google Scholar] [CrossRef]
  27. Chin, R.J.; Lai, S.H.; Chang, K.B.; Jaafar, W.Z.W.; Othman, F. Relationship between minimum inter-event time and the number of rainfall events in Peninsular Malaysia. Weather 2016, 71, 213–218. [Google Scholar] [CrossRef]
  28. Barbosa, L.R.; Almeida, C.D.N.; Coelho, V.H.R.; Freitas, E.D.S.; Galvão, C.D.O.; Araújo, J.C.D. Sub-hourly rainfall patterns by hyetograph type under distinct climate conditions in Northeast of Brazil: A comparative inference of their key properties. Rev. Bras. Recur. Hídricos 2018, 23. Available online: https://doi.org/10.1590/2318-0331.231820180076 (accessed on 12 June 2021). [CrossRef] [Green Version]
  29. Dunkerley, D. Intermittency of rainfall at sub-daily timescales: New quantitative indices based on the number, duration, and sequencing of interruptions to rainfall. Atmos. Res. 2021, 253, 105475. [Google Scholar] [CrossRef]
  30. Guo, Y.; Adams, B.J. Hydrologic analysis of urban catchments with event-based probabilistic models: 1. Runoff volume. Water Resour. Res. 1998, 34, 3421–3431. [Google Scholar] [CrossRef]
  31. Lee, E.H.; Kim, J.H. Development of new inter-event time definition technique in urban areas. KSCE J. Civ. Eng. 2018, 22, 3764–3771. [Google Scholar] [CrossRef]
  32. Nojumuddin, N.S.; Yusof, F.; Yusop, Z. Determination of minimum inter-event time for storm characterisation in Johor, Malaysia. J. Flood Risk Manag. 2018, 11, S687–S699. [Google Scholar] [CrossRef]
  33. Onderka, M.; Pecho, J.; Nejedlík, P. On how rainfall characteristics affect the sizing of rain barrels in Slovakia. J. Hydrol. Reg. Stud. 2020, 32, 100747. [Google Scholar] [CrossRef]
  34. Marengo, J.A.; Torres, R.R.; Alves, L.M. Drought in Northeast Brazil—past, present, and future. Theor. Appl. Climatol. 2017, 129, 1189–1200. [Google Scholar] [CrossRef]
  35. Guerreiro, M.J.S.; Andrade, E.M.; Abreu, I.; Lajinha, T. Long-term variation of precipitation indices in Ceará State, Northeast Brazil. Int. J. Climatol. 2013, 33, 2929–2939. [Google Scholar] [CrossRef]
  36. Andrade, E.M.; Sena, M.G.T.; da Silva, A.G.R.; Pereira, F.J.S.; Lopes, F.B. Uncertainties of the rainfall regime in a tropical semi-arid region: The case of the State of Ceará. Rev. Agro@Mbiente -Line 2016, 10, 88–95. [Google Scholar] [CrossRef] [Green Version]
  37. Franchito, S.H.; Fernandez, J.P.R.; Pareja, D. Surrogate climate change scenario and projections with a regional climate model: Impact on the aridity in South America. Am. J. Clim. Chang. 2014, 3, 474. [Google Scholar] [CrossRef] [Green Version]
  38. Campos, D.A.; Andrade, E.M.; Castanho, A.D.; Feitosa, R.C.; Palácio, H.A.Q. Biomass Dynamics in a Fragment of Brazilian Tropical Forest (Caatinga) over Consecutive Dry Years. Appl. Sci. 2020, 10, 7813. [Google Scholar] [CrossRef]
  39. Andrade, E.M.; Aquino, D.N.; Chaves, L.C.G.; Lopes, F.B. Water as Capital and Its Uses in the Caatinga. In Caatinga; Silva, J.M.C., Leal, I.R., Tabarelli, M., Eds.; Springer: Cham, Switzerlands, 2017. [Google Scholar] [CrossRef]
  40. Thornthwaite, C.W. An approach toward a rational classification of climate. Geogr. Rev. 1948, 38, 55–94. [Google Scholar] [CrossRef]
  41. Embrapa—Empresa Brasileira de Pesquisa Agropecuária. Sistema Brasileiro de Classificação de Solos; EMBRAPA: Brasília, Brazil, 2013; 353p. [Google Scholar]
  42. Andrade, E.M.D.; Rodrigues, R.D.N.; Palácio, H.A.D.Q.; Brasil, J.B.; Guerreiro, M.J.S. Hydrological behaviour of vertisols in the Brazilian semi-arid region: The importance of rainfall of less than 30 mm. Rev. Ciência Agronômica 2020, 51. Available online: https://doi.org/10.5935/1806-6690.20200029 (accessed on 12 June 2021). [CrossRef]
  43. Lima, C.A.D.; Palácio, H.A.D.Q.; Andrade, E.M.D.; dos Santos, J.C.; Brasil, P.P. Characteristics of rainfall and erosion under natural conditions of land use in semiarid regions. Rev. Bras. Eng. Agrícola Ambient. 2013, 17, 1222–1229. [Google Scholar] [CrossRef] [Green Version]
  44. Wilks, D.S. Statistical Methods in the Atmospheric Sciences: An Introduction; Academic Press: San Diego, CA, USA, 1995. [Google Scholar]
  45. Esteves, L.S. Consequences to flood management of using different probability distributions to estimate extreme rainfall. J. Environ. Manag. 2013, 115, 98–105. [Google Scholar] [CrossRef]
  46. Wang, J.; Guo, Y. An analytical stochastic approach for evaluating the performance of combined sewer overflow tanks. Water Resour. Res. 2018, 54, 3357–3375. [Google Scholar] [CrossRef]
  47. Lima, A.O.; Lyra, G.B.; Abreu, M.C.; Oliveira-Júnior, J.F.; Zeri, M.; Cunha-Zeri, G. Extreme rainfall events over Rio de Janeiro State, Brazil: Characterization using probability distribution functions and clustering analysis. Atmos. Res. 2021, 247, 105221. [Google Scholar] [CrossRef]
  48. Balistrocchi, M.; Grossi, G.; Bacchi, B. An analytical probabilistic model of the quality efficiency of a sewer tank. Water Resour. Res. 2009, 45, W12420. [Google Scholar] [CrossRef]
  49. Beskow, S.; Caldeira, T.L.; de Mello, C.R.; Faria, L.C.; Guedes, H.A.S. Multiparameter probability distributions for heavy rainfall modeling in extreme southern Brazil. J. Hydrol. Reg. Stud. 2015, 4, 123–133. [Google Scholar] [CrossRef] [Green Version]
  50. Palácio, H.A.Q.; Andrade, E.M.D.; Lopes, F.B.; Alexandre, D.M.B.; Arraes, F.D.D. Similaridade da qualidade das águas superficiais da bacia do Curu, Ceará. Ciência Rural 2009, 39, 2494–2500. [Google Scholar] [CrossRef]
  51. Dunkerley, D. How is the intensity of rainfall events best characterised? A brief critical review and proposed new rainfall intensity index for application in the study of landsurface processes. Water 2020, 12, 929. [Google Scholar] [CrossRef] [Green Version]
  52. Pinheiro, E.A.R.; Metselaar, K.; de Jong Van Lier, Q.; de Araújo, J.C. Importance of soil-water to the Caatinga biome, Brazil. Ecohydrology 2016, 9, 1313–1327. [Google Scholar] [CrossRef]
  53. Pinheiro, E.A.; Costa, C.A.G.; de Araújo, J.C. Effective root depth of the Caatinga biome. J. Arid. Environ. 2013, 89, 1–4. [Google Scholar] [CrossRef]
  54. Wischmeier, W.H.; Smith, D.D. Predicting Rainfall Erosion Losses: A Guide to Conservation Planning (No. 537); Department of Agriculture, Science and Education Administration: Washington, DC, USA, 1978.
  55. Link, T.E.; Unsworth, M.; Marks, D. The dynamics of rainfall interception by a seasonal temperate rainforest. Agric. For. Meteorol. 2004, 124, 171–191. [Google Scholar] [CrossRef] [Green Version]
  56. Murakami, S. A proposal for a new forest canopy interception mechanism: Splash droplet evaporation. J. Hydrol. 2006, 319, 72–82. [Google Scholar] [CrossRef]
  57. Ferreira, A.G.; Mello, N.G.S. Principais sistemas atmosféricos atuantes sobre a região Nordeste do Brasil e a influência dos oceanos Pacífico e Atlântico no clima da região. Rev. Bras. Climatol. 2005, 1. [Google Scholar] [CrossRef] [Green Version]
Figure 1. Location of study area–Iguatu Experimental Catchment, northeast Brazil.
Sustainability 14 01721 g001
Figure 2. Distribution of total rainfall (P, mm), rainfall duration (D, h), average intensity (I, mm h−1), and maximum intensities (I5, I30 and I60, mm h−1) for rainfall events with and without single tips (STE), as a function of minimum inter-event times (MIETs, from 15 min to 24 h).
Sustainability 14 01721 g002aSustainability 14 01721 g002b
Figure 3. Frequency of occurrence of single tip events (%) and distribution of total rainfall as a function of the minimum inter-event time (MIET from 15 min to 24 h).
Sustainability 14 01721 g003
Figure 4. Relationship between the minimum inter-event time (MIETs, from 15 min to 24 h) and the number of rainfall events. The green dashed line indicates MIET of 6 h, when there is no more statistical difference between the analysis with and without single tip events (STE).
Sustainability 14 01721 g004
Figure 5. Frequency distribution of total rainfall, duration, mean intensity, and inter-event time (IET) for minimum inter-event time (MIET) of 6 h.
Sustainability 14 01721 g005
Figure 6. Distribution of total rainfall, duration, and average intensity based on a 6-h the minimum inter-event time.
Sustainability 14 01721 g006
Table 1. Rainfall event parameters evaluated.
Parameter
depth (mm)
duration (min)
mean intensity (mm h−1)
maximum intensity at intervals of 5, 30 and 60 min (I5 to I60 mm h−1)
inter-event time (h)
Table 2. Description of the probability distribution functions adjusted to the rainfall data.
DistributionProbability Distribution Functions
Normal F   ( x ) = 1 σ 2 π e x p [ ( x μ ) 2 2 σ 2 ] d x
Log-Normal F   ( x ) = x 1 x σ log ( x ) 2 π e x p { 1 2 [ log ( x ) μ log ( x ) σ log ( x ) ]   2     } d x
Gamma F   ( x ) = 1 β α Γ ( α ) ° x μ α 1 e β μ d x   f o r   0 < x <
Exponential F   ( x ) = ° f   ( x ) d x = 1 e λ x
Weibull F   ( x ) = ° f ( x ) d x = 1 e   ( x α β ) γ  
Normal: μ is the mean and σ is the standard deviation of the random variable; x is the random variable, f(x) is the probability of the variable being less than or equal to x; Log-normal: μ is the average logarithmic value of variable x, and σ is the standard deviation of the log of variable x; Gamma: Γ(α) gamma function for parameter α, (>0) is the shape parameter for the random variable x, and β (> 0) is the scale parameter for the random variable x; Exponential: λ is the inverse of the mean; Weibull: α is the shape, β is the scale and γ is the location parameter.
Table 3. Descriptive statistics of rainfall events characteristics with and without single tip events (STE) for minimum inter-event times (MIETs) varying from 15 min to 24 h.
with STEwithout STE
MIETMeanSDCVKurSkeMinMaxMeanSDCVKurSkeMinMax
P155.110.7210.527.84.30.2142.08.513.0152.717.73.30.4142.0
19.815.2154.711.02.80.2142.012.716.3127.98.92.50.4142.0
211.916.8141.211.62.70.2162.014.517.6121.410.32.50.4162.0
313.517.6130.710.02.50.2162.015.518.1116.69.42.40.4162.0
616.318.8115.18.32.30.2162.017.418.9108.78.12.20.4162.0
1219.520.8106.56.32.00.2162.020.020.8104.06.32.00.4162.0
2428.230.9109.58.52.40.6212.028.430.9108.98.52.40.6212.0
D150.50.8164.636.44.60.110.90.70.9123.925.73.90.110.9
11.31.7129.68.42.50.113.01.61.7105.87.22.20.113.0
21.82.2117.45.02.00.113.92.22.299.14.41.80.113.9
32.42.6108.96.42.00.120.92.72.695.46.31.90.120.9
63.84.0105.55.32.00.125.64.14.099.15.22.00.125.6
126.27.9128.513.53.00.171.16.38.0125.913.42.90.171.1
2416.420.9126.94.52.00.1123.716.620.9126.24.52.00.1123.7
I158.49.9118.312.12.91.3103.511.911.596.97.62.21.3103.5
18.410.1121.017.33.40.4103.59.911.0110.913.93.00.4103.5
28.110.1124.919.13.50.4103.59.210.8117.516.23.30.4103.5
37.89.2117.711.12.80.276.38.59.6113.19.72.60.276.3
67.49.1124.013.13.10.176.37.69.3122.812.33.00.176.3
127.49.6129.612.33.00.176.37.59.7129.612.23.00.176.3
246.39.9156.214.53.40.176.36.39.9157.814.83.40.176.3
I51516.023.5146.75.52.32.4142.525.027.4109.52.21.62.4142.5
125.628.8112.21.71.52.4142.532.529.691.20.91.22.4142.5
229.429.9101.81.01.32.4142.535.230.185.50.61.12.4142.5
332.130.494.70.81.12.4142.536.630.382.80.61.02.4142.5
637.330.882.50.41.02.4142.539.630.577.00.40.92.4142.5
1241.730.773.60.30.92.4142.542.630.571.60.30.92.4142.5
2448.631.564.9−0.20.72.4142.548.831.564.7−0.20.72.4142.5
I301521.518.485.42.01.42.4100.721.518.485.42.01.42.4100.7
122.118.483.31.91.42.4100.722.118.483.31.91.42.4100.7
222.618.581.81.81.42.4100.722.618.581.81.81.42.4100.7
322.818.681.61.71.32.4100.722.818.681.61.71.32.4100.7
623.518.779.61.61.32.4100.723.518.779.61.61.32.4100.7
1224.419.078.01.41.32.4100.724.419.078.01.41.32.4100.7
2427.619.972.10.91.12.4100.727.619.972.10.91.12.4100.7
I601518.914.576.82.61.51.581.618.914.576.82.61.51.581.6
119.213.871.52.71.42.481.619.213.871.52.71.42.481.6
218.913.772.62.61.42.481.618.913.772.62.61.42.481.6
319.013.872.62.61.42.481.619.013.872.62.61.42.481.6
619.013.671.62.71.42.481.619.013.671.62.71.42.481.6
1219.413.670.12.71.42.481.619.413.670.12.71.42.481.6
2421.513.864.12.51.32.481.621.513.864.12.51.32.481.6
P-rainfall depth (mm); D-rainfall duration (h); I-rainfall intensity (mm h−1); maximum intensity at intervals of 5, 30, and 60 min (I5 to I60, mm h−1); SD–standard deviation; CV–coefficient of variation; Kur–Kurtosis; Ske–Skewness; Min–Minimum; Max–Maximum.
Table 4. Characteristics of rainfall events as a function of the minimum inter-event time (MIETs, from 15 min to 24 h).
with STE
MIETP D I I5 I30I60N° of
Events
15 min0.76b0.2b4.8b5.09b16.515.81698
1 h3.4b0.7b4.8b12.2b16.816.1880
2 h5.2b1.1b4.61 19.2b17.815.8726
3 h6.8 1.5b4.58 24b17.815.8643
6 h9.75 2.75 4.08 30.53 18.415.8530
12 h12.3 3.58 4.05 36 19.516.3443
24 h18.2 7.08 2.46 45.6 23.118.6307
without STE
MIETP D I I5 I30I60N° of
events
15 min3.2a0.4a8a12.2a16.515.8995
1 h6.4a1.1a6.4a24a16.816.1675
2 h7.62a1.5a5.95 26.4a17.815.8595
3 h8.8 1.9a5.38 30.5a17.815.8557
6 h10.9 2.96 4.62 33.6 18.415.8496
12 h12.4 3.75 4.12 36.58 19.516.3432
24 h18.2 7.17 2.45 45.72 23.118.6305
P-Median rainfall depth (mm); D-Median rainfall duration (h); I-Median rainfall intensity (mm h−1); Median I5 to I60-Maximum intensity at intervals of 5, 30 and 60 min (I5 to I60, mm h−1). Statistically different medians at the level of 1% by the Wilcoxon test with the inclusion or exclusion of STE highlighted in bold (a-higher medians; b-lower medians).
Table 5. Characteristics of rainfall events based on the 6-h the minimum inter-event time.
Rainfall ClassificationLimitsVariablesMeanStandard DeviationCVNumber of Events
Class I0.20 ≤ P ≤ 38.58 *P (mm)8.980.9410
0.08 ≤ D ≤ 11.58Duration (h)2.82.60.9
0.08 ≤ I ≤ 32.22I (mm h−1)5.66.11.1
Class II3.00 ≤ P ≤ 29.80P (mm)14.28.40.614
0.08 ≤ D ≤ 0.67Duration (h)0.30.20.6
36.00 ≤ I ≤ 76.32I (mm h−1)45.912.10.3
Class III3.60 ≤ P ≤ 161.97P (mm)45.121.60.5106
1.00 ≤ D ≤ 25.58Duration (h)8.15.50.7
0.24 ≤ I ≤ 29.93I (mm h−1)9.16.70.7
* the values of some variables overlap between classes, CV is the coefficient of variation.
Publisher’s Note: MDPI stays neutral with regard to jurisdictional claims in published maps and institutional affiliations.

