Article

Technical and Economic Analysis of an HVDC Transmission System for Renewable Energy Connection in Afghanistan

by
Gul Ahmad Ludin
1,2,*,
Akito Nakadomari
1,
Atsushi Yona
1,
Suresh Mikkili
3,
Shriram Srinivasarangan Rangarajan
4,5,
Edward Randolph Collins
4 and
Tomonobu Senjyu
1,*
1
Electrical and Electronics Engineering Department, University of the Ryukyus, 1 Senbaru, Nishihara-cho, Nakagami 903-0213, Okinawa, Japan
2
Electrical Power Engineering Department, Kabul Polytechnic University, 5th District, Kabul 1001, Afghanistan
3
Department of Electrical and Electronics Engineering, National Institute of Technology Goa, Ponda 403401, India
4
Department of Electrical and Computer Engineering, Clemson University, Clemson, SC 29634, USA
5
Department of Electrical and Electronics Engineering, SR University, Warangal 506001, India
*
Authors to whom correspondence should be addressed.
Sustainability 2022, 14(3), 1468; https://doi.org/10.3390/su14031468
Submission received: 18 December 2021 / Revised: 22 January 2022 / Accepted: 24 January 2022 / Published: 27 January 2022
(This article belongs to the Section Energy Sustainability)

Abstract

:
Aged and insufficient domestic power plants and insecure, unreliable and expensive power imports pose significant challenges for the power sector of Afghanistan. On the other hand, due to the absence of a suitable transmission grid, the internal renewable energy resources are not adequately developed, despite their abundant resource potential throughout the country. This paper proposes a voltage source converter (VSC)-based high-voltage direct current (HVDC) transmission link to connect the Herat province in the west, which has huge solar and wind energy potential, to Kabul, the capital of the country and the main load center. A techno-economic analysis of this HVDC against high-voltage alternating current (HVAC) technology was performed to determine the suitability and effectiveness of the proposed transmission system. The active, reactive and corona losses were calculated as the technical parameters and the discounted cash flow (DCF) method was deployed to economically compare both technologies. The outcomes of the paper disclose that the implementation of this transmission project is techno-economically feasible, and can result in the energy security and economic stability of the country.

1. Introduction

The socio-economic growth of a country that increases incomes and living standards and reduces poverty is intensely dependent on increased energy use. Furthermore, providing sufficient, reliable and economic energy services, in an environmentally sustainable manner, and adaptation with socio-economic development needs, are major elements of sustainable development. On the other hand, the living standard of each country is indicated by GDP (gross domestic product), which is about 90% dependent on per capita energy consumption [1]. Based on the data available for 2021, Afghanistan, with its USD 570 GDP per capita and 100 kWh per year per capita energy consumption, ranks among the lowest in the world [2,3]. The major concern is the energy resources. The major portion of supplied electricity (77.4%) in the country is imported from the neighboring countries, which is insecure, unreliable and uneconomical due to unstable neighbors, limited enforceability of commercial contracts and lack of certainty about future price trends. Moreover, the domestic power generation stations in the country are either currently out of useful life cycle or not sufficiently developed [1].
Afghanistan has tremendous, feasible potential for generating various renewable energies, such as solar, wind, hydro, biomass and geothermal energy, throughout the country. Among them, solar energy, with 222,000 MW, and wind energy, with 66,000 MW, which are technically feasible, can change Afghanistan to an energy self-sufficient country [4]. The utilization of these resources not only can fulfill the future increasing electric power demand of the country but also can create other important opportunities, such as creating jobs and exporting the surplus power to neighboring countries.
On the other hand, the major and prominent potential of solar and wind energy in the country is located in remote areas such as the Herat, Farah, Nimroz, Kandahar and Helmand provinces, and they are considerably far from the capital and other main load centers. Therefore, a techno-economically suitable power transmission system is required to transmit the power to the main load centers.
Among the two possible methods for integrating various AC grids and economic transmission of bulk power over long distances, HVDC seems suitable and a viable alternative technology compared to HVAC [5]. Due to the considerable advantages of HVDC over HVAC for long-distance power transmission, many researchers have done valuable studies on it. In [6], a comparative evaluation of HVDC and HVAC transmission systems has been done. The authors found that the frequency existing and the intermediate reactive components cause stability problems in the HVAC line. Contrariwise, due to the absence of the frequency, HVDC transmission does not have the stability problem, and hence no length limitation. The authors also mentioned that for the same power capability and comparable reliability, except for the terminal equipment, the cost per unit distance of the HVAC line is higher than that of the HVDC line. A techno-economic study of a transmission line has been done in [7,8] for the south-western part of Pakistan to transmit renewable energy from Gwadar in Baluchistan to Matiari in Sindh. The results of the study reveal that the utilization of this project can bring energy security and stability to the southwestern part of Pakistan. The economic results also show that the net present value (NPV) of HVDC transmission is comparatively lower than the HVAC transmission system. In [9], an economic comparative study of HVAC and HVDC transmission technology for connection and transmission of a 2 GW offshore wind farm over 80 km distance to the onshore grid in Korea has been done. The authors have proven that the current source converter (CSC)-based HVDC transmission system is considerably more economical compared to VSC-HVDC and HVAC transmission systems. In [10], the HVDC transmission system with its advantages is discussed as a future expectation for Pakistan. It is concluded that the HVDC transmission system is a good choice in the future for wind power transmission from the Sindh and Baluchistan provinces to the main load centers. The authors in [11] presents the design and technical analysis of a 500–600 kV HVDC transmission system for Turkey. The authors explained the importance of the HVDC transmission system and calculated the resistive and corona losses and the maximum electrical field stress on different conductor configurations. Similarly, other literature [12,13,14,15] also clarify the importance and advantages of HVDC transmission technology for renewable energy integration and bulk power transmission.
For Afghanistan, currently, there is no research to ascertain the importance of HVDC transmission technology for renewable energy transmission over long distances. This paper proposes an HVDC transmission line that connects the Herat province in the southwest with Kabul—the capital of the country. A comparative techno-economic analysis was done to clarify the effectiveness of HVDC transmission technology over HVAC. In order to technically analyze, the technical and corona losses were calculated for both technologies. For economic consideration, the discounted cash flow (DCF) method was deployed and both transmission options were compared based on their net present values (NPV). The paper begins with future power demand and challenges in Afghanistan followed by renewable energy potential followed by the Afghan power transmission system. Next, the paper presents the overall comparison of the HVDC vs. HVAC transmission system followed by the comparison of CSC-HVDC vs. VSC-HVDC technology. Thereafter, the worldwide HVDC projects are overviewed followed by the proposed transmission line and its technical and economic analysis, respectively. Finally, we discuss the findings and provide some concluding remarks.

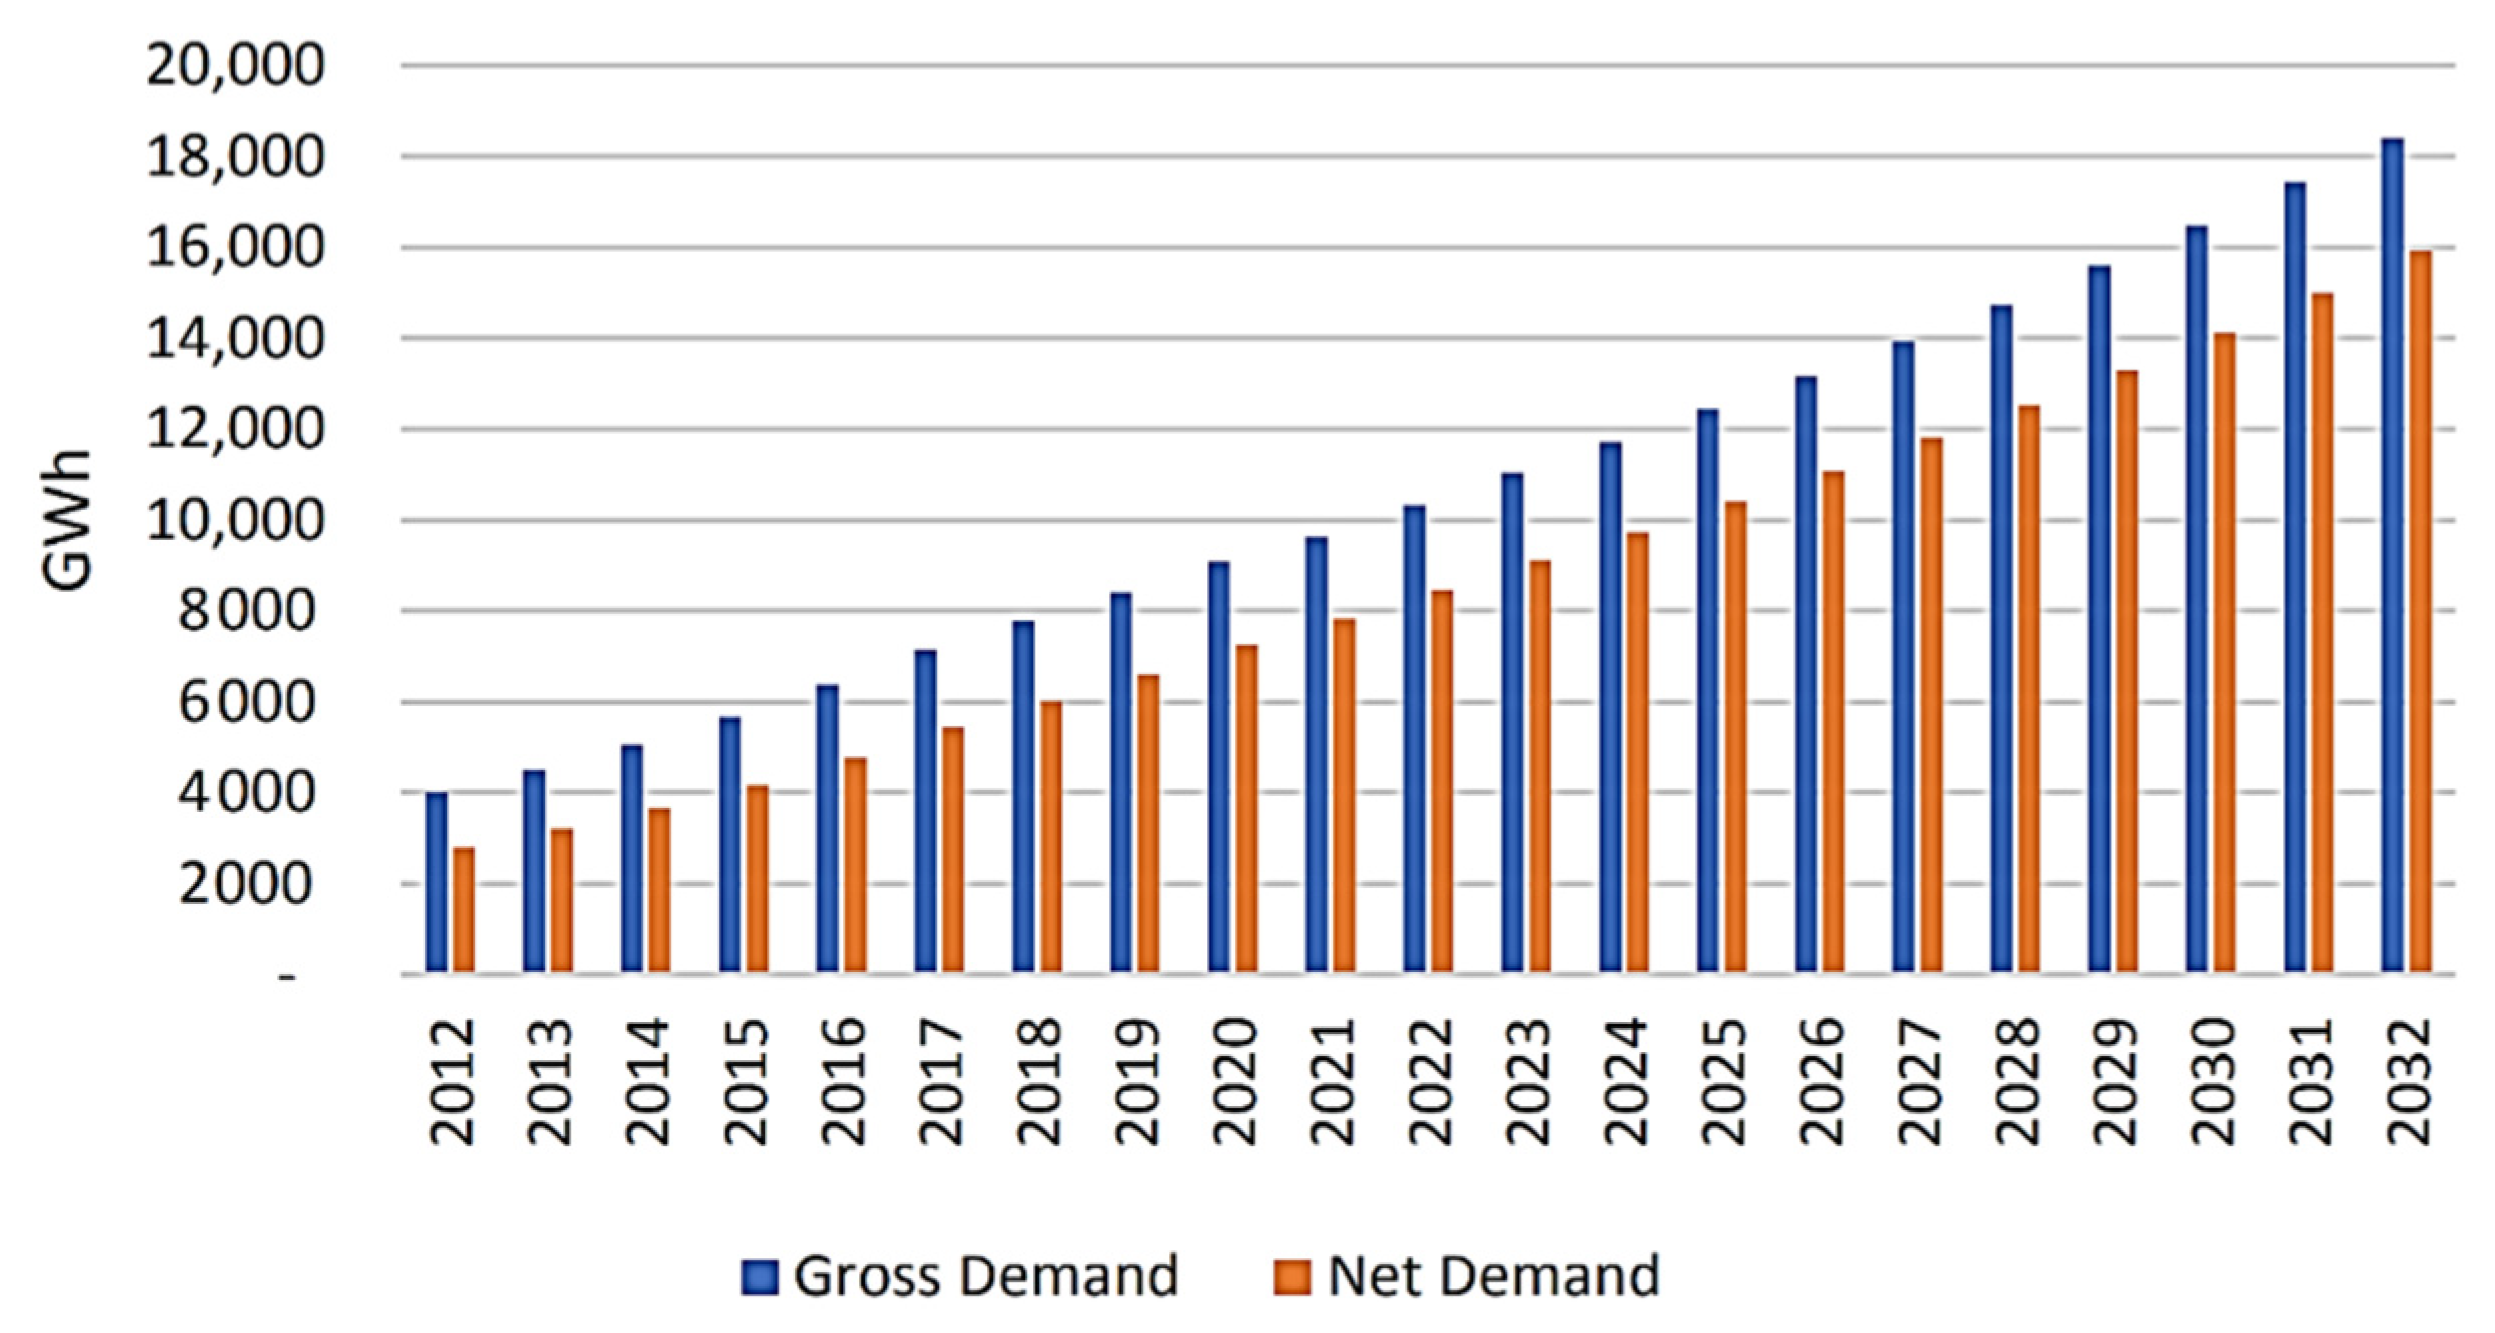
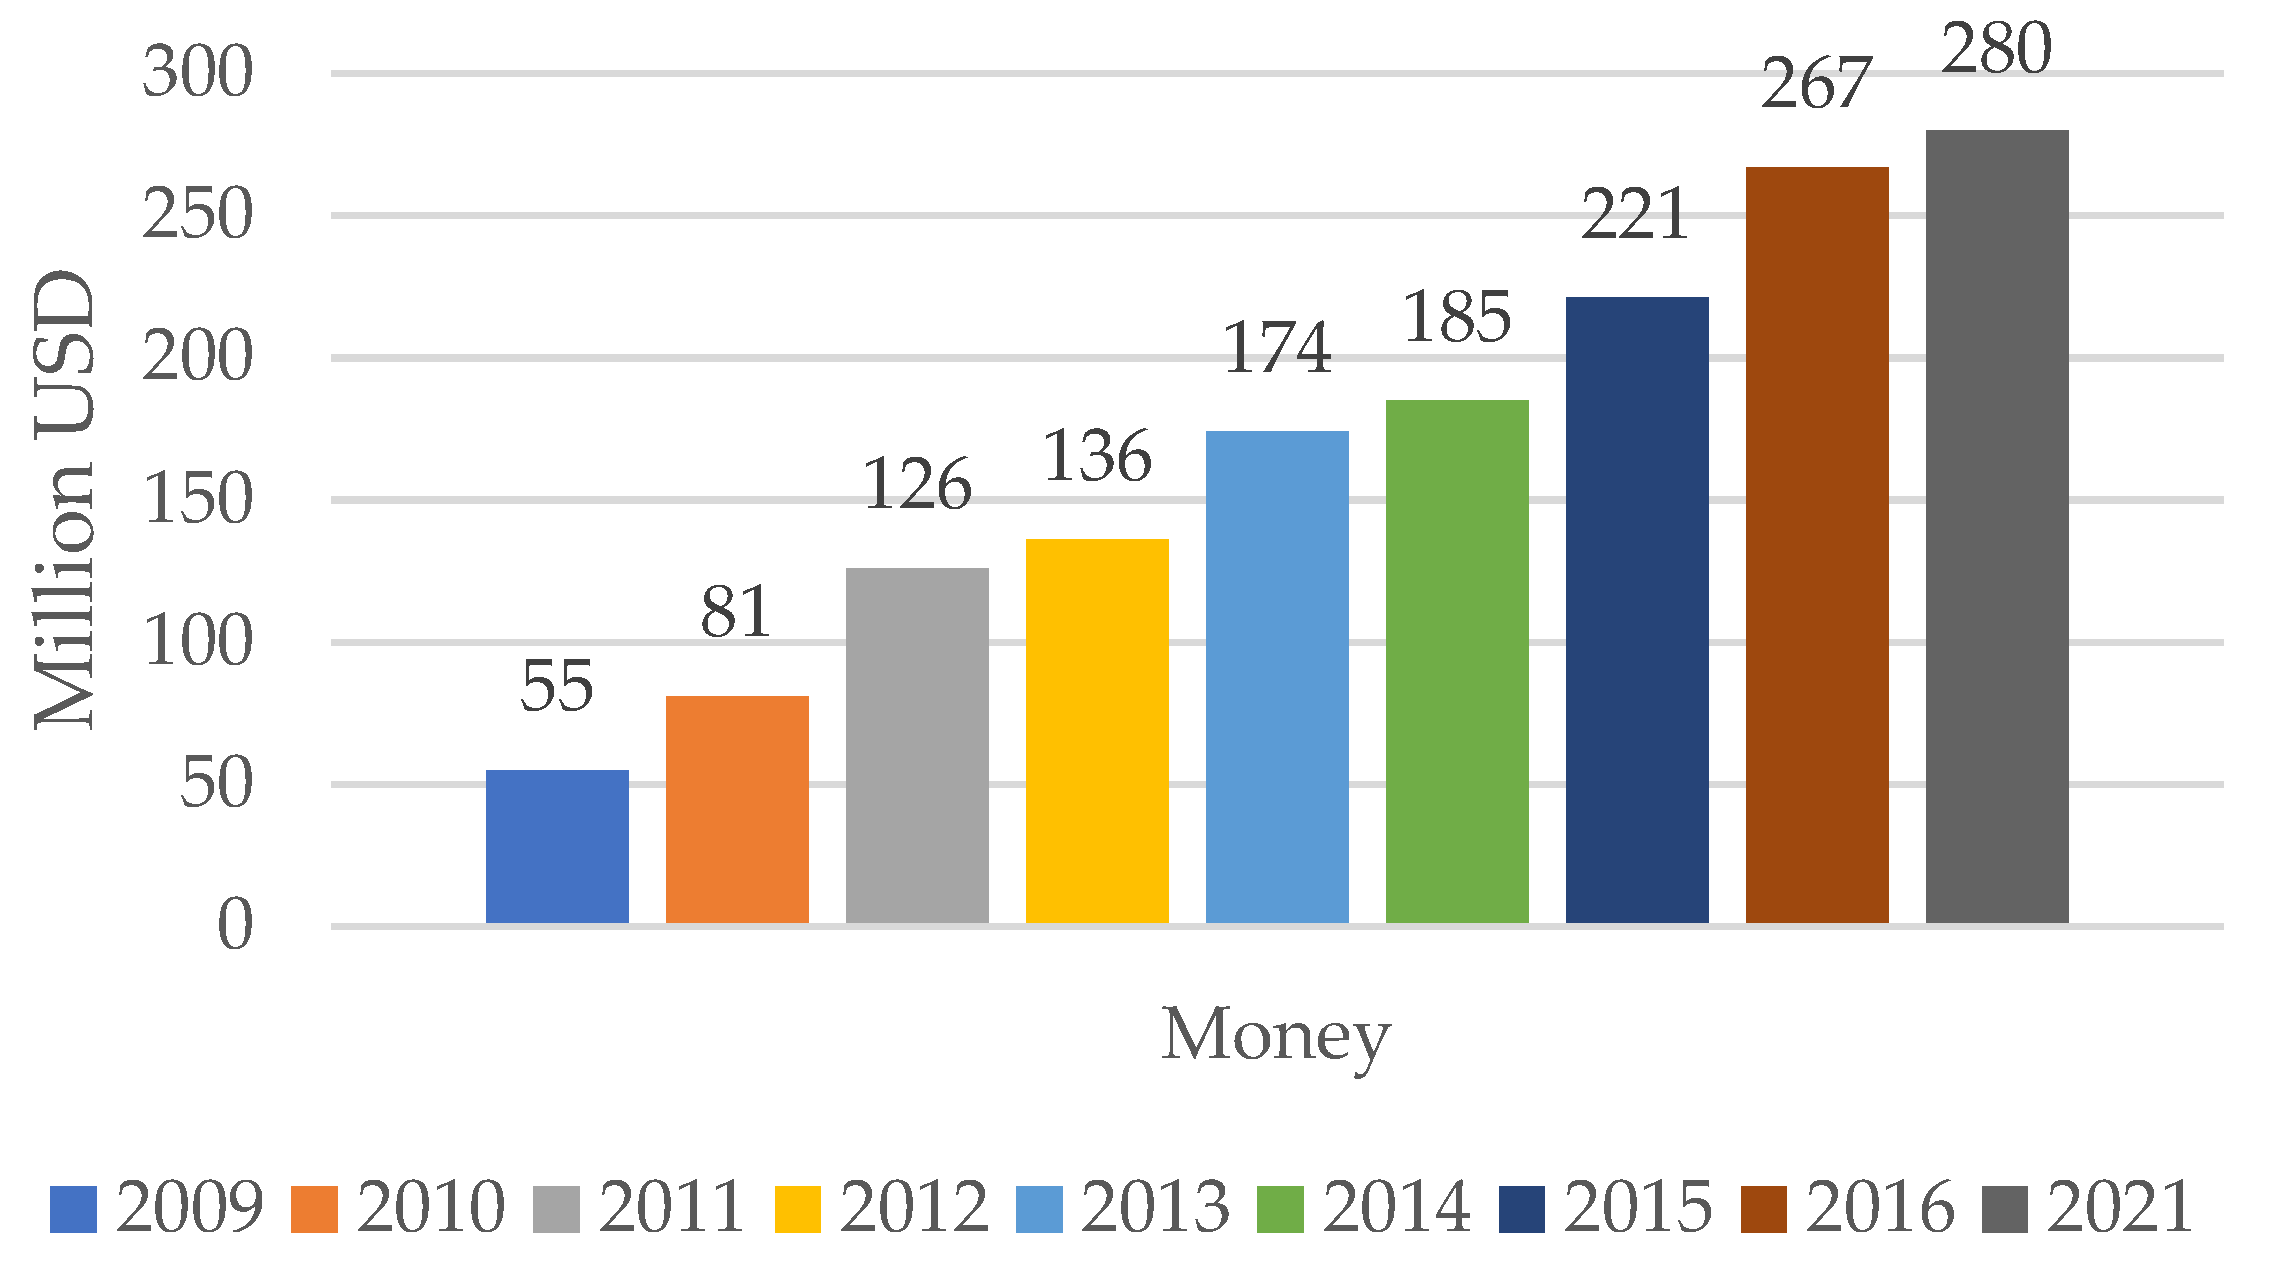
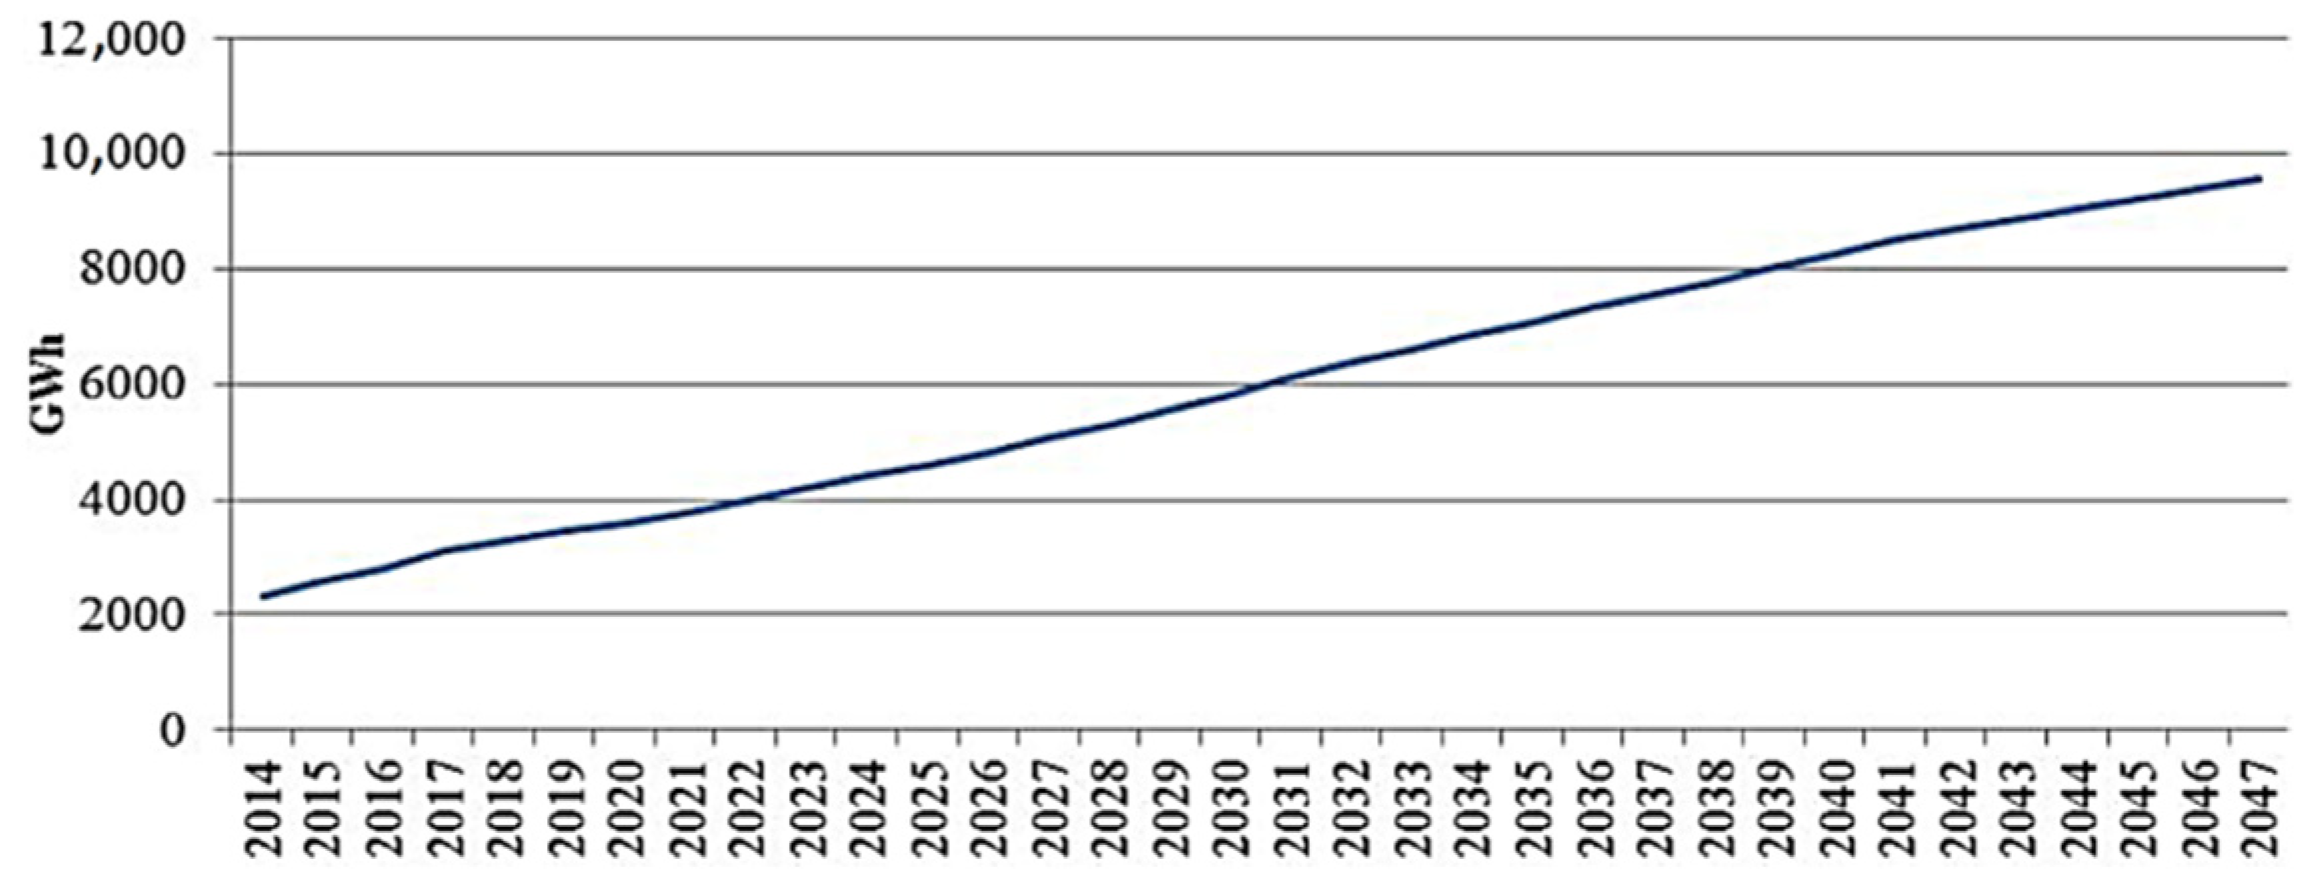
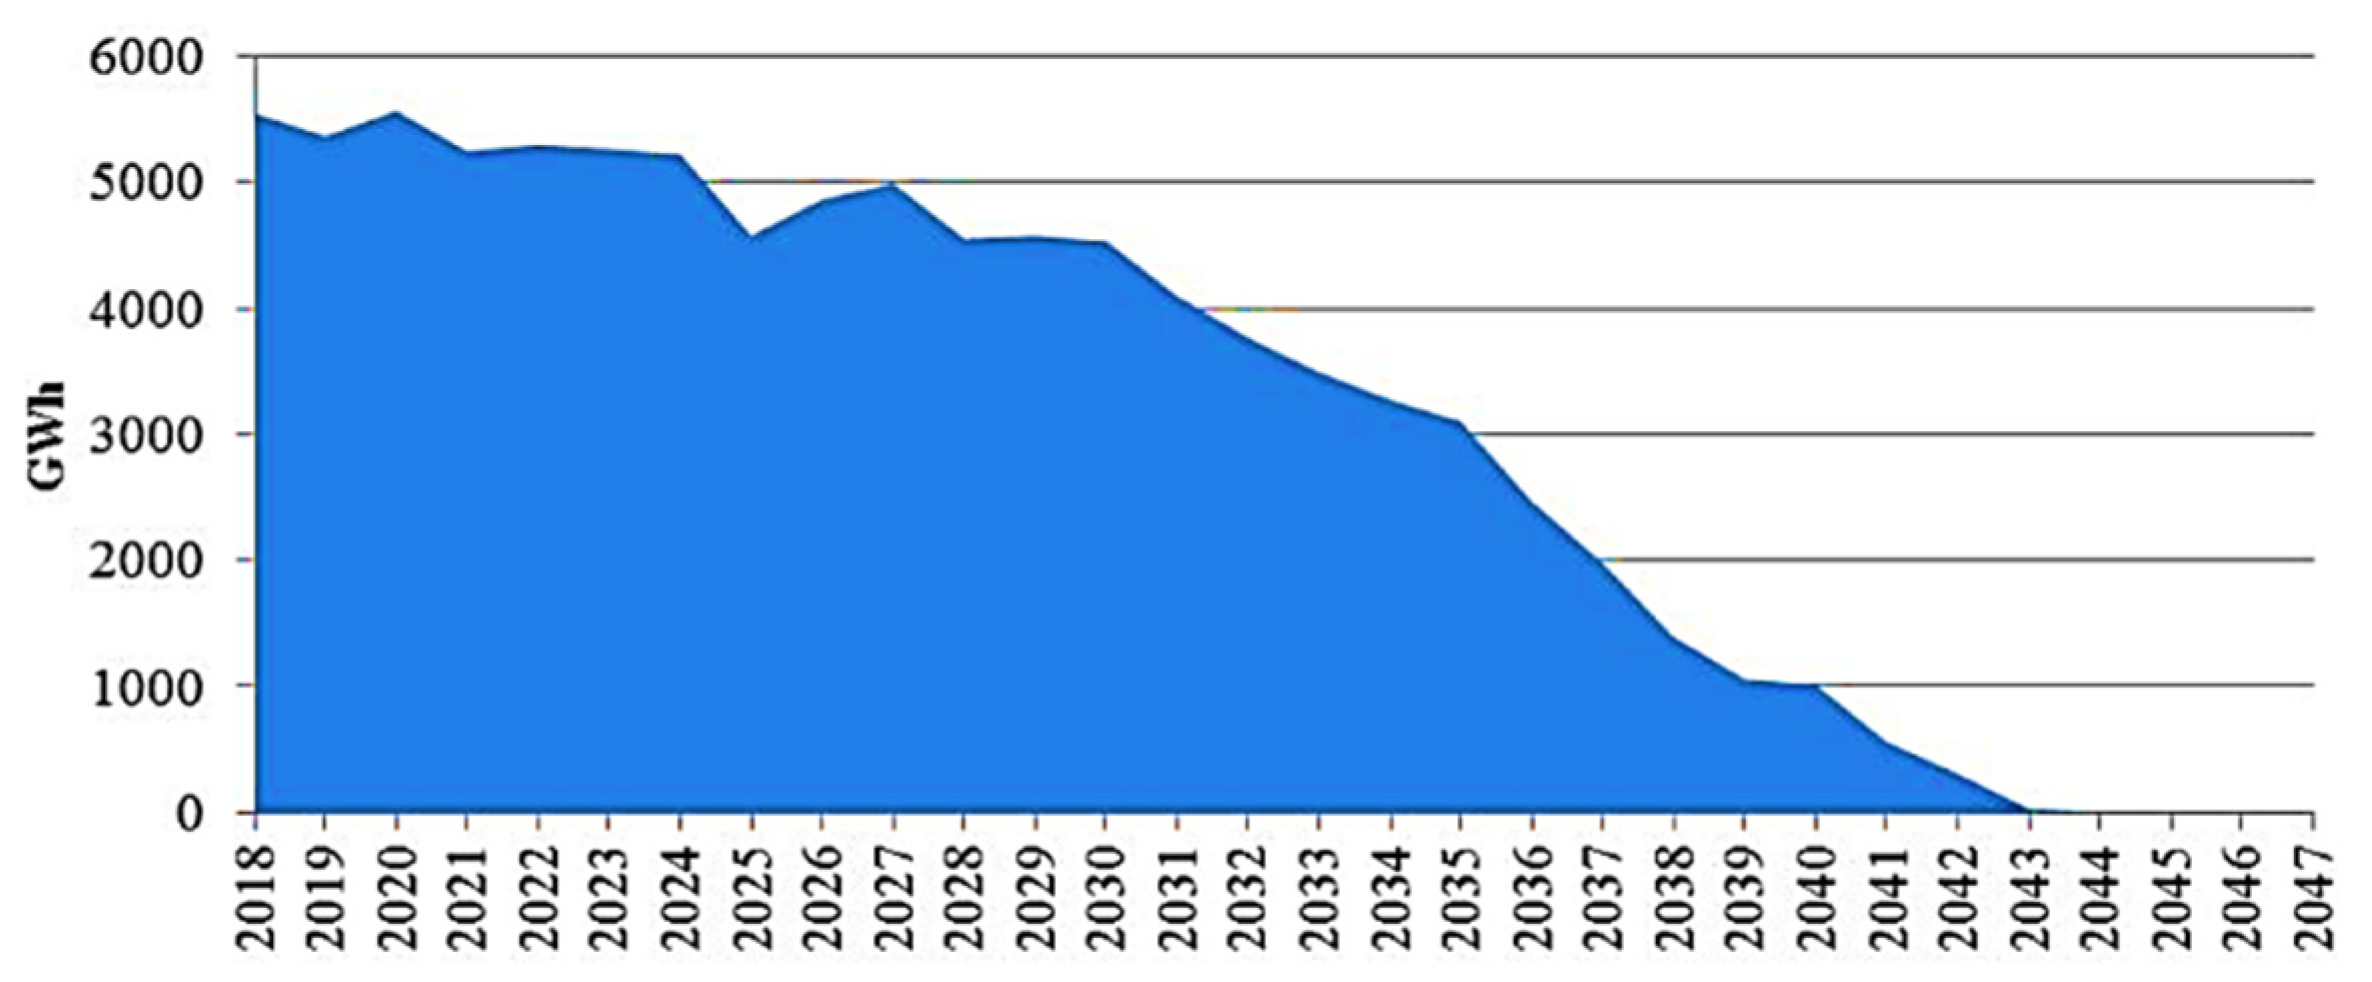
2. Future Power Demand and Challenges

Electric power demand is the major parameter for identifying cost-effective electrification and transmission technologies. Future electric power demand is a function of projected population growth and other specific assumptions regarding demand. According to the United Nations data, Afghanistan’s population increased from 32.927 million in 2015 to 39.922 million people (2.4% growth of total population per year) in 2021. According to UN projections and also assuming 2.4% annual growth, the population of Afghanistan is projected to be 64.68 million people by 2050 [16]. Meanwhile, the power demand of Afghanistan is increasing significantly. The power demand of Afghanistan is comprehensively forecasted as a part of the Afghanistan Power Sector Master Plan (APSMP) in 2012. As shown in Figure 1, net demand is projected to increase from approximately 2800 GWh in 2012 to 15,909 GWh in 2032, showing an average of 9.8% annual growth [17]. The peak demand was 600 MW in 2012 and increased to 750 MW in 2014, though the unrepressed demand was considerably higher; i.e., about 2500 MW [3,18]. Peak demand also is projected to be 3502 MW in 2032, approximately 8.6% growth per year.
The country’s power demand is currently much more than its supply, and the insecure and unstable imported power from neighboring countries, which covers 77.4% of the demand, also suffers from frequent interruptions and insurgent attacks. Furthermore, the imported power is expensive and runs asynchronously with domestic generation. Figure 2 shows the cost of power imports that the government of Afghanistan pays each year. As is clear, this graph has an upward trend year by year and clarifies that the country is paying a large amount of money each year [18,19].
As relying on power imports is increasing and given the country is paying more than USD 250 million per year, which is a huge amount, there is a need for a wide domestic power plan to focus on untapped internal renewable energy resources.
The remained electricity supply (22.4%) is generated by domestic mostly aged electric power generation stations. As shown in Figure 3, out of 623 MW total internal installed capacity, 312.5 MW (50%) is from thermal, 255.5 MW (41%) is from hydropower and 55.0 MW (9%) is from renewable energy, especially solar photovoltaic and wind generators [20]. Load shedding is still the only option to equalize and maintain the supply with the demand.
The electric power demand of Kabul as the capital and most populated province of the country is growing rapidly. The vast increase in demand is driven mainly by the expected increase in household connection rates in Kabul province, which were 44% in 2011 and are expected to reach 97.5% by 2032 [21]. As shown in Figure 4, the power demand of the Kabul region is approximately 4000 GWh (463 MW) in 2021 and will reach 8500 GWh (984 MW) by 2043. On the other hand, as shown in Figure 5, the combined surplus power of Tajikistan and Kyrgyzstan, from which Afghanistan imports the major portion of its power, is estimated to be finished by 2043 [22]. Due to its population growth and increasing power demand, the country will be able to supply only its own power demand.
To be an energy self-sufficient country and meet this growth demand, Afghanistan needs to invest in domestic renewable energy resources such as solar and wind (ADB, 2015). The remarkable grid-scale and feasible potential of solar and wind energy are available in the south and southwestern part of the country, particularly the Herat, Farah and Nimroz provinces. For this study, the Herat province was selected for utilization of these sources and their transmission to Kabul to meet the increasing future demand of the province.

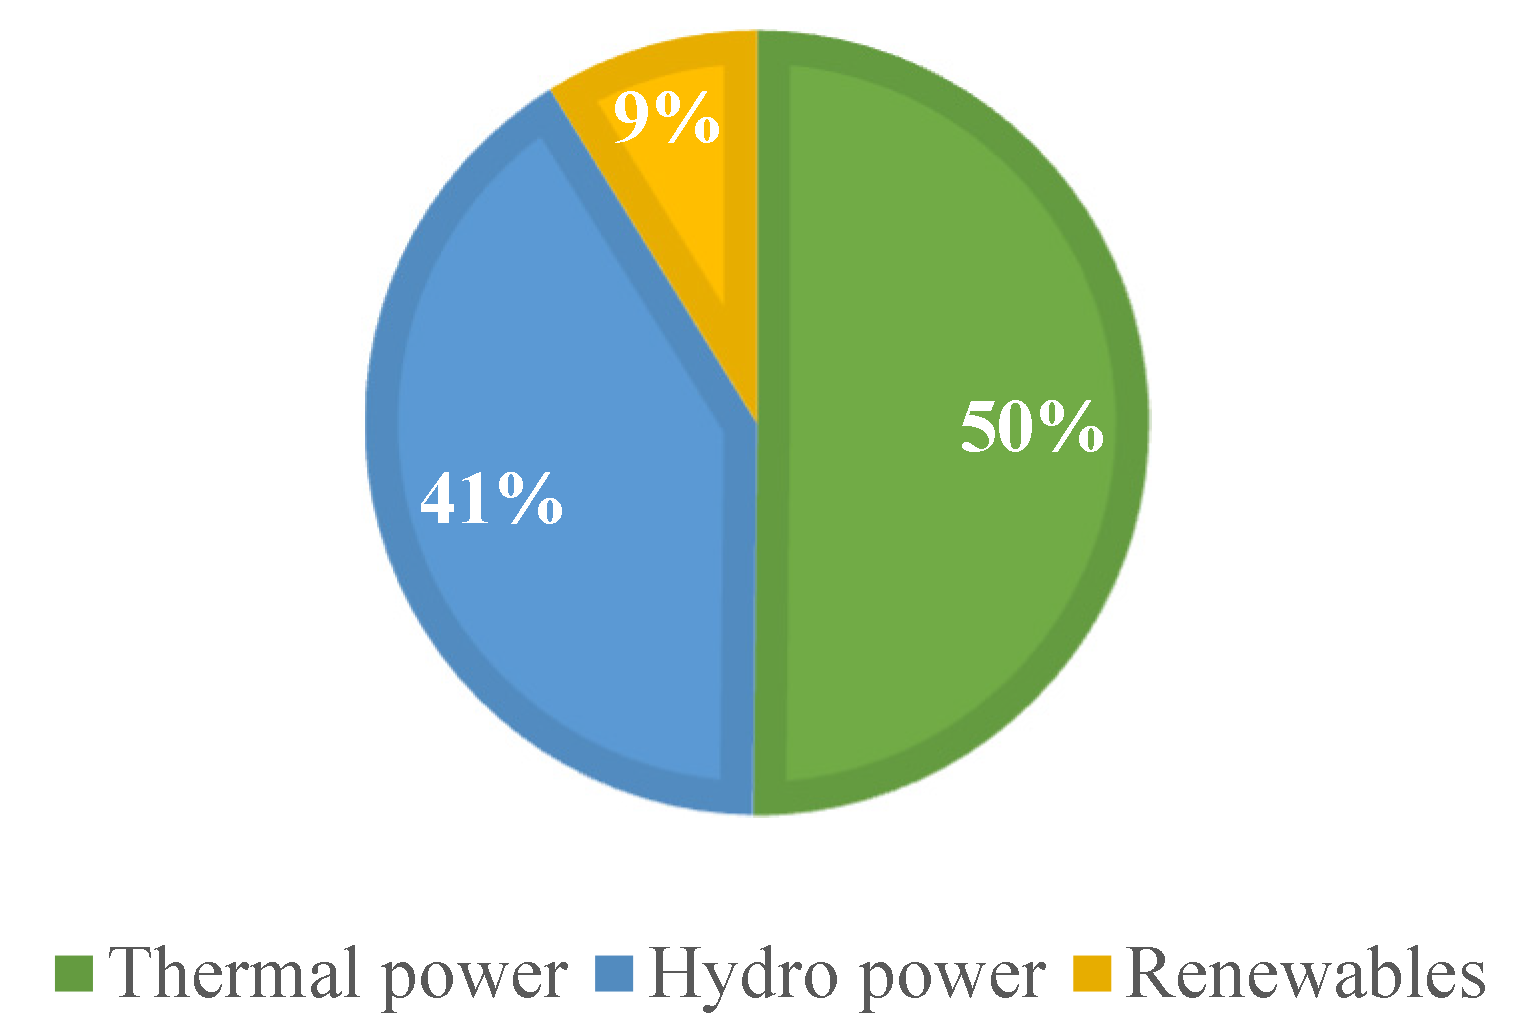
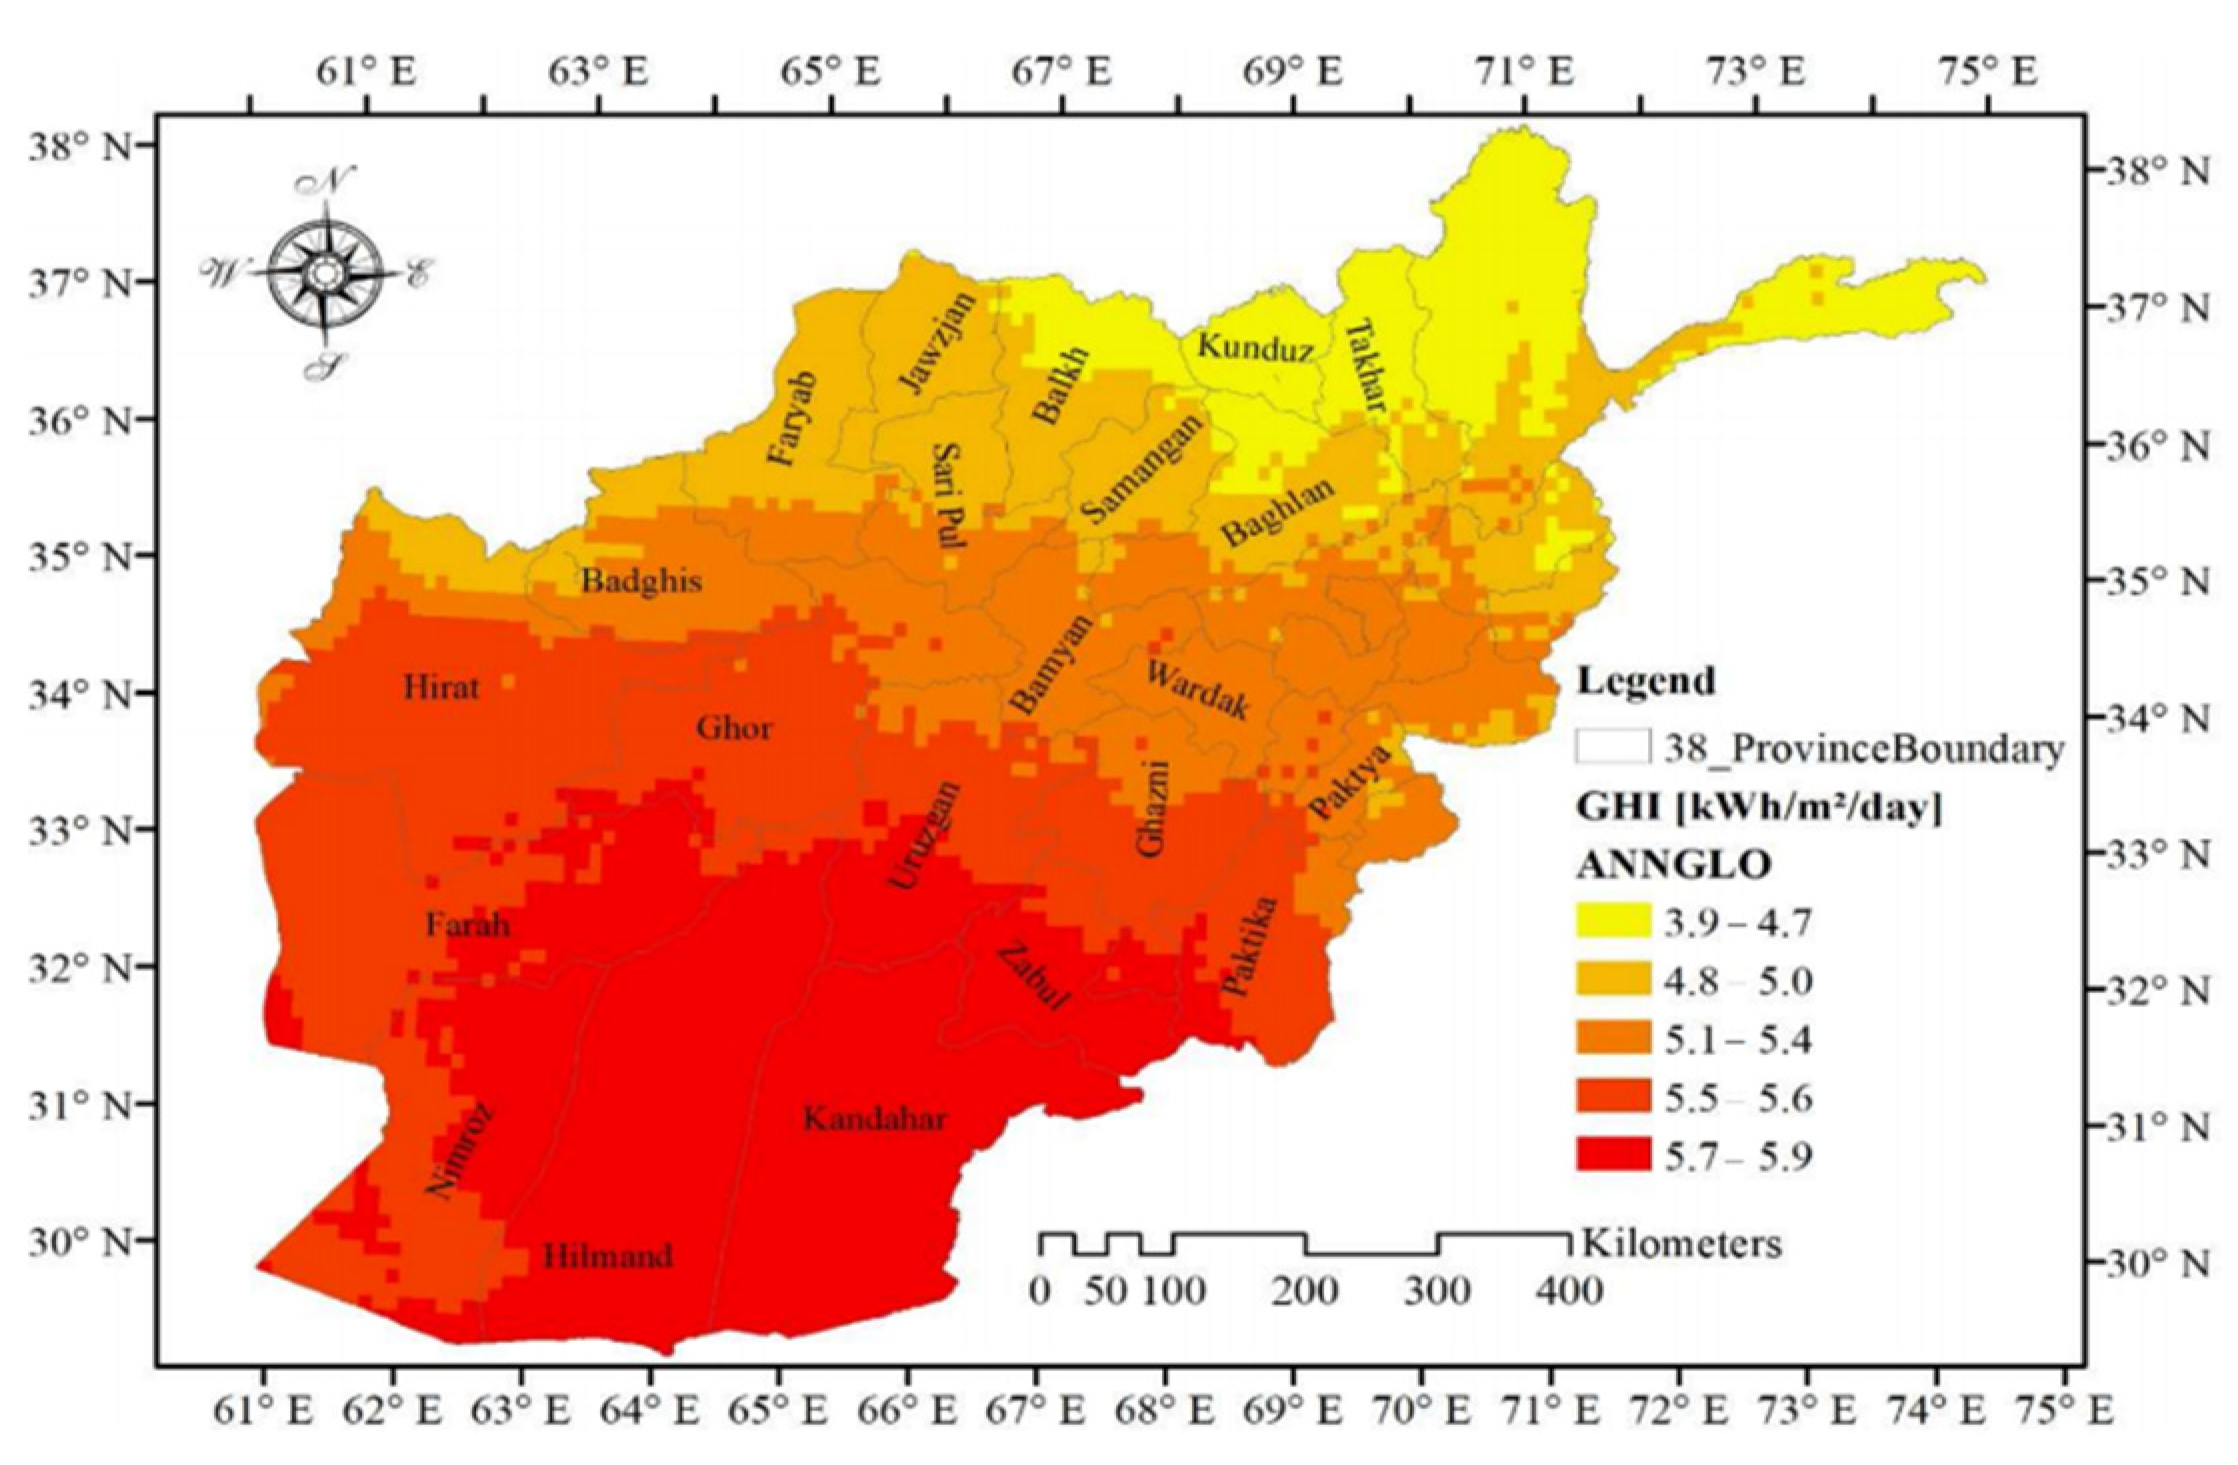
3. Renewable Energy Potential

Afghanistan has a tremendous potential for various types of renewable energy throughout the country. According to the ministry of energy and water (MEW) of the country, the total power production potential of renewable energies is 318 GW. Among them, solar energy, with a total of 222,000 MW, wind energy, with 66,000 MW, and hydropower, with 23,000 MW, constitute the major portion of renewable energy potential in the country [4,23]. Currently, only 10% of the country’s power demand is met by renewables, particularly hydropower [18]. The renewable energy policy of Afghanistan has set the 5000 MW (95%) power demand target to be met by renewable energies by 2032 [24]. The global horizontal irradiance (GHI) and annual mean wind speed maps are shown in Figure 6 and Figure 7, respectively [25]. As is clear from the figures, the huge potential of both solar and wind energy is concentrated in the south and southwestern provinces, such Herat, Farah, Nimroz and Kandahar.
Solar energy with having 300 sunny days annually and a 6.5 kWh/m2/day average and 9.0 kWh/m2/day summer solar radiation density, wind energy with 120 windy days annually, a 5 MW/km2 power density and over 8.5 m/s wind speed (in Herat Farah and Nimroz) and also as environmentally friendly and sustainable energies are the prominent and future promising options for the country. Utilization of these resources can not only meet the internal power demand but also exploit other key opportunities, such as exporting power to neighboring countries and finding jobs, more effectively; it can pave the way for the country’s liberalization from insecure, unreliable and expensive power imports (MEW-2015). The total theoretical and feasible potential of solar and wind energy per province of the country could be found in [4]. The cities with the largest power production potential, such as Herat, Farah, Kandahar, Nimroz and Helmand, are located in the south and southwestern part of the country. These provinces have large capacity factors (CF) in the range of 42 and higher while the global typical CF is between 20–35. Also, the net annual energy production (AEP) is in the range of 2418–3709 where the typical global AEP is between 1752–3066 MWh/MW [26]. The major spots of wind energy (75% windy area and 90% of the exploitable capacity) assessed by NREL are located in west-central parts especially Herat, Farah and Nimroz provinces. The areas of highest fecundity are concentrated in the western parts of the Herat and Farah provinces, with potential outputs of 30,000–50,000 MWh per year per spatial unit.

4. Afghan Power Transmission System

The Afghan power transmission system is extremely segmented, consisting of isolated grids supplied by distinct power systems, including various generating stations and import sources. The power systems of the countries meeting Afghanistan’s import needs, unfortunately, operate asynchronously with each other and with Afghanistan. The network is divided into four main parts connecting different sources to the grid: 1—the North East Power System (NEPS), consisting of various small grids and connects 17 load centers, including Kabul, Mazar-e-Sharif and Jalalabad with Tajikistan and Uzbekistan at 220 kV, 110 kV and 35 kV; 2—the southeast Power System (SEPS), consisting of Kandahar and linking with Kajaki (110 kV); 3—the Herat System linked with Iran and Turkmenistan (132 kV and 110 kV); and 4—Turkmenistan, which connects Herat Faryab, Jawzjan, Sar-e-Pul and Andkhoy Districts (110 kV).
Herat has transmission links to both Iran and Turkmenistan, but it is isolated from the rest of the transmission network. Nimroz is also connected to Iran and receives power at the 20 kV voltage level, but it has no transmission connections to other provinces.
One of the existing HVDC transmission projects in the country is the CASA-1000 project that comprises the bulk power transmission of the summer surplus from Kirgizstan and Tajikistan to Pakistan via Kabul via a high-voltage direct current system, with an additional converter station for 300 MW bidirectional transfer at Kabul. The 300 MW power is available only in summer and therefore it cannot replace domestic generation or imports. Despite the expected considerable results, such as an increase in cross-border reliable energy transmission capacity, increasing private sector investment and creating jobs and services in the region, CASA-1000 will be implemented as a stand-alone project generating revenue from power transit and re-export of Afghanistan’s share without an impact on the domestic demand–supply balance [27]. Likewise, the Uzbekistan–Afghanistan–Pakistan Electricity Supply and Trade Project (UAP_EST) would transmit 100 MW to Afghanistan at a substation north of Kabul and 900 MW to Peshawar of Pakistan. Both projects offer technical advantages to Afghanistan, especially in terms of synchronization problems and bulk power transmission over long distances to the major load center in Kabul. However, they cannot help the present and future increasing power demand of the country.
There is a plan to interconnect the NEPS to the Kandahar and Herat grids to provide solar and wind power to the electricity grid, as 80% of the high solar and wind power potential areas are located in these parts.
The main constraints to solar and wind energy utilization are the lack of transmission lines between NEPS and South-East Power System (SEPS), having high solar density and windy areas; the existing, costly imported power; low income; and the lack of security in the country.

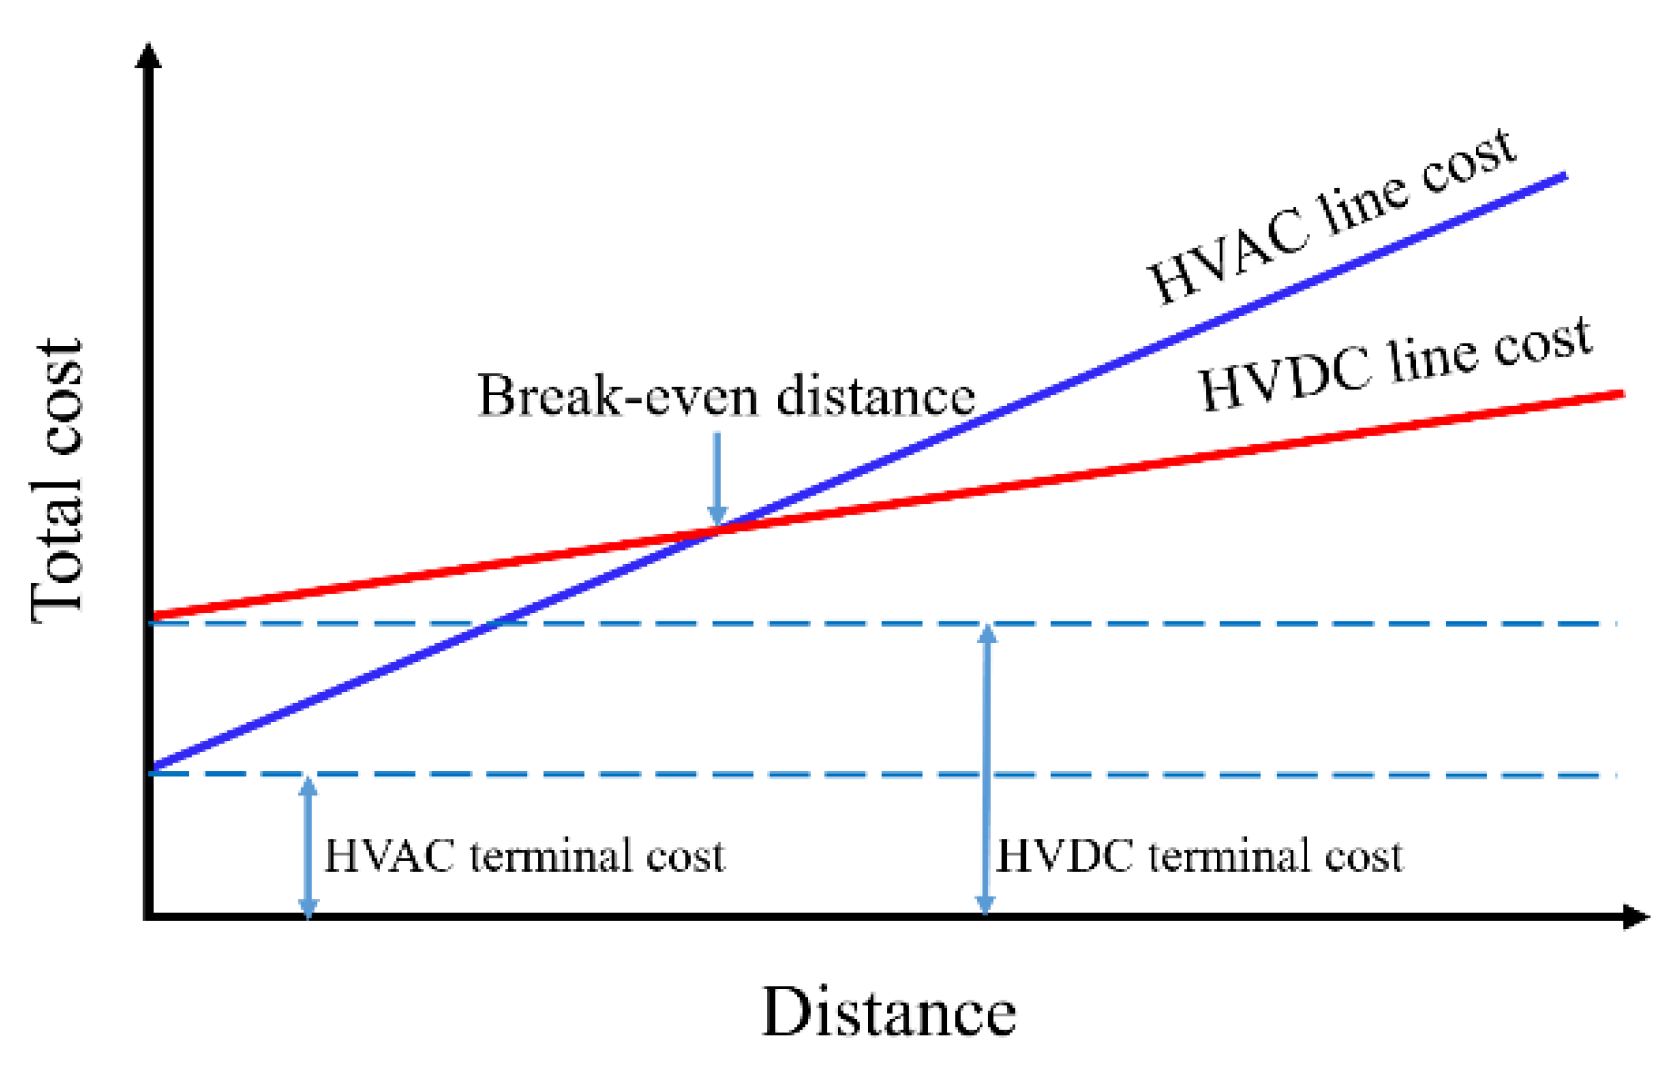
5. HVDC vs. HVAC Transmission System

The fast growth of renewable energy, both embedded within rural and urban areas (distributed), is being prohibited by different limitations of the transmission infrastructure. The major purpose of designing a transmission system is to minimize the power losses and economically supply the power at the minimum possible investment. The utilization of an HVAC transmission system is statically and dynamically limited, such as transient stability or voltage stability and thermal limits; also, it is impossible to transmit net power without affecting power flow in other parallel branches [28]. On the other hand, as the main challenge, the costly rectifier and inverter stations for AC/DC and DC/AC conversion, which are not required in HVAC cases, significantly add to the overall HVDC transmission cost, therefore providing a break-even distance for both technologies after which DC transmission becomes economically preferable. The break-even distance, as shown in Figure 8, varies between ~300 km and ~800 km for overhead lines and ~50 km to ~100 km for offshore/underground cable links. This variation relates to individual project conditions (e.g., MW/kV rating, transmission terrain and local policies) [29]. Meanwhile, the HVDC transmission system over long distance has remarkable technical and economic advantages compared to the HVAC system. Both HVAC and HVDC transmission technologies are technically/economically compared and summarized in Table 1.

6. CSC-HVDC vs. VSC-HVDC

HVDC converters are classified into two main categories: 1—current source converter (CSC–HVDC) or line-commutated converter; and 2—voltage source converter (VSC–HVDC) or self-commutated converters. The first commercial HVDC power transmission using CSC technology based on mercury arc rectifiers were commissioned by ABB in 1954 in Sweden. Later, the first CSC technology based on semiconductor devices, i.e., thyristors with a high power rating, became practical in 1970. Classic HVDC (CSC-based) transmission technology has been operating with large power capacity, high reliability and less maintenance in the last half-century [29,30].
Further development of semiconductor devices led to the innovation of Insulated-Gate Bipolar Transistor (IGBT) switches in the 1980s, and were introduced into the market in the 1990s [31]. The development of VSC based on IGBT switches was initiated with the implementation of its first VSC-HVDC transmission project in 1997 and continued due to its technical superiority and gradual rating development. Data from recent ABB releases show that their high-voltage IGBT modules rating ranges between 1700 V and 6500 V. The highest current withstanding capability is attributed to the 4500 V IGBT modules that justify their common use in HVDC systems [29]. The major difference between voltage source converter technology and conventional line commutated technology is that VSC HVDC systems use switching devices, such as IGBTs, that are able to switch on and off, unlike CSC that can only turn on the current. To date, in addition to its economic feasibility, the VSC type converter has brought many benefits to the improvement of HVDC operation and stability. On the other hand, LCC technology has a number of operational constraints, which limit its use. Both HVDC technologies are compared and summarized in Table 2.

7. Worldwide HVDC Projects

HVDC technology is playing an increasingly substantial role in power transmission over long distances. Considerable HVDC projects already have been put into operation or are under construction around the world. The total worldwide HVDC transmission operational capacity is projected to surpass 400 GW by 2022 [29]. About 52% of this capacity exists in Asia and is mainly influenced by firstly China and then India as the major market players. Several HVDC projects are constructed in these areas to transmit bulk power over long distances. About 22% of these global HVDC projects are in Europe.
To date, HVDC transmission is considered a promising technology and is utilized all over the world, as shown in Table 3 [36].
VSC technology has proven to be a key market competitor that has been gradually replacing CSC options. Many VSC-HVDC projects are implemented or currently under construction throughout the world. A study recently published by BNEF (Bloomberg New Energy Finance) states that from the total new projects, the share of VSC-HVDC technology could reach 65% by the next decade [29]. The first VSC-HVDC transmission technology was implemented by ABB in 1997, using IGBT valves in Sweden [31]. Table 4 summarizes the major worldwide VSC-HVDC projects from 1997 to 2021; the rest of the existing and planned HVDC projects can be found in [38,39].

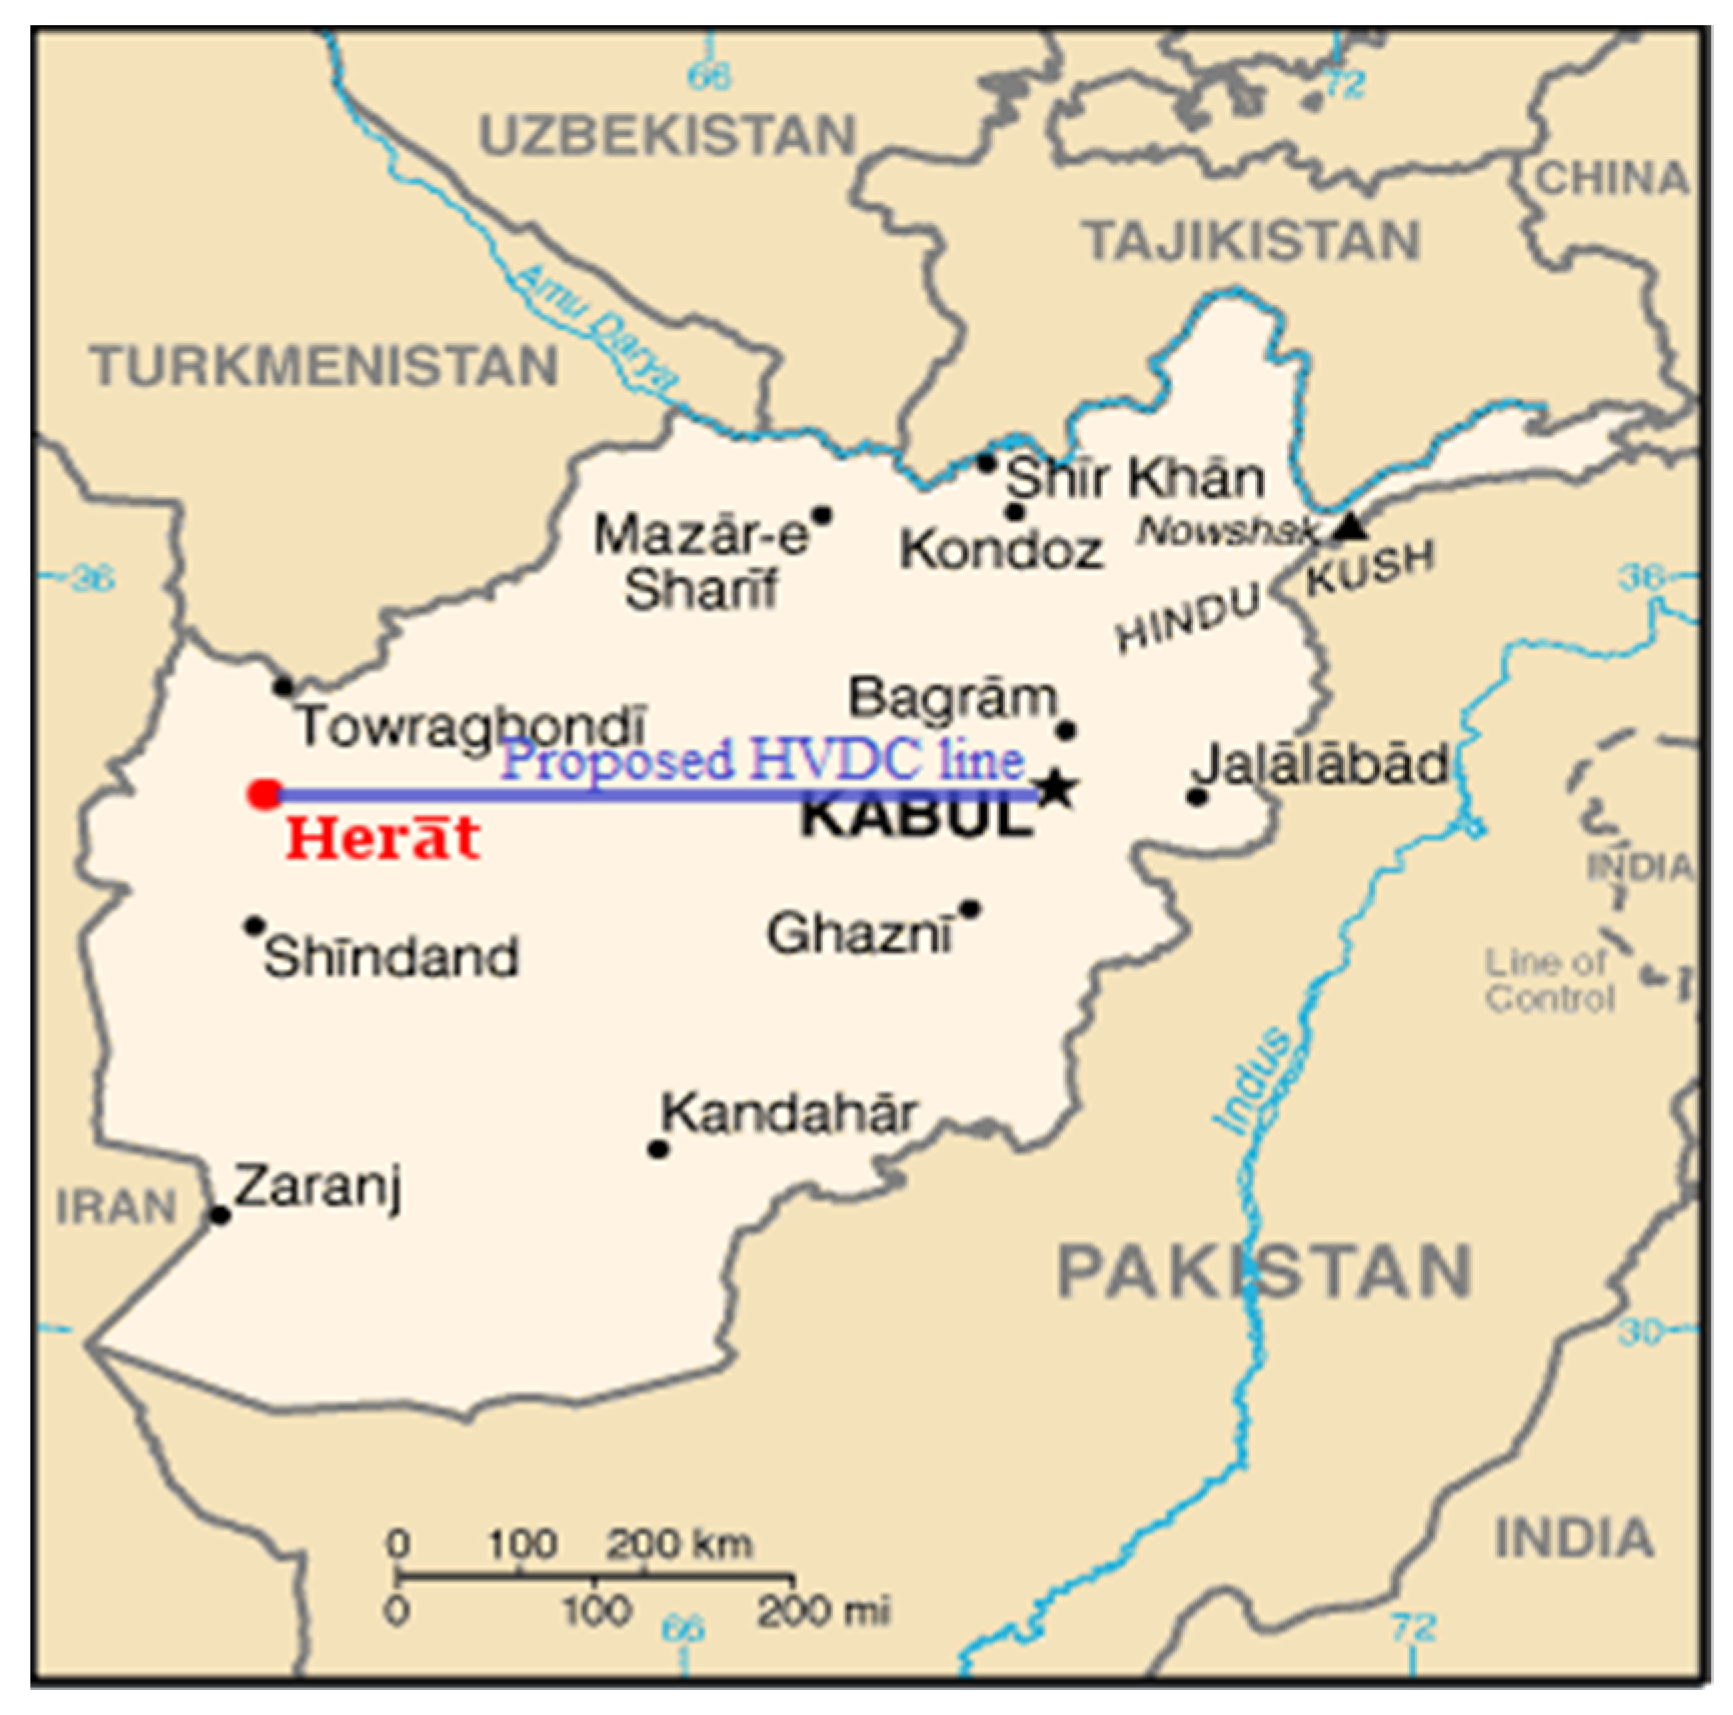
8. Proposed Transmission Line

The proposed transmission line is considered to be VSC-HVDC technology that connects the Herat province to the capital of the country—Kabul city. As shown in Figure 9, this line will transmit 1000 MW power at 500 kV voltage and stretch 640 km in distance. As the majority of the line passes through rural areas, it will have a negligible effect on the social instability. Based on population numbers, Herat is one of the largest and most important trading provinces in Afghanistan. As shown in Figure 9, it is located in the western part of the country and has a border with Turkmenistan in the north and Iran in the west [43]. Currently, Herat imports electricity from Iran.
The total feasible potential of solar and wind energy in Herat is, respectively, 28,539 MW and 18,473 MW, and the capacity factors are, respectively, 17% and 42.4% in this area [4,44]. This makes solar power and wind farms economically beneficial. Considerable wind energy potential is in the Adraskan district, which is near Herat. The electric power production potential of this district is almost nine times the current annual energy demand of the country [44].
Owing to remarkable renewable energy potential and possible socio-economic activities, the southern and western regions can be connected through an HVDC system, which can fulfill the power demand of the country and provide energy security. It is with the hope that the implementation of this transmission project will be a game-changer in energy security, providing jobs, industrial development and other socio-economic opportunities in the country.

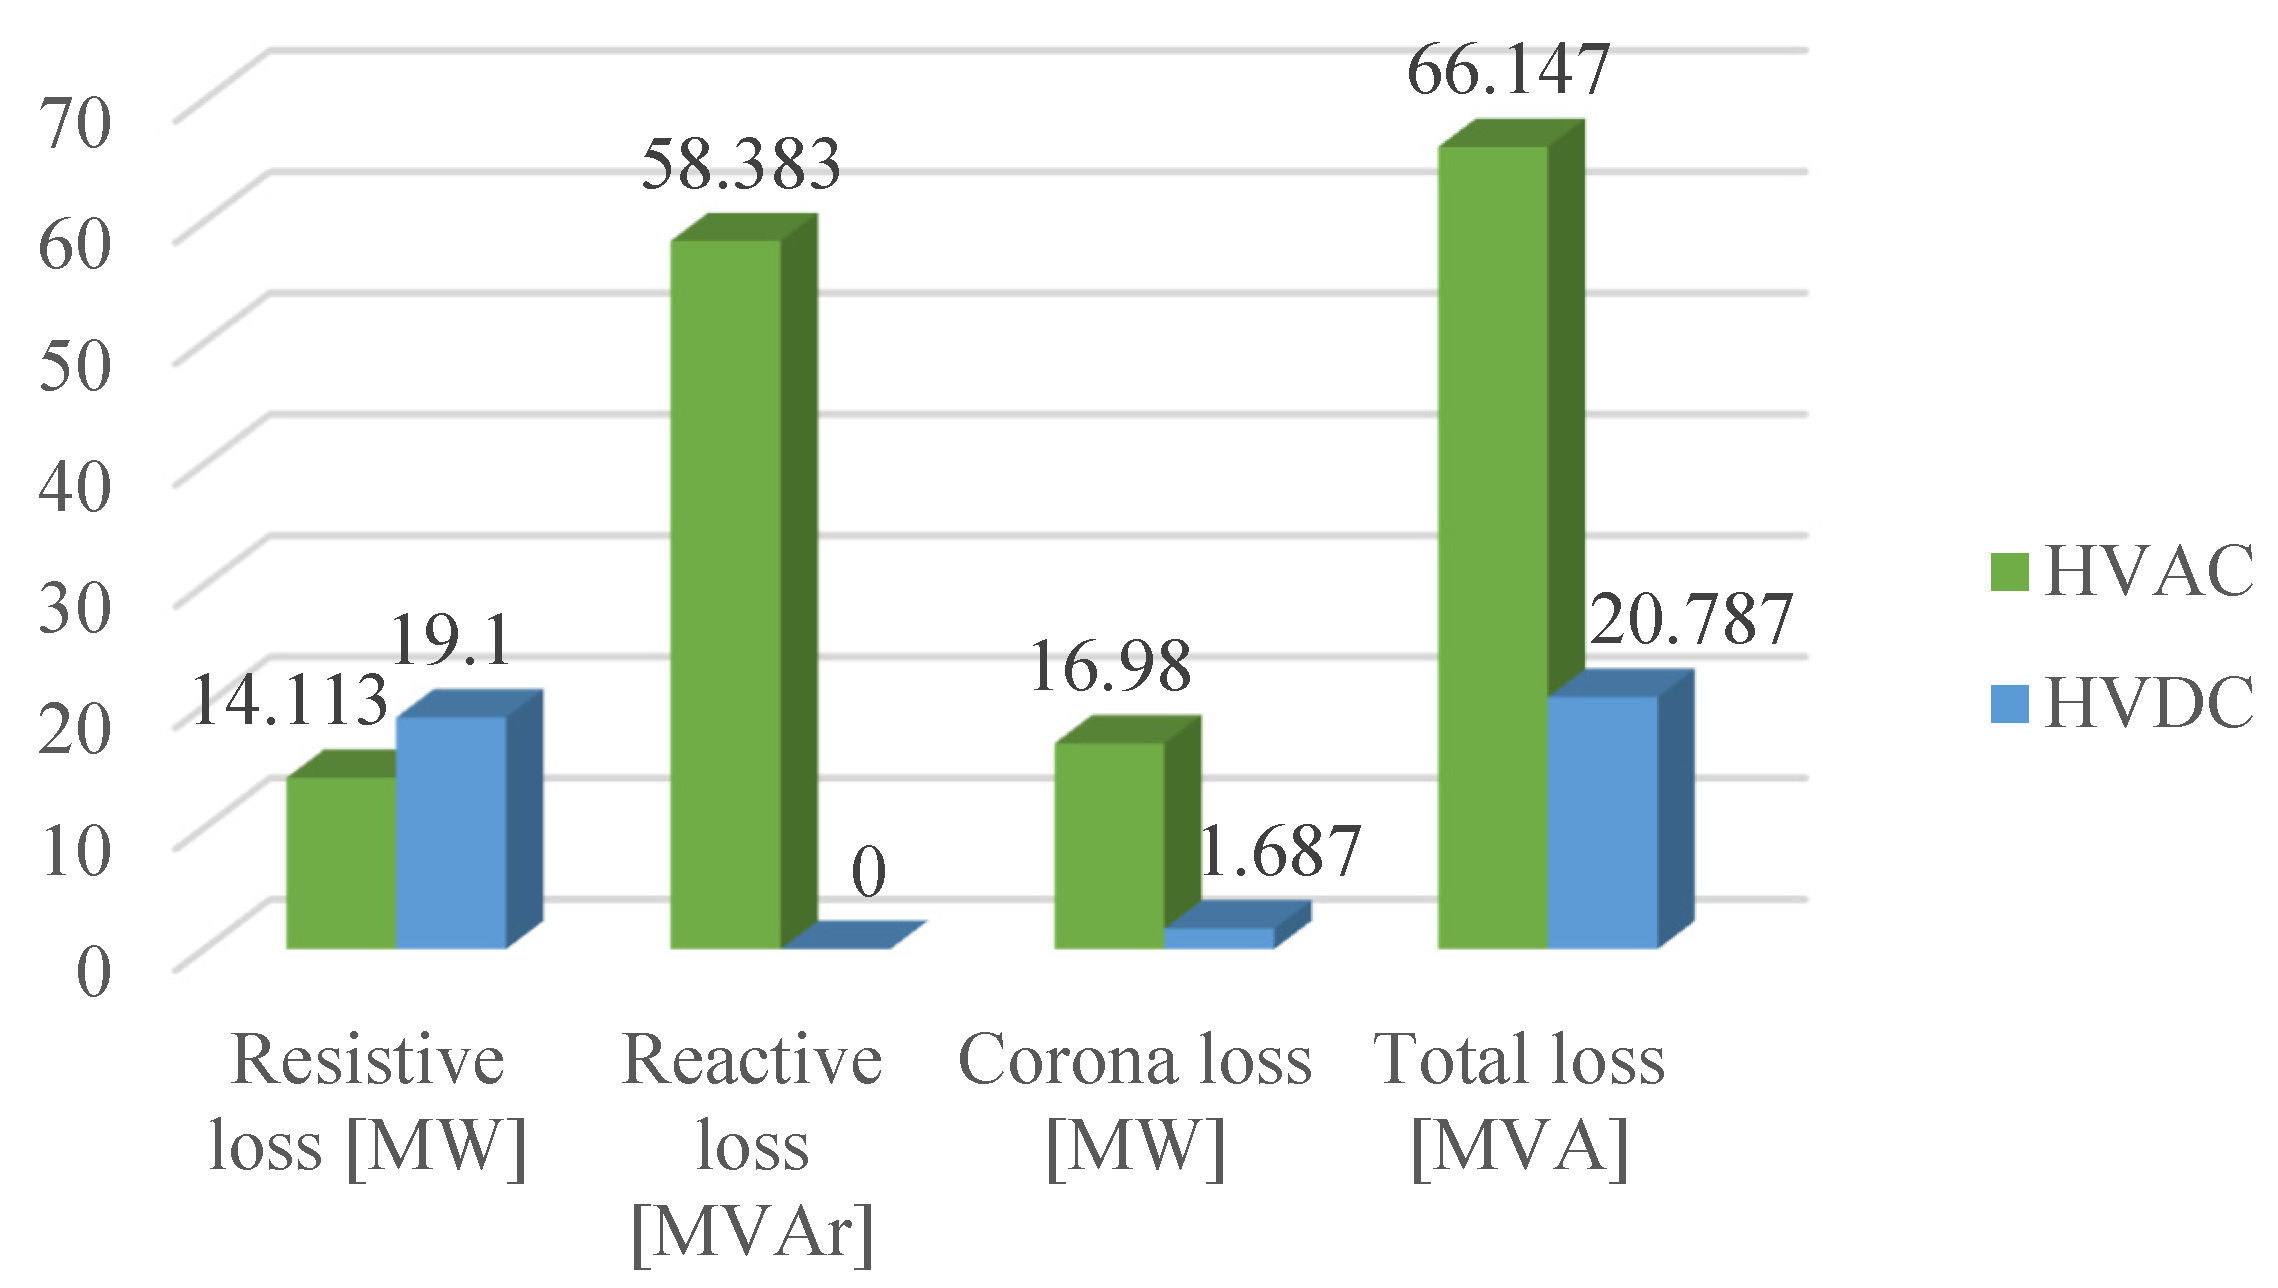
9. Technical Analysis

9.1. Resistive (Joule) Losses Calculation

9.1.1. The HVAC Line Loss

To obtain the power losses, firstly, the current of the transmission line was calculated as follows:
I l = S 3 × V l = P 3 × V l × cos φ = 1215.47   A
I p h a s e = I l 3 = 701.751   A
where S = P cos φ is the apparent power, P = 1000   MW is the rated active power,   V l and I l are the line to line (L–L) rated voltage and current, cos φ is the power factor and I p h a s e is the current per phase.   V l = 500   kV . It was assumed that the cos φ = 0.95 power factor correction is achieved and also the conductor number per phase was 4.
I 1 = I p h a s e N = 701.751 4 = 175.437   A
where N is the number of conductors per phase and I 1 is the current per conductor.
Active power loss in each phase per km was calculated as follows:
P l o s s = I 1 2 × r 0 × N = 7.351   kW / km
where r 0 = 0.0597 km is the resistance of a conductor of line per km.
The total active power loss was obtained as follows:
P t l o s s = P l o s s × n × L = 14.113   MW
where n = 3 is the total number of phases and L = 640   km is the length of the line.
The reactive power loss in each phase per km was calculated as:
Q l o s s = I 1 2 × x 0 × N = 30.408   KVAr / km
where x 0 = 0.247   Ω km is the reactance of an ACSR conductor of line per km.
The total reactive power loss was obtained as follows:
Q t l o s s = Q l o s s × n × L = 58 , 383   MVAr
The total power loss, so-called apparent power loss, was calculated as:
S t l o s s = P t l o s s 2 + Q t l o s s 2 = 60.064   MVA

9.1.2. The HVDC Line Loss (Joule Loss)

The current flow per pole in an HVDC transmission line is
I = S r a t e d 2 V r a t e d = P r a t e d 2 V r a t e d = 1000   A
where S r a t e d and P r a t e d are the rated apparent and active power and V r a t e d is the rated DC voltage of the transmission line.
The current flowing per conductor in a pole is
I 1 = I N = I 4 = 250   A
where N is the number of bundle conductors per pole, which was selected to be 4.
Resistive loss (active power or joule loss) per km for four conductors per bundle per pole for a 954 MCM ACSR conductor with 1095 A current carrying capacity was calculated as
P l o s s = I 1 2 × r 0 × N = 14.92   kW km
where r 0 = 0.05971   Ω km is the DC resistance per conductor in 20 °C.
The total resistive loss for both poles and 640 km distance were obtained as
P t l o s s = P l o s s × n × L = 14.92 × 2 × 640 = 19.1   MW
In an HVDC transmission system, the total or apparent power loss is equal to the active power loss, because the frequency and thus the reactive power is zero.
S t l o s s = P t l o s s 2 + Q t l o s s 2 = 19.1   MVA

9.2. Corona Losses

The corona loss is another factor that could have a special role in the decision for selecting HVAC or HVDC technology for bulk power transmission over a long distance. Essentially, corona loss is caused by the ionization of air molecules near the transmission line conductors. The corona does not spark across lines, but rather carries current (hence the loss) in the air along the wire.

9.2.1. HVAC Corona Loss

The formation of a corona is always accompanied by energy loss, which is dissipated in the form of light, heat, sound and chemical action. The corona factor equation was empirically derived by F.W. Peek and published in 1911. Later, the original equation was modified and showed that the total amount of power loss in a wire due to the corona effect was equal to the equation below:
P c o r o n a = 242.2 δ ( F + 25 ) r d ( V V c ) 2 · 10 5
where δ is the air density factor, F = 50   Hz is the frequency, r is the radius of conductor, d is the pole distance, V is the phase to neutral voltage of the line and V c is the critical disruptive voltage.
The air density factor is calculated as
δ = 3.92 · b 273 + t = 0.952
where b and t are the normal atmospheric pressure and temperature, respectively.
V c is calculated as follows:
V c = m 0 · g 0 · δ · r · ln ( d r ) = 256.624   kV
where m 0 is constant and equal to 1 for polished conductors, and g 0 is the reference value of the conductor field value, which depends on air density. For the normal condition g 0 = 21.2   kV / cm
Equation (14) was used to calculate the power loss due to corona loss in each phase per km of HVAC lines.
P c o r o n a = 8.844   kW
The total corona loss for three phases and 640 km distance is
P t c o r o n a = P c o r o n a · n · L = 8.844 · 3 · 640 = 16.98   MW

9.2.2. HVDC Corona Loss

In an HVDC transmission system, due to the absence of line frequency, the corona loss is considerably small. This can be also confirmed from Equation (14). The first effort in order to calculate the corona loss in unipolar and bipolar systems was made through experiments in the field, as in [45]. With some modifications for bipolar HVDC transmission lines, the corona loss can be obtained from the following equation [11].
P = 2 V · ( 1 + 2 π tan 1 2 H S ) · k c · n · r · 2 0.25 ( g g 0 ) · 10 3
where V is the DC line voltage; H is the line-ground height, which is assumed to be 27 m; S is the pole-to-pole space, which was assumed to be 16 m; k c is a constant factor, which is equal to 0.15 for a new, flat and clean conductor; n is the amount of conductor per bundle in a pole, which was four; r is the radius of a conductor; g = 30   kV / cm is the maximum electrical field of the bundle conductors; and g 0 = 21.2   kV / cm is the reference value of the conductor field value, which depends on air density.
According to Equation (18), the corona loss for a 1000 MW power transmission per km HVDC line was obtained as
P = 2.636   kW / km
The total corona loss over the 640 km distance is
P = 2.636 × 640 = 1.687   MW  
The corona loss in the case of HVAC is almost 10 times the HVDC transmission system.
To easily understand and make it visual for both HVAC and HVDC technologies, the resistive, reactive, corona and total losses are plotted in Figure 10.

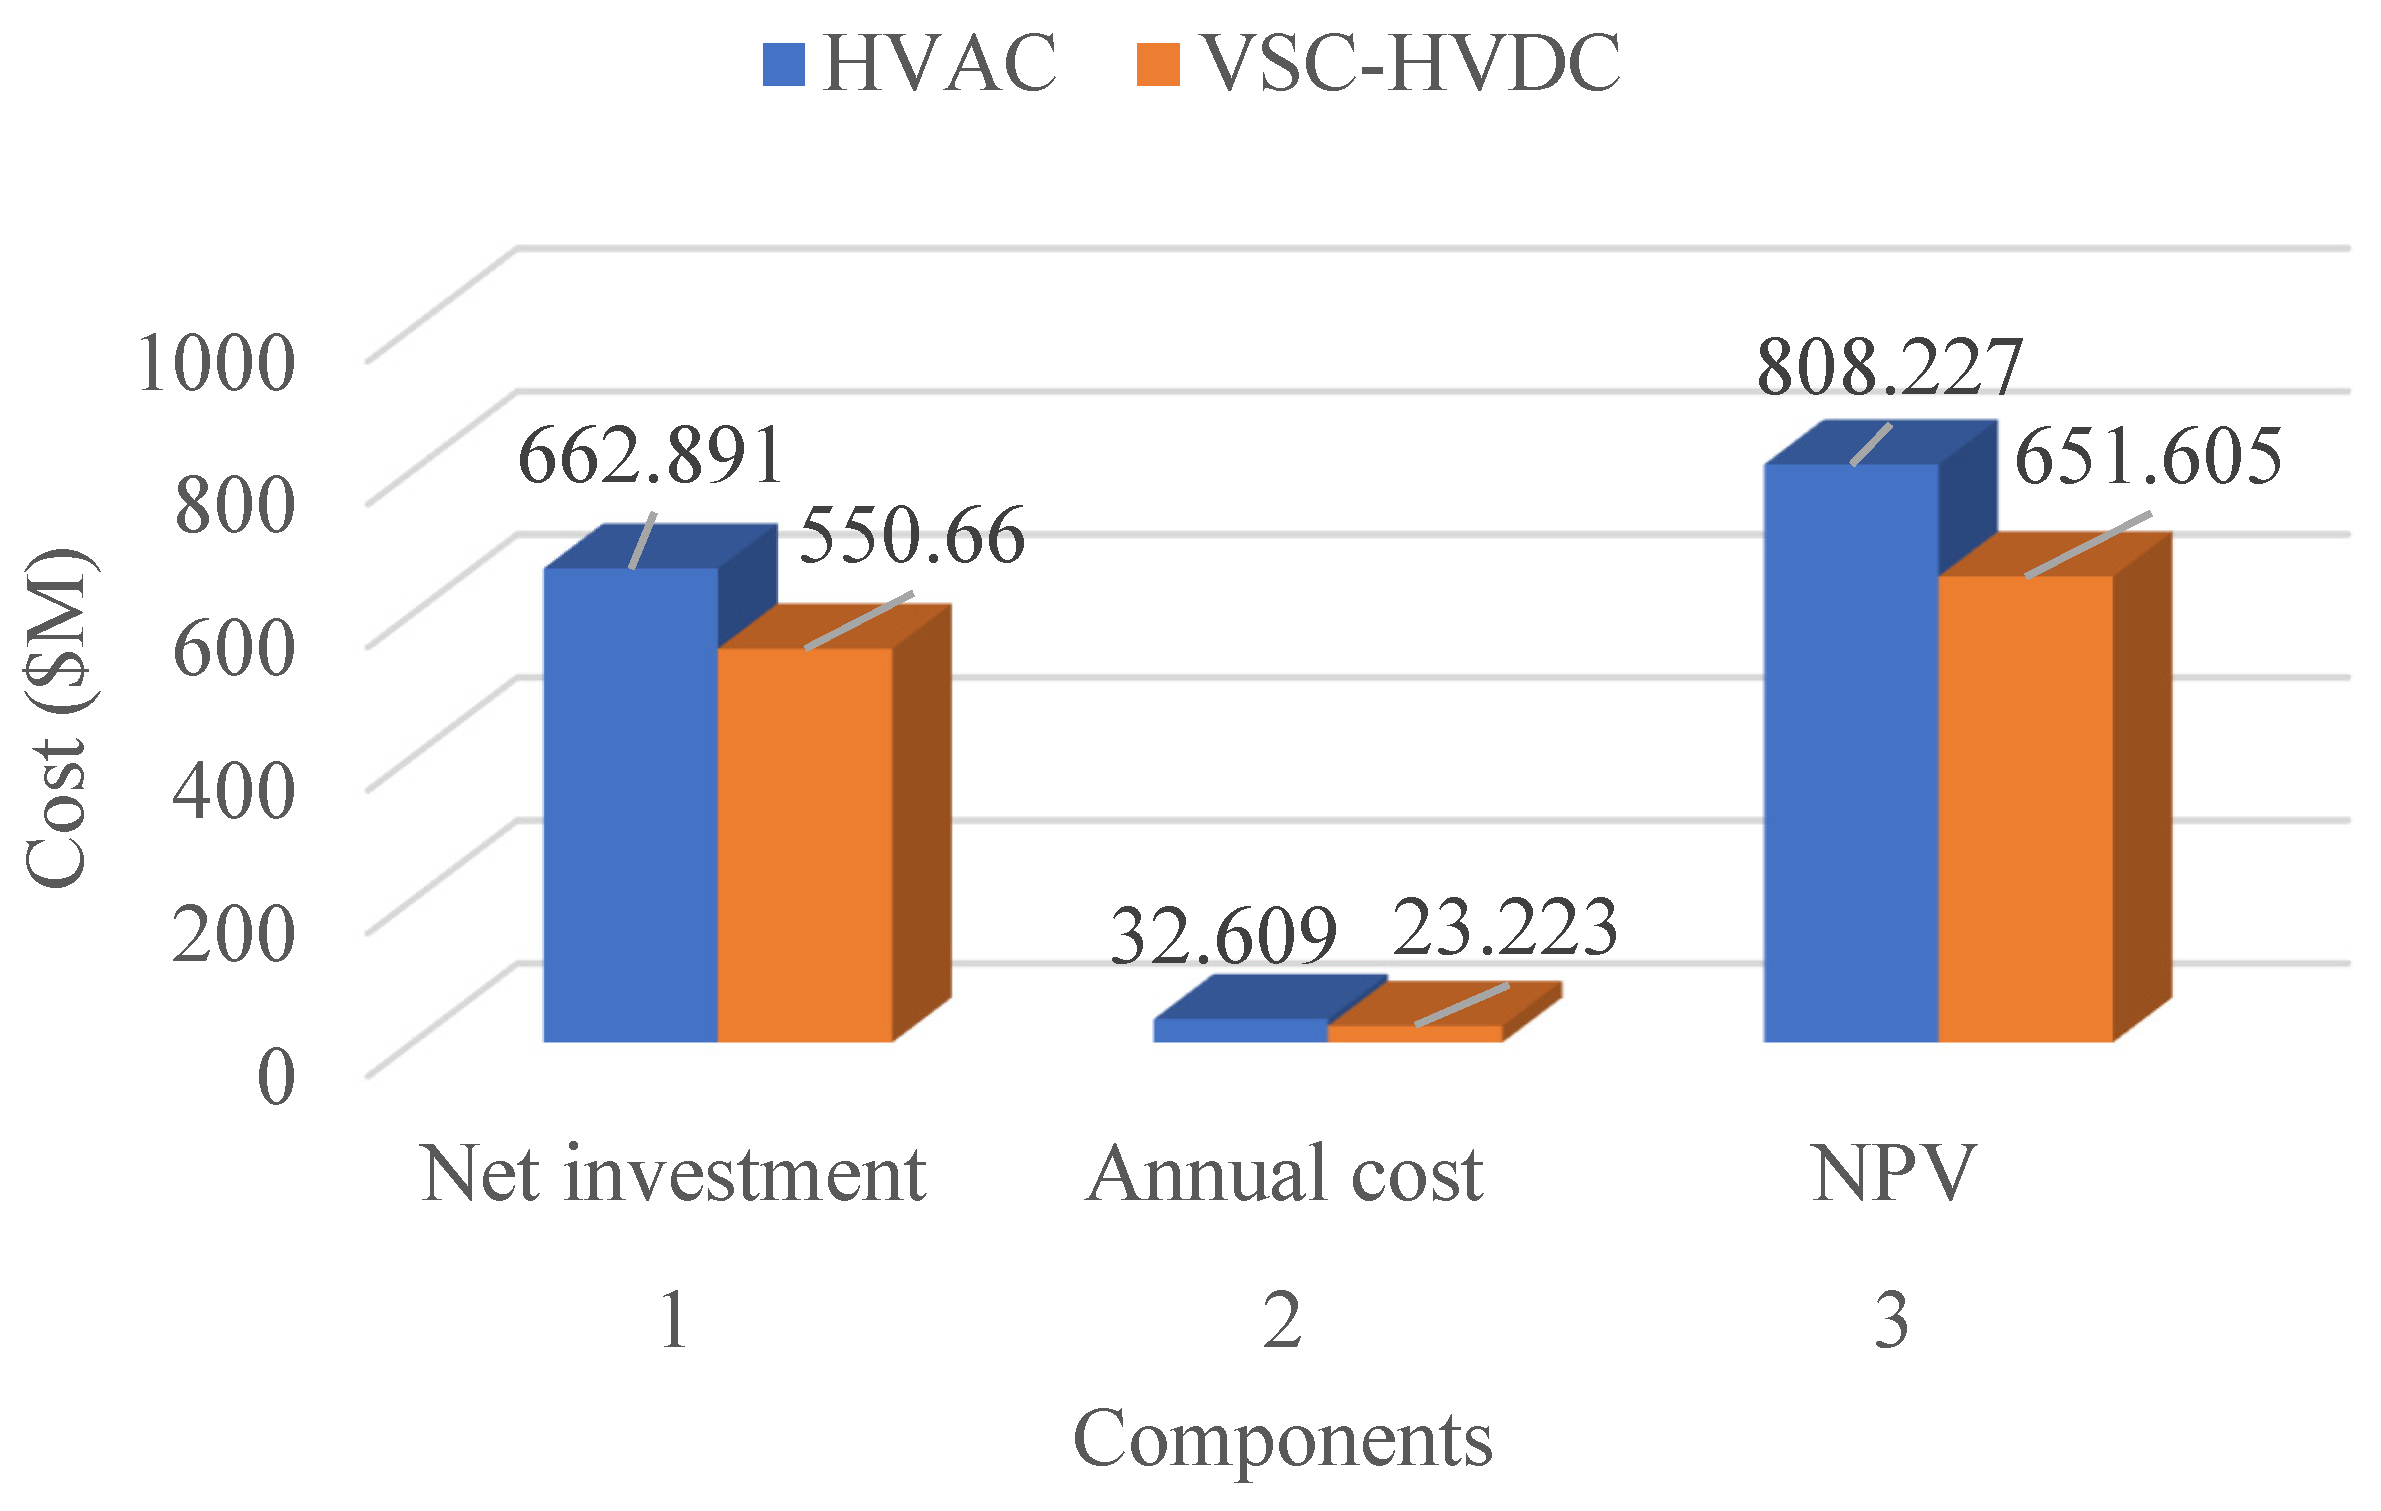
10. Economic Analysis

10.1. Investment Costs

VSC-based HVDC technology has several prominent technical advantages, as described in Section 6. In general, in VSC, both the active and reactive power is independently controllable; reactive power compensation is not required; VSC has black start capability without additional devices; etc. [5,46]. However, the economic consideration would also have a key role to identify suitable transmission technology. Hence, a cost analysis was conducted to compare the VSC-HVDC and HVAC transmission systems and ascertain the premier choice for transmission of 1000 MW power over a 640 km overhead transmission link. The 500 kV converter station was considered to be installed in both the Herat and Kabul provinces. The component and total investment cost for both the HVAC- and VSC-based HVDC transmission systems are shown in Table 5. The components are substations/converter stations, transmission lines, land costs and a reactive power compensation unit (STATCOM, only for the case of HVAC). As can be seen, although the cost of the substation of VSC-HVDC is exorbitant due to the higher expense of the power converters, the total investment of HVAC transmission technology is still significantly higher; this is because the HVAC needs a STATCOM and also its overhead line equipment is more expensive compared to the HVDC system.

10.2. Annual Costs

The total annual cost, so-called operating cost, of each HVDC and HVAC system comprises yearly maintenance and losses costs. About 0.5% of the total component capital cost is considered to be the annual maintenance cost [7]. These components include the converter or substation cost, overhead line cost and reactive power compensation unit; i.e., the STATCOM cost in the case of an HVAC transmission system. The annual maintenance cost for the HVAC and HVDC systems were calculated to be USD 2.965 million and USD 5.92 million, respectively. Due to the complexity of the VSC converter station, the annual maintenance cost is higher in the HVDC system. The losses in the HVAC system are assumed to be 5% of the total power flow [9], which was found to be USD 29.645 million. These losses include power transformers, a STATCOM and transmission line losses. In the VSC-HVDC system, the losses come from the converter station that comprises semiconductor switches, transformers and filters. These account for 3.6% (1.8% per station) of the total power flow, which is computed to be USD 17.303 million. As a consequence, the total annual cost (the sum of maintenance cost and the cost of losses) for the HVAC and VSC-HVDC systems were obtained to be USD 32.609 million and USD 23.223 million, respectively.

10.3. Discounted Cash Flow Method (DCF)

For the economic consideration, different methods could have been chosen, as shown in Figure 11 [9]. However, the discounted cash flow method, due to its time value of the money, was implemented in this study.
In this study, all the essential cash flows were calculated and discounted to find the net present values.
DCF analysis tries to measure out the value of an investment today, according to projections of how much money it will produce in the future. This applies to financial investments for investors looking to newly invest or make changes to their current trades [50].
In this study, the economic comparison of HVDC and HVAC transmission systems for a 30-year life cycle was done based on the DCF method that incorporates the investment and discounted annual costs ( D a c ). The DCF firstly utilizes the difference between the investment and annual costs; the result is net present values (NPV) for both aforementioned systems. Annual costs comprise the maintenance cost and transmission losses cost. Here, the insurance and reliability factors are neglected. The taxation rate and discount (interest) factor are, respectively, 20% and 15% in Afghanistan [51,52,53]. The DCF method is formulated as follows [7,9]:
Total   investment   cost   of   HVAC = S S c + L n c + T S c + Q C c
Total   investment   cost   of   HVDC = C S c + L n c + T S c
where S S c ,   C S c ,   L n c , T S c and Q C c are, respectively, the cost of the substation, converter station, land, transmission system (lines and poles) and reactive power compensation.
The annual cost is formulated as
C a n n u a l = M c + L c
In Equation (21), C a n n u a l is the annual cost, M c is maintenance cost and L c is the cost of losses.
NPV = Total   investment   cost   of   HVAC / HVDC + D a c
where NPV shows the net present value and D a c is the discounted annual cost.
D a c is calculated as
D a c = P × [ C a n n u a l × ( 1 T R ) ( D V × T R ) ]
P = [ 1 ( i + 1 ) t ] i
where P is the annuity factor, T R is the taxation rate, D V is the depreciation value, i denotes the discount factor and t is the life-cycle time.

10.4. Results Analysis

The results of the discount cash flow analysis are presented and discussed in this section. Figure 12 shows the net investment, annual cost and NPV for each transmission technology. According to the lifetime basis, the VSC-HVDC system is comparatively less expensive than HVAC technology. Due to the higher total investment cost and annual cost of HVAC, the NPV is also relatively higher than the HVDC transmission system. It is worth mentioning that, due to the different properties and circumstances in various projects, such as location, terrain, power rating, transmission distance, VSC converter technology option, etc., the precise cost estimation of the HVDC transmission system is difficult. However, the overall projection was obtained from the literature and already implemented projects.

11. Discussion

In this study, a VSC-HVDC transmission project was designed to transmit renewable energy (solar and wind) from the Herat to Kabul province. According to the existing literature, it is proven that the CSC-HVDC technology is more economical than the VSC-HVDC one. However, due to the advanced characteristics and technical advantages, techno-economic analysis of VSC-HVDC versus HVAC transmission was carried out in this paper. The overall comparison in Table 1 clearly verifies the usefulness and effectiveness of HVDC over HVAC transmission technology. In this paper, the resistive (active) and reactive power and corona losses were calculated as major technical parameters. As shown in Figure 10, except for resistive loss, the reactive power and corona loss of the HVAC transmission system is considerably higher; its total loss (total apparent power) is 3.18 times higher than that of VSC-HVDC technology. The reason is the non-existence of frequency in HVDC and hence reactive power loss and the need for reactive power compensators. On the other hand, as is plotted in Figure 12, in addition to its technical advantages, VSC-HVDC transmission technology is cheaper as well. It is found that the NPV of VSC-HVDC is USD 651.605 million and USD 808.227 million in the case of HVAC. Due to the absence of STATCOM equipment and the lower cost of overhead transmission lines, the NPV of VSC-HVDC is considerably smaller than that of HVAC transmission. It is worth mentioning that due to the incessant development of semiconductor devices and hence technological evolutions, the cost of VSC-HVDC (converters) technology will further decrease over time. Based on the aforementioned reasons, the proposed HVDC transmission project is techno-economically sustainable and a better choice for bulk power transmission from a rich renewable resource potential location, such as Herat, to the challenging load centers in Afghanistan.

12. Conclusions and Recommendations

Afghanistan is facing an energy crisis due to the current continuous increases in demand; the aged internal power generation stations; and insecure, unreliable and expensive power imports. Considering the huge potential of solar and wind energy in the south and western parts of the country, a techno-economic evaluation of a VSC-HVDC transmission line against HVAC is proposed in this paper. The project considered here plans to transmit 1000 MW power with 500 kV voltage over a 640 km distance from Herat in the west to the capital of the country—Kabul. From a technical perspective, VSC-HVDC is a proven technological option for bulk power transmission over long distances, having smaller losses. From an economic perspective, the DCF method shows that the VSC-HVDC system is cheaper as its net present value is much lower than HVAC technology. Hence, VSC-HVDC is proven to be a feasible and pragmatic transmission system.
For real-time implementation, further research should be carried out considering other technical parameters, the social impacts and the legal and budget requirements for this suggested future transmission project.

Author Contributions

Conceptualization, G.A.L. and T.S.; data collection, G.A.L.; methodology, G.A.L.; validation, A.N. and A.Y.; investigation, G.A.L.; resources, S.S.R. and E.R.C.; writing—original draft preparation, G.A.L.; writing—review and editing, S.M. and S.S.R.; visualization, A.Y. and S.M.; supervision, T.S.; project administration, T.S. All authors have read and agreed to the published version of the manuscript.

Funding

This research received no external funding.

Conflicts of Interest

The authors declare no conflict of interest.

References

  1. Ludin, G.A.; Matayoshi, H.; Danish, M.S.; Yona, A.; Senjyu, T. Hybrid PV/Wind/Diesel Based Distributed Generation for an Off-Grid Rural Village in Afghanistan. J. Energy Power Eng. 2017, 11, 85–92. [Google Scholar] [CrossRef]
  2. Afghanistan GDP per Capita, Trading Economics, World Bank. Available online: https://tradingeconomics.com/afghanistan/gdp-per-capita#:~:text=GDP%20per%20capita%20in%20Afghanistan%20is%20expected%20to%20reach%20570.00,according%20to%20our%20econometric%20models (accessed on 25 August 2021).
  3. Energy Supply Improvement Investment Program (RRP AFG 47282-001), Environmental Assessment and Review Framework ADB. Available online: https://ewsdata.rightsindevelopment.org/files/documents/01/ADB-47282-001_sxnXWzE.pdf (accessed on 25 August 2021).
  4. Ludin, G.A.; Amin, M.A.; Aminzay, A.; Senjyu, T. Theoretical Potential and Utilization of Renewable Energy in Afghanistan. AIMS Energy 2016, 5, 1–19. [Google Scholar] [CrossRef]
  5. Ludin, G.A.; Amin, M.A.; Matayoshi, H.; Rangarajan, S.S.; Hemeida, A.M.; Takahashi, H.; Senjyu, T. Solid-State DC Circuit Breakers and Their Comparison in Modular Multilevel Converter Based-HVDC Transmission System. Electronics 2021, 10, 1204. [Google Scholar] [CrossRef]
  6. Meah, K.; Ula, S. Comparative Evaluation of HVDC and HVAC Transmission Systems. In Proceedings of the IEEE Xplore, Power Engineering Society General Meeting 2007, Tampa, FL, USA, 24–28 June 2007; pp. 1–5. [Google Scholar] [CrossRef]
  7. Gul, M.; Tai, N.; Huang, W.; Nadeem, M.H.; Ahmad, M.; Yu, M. Technical and Economic Assessment of VSC-HVDC Transmission Model: A Case Study of South-Western Region in Pakistan. Electronics 2019, 8, 1305. [Google Scholar] [CrossRef] [Green Version]
  8. Siyal, M.A.; Maheshwari, V.K.; Memon, A.M. Techno-Economic Analysis of HVDC Transmission Line Project of China-Pakistan Economic Corridor (CPEC). In Proceedings of the 4th International Conference on Power Generation Systems and Renewable Energy Technologies (PGSRET), Islamabad, Pakistan, 10–12 September 2018. [Google Scholar]
  9. Hur, D. Economic Considerations Underlying the Adoption of HVDC and HVAC for the Connection of an Offshore Wind Farm in Korea. J. Electr. Eng. Technol. 2012, 7, 157–162. [Google Scholar] [CrossRef] [Green Version]
  10. Hafiz, K.; Shahid, A.K. High Voltage Direct Current (HVDC) Transmission: Future Expectation for Pakistan. CSEE J. Power Energy Syst. 2019, 5, 82–86. [Google Scholar] [CrossRef]
  11. Font, A.; Ilhan, S.; Ismailoglu, H.; Cortes, F.E.; Ozdemir, A. Design and Technical Analysis of 500–600 kV HVDC Transmission System for Turkey. In Proceedings of the IEEE Xplore 2017, 10th International Conference on Electrical and Electronics Engineering (ELECO), Bursa, Turkey, 30 November–2 December 2017. [Google Scholar]
  12. Larruskain, D.M.; Zamora, I.; Mazón, A.J.; Abarrategui, O.; Monasterio, J. Transmission and Distribution Networks: AC versus DC. In Proceedings of the 9th Spanish-Portuguese Congress on Electrical Engineering, Marbella, Spain, 30 June–2 July 2005. [Google Scholar]
  13. Xiang, X.; Merlin, M.M.C.; Green, T.C. Cost Analysis and Comparison of HVAC, LFAC and HVDC for Offshore Wind Power Connection. In Proceedings of the 12th IET International Conference on AC and DC Power Transmission (ACDC 2016), Beijing, China, 28–29 May 2016; pp. 1–6. [Google Scholar] [CrossRef]
  14. Yakupoglu, H.; Gozde, H.; Taplamacioglu, M.C. Technical and economic comparison of HVDC converter technologies. Int. J. Tech. Phys. Probl. Eng. 2018, 10, 25–30. [Google Scholar]
  15. Astrom, U.; Westman, B.; Lescale, V.; Asplund, G. Power transmission with HVDC at voltages above 600 kV. In Proceedings of the IEEE Power Engineering Society Inaugural Conference and Exposition in Africa, Durban, South Africa, 11–15 July 2005; pp. 44–50. [Google Scholar] [CrossRef]
  16. World Population Review. Available online: https://worldpopulationreview.com (accessed on 18 October 2021).
  17. World Bank. Afghanistan Renewable Energy Development Issues and Options; World Bank: Washington, DC, USA, 2018. [Google Scholar]
  18. Ahmadzai, S.; McKinna, A. Afghanistan electrical energy and trans-boundary water systems analyses: Challenges and opportunities. Energy Rep. 2018, 4, 435–469. [Google Scholar] [CrossRef]
  19. Safi, R.; Sharma, M.P. Energy Scenario of Afghanistan. IOSR J. Eng. 2019, 9, 50–59. [Google Scholar]
  20. ICE. Inter-Ministerial Commission for Energy, Electricity Imports. 2016. Available online: https://sites.google.com/site/iceafghanistan/electricity-supply/electricity-imports (accessed on 11 August 2021).
  21. FICHTNER GmbH & Co. KG. Afghanistan Power sector master plan. In Technical Assistance Consultants Report; Project Number 43497; Fichtner: Stuttgart, Germany, 2013. [Google Scholar]
  22. Da Afghanistan Breshna Sherkat. Central Asia South Asia Electricity Transmission and Trade Project (CASA-1000) Report; Document of the World Bank, Report No: 83250-SAS; World Bank: Washington, DC, USA, 2014. [Google Scholar]
  23. Sediqi, M.M.; Ibrahimi, A.M.; Danish, M.S.S.; Senjyu, T.; Chakraborty, S.; Mandal, P. An optimization Analysis of Cross-Border Electricity Trading Between Afghanistan and its Neighbor Countries. IFAC PapersOnline 2018, 51, 25–30. [Google Scholar] [CrossRef]
  24. Afghanistan National Renewable Energy Policy; Final Draft; Ministry of Energy and Water: Kabul, Afghanistan, 2014.
  25. Anwarzai, M.A.; Nagasaka, K. Utility-scale Implementable Potential of Wind and Solar Energies for Afghanistan Using GIS Multi-Criteria Decision Analysis. J. Renew. Sustain. Energy Rev. 2017, 71, 150–160. [Google Scholar] [CrossRef]
  26. Ershad, A.M.; Robert, J.B.; Kevin, H. Analysis of solar photovoltaic and wind power potential in Afghanistan. Renew. Energy 2016, 85, 445–453. [Google Scholar] [CrossRef]
  27. Neifer, R. Afghanistan: Addendum to the Afghanistan Power Sector Master Plan. In Technical Assistance Consultant’s Report; Project Number: 43497; Fichtner: Stuttgart, Germany, 2014. [Google Scholar]
  28. Guadalupe, A.G.; Pedro, C.R.; Antonio, G.E. Future power transmission: Visions, technologies and challenges. Renew. Sustain. Energy Rev. 2018, 94, 285–301. [Google Scholar]
  29. Alassia, A.; Bañalesa, S.; Ellabbana, O.; Adamb, G.; MacIver, C. HVDC Transmission: Technology Review, Market Trends and Future Outlook. Renew. Sustain. Energy Rev. 2019, 112, 530–554. [Google Scholar] [CrossRef]
  30. Rehman, B.; Rehman, A.U.; Khan, W.A.; Sami, I.; Ro, J.-S. Operation and Challenges of Multi-Infeed LCC–HVDC System: Commutation Failure, AC/DC Power Flow, and Voltage Stability. Appl. Sci. 2021, 11, 8637. [Google Scholar] [CrossRef]
  31. Nishioka, A.; Alvarez, F.; Omori, T. Global Rise of HVDC and Its Background. Hitachi. Hitachi Rev. 2020, 69, 458–459. Available online: https://www.hitachi.com/rev/archive/2020/r2020_04/pdf/gir.pdf (accessed on 12 January 2022).
  32. Yu, J.; Karady, G.G.; Gu, L. Applications of embedded HVDC in power system transmission. In Proceedings of the Power Engineering and Automation Conference, Wuhan, China, 18–20 September 2012; pp. 1–6. [Google Scholar] [CrossRef]
  33. Beaumont, P.; Brown, W.; Chan, S.; Deronja, A.; Fischer, N.; Hedding, R.; Houser, M.K.; Johnson, B.; Kirkham, H.; Manna, T.; et al. Impact of Voltage Source Converter (VSC) Based HVDC Transmission on AC System Protection. A Technical Report to the System Protection Subcommittee of the Power System Relaying and Control Committee. Available online: https://orca.cardiff.ac.uk/141967/1/9.a.4.pdf (accessed on 25 August 2021).
  34. Li, X.; Yuan, Z.; Fu, J.; Wang, Y.; Liu, T.; Zhu, Z. Nanao multi-terminal VSC-HVDC project for integrating large-scale wind generation. In Proceedings of the 2014 IEEE PES General Meeting|Conference & Exposition, National Harbor, MD, USA, 27–31 July 2014; pp. 1–5. [Google Scholar] [CrossRef]
  35. Hannan, M.A.; Hussin, I.; Ker, P.J.; Hoque, M.M.; Lipu, M.H.; Hussain, A.; Rahman, M.A.; Faizal, C.W.M.; Blaabjerg, F. Advanced Control Strategies of VSC Based HVDC Transmission System: Issues and Potential Recommendations. IEEE Access 2018, 6, 78352–78369. [Google Scholar] [CrossRef]
  36. Ebrahim, M.A.; Ahmed, M.N.; Ramadan, H.S.; Becherif, M.; Zhao, J. Optimal metaheuristic-based sliding mode control of VSC-HVDC transmission systems. Math. Comput. Simul. 2021, 179, 178–193. [Google Scholar] [CrossRef]
  37. Larruskain, D.; Zamora, I. Abarrategui, O.; Iturregi, A. VSC-HVDC configurations for converting AC distribution lines into DC lines. Electr. Power Energy Syst. 2014, 54, 589–597. [Google Scholar] [CrossRef]
  38. Khalid, S. Developments in the HVDC Market in 2020. Power Technology Research. 2021. Available online: https://powertechresearch.com/developments-in-the-hvdc-market-in-2020/ (accessed on 12 January 2022).
  39. List of HVDC Projects, Wikipedia. Available online: https://en.wikipedia.org/wiki/List_of_HVDC_projects (accessed on 12 January 2022).
  40. Li, Y.; Liu, H.; Fan, X.; Tian, X. Engineering practices for the integration of large-scale renewable energy VSC-HVDC systems. Glob. Energy Interconnect. 2020, 3, 149–157. [Google Scholar] [CrossRef]
  41. Siemens Energy and Sumitomo Electric Commission First VSC-HVDC Link Improving Power Quality in India. Siemens Energy. 2021. Available online: https://press.siemens-energy.com/global/en/pressrelease/siemens-energy-and-sumitomo-electric-commission-first-vsc-hvdc-link-improving-power (accessed on 16 March 2021).
  42. Transmission Intelligence Service. Tres Amigas. Transmission Project Profiles. 2018. Available online: https://www.transmissionhub.com/articles/transprojects/tres-amigas (accessed on 9 August 2021).
  43. The World Bank. Household and Enterprise Survey—Afghanistan Energy Project: Intermediary Results Report; World Bank: Washington, DC, USA, 2020. [Google Scholar]
  44. Anwarzai, M.A. Research and Analysis of Afghanistan’s Wind, Solar, and Geothermal Resources Potential. Ph.D. Thesis, Department of Electronic and Information Engineering, Graduate School of Engineering, Tokyo University of Agriculture and Technology, Tokyo, Japan, 2018. [Google Scholar]
  45. Knutsen, N.; Ilıceto, F. Contribution to the electrical design of HVDC overhead lines. IEEE Trans. 1974, PAS-93, 233–239. [Google Scholar]
  46. Belda, N.A.; Smeets, R.P.P. Test Circuits for HVDC Circuit Breakers. IEEE Trans. Power Deliv. 2017, 32, 285–293. [Google Scholar] [CrossRef]
  47. Working Group B4.46. Voltage Source Converter (VSC) HVDC for Power Transmission—Economic Aspects and Comparison with Other AC and DC Technologies; CIGRE Publications: Cigré: Paris, France, 2012; ISBN 978-2-85873-184-8. [Google Scholar]
  48. Jardini, J.A.; Nolasco, J.F.; Grahan, J.F.; Bruske, J. Impacts of HVDC Lines on the Economics of HVDC Projects. Brochure 388. IEEE Power Energy Soc. 2008, 17, B4. [Google Scholar]
  49. Transmission Cost Estimation GUIDE. Misoenergy, MTEP20, 11 February 2020. Available online: https://cdn.misoenergy.org/20200211%20PSC%20Item%2005c%20Cost%20Estimation%20Guide%20for%20MTEP20%20DRAFT%20Redline425617.pdf (accessed on 19 November 2021).
  50. Discounted Cash Flow (DCF) Definition. Available online: https://www.investopedia.com/terms/d/dcf.asp#:~:text=What%20Is%20Discounted%20Cash%20Flow,will%20generate%20in%20the%20future (accessed on 19 November 2021).
  51. Kelly, C. Worldwide Tax Summaries, Corporate Taxes 2017/18; PwC: Dublin, Ireland, 2017. [Google Scholar]
  52. ADB. Economic Indicators for Afghanistan. Available online: https://www.adb.org/countries/afghanistan/economy (accessed on 1 May 2021).
  53. Global Edge, Afghanistan Economy. Available online: https://globaledge.msu.edu/countries/afghanistan/economy (accessed on 1 May 2021).
Figure 1. Afghanistan total projected electricity demand [17].
Sustainability 14 01468 g001
Figure 2. Cost of power imports [18].
Sustainability 14 01468 g002
Figure 3. Total domestic power installed capacity.
Sustainability 14 01468 g003
Figure 4. Power demand forecast for Kabul region [21].
Sustainability 14 01468 g004
Figure 5. Combined surplus summer power available in the Kyrgyz Republic and Tajikistan [22].
Sustainability 14 01468 g005
Figure 6. GHI (global horizontal irradiance) map, Adapted with permission from ref. [25]. 2016 Elsevier.
Sustainability 14 01468 g006
Figure 7. Annual mean wind speed (m/sec) map at 50 m above the ground level [25].
Sustainability 14 01468 g007
Figure 8. HVDC vs. HVAC transmission cost.
Sustainability 14 01468 g008
Figure 9. Proposed transmission line layout.
Sustainability 14 01468 g009
Figure 10. Loss comparison of the HVAC and HVDC transmission systems.
Sustainability 14 01468 g010
Figure 11. Business decision-making procedure.
Sustainability 14 01468 g011
Figure 12. HVAC and VSC-HVDC comparison based on the DCF method.
Sustainability 14 01468 g012
Table 1. HVAC and HVDC transmission technologies: overall comparison [6,7,8,9,10,11,12].
No.CharacteristicsHVACHVDC
1Full control (active and reactive power)ImpossibleEasy
2Network connection possibilitiesOnly synchronized power systemsAny networks (different frequencies and voltages)
3Power oscillation damping NoYes
4Transmission capacityLowHigh
5Losses in over break-even distance for the same applicationHigher due to the line impedance (R + jX)
(5–10%)
Lower due to the absence of capacitive and inductive losses (only R) (2–3%)
6Reliability LowHigh
7Long-haul transmission stabilityLimitedNo limit
8Efficiency in long-distanceLowHigh
9Skin effect existYesNo
10Space requirementMoreLess
11LifetimeShortLonger due to the absence of dielectric losses
12Noise intensityHighLow
13corona and radio interferenceHighLow
14Right-of-way (ROW) and visual impactCould exceed 3 times the HVDCNarrow
15TowersLargerSmaller
16Charging current issueExistsDoesn’t exist
17Number of cables/conductors 3-phase conductors with lower individual ratingsFewer
18Costs in over break-even distance HigherLower
19Power transfer capabilityPower flow is limited by reac-tance of the line X and the operating angle between V 1 and V 2 :
P = V 1 V 2 X sin δ ;   where ,   V 1   and     V 2   are the sending and receiving side voltages.
( δ )   is   always < 30 ° due to synchronism relays.
The power flow is only limited by re-sistance of the line R :
P = V S ( V S V R ) R ;   are the sending and receiving side voltages, respectively.
Also, power per conductor in HVDC is 2 times HVAC:
P H V D C = 2 P H V A C
20Short circuit current limitationHVAC system contributes to the short-circuit current of connected AC systems. An HVDC transmission does not contribute to the short circuit current of the interconnected AC system.
Table 2. Comparison between CSC-HVDC and VSC-HVDC technologies [7,10,29,30,32,33,34,35].
No.AttributesCSC-HVDCVSC-HVDC
1Switching device Thyristor valve IGBT valve
2Commutation and its frequency range grid-commutation, 50–60 Hz Self-commutation, Up to a few kHz
3Power-flow reversal mechanism Voltage polarity reversal (slow, causes current stress) Current direction reversal (fast, adds more reliability)
4Converter station size Larger Smaller (25–40%)
5Independent control of active and reactive powerNoYes
6Reactive power demand 50–60% of rated active power None
7Typical system losses2.5–4.5%4–6%
8Filters requirements High (Expensive) Low
9Inherent reactive power control and Grid SupportNo (discontinuous control
(switched shunt banks))
Yes (continuous control (advanced PWM switching technic, and can support reactive power to the grid))
10Dynamic responseFaster Slower
11Black-start capability No Yes
12AC side fault handling capability Lower (Line-Frequency Dependent) Higher (MVAR support/black Start)
13DC side fault handling capability Higher (DC reactor/short-circuit failure) Lower (high di/dt rate)
14AC and DC side harmonicsHigher Lower
15Maximum available rating12,000 MW/±1100 kV2000 MW/±500 kV
16Multi-terminal HVDC suitability Limited Highly suitable
17Stations cost Lower Higher
18Scheduled maintenanceTypically < 1%Typically < 0.5%
19AC connectionsLimited to medium and high capacity circuits.Electrically can be connected to weak networks
Table 3. Worldwide HVDC projects by region [36,37].
RegionNumber of ProjectsHVDC Line/Cable Length (km)Total Capacity (MW)
North America2966,94275,150
Europe23577220,220
China and India3360,561266,700
Others1225,12037,110
Total97118,445399,180
Table 4. Summary of the major VSC-HVDC projects in the world [7,29,31,32,39,40,41,42].
No.Name of the ProjectTotal Line/Cable Length (km)DC Voltage
Rating (kV)
Power Rating (MW)Year
1Hellsjön-Grängesberg1018031997
2Terranora interconnector59801802000
3Eagle Pass, Texas Back to Back 138362000
4Tjæreborg4.3972000
5Cross Sound Cable401503302002
6Murray link1771502202002
7HVDC Troll7060802004
8Estlink1051503502006
9NordE.ON 12031504002009
10HVDC Valhall292150782009
11Trans Bay Cable882004002010
12Caprivi Link9705003002010
13HVDC DolWin11653208002013
14HVDC HelWin11302505762015
15SydVästlänken26030012002015
16HVDC NordBalt4503007002015
17Skagerrak 42445007002015
18Interconexión Eléctrica Francia-España (INELFE)64.5 32020002015
19DolWin21353209002016
20Zhangbei81850030002019
21Chongqing-Hubei171142050002019
22Tres Amigas SuperStation48.3 34550002021
23Siemens and Sumitomo joint project of India26332020002021
Table 5. Investment cost comparison [47,48,49].
ComponentsTransmission System Costs (USD Million)
HVAC SystemVSC-HVDC System
Substation260340
Land use7070
STATCOM143-
Overhead system189.891140.66
Total662.891550.66
Publisher’s Note: MDPI stays neutral with regard to jurisdictional claims in published maps and institutional affiliations.

