1. Introduction
As a basic space for resident leisure and recreational activities, outdoor public open space (POS) in urban communities provides multiple functions, such as improving the quality of the community environment, providing leisure and recreational places, and helping residents lead healthy lifestyles. As such, it is closely related to the physical and mental health of residents. The Shanghai Urban Master Plan (2017–2035) aims “to build a 15-min living circle based on urban and rural communities, optimize the community living, employment, and travel environment, with a coverage rate of about 99% for community public service facilities within a 15-min walking distance, build a high-quality public space network, and increase the independent public open spaces used by squares and parks so as to fully meet the basic living needs of residents, with 90% of public open spaces (parks and squares of 400 m
2 or more) in urban and rural communities within a 5-min walking distance” [
1]. Though the number of POS in Shanghai’s urban communities continues to increase, it still cannot fully meet the needs of community residents, so the communities still face many problems in daily recreation.
Research on urban community POS has been based on park design and equality assessments [
2,
3,
4,
5,
6,
7,
8], including research on space vitality, analysis of spatiotemporal characteristics of POS, analysis of perceived satisfaction of recreation, influencing factors, and the efficiency of functions. Existing studies have shown that the elements impacting the use of POS in urban communities can be divided into two types: site elements and user elements [
9]. Site elements include space characteristics, environment, and facilities. User elements include gender, age, occupation, and preference [
9]. Urban communities’ recreational attractions, the spatiotemporal characteristics of their use, and influencing factors are multifaceted. Consider the structural pattern and spatiotemporal differentiation characteristics of space use at a macro scale, recreational standing time in POS and types of spaces attractive to residents at the meso scale, and residents’ preferences for specific environments at the micro scale [
10]. According to the scale of the research, the main research methods used have been analyzing cell phone signaling big data, ArcGIS and kernel density analysis, geodetector data analysis, path tracking, and eye-movement analysis techniques [
11]. The analysis by big data pays more attention to general behavioral law, but it cannot be used to obtain the recreational behavior of the elderly and children, as they may not use cell phones. The path tracking method shows the distribution and standing time of residents, which reflect the regularity of POS use and residents’ leisure preferences [
12]. It can verify the spatiotemporal characteristics of space use.
Therefore, to explore the relationships between space characteristics and space use demands in urban communities by taking POS (e.g., green spaces, squares, streets) in urban communities in Shanghai as examples, this study analyzed the spatiotemporal characteristics and recreational attractions of POS through space use intensity analysis and geodetector software. The results were verified by the path tracking method. The findings provide a basis for the optimization of POS in urban communities.
2. Materials and Methods
In contrast to private spaces, POS in this study refers to outdoor spaces in urban communities that provide services for residents in daily life [
13]. It includes varied spaces for leisure activities, such as green spaces, squares, and avenue [
14,
15,
16]. Such spaces are important for hosting residential leisure and recreational activities.
Based on the goals of the Shanghai Urban Master Plan (2017–2035) for communities, a study of the Shanghai leisure system classified POS into three major categories and 11 subcategories, the latter including urban-level and community-level POS, playgrounds and activity green spaces, open subsidiary green spaces, recreational assembly squares, traffic squares, affiliated squares, commercial leisure streets, ecological leisure streets, cultural leisure streets, and complex streets [
17]. Moreover, the POS structure was divided into three types: single-core, multi-core, and axial (
Figure 1) [
17]. The single-core model refers to one large-scale POS in the center of the community. The multi-core model refers to a POS structure with two or more nodes in the region, such as parks and squares. Finally, the axial model refers to POS distributed continuously so as to form a belt [
17].
2.1. Study Sites
To study the relationships between POS and residential use demand in urban communities with different locations and structures, urban communities with areas of 1.5–2 km
2, populations of about 10,000 residents, and about 90% of POS within 5–15 min walking distance were selected from the central city, a suburb, and the outskirts of Shanghai (i.e., the Ruijin community in Huangpu District in the city center, the Xincheng community in Minhang District in a suburb, and the Fangsong community in Songjiang District in the outskirts) (
Figure 2). By population census, the Ruijin community has the highest proportion of older people (20.5%), the Xincheng community has the highest proportion of middle-aged people (66.3%), and the Fangsong community has the highest proportion of adolescents (25.1%) (
Table 1) [
18].
2.2. Methods
2.2.1. Data Collection through Tencent Travel Public Terminal
The visitor volume data of community parks, recreational squares, and recreational streets were obtained from the Tencent Travel public terminal from 22 August 2018 to 26 August 2018, including working days and weekend days. At the same time, the big data were combined with behavioral observation data, and the observation times were 7:00–9:00 a.m., 9:00–11:00 a.m., 11:00–13:00 p.m., 14:00–16:00 p.m., 16:00–18:00 p.m., and 18:00–20:00 p.m., for a total of six time periods.
2.2.2. Points of Interest and Kernel Density Estimation
Based on the open map points of interest (POI) and with the help of the Cat’s Eye app, the POI data were crawled, cleaned, classified, and shown. Cat’s Eye was China’s application to combine intelligent technologies with investigation data [
19]. By using a user-friendly WeChat interface and adopting open-source datasets and algorithms of image segmentation and target detection, such app can recognize the required information from site photos taken by investigators. For example, pedestrians in given pictures can be detected and counted in seconds by behavioral observation [
19]. When we upload the photos, the basic information can be selected and edited, including location, time, and type of human behavior, spatial settings, facilities, and amenities of the landscape. Then, the data of visitors’ volume can be exported.
At the same time, based on the data shown in Cat’s Eye, a geodatabase of visitors’ volume was established in the ArcGIS platform. The areas with a high aggregation of residents’ POI in three urban communities were visualized using kernel density estimation (KDE) [
20]. Combined with the calculation of the average daily visitors, they reflect the use intensity of POS in different urban communities.
POI reflects the distribution of POS that the residents prefer, such as green space, squares, commercial squares, facilities, and roads. When the POI results were overlaid with the map of POS in communities, it was found that the areas with a high aggregation of POIs were mainly community parks, commercial squares, and space around schools and hospitals.
Based on POI analysis results, the use intensity of POS in communities was used to indicate the space vitality. The average daily space vitality of residents in each type of POS (green spaces, squares, and roads) for six time periods was calculated as follows:
where P
UI is the intensity of public space use by visitors (person/m
2), P
UN is the total number of average daily visitors (person), and P
A is the area of POS (m
2).
2.2.3. Stagnation Points to Verify Attraction of POS
The space vitality and attraction of the POS, based on OPI and kernel density estimation (KDE), indicates the spatiotemporal characteristics of POS in communities. The results could be further verified by behavioral observation, such as the stagnation point method and path tracking [
21]. The stagnation point is a site where residents do activities such as stopping, resting, and exercising, which occurs when they are engaged in leisure and recreational activities. The occurrence of stagnation points indicates a visitor’s spontaneous behavior and preferences [
10].
Taking the Fangsong community as an example, based on the use intensity of POS, the distribution of stagnation points could be analyzed theoretically.
GPS path analysis was applied to track residents’ recreational behavior and verify the rationality of theoretical stagnation points. We calculated the standing time of each point and supplied the new points where residents stayed for recreation [
10].
2.2.4. GPS Path Tracking to Verify Kernel Density Analysis
The GPS instrument (GPS-MT 90) was set to record spatial geolocation data at 1-min intervals to track the paths of residents within the community. Then, 1200 residents were selected for path tracking, which represented 10% of the residents in the community. A total of 1200 GPS sample data points were obtained through the behavioral tracking survey from August 2018 to September 2019. Among them, 400 samples were from residents between 7 to 22 years old, 400 from those 23 to 59 years old, and 400 from those older than 60 years. The obtained valid data were imported into ArcGIS 10.0 software to obtain a behavioral trajectory schematic of the community recreation residents [
22].
2.2.5. Behavioral Observation to Verify Stagnation Points
By behavioral observation for a week in each stagnation point, the average number of residents and time periods of recreation could be obtained. The sites with a staying time of more than 5 min could be considered staying stagnation points [
23]. The periods of time were divided into four sub-periods during which residents’ activities were concentrated: A, 7:00–8:00, B, 9:00–10:00, C, 15:00–16:00, and D, 17:00–18:00. The validation of the stagnation points was based on Equation (2) [
24]. If K was greater than 1.5, the rational existence of the stagnation point was verified (
Table 2).
here, K is the comparison coefficient (K) between the density of recreation residents of each stagnation point and the density of residents to the POS in the whole community. ρ (person/m
2) is the density of recreation residents at a stagnation point that is the number of residents per unit area staying at the stagnation point. The average density of recreation residents in the whole community is the ratio of the total number of residents in the community to the area of POS in each time period, recorded as ρ
0 (person/m
2).
2.2.6. Geodetector for Analyses on Influencing Factors
The effectiveness of external factors was examined by geodetectors to determine the influence on the use of POS. To explore the correlation between POS area, land-use composition, accessibility, transportation convenience, and the use intensity of POS, the use intensity was added to the geographic distribution layer of external influencing factors in the software to determine the discrete variance between the use intensity and influencing factors [
25].
Data collection and organization: Independent variables, such as POS area, POS area for each resident, proportion of residential land use, proportion of commercial land use, population density of residents, and the accessibility and convenience of transportation, needed to be discretized using the K-means classification algorithm.
Pedestrian accessibility was estimated by ArcGIS to calculate the minimum cumulative resistance value of each POS to residential areas on foot within the service radius of 1.0–3.0 km [
26]. We assigned values to different levels of roads. As the preferred walking time of residents was within 20 min [
27], the resistance value assigned to walking over 20 min was level 1, 10–20 min corresponded to level 2, and 1–10 min corresponded to level 3.
Sample read-in software: The sample data were input into the geodetector software to measure the influence values P (
Table 3) of the factors (
Table 4) on the use intensity of POS [
28].
3. Results
3.1. Temporal Characteristics of POS Use in Urban Communities of Shanghai
Figure 3 shows the relative activity levels (visitor volume every hour in one day) in the POS (green areas, squares, and streets) in three communities. There was no regularity in the POS usage of residential recreation time. However, the periods for the peak of relative activity in the POS of the three communities were different. Behavioral observation showed that the relative activity in parks and commercial squares was greater than that on recreational roads.
The Ruijin community in Shanghai’s Huangpu District is located in the center of the city, close to transportation hubs, with a high population density and high pedestrian flow. There are several pocket parks, community parks, recreational squares, and boulevards in a multi-core structural pattern, which are widely distributed near commercial buildings, transportation access points, and other public services, and offer high pedestrian accessibility. The average daily relative activity of green spaces, recreational squares, and roads in POS was much higher than that in other communities.
Figure 3a shows the three peaks of daily relative activity in the morning (6:00–8:00, 10:00–12:00) and afternoon (16:00–18:00). In contrast, the line chart of the relative activity on the weekend days has only two peaks, which is in line with residents’ morning exercise and shopping mall business hours (7:00–10:00, 15:00–19:00).
The average daily relative activity in the POS of the Xincheng community in Minhang District was less than that of the Ruijin community in the city center and slightly greater than that of the Fangsong community in the suburban new city. The relative activity in the afternoon (16:00–20:00) was slightly greater than that in the morning (10:00–13:00) (
Figure 3b). The only park in the Xincheng community is centrally located, with a commercial recreational square, having a single-core structure pattern. In addition to the morning walkers, more residents chose to visit the park and commercial square in the afternoon for recreational activities, resulting in peak usage in the afternoon.
The line chart of
Figure 3c shows that except for the recreation square, which has a clear peak, the relative activity line chart of parks is relatively flat in the Fangsong community. Among them, the relative activities were ranked as recreational squares > community parks > recreational streets. For example, one peak occurred on weekdays during shopping mall operation (10:00–13:00), and the peak in the afternoon (16:00–21:00) was higher than that in the morning. The community park (Songjiang Central Park) has a large area, running through the community like a belt and connecting several communities, with an axial structure pattern. Additionally, there are many leisure activity spaces in the residential area around the park.
3.2. Spatial Characteristics of POS in Urban Communities in Shanghai
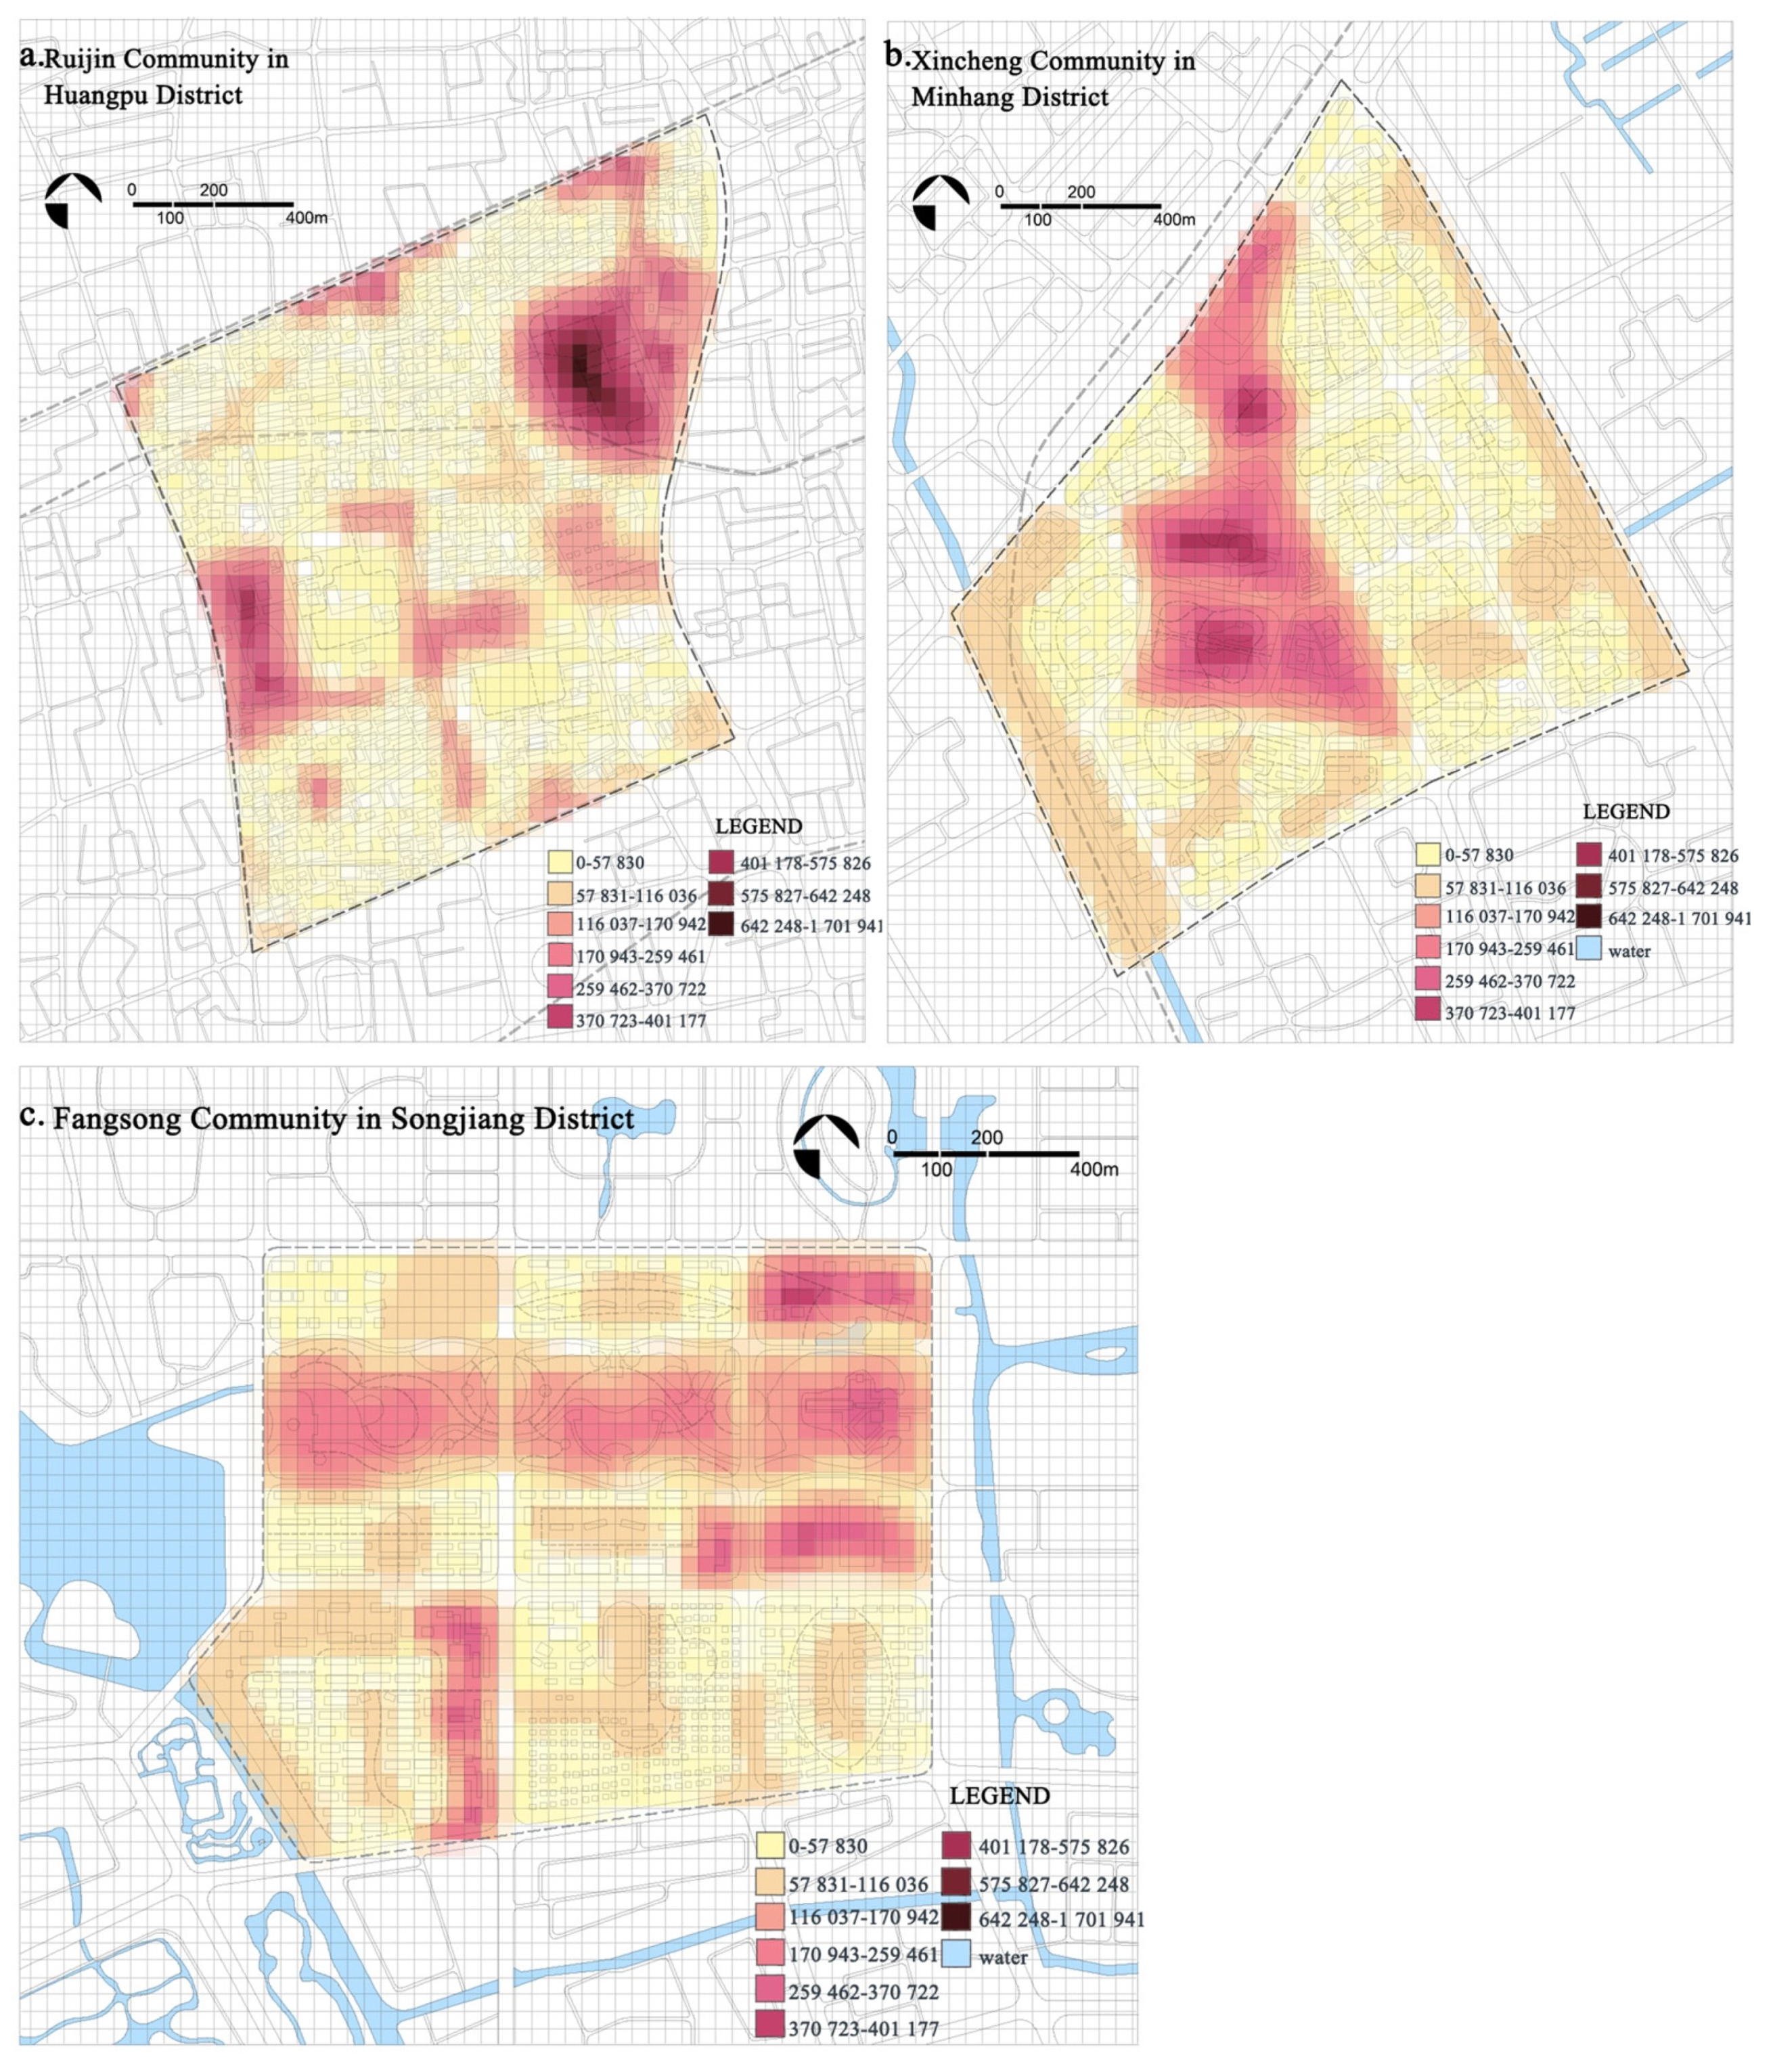
As the results by KDE in
Figure 4 show, there were significant differences in the use intensity of POS in the three communities. The use intensity of POS in the Ruijin community, located in the center of Shanghai, was significantly higher than those of the communities located in a suburb and the outskirts of the city. The use intensity in the central area was slightly higher than that in the peripheral areas of the community. For example, there were more than two scattered POS with high values of use intensity in the Ruijin community, which were the Fuxing community park, Yulan and Shaoxing pocket parks, Paris Spring commercial square, and streets, showing a multi-core structure pattern. This also shows the recreational attraction of those POS, indicating that residents prefer to aggregate in those POS for daily recreational behaviors.
Unlike the multi-core structure of the Ruijin community, the Xincheng community in the suburban Minhang District had a relatively low use intensity of POS, showing a single-core structure pattern. The high-density cores were clustered at the center of the Xincheng community, which is a recreational area formed by the commercial square and community parks. Around the cores, there is residential land. The green space in the residential area serves the daily recreational functions. However, the area is limited.
The use intensity of the POS in the Fangsong community, located in the outskirts of Shanghai, was much less than in the other communities. The belt-shaped cores with high use intensity were scattered and striped, as were parks (Songjiang Central Park) and the squares surrounding them. The green space ratio was high (45%) for residential land around the park, serving as a POS with diverse recreational functions. The large-scale municipal parks around the Fangsong community, such as Basketball Park, disperse the residents present at them.
3.3. Verification of Attraction of POS by Stagnation Points
3.3.1. Distribution of Theoretical Stagnation Points
According to the service functions of POS in communities, stagnation points are classified into five types: ecological, landscape, living, facility, and commercial space stagnation points [
22]. Based on the results of the previous analysis of the spatiotemporal characteristics of POS, the distribution of theoretical stagnation points was derived (
Figure 5a). However, the rationality of the staying points had to be further revised, supplemented, and verified by behavioral observation data and GPS path tracking.
As can be seen in
Table 2, the average K value of each stagnation point was 3.99–20.05, thereby verifying the rationality of the theoretical stagnation points.
3.3.2. Verification of Stagnation Points Based on Behavioral Observation
Through behavioral observation, the numbers of residents staying at each station for 5, 10, 15, 20, 30, and 60 min per day were counted (
Figure 6a). The numbers of residents staying per day at the stagnation points were used as the main classification basis to group and determine the levels of stagnation points (
Figure 6b). In the figure, the stagnation points could be classified into four levels: core, medium, general, and secondary. According to the principle of stagnation point classification, the higher the level of a stagnation point, the greater the recreational attraction, and the higher the possibility of visitor aggregation [
22].
The 55 stagnation points in the Fangsong community were classified into four levels (
Figure 5c). As can be seen in the figure, there were four core stagnation points in the Fangsong community, which were mainly distributed at the main entrance of the community park, in the squares of the community activity center, and in the grassland. The six medium stagnation points were concentrated at the secondary entrance of the community park, in recreational squares with facilities, and in open and semi-open viewing platforms. Additionally, 25 general stagnation points were evenly distributed in commercial squares, recreational streets, playgrounds, and fitness sites in residential area. Moreover, 20 secondary stagnation points of level 4 were scattered in the entrance spaces of residential communities, green space next to houses, street-side green spaces, and POS with slightly less accessibility. The results of the classification of the stagnation points are generally consistent with the analysis of the use intensity of POS.
3.4. Analysis of External Factors Influencing POS Use in Communities
The results of kernel density analysis and space use intensity analysis indicate that there are significant differences among the POS in the three communities. Studies have shown that the factors influencing the recreational attraction of POS include both site and user elements, such as the POS area proportion, POS area for each resident, pedestrian accessibility, transportation convenience, population density, commercial facilities, and residential land proportion [
24,
25]. The effectiveness of external factors was examined by geodetectors to determine the influence of the above factors on the use of POS [
25].
As
Table 3 shows, the influences of external factors on the use intensity of POS in communities (P value) were in the following order: percentage of POS area (0.30) > pedestrian accessibility (0.29) > population density (0.26) > percentage of commercial land (0.23) > area occupied per capita (0.21) > percentage of residential land (0.19) > transportation convenience (0.17). As a result, among the external influencing factors, the use intensity of POS was the most influenced by the percentage of POS area and pedestrian accessibility. The service radii of POS were limited. The edges of the community are not easily accessible for pedestrians and tend to exceed the fatigue limit distance of walking, leading to a low frequency of space usage.
Factors such as population density, the percentage of commercial land, the area of POS per capita, and the percentage of residential land had the second highest levels of influence on space-use intensity. The squares attached to commercial facilities in communities could effectively meet residents’ daily leisure and recreation needs by increasing the area of POS occupied per capita.
Among the seven main external influences, transportation convenience (car, subway, and bus) had the least influence on residents’ leisure and recreation behavior in POS, owing to the fact that the service radius of a POS can cover more than 60% of the whole community, and the leisure and recreation activities of residents require short-distance travel. In addition, high car travel costs, inconvenient parking, and low convenience are inconsistent with the purpose of daily leisure in POS.
4. Conclusions
To analyze the relationships between the space characteristics of POS and the use intensity of residents in urban communities, behavioral observation was used to describe the temporal characteristics of POS use. Spatial features of use intensity of POS were explored through data of POI, obtained by Cat’s Eye APP, and KDE. To verify the recreational attraction of POS, stagnation points were tested by GPS path tracking and behavioral observation.
The results indicate that there is a difference in the spatiotemporal characteristics of POS use among the Ruijin, Xincheng, and Fangsong communities. Peaks of pedestrian activity occur at different times and in different spaces. The heat maps of POI and use intensity of POS in communities in the urban center, a suburb, and the outskirts of Shanghai show multi-core, single-core, and axial structural characteristics.
In addition, the recreational attraction of POS was verified by the results of resident path tracing, behavioral observation, and stagnation point distribution. The results of POI and space use intensity analysis were supplemented by five stagnation point categories: ecological space, landscape space, living space, facility space, and commercial space. The results of the stagnation point classification of the Fangsong community are generally consistent with the results of use intensity, as the heat map showed, which also verifies the differences in the recreational appeal of POS to residents.
The influences affecting the use intensity of POS include the area proportion, per-capita POS area, pedestrian accessibility, transportation convenience, population density, proportion of commercial land, and proportion or residential land. The results of the geodetector analysis indicate that the POS area proportion, pedestrian accessibility, and population density are the most important factors influencing the use intensity and attraction of POS in the community, followed by indicators such as the proportion of commercial land and the POS area occupied per capita.
5. Discussions
The POS in communities may promote social interaction among residents, which is beneficial for interpersonal interaction, and has a positive impact on health [
29]. The selection of the three community samples in this study was representative of Shanghai city, with three structural patterns of POS: single-core, multi-core, and axial patterns.
The single-core POS structure pattern presents as a radial network structure with recreational streets connecting the centers and sub-centers composed of community parks and squares, such as the Xincheng community. The single-core center had a strong attraction for recreation residents, and the service radii of the centrally located parks and recreation squares were limited, resulting in the uneven use frequency of POS in urban communities [
30].
The multi-core POS structure pattern presents as a complex network structure with leisure streets connecting multiple leisure and recreation centers and sub-centers, as is the case with the Ruijin community. Each center and sub-center had a strong attraction to community residents, the recreation attraction of the community center and community edge was relatively balanced, and the service radii of scattered parks and leisure squares covered and overlapped [
31].
The axial POS structure pattern presents as a regular network structure with interlocking multi-axes, as is the case with the Fangsong community. Its parks and leisure squares are laid out in an axial pattern, and residential and commercial land uses are mosaic around the axial pattern, taking up the leisure and recreational functions of the community residents in a decentralized manner [
32]. The recreational attraction and frequency of space use were evenly distributed.
The factors influencing use intensity of POS are complex, as the layout of POS is also influenced by various factors, such as construction time and historical evolution. The method of geodetection was introduced to quantitatively analyze the external influences on the attraction of POS in communities. The main influences in this study were the proportion of POS area, pedestrian accessibility, population density, and proportion of commercial land, which is consistent with the findings of existing studies [
30,
31,
32,
33].
However, other studies using geodetection have suggested that the order of influences on the visitors’ spatial distribution in country parks is commercial facilities > population density > transportation convenience. That conclusion is different from the one in this paper. This may be because country parks are mainly located on the outskirts of urban centers, and commercial facilities limit the recreational potential of the parks [
31]. As a result, the distribution of commercial facilities is an important factor in the use of country parks. However, remote locations, which are accessible mainly by buses and private cars, have minimal impact on accessibility [
32]. Similarly, in this research, the influence of transportation convenience was weak, probably because more than 90% of POS in communities are located within 15 min of walking, so factors such as the number of subway stations and accessibility by car have little influence on community POS.
Moreover, the results may shed some light on the planning and design of urban community POS, in terms of suggestions and assumptions. The suitable walking distance of urban community public spaces for residents’ daily leisure life is recommended to be between 5 and 15 min [
29]. The planning and design of community public space should strengthen the intergenerational communication and decision-making of residents, which provides a method of co-governance for residents in community. To solve space-use problems, for the old communities located in the center of the city, owing to the limited space, the connectivity of public spaces should be strengthened, the functions of the spaces should be diversified, and residents should be advised to use the spaces at different times. For the suburban communities, pocket parks can be added to form complementary public space nodes with community parks to effectively balance recreational attraction.
Author Contributions
Conceptualization, B.Y.; methodology, B.Y.; software, W.S.; validation, W.S. and J.W.; formal analysis, W.S.; investigation, W.S.; resources, J.W. All authors have read and agreed to the published version of the manuscript.
Funding
This research received no external funding or This research was funded by Chinese National Social Science Fund, and grant number is [21BSH124].
Institutional Review Board Statement
The studies were not involving humans or animals contacting or invasion.
Informed Consent Statement
The studies were not involving humans or animals contacting or invasion.
Data Availability Statement
The data presented in this study are available on request from the corresponding author. The data are not publicly available due to the third party permission. Restrictions apply to the availability of these data. Data was obtained from Tencent travel data center and are available with the permission of Tencent.
Acknowledgments
The authors wish to acknowledge Shu Tian for his assistance in designing and carrying out this research. This work was supported by the Chinese National Social Science Fund (21BSH124).
Conflicts of Interest
The authors declare no conflict of interest.
References
- Mo, F. The evolution of greenspace development planning in Shanghai for 70 years (1949–2019). Chin. Landsc. Archit. 2019, 10, 1336–1339. [Google Scholar]
- Echeverria, S.E.; Amiee, L.; Carmen, R.I.; Johnson-Dias, J.; Pacquiao, D. A community survey on neighborhood violence, park use and physical activity among urban youth. J. Phys. Act. Health 2014, 11, 186–194. [Google Scholar] [CrossRef] [PubMed]
- Morgan, H.S.; Kaczynski, A.T.; Child, S.; Moore, J.B.; Porter, D.; Hibbert, J. Green and lean: Is neighborhood park and playground availability associated with youth obesity: Variations by gender, socioeconomic status, and race/ethnicity. Prev. Med. 2017, 95, 101–108. [Google Scholar] [CrossRef] [PubMed]
- Luo, Q.Q.; Xia, L.J. Main issues addressing current research interest in community parks in the united states and their enlightenment to China: A review of indexed literature on Web of Science 2008–2013. Chin. Landsc. Archit. 2015, 31, 35–39. [Google Scholar]
- Yu, B.Q.; Xie, C.K.; Yang, S.B. Correspondence analysis on residents’ perceived recreation satisfaction and importance in shanghai urban community park. Chin. Landsc. Archit. 2014, 30, 5–78. [Google Scholar]
- Xu, L.Q.; Yan, Y. A review of the evaluating model of publicness of public space. New Archit. 2016, 38, 1–9. [Google Scholar]
- Guo, S.H.; Yang, G.G.; Pei, T.; Ma, T.; Song, C.; Shu, H.; Du, Y.; Zhou, C. Analysis of Factors Affecting Urban Park Service Area in Beijing: Perspectives from Multi-source Geographic Data. Landsc. Urban Plan. 2019, 181, 103–117. [Google Scholar] [CrossRef]
- Li, F.Z.; Qian, L.X.; Zang, F.Q.; Li, X. Study on recreational use and influencing factors of country parks in Beijing based on Tencent Travel Big Data. Chin. Landsc. Archit. 2019, 26, 77–82. [Google Scholar]
- Li, F.Z.; Dai, C.L.; Yao, P. Spatial-temporal pattern and causes of the use of community parks in central city of Beijing: An empirical study based on 58 parks. J. Beijing For. Univ. 2017, 39, 91–97. [Google Scholar]
- Ding, S.G.; Lu, P.; Liu, Y.Q.; Cheng, S. Stationary point applied in spatial analysis on Chinese gardens: Taking an example of the Master of Nets Garden. J. Nanjing Agric. Univ. 2017, 40, 998–1006. [Google Scholar]
- Wu, C.Z.; Liu, W.Q.; Li, S.H. GPS/GIS-based study on the difference of space distribution of park recreationists: Taking Gongqing forest park in shanghai as the example. Chin. Landsc. Archit. 2017, 9, 98–103. [Google Scholar]
- Meijles, E.W.; Bakker, M.; Groote, P.D.; Barske, R. Analyzing hiker movement patterns using GPS data: Implications for park management. Comput. Environ. Urban Syst. 2014, 47, 44–57. [Google Scholar] [CrossRef] [Green Version]
- Wu, Z.Q.; Li, D.H. Principle of Urban Planning, 4th ed.; China Architecture & Building Press: Beijing, China, 2010; pp. 563–564. [Google Scholar]
- Fu, G.L. Discussion on the urban public open space. Planners 2004, 20, 46–50. [Google Scholar]
- Zhou, J. Planning Control and Guidance of Urban Public Space Construction—A Study on Shaping High-Quality Urban Public Space; China Construction Industry Press: Beijing, China, 2005; pp. 63–108. [Google Scholar]
- Yang, X.C.; Sima, X.; Hong, T. Urban open space system planning method research: A case study of Shenzhen city. Planners 2008, 24, 24–27. [Google Scholar]
- Che, S.Q.; Xu, H.; Li, Z.G.; Wei, H.J. Study on Public Open Space and Leisure in Shanghai; Shanghai Jiao Tong University Press: Shanghai, China, 2019; pp. 62–68. [Google Scholar]
- Yang, S.B. Analysis on the impact of residents’ professional differentiation on recreation demands in urban community park. Chin. Landsc. Archit. 2015, 1, 101–105. [Google Scholar]
- Wang, T.; Mao, M.R.; Cui, B.S. Cat’s Eye: An Intelligent Investigation Tool for Urban Planning and Design. Landsc. Archit. Front. 2019, 7, 112–120. [Google Scholar]
- Wang, J.F.; Li, X.H.; Christakos, G.; Liao, Y.-L.; Zhang, T.; Gu, X.; Zheng, X.-Y. Geographical detectors-based health risk assessment and its application in the neural tube defects study of the Heshun Region, China. Int. J. Geogr. Inf. Sci. 2010, 24, 107–127. [Google Scholar] [CrossRef]
- Liu, K.L.; Lin, Y.J. The Relationship between physical landscape attributes of neighborhood parks and emotional experiences. J. Taiwan Soc. Hortic. Sci. 2007, 53, 127–138. [Google Scholar]
- Ren, Z.; Lu, S.Z. The open residential outer space using efficiency evaluation based on communication requirements: A case study of Yanshan residence in Ji’nan. Huazhong Archit. 2016, 34, 68–73. [Google Scholar]
- Hongrun, J.U.; Zhang, Z.X.; Zuo, L.J.; Wang, J.; Zhang, S.; Wang, X.; Zhao, X. Driving forces and their interactions of built-up land expansion based on the geographical detector: A case study of Beijing, China. Int. J. Geogr. Inf. Sci. 2016, 30, 2188–2207. [Google Scholar]
- Li, F.Z.; Zhang, F.; Li, X. Spatiotemporal patterns of the use of urban green spaces and external factors contributing to their use in central Beijing. Int. J. Environ. Public Health 2017, 14, 237. [Google Scholar] [CrossRef] [PubMed]
- Wang, J.F.; Xu, C.D. Geodetector: Principle and prospective. Acta Geogr. Sin. 2017, 72, 116–134. [Google Scholar]
- Lin, Z.W.; Zeng, H. The evaluation of park accessibilities of residential communities of various levels: A case study of Bao’ a district, Shenzhen. Chin. Landsc. Archit. 2014, 30, 59–62. [Google Scholar]
- Wang, L.Y.; Xiao, Y. Exploring the Linkage between Greenness Exposure and Depression among Chinese People: Mediating Roles of Physical Activity, Stress and Social Cohesion and Moderating Role of Urbanicity. Health Place 2019, 58, 102168. [Google Scholar]
- Xiao, Y.; Wang, D.; Fang, J. Exploring the Disparities in Park Access Through Mobile Phone Data: Evidence from Shanghai, China. Landsc. Urban Plan. 2019, 181, 89–91. [Google Scholar] [CrossRef]
- Pouso, S.; Borja, N.; Fleming, L.E.; Gómez-Baggethun, E.; White, M.P.; Uyarra, M.C. Contact with blue-green spaces during the COVID-19 pandemic lockdown beneficial for mental health. Sci. Total Environ. 2020, 46, 132–141. [Google Scholar] [CrossRef]
- Wu, L.F.; Seung, K.K. Health outcomes of urban green space in China: Evidence from Beijing. Sustain. Cities Soc. 2020, 34, 178–184. [Google Scholar] [CrossRef]
- Han, Y.; Kang, W.; Thoren, J.; Song, Y. Modeling the Effects of Landscape Patterns of Current Forests on the Habitat Quality of Historical Remnants in a Highly Urbanized Area. Urban For. Urban Green. 2019, 41, 354–363. [Google Scholar] [CrossRef]
- Li, F.; Li, F.; Li, S.; Lone, Y. Deciphering the recreational use of urban parks: Experiments using multi-source big data for all Chinese cities. Sci. Total Environ. 2020, 701, 134896–134909. [Google Scholar] [CrossRef]
- Liu, F.N.; Zhang, L. Using Multi-source Big Data to Understand the Factors Affecting Urban Park Use in Wuhan. Urban For. Urban Green. 2019, 43, 126367–126375. [Google Scholar] [CrossRef]
| Publisher’s Note: MDPI stays neutral with regard to jurisdictional claims in published maps and institutional affiliations. |
© 2022 by the authors. Licensee MDPI, Basel, Switzerland. This article is an open access article distributed under the terms and conditions of the Creative Commons Attribution (CC BY) license (https://creativecommons.org/licenses/by/4.0/).


