Article

A Study on Growth Engines of Middle Market Enterprise (MME) of Korea Using Meta-Analysis

1
College of General Education, Seoul Women’s University, Seoul 01797, Korea
2
Greehey School of Business, St. Mary’s University, San Antonio, TX 78228, USA
3
William F. Miller School of Management of Technology, Konkuk University, Seoul 10223, Korea
*
Author to whom correspondence should be addressed.
Sustainability 2022, 14(3), 1469; https://doi.org/10.3390/su14031469
Submission received: 20 December 2021 / Revised: 23 January 2022 / Accepted: 24 January 2022 / Published: 27 January 2022

Abstract

:
The purpose of this study is to comprehensively review previous studies and discover implications for the sustainable growth engines of middle market enterprise (MME) of Korea using meta-analysis. Since Germany’s hidden champion companies are considered as benchmarking targets because their economic environment and size are similar to those of Korean MMEs, a meta-analysis was conducted on the previous studies of them. As a result of integrating the effect sizes of input and output factors according to the process of the Program Logic model from the viewpoint of dynamic capabilities, 198 in Germany and 229 in Korea were derived. It was found that, unlike Korean companies, the number of skilled workers, labor productivity, CEO experience, and Innovation activities within the firm had a significant impact on Germany’s hidden champion companies. In addition, industry and region-oriented innovation networks and family businesses were identified as important variables. Meta-analysis collects a large number of individual studies in order to integrate the results and statistically assess the data. As a result, it will be used as basic data for developing models for academic research in the future. In addition, it will provide implications for sectors in which Korean MMEs should concentrate their efforts in order to create an innovative ecosystem.

1. Introduction

Most markets in highly developed open economies, innovation is a key driver of competition [1]. SMEs (small- and medium-sized enterprises) need to develop capabilities and management practices not only to keep pace with technological change but also to gain competitive advantages from innovation, allowing them to compete with large firms [1]. In a time when the pandemic caused by COVID-19 has caused economic downturns in countries around the world and paradigm shifts in industries, as with recent times, firms are required to innovate to overcome the crisis [2]. However, technological innovation does not always succeed and often fails because innovation activity is uncertain. Nevertheless, experts predict that COVID-19 will bring about bigger impacts than the 2008 global financial crisis and that if it is not properly responded to, firms may face long-term difficulties. Recently, innovation research has explained how firms cope with the economic fallout of the pandemic and how innovation processes are structured and conducted [3]. The research suggests that firms respond to emerging challenges by accelerating digitization [4,5], rethinking corporate practices [5,6,7], or developing frugal solutions [3,8]. Additionally, technology innovation based on partnerships will be a key factor in promoting a virtuous cycle of national economic growth and in creating a firm’s sustainable growth and positive economic performance [9,10].
During the 2008 economic crisis, Germany, a manufacturing powerhouse, overcame the crisis by strengthening the innovation capabilities of small- and medium-sized firms (SMEs), which are the center of the German economy and society, and it is being talked about as a representative success story. Germany established the ⌈Mittelstand 4.0⌉ strategy for the growth of SMEs and established a strategy to convert production processes to digital ones; to implement this strategy, the Federal Ministry for Economic Affairs and Energy (BMWi) of Germany input 28.84 million euros (about 37 billion in KRW) in 2016 and 48.31 million euros (about 62 billion in KRW) in 2017. Germany’s bold investment decision was made because Germany judged that the role of flexible and fast SMEs/middle market enterprises was most important to overcome the rapidly changing crisis and respond to technologies and markets.
South Korea has also pursued changes by benchmarking the case of Germany. Germany has experienced a history of division, as with South Korea, has an SME-type industrial structure centered on manufacturing, and has many similarities to the South Korean economy in that its economy is a global-oriented economy with high external dependencies [11]. In addition, similar to South Korea, Germany has an export-oriented economy and a large firm-led SME-type industrial structure. As such, the similarities, such as the fact that Germany’s SME size is similar to that of South Korea, the fact that both countries put emphasis on human resources due to the lack of resources, and the fact that both countries put emphasis on manufacturing and export-oriented economic policies, are reasons why South Korea benchmarks Germany for SME policies [12].
Thus far, South Korea has achieved economic growth centered on manufacturing industries such as automobiles, semiconductors, and steel, but problems due to the sluggish manufacturing industries have been constantly raised. In addition, the trickle-down effects brought about by large-firm-centered growth and the global crisis of COVID-19 overlapped the problems caused by the polarization of large firms and SMEs, exacerbating the growth stagnation of small- and medium-sized and middle market enterprises [13,14]. If a large firm system is selected in the early stages of economic development, it will be possible to accelerate the pursuit of advanced countries through the imitation and learning of overseas advanced experiences and technologies, thanks to the economy of scope and the economy of scale. However, it will intensify the problem of polarization in income and resource distributions and structuralize the large-firm-first principle, leading to the inhibition of the growth of SMEs and middle market enterprises. Since the 1980s, the polarization of the South Korean economy has already been confirmed by the fact that cases of upward movement from the start-up to the SME–middle market enterprise to the large firm and corporate group are very rare [13]. The polarization was further exacerbated by the social and environmental event termed COVID-19.
Arguments have been raised by major research institutes that in order to overcome the foregoing, the environmental opportunity from the reorganization of industrial paradigms due to digitalization, as with that of recent times, should be seized to utilize SMEs and middle market enterprises as new growth engines. In particular, in preparation for the post-Corona era, the importance of nurturing middle market enterprises, which are a firm group similar to the hidden champions among German Mittelstand firms, is being emphasized again. Hidden champion is a term that first appeared in a book conducted by Simon (1990) [15]. The term was used first as a title of a publication in a scientific German management journal to describe a small firm in Germany. In order to be considered a hidden champion, a company must meet the following conditions: (1) Number one, two, or three in the global market, or number one on the company’s continent, determined by market share, (2) revenue below USD 5 billion, and (3) low level of public awareness [16]. Since middle market enterprises are more stable than SMEs in internal resources, capabilities, and technical skills, these firms should be intensively fostered to construct a stable economic structure and secure competitive advantages. In South Korea, the legal concept of middle market enterprises was enacted in 2011, and currently, there are 4468 middle market enterprises. Despite that the share of these firms in the industrial structure is very small, as they account for only 0.1% of all firms, middle market enterprises play a much more important role in economic growth compared to SMEs to the extent that the sales of middle market enterprises are 639 trillion won, accounting for 14.5% of the total domestic firms’ sales, and their export amount is 85.1 billion dollars, which is 17.2% of the total export amount of South Korea (www.ahpek.or.kr, accessed on 23 August 2021). In addition, since middle market enterprises play the role of the waist of industry, fostering them can create a pot-shaped economic structure with a strong backbone and a healthy industrial ecosystem. This will enhance not only firm competitive power but also national competitive power so that the present economic problems can be fundamentally solved.
However, since the South Korean policy paradigm classifies firm types (large firms, middle market enterprises, SMEs) based on the sizes of the firms to implement regulations and support according to the firm types, policy and institutional support for middle market enterprises are much more insufficient compared to SMEs. In addition, if a firm grows up from an SME and is judged to be a middle market enterprise, that firm will not receive the legal and institutional support it has received thus far. Therefore, middle market enterprises suffer from difficulties in procuring human resources and funds that they have received since they were SMEs [17]; some competitive SMEs show the “Peter Pan syndrome” in which they avoid growth, and the phenomenon of a return to SMEs is appearing. Consequently, long-term growth stagnation is repeated (http://www.kmmei.re.kr, accessed on 7 July 2021).
Although various issues related to the growth of middle market enterprises in South Korea have been raised, studies on such issues are insufficient because the legal basis for middle market enterprises was enacted in 2011. In addition, since most studies have applied the topics that had been addressed in SME studies to middle market enterprise studies, the characteristics of middle market enterprises, such as their growth paths, investment status, and innovation capability, cannot be reflected, and there are limitations in deriving core factors for growing into global hidden champions. Therefore, this study intends to identify the core factors of the growth of German hidden champion firms shown in previous studies through meta-analysis and to present academic and practical implications through comparison analysis with domestic middle market enterprises.

2. Literature Review

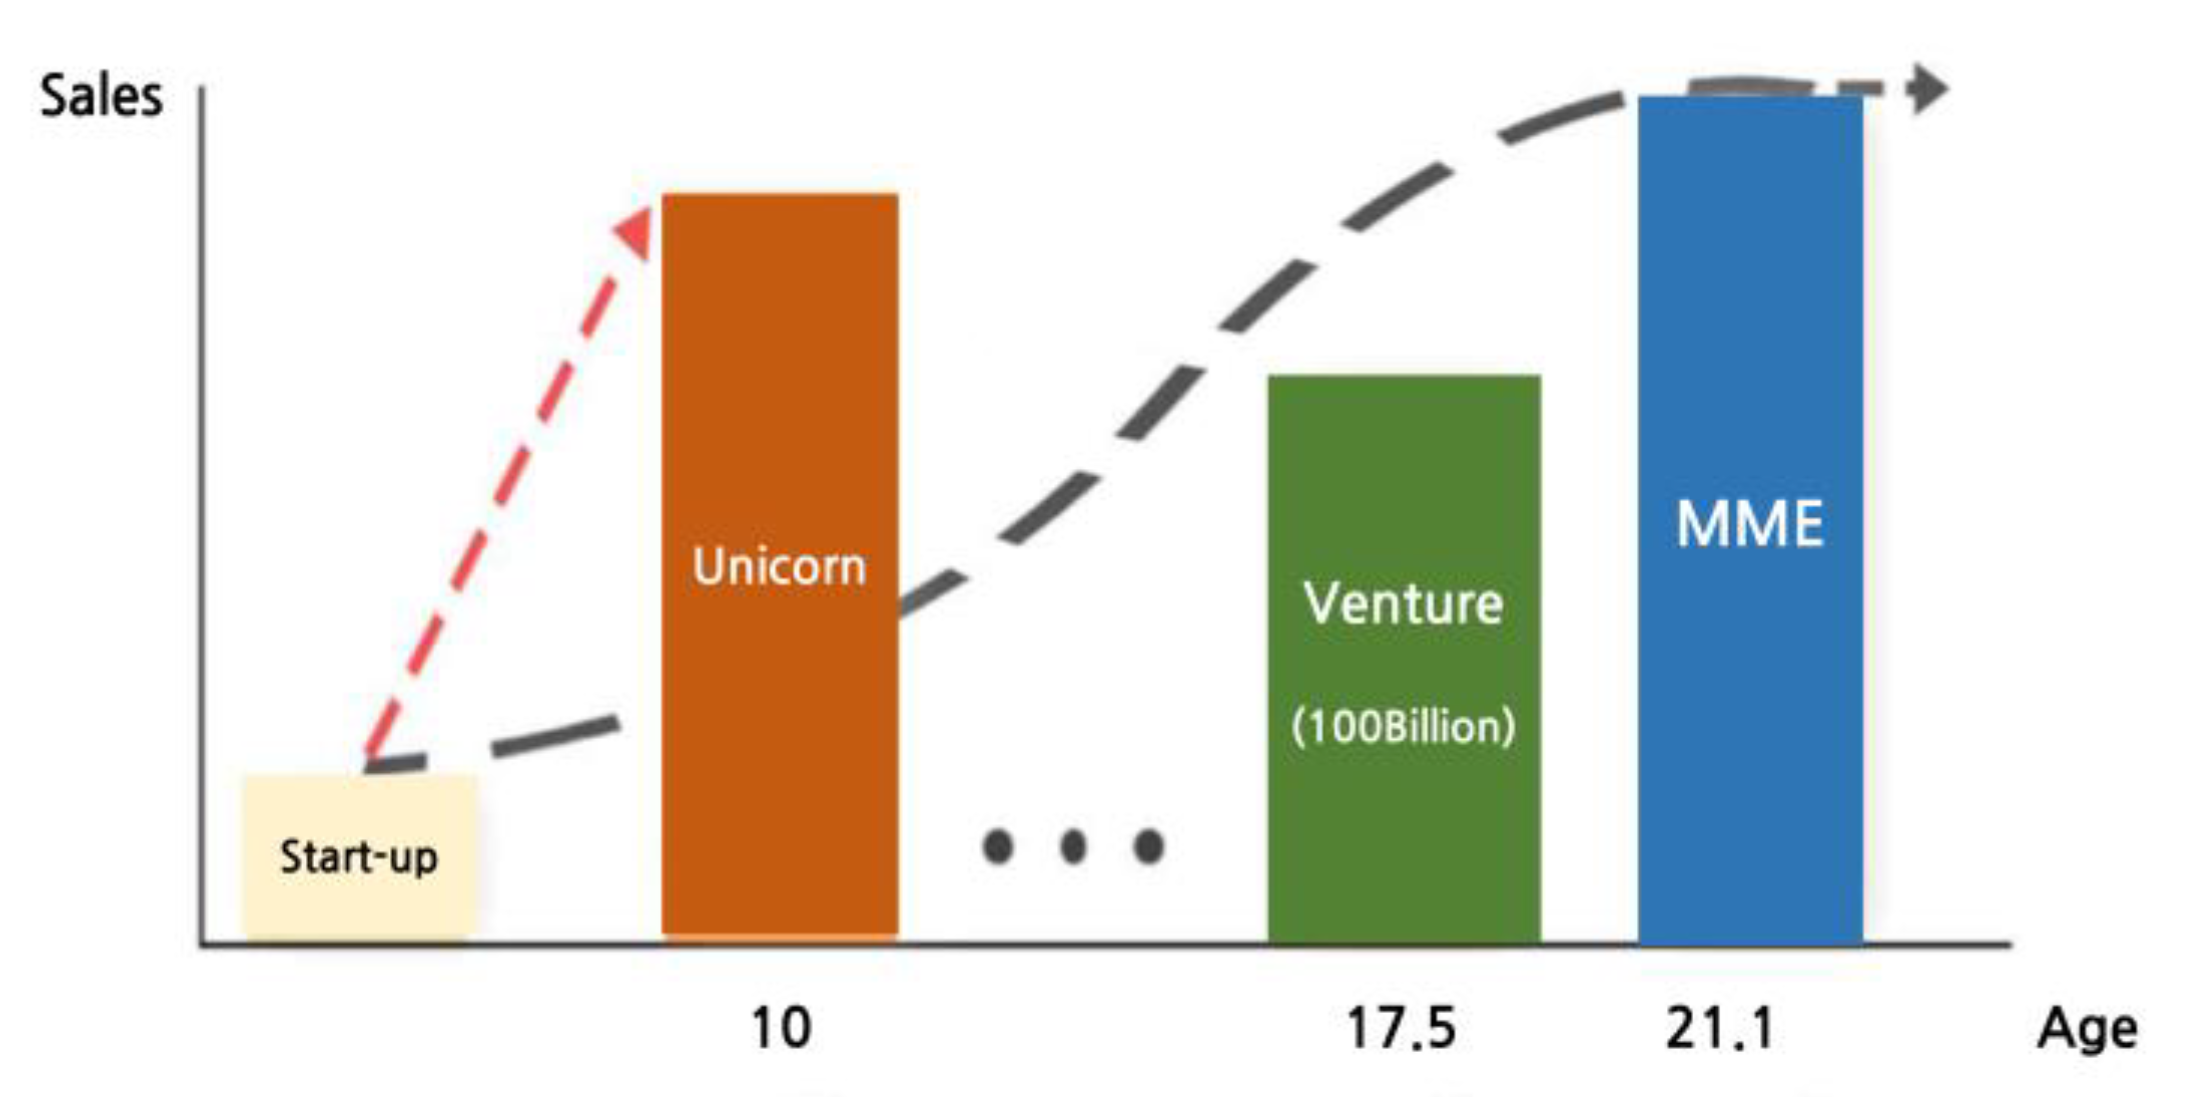
2.1. Middle Market Enterprises (MMEs) in South Korea

The legal basis for the middle market enterprises (MMEs) in South Korea was prepared through the amendment of the Industrial Development Act (March 2011) and the enforcement ordinance of the same law (1 July 2011) in 2011. Before the foregoing, there was no legal concept of MMEs in the dichotomized industrial structure in which firm groups were classified into SMEs and large firms, defined according to the Framework Act on Small and Medium Enterprises. Therefore, in previous studies, MMEs have been diversely and arbitrarily defined within a certain range that exceeds the scope of SMEs based on capital, sales, or employees.
After the concept of MMEs was introduced in 2011, there were a total of 5007 MMEs in South Korea as of 2018. Although they account for only 0.7% of the total number of firms, their share in the economy was large, to the extent that they accounted for 21.5% of sales, 21.5% of exports, and 21.3% of employment of entire firms (https://www.fomek.or.kr, accessed on 22 July 2021). MMEs in South Korea have continued to grow and are positioned as the central axis of the industrial ecosystem in charge of “the waist of the industry”. Additionally, they are evaluated to be of the size equipped with the “flexibility and speed” that enable the most active responses to changes in global industrial paradigms since they are more stable than SMEs and more flexible and speedy than large firms [18].
In particular, the importance of innovative and strong MMEs that have unique agility and do not hesitate to take on challenges is being emphasized in the recent time of great changes in the industrial landscape. Therefore, the South Korean government has established various customized policies considering the sizes and characteristics of firms and has been striving to create a sound industrial ecosystem and strengthen the competitive power of industries through an industrial cooperation model led by MMEs. It is necessary to strengthen the bridging roles of middle market enterprises so that SMEs, which account for 94.8% of all South Korean firms and about 88% of employees, can grow into large firms equipped with global competitive power.
Nevertheless, SMEs and MMEs in South Korea are still experiencing growth stage stagnation and growth rate retardation. Starting from 10 billion won in sales, the number of firms rapidly decreases, and there are few firms growing into each of the stages of SMEs → MMEs → large firms. The number of firms that grew from SMEs to MMEs was 96 as of 2018, but the number of firms that returned to SMEs due to declining sales was 89. Therefore, the actual increase in the number is very small, around 10 per year. In addition, the number of firms that have grown from an MME to a large firm since 2014 is only 5. Additionally, the growth rate is low compared to that of a “unicorn”, as shown in Figure 1. The slow emergence of SMEs and MMEs equipped with global competitive power is a very dangerous signal for the South Korean economy and industrial structure [19].
Since MMEs have different characteristics from large firms or SMEs in not only the sizes of firms but also internal resources, capabilities, management strategies, investment activities, and growth paths, in-depth studies on the internal resources and capabilities and the innovative strategic activities of MMEs are necessary [20].

2.2. Mittelstand and Hidden Champion

The reason Germany has become an economic powerhouse that leads the European economy today is not only its diverse internal and external ecosystem environment, such as domestic public-private partnerships, market expansion due to the European Union, excellent logistics and transportation networks, and ideal geographical conditions linking Eastern and Western European countries, but also many strong global SMEs. Germany, as with Korea, is a country with an export-oriented economy and has an economic structure in which large firms lead the industry but SMEs strongly support large firms. In Germany, domestic SMEs are collectively called Mittelstand, and the scope is determined according to sales and employees. The IFM Bonn defines small- and medium-sized firms (SMEs) by referring to quantitative criteria, i.e., annual turnover (≤EUR 50 million) and the number of employees (<500 employees) (https://en.ifm-bonn.org, accessed on 7 July 2021) (Table 1). The quantitative standards are similar to those for South Korean SMEs, but IFM Bonn includes the concept of family firms in ownership and governance as well as quantitative regulations. This is different from South Korean SMEs.
Similar to South Korea, SMEs (kleineund mittlere unternehmen) in Germany account for 99.8% of all firms in number and 64.1% of the employed population (Table 2).
Similar to Korea, Germany has an economic structure led by large firms, but German cooperative SMEs are different from South Korean SMEs in that they are global SMEs ranked 1st to 3rd in the world market and can exert equal bargaining power with large firms [11]. As such, the win–win structure with large firms ultimately supports the stable economic structure of the German economy. These firms are called “hidden champions”, and this is also a reason why German SMEs are recognized globally for their competitive power. The term “hidden champions” has been explored by Simon since the beginning of the 1990s, and it is used to describe SMEs with high world market share. According to the assumptions of Simon’s concept, hidden champions share the following characteristics [1,16]:
(1)
A hidden champion takes a top-3 position on the global market or the first position in Europe or on its continent—its market position is primarily dependent on its market share (or on its relative share).
(2)
Its revenue does not exceed five billion euros.
(3)
It has got little popularity and leads a more or less hidden existence away from the public eye.
According to Simon·Kucher and Partners (2021), Germany has the largest number of hidden champion firms at 1573 and shows an unrivaled status to the extent that the gap from the United States, which is in the second place, is very large. On the other hand, it is reported that only 22 hidden champion firms exist in South Korea.
Therefore, many major studies in South Korea commonly argue that, in order to foster South Korean hidden champion firms, it is necessary to foster MMEs that have the most similar firm characteristics to hidden champions [11,12] since German hidden champion firms are close to large firms based on South Korean standards; MMEs that act as the waist between SMEs and large firms are highly likely to grow into future hidden champions.
A major characteristic mentioned as a success factor of the German hidden champion firms shown in previous studies is that they are long-lived firms. The technological accumulation and source technologies of skilled manpower can cause innovation and consequently launch products with market competitiveness. This can be said to be the result of continuous technical education and consulting under an excellent entrepreneurial spirit [11,21,22]. Kim (2014) emphasized that there are many differences in management systems, strategies, and management environments as well as management philosophies and management perspectives between German and South Korean SMEs; parts that can be benchmarked should be strategically taken [11].

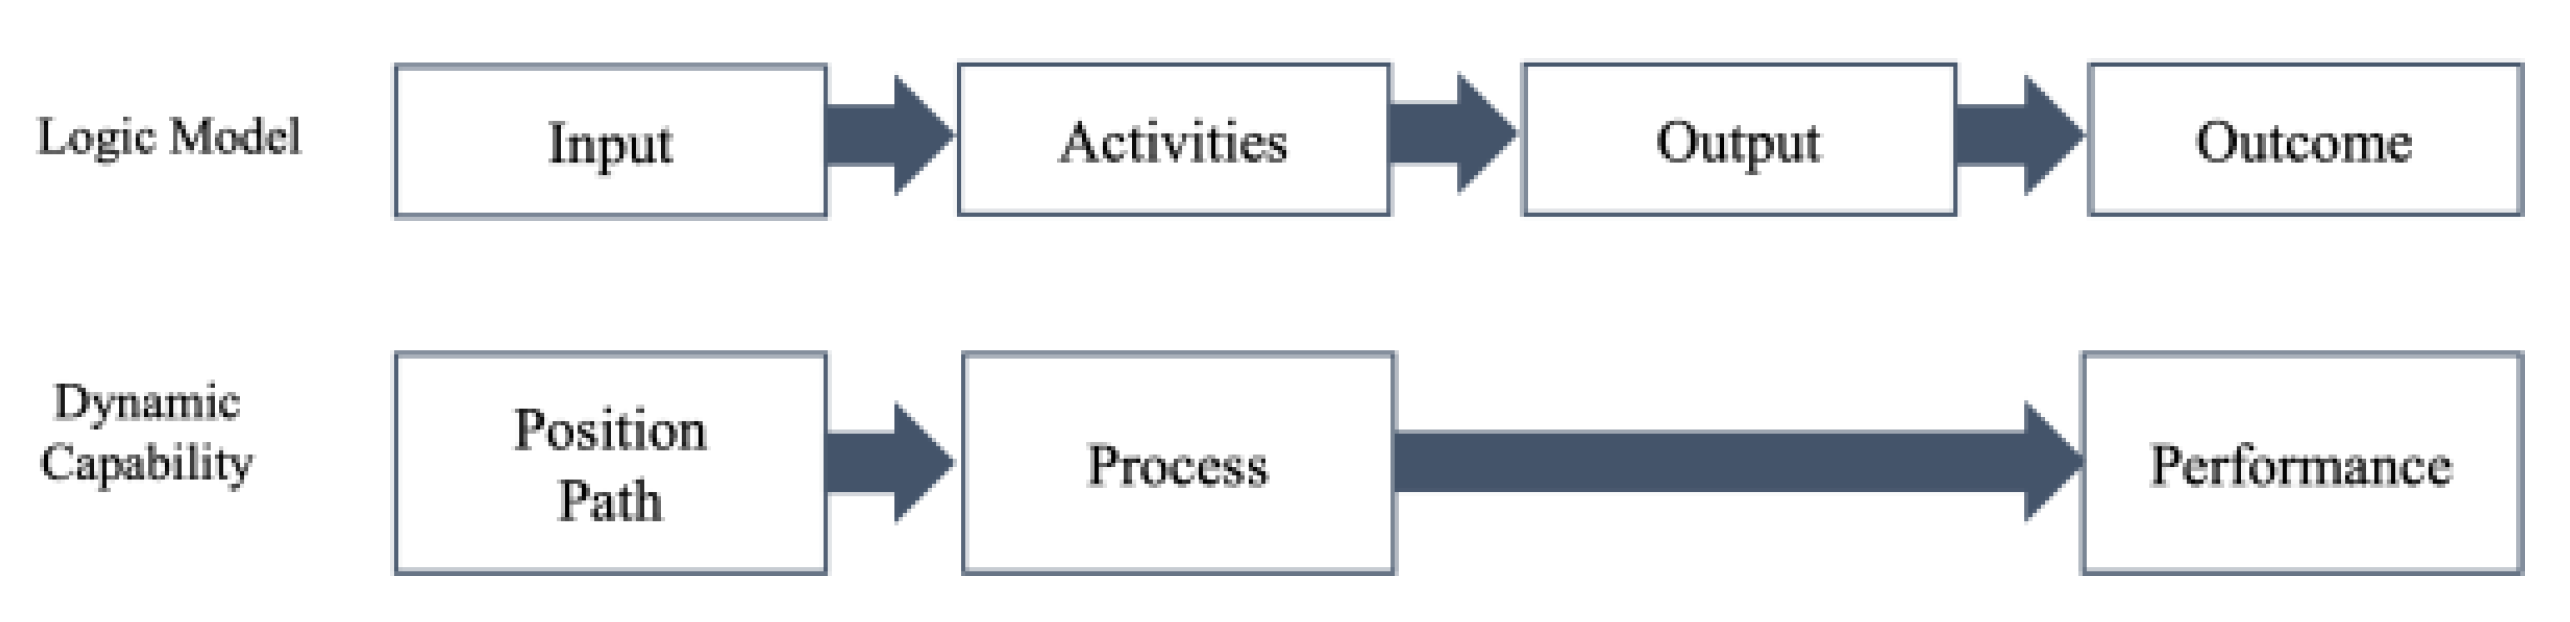
2.3. Dynamic Capabilities of Middle Market Enterprise

In a rapidly changing environment, to actively respond to the environment, thereby achieving sustainable growth, firms need the ability to make organizational capabilities that are unique assets of them and internally and externally integrate, construct, and reorganize the organizational capabilities, that is, an ability of an upper concept to change routines, processes, and capabilities [23]. The ability to achieve innovative and new competitive advantages despite the path dependence and market position and dynamic processes are necessary. The concept of dynamic competency has been defined diversely by scholars. It is sometimes classified into capabilities but is also defined as a process or routine. With a strategic management model focusing on efficiency, Teece and Pisano (1994) described dynamic competency in three dimensions: positions, paths, and process [1,23].
“Positions” refer to the diverse resources currently possessed by the firm that constitute processes and, thereby, can provide competitive advantages; financial, technical, intellectual, organizational, and market assets. Excellence in this field is an element that lays the foundation for strategic and operational management and determines the company’s competitive advantages. The concept of “path” refers to the path the firm has taken thus far, which affects the decision of the firm’s strategic alternatives. It is formed based on what happened in the past and creates a dynamic learning process in that the know-how accumulated in the past and present will be used more efficiently hereafter. In-house research and development (R&D) can therefore be an essential prerequisite for a firm’s “absorbing capacity”, which is, the ability to recognize, assimilate, and apply new knowledge [1,24]. In addition, cooperative preparation and openness to external sources of knowledge are also other relevant means of capacity accumulation. A “process” is a pattern of business methods or execution of a firm, and it means all intra-organizational interactions between different functions and departments and inter-organizational relationships with partners outside the company, particularly customers and suppliers. The process is affected by the position and path the firm has.
Recent studies of hidden champions have shown that processes, positions, and paths are drivers of the hidden champions’ success and are important elements when searching for lessons that can be learned by other firms [1,25,26,27,28].
Therefore, this study intends to compare South Korean middle market enterprises and German hidden champion firms in terms of processes, positions, and paths. In addition, this study will analyze the relationship between dynamic capabilities and performance to present strategic implications for developing the growth strategies of South Korean middle market enterprises.

3. Materials and Methods

3.1. Criteria for Selecting Studies and Data Collection

The first steps in this meta-analysis are the retrieval and selection of studies. We reviewed related studies on websites that provide academic information. Since this study aims to verify the core elements that have induced the growth of hidden champion firms in major advanced countries such as Germany and the core competencies of MMEs in South Korea, both domestic and overseas data were reviewed.
In the case of overseas data, the original data of studies conducted with the German Mittelstand were collected. In particular, since hidden champion firms mean strong small firms with innovative capabilities among Mittelstand firms, the data were mainly collected from studies that empirically analyzed those firms. Major sites at which the original texts were searched for were Proquest, EBSCo, and ScienceDirect. The data were searched for at these sites with keywords “Mittelstand”, “Hidden champion”, “Germany”, “SME”, “Innovation”, and “Success”. When searching, data types were limited to scholarly journals and studies, and only those studies that were written in English were extracted. A total of 3227 documents were retrieved, but after excluding overlapping studies and checking the contents of the abstracts, a total of 139 studies suitable for the purpose and scope of this study were selected, and a DB consisting of the variables used in these studies was constructed.
In the case of domestic data, research studies on “innovative SMEs” and “middle market enterprises” were collected from major original text providing source websites such as KISS, KCI, and DBpia because, since the definition of middle market enterprises was established in 2011, similar firm groups could correspond to innovative SMEs in the literature prior to 2011. A total of 512 documents were retrieved, but after excluding overlapping studies and checking the contents of the studies, only empirical studies were selected to construct a DB.

3.2. Structure of Variables

In general, the logic model is a systematic and visual method for understanding and sharing program resources, activities, changes, and results, and it consists of Input → Activities → Outputs → Outcomes (Short, Medium, Long) (Figure 2). In this study, the sizes of the effects of variables recoded according to the process consisting of Input → Innovation Activities → Innovation Outcome were combined. According to the logic model process, a total of 198 effect sizes were derived in the case of overseas studies and 229 were derived in the case of domestic studies.
Input factors were divided into positions and paths from the viewpoint of dynamic firm capabilities. Positions are firm positions and include technical assets, financial assets, and market structure assets owned by firms. In addition, Teece’s study included human capital in the paths because knowledge is inherent not only in equipment and products but also in humans, but this study included it in positions. Positions also include entrepreneurial features from managerial and organizational perspectives. Paths include the innovation orientation and innovation competency of firms that provide path dependency and technological opportunities. It also includes investment in R&D expenses for innovation. As for the factor innovation activities, R&D activities affected by the position and path of the firm were redefined as the process dimension of Teece. However, there were some studies that included R&D cost, open innovation, and in-house innovation as activity factors. Innovation outcomes were divided into financial and non-financial performances (e.g., market performance, new product development, royalty revenue, study performance). The operational definitions of input factors are as shown in Appendix A.
Variables mainly used in the studies in South Korea and those in Germany were compared (Table 3). According to the results, the geographic locations of German hidden champion firms, whether they are family firms or not, and their market shares were used as major variables. In addition, the variable entrepreneurial characteristics were used as an important variable in studies in Germany, but it was not used in domestic studies. The foregoing is judged to have reflected the fact that studies on entrepreneurial characteristics perceived that entrepreneurial characteristics are important in start-up firms in their early stage and SMEs, but the characteristics of managers who pursue efficiency are important in mature firm groups such as MMEs.
In view of the differences in variables, it is assumed that the growth engines of Germany’s hidden champions and South Korea’s MMEs will be different.

4. Method of Meta-Analysis

4.1. Coding

For the coding and analysis of the effect size, we used the Comprehensive Meta-analysis (CMA) 3.0 program. Since the consistency of input and output factors should be secured for meta-analysis, the effect sizes reported in various forms in many studies should be integrated into one type before analysis. A total of 36 studies that fit the purpose of this study were finally selected, similar terms were recoded, and input and output factors were organized (Appendix B). The relationship between input and activity is expressed as IA, and the relationship of input–activity–performance is expressed as IAP.

4.2. Effect Size Calculation and Transformation

Meta-analysis is a comprehensive analysis method to analyze various research results of individual studies with the same subject systematically and quantitatively [29]; it began with Glass, Rosenthal, Hunter, Schmidt in the 1970s and has been developed into a statistical method of “analysis of analysis” to comprehensively analyze existing research results today [30].
For meta-analysis, the effect sizes reported in various forms in many studies should be integrated into one type before analysis. This study analyzed Pearson’s product moment correlation coefficient r, which indicates a linear relationship between two variables. Since the correlation coefficients reported by individual studies may have biases indicating asymmetric distributions, they were converted into Fisher’s Z to calculate the average effect size [31].
As for the concrete method for this procedure, first, to integrate the effect sizes, the T value, the F value, and the regression coefficient (β), which are not reported as Pearson correlation coefficients, are converted into r values using the following formula according to a study conducted by Wolf (1986) [32].
r = t 2 t 2 + d f       or   r = t 2 t 2 + n 1 + n 2 2       ( d f :   degree   of   freedom )
r = F F + n 1 + n 2 2
To minimize the asymmetric bias of the Pearson’s product moment correlation coefficients, the effect size was calculated after converting r to Fisher’s Z [31]. In a meta-analysis, the larger the number of samples, the more reliable and accurate the effect size. Therefore, larger weights are given in studies with a large number of samples according to the inverse weight ( W i ) and the weighted mean ( M ).
W i = 1 V z M = i = 1 k W 1 Y i i = 1 k W i   ( Y i   : E f f e c t   s i z e )
The effect sizes, calculated as Fisher’s Zs, are converted back to the original Pearson’s product moment correlation coefficients before being reported for ease of understanding and interpretation [31,33].

5. Verification of Publication Bias and Homogeneity

5.1. Publication Bias

Since meta-analysis uses various types of data such as academic journals and dissertations, the results may be distorted if the studies analyzed do not represent the entire phenomenon and report the size in certain directions. Therefore, funnel plots and the stability coefficients (fail-safe N) should be analyzed to verify the bias of the data.
In general, it is judged that there is no publication bias when the schematics of the funnel plot are symmetrical, and when the stability coefficient is greater than 5K + 10, there is no publication bias. Therefore, the model in this study is judged to have no publication bias (Table 4).

5.2. Homogeneity Verification

Homogeneity verification is checking how heterogeneous the effect sizes are. In general, homogeneity is checked with the test statistic Q value and the I2 value. The Q value was found to be statistically significant (p = 0.000). In addition, the I2 value, which is interpreted as a percentage of variability of the effect sizes, was also analyzed to be 75 or higher, confirming heterogeneity between the effect sizes [34] (Table 5). Therefore, the average effect size calculation is reported by adopting a random effect model [31].

6. Result

6.1. Size of the Effect of Output (Innovation Process + Innovation Outcome)

Table 6 shows the results of the comparison of the output factors of German hidden champion firms (Overseas) and South Korean MMEs (Domestic). In this table, the results of comparison and analysis were conducted without distinguishing activity factors from outcome factors. As presented earlier, the input factors of overseas studies were different from those of domestic studies, and the sizes of effects were also different. According to Cohen (1988)’s analysis criteria, 0.10 to 0.23 values are interpreted as small effect sizes, 0.24 to 0.36 as medium effect sizes, and 0.37 or larger as large effect sizes [35].
The effect sizes of German hidden champion firms were analyzed, and, according to the results, the top factors (over 0.37) were shown to be closed innovation (0.739) and open innovation (0.437), and the middle factors (over 0.24) were shown to be human resources (0.330) and labor productivity (0.305), the CEO’s experience (0.303), exports (0.242), and the location in western Germany (0.242). It can be said that innovation activities affect overall innovation performance, and the importance of human resources could be identified. It is judged that, in the case of Germany, since workers are systematically fostered through the apprenticeship system to cultivate manpower for SMEs, these workers can play the role of core resources for the enhancement of competitive power later. In addition, it was identified that the importance of closed innovation was greater than that of open innovation so that the importance of innovation activities inside and outside the firm could be confirmed, and this indicates that internal cooperation needs to precede first, prior to cooperation with external organizations [36].
On the other hand, in the case of South Korean MMEs, the effect sizes were shown to be the largest in the case of size (0.340), followed by innovation orientation (0.323) and innovation capability (0.296). The importance of effect sizes was derived from relatively fewer factors compared to German hidden champions. In addition, it was found that the size and innovation capability of firms affect the innovation performance so that it is judged that firms of at least a certain size can perform based on the stability of funds. In addition, the innovation orientation within the firm was found to have an important effect on performance so that the importance of organizational innovation, which is a non-technical innovation, could be identified.

6.2. Comparison of the Sizes of Effects on Innovation Processes

Table 7 is the results of the analysis of the sizes of the effects of factors affecting the innovation process, which is an activity factor. Whereas the number of K was found to be 75 in the case of overseas studies, it was found to be 12 in the case of domestic studies, indicating that the studies were relatively insufficient.
Commonly, some of the input factors of firms included 0 in the confidence interval, indicating that they were not statistically significant. Among the significant factors of German hidden champion firms, the factors with large effects were shown to be open innovation (0.716), labor productivity (0.396), CEO experience (0.281), export share (0.224), skilled manpower (0.140), and R&D expenditure (0.101) in order of precedence.
On the other hand, in the case of Korean MMEs, the proportion of government subsidies (0.175) was found to have a significant effect on innovation activities.

6.3. Comparison of the Sizes of Effects on Non-Financial Performance

Table 8 shows the results of the analysis of the sizes of the effects of factors affecting non-financial performance among outcomes. Whereas the number of K was found to be 31 in the case of overseas studies, it was found to be 78 in the case of domestic studies, indicating that more diverse studies were conducted in South Korea.
Among the results of German hidden champion firms, the factors with the large statistically significant effects were R&D expenditure (0.616), export share (0.448), innovation capability (0.203), and financial characteristics (0.141) in order of precedence.
On the other hand, in the case of Korean MMEs, the effect of innovation capability was the largest (0.373), followed by innovation orientation within the firm (0.323), government subsidy (0.303), the level of manpower (0.266), and financial characteristics (0.137) in order of precedence.

6.4. Comparison of the Sizes of Effects on Financial Performance

Table 9 shows the results of the analysis of the sizes of the effects of factors affecting financial performance among outcomes. Whereas the number of K was found to be 92 in the case of overseas studies, it was found to be 137 in the case of domestic studies. In the results of German hidden champion firms, the factors with the large statistically significant effect sizes were shown to be introverted innovation (0.739), firm size (0.319), CEO’s experience (0.312), financial characteristics (0.275), market share (0.213), history (0.181), R&D expenditure (0.164), and industrial characteristics (0.141) in order of precedence. On the other hand, in the case of South Korean MMEs, those were shown to be firm size (0.355), innovation capability (0.198), location of the firm (0.178), history (0.160), R&D expenditure (0.132), and export share (0.109) in order of precedence.

7. Conclusions

This study conducted meta-analyses with previous studies on German hidden champions and South Korean MMEs. Since Germany has similar industrial and economic structures to those of South Korea, it has been continuously argued that German hidden champion firms should be benchmarked to develop the capabilities of South Korean MMEs. Therefore, this study compared and analyzed factors affecting performance with studies on similar firm groups in the two countries. In particular, the differences were compared from the viewpoint of position, path, and process, which are major factors of dynamic capabilities, and the logic model was modified and applied to the process up to performance creation.
According to the results of the analysis, German hidden champion firms and domestic middle market enterprises had similar firm size and characteristics but had different detailed factors that affect performance. This is considered attributable to differences in the management environments and management philosophies of firms in the individual countries. In particular, the variable entrepreneurial characteristics were used as important variables in studies in Germany, but it was not used in Korean studies. The foregoing is judged to have reflected the fact that studies on entrepreneurial characteristics perceived that entrepreneurial characteristics are important in start-up firms in their early stage and SMEs but the characteristics of managers who pursue efficiency are important in mature firm groups such as middle market enterprises. However, considering the reality that South Korean middle market enterprises are sunk in growth stagnation, it is necessary to benchmark overseas cases to cultivate the entrepreneurial spirit. We need to understand that hidden champions internally establish their corporate identity and that the values of the founder or entrepreneur who runs the company are reflected in the brand [12].
Although the internal and external environmental characteristics of the firms in the two countries are different, factors that affect their performance were analyzed concretely because they should be applied according to the South Korean policy environment (Table 10).
The factors that commonly affect the performance of German hidden champion firms and that of South Korean MMEs were found to be firm size, history, the proportion of exports, market share, financial position, and the proportion of R&D. Although not derived from Korean studies, when the factors that create the performance of hidden champion firms were analyzed, the proportion of skilled manpower and labor productivity were found to have important effects, indicating that competitive power can be secured by benchmarking the management and training of human resources. The trust and sense of the companionship of human resources will become a source that can induce the best customer service and will consequently create a virtuous cycle of firm growth [11]. In addition, given the results of many previous studies indicating that the expansion of human resources is important for the performance of technological innovation of SMEs, constructing a system to secure, cultivate, and maintain excellent technical manpower will be necessary for the R&D-based growth of middle market enterprises.
Germany tends to focus on entrepreneurial spirit and vertical market expansion. German firms are characterized by focusing on providing customized value packages that can best combine their strengths in order to secure niche markets but to maintain technology-oriented niche markets rather than price- and volume-oriented markets [11]. This indicates that since the firms are small but highly flexible, they focus on making good use of their internal resources and capabilities. Additionally, these results support the results of previous studies indicating that internal technical cooperation and processes are more important than external organizations’ cooperation for SMEs’ technological innovation [37]. These results suggest that MMEs in Korea, which are highly dependent on large corporations, need to establish strategies to secure competitiveness in the market based on their own specialized innovation capabilities.
In addition, although government subsidies were found to be an important factor for domestic firms, the foregoing suggests that in order to achieve the growth and independence of firms from a long-term perspective, they should focus on attracting private investments rather than government investment support.
This study not only provides academic and policy implications but also will be a useful reference for future studies in that it has attempted a meta-analysis of German hidden champion firms and domestic middle market enterprises for the first time. In particular, it was identified from the results of this study that in the case of German hidden champion firms, the characteristics of innovation networks that enable active industry–university joint research are activated and that regional and specialized vocational training, technology development, and employment can be systematically linked and consequently lead to the creation of performance. Additionally, in the case of South Korea, various policies are being implemented to foster middle market enterprises, but in order not to end with short-term support, middle market enterprises should focus on reducing their dependence on large firms and lay the groundwork for self-reliance in the long term. In order to reduce social polarization and stabilize employment, it is necessary to reduce wage gaps for professional workers and develop specialized manpower training programs and career paths in connection with R&D investment strategies. In order for the apprenticeship program to train German master craftsmen (meisters) to take root in Korean society, the recognition that workers with the same value should be paid the same wages without discrimination based on gender, age, or status needs to be established in advance [11]. In addition, as digitalization is accelerating due to the recent COVID-19 pandemic, it is necessary to closely examine the German Mittelstand 4.0 policy to find a balance between the digitization of production and work processes, employment stability, and the improvement of labor productivity.

Author Contributions

Conceptualization, M.K., S.L. and Y.-w.S.; data curation, M.K. and Y.-w.S.; formal analysis, M.K., S.L. and Y.-w.S.; methodology, M.K.; project administration, M.K.; validation S.L. and Y.-w.S.; writing—original draft preparation, M.K.; writing—review and editing, M.K., S.L., and Y.-w.S. All authors have read and agreed to the published version of the manuscript.

Funding

This work was supported by the Ministry of Education of the Republic of Korea and the National Research Foundation of Korea (NRF-S201909S00048). This work was supported by a research grant from Seoul Women’s University (2021-0450).

Institutional Review Board Statement

Not applicable.

Informed Consent Statement

Not applicable.

Data Availability Statement

Not applicable.

Conflicts of Interest

The authors declare no conflict of interest.

Appendix A

Table A1. Operational Definition of Variable.
Variable NameOperational Definition
Firm PositionSizeFirm size based on sales
Firm PositionAgeFirm history
Firm PositionLocation(Overseas, western Germany, Domestic) metropolitan area
Firm PositionIndustryIndustrial characteristics, such as the intensity of industrial competition, industrial rate of return, or growth rate
Firm PositionCreditThe creditworthiness of the firm
Firm PositionExportExports/Sales Ratio
Firm PositionMarket shareMarket share
Firm PositionFamily firmWhether the firm is a family firm
Firm PositionNumber of employeesNumber of human resources
Firm PositionHuman CapitalNumber of skilled workers
Firm PositionLabor productivityLabor productivity of workers
Firm PositionFinancial conditionThe financial position of the firm (sales, debt ratio, liquidity)
Firm PositionsubsidyGovernment subsidy/sales
Firm PositionEducationEducation level of CEO
Firm PositionExperienceCEO’s experience in related fields
Innovation PathInnovation OrientationInnovation orientation within the firm (efforts for innovation, such as education and training)
Innovation PathInno_compatencyR&D department arrangement, number of patents and intellectual property rights, new product development capability
Innovation PathOpen InnovationCooperation activities with organizations outside the firm
Innovation PathIn house InnovationInnovation activities within the firm
Innovation PathR&DFinancial investment in innovation activities such as R&D investment and R&D intensity

Appendix B

Table A2. List of Studies Used in the Analysis.
NOAuthorTypeInputOutput
1Audretsch, D.B. & Elston, J A (2006) [38]IPSize
Age
Financial condition
Financial Performance
2Classen, N., Carree, M., Gils, A.V. & Peters, B. (2014) [39]IAPSize
Age
Location
Industry
Export
Human capital
Market share
Family firm
Inno_compatency
Inno_Process/
Non_Financial/
Financial Performance
3Rant, M., & Černe, S. (2017) [40]IPInno_compatency
Innovation orientation
Financial Performance
4Gruenwald, R. K. (2016) [41]IPSize
Financial condition
R&D
Financial Performance
5Bartz and Winkler (2016) [42]IPAge
Innovation orientation
Financial Performance
6Rammer et al. (2009) [43]IPSize
Age
In_house_innovation
Open Innovation
Innovation orientation
Subsidy
Non_Financial
7Sch¨afer et al. (2017) [44]IALocation
Family firm
Human capital
R&D
Financial condition
Subsidy
Inno_Process
8Rammer, C. & Schmiele, A. (2008) [45]IPSize
Age
Location
Labor productivity
Human capital
Open Innovation
In house Innovation
R&D
Non_Financial/
Financial Performance
9Almus, M. & Czarnitzki, D. (2003) [46]IPAge
Market share
Export
Financial condition
Number of employees
Inno_compatency
Open Innovation
Financial Performance
10Harms, R.(2009) [47]IPSize
Age
Experience
R&D
Open Innovation
Financial Performance
11Hertel, M. & Menrad, K. (2016) [48]IAOpen innovationInno_Process
12Müller and Zimmermann (2009) [49]IAAge
Financial condition
Inno_Process
13Czarnitzki, D. & Dlanote (2015) [50]IAAge
Export
Location
Credit
Number of employees
Financial condition
Labor productivity
Subsidy
Inno_Process
14Block, J. h. & Wagner, M. (2010) [51]IPEducation
Experience
Financial Performance
15Andries, P. & Czarnitzki, D. (2014) [52]IPAge
Number of employees
Inno_compatency
R&D
Non_Financial
Performance
16Harms, R., Wagner, M. & Glauner, W.(2010) [53]IAExperienceInno_Process
17Calabrò et al.(2017) [54]IPSize
Age
Industry
Family firm
Financial Performance
18Steeger & Hoffmann (2016) [55]IPSize
Age
Export
R&D
Labor productivity
Financial condition
Innovation Orientation
Non_Financial
Performance
19Ahn, Seungku et al. (2017) [56]IASubsidy
Inno_compatency
Industry
Inno_Process
20Oh, Chung Hyun (2014) [57]IASubsidy
Size
Inno_compatency
Inno_Process
21Jeon, Kwang-Hak et al. (2018) [58]IAPR&D
Inno_compatency
Subsidy
Financial condition
Size
Inno_Process/
Financial Performance
22Jeon, Joong-yang (2018) [59]IAPOpen InnovationInno_Process/
Financial Performance
23Jung, Gap Jin (2015) [60]IAInnovation Orientation
Inno_compatency
Inno_Process
24Jung, Jun-ho et al. (2016) [61]IASubsidy
Financial condition
Export
Age
Inno_Process
25Jung, Jun-ho (2017) [62]IPSubsidyNon_Financial
Performance
26Hwang, Seong-wook (2017) [63]IPAge
Size
Open Innovation
R&D
Financial condition
Financial Performance
27Kim, Do-Eui et al. (2020) [64]IPNumber of employees
Subsidy
Non_Financial
Performance
28Kim, Do-Eui (2021) [65]IPNumber of employees
Industry
Non_Financial
Performance
29Kim, Jungho & Kim, Minseo (2014) [20]IPFinancial condition
Size
Age
R&D
Export
Industry
Financial Performance
30Min, Yong-ki et al. (2021) [66]IAPSubsidyInno_Process/
Non_Financial
Performance
31Oh, Han-seok & Choi, Gyung-hyun (2020) [67]IPSubsidy
Size
R&D
Export
Financial Performance
32Woo, Ki Hoon et al. (2016) [68]IPNumber of employees
Inno_compatency
Financial Performance
33Lee, Byung-yoon (2014) [69]IAOpen Innovation
Size
Inno_Process
34Lee, Jong-ho et al. (2021) [70]IPSubsidyNon_Financial
Performance
35Hyun, Yong-soo et al. (2013) [71]IPNumber of employees
Age
Financial condition
R&D
Open Innovation
Financial Performance
36Hong, Woon Sun & Kim, Hee Jae (2018) [72]IPR&DNon_Financial
Performance
Type I is input, A is activities, P is performance.

References

  1. Rammer, C.; Spielkamp, A. The Distinct Features of Hidden Champions in Germany: A Dynamic Capabilities View; ZEW—Leibniz-Zentrum für Europäische Wirtschaftsforschung: Mannheim, Germany, 2019. [Google Scholar]
  2. Sawng, Y.; Shin, J.; Kim, M. A Reconsideration of Innovation Failure: Evidence from the Korea Innovation Survey. J. Sci. Ind. Res. 2019, 78, 822–826. [Google Scholar]
  3. Dahlke, J.; Bogner, K.; Becker, M.; Schlaile, M.P.; Pyka, A. Crisis-driven innovation and fundamental human needs: A typological framework of rapid-response COVID-19 innovations. Technol. Forecast. Soc. Chang. 2021, 169, 120799. [Google Scholar] [CrossRef]
  4. Kraus, S.; Clauss, T.; Breier, M.; Gast, J.; Zardini, A.; Tiberius, V. The economics of COVID-19: Initial empirical evidence on how family firms in five European countries cope with the corona crisis. Int. J. Entrep. Behav. Res. 2020, 26, 1067–1092. [Google Scholar] [CrossRef]
  5. Wang, Y.; Hong, A.; Lib, X.; Gao, J. Marketing innovations during a global crisis: A study of China firms’ response to COVID-19. J. Bus. Res. 2020, 116, 214–220. [Google Scholar] [CrossRef] [PubMed]
  6. Biron, M.; De Cieri, H.; Fulmer, I.; Lin, C.V.; Mayrhofer, W.; Nyfoudi, M.; Sanders, K.; Shipton, H.; Min, J.; Sun, J. Structuring for innovative responses to human resource challenges: A skunk works approach. Hum. Resour. Manag. Rev. 2020, 31, 100768. [Google Scholar] [CrossRef]
  7. Juergensen, J.; Guimón, J.; Narula, R. European SMEs amidst the COVID-19 crisis: Assessing impact and policy responses. J. Ind. Bus. Econ. 2020, 47, 499–510. [Google Scholar] [CrossRef]
  8. Cankurtaran, P.; Beverland, M.B. Using design thinking to respond to crises: B2B lessons from the 2020 COVID-19 pandemic. Ind. Mark. Manag. 2020, 88, 255–260. [Google Scholar] [CrossRef]
  9. Kim, M.; Park, H.; Sawng, Y.W.; Park, S.Y. Bridging the gap in the technology commercialization process: Using a three-stage technology-product-market model. Sustainbility 2019, 11, 6267. [Google Scholar] [CrossRef] [Green Version]
  10. Jin, S.H.; Choi, S.O. The Effect of Innovation Capability on Business Performance: A Focus on IT and Business Service Companies. Sustainability 2019, 11, 5246. [Google Scholar] [CrossRef] [Green Version]
  11. Kim, I.-S. A Study on the Business Ecosystem of German SMEs and its Implications for Korean SMEs: Focusing on the Hidden Champion Enterprises in Germany. Koreanische Z. Wirtsch. 2014, 32, 69–95. [Google Scholar]
  12. Han, I. Overseas Training Results Report_German SME Competitiveness Analysis and SME Growth Ladder Construction Method Research; Ministry of SMEs and Startups: Sejong-si, Korea, 2019. [Google Scholar]
  13. Cho, Y. The search for a new growth system and Growth engine for small and medium-sized enterprises. Future Growth Res. 2019, 5, 347. [Google Scholar]
  14. Sung, M.-J. Corporate Polarization in the Post-Corona Era; Science and Technology Policy Institute: Sejong-si, Korea, 2021. [Google Scholar]
  15. Simon, H. Hidden Champions: Speerspitze der deutschen Wirtschaft. J. Bus. Eco. 1990, 60, 875–890. [Google Scholar]
  16. Simon, H. Hidden Champions of the 21st Century: Success Strategies of Unknown World Market Leaders; Springer: London, UK, 2009. [Google Scholar]
  17. Ko, S.J.; Kim, K.S. Study on the Characteristics of R & D Investment Pattern for the Middle Size Companies. J. Korea Technol. Innov. Soc. 2009, 12, 525–544. [Google Scholar]
  18. Kang, S.; Park, S. A Relationship between Innovation Capability and Performance: Differences in Firm Development Stages. Asia-Pacific J. Bus. Ventur. Entrep. 2018, 13, 91–100. [Google Scholar] [CrossRef]
  19. Lee, Y.-J.; Kwon, K.-H. Let’s Raise a Real Unicorn! STEPI Insight, Science and Technology Policy Institute: Sejong-si, Korea, 2020. [Google Scholar]
  20. Kim, J.; Kim, M. Effects of Innovation and Export on the Performance of Medium-sized Firms: The Moderating Role of Corporate Type. Korean Manag. Rev. 2014, 43, 1787–1812. [Google Scholar]
  21. Voeth, M.; Herbst, U.; Barisch, S. Hidden Champion Region Stuttgart—Ergebnisse einer Empirischen Untersuchung; Hohenheimer Arbeits- und Projektberichte zum Marketin: Hohenheim, Germany, 2007. [Google Scholar]
  22. Yu, H.; Chen, Y. Factors Underlying Hidden Champions in China: Case Study. Master’s Thesis, University Halmstad, Halmstad, Sewden, May 2009. [Google Scholar]
  23. Teece, D.J.; Pisano, G.; Shuen, A. Dynamic Capabilities and Strategic Management. Strateg. Manag. J. 1997, 18, 509–533. [Google Scholar] [CrossRef]
  24. Cohen, W.M.; Levintbal, D.A. Absorptive Capacity: A New Perspective on Learning and Innovation. Adm. Sci. Q. 1990, 35, 128–152. [Google Scholar] [CrossRef]
  25. Simon, H. Hidden Champions: Aufbruch Nach Globalia; Campus Verlag GmbH: Frankfurt, Germany, 2012. [Google Scholar]
  26. Audretsch, D.B.; Lehmann, E.E.; Schenkenhofer, J. Internationalization strategies of hidden champions: Lessons from Germany. Multinatl. Bus. Rev. 2018, 26, 2–24. [Google Scholar] [CrossRef]
  27. Kirner, E. Are Knowledge Angels the Secret behind the Success of Hidden Champions and Hidden Innovators? EvoREG Research Note: Basel, Switzerland, 2011. [Google Scholar]
  28. Venohr, B.; Strasse, B.; Berlin, D.; Meyer, K.E. The German Miracle Keeps Running: How Germany ’ s Hidden Champions Stay Ahead in the Global Economy; Institute of Management, Berlin School of Economics: Berlin, Germany, 2007; pp. 1–35. [Google Scholar]
  29. Seong-dong, H. Easy-to-Understand Meta-Analysis; Hakjisa: Seoul, Korea, 2014. [Google Scholar]
  30. Seong-sam, O. Theory and Practice of Meta-Analysis; Konkuk University Press: Seoul, Korea, 2002. [Google Scholar]
  31. Borenstein, M.; Hedges, L.V.; Higgins, J.P.T.; Rothstein, H.R. Introduction to Meta-Analysis; John Wiley & Sons, Ltd.: Chichester, UK, 2009. [Google Scholar]
  32. Chung, B.; Hyun, B. Meta-Analysis on Factors Influencing Technology Transfer Performance. J. Korea Technol. Innov. Soc. 2018, 21, 522–559. [Google Scholar]
  33. Shadish, W.R.; Haddock, C.K. Combining estimates of effect size. In The Handbook of Research Synthesis; Cooper, H., Hedges, L.V., Eds.; Russell Sage Foundation: New York, NY, USA, 1994. [Google Scholar]
  34. Huedo-Medina, T.B.; Sanchez-Meca, J.; Marin-Martinez, F.; Botella, J. Assessing heterogeneity in meta-analysis: I2 or Q statistic? Psychol. Methods 2006, 11, 193–206. [Google Scholar] [CrossRef] [Green Version]
  35. Cohen, J. Statistical Power Analysis for the Behavioral Science, 2nd ed.; Lawrence Erlbaum Associates: Mahwah, NJ, USA, 1988. [Google Scholar]
  36. Kim, J.; Kim, M.; Park, H. A Meta-analysis on Antecedents and Consequences of Technological Innovation: Focused on Empirical Analyses of South Korea’s SMEs. Asia Pacific J. Small Bus. 2020, 42, 43–67. [Google Scholar] [CrossRef]
  37. Rosenbusch, N.; Brinckmann, J.; Bausch, A. Is innovation always beneficial? A meta-analysis of the relationship between innovation and performance in SMEs. J. Bus. Ventur. 2011, 26, 441–457. [Google Scholar] [CrossRef] [Green Version]
  38. Audretsch, D.B.; Elston, J.A. Can institutional change impact high-technology firm growth?: Evidence from Germany’s Neuer Markt. J. Product. Anal. 2006, 25, 9–23. [Google Scholar] [CrossRef] [Green Version]
  39. Classen, N.; Carree, M.; van Gils, A.; Peters, B. Innovation in family and non-family SMEs: An exploratory analysis. Small Bus. Econ. 2014, 42, 595–609. [Google Scholar] [CrossRef]
  40. Rant, M.B.; Cerne, S.K. Becoming a Hidden Champion: From Selective use of Customer Intimacy and Product Leadership to Business Attractiveness. South East Eur. J. Econ. Bus. 2017, 12, 89–103. [Google Scholar] [CrossRef] [Green Version]
  41. Gruenwald, R.K. Causes of High-Growth of Small- and Mid-Cap Companies in the DACH Countries. Ph.D. Thesis, Uniwersytet Ekonomiczny W Krakowie, Kraków, Poland, 2016. [Google Scholar]
  42. Bartz, W.; Winkler, A. Flexible or fragile? The growth performance of small and young businesses during the global financial crisis—Evidence from Germany. J. Bus. Ventur. 2016, 31, 196–215. [Google Scholar] [CrossRef]
  43. Rammer, C.; Czarnitzki, D.; Spielkamp, A. Innovation success of non-R&D-performers: Substituting technology by management in SMEs. Small Bus. Econ. 2009, 33, 35–58. [Google Scholar] [CrossRef] [Green Version]
  44. Schäfer, D.; Stephan, A.; Mosquera, J.S. Family ownership: Does it matter for funding and success of corporate innovations? Small Bus. Econ. 2017, 48, 931–951. [Google Scholar] [CrossRef]
  45. Rammer, C.; Schmiele, A. Driver and Effects of Internationalizing Innovation by SMEs; Discussion Paper No. 08-035; ZEW—Centre for European Economic Research: Mannheim, Germany, 2008. [Google Scholar]
  46. Almus, M.; Czarnitzki, D. The effects of public R and D subsidies on firms’ innovation activities: The case of Eastern Germany. J. Bus. Econ. Stat. 2003, 21, 226–236. [Google Scholar] [CrossRef]
  47. Harms, R. A Multivariate Analysis of the Characteristics of Rapid Growth Firms, Their Leaders, and Their Market. J. Small Bus. Entrep. 2009, 22, 429–454. [Google Scholar] [CrossRef]
  48. Hertel, M.; Menrad, K. Adoption of energy-efficient technologies in German SMEs of the horticultural sector—the moderating role of personal and social factors. Energy Effic. 2016, 9, 791–806. [Google Scholar] [CrossRef]
  49. Müller, E.; Zimmermann, V. The importance of equity finance foR R&D activity. Small Bus. Econ. 2009, 33, 303–318. [Google Scholar] [CrossRef]
  50. Czarnitzki, D.; Delanote, J. R&D policies for young SMEs: Input and output effect. Small Bus. Econ. 2015, 45, 465–485. [Google Scholar]
  51. Block, J.H.; Marcus, W. Necessity and opportunity entrepreneurship in Germany: Characteristics and Earning Differentials. Necessity Entrep. 2010, 62, 154–174. [Google Scholar]
  52. Andries, P.; Czarnitzki, D. Small firm innovation performance and employee involvement. Small Bus. Econ. 2014, 43, 21–38. [Google Scholar] [CrossRef] [Green Version]
  53. Harms, R.; Wagner, M.; Glauner, W. Relating Personal, Firm-based and Environmental Factors to the Monetary and Temporal Engagement in Corporate Social Responsibility in German Gazelles. J. Small Bus. Entrep. 2010, 23, 195–210. [Google Scholar] [CrossRef]
  54. Calabrò, A.; Campopiano, G.; Basco, R. Principal-principal conflicts and family firm growth: The moderating role of business family identity. J. Fam. Bus. Manag. 2017, 7, 291–308. [Google Scholar] [CrossRef]
  55. Steeger, J.H.; Hoffmann, M. Innovation and family firms: Ability and willingness and German SMEs. J. Fam. Bus. Manag. 2016, 6, 251–269. [Google Scholar] [CrossRef]
  56. Ahn, S.; Kim, J.; Kim, J.; Technology, K.; Society, I. The Effect of Public R&D Support on R&D Investment of Korean Medium-sized Firms. J. Korea Technol. Innov. Soc. 2017, 20, 546–575. [Google Scholar]
  57. Oh, C.H. A Study on the Effects of Alliance Capability on Cooperative R&D Activities’ Performance: Alliance Capability Drivers; The Graduate School Korea University of Technology Education Cooperative: Seoul, Korea, 2013. [Google Scholar]
  58. Jeon, K.-H.; Ha, S.-T.; Park, J.-E.; Park, M.-K. The Effect of Corporate Innovation Activities and Government Policy on Corporate Outcomes: Focusing on Small and Medium Enterprises. Korean Account. J. 2018, 27, 295–323. [Google Scholar] [CrossRef]
  59. Jeon, J.Y. A Study on the R&D Cooperation Characteristics and Innovation Performance of SMEs; Graduate School of Konkuk University: Seoul, Korea, 2018. [Google Scholar]
  60. Jung, G. Impact of Internal Marketing Factorson Technological Innovation in Organizations and Perceived Service Quality; Graduate School, Daejeon University: Daejeon, Korea, 2015. [Google Scholar]
  61. Jung, J.-H.; Kim, J.-S.; Choi, K.; Lee, B.-H. Effectiveness of Government R&D on Firms R&D Spending. J. Korea Contents Assoc. 2016, 16, 150–162. [Google Scholar]
  62. Jung, J. Effectiveness of Government R&D Subsidies on R&D Investment of Each Type of Firm; University of Science and Technology: Seoul, Korea, 2017. [Google Scholar]
  63. Hwang, S.-W. The Effect of R&D Capabilities, Financial Stability and Internationalization on the Business Performance of Medium-Large Enterprise Focusing on Panel Analysis of Manufacturing Industry; Graduate School of Konkuk University: Seoul, Korea, 2017. [Google Scholar]
  64. Kim, D.-E.; Jeong, J.-H.; Lee, C.; Min, Y.-K. Determinants of R&D Capability of Mid-Sized DomesticExport Companies: Firm Level, Market Level, Government Level. Int. Bus. Rev. 2021, 24, 197–209. [Google Scholar]
  65. Kim, D.-E. Empowering Factors of Corporate Technology Planning Capabilities: Focusing on Small and Medium-Sized Companies. Korean Manag. Consult. Rev. 2021, 21, 441–450. [Google Scholar]
  66. Min, Y.; Jeong, J.; Lee, C.; Kim, D. The Effect of Government R&D Support Programs on R & D Investment and Innovation Performance in Korean Medium Sized Enterprises. Korean Manag. Rev. 2021, 50, 173–195. [Google Scholar]
  67. Oh, H.; Choi, G. Economic Performance Anaiysis of Public Support for Technology Innovation-led Enterprises: Focused on World Class 300 Project. Asia-Pacific J. Bus. Ventur. Entrep. 2020, 15, 121–133. [Google Scholar]
  68. Woo, K.H.; Park, B.J.; Park, S.Y. The Impact of the Capabilities of R&D Intensive Firms on Export Performance: Focusing on SMEs and Mid-sized Firms. Asia-Pacific J. Bus. Ventur. Entrep. 2016, 11, 167–178. [Google Scholar]
  69. Lee, B. An Empirical Study of the Impacts of Open Innovation of SMEs and HPE on Business Performance. J. Ind. Econ. Bus. 2014, 27, 2483–2511. [Google Scholar]
  70. Lee, J.L.; Sim, J.; Lim, C.-L.; Jung, W.-J. Impact of Government R&D Support on the Performance of Middle Market Enterprises. J. Korea Technol. Innov. Soc. 2021, 24, 139–160. [Google Scholar]
  71. Hyun, Y.S.; Lee, B.H.; Lee, J.S. The impact of technology acquisition strategy on firm performance in Korean Medium size Enterprises. Asia-Pacific J. Bus. Ventur. Entrep. 2013, 8, 1–16. [Google Scholar]
  72. Hong, W.S.; Kim, H.J. The Impact of Technological Innovation Activities on Firm Growth. Sci. Technol. Policy 2018, 1, 63–86. [Google Scholar]
Figure 1. Growth rate of MMEs in Korea (The Government of the Republic of Korea, 2020).
Sustainability 14 01469 g001
Figure 2. Structure of variables.
Sustainability 14 01469 g002
Table 1. SME definition of the IfM Bonn (https://en.ifm-bonn.org (accessed on 7 July 2021).
Firm SizeNo. of EmployeesTurnover in EUR p.a.
MicroUp to 9up to 2 million
SmallUp to 49up to 10 million
Medium-SizedUp to 499up to 50 million
SME (overall)Under 500up to 50 million
Table 2. Comparison of SME characteristics.
Germany (2018)South Korea (2018)
SMEsNo. of Companies3,476,814 (99.8%)6,638,694 (99.9%)
SMEsRatio of Employment in the Entire Industry64.1%83.1%
SMEsRatio of Sales in the Entire Industry58.6%48.5%
SMEsRatio of Export in the Entire Industry15.93%34.1%
Table 3. Variable in domestic and foreign literature.
DivisionOverseasDomestic
Dynamic CapabilitiesFirm PositionResourceSize
Age
Location
Industry
Credit
Export
Family firm
Market share
Size
Age
Location
Industry
Export
Market share
Dynamic CapabilitiesFirm PositionEmployeeNumber of employees
Human capital
Labor productivity
Number of employees
Dynamic CapabilitiesFirm PositionFinanceFinancial condition
Subsidy
Financial condition
Subsidy
Dynamic CapabilitiesFirm PositionEntrepreneurialEducation
Experience
Gender
Dynamic CapabilitiesInnovation pathInnovation orientation
Innovation competency
Innovation expenditure
Open Innovation
In house Innovation
R&D
Innovation orientation
Innovation competency
Innovation expenditure
Open Innovation
Dynamic CapabilitiesInnovation Process: ActivitiesProduct Innovation
Process Innovation
Technology Application
R&D cost
R&D employment
Open Innovation
R&D cost
Open Innovation
In house Innovation
Innovation Outcome: Financial PerformanceGrowth: Sale, Total asset, Revenue, Employee, Gross earnings
Efficiency: Asset turnover, internal rate of return, Labor productivity
Growth: Sale, Total asset, Revenue, Employee, Gross earnings
Efficiency: Asset turnover, internal rate of return, Labor productivity, Net profit, Operating profit, Sales per employee
Innovation Outcome: Non-financial PerformanceProduct innovation output
Process innovation output
Innovation success
New product development
Product innovation output: New product development, Product Improvement
Process innovation output: Process Improvement
Innovation success
Patent application
Number of Effect size198229
Table 4. Verification of publication bias (left: German hidden champion firms (Overseas), right: South Korean MMEs (Domestic)).
Input factor → Innovation Process
Sustainability 14 01469 i001 Sustainability 14 01469 i002
Z-value: 24.971/p-value: 0.000/α:0.05/Z for α: 1.95/K:75/stability coefficient: 2100Z-value: 14.317/p-value: 0.000/α:0.05/Z for α: 1.95/K:12/stability coefficient: 629
Input factor → outcome factor (Non-financial performance)
Sustainability 14 01469 i003 Sustainability 14 01469 i004
Z-value: 30.472/p-value: 0.000/α:0.05/Z for α: 1.95/K:31/stability coefficient: 7463Z-value: 49.158/p-value: 0.000/α:0.05/Z for α: 1.95/K:80/stability coefficient: 10,247
Input factor → outcome factor (Financial performance)
Sustainability 14 01469 i005 Sustainability 14 01469 i006
Z-value: 89.229/p-value: 0.000/α:0.05/Z for α: 1.95/K:92/stability coefficient: 10,592Z-value: 26.794/p-value: 0.000/α:0.05/Z for α: 1.95/K:137/stability coefficient: 5469
Table 5. Results of homogeneity verification.
Analysis ModelKESQpI2
OverseasInput → Inno_Process750.0971016.250.00092.718
OverseasInput → Non_financial310.1632071.6410.00098.551
OverseasInput → Financial920.08621,444.4390.00099.575
DomesticInput → Inno_Process120.148136.1760.00091.922
DomesticInput → Non_financial800.287899.1290.00091.214
DomesticInput → Financial1370.1361076.1790.00087.363
K = number of effect sizes, ES = effect size, Q = Q value, p = significance level, I2 = % of the variability of the effect sizes.
Table 6. Comparison of the sizes of the effects of outputs in domestic and overseas literature.
InputOutput
(Innovation Process + Innovation Performance)
OverseasDomestic
KESKES
Firm PositionSize130.225 ***180.340 ***
Firm PositionAge160.140 ***130.119 **
Firm PositionLocation120.242 *40.178 *
Firm PositionIndustry50.054160.076 ***
Firm PositionCredit50.037 *
Firm PositionExport40.242 **90.065 *
Firm PositionMarket share30.070
Firm PositionFamily firm100.077 ***
Firm PositionNumber of employees100.041 *80.162 *
Firm PositionHuman Capital100.330 *
Firm PositionLabor productivity40.305 *
Firm PositionFinancial condition370.225 ***310.116 ***
Firm Positionsubsidy70.073 **510.196 ***
Firm PositionEducation20.025
Firm PositionExperience90.303 ***
Innovation PathInnovation Orientation110.098 **250.323 ***
Innovation PathInno_compatency80.127 **210.296 ***
Innovation PathOpen Innovation110.437 **120.125 *
Innovation PathIn house Innovation50.739 *
Innovation PathR&D160.209 *210.129 ***
K198229
ES0.2100.195
Q25,517.2782988.563
p0.0000.000
I299.22892.371
* p < 0.05, ** p < 0.01, *** p < 0.001, K = number of effect sizes, ES = effect size, Q = Q value, p = significance level, I2 = % of the variability of the effect sizes.
Table 7. Comparison of the sizes of effects on activity factors (innovation activities) in domestic and overseas literature.
InputInnovation Process
OverseasDomestic
KES−95% CI+95% CIpKES−95% CI+95% CIp
Firm PositionSize20.047 **0.0120.0820.009
Firm PositionAge50.139(0.027)0.3050.10220.037(0.013)0.0880.147
Firm PositionLocation60.108(0.006)0.2220.063
Firm PositionIndustry40.049 ***0.0240.0730.00010.070(0.011)0.1500.088
Firm PositionCredit40.045 *0.0090.0810.014
Firm PositionExport20.224 **0.0940.3480.00120.042(0.011)0.0940.119
Firm PositionMarket share20.000(0.035)0.0351.000
Firm PositionFamily firm50.054 *0.0100.0970.015
Firm PositionNumber of employees60.025(0.007)0.0570.129
Firm PositionHuman Capital50.140 *0.0250.2550.017
Firm PositionLabor productivity10.396 ***0.3430.4460.000
Firm PositionFinancial condition80.040 ***0.0200.0610.00020.042 ***(0.011)0.0940.000
Firm Positionsubsidy70.072 **0.0200.1240.00740.175 **0.1080.2410.003
Firm PositionEducation
Firm PositionExperience40.281 ***0.1600.3940.000
Innovation PathInnovation Orientation
Innovation PathInno_compatency30.092(0.046)0.2250.19110.1200.0400.1990.088
Innovation PathOpen Innovation10.716 ***0.6070.7980.000
Innovation PathIn house Innovation
Innovation PathR&D100.101 **0.0430.1570.001
Total750.070 ***0.0600.0800.000120.082 ***0.0550.1100.000
* p < 0.05, ** p < 0.01, *** p < 0.001, K = number of effect sizes, ES = effect size, CI = confidence interval, p = significance level.
Table 8. Comparison of the sizes of effects on outcome factors (non-financial performance) in domestic and overseas literature.
InputNonfinancial Performance
OverseasDomestic
KES−95% CI+95% CIpKES−95% CI+95% CIp
Firm PositionSize30.081 *0.0120.1490.02110.052(0.159)0.2590.631
Firm PositionAge50.086 **0.0360.1370.00130.059(0.039)0.1560.237
Firm PositionLocation20.091(0.048)0.2290.200
Firm PositionIndustry 50.087 **0.0260.1470.005
Firm PositionCredit
Firm PositionExport10.448 ***0.3910.5040.000
Firm PositionMarket share
Firm PositionFamily firm20.096(0.053)0.2440.206
Firm PositionNumber of employees20.070(0.068)0.2090.31740.266 **0.0740.4400.007
Firm PositionHuman Capital20.469(0.313)1.2500.240
Firm PositionLabor productivity10.080 **0.0240.1370.005
Firm PositionFinancial condition10.141 ***0.0850.1970.00030.137 **0.0480.2240.003
Firm Positionsubsidy 220.303 ***0.2260.3760.000
Firm PositionEducation
Firm PositionExperience
Innovation PathInnovation Orientation70.100(0.009)0.2090.071250.323 ***0.2730.3720.000
Innovation PathInno_compatency20.203 ***0.1230.2830.000120.373 ***0.2890.4520.000
Innovation PathOpen Innovation 40.272 *0.0050.5030.046
Innovation PathIn house Innovation
Innovation PathR&D30.616 *0.0151.2160.04410.070(0.086)0.2230.380
Total310.163 ***0.1400.1860.000800.204 ***0.1770.2310.000
* p < 0.05, ** p < 0.01, *** p < 0.001, K = number of effect sizes, ES = effect size, CI = confidence interval, p = significance level.
Table 9. Comparison of the sizes of effects on outcome factors (financial performance) in domestic and overseas literature.
InputFinancial Performance
OverseasDomestic
KES−95% CI+95% CIpKES−95% CI+95% CIp
Firm PositionSize80.319 ***0.1510.4700.000170.355 ***0.2420.4590.000
Firm PositionAge60.181 ***0.0790.2820.00080.160 **0.0610.2550.002
Firm PositionLocation40.519(0.003)1.0400.05140.178 *0.0270.3210.021
Firm PositionIndustry10.141 *0.0170.2640.025100.075 ***0.0390.1100.000
Firm PositionCredit10.001(0.060)0.0620.974
Firm PositionExport10.059(0.002)0.1200.05770.109 *0.0110.2050.029
Firm PositionMarket share10.213 ***0.1490.2780.000
Firm PositionFamily firm30.116 **0.0390.1910.003
Firm PositionNumber of employees20.067(0.031)0.1640.18040.050(0.028)0.1280.210
Firm PositionHuman Capital30.555(0.340)1.4500.224
Firm PositionLabor productivity20.361(0.249)0.9720.246
Firm PositionFinancial condition280.275 ***0.1640.3790.000260.090 ***0.0430.1360.000
Firm Positionsubsidy 250.085 ***0.0530.1170.000
Firm PositionEducation20.025(0.007)0.0570.122
Firm PositionExperience50.312 **0.1020.5230.004
Innovation PathInnovation Orientation40.074 *0.0120.1370.019
Innovation PathInno_compatency30.110(0.009)0.2300.07080.198 *0.0350.3510.018
Innovation PathOpen Innovation100.391(0.016)0.7990.06080.049(0.003)0.0990.062
Innovation PathIn house Innovation50.739 *0.0131.4650.046
Innovation PathR&D30.164 *0.0070.3210.040200.132 ***0.0900.1740.000
Total920.086 ***0.0690.1030.0001370.095 ***0.0790.1110.000
* p < 0.05, ** p < 0.01, *** p < 0.001, K = number of effect sizes, ES = effect size, CI = confidence interval, p = significance level.
Table 10. Comprehensive growth engines of middle market enterprises.
OverseasDomestic
Firm PositionFirm size
History
Industrial characteristics
Proportion of exports
Market share
Family firm
Firm size
History
Location
Proportion of exports
Market share
Firm PositionSkilled manpower
Labor productivity
Financial position
Level of manpower
Financial position
Government subsidy
Firm PositionCEO’s experience
Innovation PathOpen innovation
Introverted innovation
Proportion of R&D
Innovation orientation
Innovation capability
Open innovation
Proportion of R&D
Publisher’s Note: MDPI stays neutral with regard to jurisdictional claims in published maps and institutional affiliations.

