Article

Effect of Solid Phosphate Sludge Amendments on the Growth of Fruit and Forest Trees in the Nursery

1
Laboratory of Plant, Faculty of Sciences of Kenitra, Animal and Agro-Industry Productions-Ibn Tofail University, Kenitra 14000, Morocco
2
Plant Protection Unit, Regional Center of Agricultural Research of Kenitra, National Institute of Agricultural Research, Avenue Ennasr, BP 415 Rabat Principale, Rabat 10090, Morocco
3
Integrated Crop Production Research Unit, Regional Center of Agricultural Research of Agadir, National Institute of Agricultural Research, Avenue Ennasr, BP 415 Rabat Principale, Rabat 10090, Morocco
*
Author to whom correspondence should be addressed.
Sustainability 2022, 14(24), 16819; https://doi.org/10.3390/su142416819
Submission received: 27 October 2022 / Revised: 30 November 2022 / Accepted: 2 December 2022 / Published: 15 December 2022

Abstract

:
Phosphorus deficiency is a major limiting factor in horticultural production. One potential solution can be restoring soil phosphorus from mineral resources, such as solid phosphate sludge (SPS) generated from phosphate treatment processes at mining sites in agriculture. This study explores the possibility of using this sludge in nurseries to produce fruit and forest plants. We tested six mixtures of SPS with the sandy soil of the Maamora forest on ten plant species. In the second experiment, we tested the same mixtures with sea sand. In addition, one concentration of four composts based on phosphate sludge was also tested on two citrus rootstocks and carob. The first experiment’s results showed significantly higher growth with the control mixture for pomegranate, acacia, and C. volkameriana plants. The relative growth was higher at SPS concentrations of 20% to 30% for the other plant species, although there was no significant difference between treatments. The estimations of AUGPC (area under the growth progress curve) showed no significant difference in most species. In the second experiment, the relative growth in the M4 (30% of SPS + 70% of sand) mixture was higher, and the AUGCP showed a significant difference compared to the M1 control mixture. The application of solid phosphate sludge positively affects and improves the growth of fruit and forest trees in the nurseries, especially when the concentration is between 20 and 30%. For this purpose, the phosphate sludge could have great potential to be used in nurseries and create a favourable soil condition as a cultivation substrate.

1. Introduction

Phosphorus (P) deficiency is one of the major limiting factors for plant growth in horticultural crops. Adding phosphorus inputs is necessary for sustainable agricultural crops [1]. Deficient phosphorus in substrates produces irregular growth, both in the aerial and root systems, which impairs seedling quality [2]. It is an essential constituent of ATP, which serves as a source of energy for plant metabolism and stimulates the growth of fine roots that are very important for seedling development [3]. Nutrients in the substrate are essential to the proper growth of seedlings in the nursery in terms of height, diameter, and mass production [4]. Nevertheless, phosphorus availability is low in soils because of its fixation as insoluble phosphates of iron, aluminum, and calcium in acidic or calcareous soil [5]. Despite the large amount of total P immobilized on the surfaces of soil mineral particles, the available soluble P is often too small to support good plant growth [6]. Consequently, small-scale farmers often have difficulty accessing fertilizer supplies due to the high cost of mineral fertilizers.
Phosphate refers to the product of mining and subsequent metallurgical treatment of ores containing phosphorus [7]. Its low price is very attractive as a phosphate fertilizer, and it is relatively slow to release soluble P compared to industrial P fertilizers [5]. The direct application of phosphate rocks and their modified forms has been recommended as alternatives for P fertilization.
Additionally, with large quantities deposited in the open air and higher carbonate contents, natural phosphate rock dumps and phosphate sludge have the most damaging effects on the environment. This accumulation of by-products represents a risk and a big problem for storage capacities [8]. Based on its composition, phosphate sludge might contain characteristics similar to those of phosphate rock [9]. It consists of fine clayey particles and still contains an important amount of P [10]. This solid phosphate sludge, generated from phosphate treatment processes at mining sites in agriculture, is an alternative recovery technique for phosphate. SPS can control some soil-borne pathogens and improve the plant growing in the nursery after composting or inoculation with arbuscular mycorrhizal fungi [11,12,13]. Phosphate wash sludge is also rich in mineral elements [8]. We hypothesize that using sludge in a nursery can recover some of the mineral elements that are essential substrates for growing plants, including phosphorus. Thus, this study aims to assess the effect of solid phosphate sludge amendments on the growth of fruit and forest trees in a nursery.

2. Materials and Methods

2.1. Origin of the Phosphate Sludge and Mixtures Compositions

The solid phosphate sludge was collected from the Khouribga phosphate treatment sludge disposal site. The physico-chemical parameters of SPS have been mentioned in Table 1. Nurserymen in the Rabat-Sale-Kénitra region use the sandy soil of the Maamora forest. This substrate has been used as a control (S1: without sludge) and to make the various amendments with SPS. The soil used as a control for the second experiment and for the preparation of mixtures is sea sand. Four composts based on SPS and horticultural residues produced at the INRA center in Agadir, Morocco (30°02′36″ N; 9°33′13″ W) were added.

2.2. Effect of the Amendments of Solid Phosphate Sludge and Maamora Soil on the Plant Growth in the Nursery (Experiment 1)

The experiment was carried out for six months. Sludge-based mixtures were mixed with different concentrations of 10, 20, 30, 40, and 50% (S2, S3, S4, S5, and S6, respectively) (v/v) (Table 2). The Maamora soil is used to prepare mixtures (sandy soil, pH: 6.24, EC: 0.08 ms/cm and with 21.79% of water retention as a fresh weight) and is also used alone as a control treatment (S1). The test was conducted in a greenhouse, at the experimental station El Menzeh (INRA-Kenitra) in the Rabat-Sale-Kenitra region of Morocco (34°17′46″ N; 6°29′03″ W). The fruit and forest plants used in this experiment are apple (Malus halliana), olive (Olea europaea L. cv. Picholine), pomegranate (Punica granatum), sour orange (Citrus aurantium), Citrus volkameriana, Carrizo citrange, Citrus macrophylla, argan (Argania spinosa), carob (Ceratonia siliqua), and acacia (Acacia Senegal).
Homogeneous seedlings have been transplanted in pots containing approximately 2 kg (16.5 cm × 14 cm) of substrate mixtures according to a completely randomized block design with six repetitions [12].
The plants were watered every second day individually with the same quantity and treated with pesticides against disease fortnightly in the growth room (greenhouse). The average maximum temperatures during these months were respectively (32.16, 33.12, and 33.37 °C), the minimum temperatures were, respectively, 15.04, 18.93, and 19.29 °C, and the relative humidity was between 60 and 90%.

2.3. Effect of the Amended Sand and Solid Phosphate Sludge on the Plant Growth in the Nursery (Experiment 2)

The experiment was carried out for five months. The sea sand has been washed three times to remove salts. Sand-based mixtures were mixed with different concentrations 10, 20, 30, 40, and 50% (M2, M3, M4, and M5, respectively) of phosphate sludge and the 10% concentration of four agricultural waste composts in mixing with phosphate sludge (M7, M8, M9, and M10) (Table 3). The four composts are B1 (manure 30%, P sludge 41%, and tomato waste 29%), B2 (manure 30%, P sludge 29% and tomato waste 41%), B3 (manure 30%, P sludge 35%, and tomato waste 35%), and B7 (manure 10%, P sludge 10%, tomato waste 20%, and olive cake 60%). The poor sand is used as a control mixture (M1) to prepare mixes. The test was conducted in the same conditions as the first experiment for Citrus volkameriana, Carrizo Citrange, and carob plants.
During the five months, the average maximum temperatures were, respectively, 33.11, 33.21, and 33.37 °C; the minimum temperatures were, respectively, 14.04, 14.29, and 16.93 °C; and the relative humidity was between 60 and 90%.

2.4. Measured Parameters

Plant height, trunk diameter, and leaf chlorophyll content index (SPAD values) were assessed. The leaf chlorophyll content was determined using a portable chlorophyll meter on three leaves per plant (SPAD-502, Minolta Co., Ltd., Osaka, Japan). The chlorophyll content index was recorded at the 2/3 position from the leaf based at the apex of a fully expanded leaf [14]. The observation was made fortnightly on apple, olive, sour orange, Carrizo Citrange, Citrus volkameriana, and Citrus macrophylla plants and started at 15 days after transplanting for all the treatments with their six repetitions. For the other forest seedlings, SPAD values were not recorded due to the small leaf area of the seedlings, which was not supported by the SPAD device.
The relative growth (RG) was calculated [12]:
RG% = [(St − S0)/S0] × 100
where S0 is the initial size and St is the final size.
According to Baiz [12], estimates of the area under the growth progression curve (AUGPC) were calculated during the growth period according to the trapezoidal integration method (ten measuring dates were included).

2.5. Statistical Analysis Method

The variance and covariance analyses were performed on a triplicate basis. For assessing the significance of differences between the values of each parameter, the homogeneity of variance was determined. One-way analysis of variance and means comparison based on the Newman and Keuls test at p < 0.05. The difference in AUDPG was assessed by covariance analysis. The statistical treatment of the results was carried out using SPSS Statistics 23.0 software.

3. Results

3.1. Effect of the Amendments of Solid Phosphate Sludge and Maamora Soil on the Plant Growth in the Nursery (Experiment 1)

For each parameter measured, the relative growth was determined in percentage and varied considerably between species. The application of soil amendments positively affected the growth of apple plants. From Table 4, the highest relative height growth was observed in the S4 mixture with 30% phosphate sludge and was significantly different from the other mixtures (Table 4). In addition, no significant difference was shown between all mixtures for relative diameter growth and chlorophyll index of these plants.
The supply of 30% of sludge amendments improved the relative height growth for olive plants (S4 mixture), although no significant difference was shown. The same results were noted for relative diameter growth and chlorophyll index SPAD (Table 4).
Similarly, C. volkameriana plant growth was not increased by the application of SPS amendments, and relative height and diameter growth were higher in the control mixture. For sour orange plants, no significant difference was observed. Nevertheless, the growth was improved with 40% of the phosphate sludge application, especially for the growth diameter of these plants (Table 5). Meanwhile, for pomegranate plants, the relative height growth was not significantly affected by supplying SPS, and higher growth was recorded in the control mixture with 306%. However, there was no significant difference in the relative diameter growth (Table 6).
The greatest relative height and diameter growth was noted in the S4 and S3 mixtures for Carrizo citrange and C. macrophylla plants, respectively, although there was no significant difference. Moreover, the forest plants: carob, argan, and acacia were not affected by the addition of phosphate sludge amendments, and no significant difference was recorded in all mixtures. However, we pointed out that the highest relative growth was noticed in S3 and S4 mixture plants (Table 5 and Table 6).
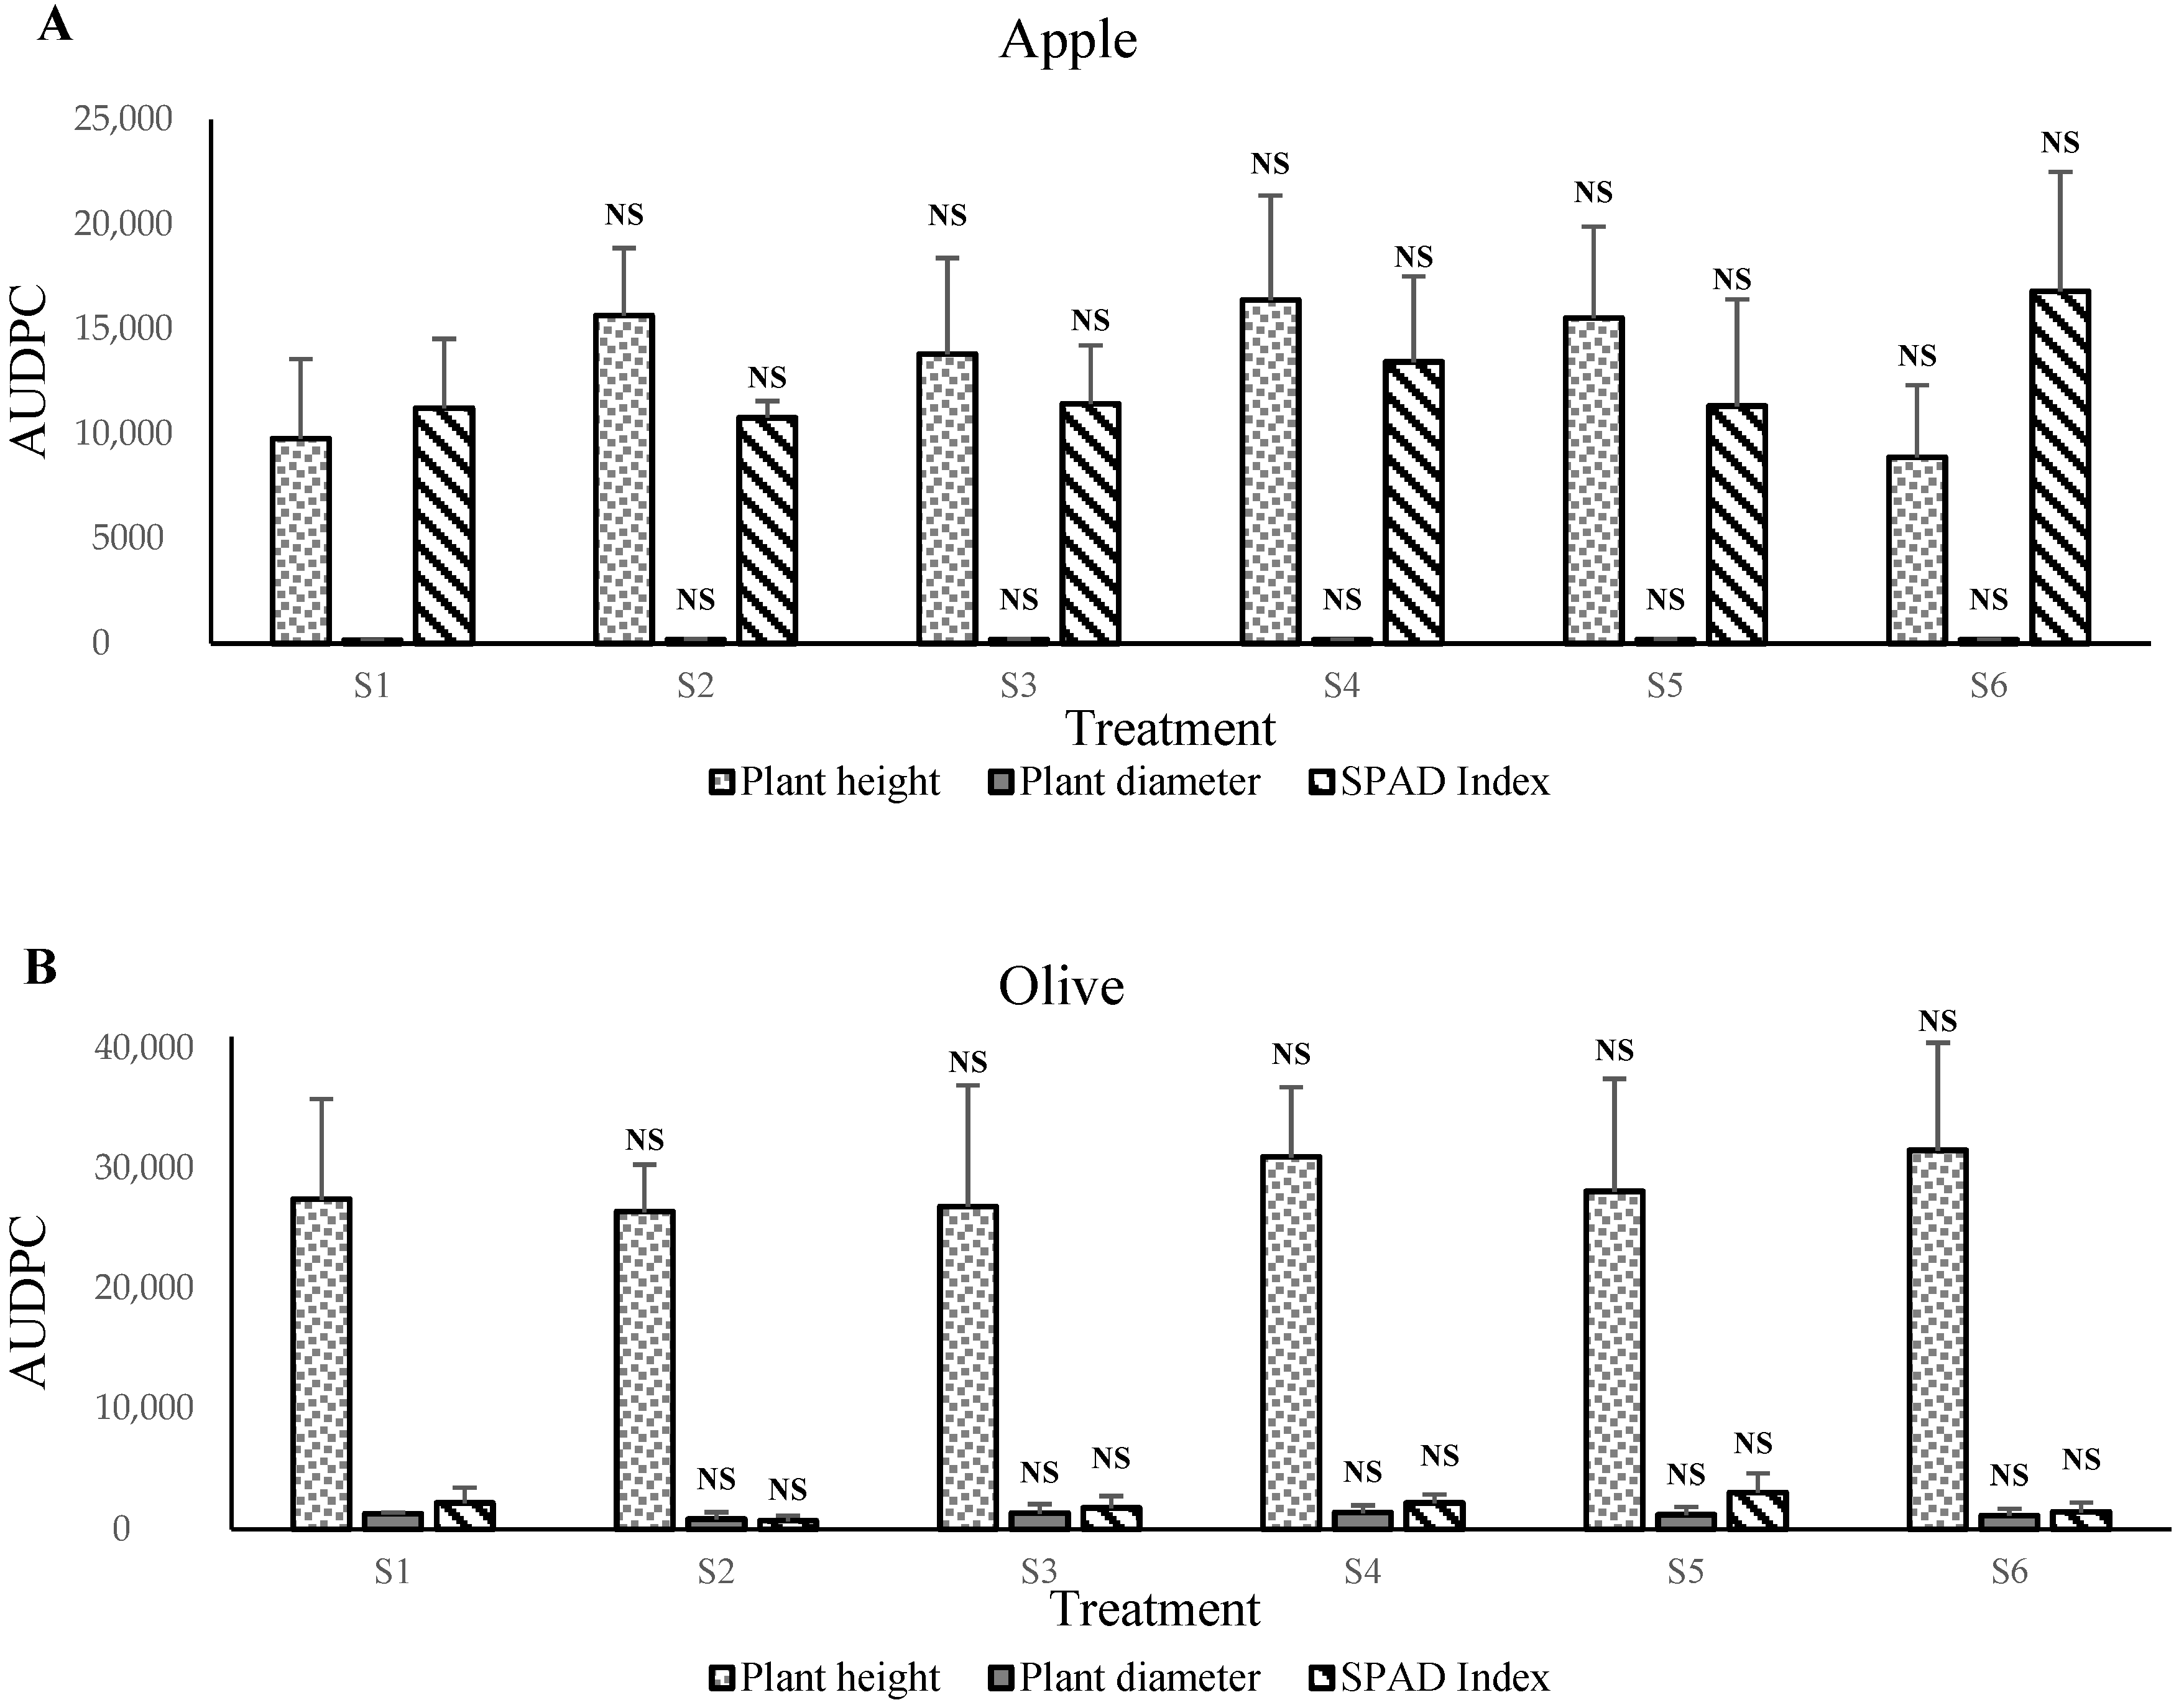
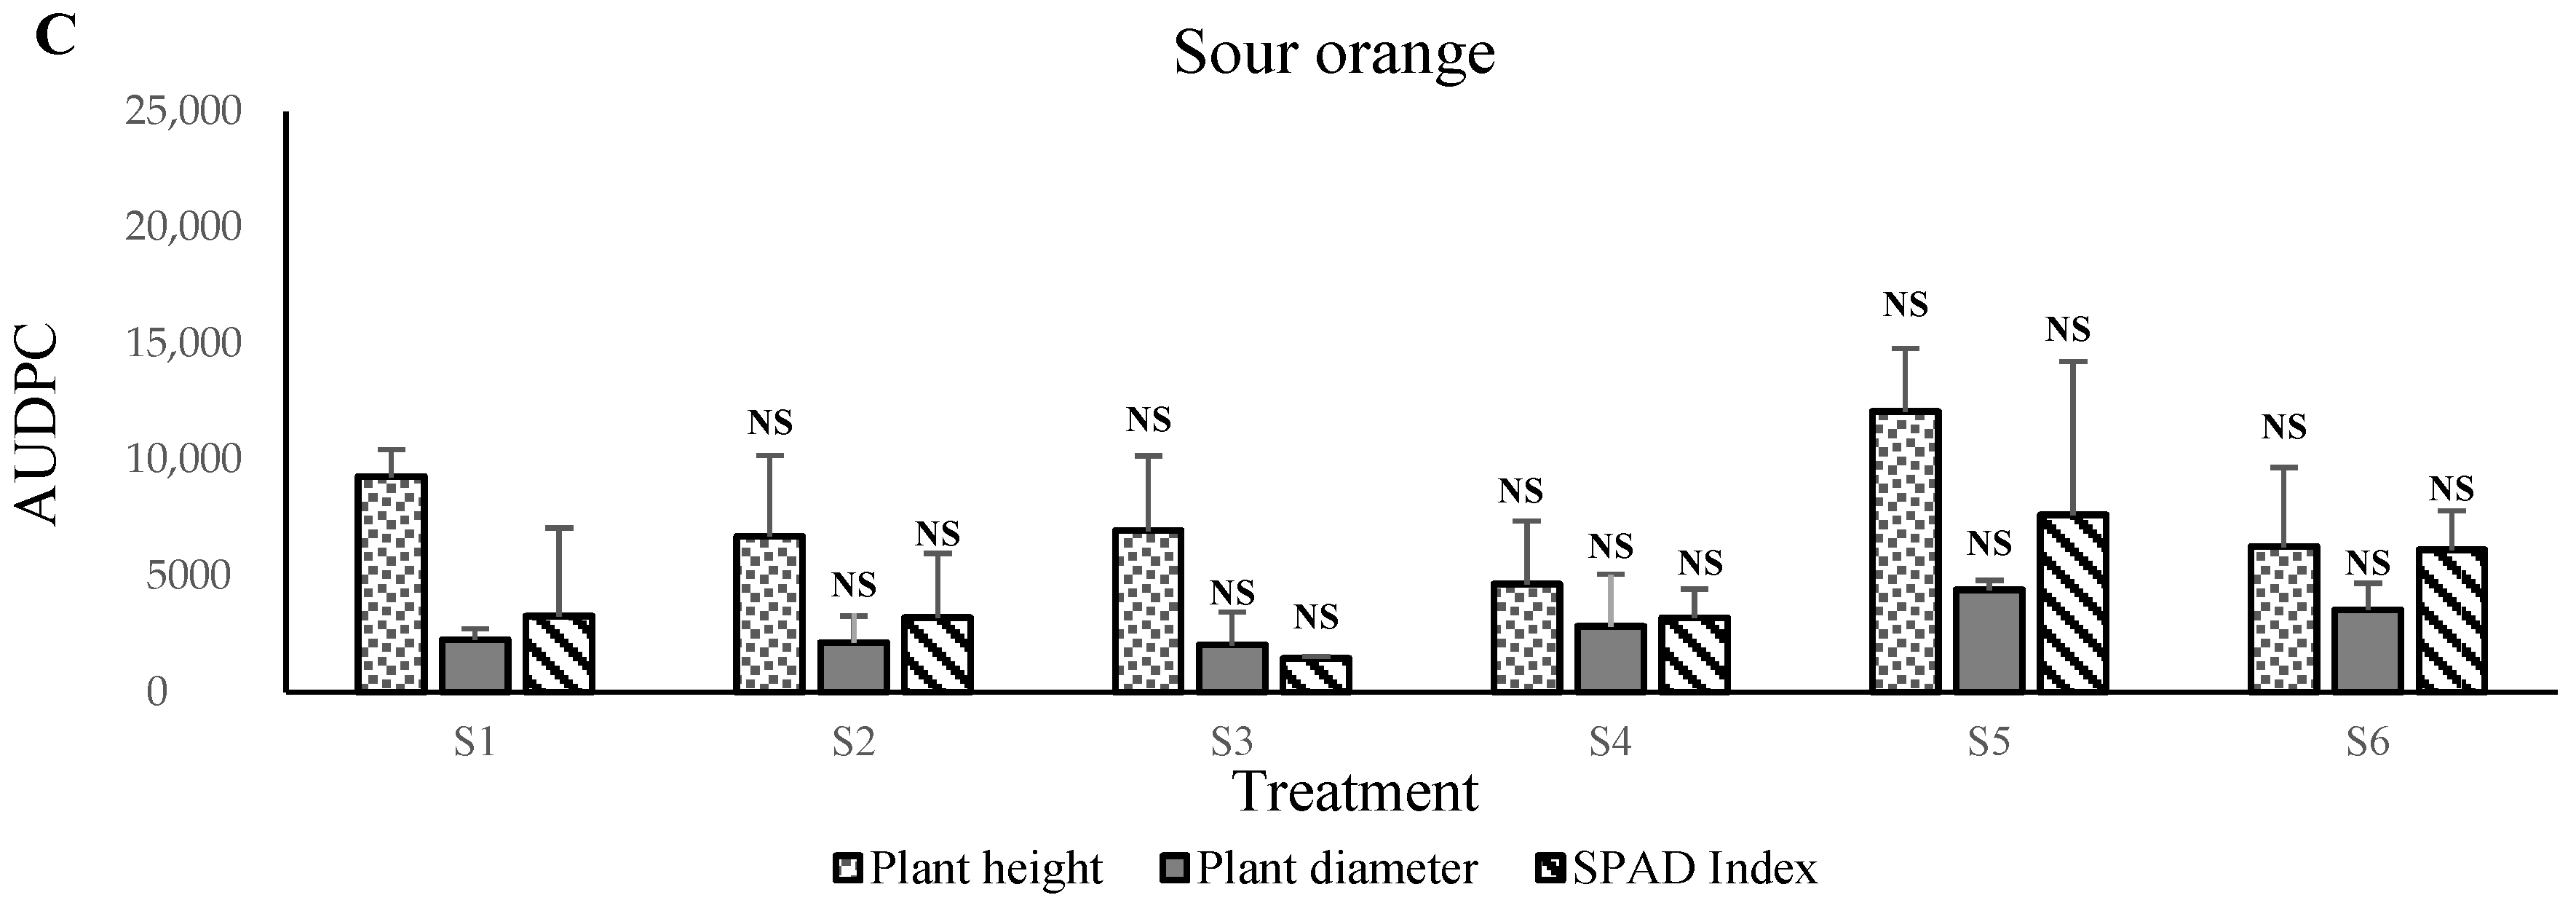
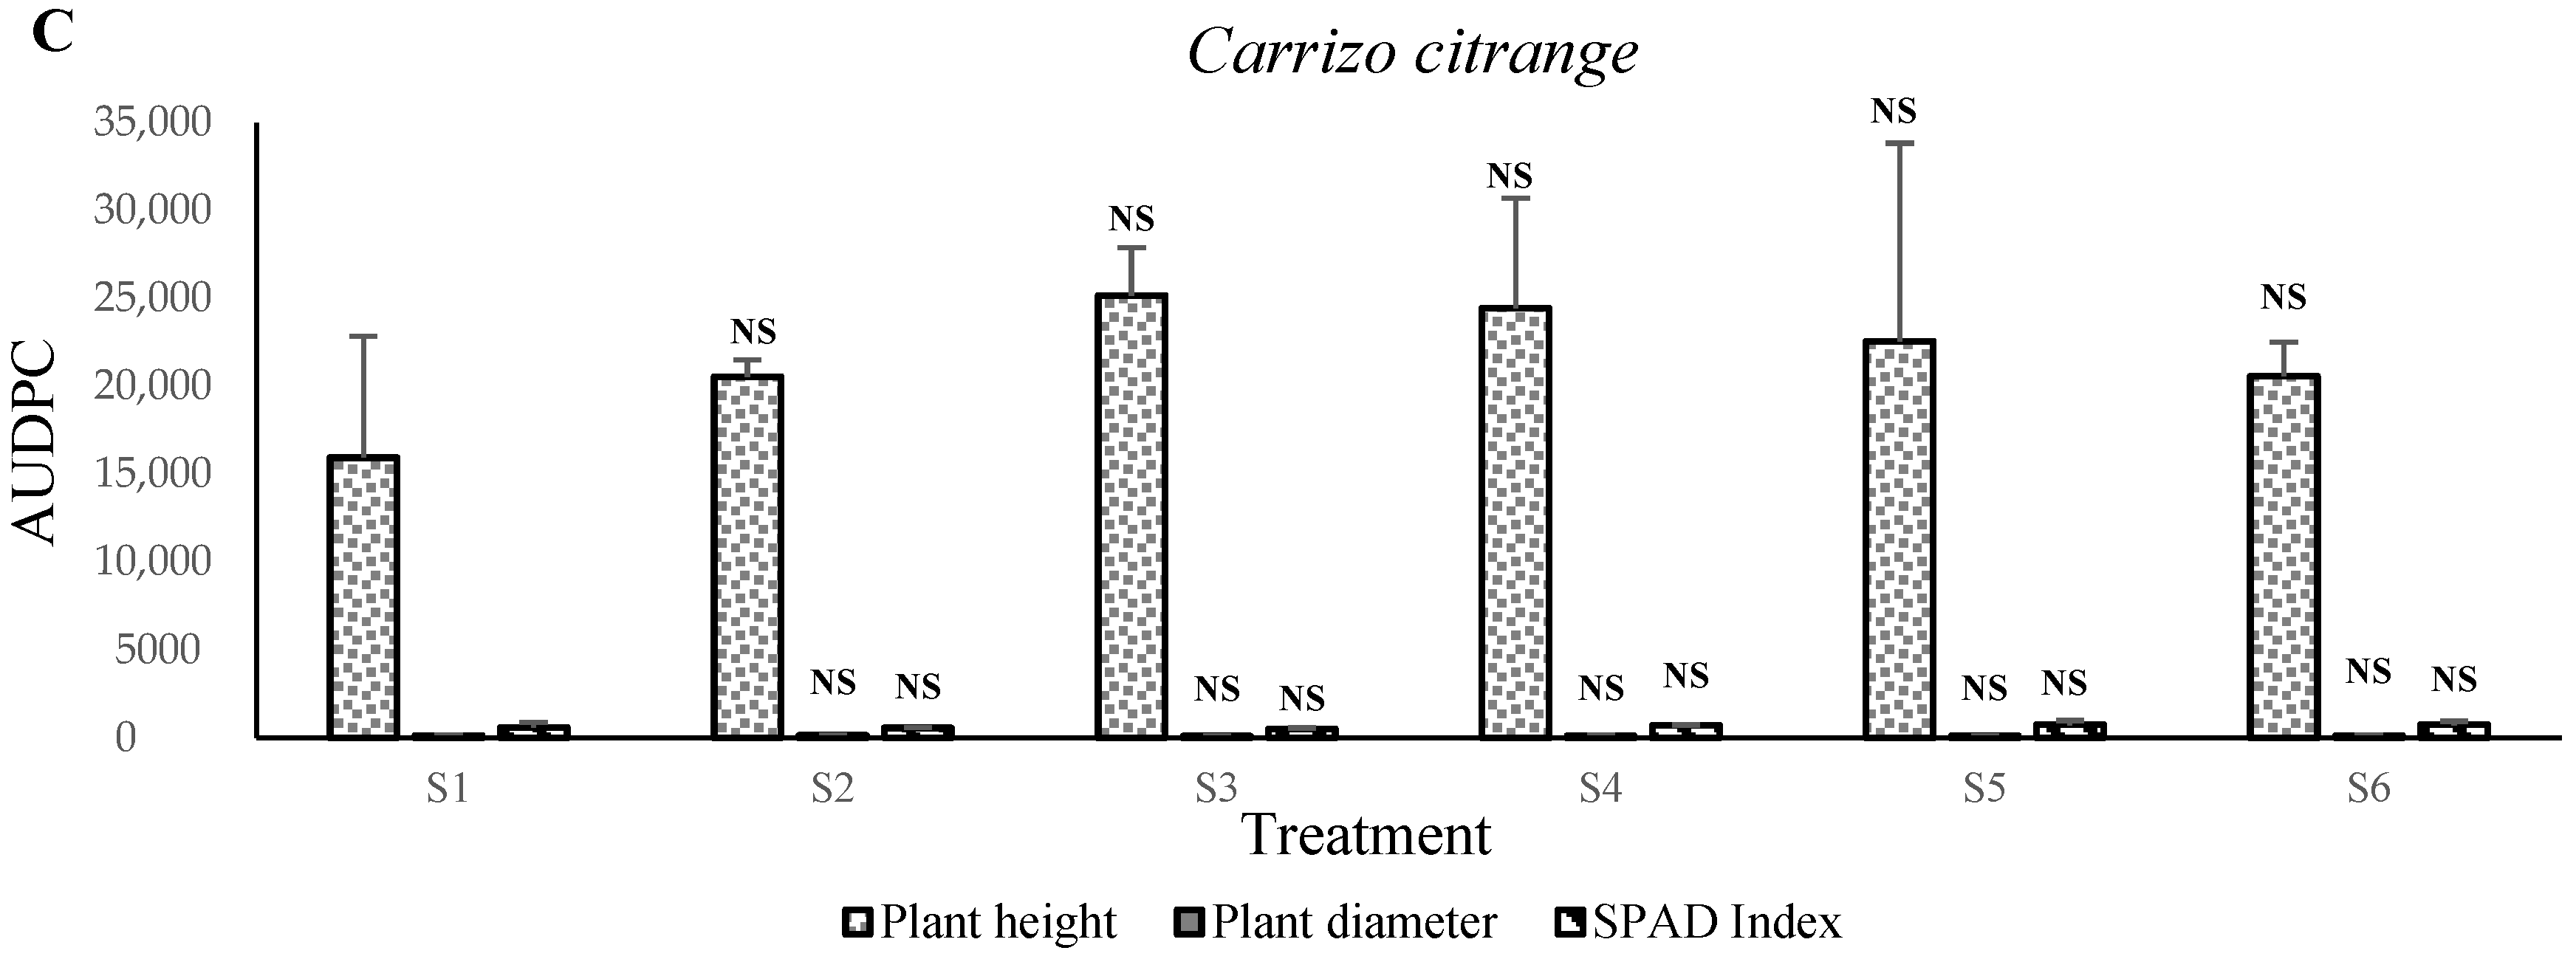
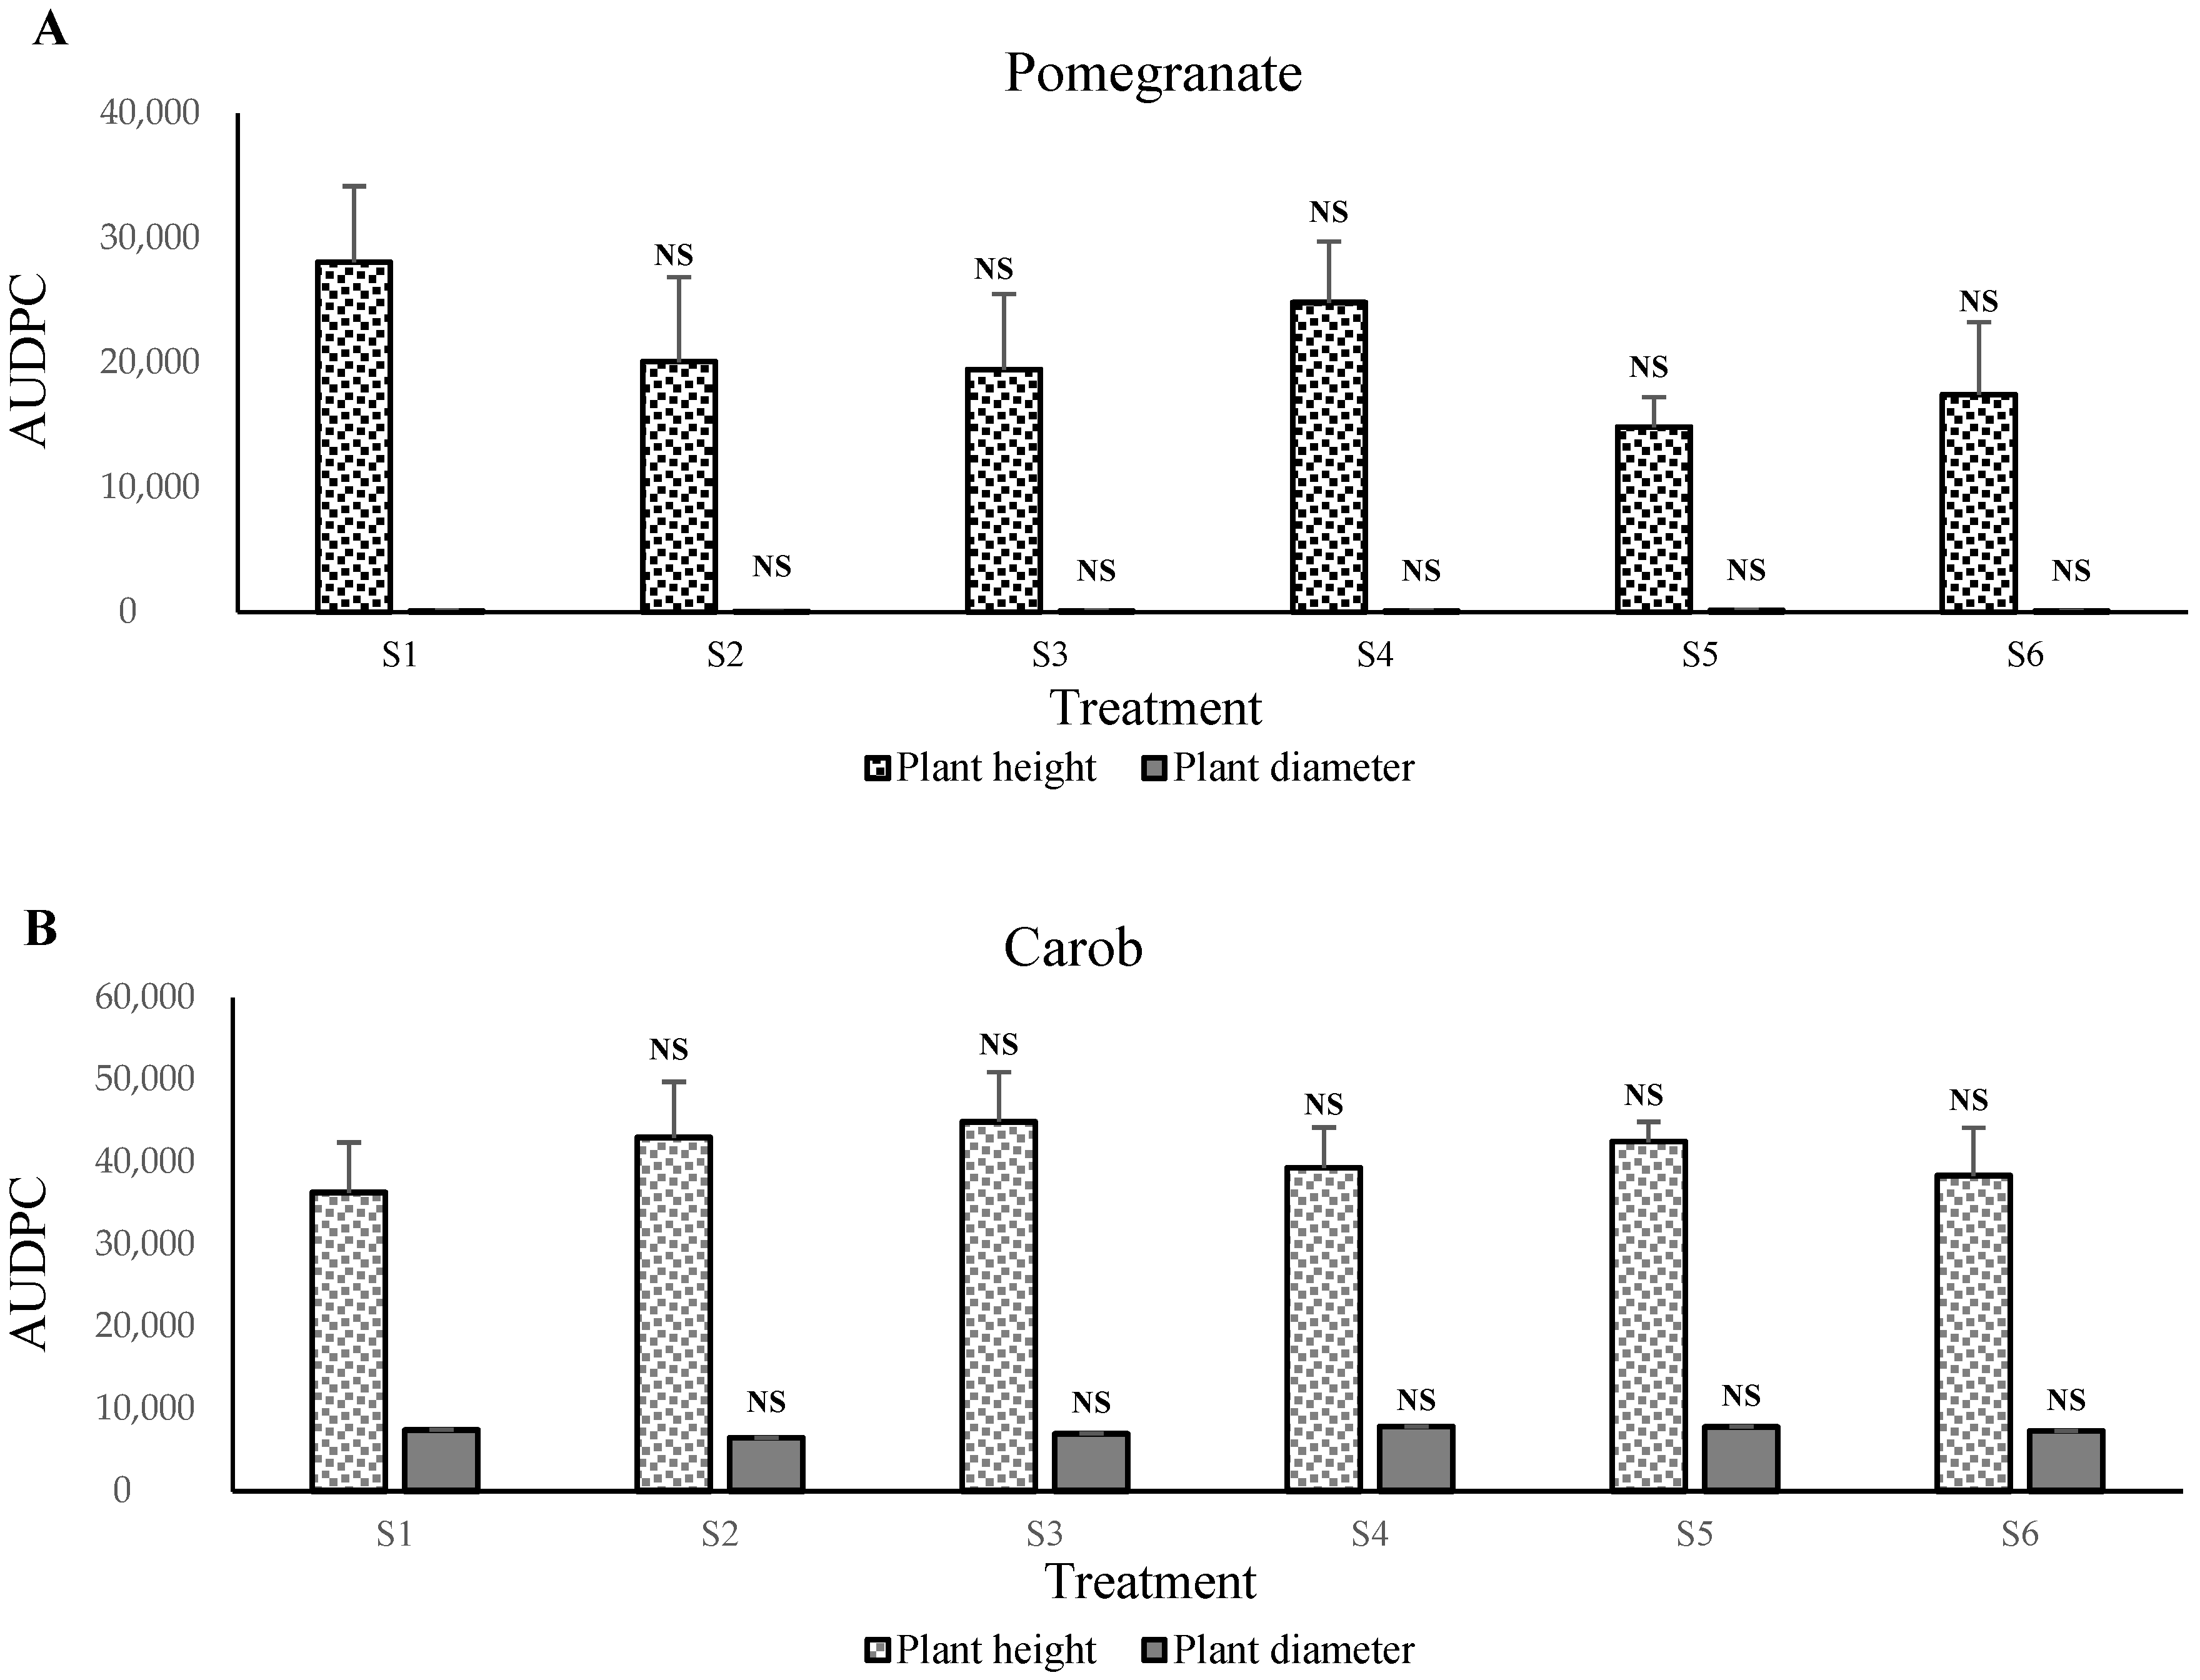
Estimates of the relative growth of the measurement parameters were plotted over time to generate growth progression curves; subsequently, the area under the growth progress curve (AUGPC) was calculated by the trapezoidal integration method. The AUGPC marker over 240 days of growth progress. Statistically, no significant differences were observed in plant height, plant diameter, and chlorophyll index SPAD in phosphate sludge amendment plants compared to the control mixture (Maamora soil) for apple, olive, sour orange, Citrus macrophylla, Carrizo citrange, argan, and carob plants (Figure 1, Figure 2 and Figure 3).
Furthermore, for pomegranate-height plants, the growth progression curves AUGPC showed significant differences when substrates were mixed with 40% (S5) and 50% (S6) of sludge (Figure 3A), but the AUGPC did not differ significantly in height and diameter for C. volkameriana plants (Figure 2A). Meanwhile, the S3 mixture was significantly different from the control mixture for acacia plants.

3.2. Effect of the Amended Sand and Solid Phosphate Sludge on the Plant Growth in the Nursery (Experiment 2)

Maamora soil (the control mixture) is inherently rich with minerals, so the additional solid phosphate sludge response did not differ significantly. This indicates that Maamora soil can possibly also be used as an amendment substrate in the nursery. The objective of this second experiment is to evaluate the effect of these sludge amendments with poor sand on the growth of some fruit and forest plants.
The addition of SPS increases the relative height and diameter growth for Carrizo citrange plants, and the highest growth was noticed in the M3 mixture for both parameters at 117% and 71%, respectively (Table 7). Moreover, the relative height and diameter growth improved when the substrates were mixed with 30% (S4) and 10% (S2) of phosphate sludge with 154% and 96%, respectively, for C. volkameriana plants (Table 7). Otherwise, the higher relative height and diameter growth was in the M4 mixture for carob plants (Table 8). The relative growth of the chlorophyll index SPAD was also calculated for Carrizo citrange and C. volkameriana plants. The highest index was also recorded in the M4 mixture with 30% phosphate sludge for both citrus plants (Table 7).
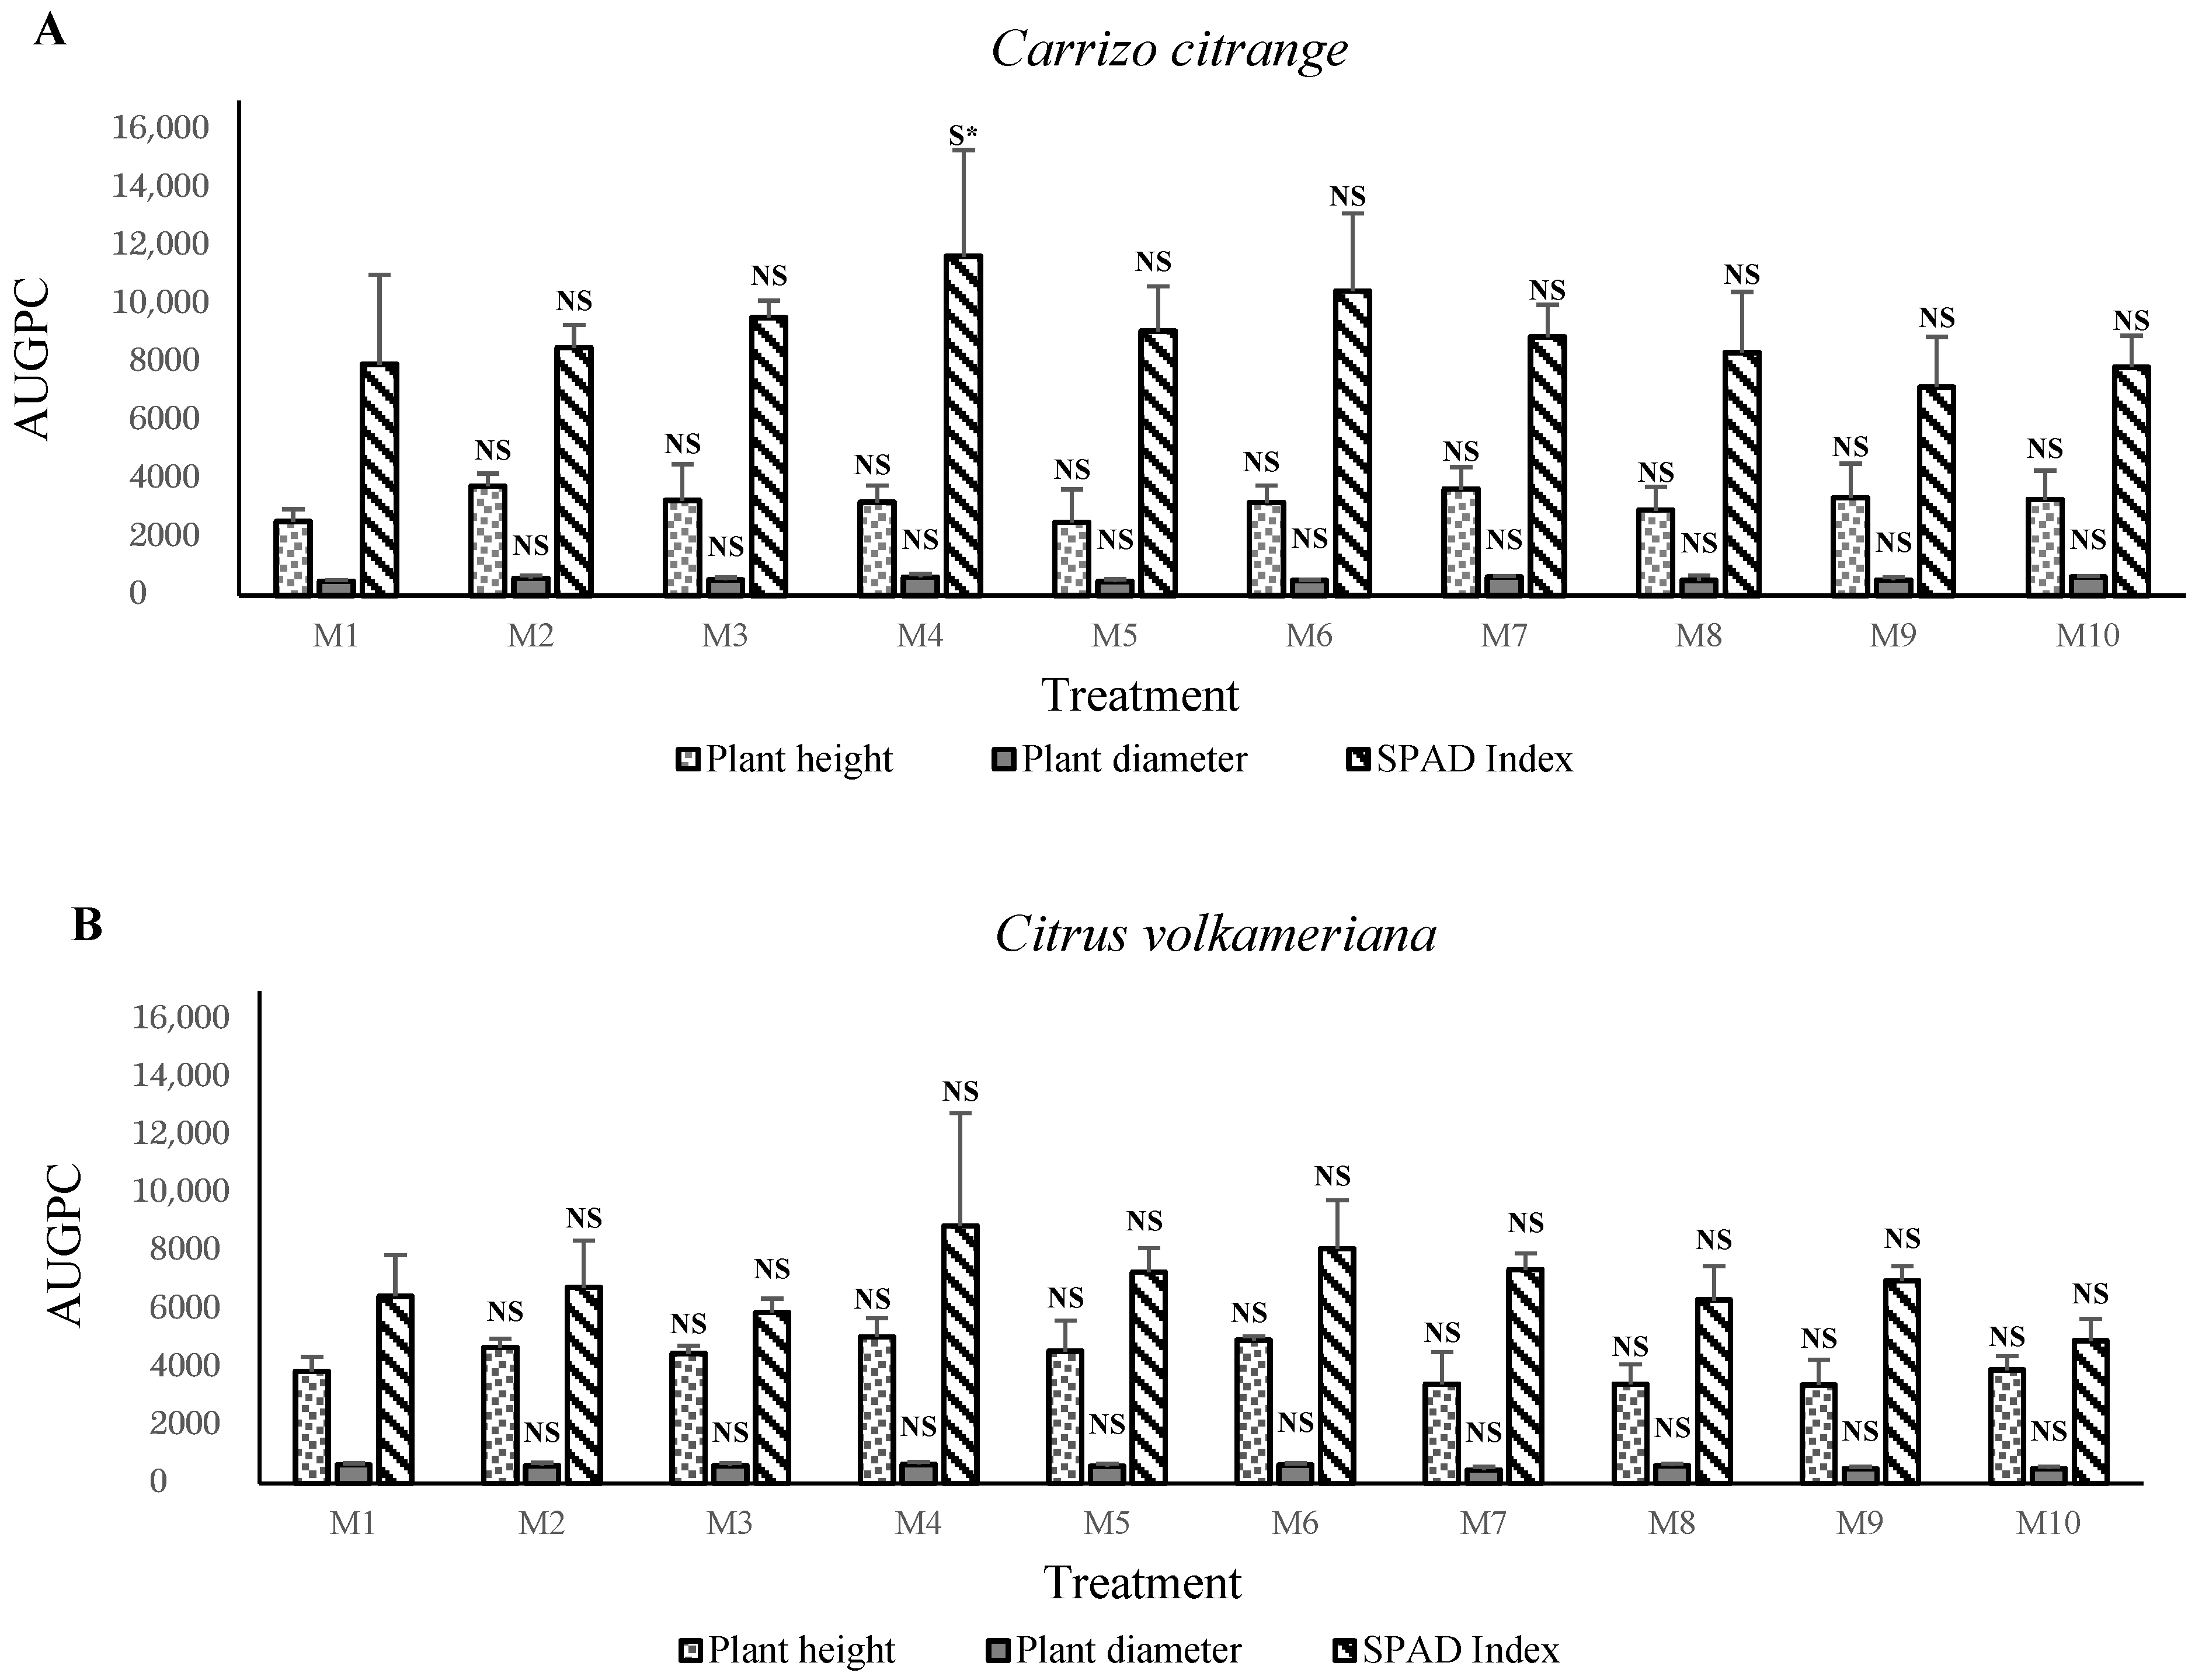
The AUGPC showed that the higher area under the growth progress curve in all parameters was observed in the M4 mixture with 30% solid phosphate sludge for Carrizo citrange, C. volkameriana, and carob plants, with a significant difference compared to the control substrate (Figure 4).

4. Discussion

Plant height and plant diameter are the main parameters observed when assessing plant growth, as are leaf chlorophyll content index (SPAD) values, where higher values can be indicators of a higher yield [15], photosynthetic rate [16], and important biochemical indicators for plants [17].
The solid phosphate sludge amendment used contains fluorapatite (44%), carbonates (22%), quartz (17%), and smectite-like swelling clay (montmorillonite) [18], which resulted in a very high pH (8.2) and made these amendments unsuitable for tree cultivation, which requires a pH of 6–7 [19]. This study showed that the application of amendments such as Maamora soil or sand gradually decreases the pH over concentrations.
The first experiment showed that the control soil (S1 mixture) presented the highest growth for pomegranate, C. volkameriana, and acacia plants. This means that Maamora soil is rich soil with a high level of organic matter. The latter plays a vitally important role in P solubilization through the acidifying and chelation mechanisms. The soil’s low level of organic matter may also be an essential factor for the overall low mineralization trend of P observed in this study [20]. These results are consistent with the research conducted by Benjelloun [21], where he confirms that the cork oak soils are relatively more stable and better provided with organic matter (greater than 1.10%). According to Provencher [22], organic matter positively influences the assimilation of phosphorus by the plant. On the other hand, as the acidity increases, more phosphorus can bind energetically with the hydroxides of iron (Fe) or aluminum (Al) and then not be released in the soil solution and consequently not be available for vegetation [23,24].
The pomegranate and C. volkameriana plants might also prefer the pH of the Maamora soil, which varies between 4.8 and 6.4 with an average of 5.68, which places it in the category of acid soils [25]. Of these plants, trees prefer this interval of pH for nutrient uptake. If the pH of a substrate exceeds 6.5, mineral deficiencies may occur, and the solubility of nutrients in the soil is affected [26]. The application of phosphate sludge increases the pH, which might affect plant growth. The supply of clay phosphate sludge can also affect the growth of these young plants.
In contrast, the apple, olive, Carrizo citrange, C. macrophylla, sour orange, carob, and argan plants prefer growth in S3 and S4 mixtures, that is, between 20% and 40% of solid phosphate sludge amendments. The obtained results indicated that the vigor of plants corresponded positively with the nutritional status of substrates. We assume that phosphate sludge and Maamora soil material stimulate plant growth and increase mineral nutrient uptake rates. The concentrations increases the pH level to between 7.0 and 7.7 (results not shown). This level can be the optimum for these species’ plant growth. This positive effect of phosphate sludge application suggests that natural P works best in acidic soils, while it shows poor efficiency in alkaline soils [20]. Under acidic conditions such as Maamora soil, organic acid anions with oxygen-containing carboxylic groups can form stable complexes with cations such as calcium, aluminum, and iron commonly bound with phosphate [27]. Organic acid anions loosen cation–oxygen bonds by complexing with cations on the mineral surface and catalyzing the release of cations to solution [28]. Natural P is more effective under acidic conditions [20].
The mineral nutrition of plants is one of the major constraints that can affect plants’ main physiological processes (accumulation of organic matter, amount of chlorophyll, and intensity of photosynthesis) [29]. The main elements in chlorophyll synthesis are nitrogen, copper, zinc, iron, and manganese [30]. The significant increase of these elements can improve the nutritional condition of the soil, which can reflect the growth of the plant and especially the chlorophyll content [31,32]. The application of phosphate sludge increases the capacities of these nutrient elements in the mixtures. It has been previously demonstrated that legumes could immediately benefit from the application of natural phosphate [33]. In citrus trees, rootstocks can improve many soil constraints, such as saline stress [34] and low nutrient availability [35]. The ability to acquire P from the soil of these rootstocks is known as an essential variability [36], which might explain differences in responses of citrus trees to uptake P, as demonstrated by other authors and as observed in our study [37,38]. However, the specific mechanisms that explain the differential responses of cultivated citrus to P fertilization are not yet fully understood [38] because root growth is limited by low-P availability [39]. In this context, the effects of P rates and placement might be more pronounced in young trees than in mature ones because the former have a relatively greater nutrient demand and lower P absorption capacity due to their limited root systems [40]. Supplying phosphate sludge enhances citrus plant growth (except for C. volkameriana rootstock in the first experiment). It might arise from the fact that P moves in the soil through diffusion and roots create depletion zones that hinder P uptake [41].
Relative growth for apple plants is related to phosphorus concentrations; Fortuna [42] confirmed this, which showed that the only plants fertilized with high amounts of phosphate showed renewal of shoot apical growth. They concluded that the renewal of shoot apical growth was related to tissue P concentration. In addition, among the numerous elements influencing plant development during forest establishment are the effects of water availability in the soil on plant growth and how these compromise plant performances prevail [43]. Sandy soils contain large pores that positively allow more water movement and air circulation but negatively cause water stress and nutrient leaching [44]. Adding water stress, this medium can be challenging to plant growth and expansion. Plants need water for their growth and development. It is the transporter of mineral nutrients from the soil into the plants’ vascular system [45]. Water is indispensable for plant growth, especially in the early stages. A water deficit during this phase reduces growth and increases death rates and disease susceptibility [46,47]. Plants take up P in its inorganic form as phosphate [48]. Since inorganic P is usually depleted in soil solutions, P is often the first limiting macronutrient for plant growth under natural conditions [49,50] because nutrient availability is generally considered the major resource factor limiting growth in many forest tree species [51]. We can suggest that the application of phosphate sludge increases forest plant growth with an increase in nutrient elements and water retention.
These results were confirmed with the second experiment using SPS amendment in the poor sand. These results showed higher growth in M3 and M4 mixtures with 20% to 30% phosphate sludge. The supply of SPS positively affects plant growth. This effect was evident in this experiment with the use of poor sand. We can suggest that natural phosphate in the solid phosphate plays an essential role in the growth of fruit and forest plants in the nurseries, but at concentrations of 20–30%. Direct application of ground natural phosphate was proven beneficial to crops on soils [52]. The natural P has the potential and some benefits of being used as an alternative to mineral fertilizers [1]. The direct application is available in many countries as a substitutional solution to the expensive water-soluble P fertilizers used for crop production in tropical soils [1,53]. The partial acidulation can make the natural P more effective, especially as a superphosphate for some soils and crops. The solubilization of this P can be influenced by oxygen, water, or complexing agents [54,55,56]. Therefore, it is likely that smectite may be the dominant clay mineral present in soil composition that adsorbs high H2PO4. The other possibility may be the fixation of some of the applied or native P on the surface of the clay particles, given the 28% clay content of the soil used in the study [20]. Furthermore, high concentrations of solid phosphate sludge can negatively affect the growth of fruit and forest plants. This is confirmed by our results with the concentrations of 40 and 50% and might be due to the high level of pH and the clay rate in sludge.
Phosphate is applied continuously because plants only utilize small amounts of phosphate fertilizers. The rest (about 70%) converted rapidly into insoluble complexes (calcium phosphate, aluminum phosphate, and iron phosphate) in the soil [57,58,59]. Moreover, P is often considered one of the main nutrients in agricultural soils [60]. The major P sources to produce seedlings are the nutrients released slowly from rock phosphate and organic fertilizers in organic nursery production [61,62]. The production of quality seedlings also requires intensive fertilization in high-quality nurseries, especially in the early growth stages [63].

5. Conclusions

In the present study, plant growth of apple, olive, Carrizo citrange, C. macrophylla, sour orange, carob, and argan was improved in the first experiment with the addition of phosphate sludge amendments, especially at the concentrations of 20, 30, and 40%. These results are confirmed after the use of poor sand with SPS in the second experiment, which showed that the highest relative growth was noted in M3 and M4 mixtures (20 and 30% of SPS).
From this point, the application of solid phosphate sludge positively affects and improves the growth of fruit and forest trees in the nurseries, especially when the concentration is between 20 and 30%. This effect might be due mainly to the P element’s chemical and physical properties. Consequently, an alternative technology could be developed based on mixing sand with phosphate by-products. Further research is needed to improve the quality of this substrate and incorporate symbiotic microorganisms before recommending solid phosphate sludge in nurseries.

Author Contributions

Z.B. installed, followed the experiments, and wrote the manuscript; K.A. participated in experiment 1 and 2 methods; A.H. carried out the fertigation and trial monitoring; J.D. revised the manuscript; M.E. monitored the study. All authors have read and agreed to the published version of the manuscript.

Funding

This research received no external funding.

Institutional Review Board Statement

Not applicable.

Informed Consent Statement

Not applicable.

Acknowledgments

The authors would like to acknowledge the support through the R&D Initiative—Appel à projets autour des phosphates APPHOS—sponsored by OCP (OCP Foundation, R&D OCP, Mohammed VI Polytechnic University, National Center of Scientific and technical Research CNRST, Ministry of Higher Education, Scientific Research and Professional Training of Morocco MESRSFC) under the project entitled “Valorisation des boues solides des phosphates en arboriculture fruitière et foresterie”; project ID: [BIO-ELG-01/2017].

Conflicts of Interest

We wish to confirm that there are no known conflicts of interest associated with this publication and there has been no significant financial support for this work that could have influenced its outcome.

References

  1. Owusu-Bennoah, E.; Zapata, F.; Fardeau, J.C. Comparison of greenhouse and 32P isotopic laboratory methods for evaluating the agronomic effectiveness of natural and modified rock phosphates in some acid soils of Ghana. Nutr. Cycl. Agroecosystems 2002, 63, 1–12. [Google Scholar] [CrossRef]
  2. Gomes, J.M.; Paiva, H.N. Viveiros Florestais: Propagação Sexuada; Universidade Federal de Viçosa: Viçosa, Brazil, 2012; 116p. [Google Scholar]
  3. Hastuti, P.B.; Rohmiyati, S.M. Application of Empty Fruit Bunches Compost and Types of P Fertilizer on the Growth and Phosphorus Uptake in Oil Palm Seedlings. Agrotechnol. Res. J. 2020, 4, 59–64. [Google Scholar] [CrossRef]
  4. Ceconi, D.E.; Poletto, I.; Brun, E.J.; Lovato, T. Crescimento de mudas de açoita-cavalo (Luehea divaricata Mart.) sob influência da adubação fosfatada. Cerne 2006, 12, 292–2999. [Google Scholar]
  5. Hellal, F.; El-Sayed, S.; Zewainy, R.; Amer, A. Importance of phosphate rock application for sustaining agricultural production in Egypt. Bull. Natl. Res. Cent. 2019, 43, 11. [Google Scholar] [CrossRef]
  6. Richardson, A.E.; Simpson, R.J. Soil microorganisms mediating phosphorus availability update on microbial phosphorus. Plant Physiol. 2011, 156, 989–996. [Google Scholar] [CrossRef] [Green Version]
  7. Zapata, F.; Roy, R.N. Utilisation des Phosphates Naturels Pour Une Agriculture Durable; Organisation des Nations Unies Pour L’alimentation et L’agriculture: Rome, Italy, 2004. [Google Scholar]
  8. Hakkou, R.; Benzaazoua, M.; Bussière, B. Valorization of phosphate waste rocks and sludge from the Moroccan phosphate mines: Challenges and perspectives. “SYMPHOS 2015”, 3rd International Symposium on Innovation and Technology in the Phosphate Industry. Procedia Eng. 2016, 138, 110–118. [Google Scholar] [CrossRef] [Green Version]
  9. Haouas, A.; El Modafar, C.; Douira, A.; Ibnsouda-Koraichi, S.; Filali-Maltouf, A.; Moukhli, A.; Amir, S. Evaluation of the nutrients cycle, humification process, and agronomic efficiency of organic wastes composting enriched with phosphate sludge. J. Clean. Prod. 2021, 302, 127051. [Google Scholar] [CrossRef]
  10. Loutou, M.; Hajjaji, M.; Mansori, M.; Favotto, C.; Hakkou, R. Phosphate sludge: Thermal transformation and use as lightweight aggregate material. J. Environ. Manag. 2013, 130, 354e360. [Google Scholar] [CrossRef]
  11. Baiz, Z.; Dahmani, J.; Gaboun, F.; Elguilli, M. Inhibition of Verticillium Dahliae and Rhizoctonia Solani Growth by Solid Phosphate Sludge Amendments. Open Agric. J. 2020, 14, 145–156. [Google Scholar] [CrossRef]
  12. Baiz, Z.; Azim, K.; Tabrika, I.; Abbas, Y.; Ibijbijen, J.; Hamza, A.; Dahmani, J.; Elguilli, M. Effect of composted Solid phosphate sludge with organic horticultural residues on the growth of citrus and forest seedlings. Org. Agric. J. 2021, 11, 577–587. [Google Scholar] [CrossRef]
  13. Baiz, Z.; Elguilli, M.; Azim, K.; Dahmani, J.; Abbas, Y. Selection and valorization of mycorrhizal fungi isolated from phosphate sludge basins in promoting of Citrus and carob seedlings. E3S Web Conf. 2021, 319, 01062. [Google Scholar] [CrossRef]
  14. Yuan, Z.; Cao, Q.; Zhang, K.; Ata-Ul-Karim, S.T.; Tian, Y.; Zhu, Y.; Cao, W.; Liu, X. Optimal leaf positions for SPAD meter measurement in rice. Front. Plant Sci. 2016, 7, 719. [Google Scholar] [CrossRef] [PubMed] [Green Version]
  15. Parthasarathi, T.; Vanitha, K.; Lakshamanakumar, P.; Kalaiyarasi, D. Aerobic rice-mitigating water stress for the future climate change. Int. J. Agron. Plant Prod. 2012, 3, 241–254. [Google Scholar]
  16. Anjum, S.A.; Xie, X.Y.; Wang, L.C.; Saleem, M.F.; Man, C.; Lei, W. Morphological, physiological and biochemical responses of plants to drought stress. Afr. J. Agric. Res. 2011, 6, 2026–2032. [Google Scholar] [CrossRef]
  17. Liu, B.; Yue, Y.M.; Li, R.; Shen, W.J.; Wang, K.L. Plant leaf chlorophyll content retrieval based on a field imaging spectroscopy system. Sensors 2014, 14, 19910–19925. [Google Scholar] [CrossRef] [Green Version]
  18. Loutou, M.; Hajjaji, M.; Mansori, M.; Favotto, C.; Hakkou, R. Heated blends of clay and phosphate sludge: Microstructure and physical properties. J. Asian Ceram. Soc. 2015, 4, 11–18. [Google Scholar] [CrossRef]
  19. Azman, E.A.; Jusop, S.; Ishak, C.F.; Ismail, R. Increasing Rice Production Using Different Lime Sources on an Acid Sulphate Soil in Merbok, Malaysia. Pertanika J. Trop. Agric. Sci. 2014, 37, 223–247. [Google Scholar]
  20. Abbasi, M.K.; Musa, N.; Manzoor, M. Mineralization of soluble P fertilizers and insoluble rock phosphate in response to phosphate-solubilizing bacteria and poultry manure and their effect on the growth and P utilization efficiency of chilli (Capsicum annuum L.). Biogeosciences 2015, 12, 4607–4619. [Google Scholar] [CrossRef] [Green Version]
  21. Benjelloun, H.; Zine El Abidine, A.; Laghlam, A. Impact des différentes espèces de reboisement et de l’absence du couvert végétal sur les propriétés physicochimiques du sol dans la Maâmora occidentale. In Annales de la Recherche Forestière du Maroc; Station de recherches forestière de Rabat: Rabat, Morocco, 1997; pp. 17–31. [Google Scholar]
  22. Provencher, M. Évaluation Spatiale de L’efficacité Agronomique du LIOR dans la Pomme de Terre. Master’s Thesis, sol et Environnement, Laval University, Quebec City, QC, Canada, 2003; 64p. [Google Scholar]
  23. Fardeau, J.; Morel, C.; Boniface, R. Cinétiques de transfert des ions phosphates du sol vers la solution du sol: Paramètres caractéristiques. Agronomie 1991, 11, 783–797. [Google Scholar] [CrossRef] [Green Version]
  24. Duchaufour, P.H. Pédologie, Sol, Végétation, Environnement, 4th ed.; Masson: Paris, France, 1995; 324p. [Google Scholar]
  25. El Boukhari, E.B.; Brhadda, N.; Gmira, N. Contribution à l’étude de la régénération artificielle du chêne liège (Quercus suber L.) vis-à-vis du contenu minéral des feuilles et des paramètres physicochimiques des sols de la Maâmora (Maroc). Nat. Technol. C- Sci. L’environnement 2016, 3–26. [Google Scholar]
  26. Comtois, M.M. Légaré La Fertilisation des Plantes Ligneuses Cultivées en Contenant; Institut Québécois de Développement de l’Horticulture Ornementale: Saint-Hyacinthe, QC, Canada, 2004; 57p. [Google Scholar]
  27. Jones, D.L. Organic acids in the rhizosphere—A critical review. Plant Soil 1998, 205, 25–44. [Google Scholar] [CrossRef]
  28. Kpomblekou, K.; Tabatabai, M.A. Effect of organic acids on release of phosphorus from phosphate rocks. Soil Sci. 1994, 158, 442–453. [Google Scholar] [CrossRef]
  29. De Bang, T.C.; Husted, S.; Laursen, K.H.; Persson, D.P.; Schjoerring, J.K. The molecular–physiological functions of mineral macronutrients and their consequences for deficiency symptoms in plants. New Phytol. 2021, 229, 2446–2469. [Google Scholar] [CrossRef] [PubMed]
  30. Hemmaty, S.; Dilmaghani, M.R.; Naseri, L. Effects of Sulfur Application on Soil pH and Uptake of Phosphorus, Iron and Zinc in Apple Trees. J. Plant Physiol. Breed. 2012, 2, 1–10. [Google Scholar]
  31. Panhwar, Q.; Naher, U.; Radziah, O.; Shamshuddin, J.; Razi, I.M. Bio-fertilizer, ground magnesium limestone and basalt applications may improve chemical properties of Malaysian acid sulfate soils and rice growth. Pedosphere 2014, 24, 827–835. [Google Scholar] [CrossRef]
  32. Cao, Y.; Ma, Y.; Guo, D.; Wang, Q.; Wang, G. Chemical properties and microbial responses to biochar and compost amendments in the soil under continuous watermelon cropping. Plant Soil Environ. 2017, 63, 1–7. [Google Scholar] [CrossRef] [Green Version]
  33. Vanlauwe, B.; Wendt, J.; Diels, J. Combined application of organic matter and fertilizer. In Sustaining Soil Fertility in West-Africa; Tian, G., Ishida, F., Keatinge, J.D.H., Eds.; SSSA Special Publication: Madison, WI, USA, 2001; Volume 58, pp. 247–280. [Google Scholar] [CrossRef]
  34. Gimeno, V.; Syvertsen, J.P.; Rubio, F.; Martinez, V.; Garcia-Sanchez, F. Growth and mineral nutrition are affected by substrate type and salt stress in seedlings of two contrasting citrus rootstocks. J. Plant Nutr. 2010, 33, 1435–1447. [Google Scholar] [CrossRef]
  35. Pestana, M.; Varennes, A.; Abadia, J.; Faria, E.A. Differential tolerance to iron deficiency of citrus rootstocks grown in nutrient solution. Sci. Hortic. 2005, 104, 25–36. [Google Scholar] [CrossRef] [Green Version]
  36. Wutscher, H.K. Alteration of fruit tree nutrition through rootstocks. HortScience 1989, 24, 578–584. [Google Scholar] [CrossRef]
  37. Mattos, D., Jr.; Quaggio, J.A.; Cantarella, H.; Alva, A.K.; Graetz, D.A. Response of young citrus trees on selected rootstocks to nitrogen, phosphorus, and potassium fertilization. J. Plant Nutr. 2006, 29, 1371–1385. [Google Scholar] [CrossRef]
  38. Zambrosi, F.C.B.; Mattos, D.; Quaggio, J.A.; Cantarella, H.; Boaretto, R.M. Phosphorus Uptake by Young Citrus Trees in Low-P Soil Depends on Rootstock Varieties and Nutrient Management. Commun. Soil Sci. Plant Anal. 2013, 44, 2107–2117. [Google Scholar] [CrossRef]
  39. Fujita, K.; Kai, Y.; Takayanagi, M.; El-Shemy, H.; Adu-Gyamfi, J.J.; Mohapatra, P.K. Genotypic variability of pigeonpea in distribution of photosynthetic carbon at low phosphorus level. Plant Sci. 2004, 166, 641–649. [Google Scholar] [CrossRef] [Green Version]
  40. Quaggio, J.A.; Mattos, D., Jr.; Cantarella, H.; Stuchi, E.S.; Sempionato, O.R. Sweet orange trees grafted on selected rootstocks fertilized with nitrogen, phosphorus, and potassium. Pes. Agrop. Bras. 2004, 39, 55–60. [Google Scholar] [CrossRef] [Green Version]
  41. Clarkson, D.T. Factors affecting mineral nutrient acquisition by plants. Annu. Rev. Plant Physiol. 1985, 36, 77–115. [Google Scholar] [CrossRef]
  42. Fortuna, P.; Citernesi, A.S.; Morini, S.; Vitagliano, C.; Giovannetti, M. Influence of arbuscular mycorrhizae and phosphate fertilization on shoot apical growth of micropropagated apple and plum rootstocks. Tree Physiol. 1996, 16, 757–763. [Google Scholar] [CrossRef]
  43. Gregory, P.J.; Nortcliff, S. Soil Conditions and Plant Growth; John Wiley & Sons: Hoboken, NJ, USA, 2012. [Google Scholar] [CrossRef] [Green Version]
  44. Tsoar, H. Sand dunes mobility and stability in relation to climate. Phys. A Stat. Mech. Its Appl. 2005, 357, 50–56. [Google Scholar] [CrossRef]
  45. Kujawski, R.F. Long-Term Drought Effects on Trees and Shrubs. 2015. Available online: https://www.northeastnursery.com/blogs/long-term-drought-effects-on-trees-and-shrubs (accessed on 3 March 2021).
  46. Osakabe, Y.; Osakabe, K.; Shinozaki, K.; Tran, L.-S.P. Response of plants to water stress. Front. Plant Sci. 2014, 5, 86. [Google Scholar] [CrossRef] [Green Version]
  47. Fakhech, A.; Manaut, N.; Ouahmane, L.; Hafidi, M. Contributions of indigenous arbuscular mycorrhizal fungi to growth of retama monosperma and acacia gummifera under water stress (case study: Essaouira sand dunes forest). J. Sustain. For. 2019, 38, 686–696. [Google Scholar] [CrossRef]
  48. Becquer, A.; Trap, J.; Irshad, U.; Ali, M.A.; Claude, P. From soil to plant, the journey of P through trophic relationships and ectomycorrhizal association. Front. Plant Sci. 2014, 5, 548. [Google Scholar] [CrossRef] [Green Version]
  49. Vitousek, P.M.; Porder, S.; Houlton, B.Z.; Chadwick, O.A. Terrestrial phosphorus limitation: Mechanisms, implications, and nitrogen-phosphorus interactions. Ecol. Appl. 2010, 20, 5–15. [Google Scholar] [CrossRef] [Green Version]
  50. Zavišic’, A.; Yang, N.; Marhan, S.; Kandeler, E.; Polle, A. Forest Soil Phosphorus Resources and Fertilization Affect Ectomycorrhizal Community Composition, Beech P Uptake Efficiency, and Photosynthesis. Front. Plant Sci. 2018, 9, 463. [Google Scholar] [CrossRef] [PubMed] [Green Version]
  51. Kim, C.; Jeong, J.; Park, J.-H.; Ma, H.-S. Growth and Nutrient Status of Foliage as Affected by Tree Species and Fertilization in a Fire-Disturbed Urban Forest. Forests 2015, 6, 2199–2213. [Google Scholar] [CrossRef]
  52. Khan, R.U.; Rashid, A.; Khan, A. Effect of cutting chickpea at different dates on green fodder and seed yield under rainfed condition. Pak. J. Biol. Sci. 1999, 2, 347–349. [Google Scholar] [CrossRef]
  53. Akande, M.O.; Oluwatoyinbo, F.I.; Adediran, J.A.; Buari, K.W.; Yusuf, I.O. Soil Amendments Affect the Release of P from Rock Phosphate and the Development and Yield of Okra. J. Veg. Crop Prod. 2004, 9, 3–9. [Google Scholar] [CrossRef]
  54. Chien, S.H.; Menon, R.G. Factors affecting the agronomic effectiveness of phosphate rock for direct application. Fertil. Res. 1995, 41, 227–234. [Google Scholar] [CrossRef]
  55. Duponnois, R.; Founoune, H.; Masse, D.; Pontanier, R. Inoculation of Acacia holosericea with ectomycorrhizal fungi in a semiarid site in Senegal: Growth response and influences on the mycorrhizal soil infectivity after 2 years plantation. For. Ecol. Manag. 2005, 207, 351–362. [Google Scholar] [CrossRef]
  56. Menon, R.G.; Chien, S.H.; Gadalla, A.E.N. Phosphate rocks compacted with superphosphates vs. partially acidulated rocks for bean and rice. Soil Sci. Soc. Am. J. 1991, 59, 1762–1767. [Google Scholar] [CrossRef]
  57. Alam, M.M.; Ladha, J. Optimizing phosphorus fertilization in an intensive vegetable-rice cropping system. Biol. Fertil. Soils 2004, 40, 277–283. [Google Scholar] [CrossRef]
  58. Rodríguez, H.; Fraga, R. Phosphate solubilizing bacteria and their role in plant growth promotion. Biotechnol. Adv. 1999, 17, 319–339. [Google Scholar] [CrossRef]
  59. Tao, G.-C.; Tian, S.-J.; Cai, M.-Y.; Xie, G.-H. Phosphate-solubilizing and mineralizing abilities of bacteria isolated from soils. Pedosphere 2008, 18, 515–523. [Google Scholar] [CrossRef]
  60. Guiñazú, L.B.; Andrés, J.A.; MFDel, P.; Pistorio, M.; Rosas, S.B. Response of alfalfa (Medicago sativa L.) to single and mixed inoculation with phosphate-solubilizing bacteria and Sinorhizobium meliloti. Biol. Fertil. Soils 2010, 46, 185–190. [Google Scholar] [CrossRef]
  61. Herrera, F.; Castillo, J.E.; Chica, A.F.; López Bellido, L. Use of municipal solid waste compost (MSWC) as a growing medium in the nursery production of tomato plants. Bioresour. Technol. 2008, 99, 287–296. [Google Scholar] [CrossRef] [PubMed]
  62. Ceglie, F.G.; Elshafie, H.; Verrastro, V.; Tittarelli, F. Evaluation of olive pomace and green waste composts as peat substitutes for organic tomato seedling production. Compos. Sci. Util. 2011, 19, 293–300. [Google Scholar] [CrossRef]
  63. Mihreteab, H.; Ceglie, F.; Aly, A.; Tittarelli, F. Rock phosphate enriched compost as a growth media component for organic tomato (Solanum lycopersicum L.) seedlings production. Biol. Agric. Hortic. 2016, 32, 7–20. [Google Scholar] [CrossRef]
Figure 1. Estimates of the relative growth of the growth parameters were plotted over time to generate growth progression curves; subsequently, the area under the growth progress curve (AUGPC) was calculated by the trapezoidal integration method. Data are means of 18 plants. Statistically significant differences are indicated as p < 0.05 compared to S1 (the control mixture). (A). Growth progression curves for apple plants. (B). Growth progression curves for olive plants. (C). Growth progression curves for citrus sour orange plants. NS: not significant.
Sustainability 14 16819 g001aSustainability 14 16819 g001b
Figure 2. Estimates of the relative growth of the growth parameters were plotted over time to generate growth progression curves; subsequently, the area under the growth progress curve (AUGPC) was calculated by the trapezoidal integration method. Data are means of 18 plants. Statistically significant differences are indicated as p < 0.05 compared to S1 (the control mixture). (A). Growth progression curves for Citrus volkameriana plants. (B). Growth progression curves for Citrus macrophylla plants. (C). Growth progression curves for Carrizo citrange plants. NS: not significant, S*: significant.
Sustainability 14 16819 g002aSustainability 14 16819 g002b
Figure 3. Estimates of the relative growth of the growth parameters were plotted over time to generate growth progression curves; subsequently, the area under the growth progress curve (AUGPC) was calculated by the trapezoidal integration method. Data are means of 18 plants. Statistically significant differences are indicated as p < 0.05 compared to S1 (the control mixture). (A). Growth progression curves for pomegranate plants. (B). Growth progression curves for carob plants. (C). Growth progression curves for argan plants. (D). Growth progression curves for acacia plants. NS: not significant, S*: significant.
Sustainability 14 16819 g003aSustainability 14 16819 g003b
Figure 4. Estimates of the relative growth of the growth parameters were plotted over time to generate growth progression curves; subsequently, the area under the growth progress curve (AUGPC) was calculated by the trapezoidal integration method. Data are means of nine plants, and error bars indicate SE. Statistically significant differences are indicated as p < 0.05 compared to S1 (reference soil). (A). Growth progression curves for Carrizo citrange plants. (B). Growth progression curves for Citrus volkameriana plants. (C). Growth progression curves for Carob plants. NS: not significant, S*: significant.
Sustainability 14 16819 g004aSustainability 14 16819 g004b
Table 1. Physico-chemical properties of phosphate sludge amendments.
ParametersSPS Content
Soil pH (in water)8.22
EC (ms/cm)0.35
N Total (%)0.49
Organic matter (%)0.45
Available P (mg/kg)16.3
P Total (%)10.22
Exchangeable K (%)0.16
Clay (%)28
Total limestone (%)42
TextureClay loam
Table 2. Mixtures compositions (experiment 1).
MixturesComposition
S1 100% of Maamora forest soil
S2 90% of Maamora forest soil + 10% of SPS
S3 80% of Maamora forest soil + 20% of SPS
S4 70% of Maamora forest soil + 30% of SPS
S5 60% of Maamora forest soil + 40% of SPS
S6 50% of Maamora forest soil + 50% of SPS
Table 3. Mixtures compositions (experiment 2).
MixturesComposition
M1 100% of Sand (control mixture)
M2 90% of Sand + 10% of SPS
M3 80% of Sand + 20% of SPS
M4 70% of Sand + 30% of SPS
M5 60% of Sand + 40% of SPS
M6 50% of Sand + 50% of SPS
M7 90% of Sand + 10% of compost B1
M8 90% of Sand + 10% of compost B2
M9 90% of Sand + 10% of compost B3
M10 90% of Sand + 10% of compost B7
Table 4. Effect of different amendments on the relative growth of different parameters (plant height, plant diameter) and chlorophyll index SPAD for fruit trees after final growth.
SpeciesMixturesPlant Height (%)Plant Diameter (%)Chlorophyll Content Index (SPAD)
AppleS191.94 b7.05 a105.58 a
S2143.01 ab7.95 a95.05 a
S3130.51 ab8.01 a103.35 a
S4149.54 a7.35 a123.25 a
S5144.29 ab7.92 a96.89 a
S690.31 b7.07 a157.44 a
LSD55.4921.235101.49
OliveS1268.60 a32.29 a102.08 a
S2263.21 a24.83 a97.25 a
S3269.85 a31.49 a105.75 a
S4304.16 a32.64 a113.98 a
S5277.08 a32.30 a99. 98 a
S6303.24 a26.02 a112.11 a
LSD133.8821.82427.776
Sour orangeS196.80 a34.39 ab28.67 a
S277.17 a35.14 ab28.56 a
S377.87 a31.57 b12.47 a
S458.93 a42.16 ab27.94 a
S5109.12 a59.52 a67.82 a
S672.22 a48.39 ab53.91 a
LSD60.01726.91257.897
The letters a and b reflect the significant difference between treatments. The averages followed by the same letter in the same column do not differ significantly between them according to the Newman and Keuls test at p < 0.05.
Table 5. Effect of different amendments on the relative growth of different parameters (plant height, plant diameter) and chlorophyll index SPAD for fruit trees after final growth.
SpeciesMixturesPlant Height (%)Plant Diameter (%)Chlorophyll Content Index (SPAD)
Citrus VolkamerianaS1125.35 a65.08 a65.18 a
S278.31 b54.15 ab64.06 a
S362.53 b45.78 ab50.50 a
S459.28 b32.94 b89.16 a
S585.25 b52.06 ab122.31 a
S660.10 b42.99 b115.53 a
LSD34.46921.98684.45
Citrus macrophyllaS1142.35 a70.45 a65.21 a
S2158.48 a102.46 a71.60 a
S3141.61 a92.77 a52.87 a
S4214.36 a90.55 a87.66 a
S5205.80 a48.34 a126.03 a
S6208.75 a68.42 a93.30 a
LSD82.7560.583121.63
Carrizo citrangeS1184.07 a14.29 a16.67 a
S2239.26 a15.83 a11.10 a
S3266.98 a12.53 a8.14 a
S4265.40 a13.43 a24.59 a
S5244.08 a12.99 a28.26 a
S6230.32 a13.22 a23.92 a
LSD110.596.38233.784
The letters a and b reflect the significant difference between treatments. The averages followed by the same letter in the same column do not differ significantly between them according to the Newman and Keuls test at p < 0.05.
Table 6. Effect of different amendments on the relative growth of different parameters (plant height, plant diameter) and chlorophyll index SPAD for pomegranate and forest trees after final growth.
SpeciesMixturesPlant Height (%)Plant Diameter (%)
PomegranateS1310.44 a2.82 a
S2226.88 ab1.57 a
S3212.04 ab2.53 a
S4280.47 ab2.40 a
S5173.99 ab4.01 a
S6195.65 ab2.50 a
LSD107.423.303
CarobS1472.35 a144.45 a
S2549.65 a122.48 a
S3556.82 a139.57 a
S4508.52 a157.92 a
S5534.00 a157.79 a
S6487.52 a144.76 a
LSD114.5150.819
ArganS1278.30 a165.78 a
S2327.28 a166.56 a
S3392.13 a131.67 a
S4295.21 a139.60 a
S5290.90 a143.96 a
S6295.50 a142.45 a
LSD58.09436.233
AcaciaS1605.59 a168.71 a
S2632.65 a144.17 a
S3380.69 b83.43 a
S4438.99 b96.30 a
S5443.17 b111.86 a
S6418.10 b88.74 a
LSD160.0791.564
The letters a and b reflect the significant difference between treatments. The averages followed by the same letter in the same column do not differ significantly between them according to the Newman and Keuls test at p < 0.05.
Table 7. Effect of different sand amendments on the relative growth of different parameters (plant height, plant diameter) and chlorophyll index SPAD for citrus plants after final growth.
SpeciesMixturesPlant Height (%)Diameter of the Plant (%)Chlorophyll Content Index (SPAD)
Carrizo citrangeM15.15 h37.38 e46.98 bc
M292.13 b54.03 c42.85 bcd
M3117.05 a71.04 a57.85 a
M445.09 de44.99 d58.15 a
M549.96 d38.07 e40.03 de
M681.07 c60.06 b35.12 e
M739.88 ef58.88 b39.14 de
M819.87 g46.15 d47.92 b
M943.09 e69.85 a42.02 cd
M1036.13 f67.14 a53.89 a
LSD6.946.845.9
Citrus volkamerianaM170.92 fg42.12 d36.00 bc
M2134.08 c95.86 a33.84 cd
M3134.07 c74.15 b40.47 a
M4154.07 a64.93 c32.99 cd
M5121.96 d78.94 b31.02 d
M6140.14 b79.09 b26.09 e
M765.86 g31.02 e31.94 d
M874.15 f77.96 b36.03 bc
M972.96 f21.08 f38.96 ab
M1086.05 e42.09 d36.99 b
LSD6.029.183.4
The letters a, b, c, d, e, f, g and h reflect the significant difference between treatments. The averages followed by the same letter in the same column do not differ significantly between them according to the Newman and Keuls test at p < 0.05.
Table 8. Effect of different sand amendments on relative growth of different parameters (plant height, plant diameter), and chlorophyll index SPAD for carob plants after final growth.
SpeciesMixturesPlant Height (%)Diameter of the Plant (%)
CarobM1104.14 e60.09 g
M210.66 h136.99 b
M395.85 fg113.87 c
M4171.03 a151,65 a
M5131.03 b98.70 c
M6124.14 c86.72 d
M791.03 g70.84 f
M8111.03 d93.91 c
M9100.00 ef76.12 e
M10120.00 c70.00 f
LSD6.855.25
The letters a, b, c, d, e, f, g and h reflect the significant difference between treatments. The averages followed by the same letter in the same column do not differ significantly between them according to the Newman and Keuls test at p < 0.05.
Publisher’s Note: MDPI stays neutral with regard to jurisdictional claims in published maps and institutional affiliations.